
Optimization Study on Synergistic System of Photocatalytic Degradation of AR 26 and UV-LED Heat Dissipation


Abstract
:1. Introduction
2. Results and Discussion
2.1. Optimization of Parameters Affecting Cooling and Photocatalytic Performance
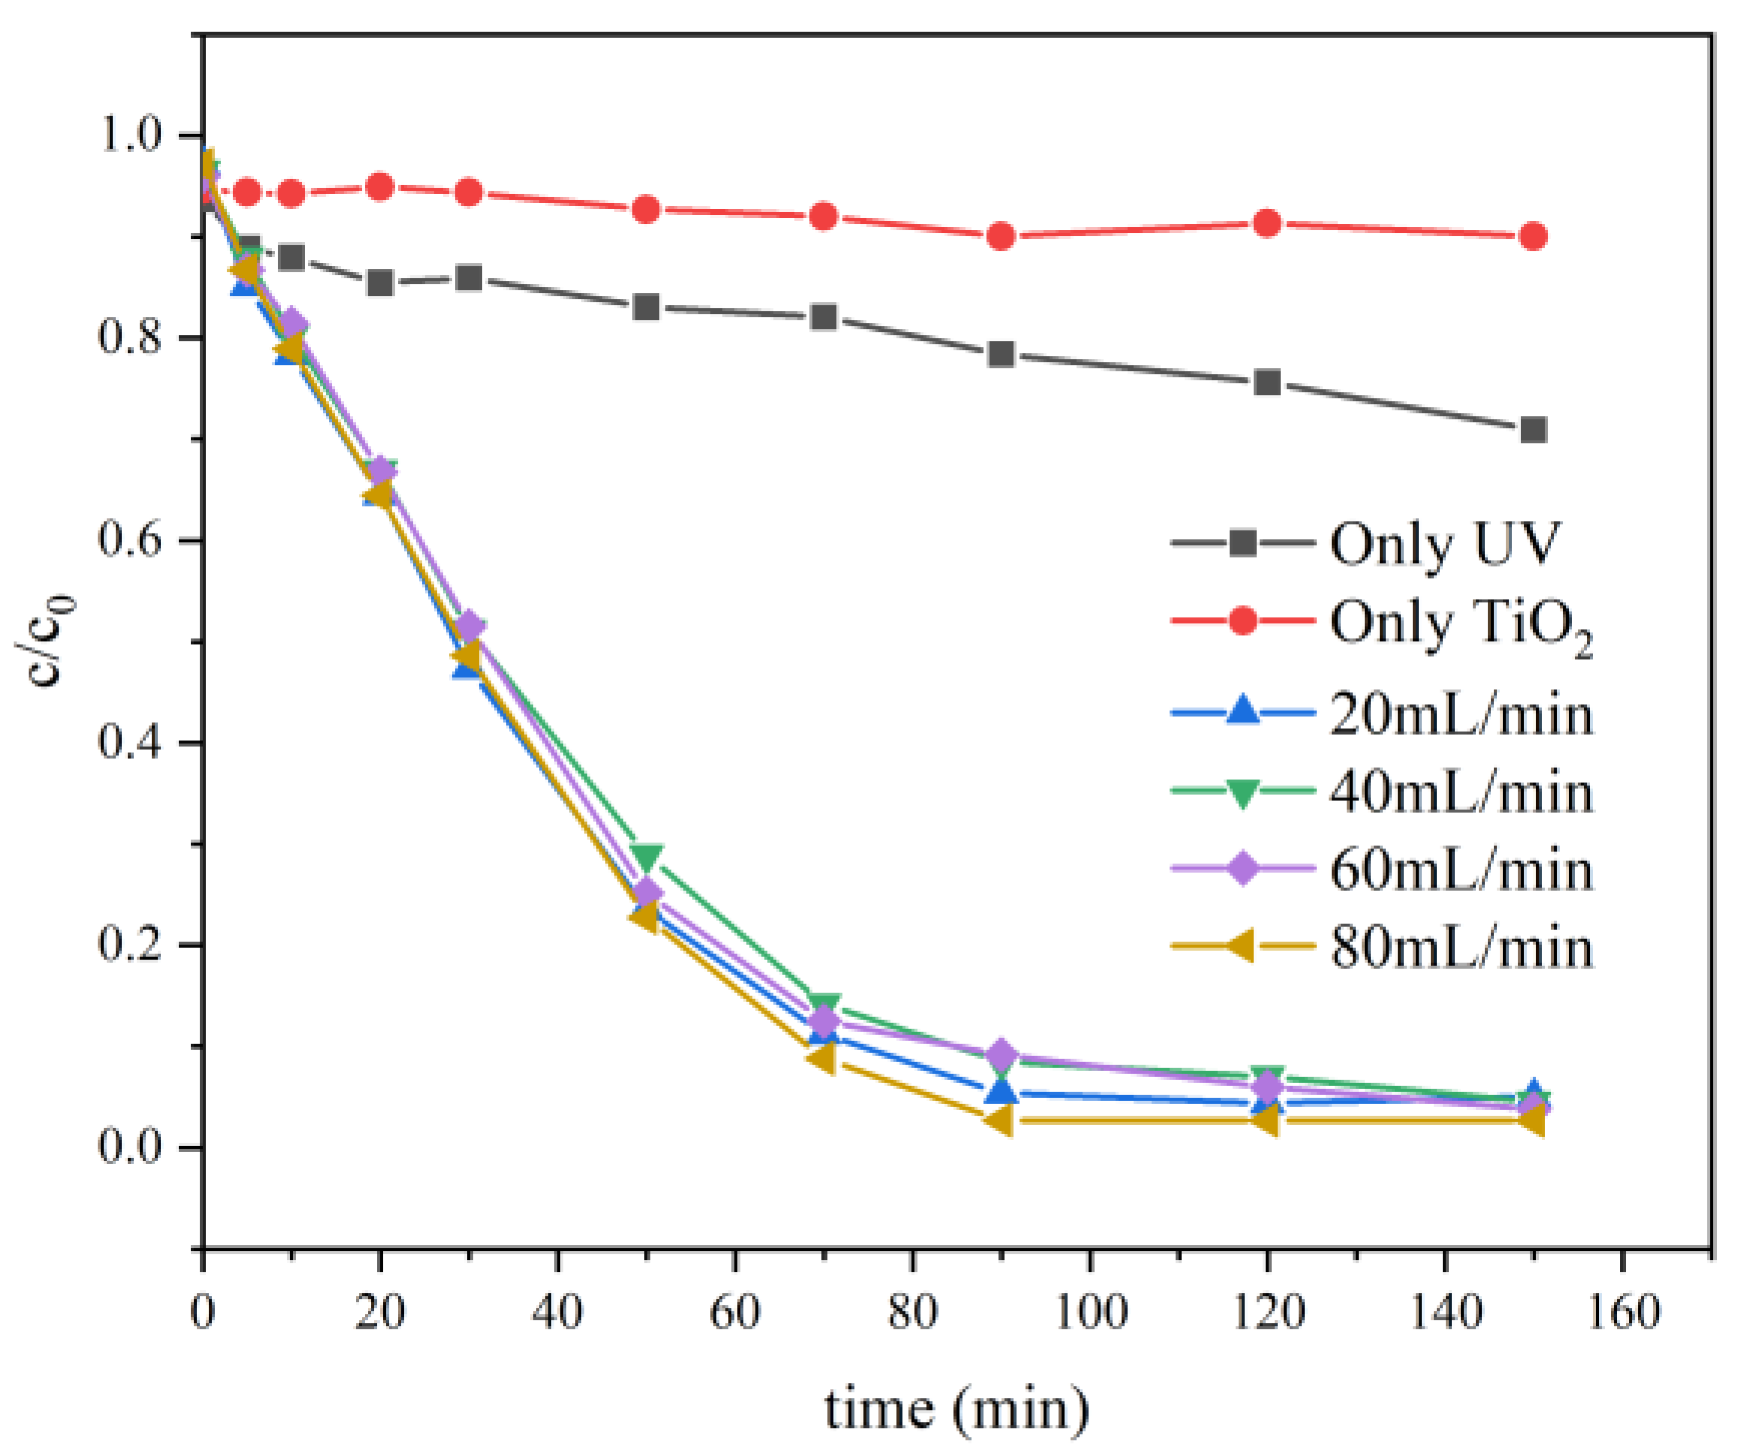
2.1.1. Flow Rate
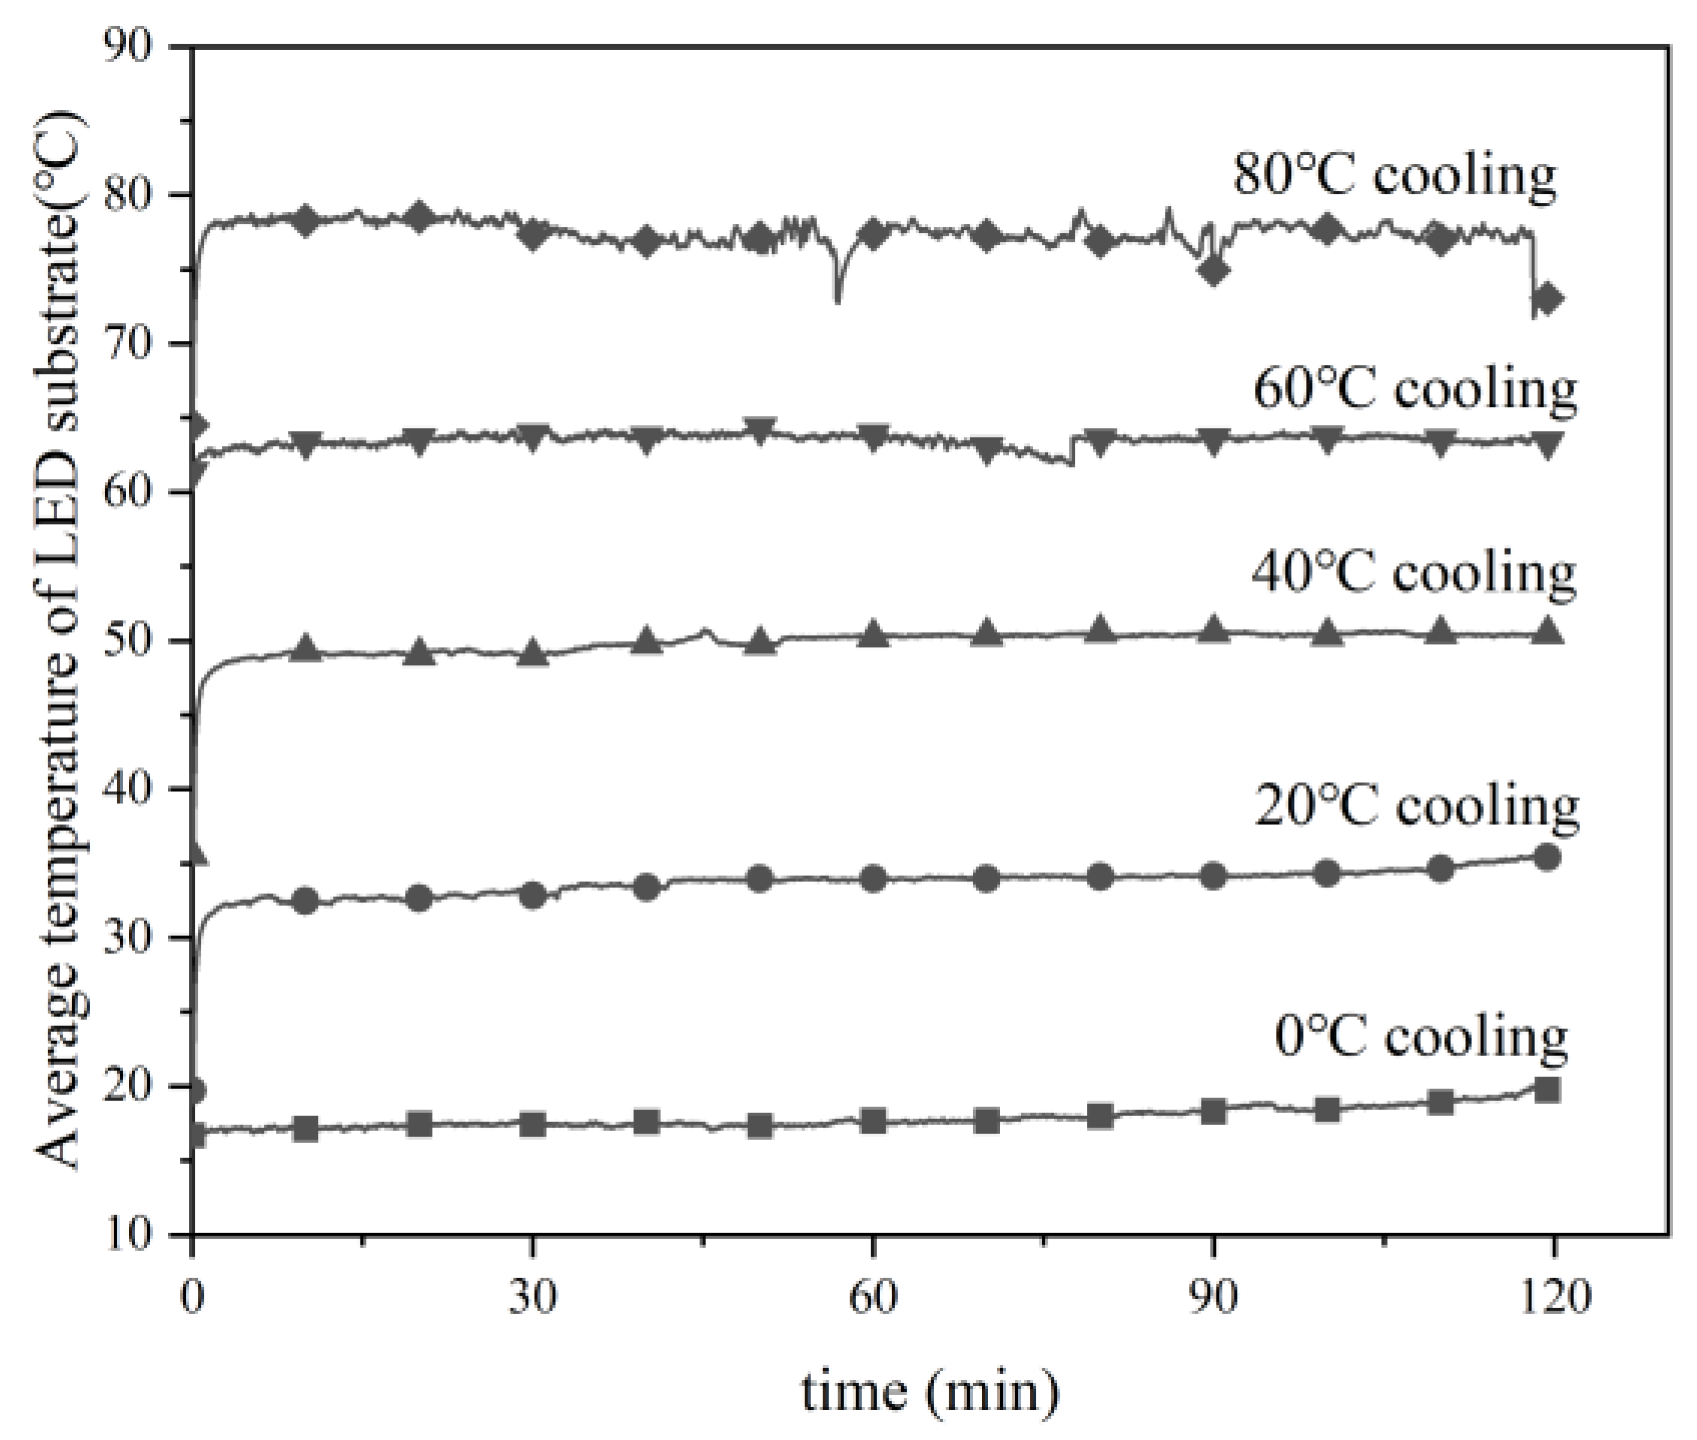
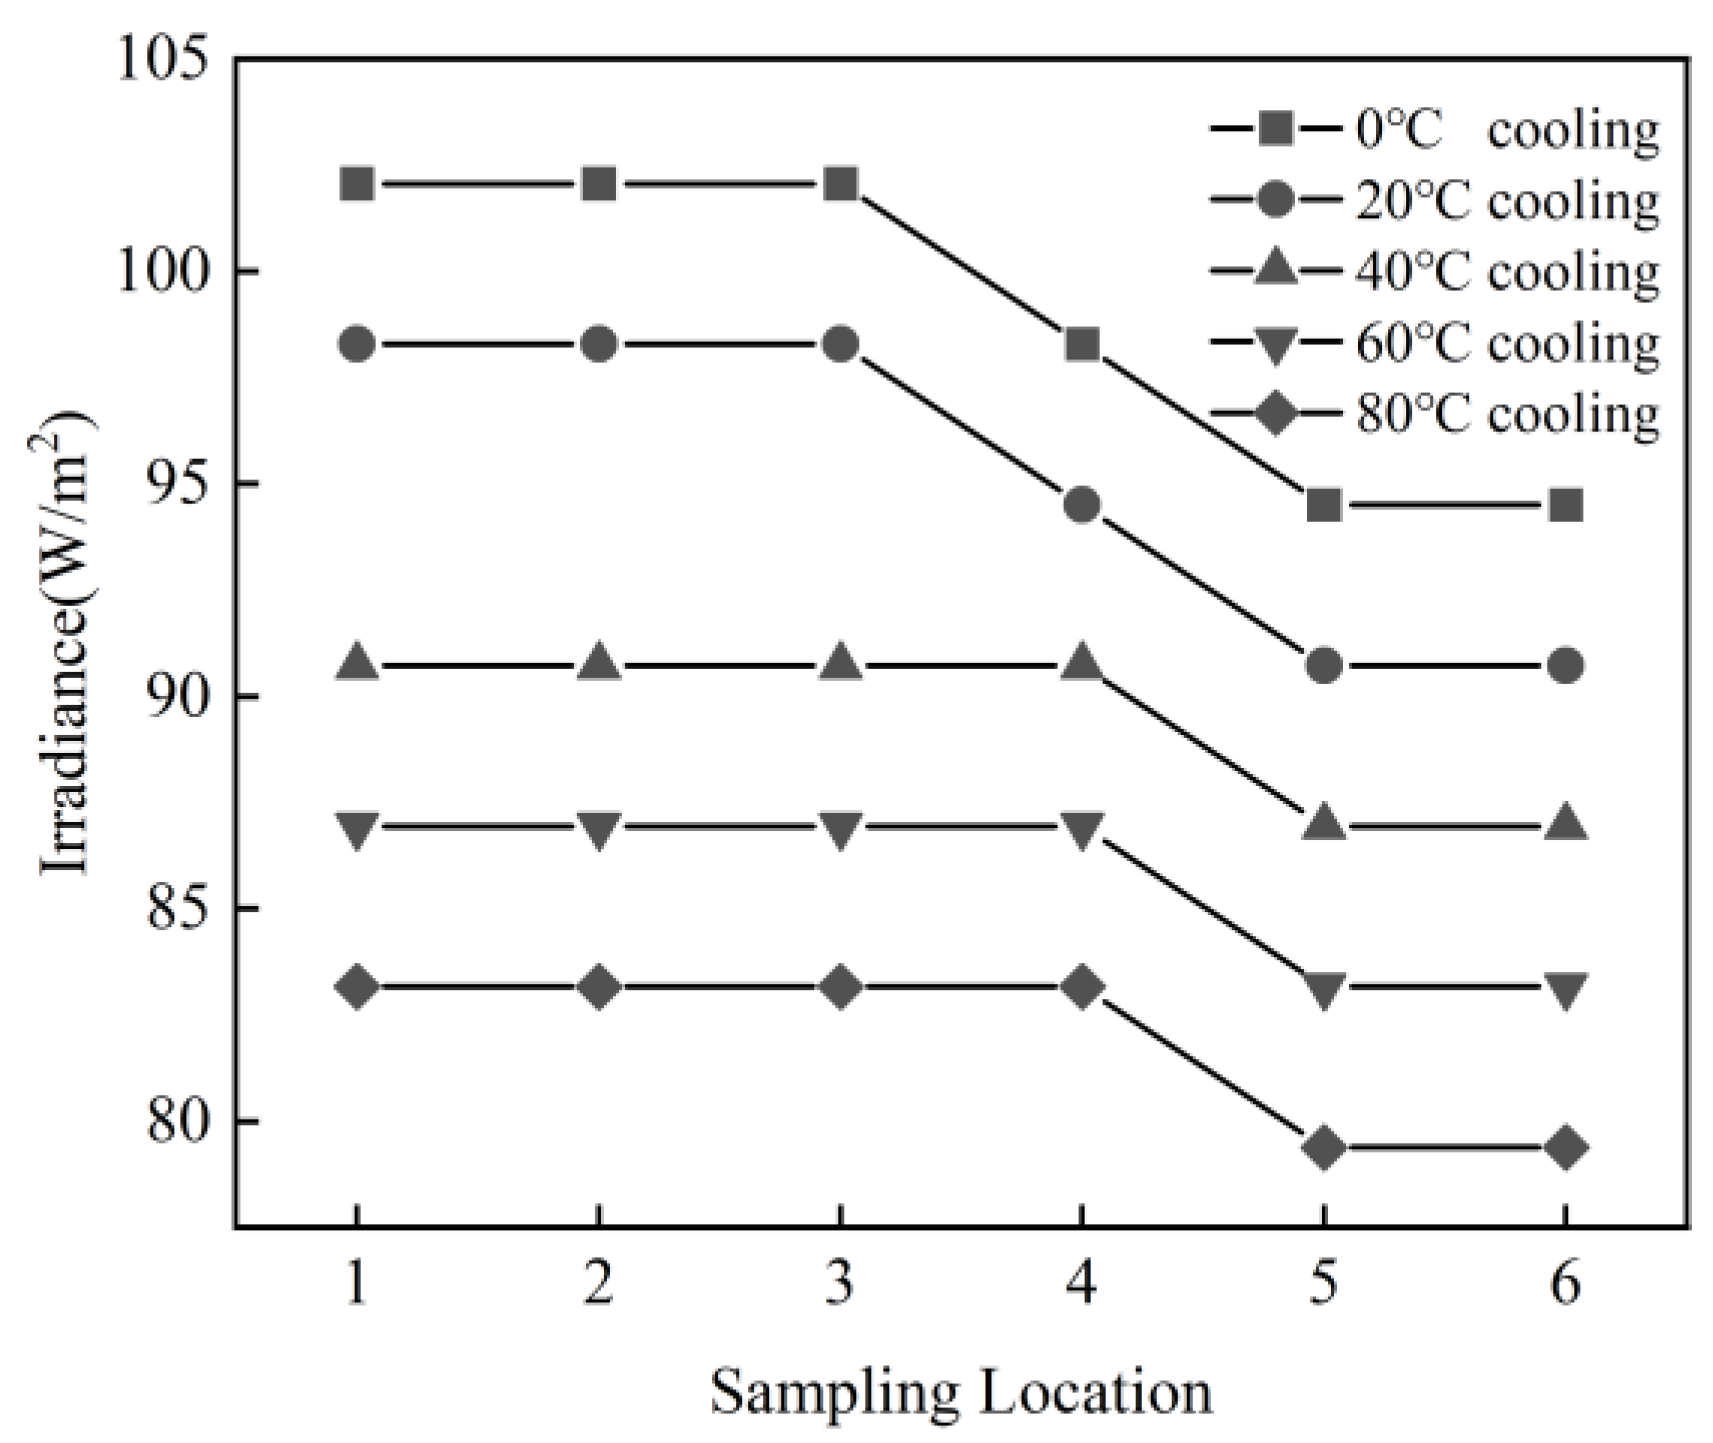
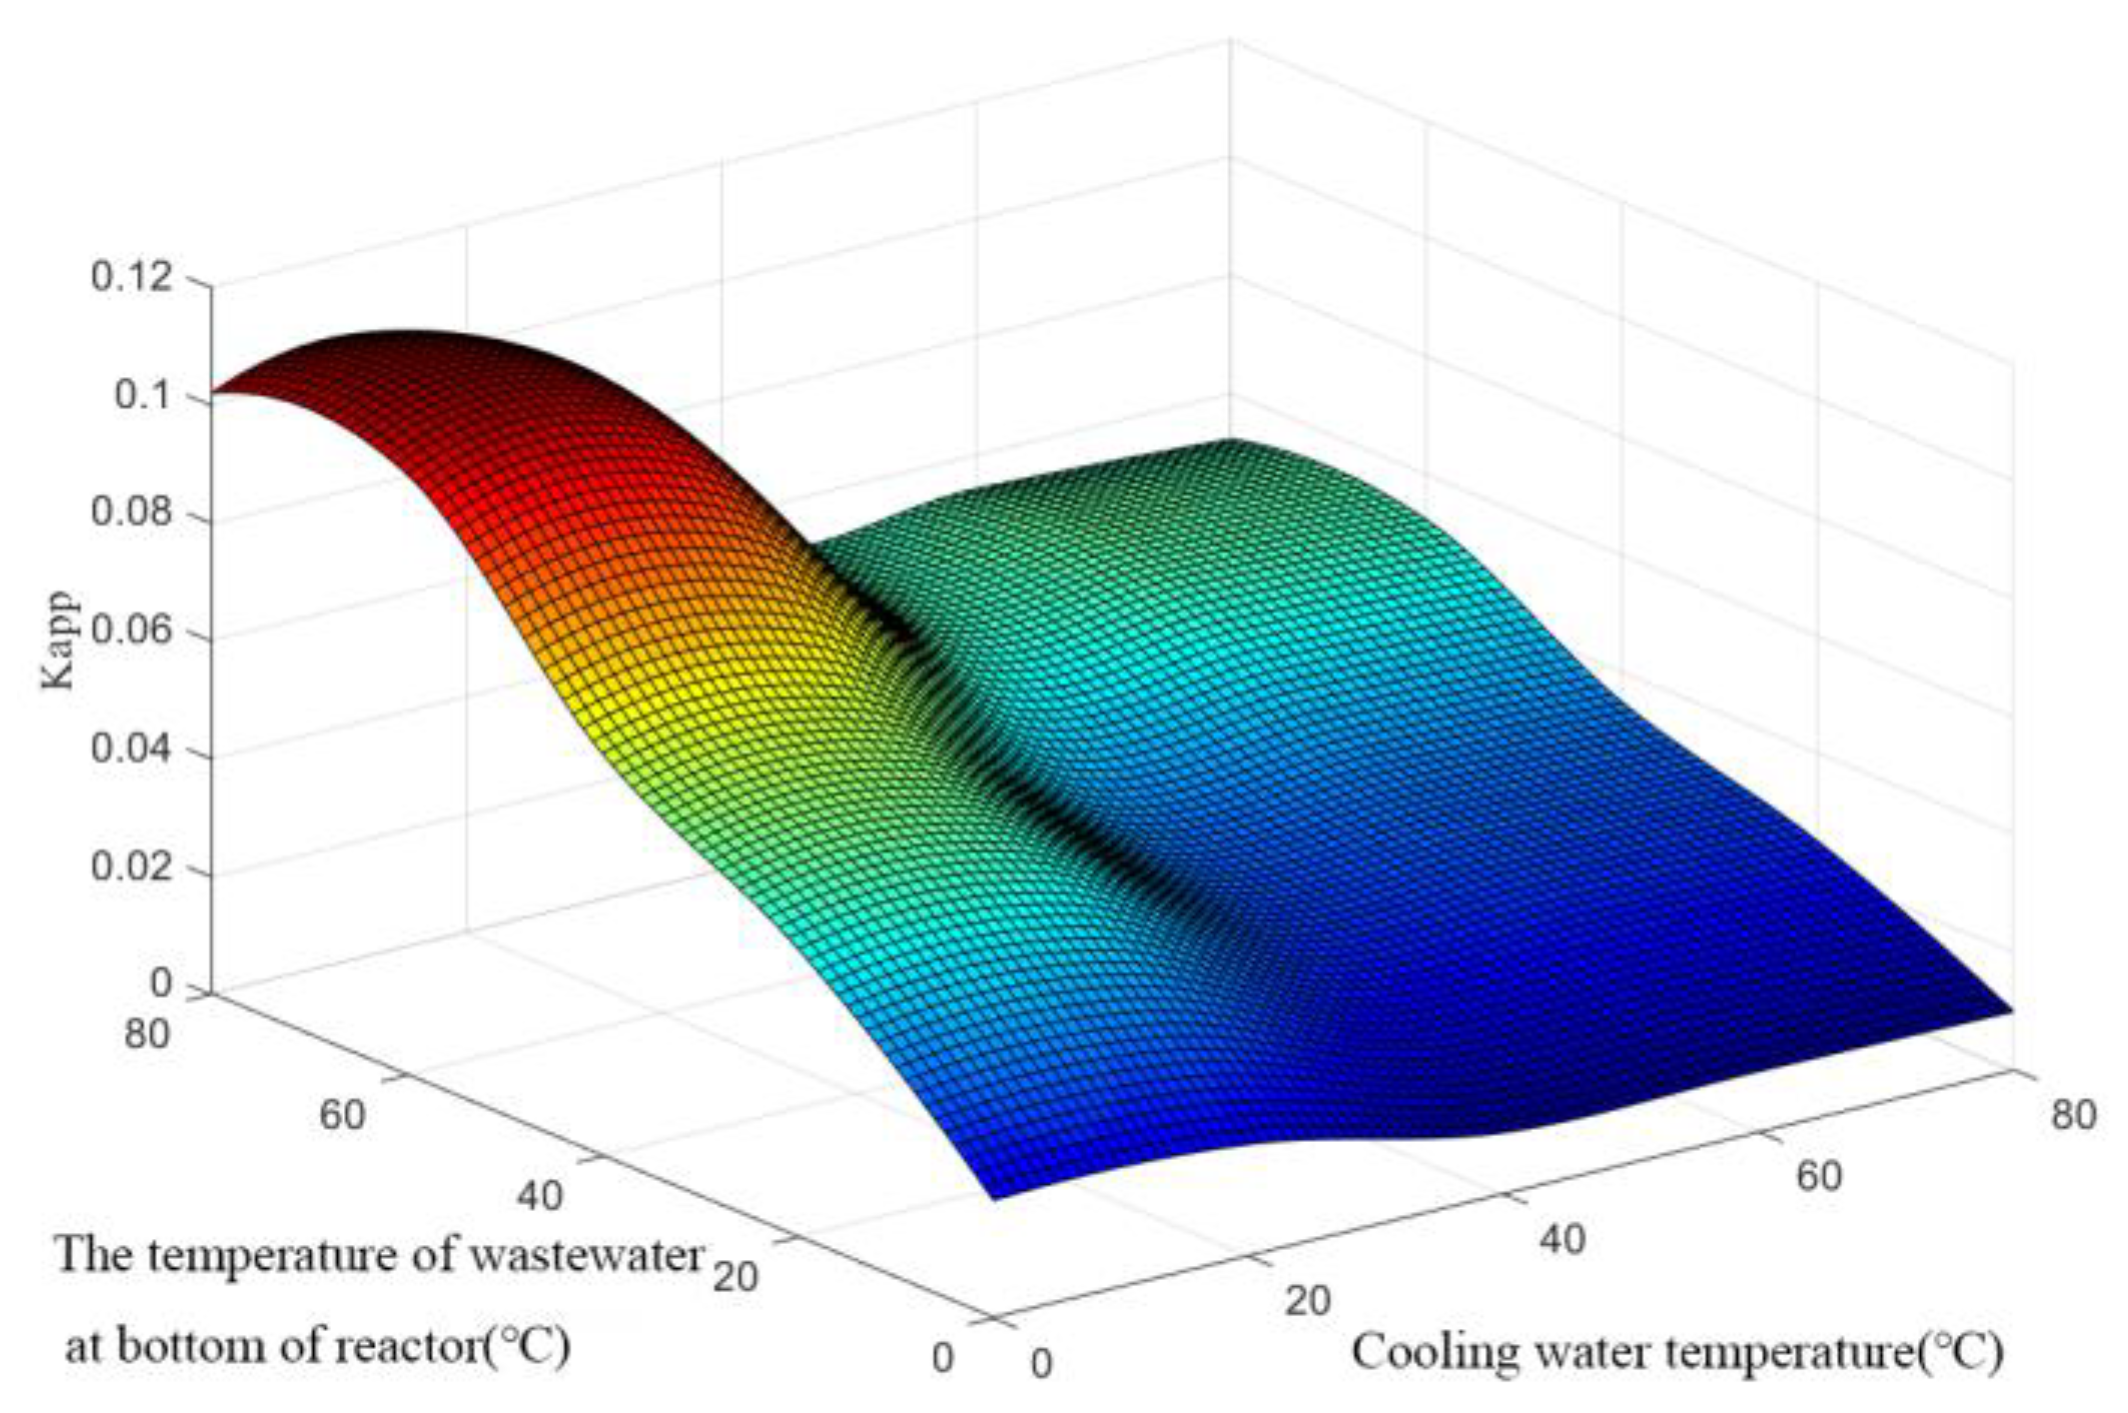
2.1.2. Wastewater Temperature
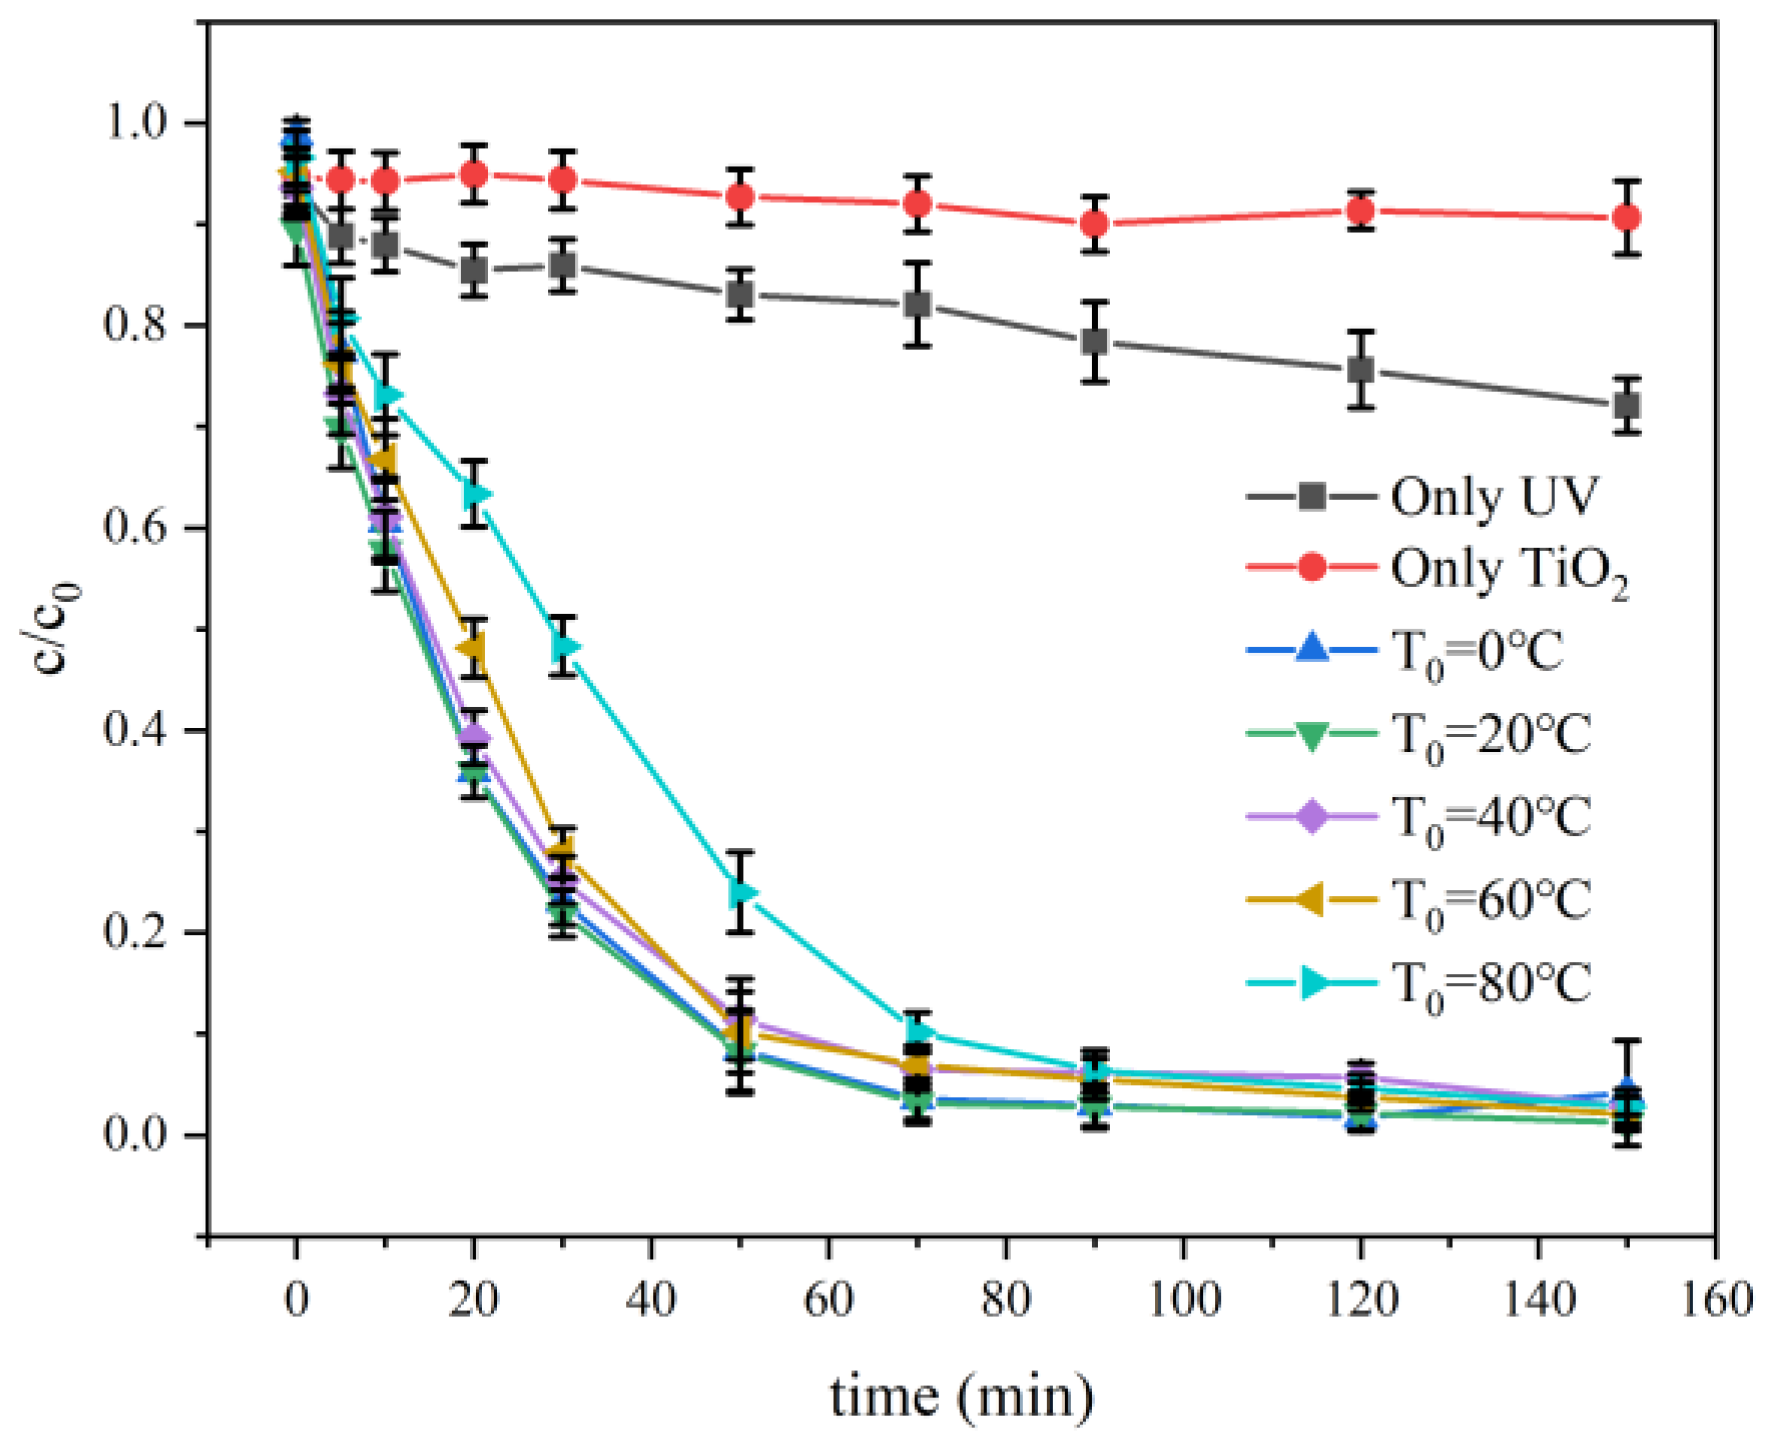
Variation of Cooling Water Temperature on UV-LED Array
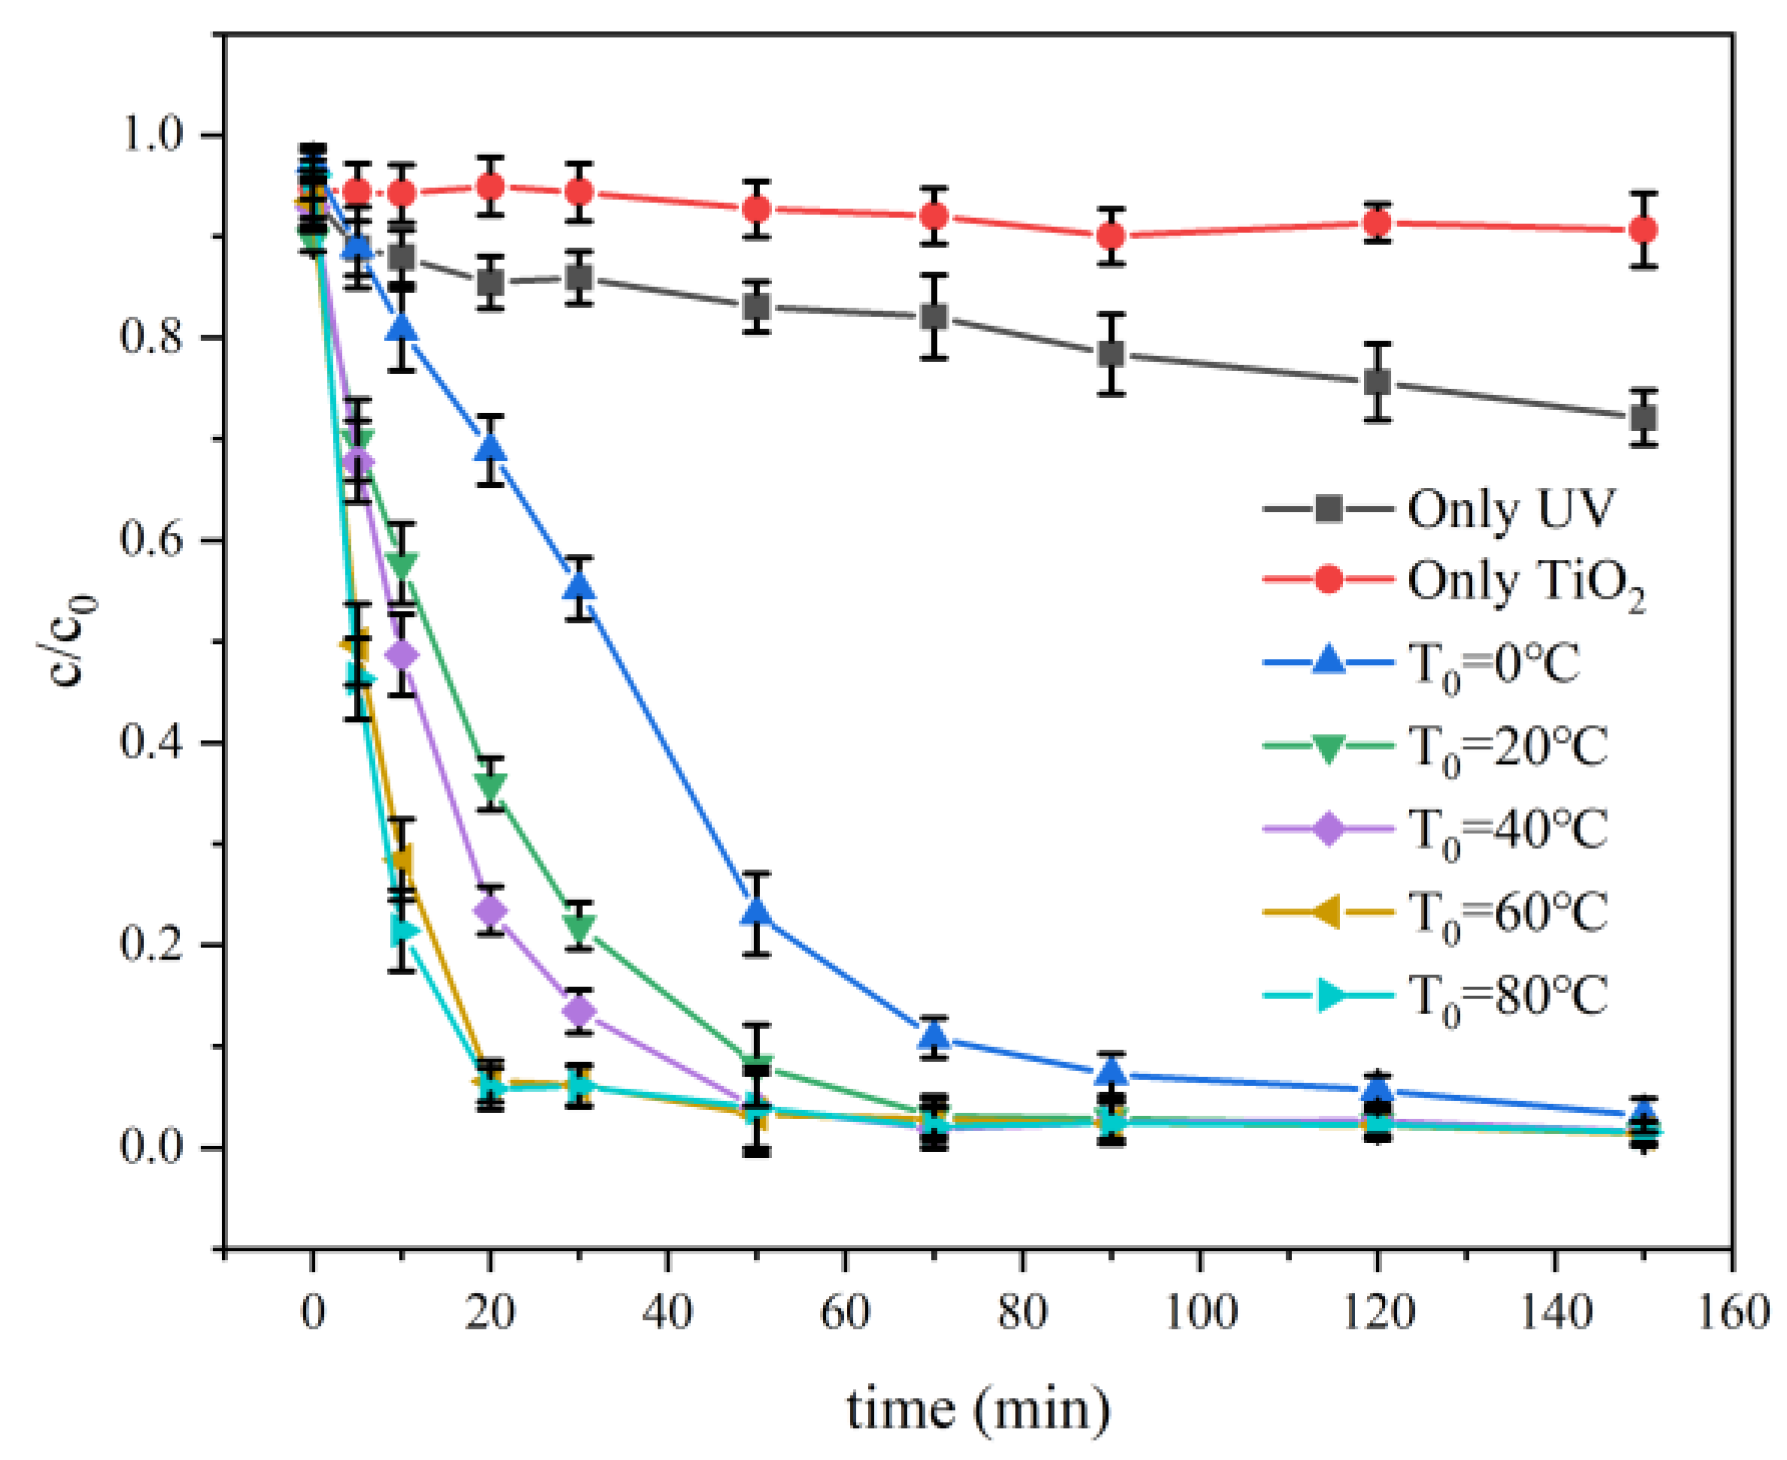
Variation of the Temperature of Wastewater at Bottom of Reactor
2.2. The Effect of Photocatalytic Performance
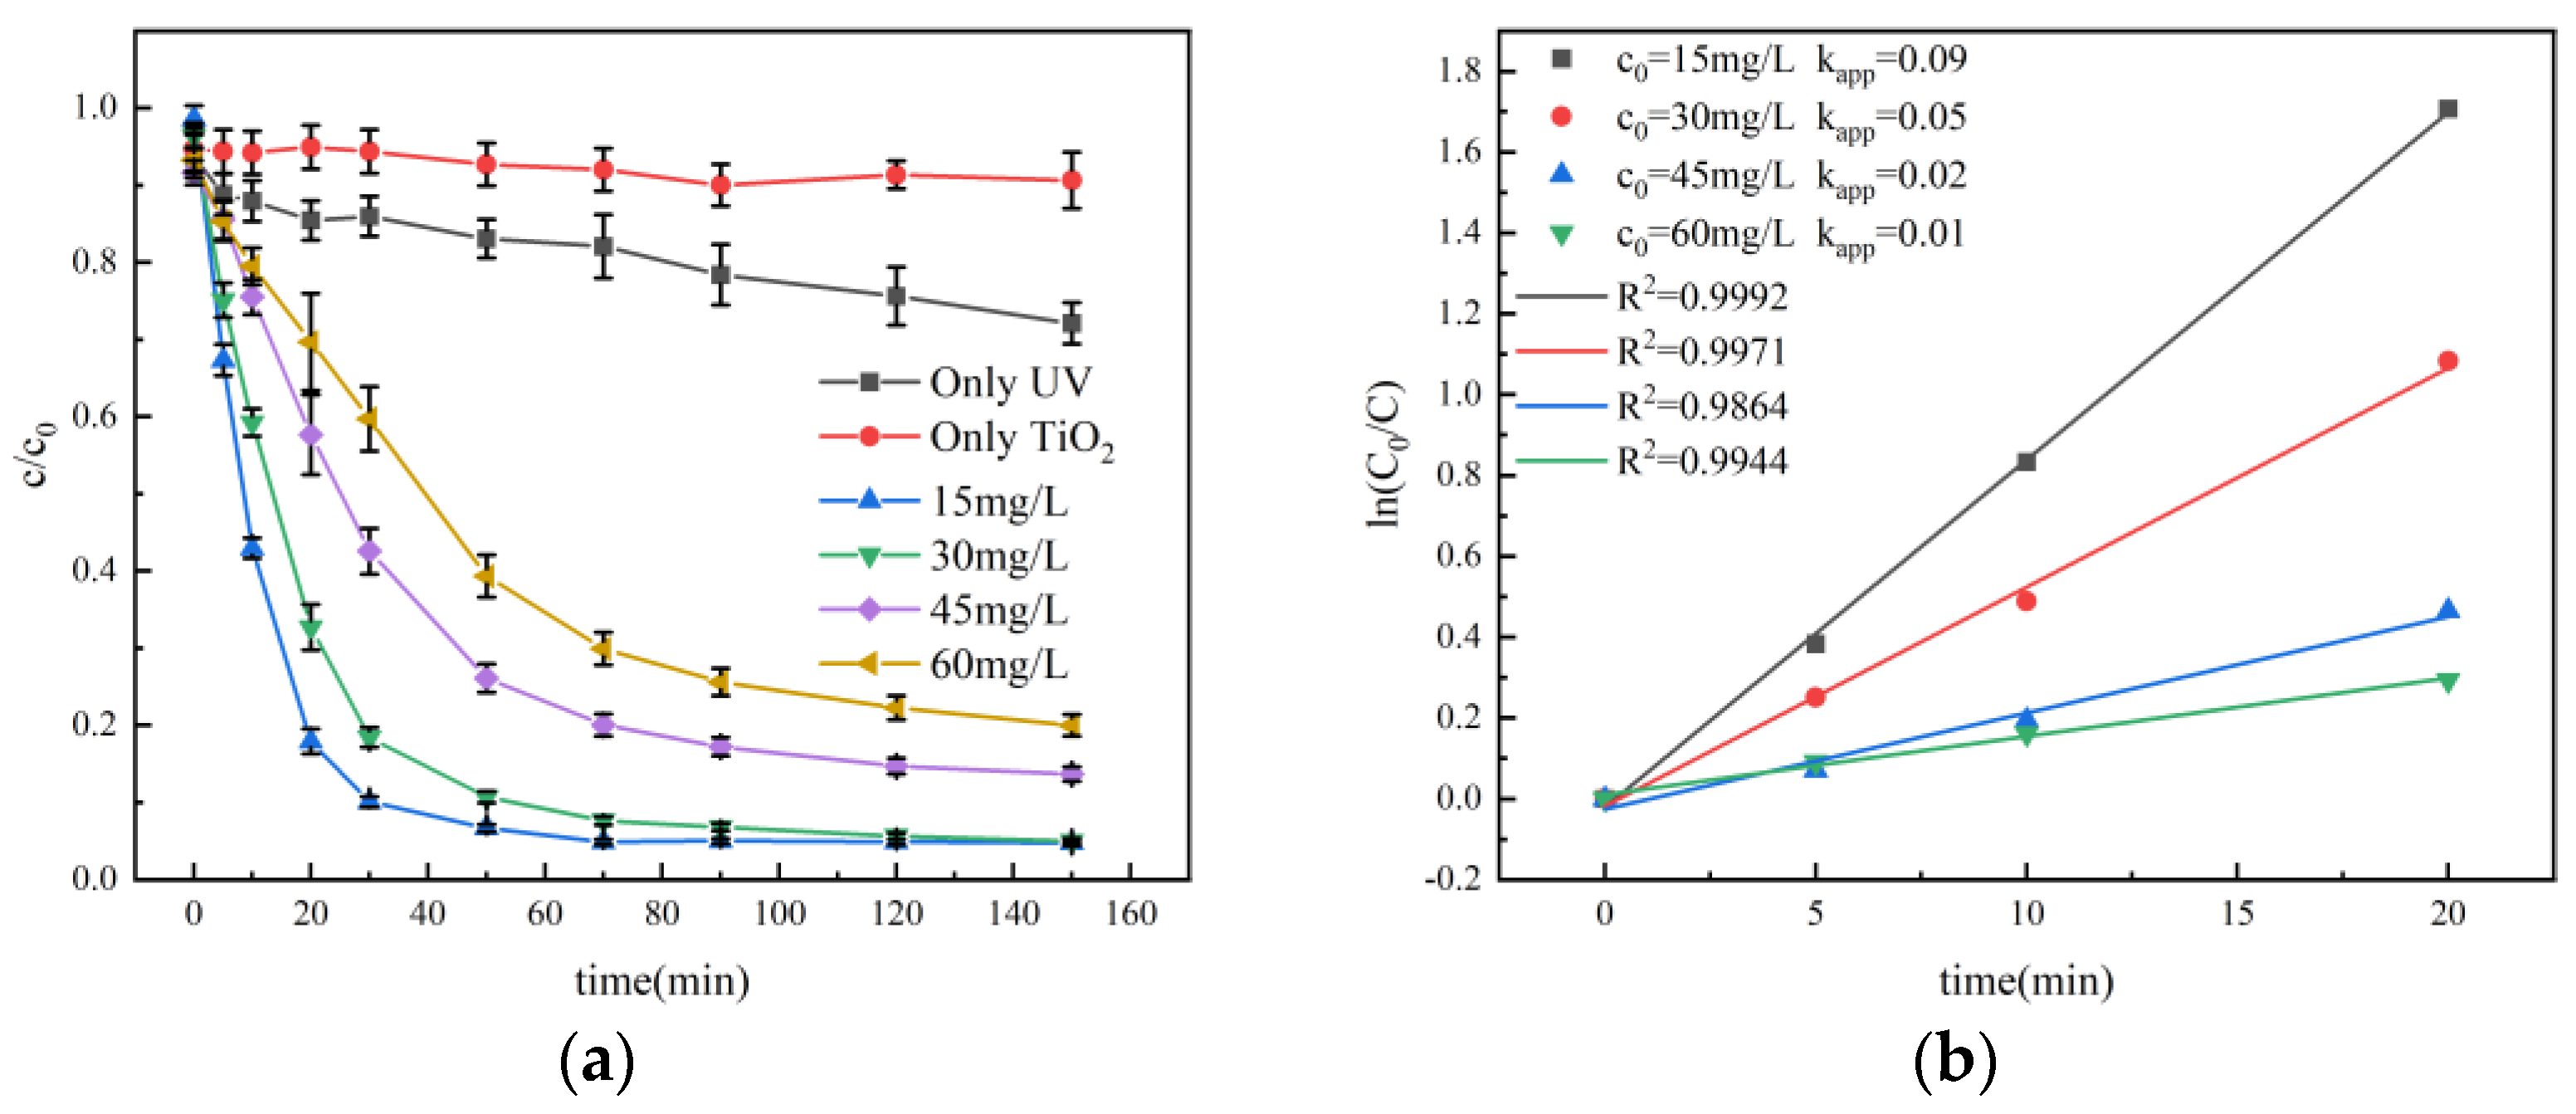
2.2.1. Initial AR 26 Concentration
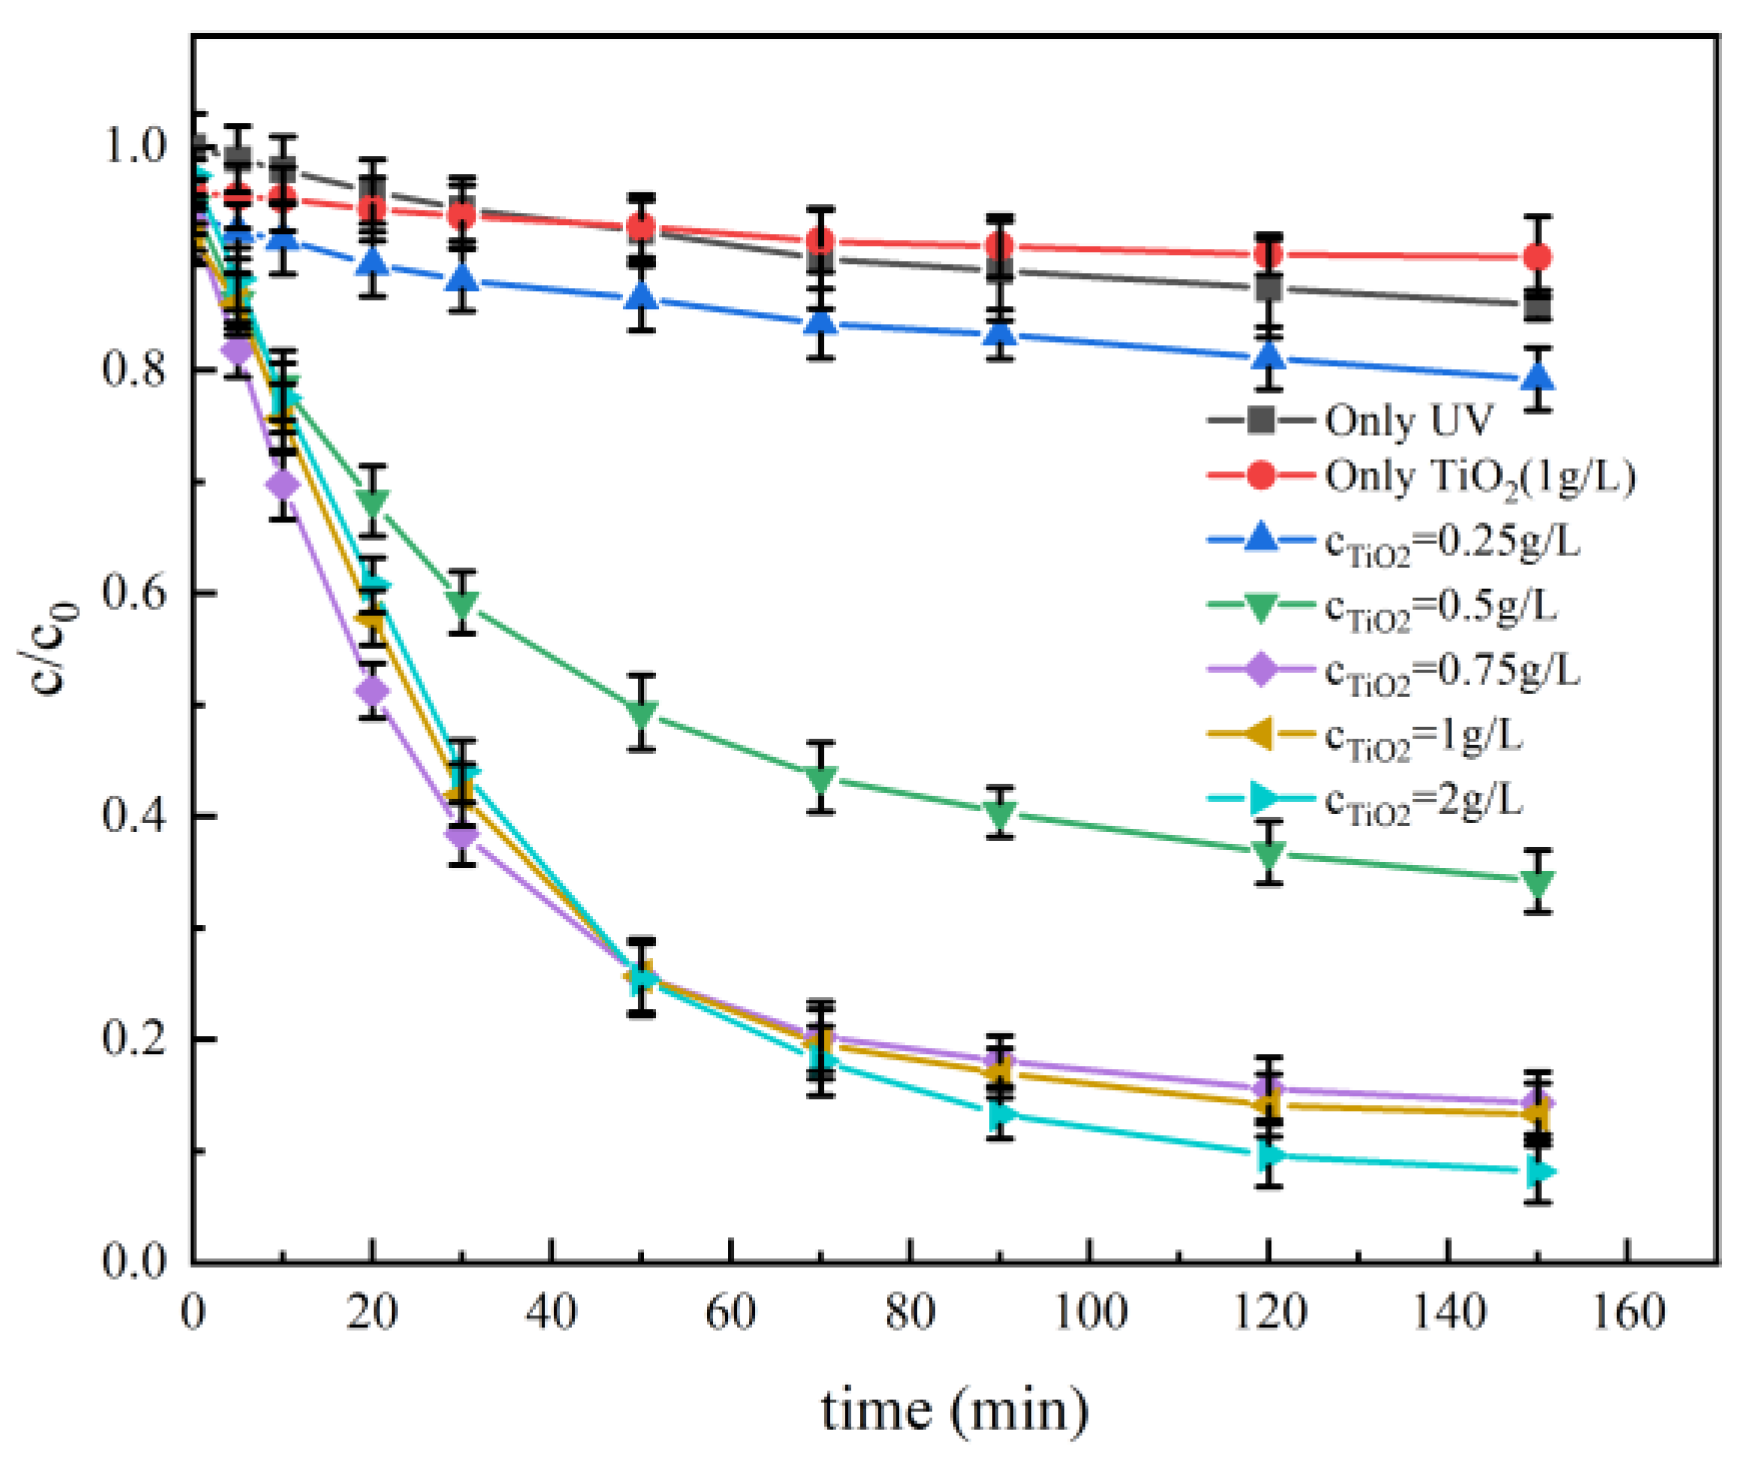
2.2.2. TiO2 Dosage
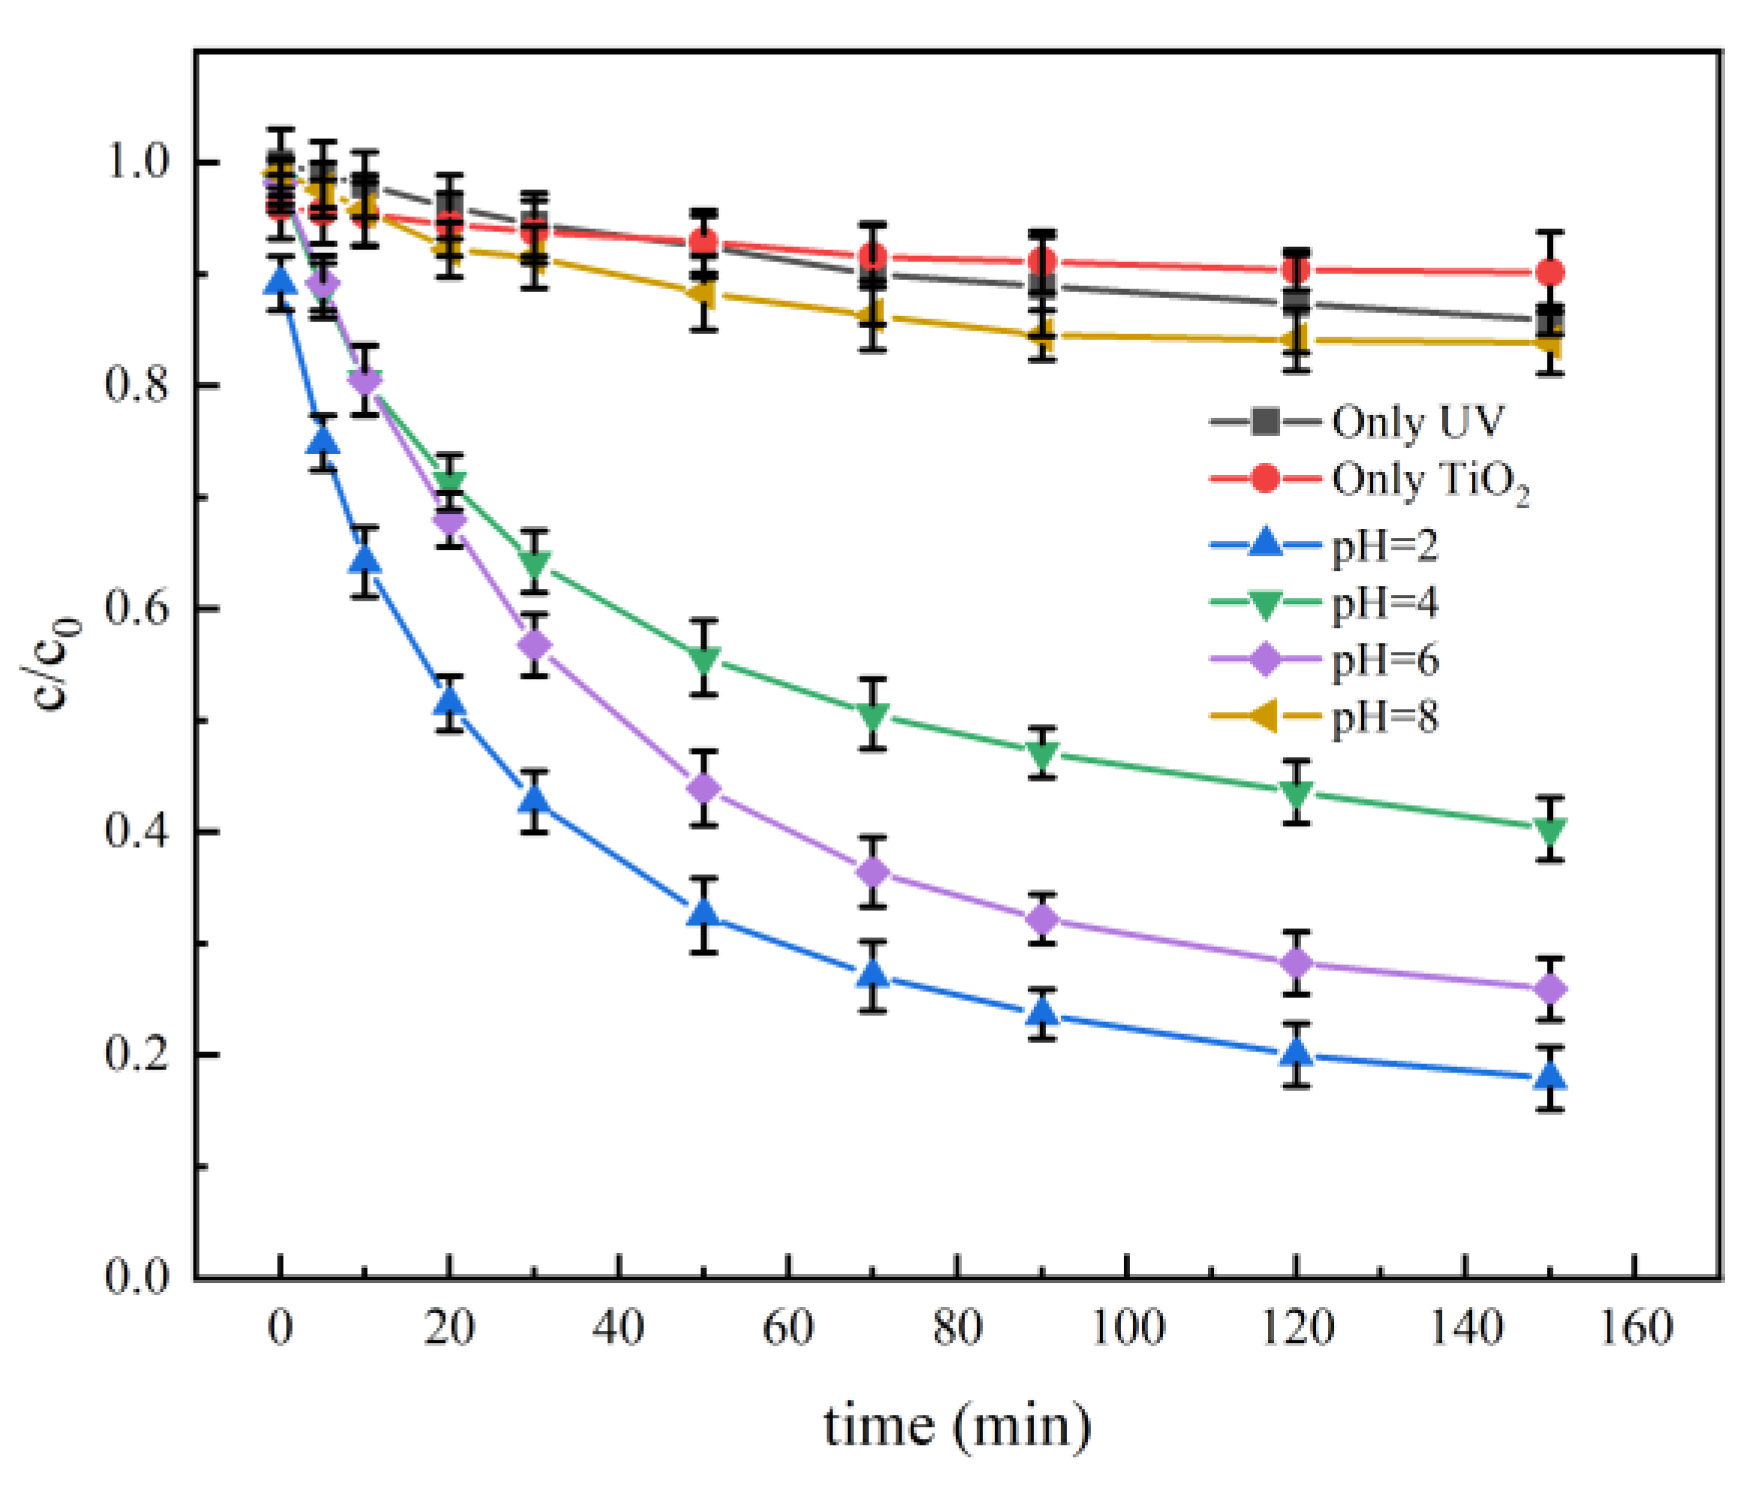
2.2.3. pH
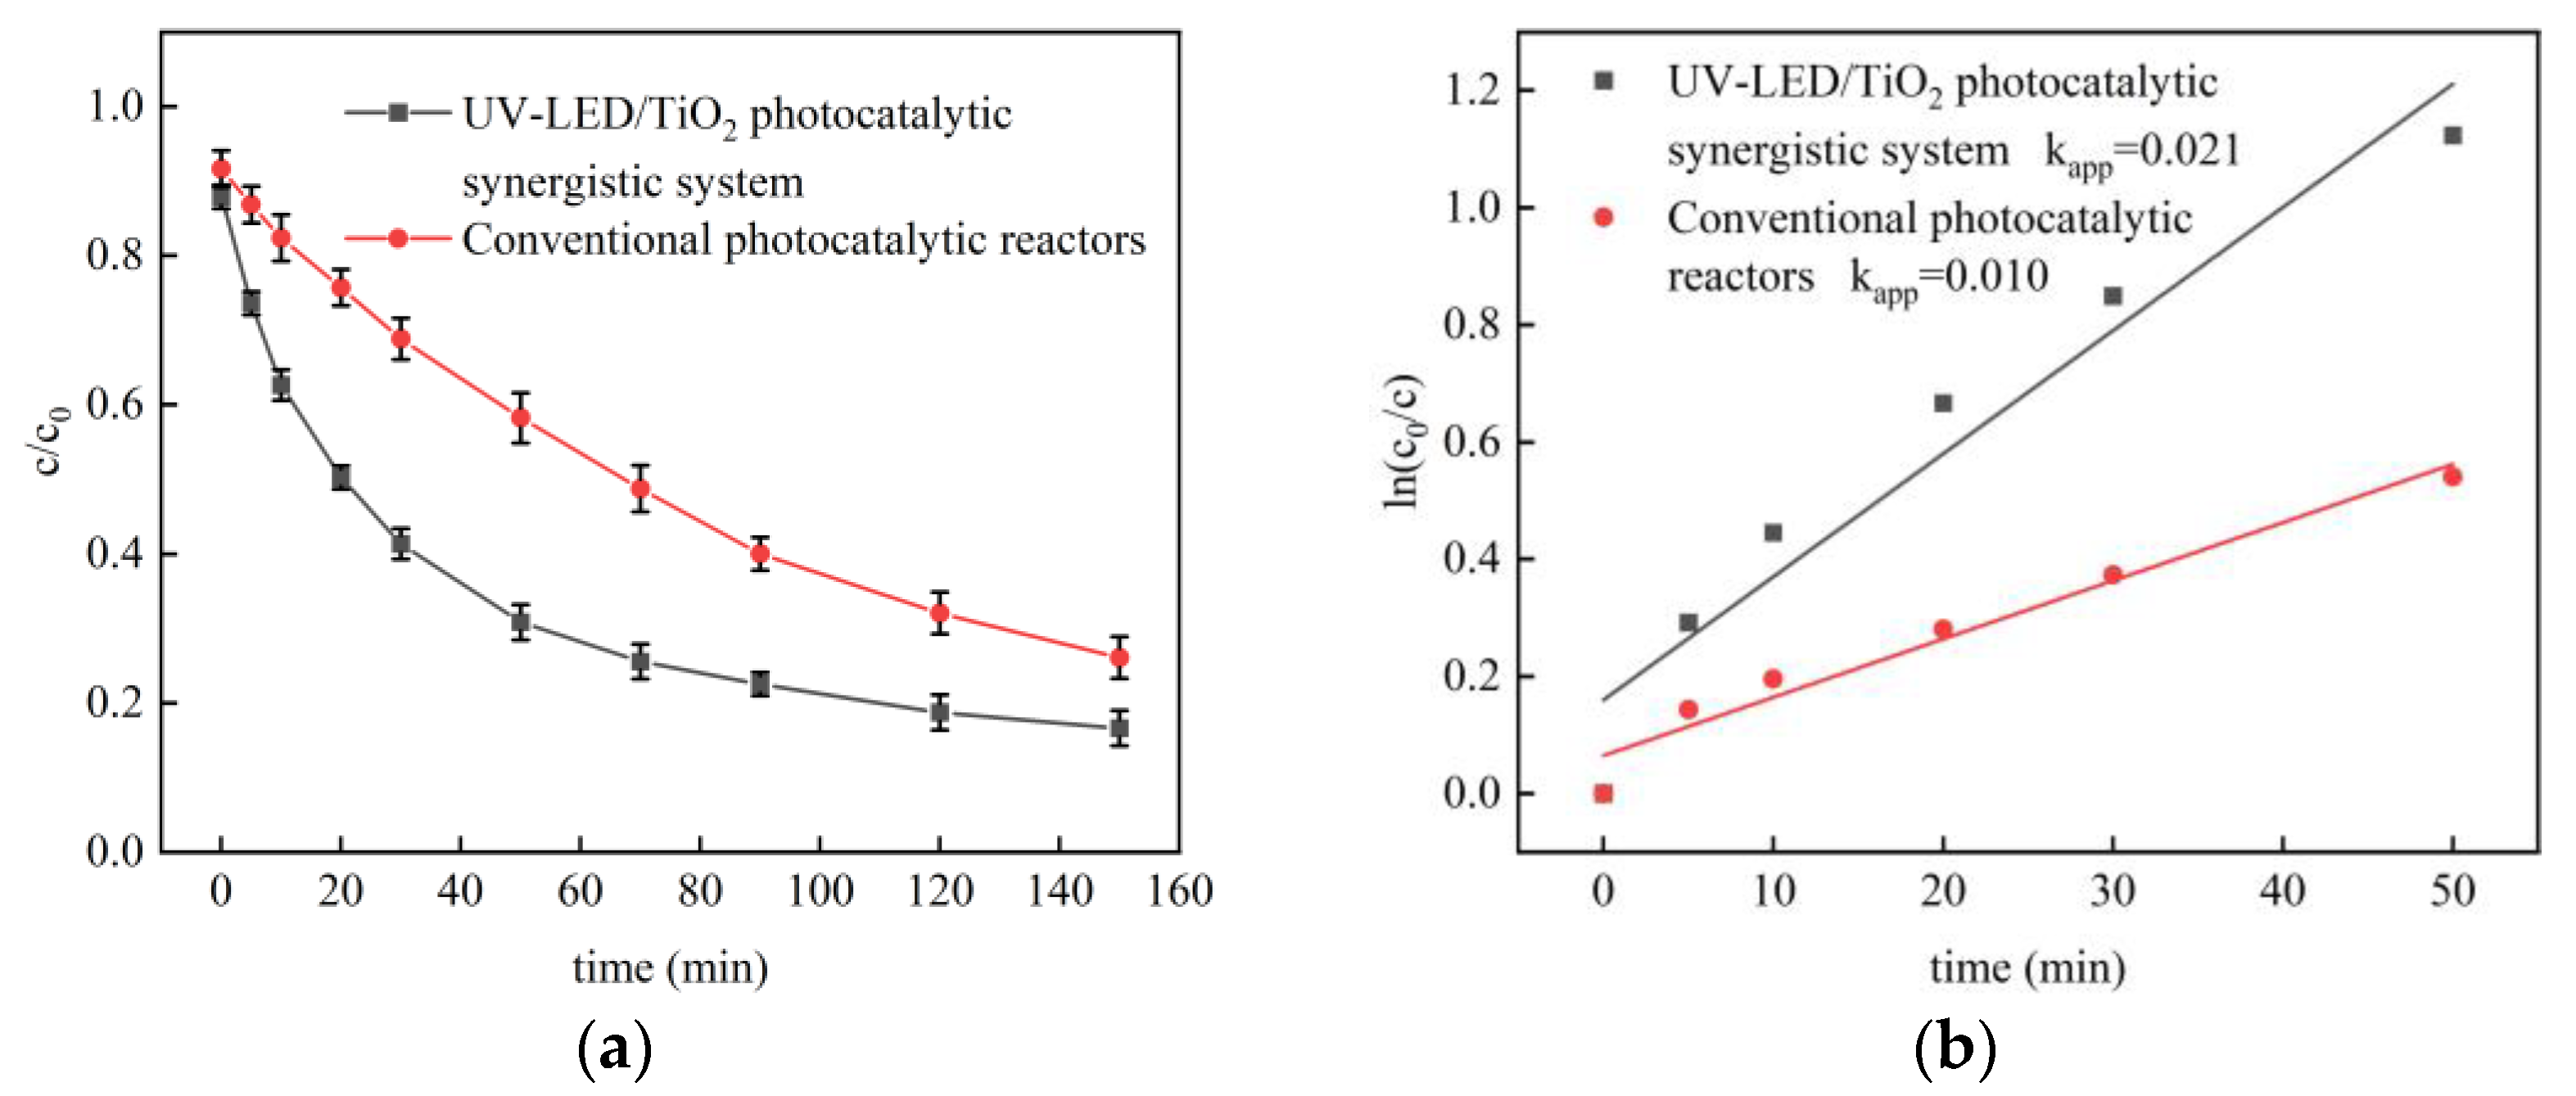
2.3. Performance Comparison with Conventional Photocatalytic Reactor
2.3.1. Wastewater Degradation Performance
2.3.2. Optical Quantum Efficiency
2.3.3. Analysis of Energy Consumption
3. Materials and Methods
3.1. Materials
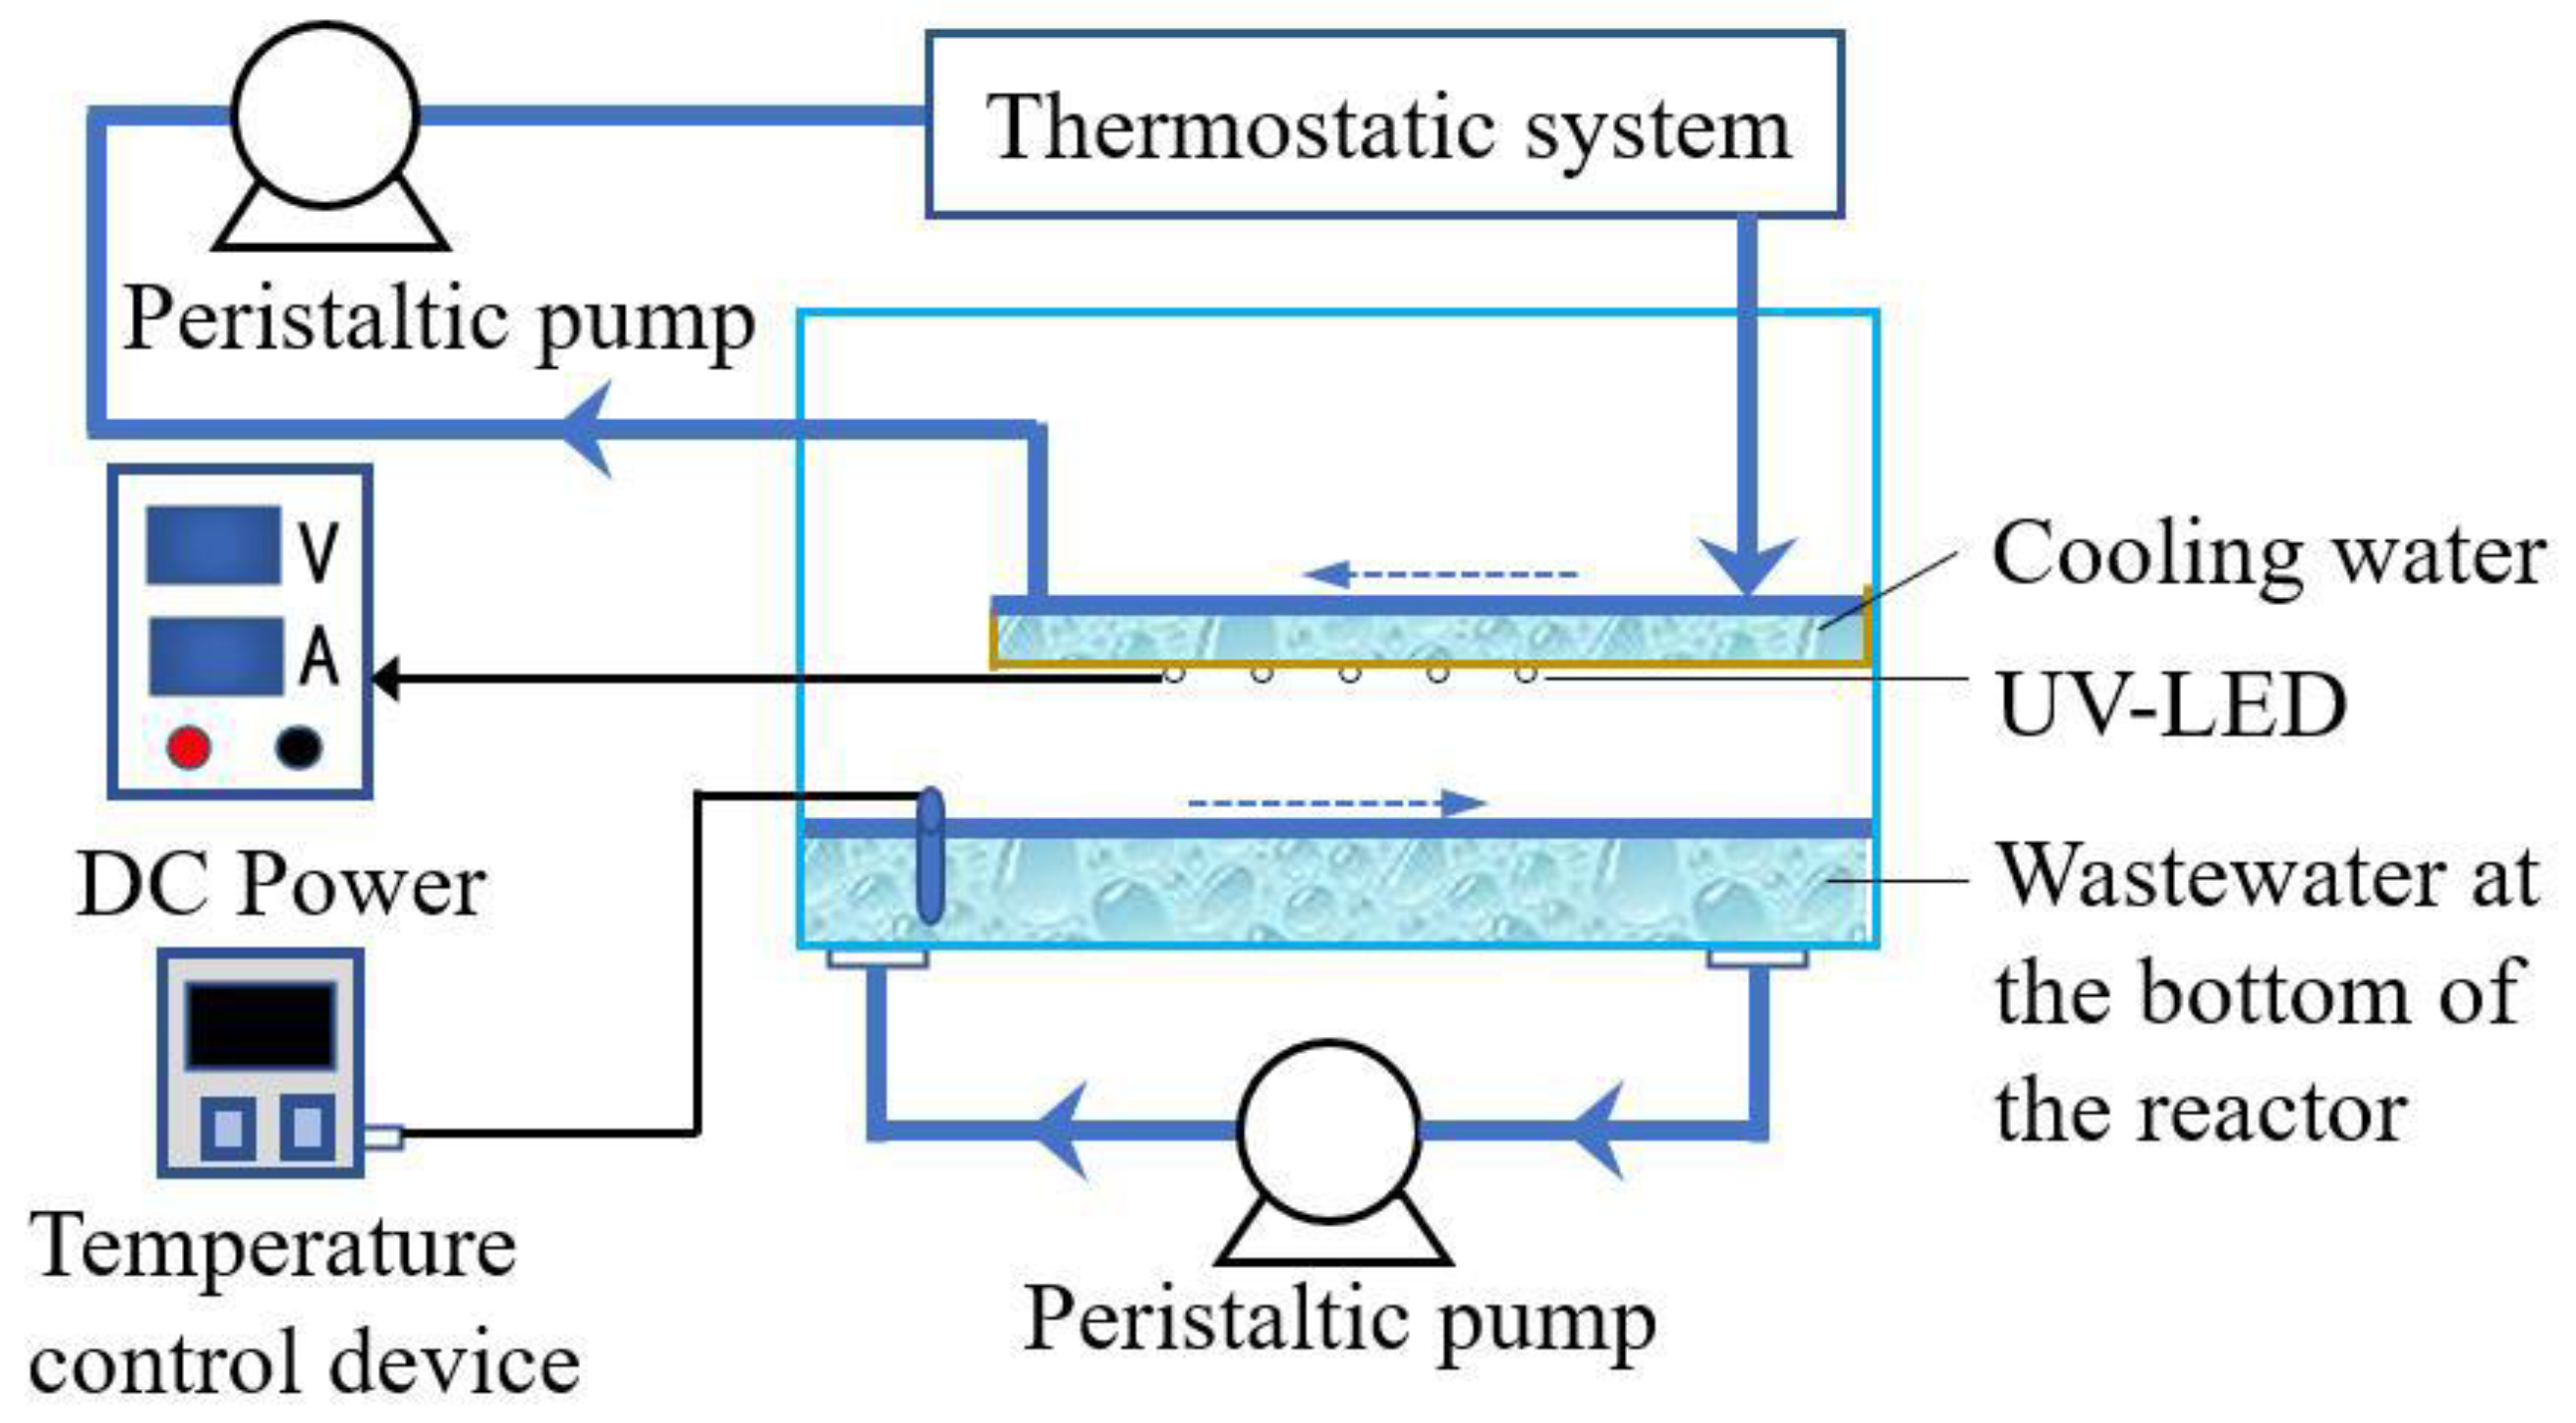
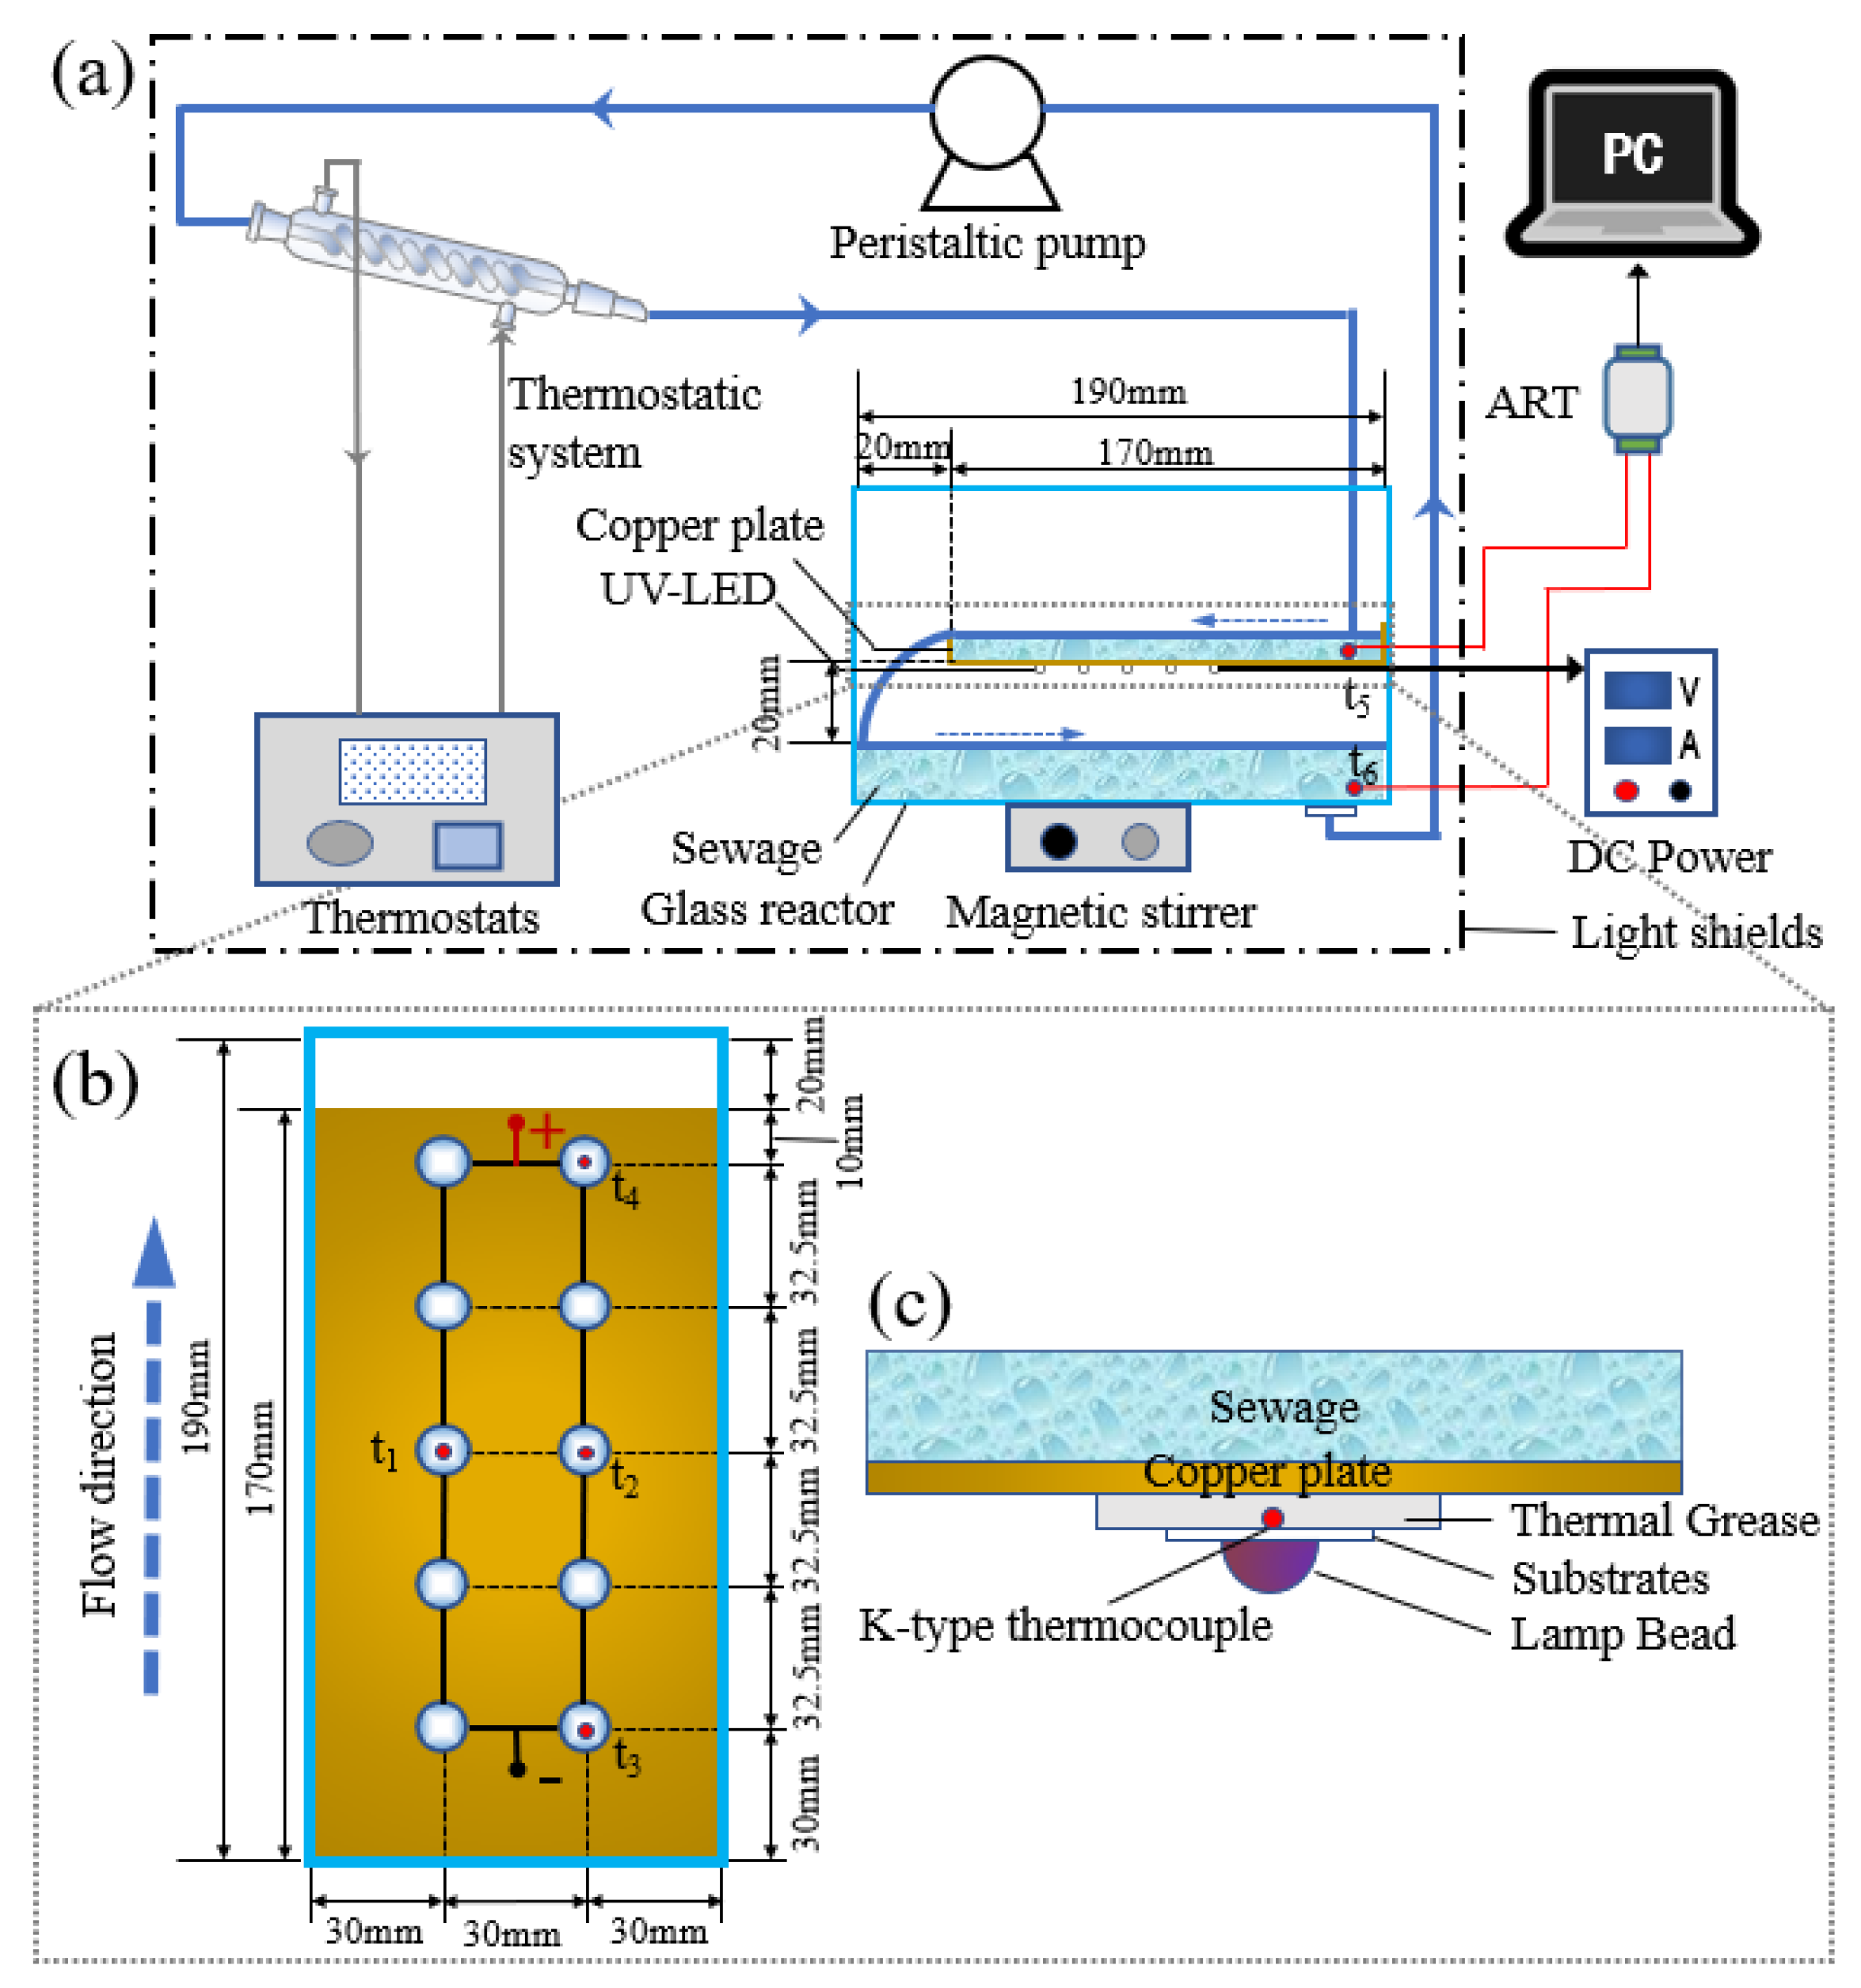
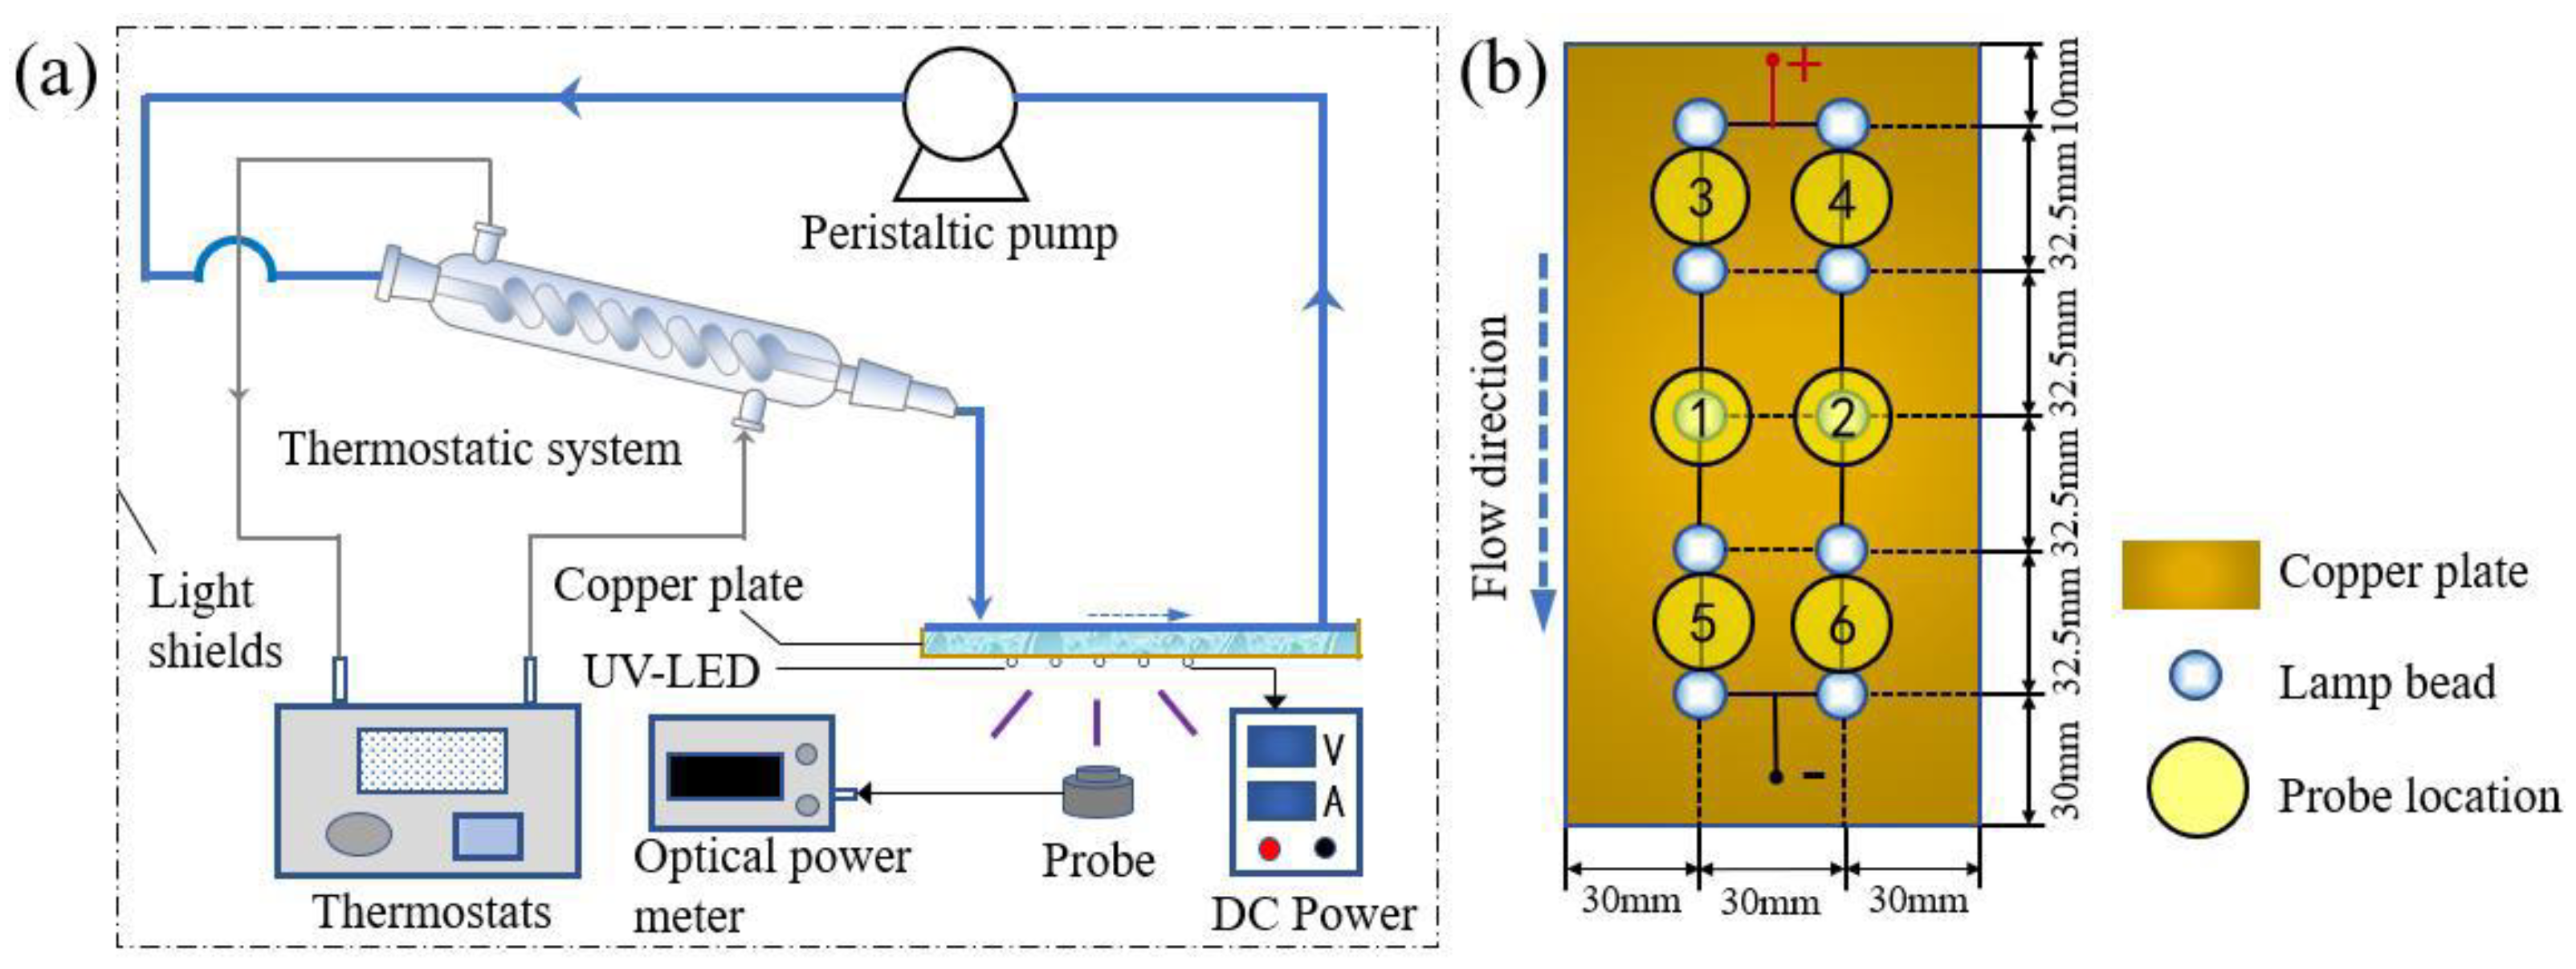
3.2. UV-LED/TiO2 Photocatalytic Synergistic System
3.3. Experimental Procedure
3.3.1. Experimental Process of a Synergistic System
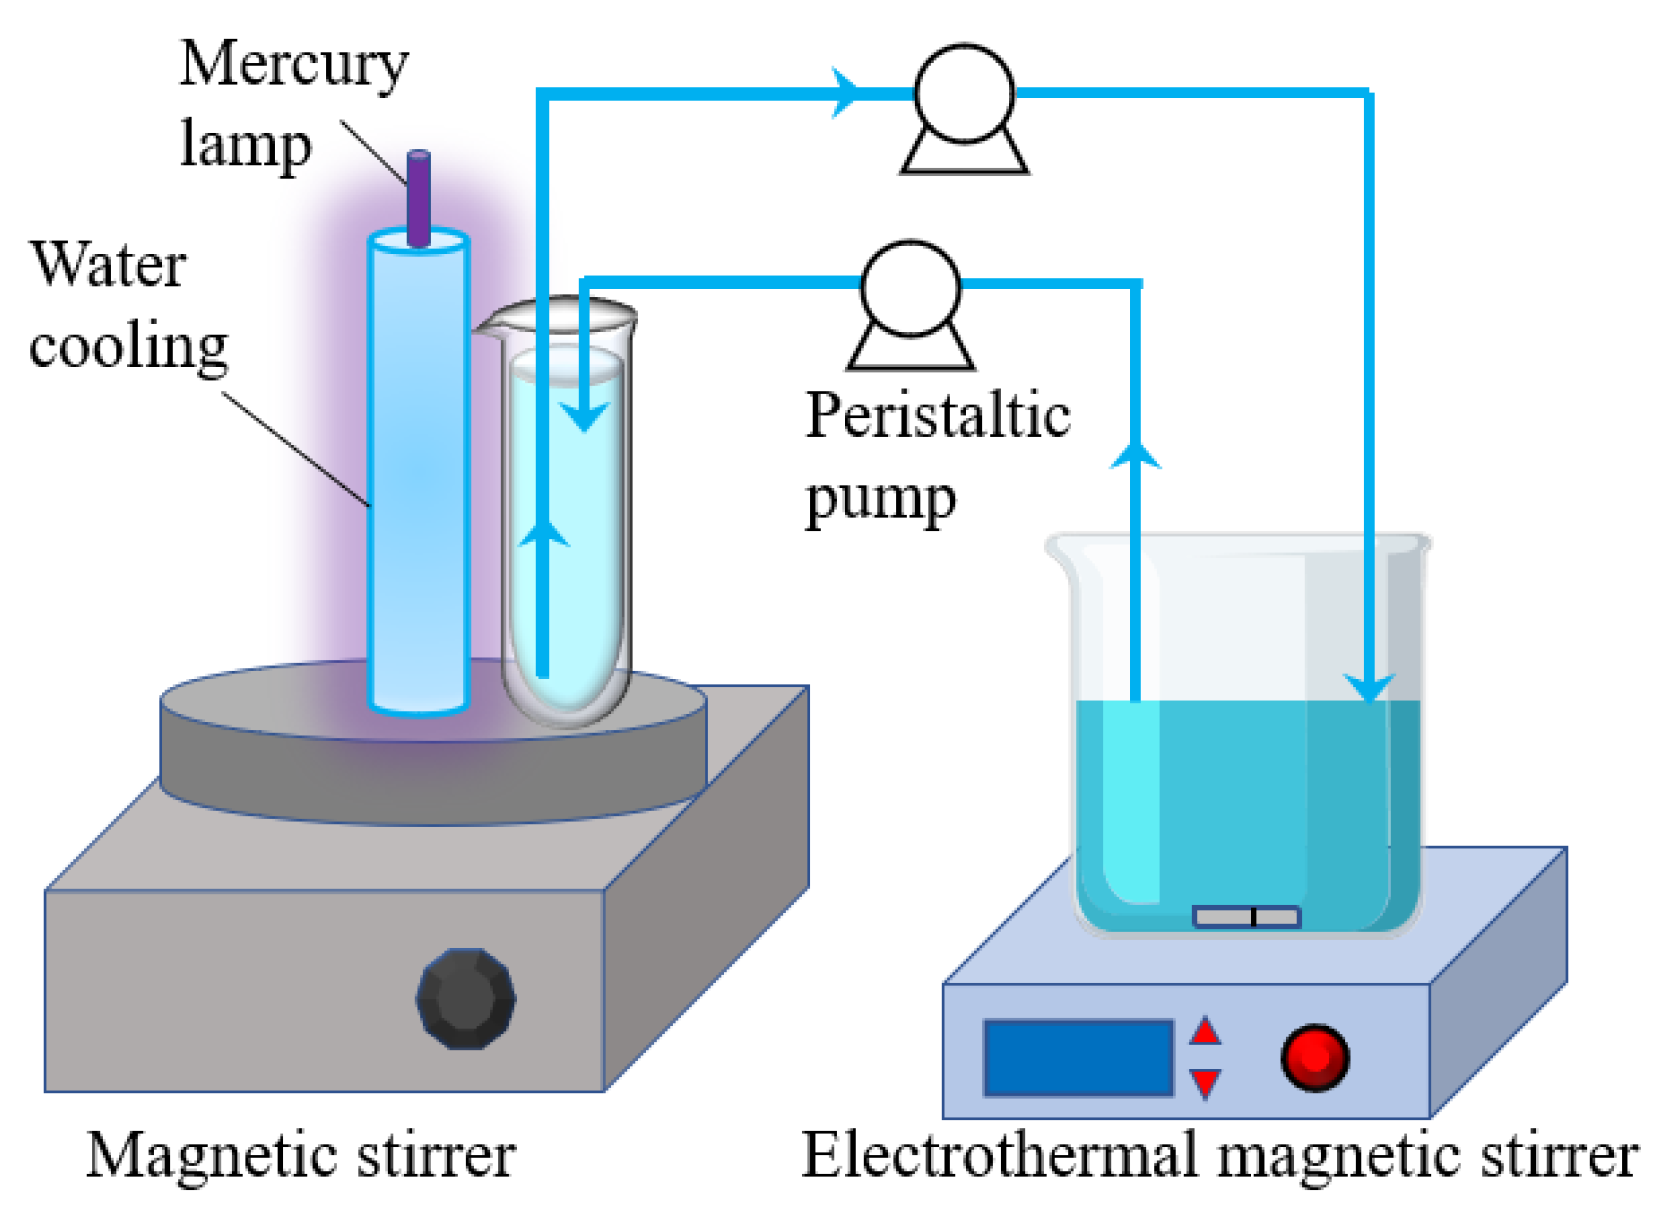
3.3.2. Experimental Flow of Conventional Photocatalytic Reactor
3.4. Analysis Methods
3.4.1. Heat Dissipation Performance of UV-LED
3.4.2. Photocatalytic Degradation Performance
4. Conclusions
- (1)
- Wastewater temperature directly influences the performance of the UV-LED lamp. Hence, a high flow rate (80 mL/min) and a low temperature (20 °C) of sewage helps to ensure the long-term operational stability of LED beads.
- (2)
- The parameters affecting the degradation rate, such as the initial concentration, TiO2 concentration, and pH value, were investigated. Under an initial concentration of AR 26 of 45 mg/L, TiO2 with moderate dosing (0.75 g/L) under strong acid conditions (pH = 2) helped to further improve photocatalytic activity. Under these conditions, the decolorization rate of AR 26 was more than 80%.
- (3)
- For the same volume of treated wastewater, the degradation efficiency and photometric efficiency of the coupled system for AR 26 were 2.1 times and 1.5 times those of the conventional photocatalytic reactor, respectively. The unit power consumption of the coupled system was only 193.90 kW·h, which was 18% that of the conventional photocatalytic reactor.
- (4)
- The novel UV-LED cooling and TiO2 photocatalytic wastewater synergistic system has the advantages of simple structure, easy operation and low energy consumption. It can achieve excellent heat dissipation for high-power UV-LED and high wastewater degradation ability at the same time. It promises to be an alternative solution for treating wastewater treatment.
Author Contributions
Funding
Data Availability Statement
Conflicts of Interest
References
- Dihom, H.R.; Al-Shaibani, M.M.; Mohamed, R.; Al-Gheethi, A.A.; Sharma, A.; Khamidun, M.H.B. Photocatalytic degradation of disperse azo dyes in textile wastewater using green zinc oxide nanoparticles synthesized in plant extract: A critical review. J. Water Process Eng. 2022, 47, 102705. [Google Scholar] [CrossRef]
- Farouq, R.; Ismaeel, E.K.; Monazie, A.M. Optimized Degradation of Eosin Dye Through UV-ZnO NPs Catalyzed Reaction. J. Fluoresc. 2022, 32, 715–722. [Google Scholar] [CrossRef] [PubMed]
- Dos Santos, A.B.; Cervantes, F.J.; Van Lier, J.B. Review paper on current technologies for decolourisation of textile wastewaters: Perspectives for anaerobic biotechnology. Bioresour. Technol. 2007, 98, 2369–2385. [Google Scholar] [CrossRef] [PubMed]
- Cao, C.; Xiao, L.; Chen, C.; Shi, X.; Cao, Q.; Gao, L. In situ preparation of magnetic Fe3O4/chitosan nanoparticles via a novel reduction–precipitation method and their application in adsorption of reactive azo dye. Powder Technol. 2014, 260, 90–97. [Google Scholar] [CrossRef]
- Kaykhaii, M.; Sasani, M.; Marghzari, S. Removal of Dyes from the Environment by Adsorption Process. Chem. Mater. Eng. 2018, 6, 31–35. [Google Scholar] [CrossRef] [Green Version]
- Kumar, P.S.; Joshiba, G.J.; Femina, C.C.; Varshini, P.; Priyadharshini, S.; Karthick, M.A.; Jothirani, R. A critical review on recent developments in the low-cost adsorption of dyes from wastewater. Desalin. Water Treat. 2019, 172, 395–416. [Google Scholar] [CrossRef]
- Pai, S.D.; Kini, M.S.; Selvaraj, R. A review on adsorptive removal of dyes from wastewater by hydroxyapatite nanocomposites. Environ. Sci. Pollut. Res. Int. 2021, 28, 11835–11849. [Google Scholar] [CrossRef]
- Sayilgan, E.; Cakmakci, O. Treatment of textile dyeing wastewater by biomass of Lactobacillus: Lactobacillus 12 and Lactobacillus rhamnosus. Environ. Sci. Pollut. Res. Int. 2013, 20, 1556–1564. [Google Scholar] [CrossRef] [PubMed]
- Souza, F.H.M.; Leme, V.F.C.; Costa, G.O.B.; Castro, K.C.; Giraldi, T.R.; Andrade, G.S.S. Biosorption of Rhodamine B Using a Low-Cost Biosorbent Prepared from Inactivated Aspergillus oryzae Cells: Kinetic, Equilibrium and Thermodynamic Studies. Water Air Soil Pollut. 2020, 231, 1–13. [Google Scholar] [CrossRef]
- Balouchi, H.; Baziar, M.; Dehghan, A.; Alidadi, H.; Shams, M. Combination of electrocoagulation and MOF adsorption systems for EBT removal from water. Int. J. Environ. Anal. Chem. 2022, 102, 1307–1317. [Google Scholar] [CrossRef]
- Li, C.; Zhang, M.; Song, C.; Tao, P.; Sun, M.; Shao, M.; Wang, T. Enhanced Treatment Ability of Membrane Technology by Integrating an Electric Field for Dye Wastewater Treatment: A Review. J. AOAC Int. 2018, 101, 1341–1352. [Google Scholar] [CrossRef] [PubMed]
- Cestarolli, D.T.; de Oliveira, A.D.; Guerra, E.M. Removal of Eriochrome Black textile dye from aqueous solution by combined electrocoagulation-electroflotation methodology. Appl. Water Sci. 2019, 9, 1–5. [Google Scholar] [CrossRef] [Green Version]
- Petrucci, E.; Di Palma, L.; Lavecchia, R.; Zuorro, A. Modeling and optimization of Reactive Green 19 oxidation on a BDD thin-film electrode. J. Taiwan Inst. Chem. Eng. 2015, 51, 152–158. [Google Scholar] [CrossRef]
- Natarajan, S.; Bajaj, H.C.; Tayade, R.J. Recent advances based on the synergetic effect of adsorption for removal of dyes from waste water using photocatalytic process. J. Environ. Sci. 2018, 65, 201–222. [Google Scholar] [CrossRef]
- Sundar, K.P.; Kanmani, S. Studies on the development of a novel UV-LED strip photocatalytic reactor and performance on dye removal. Environ. Prot. Eng. 2021, 47, 31–47. [Google Scholar] [CrossRef]
- Dai, K.; Lu, L.H.; Dawson, G. Development of UV-LED/TiO2 Device and Their Application for Photocatalytic Degradation of Methylene Blue. J. Mater. Eng. Perform. 2013, 22, 1035–1040. [Google Scholar] [CrossRef]
- Song, K.; Mohseni, M.; Taghipour, F. Application of ultraviolet light-emitting diodes (UV-LEDs) for water disinfection: A review. Water Res. 2016, 94, 341–349. [Google Scholar] [CrossRef]
- Yung, K.; Liem, H.; Choy, H.; Cai, Z. Thermal investigation of a high brightness LED array package assembly for various placement algorithms. Appl. Therm. Eng. 2014, 63, 105–118. [Google Scholar] [CrossRef]
- Zhang, P.; Zeng, J.; Chen, X.; Cai, M.; Xiao, J.; Yang, D. An experimental investigation of a 100-W high-power light-emitting diode array using vapor chamber–based plate. Adv. Mech. Eng. 2015, 7, 168781401562007. [Google Scholar] [CrossRef] [Green Version]
- Delendik, K.; Kolyago, N.; Voitik, O. Design and investigation of cooling system for high-power LED luminaire. Comput. Math. Appl. 2021, 83, 84–94. [Google Scholar] [CrossRef]
- Kaya, M. Experimental Study on Active Cooling Systems Used for Thermal Management of High-Power Multichip Light-Emitting Diodes. Sci. World J. 2014, 2014, 563805. [Google Scholar] [CrossRef] [PubMed] [Green Version]
- Kang, X.; Wang, Y.; Huang, Q.; Cui, Y.; Wang, C.; Wen, C.; Fan, J. Phase-change immersion cooling high power light emitting diodes and heat transfer improvement. Microelectron. Reliab. 2017, 79, 257–264. [Google Scholar] [CrossRef]
- Chen, Y.; Hou, T.; Pan, M. Comparative Analysis Between Water-Cooled and Air-Cooled Heat Dissipation in a High-Power Light-Emitting Diode Chipset. J Therm. Sci. Eng. Appl. 2019, 11, 061002. [Google Scholar] [CrossRef]
- Gatapova, E.Y.; Sahu, G.; Khandekar, S.; Hu, R. Thermal management of high-power LED module with single-phase liquid jet array. Appl. Therm. Eng. 2021, 184, 116270. [Google Scholar] [CrossRef]
- Sahu, G.; Khandekar, S.; Muralidhar, K. Thermal characterization of spray impingement heat transfer over a High-Power LED module. Therm. Sci. Eng. Prog. 2022, 32, 101332. [Google Scholar] [CrossRef]
- Seo, J.-H.; Lee, M.-Y. Illuminance and heat transfer characteristics of high power LED cooling system with heat sink filled with ferrofluid. Appl. Therm. Eng. 2018, 143, 438–449. [Google Scholar] [CrossRef]
- Wang, C.; Bai, H.; Yi, N.; Kang, X. Multi-dimensional optimization for a novel photocatalytic reactor incorporating the decolorization of azo dye and thermal management of ultraviolet light-emitting diode arrays. Energy Convers. Manag.-X 2023, 17, 100344. [Google Scholar] [CrossRef]
- Sheidaei, B.; Behnajady, M.A. Efficiency of a Photoreactor Packed with Immobilized Titanium Dioxide Nanoparticles in the Removal of Acid Orange 7. Water Environ. Res. 2016, 88, 449–457. [Google Scholar] [CrossRef]
- Xie, Q. LED Packaging and Reliability Research. Master’s Thesis, University of Electronic Science and Technology of China, Chengdu, China, 2012. [Google Scholar]
- Malato, S.; Fernandez-Ibanez, P.; Maldonado, M.I.; Blanco, J.; Gernjak, W. Decontamination and disinfection of water by solar photocatalysis: Recent overview and trends. Catal. Today 2009, 147, 1–59. [Google Scholar] [CrossRef]
- Gaya, U.I.; Abdullah, A.H. Heterogeneous photocatalytic degradation of organic contaminants over titanium dioxide: A review of fundamentals, progress and problems. J. Photochem. Photobiol. C 2008, 9, 1–12. [Google Scholar] [CrossRef]
- Zuorro, A.; Lavecchia, R.; González-Delgado, Á.D.; García-Martinez, J.B.; L’Abbate, P. Optimization of Enzyme-Assisted Extraction of Flavonoids from Corn Husks. Processes 2019, 7, 804. [Google Scholar] [CrossRef] [Green Version]
- Okcu, G.D.; Tunacan, T.; Dikmen, E. Photocatalytic degradation of yellow 2G dye using titanium dioxide/ultraviolet A light through a Box-Behnken experimental design: Optimization and kinetic study. J. Environ. Sci. Health A 2019, 54, 136–145. [Google Scholar] [CrossRef] [PubMed]
- Rani, C.N.; Karthikeyan, S. Feasibility study of acenaphthene degradation in a novel slurry UV photocatalytic membrane reactor: Effect of operating parameters and optimization using response surface modeling. Chem. Eng. Process. 2020, 155, 108051. [Google Scholar] [CrossRef]
- Sun, J.; Qiao, L.; Sun, S.; Wang, G. Photocatalytic degradation of Orange G on nitrogen-doped TiO2 catalysts under visible light and sunlight irradiation. J. Hazard. Mater. 2008, 155, 312–319. [Google Scholar] [CrossRef]
- Neppolian, B.; Choi, H.C.; Sakthivel, S.; Arabindoo, B.; Murugesan, V. Solar light induced and TiO2 assisted degradation of textile dye reactive blue 4. Chemosphere 2002, 46, 1173–1181. [Google Scholar] [CrossRef] [PubMed]
- So, C.M.; Cheng, M.Y.; Yu, J.C.; Wong, P. Degradation of azo dye Procion Red MX-5B by photocatalytic oxidation. Chemosphere 2002, 46, 905–912. [Google Scholar] [CrossRef]
- Kosmulski, M. pH-dependent surface charging and points of zero charge. III. Update. J. Colloid Interface Sci. 2006, 298, 730–741. [Google Scholar] [CrossRef]
- Tunesi, S.; Anderson, M. Influence of chemisorption on the photodecomposition of salicylic acid and related compounds using suspended titania ceramic membranes. J. Phys. Chem. 1991, 95, 3399–3405. [Google Scholar] [CrossRef]
- Ennouri, R.; Lavecchia, R.; Zuorro, A.; Elaoud, S.C.; Petrucci, E. Degradation of chloramphenicol in water by oxidation on a boron-doped diamond electrode under UV irradiation. J. Water Process Eng. 2021, 41, 101995. [Google Scholar] [CrossRef]
- Quan, X.; Yang, L.; Cheng, Z.; Jiang, L.; Xu, Y. Degradation and nitrogen removal of azo dye in gas-liquid-solid circulating slurry photocatalytic reactor. CIESC J. 2010, 61, 2829–2835. [Google Scholar]
- Kim, L.; Choi, J.H.; Jang, S.H.; Shin, M.W. Thermal analysis of LED array system with heat pipe. Thermochim. Acta 2007, 455, 21–25. [Google Scholar] [CrossRef]
- Lin, H.W.; Zhang, K.; Yang, G.; Li, Y.; Liu, X.; Chang, K.; Ye, J. Ultrafine nano 1T-MoS2 monolayers with NiOx as dual co-catalysts over TiO2 photoharvester for efficient photocatalytic hydrogen evolution. Appl. Catal. B-Environ. 2020, 279, 119387. [Google Scholar] [CrossRef]


| Cooling Water Flow Rate (mL/min) | The Temperature at t1 (°C) | The Temperature at t2 (°C) | The Temperature at t3 (°C) | The Temperature at t4 (°C) | Average Temperature (°C) |
|---|---|---|---|---|---|
| 20 | 36.8 | 42.3 | 39.3 | 31.6 | 37.5 |
| 40 | 35.7 | 41.1 | 38.7 | 30.6 | 36.4 |
| 60 | 35.3 | 40.6 | 37.7 | 30.3 | 36.0 |
| 80 | 34.5 | 40.2 | 36.1 | 29.9 | 35.2 |
Disclaimer/Publisher’s Note: The statements, opinions and data contained in all publications are solely those of the individual author(s) and contributor(s) and not of MDPI and/or the editor(s). MDPI and/or the editor(s) disclaim responsibility for any injury to people or property resulting from any ideas, methods, instructions or products referred to in the content. |
© 2023 by the authors. Licensee MDPI, Basel, Switzerland. This article is an open access article distributed under the terms and conditions of the Creative Commons Attribution (CC BY) license (https://creativecommons.org/licenses/by/4.0/).
Share and Cite
Wang, C.; Bai, H.; Kang, X. Optimization Study on Synergistic System of Photocatalytic Degradation of AR 26 and UV-LED Heat Dissipation. Catalysts 2023, 13, 669. https://doi.org/10.3390/catal13040669
Wang C, Bai H, Kang X. Optimization Study on Synergistic System of Photocatalytic Degradation of AR 26 and UV-LED Heat Dissipation. Catalysts. 2023; 13(4):669. https://doi.org/10.3390/catal13040669
Chicago/Turabian StyleWang, Chen, Haoliang Bai, and Xue Kang. 2023. "Optimization Study on Synergistic System of Photocatalytic Degradation of AR 26 and UV-LED Heat Dissipation" Catalysts 13, no. 4: 669. https://doi.org/10.3390/catal13040669