
Effect of MnO2 Crystal Type on the Oxidation of Furfural to Furoic Acid

1
State Key Laboratory of Coal Conversion, Institute of Coal Chemistry, Chinese Academy of Sciences, Taiyuan 030001, China
2
University of Chinese Academy of Sciences, Beijing 100049, China
3
Dalian National Laboratory for Clean Energy, Chinese Academy of Sciences, Dalian 116023, China
*
Authors to whom correspondence should be addressed.
Catalysts 2023, 13(4), 663; https://doi.org/10.3390/catal13040663
Submission received: 27 February 2023
/
Revised: 21 March 2023
/
Accepted: 24 March 2023
/
Published: 28 March 2023
(This article belongs to the Special Issue Recent Trends in Catalysis for Syngas Production and Conversion)
Abstract
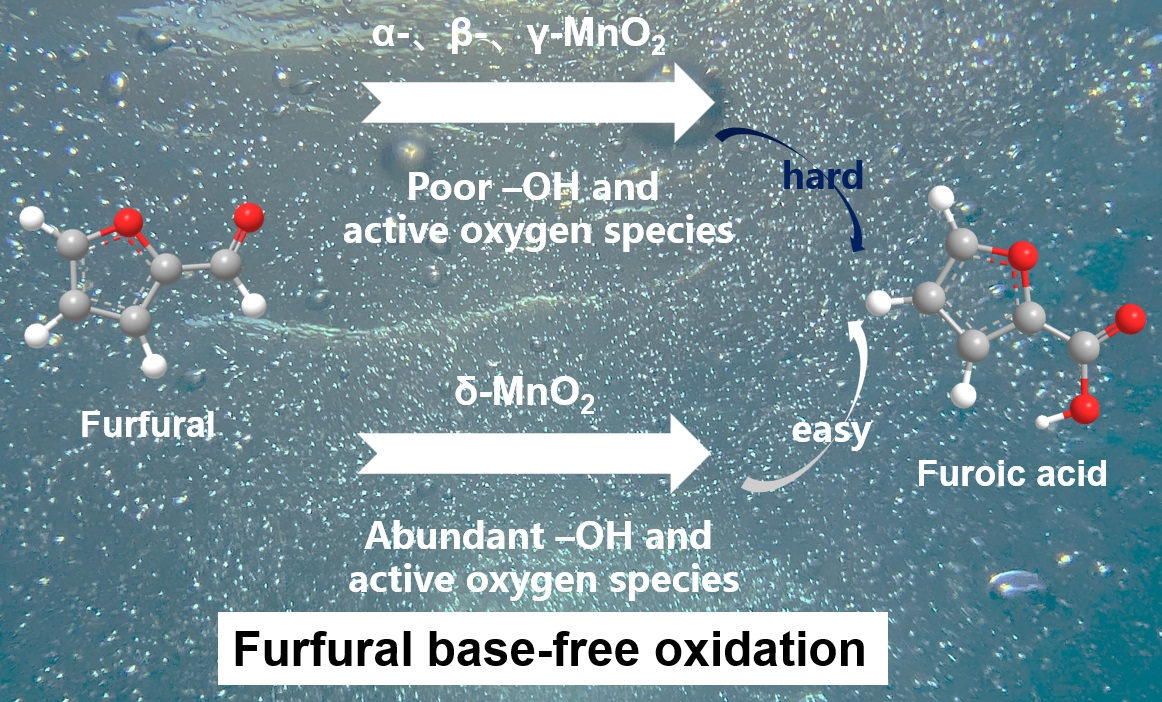
:The base-free oxidation of furfural by non-noble metal systems has been challenging. Although MnO2 emerges as a potential catalyst application in base-free conditions, its catalytic efficiency still needs to be improved. The crystalline form of MnO2 is an important factor affecting the oxidation ability of furfural. For this reason, four crystalline forms of MnO2 (α, β, γ, and δ-MnO2) were selected. Their oxidation performance and surface functional groups were analyzed and compared in detail. Only δ-MnO2 exhibited excellent activity, achieving 99.04% furfural conversion and 100% Propo.FA (Only furoic acid was detected by HPLC in the product) under base-free conditions, while the furfural conversion of α, β, and γ-MnO2 was below 10%. Characterization by XPS, IR, O2-TPD and other means revealed that δ-MnO2 has the most abundant active oxygen species and surface hydroxyl groups, which are responsible for the best performance of δ-MnO2. This work achieves the green and efficient oxidation of furfural to furoic acid over non-noble metal catalysts.

1. Introduction
With the decrease in global fossil resources, the production of biochemical products from biomass feedstock, such as agricultural waste and forestry waste, is important for sustainable development and CO2 emission reduction. Furthermore, as a value-added biochemical derived from lignin, furoic acid is widely used in the pharmaceutical, agrochemical, and fragrance industries. Most importantly, furoic acid can be used to synthesize 2,5-Furandicarboxylicacid (FDCA), which is a key monomer for the synthesis of polyethylene furanoate (PEF), a substitute for polyethylene terephthalate (PET) [1,2,3].
Currently, there are three main methods for preparing furoic acid: the Cannizaro method, the base-free esterification method [4,5,6] and the catalytic oxidation method. Cannizaro method needs to consume a lot of bases, and the maximum yield is only 50%. The base-free esterification method consumes a lot of organic solvents, and the steps are tedious. Compared with the above two methods, the direct catalytic oxidation method is a green process that can oxidize furfural to furfural acid in one step. Two types of catalysts, including noble metal and non-noble metal, have been applied in this technique. The noble metal catalysts mainly focused on Au-based [7,8,9,10,11] and Pt-based and Pd-based systems [12,13,14]. These catalytic systems can efficiently convert furfural under low or base-free conditions, but the use of noble metals makes the catalysts too expensive. Non-noble metal catalysis mainly includes copper oxide [15], cobalt [16], etc., as active components. This catalytic system needs to be carried out under high alkali conditions. In addition, a large amount of acid neutralization is required for product separation, which is not environmentally friendly. Consequently, the creation of non-noble and base-free furfural oxidation catalysts remains the research focus.
As a potential oxidation catalyst, MnO2 can activate oxygen to produce abundant active oxygen species at low temperatures [17,18], which can activate the aldehyde group to the carboxyl group occur at low temperatures. Thus, MnO2 is widely used in aldehyde reactions, such as the oxidation of formaldehyde [19,20,21] and the oxidation of 5-hydroxymethyl-furfural [22,23]. For example, in furfural oxidation, it is reported by Camila Palombo [24] et al. found that MnO2 exhibited 55% furfural conversion and 25% furoic acid selectivity in base-free conditions, indicating that the non-noble metal MnO2 has potential application in furfural oxidation. However, the furoic acid yield is much lower than that in a strongly alkaline environment [15,16].
The inherent properties such as morphology, crystalline surface, and crystalline shape of MnO2 strongly influence catalytic performance [23,25,26,27], in which crystalline shape plays a crucial role in the oxidation properties. For example, Xiao et al. [28] found that product selectivity in the ammonization of alcohols reaction varies significantly on different crystals of MnO2. For further study, they found that the hydroxyl group on MnO2 plays an essential role in the activation of nitrile, and hydroxyl-rich MnO2 has higher amide selectivity. Furthermore, Hayashi et al. [23] found that the oxidation activity of 5-hydroxymethylfurfural varies greatly on different crystalline forms of MnO2. They found that the vacancy formation energies in different crystalline forms of MnO2 are different, and low vacancy formation energies can promote the activation of oxygen.
In summary, the oxygen vacancy formation energy and surface groups vary greatly on different types of MnO2, resulting in different abilities for producing reactive oxygen species and activating reactants, which can significantly affect the catalyst activity and product selectivity. In the furfural oxidation reaction, the activation of furfural and oxygen are both essential for furfural conversion [1,12,29]. Thus, it inspired that the furfural conversion and furoic acid yield might be significantly enhanced by adjusting the crystalline shape of MnO2 in base-free conditions.
Based on the above analysis, four MnO2 with different crystalline structures were synthesized in the present study. The obtained MnO2 was characterized by XRD, IR, XPS, O2-TPD and other techniques. Furthermore, the catalytic activity was evaluated in the oxidation of furfural to furoic acid. And the factors affecting the catalytic performance over different MnO2 are discussed.
2. Results
2.1. Furfural Oxidation Properties of Different Crystalline MnO2
The catalytic performance of different MnO2 in the furfural oxidation to furoic acid is shown in Table 1. In the reaction temperature range of 60–120 °C, the furoic acid selectivity of all four crystalline MnO2 types was close to 100%, but δ-MnO2 shows much higher furfural conversion than α-, β-, and γ-MnO2. For example, the furfural conversion on α-, β-, and γ-MnO2 does not exceed 10% at 120° (Entry 4, Entry 8, Entry 12). While δ-MnO2 shows significantly higher furfural conversions, which can reach more than 69.68% at 120 °C (Entry 16).
Further, the reaction conditions were optimized for the δ-MnO2 catalyst, and the results are shown in Table 1. When only the reaction time was varied, the conversion kept increasing with the increase of reaction time (Entry 15, Entry 17–Entry 20). However, the carbon balance decreased sharply when the reaction time reached 24 h, which may be related to the increased reaction time to generate the polymeric compounds (Entry 20) [14,24]. When only the catalyst dosage was changed, the furfural conversion increased continuously with the increase of catalyst amount, but the carbon balance data decreased slightly (Entry 21–Entry 23).
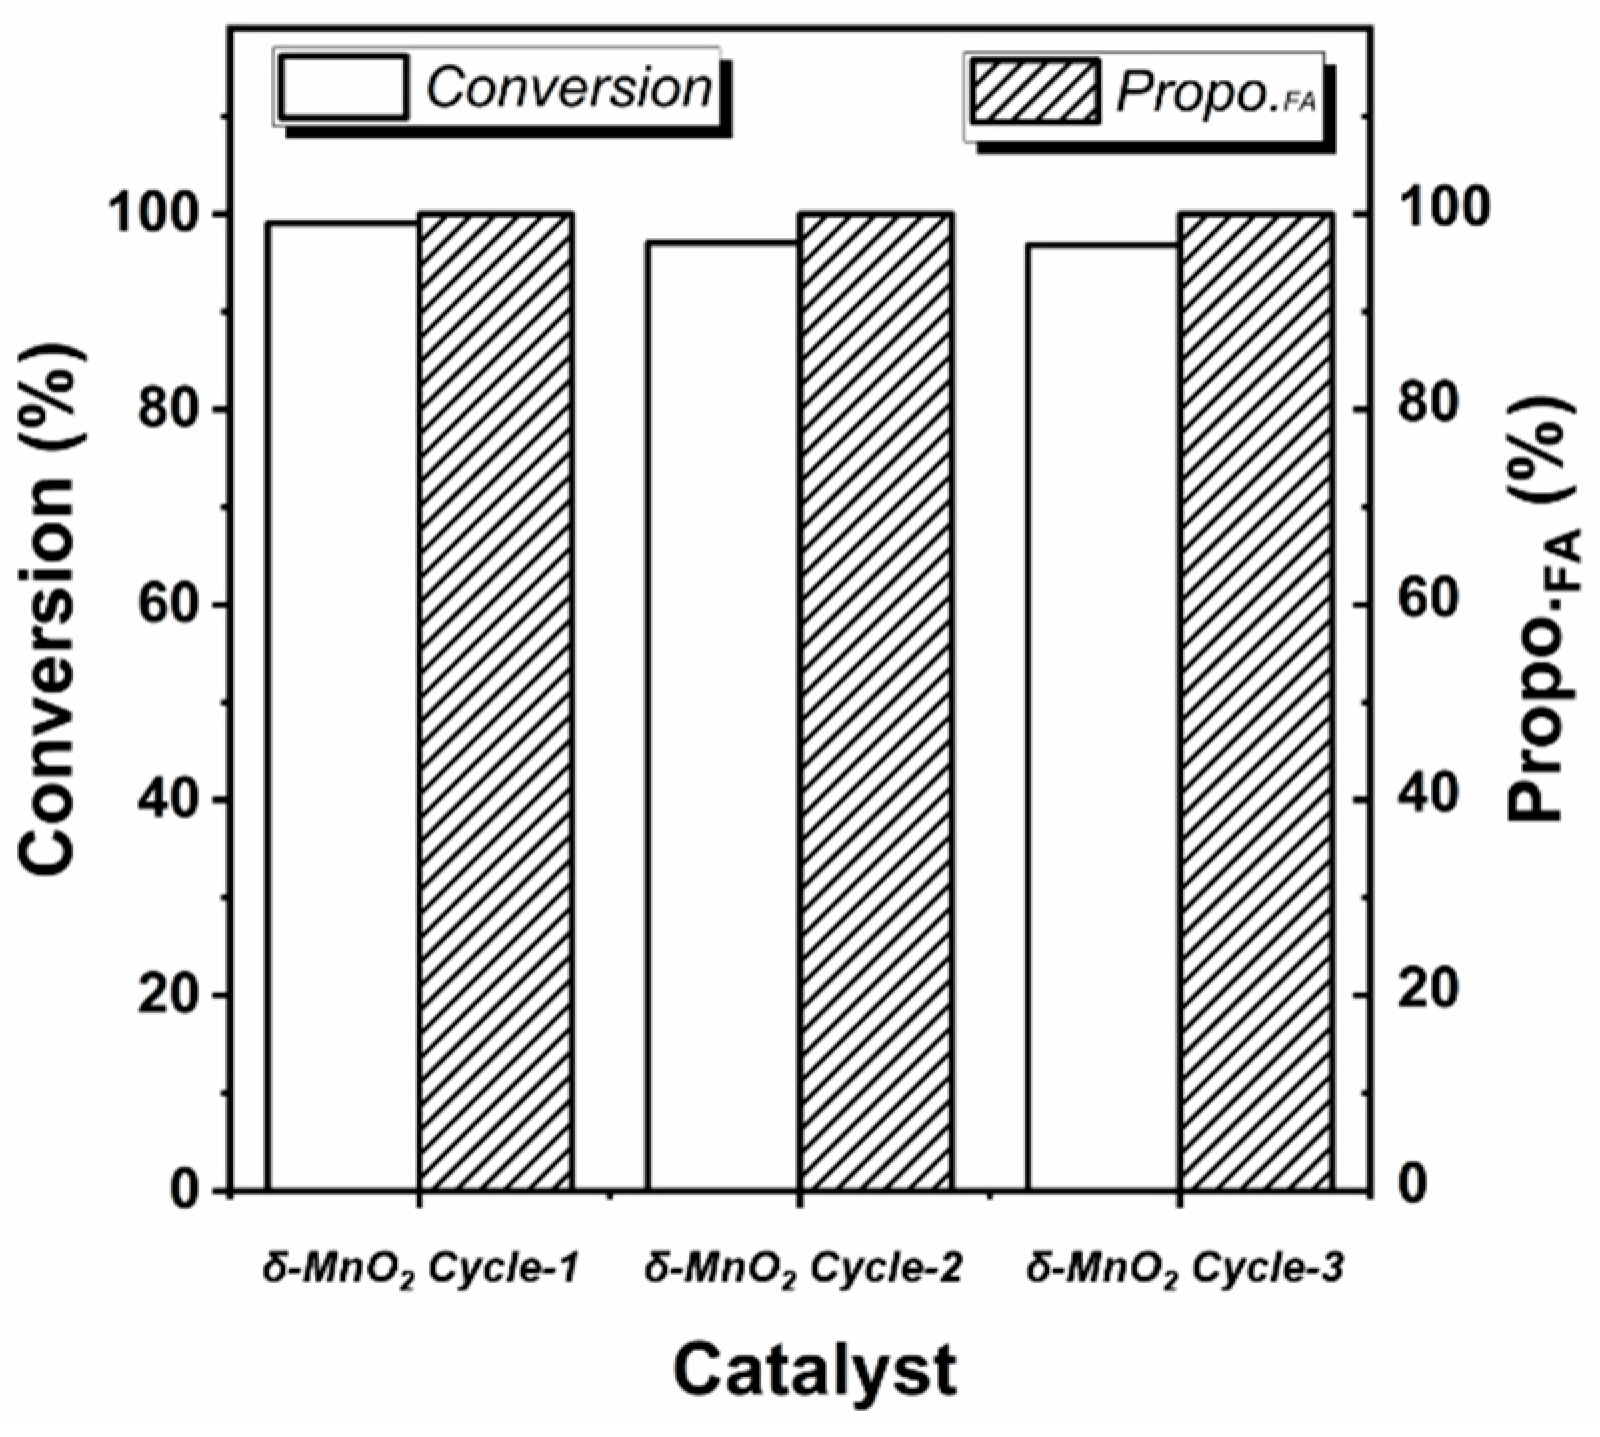
Under the optimized reaction conditions, the conversion of furfural on δ-MnO2 can even reach 99.04% without by-products (Entry 23). And this data is much higher than the reported 55% conversion and 25% selectivity on MnO2 [24]. The stability of the δ-MnO2 in the reaction was further investigated. After three cycles, the δ-MnO2 still maintains a high furoic acid yield of 96.80%, showing great potential for application (see Figure 1).
2.2. Structural Properties of Different Crystalline MnO2
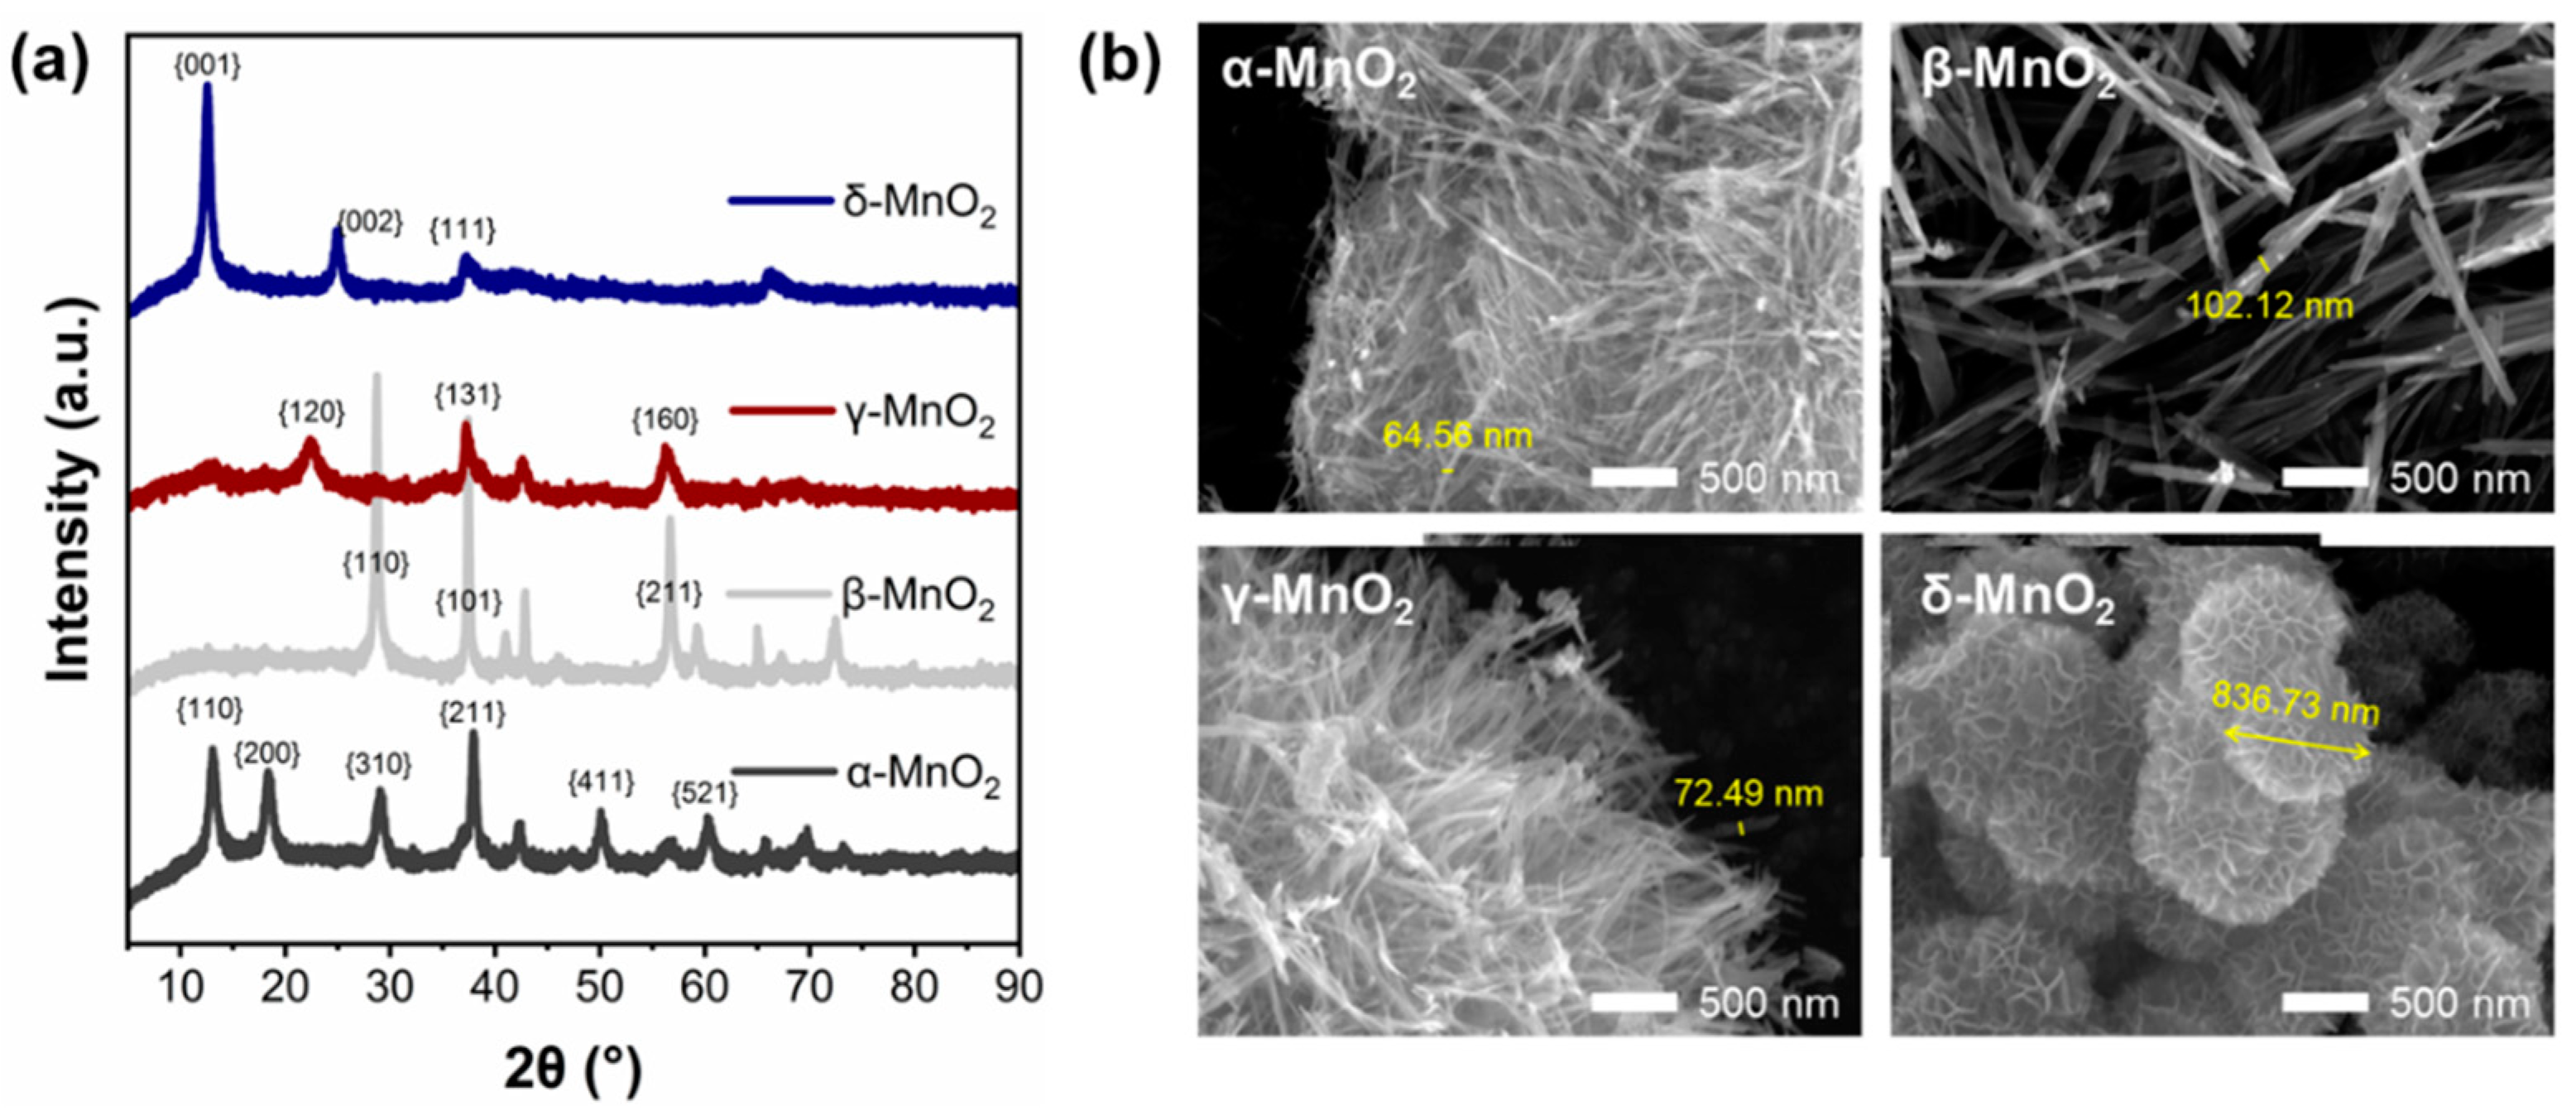
To further explore the reasons for the excellent performance of δ-MnO2, the physical and chemical properties of the four MnO2 were characterized. The XRD spectrum of MnO2 with different crystalline structures is shown in Figure 2a. A check of the XRD standard PDF cards shows that the spectrum corresponds well with the standard α-type (JCPDS 44-0141), β-type (JCPDS 24-0735), γ-type (JCPDS 14-0644), and δ-type (JCPDS 80-1098) MnO2 cards (see Table S2), indicating the successful synthesis of four crystalline types of MnO2. PDF cards and previous studies have shown that α-MnO2 of Hollandite-type exhibits a one-dimensional (1 × 1) tunneling structure, β-MnO2 of pyrolusite-type exhibits a one-dimensional (2 × 2) tunneling structure, γ-MnO2 of Nsutite-type exhibits a one-dimensional (1 × 1) tunneling structure, and δ-MnO2 of Birnessite-type exhibits a two-dimensional lamellar structure. And these structural differences can be seen clearly in SEM images (Figure 2b). The α-MnO2, β-MnO2, and γ-MnO2 are assembled by fibers, while δ-MnO2 is assembled by sheets. All of which are composed of six-coordinated [MnO6] basic units [23,30].
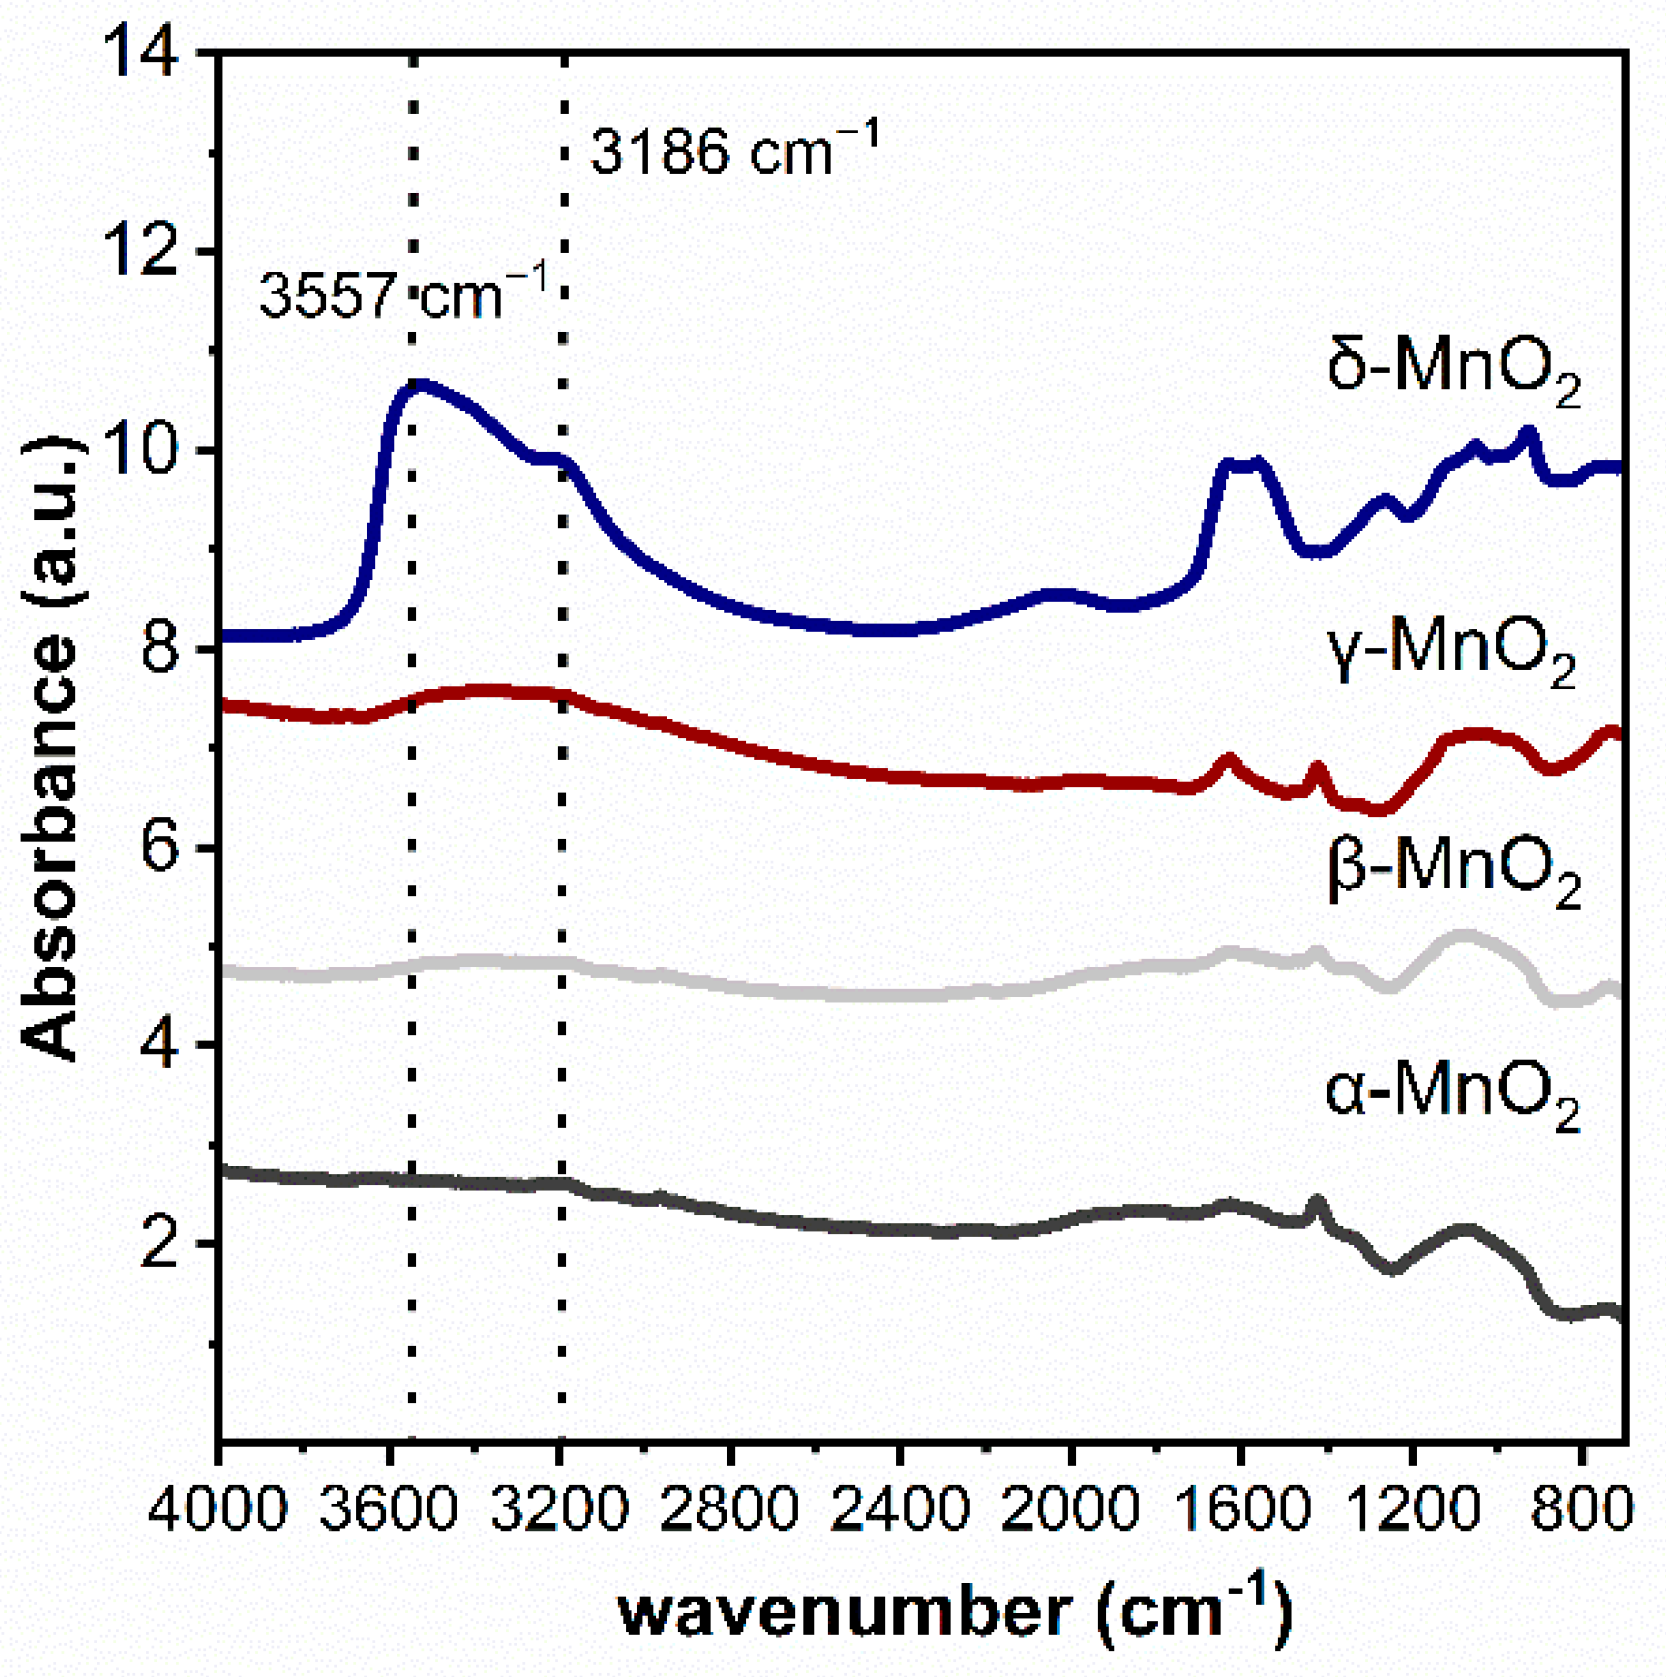
The functional groups on MnO2 with different crystalline structures were characterized by the infrared technique (see Figure 3). As can be seen, three peaks at 3186 cm−1 and 3557 cm−1 attributed to hydroxyl groups can be found on δ-MnO2 [31,32,33]. While these peaks are very weak on α-MnO2, β-MnO2 and γ-MnO2. These phenomena indicated that the δ-MnO2 has significantly more structural hydroxyl groups than the other three MnO2.
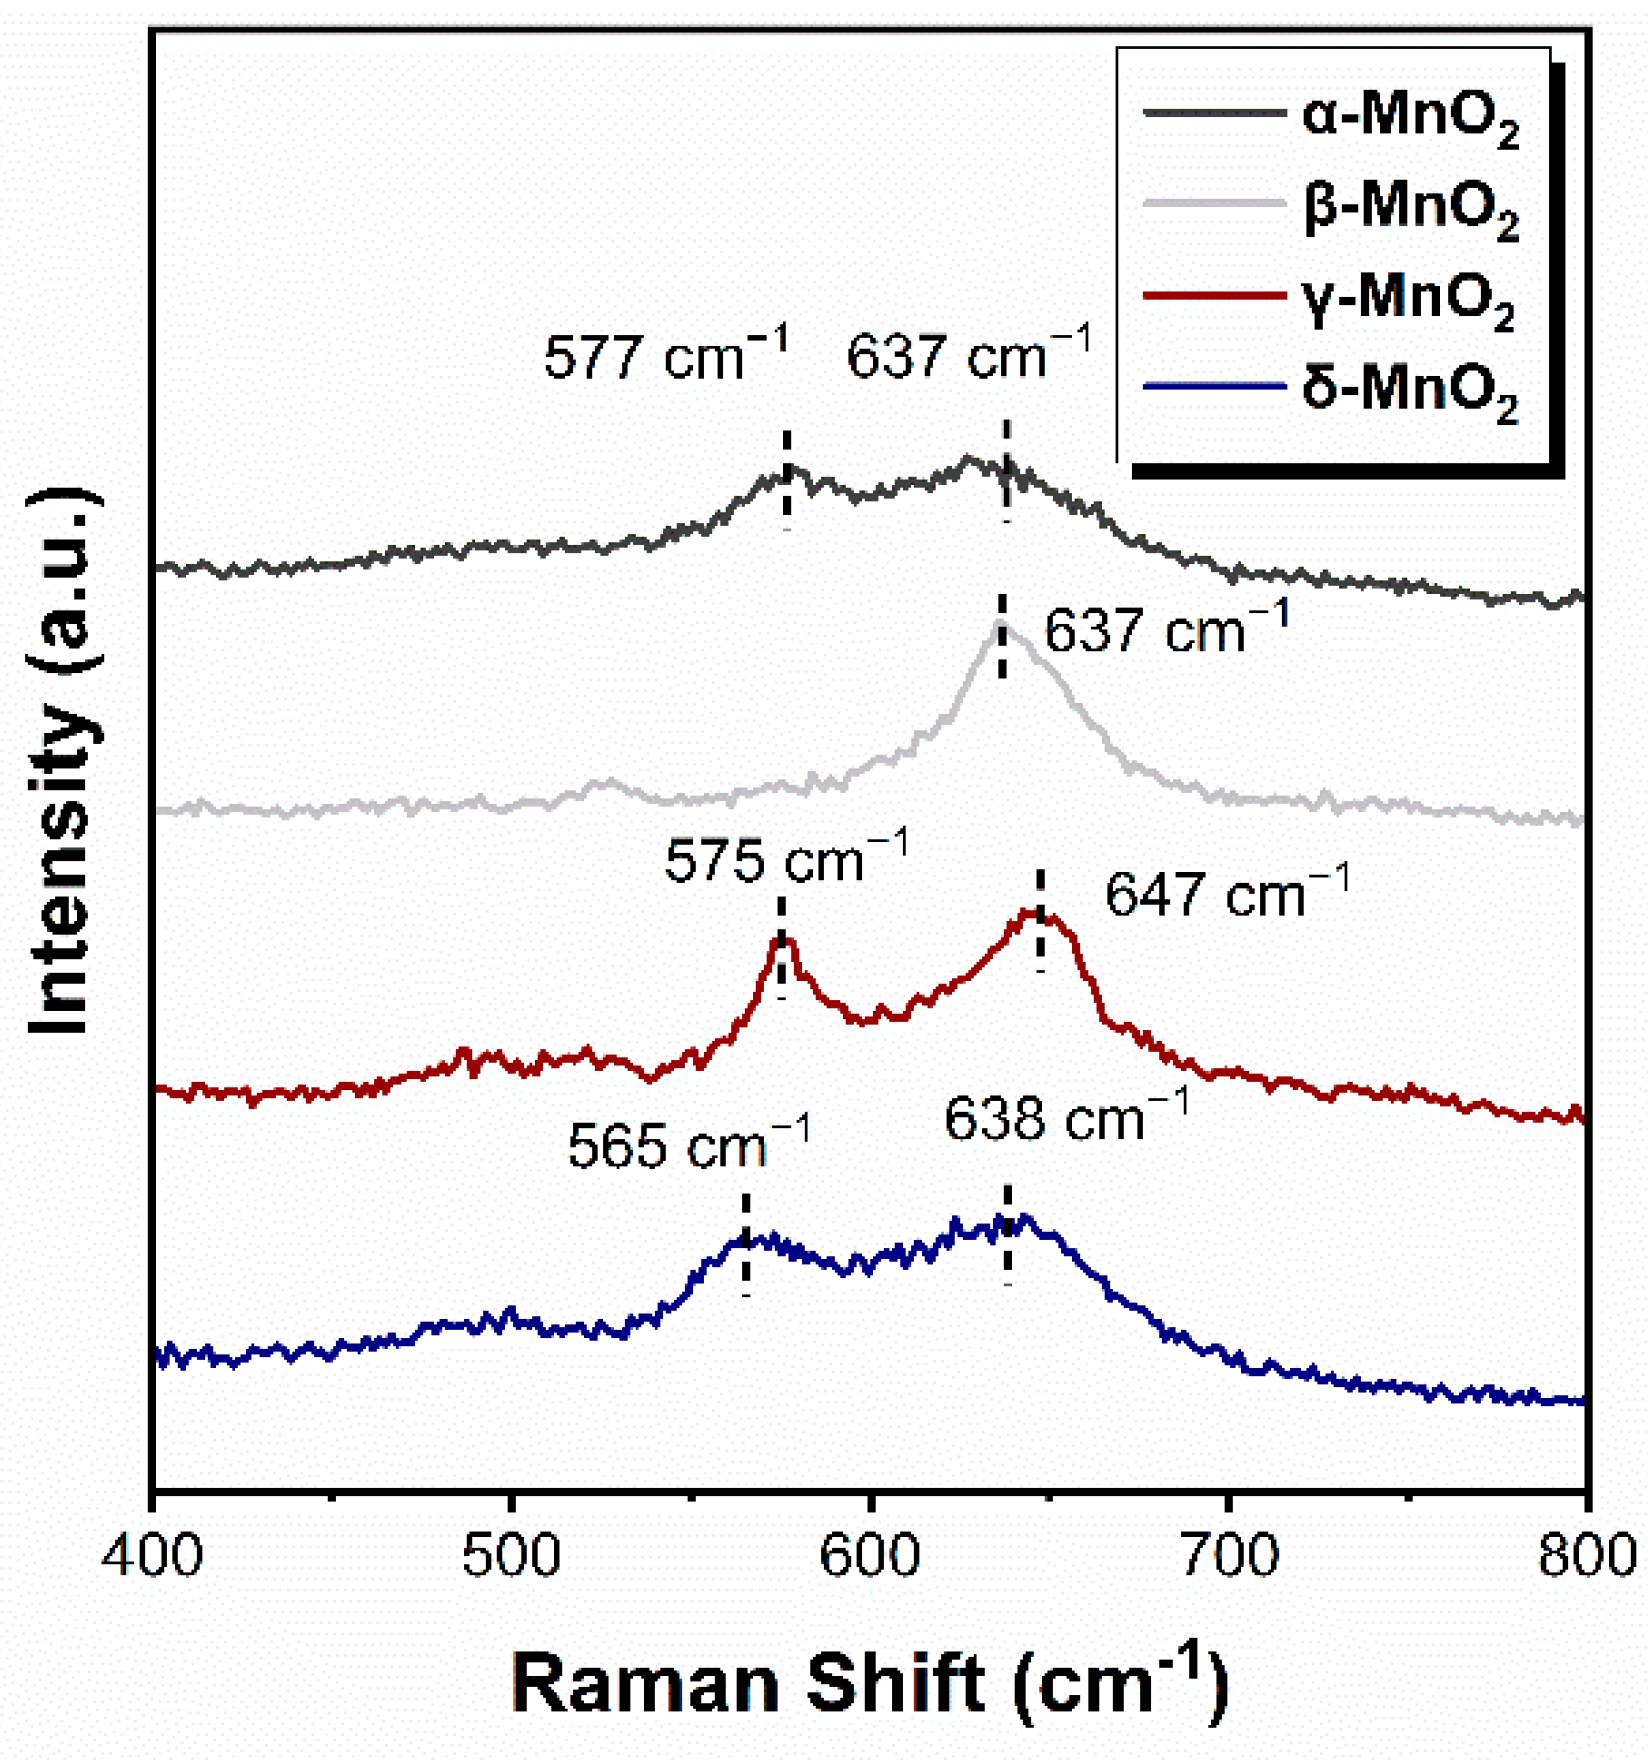
The strength of the Mn-O bond of α-MnO2, β-MnO2, γ-MnO2 and δ-MnO2 was characterized by Raman spectroscopy, and the results are shown in Figure 4. The Raman vibration peaks in 565–580 cm−1 and 635–650 cm−1 are attributed to the Mn-O bond in the [MnO6] octahedron [22,34,35]. As can be seen, the vibrational peaks appear near 575 cm−1 on α-, β- and γ-MnO2, which shifts to 565 cm−1 on δ-MnO2. From Hooke’s law (1), it follows that:
The mechanical constant k of the Mn-O bond is positively correlated with the Raman shift ω. Therefore, the Mn-O bond is weaker as the corresponding peak shift to a low wavenumber [25]. Thus, the above results indicated that the Mn-O bond in δ-MnO2 is weaker than those in α-, β- and γ-MnO2, which leads to the easier breakthrough of the Mn-O bond and might produce more active oxygen species.
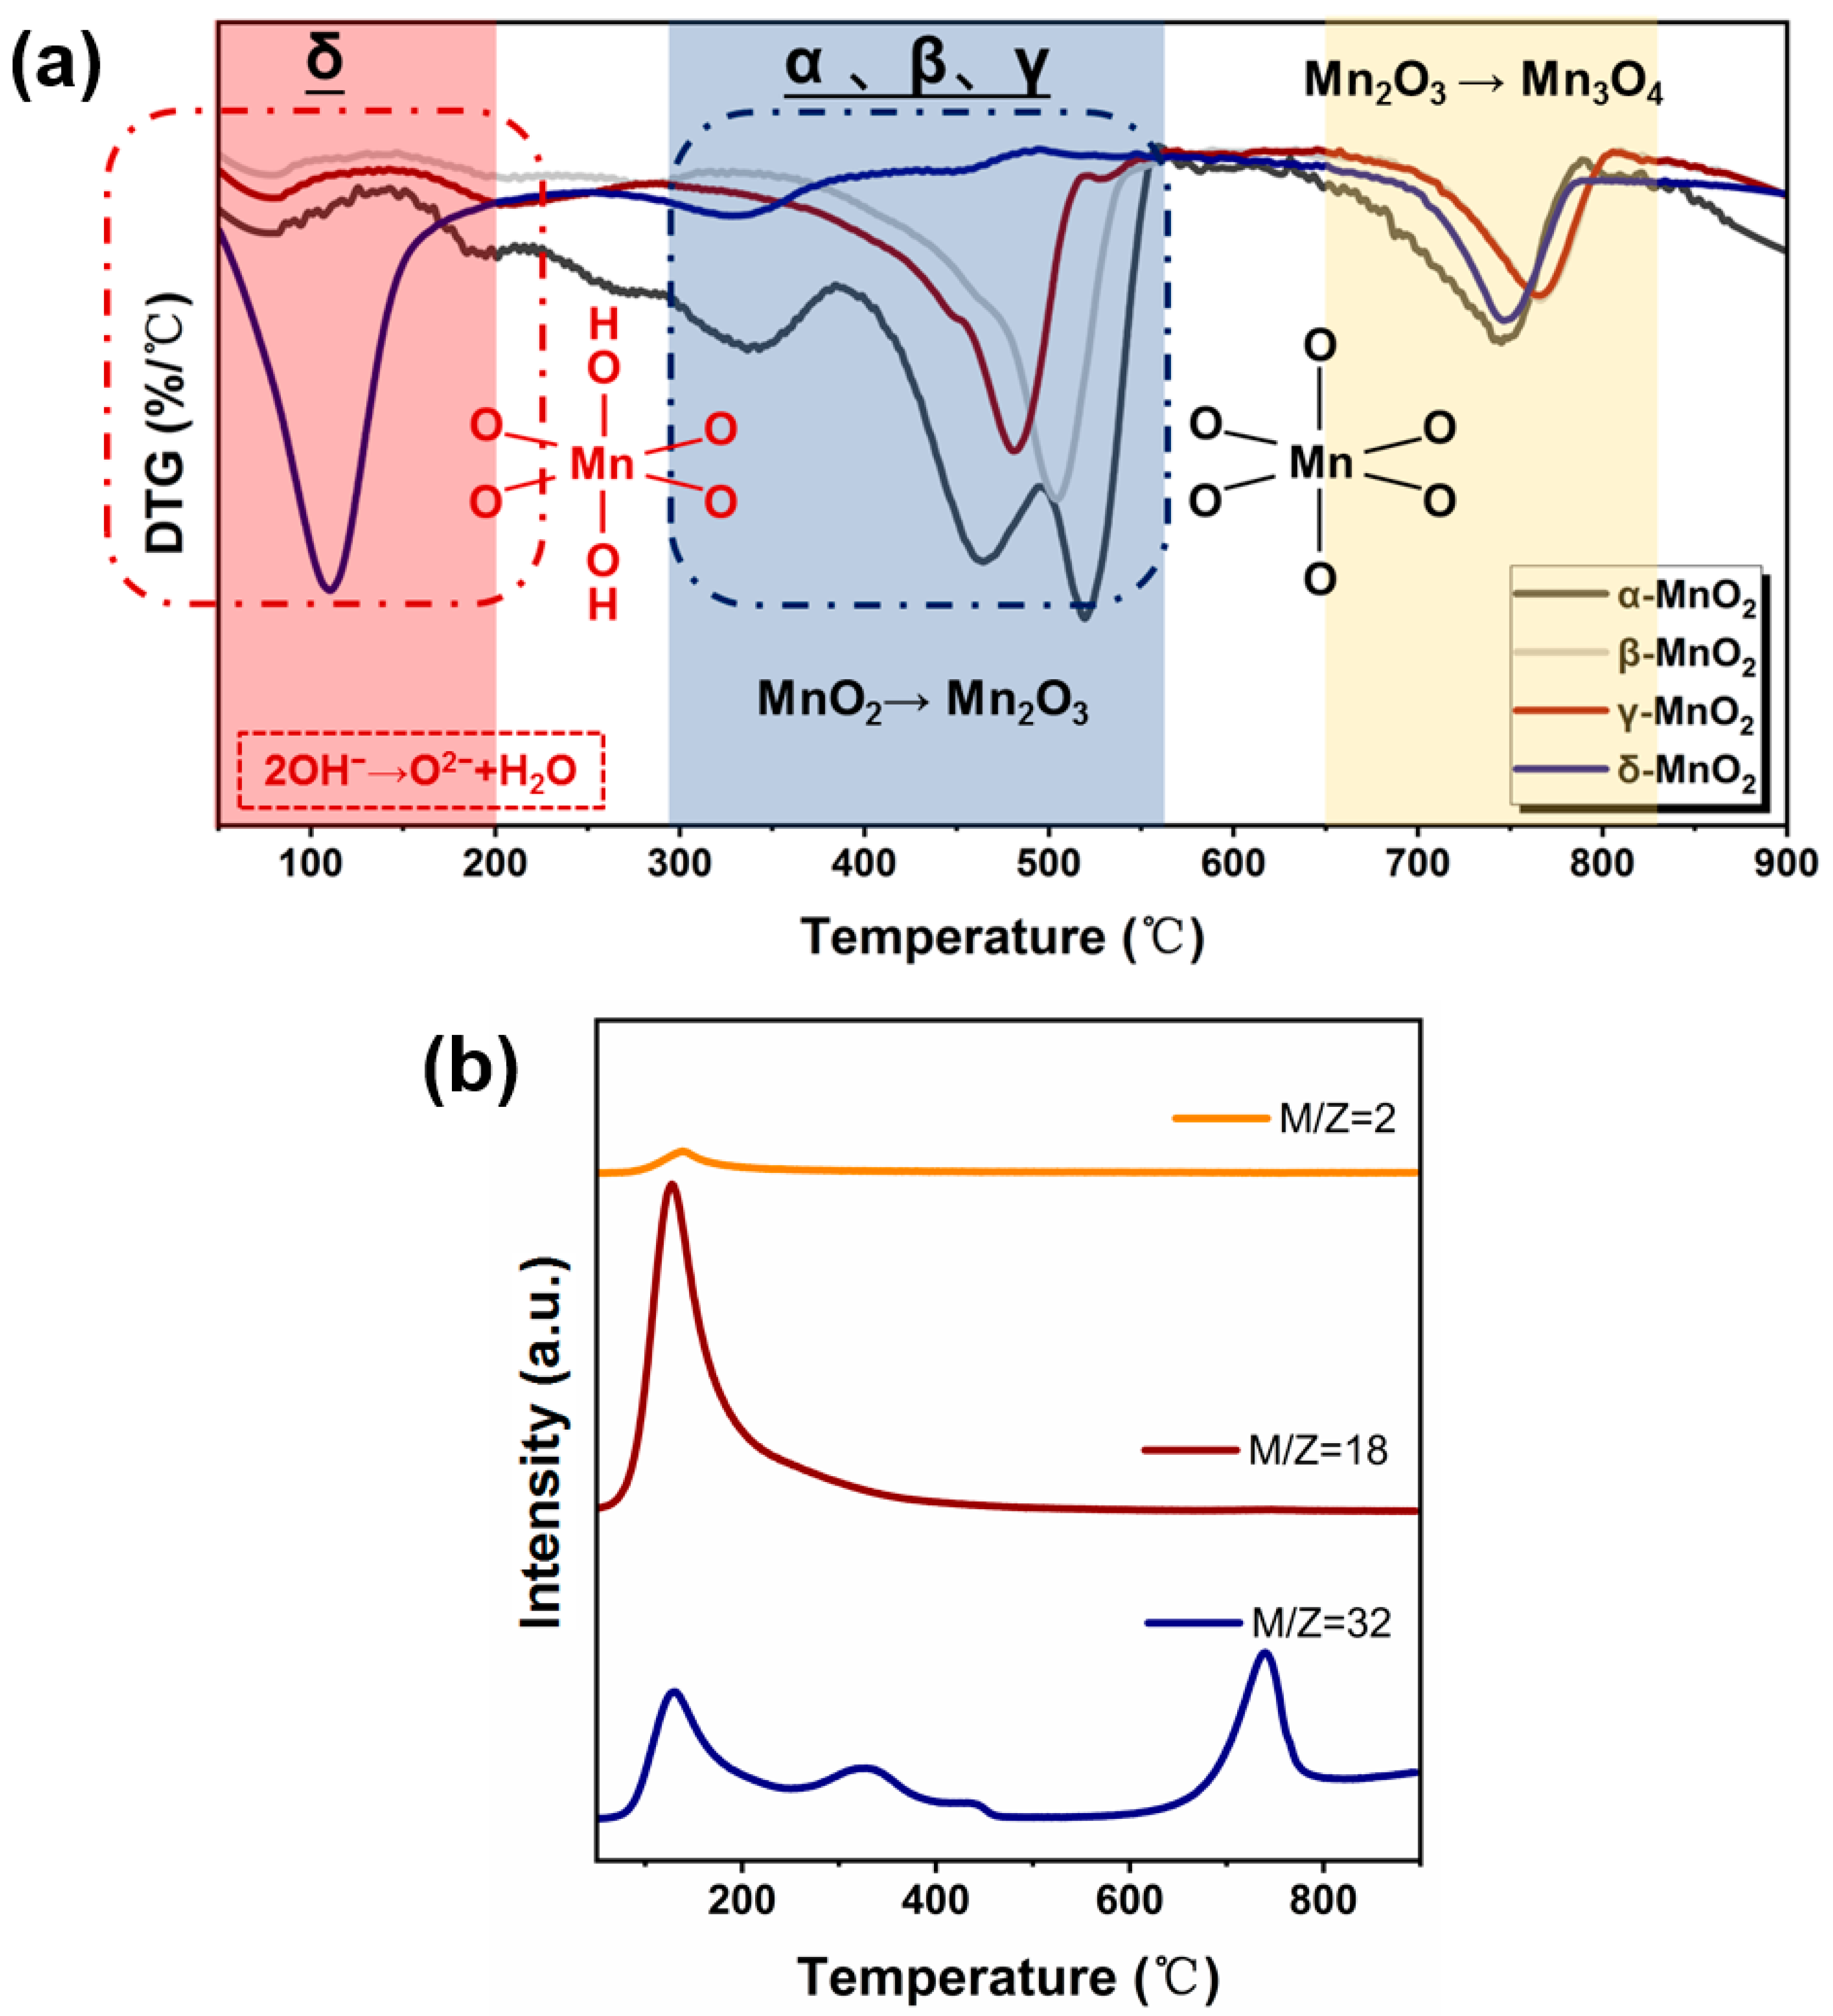
To further characterize the structural stability of MnO2 with different crystalline forms, thermogravimetry characterization was carried out (see Figure 5a). For α-, β-, and γ-MnO2, two weight loss peaks at 300–550 °C and 650–800 °C appeared, which correspond to the transformation of MnO2 to Mn2O3 and Mn2O3 to Mn3O4, respectively [35]. While for δ-MnO2, two weight loss peaks appeared at 50–200 °C and 650–800 °C, respectively. To gain further insight into the cause of the weight loss observed at 50–200 °C, a TG-MS analysis was conducted on δ-MnO2 (see Figure 5b). As can be seen, a large amount of water and oxygen was detected in the temperature range of 50–200 °C, and the peak shapes and emerging temperature correspond well. Combining the IR results indicating that δ-MnO2 has a significantly higher concentration of hydroxyl groups and the Raman results showing that δ-MnO2 has the weakest Mn-O bond, the weight loss in 50–200 °C region on δ-MnO2 might be related to the release of oxygen from structural hydroxyl groups (2-OH→1/2O2 + H2O), which might enhance the easier phase transformation from MnO2 to Mn2O3. Meanwhile, δ-MnO2 contains a high amount of H-bonded hydroxyl likely evolving from water and other surface hydroxyls as shown by the broad 3000–3700 cm−1 band, also by adsorbed water in 1625 cm−1 [36] (see Figure 3). Therefore, TGA from 80–200 °C should be a combination of weakly adsorbed water.
2.3. Oxidation Capacity of Different Crystalline MnO2
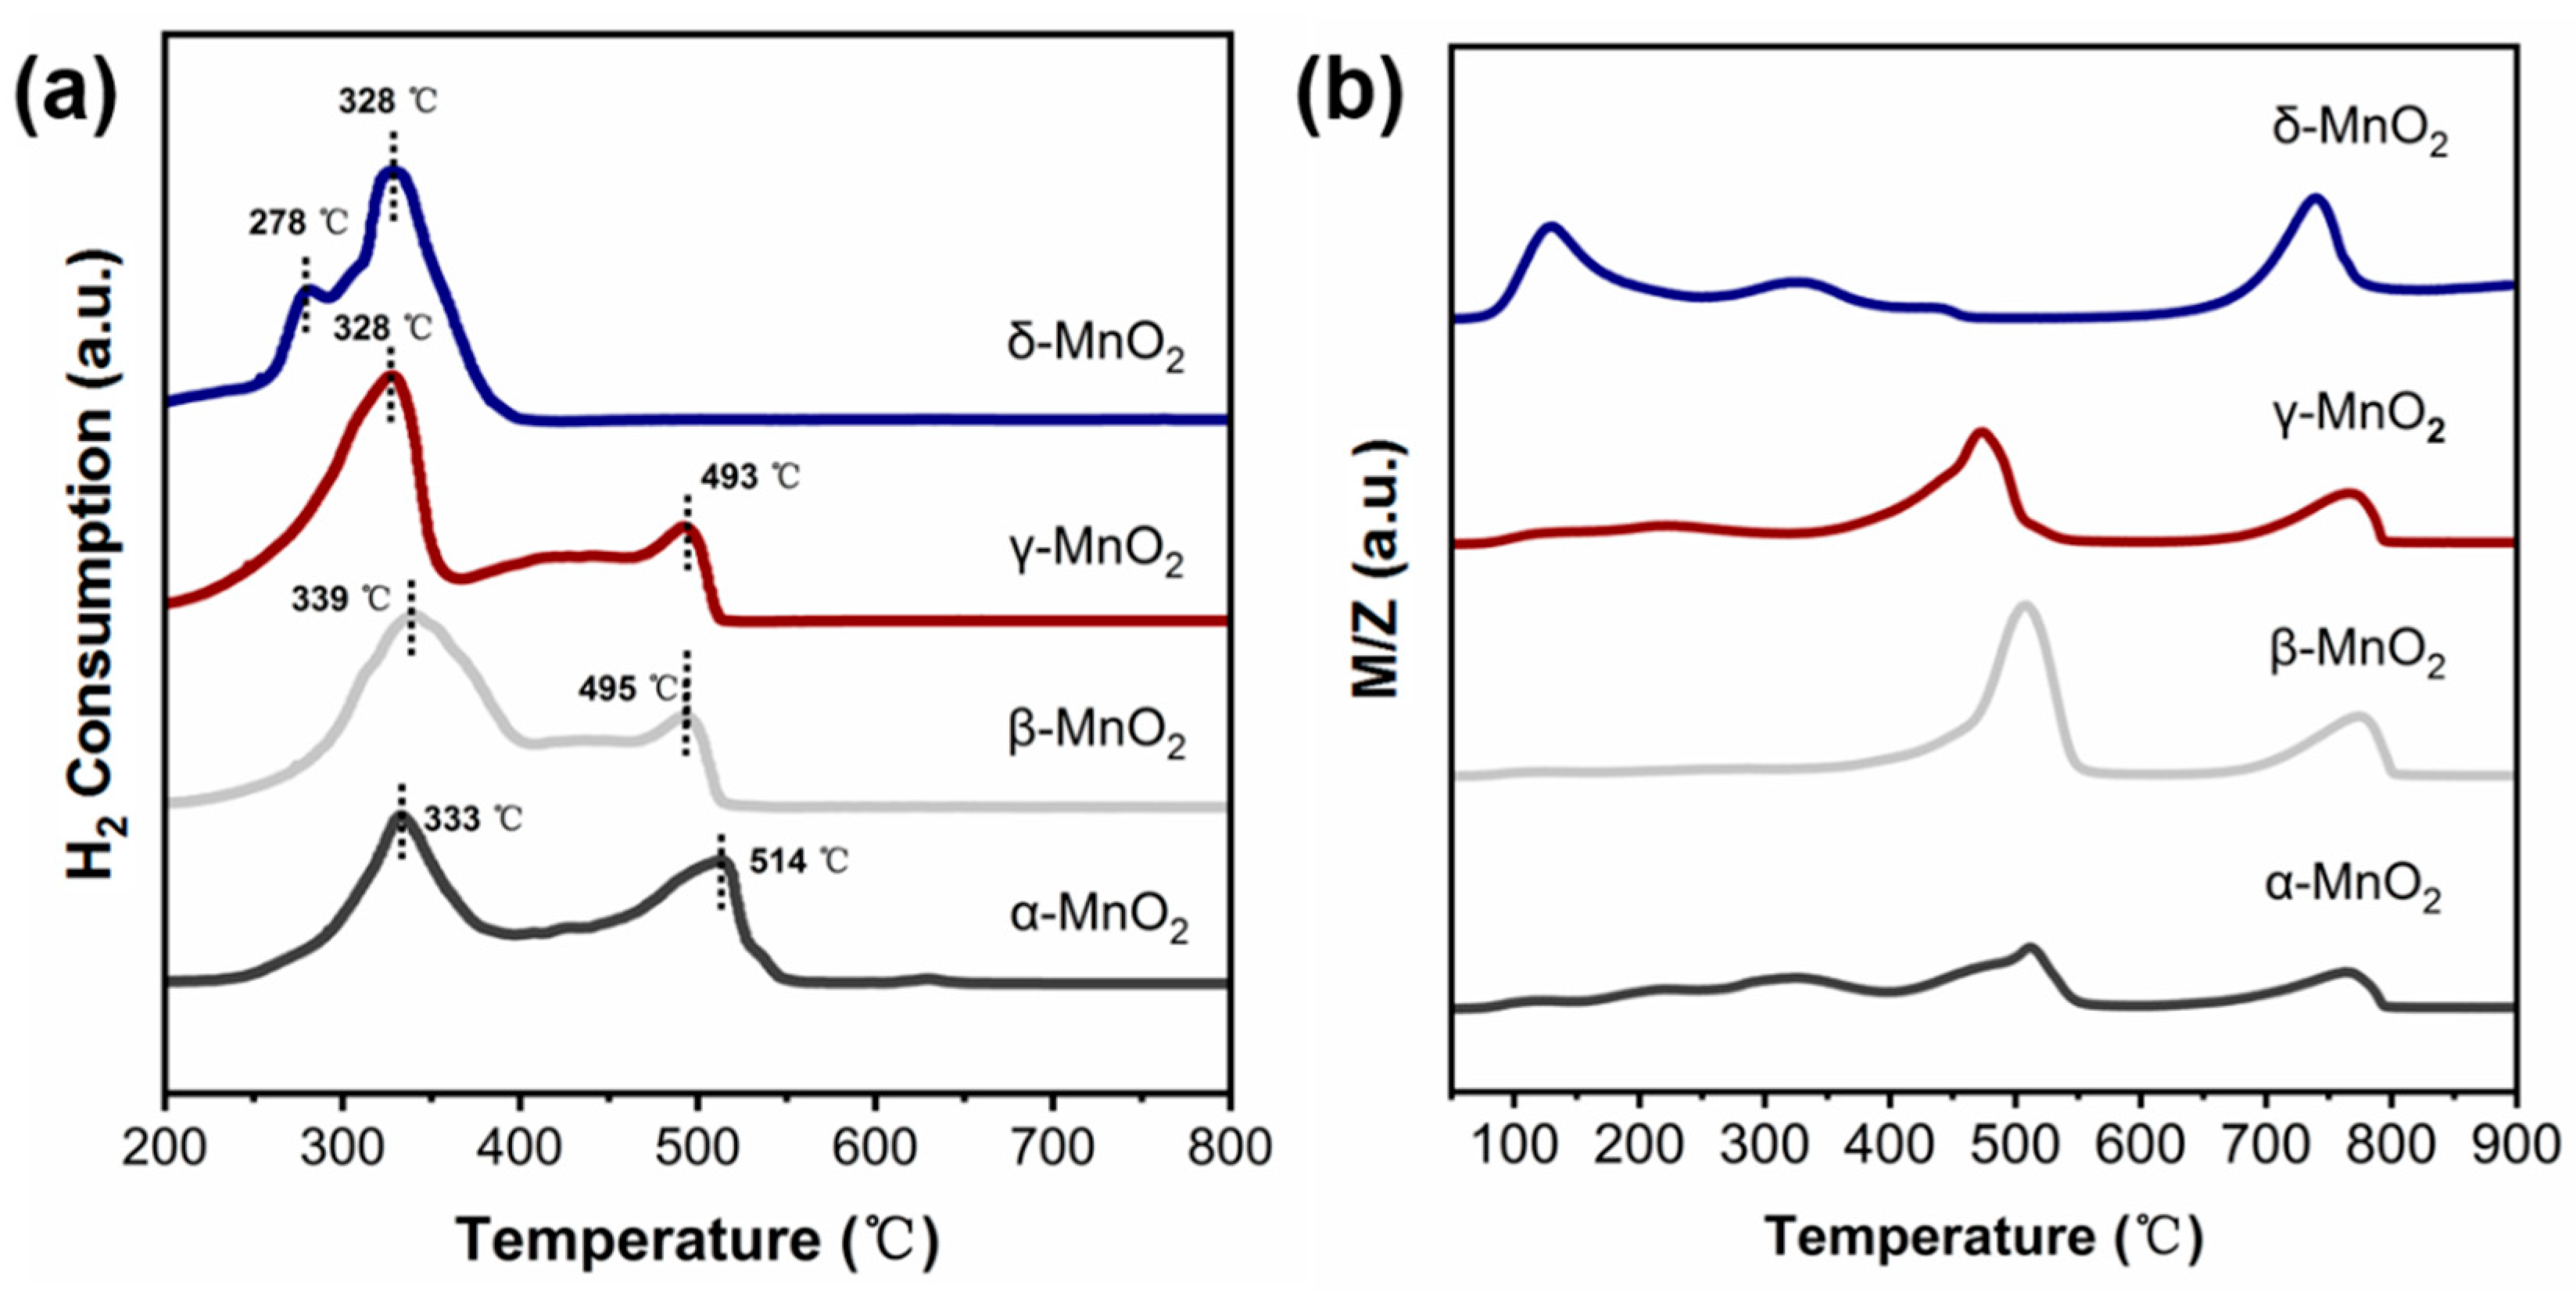
The oxidation ability of α-, β-, γ-MnO2 and δ-MnO2 were characterized by H2-TPR and O2-TPD techniques. (see Figure 6a,b). Figure 6a shows that the main H2 consumption peaks of α, β, and γ-MnO2 appeared near 330 °C and 500 °C, respectively. While the main H2 consumption peak on δ-MnO2 is at 328–340 °C with a shoulder peak near 278 °C. These results indicated that the oxygen in δ-MnO2 is more easily utilized. And this deduction was further supported by the O2-TPD result (see Figure 6b). The O2 desorption peaks of α-, β- and γ-MnO2 mainly appeared near 500 °C and 750 °C. While, for δ-MnO2, the desorption peak of O2 shifted to 140 °C, 330 °C and 730 °C. It was reported that the region lower than 400 °C corresponds to the active oxygen species [37,38], while that higher than 400 °C corresponds to the lattice oxygen (Olatt). Thus, the above result indicated that δ-MnO2 has a stronger ability to generate active oxygen species than α-, β- and γ-MnO2, consistent with the Raman and TG results.
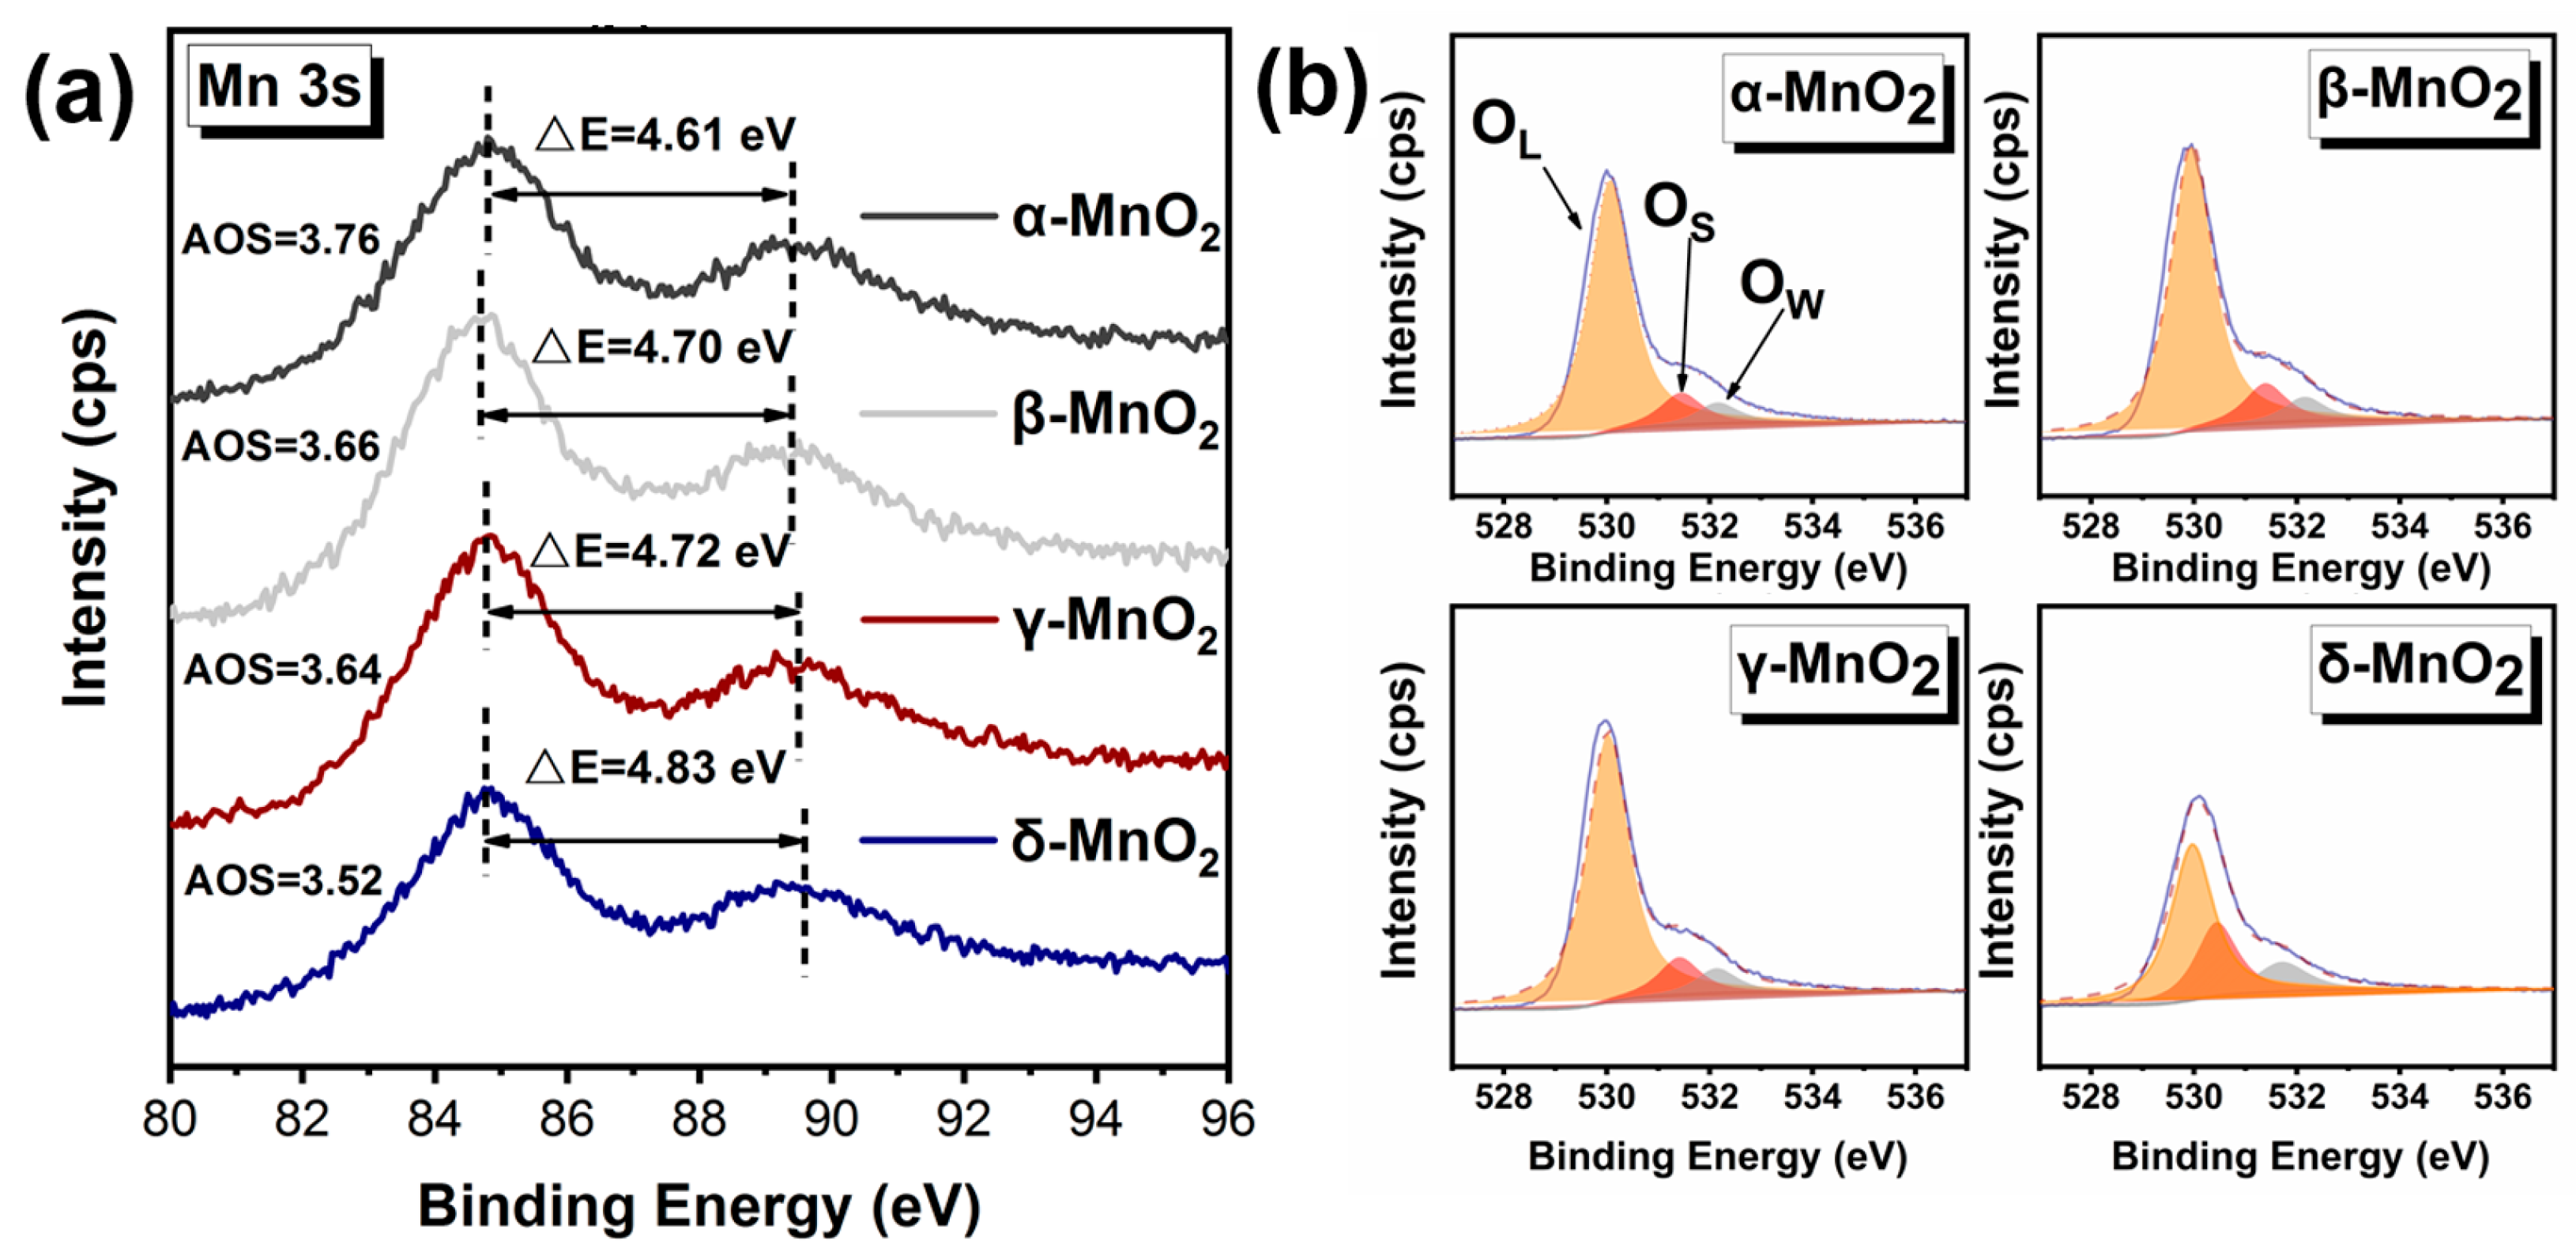
To verify the strong ability to produce active oxygen species on δ-MnO2, the binding energy of Mn was further analyzed (see Figure 7a), and the average oxidation state (AOS) of Mn was calculated by an empirical formula (AOS = 8.956 − 1.126 × ΔE) [39,40]. Where the lower the AOS of Mn, the more electrons can be transferred to the adsorbed oxygen, resulting in more active oxygen species. Compared with α-MnO2 (AOS = 3.76), β-MnO2 (AOS = 3.66), and γ-MnO2 (AOS = 3.64), the δ-MnO2 exhibits lower AOS of 3.52 for Mn, indicating δ-MnO2 has a stronger ability to activate oxygen and is more likely to produce active oxygen species than α-, β-, and γ-MnO2.
And this deduction was further verified by the binding energy of O 1 s (see Figure 7b and Table 2). The O 1 s spectra show that the binding energy of O is at 528–534 eV, which can be divided into three peaks at 530 eV, 531.5 eV, and 533 eV corresponding to lattice oxygen, active oxygen species, and water or oxygen adsorbed on the surface, respectively [39,41]. Based on the peak areas, the percentages of surface-active oxygen species on different MnO2 have been calculated (see Table 2). The percentage of active oxygen species on δ-MnO2 was a staggering 27.70%, which is significantly higher than those on α-, β-, and γ-MnO2. It demonstrates that δ-MnO2 is capable of producing more active oxygen species.
2.4. Discussion
The above results show that δ-MnO2 has a more abundant hydroxyl group and a stronger ability to activate oxygen compared with α-, β- and γ-MnO2. Therefore, the effect of the hydroxyl group and the oxygen activation ability of MnO2 on the oxidation of furfural are discussed in detail below.
2.4.1. The Role of the Hydroxyl Group of MnO2
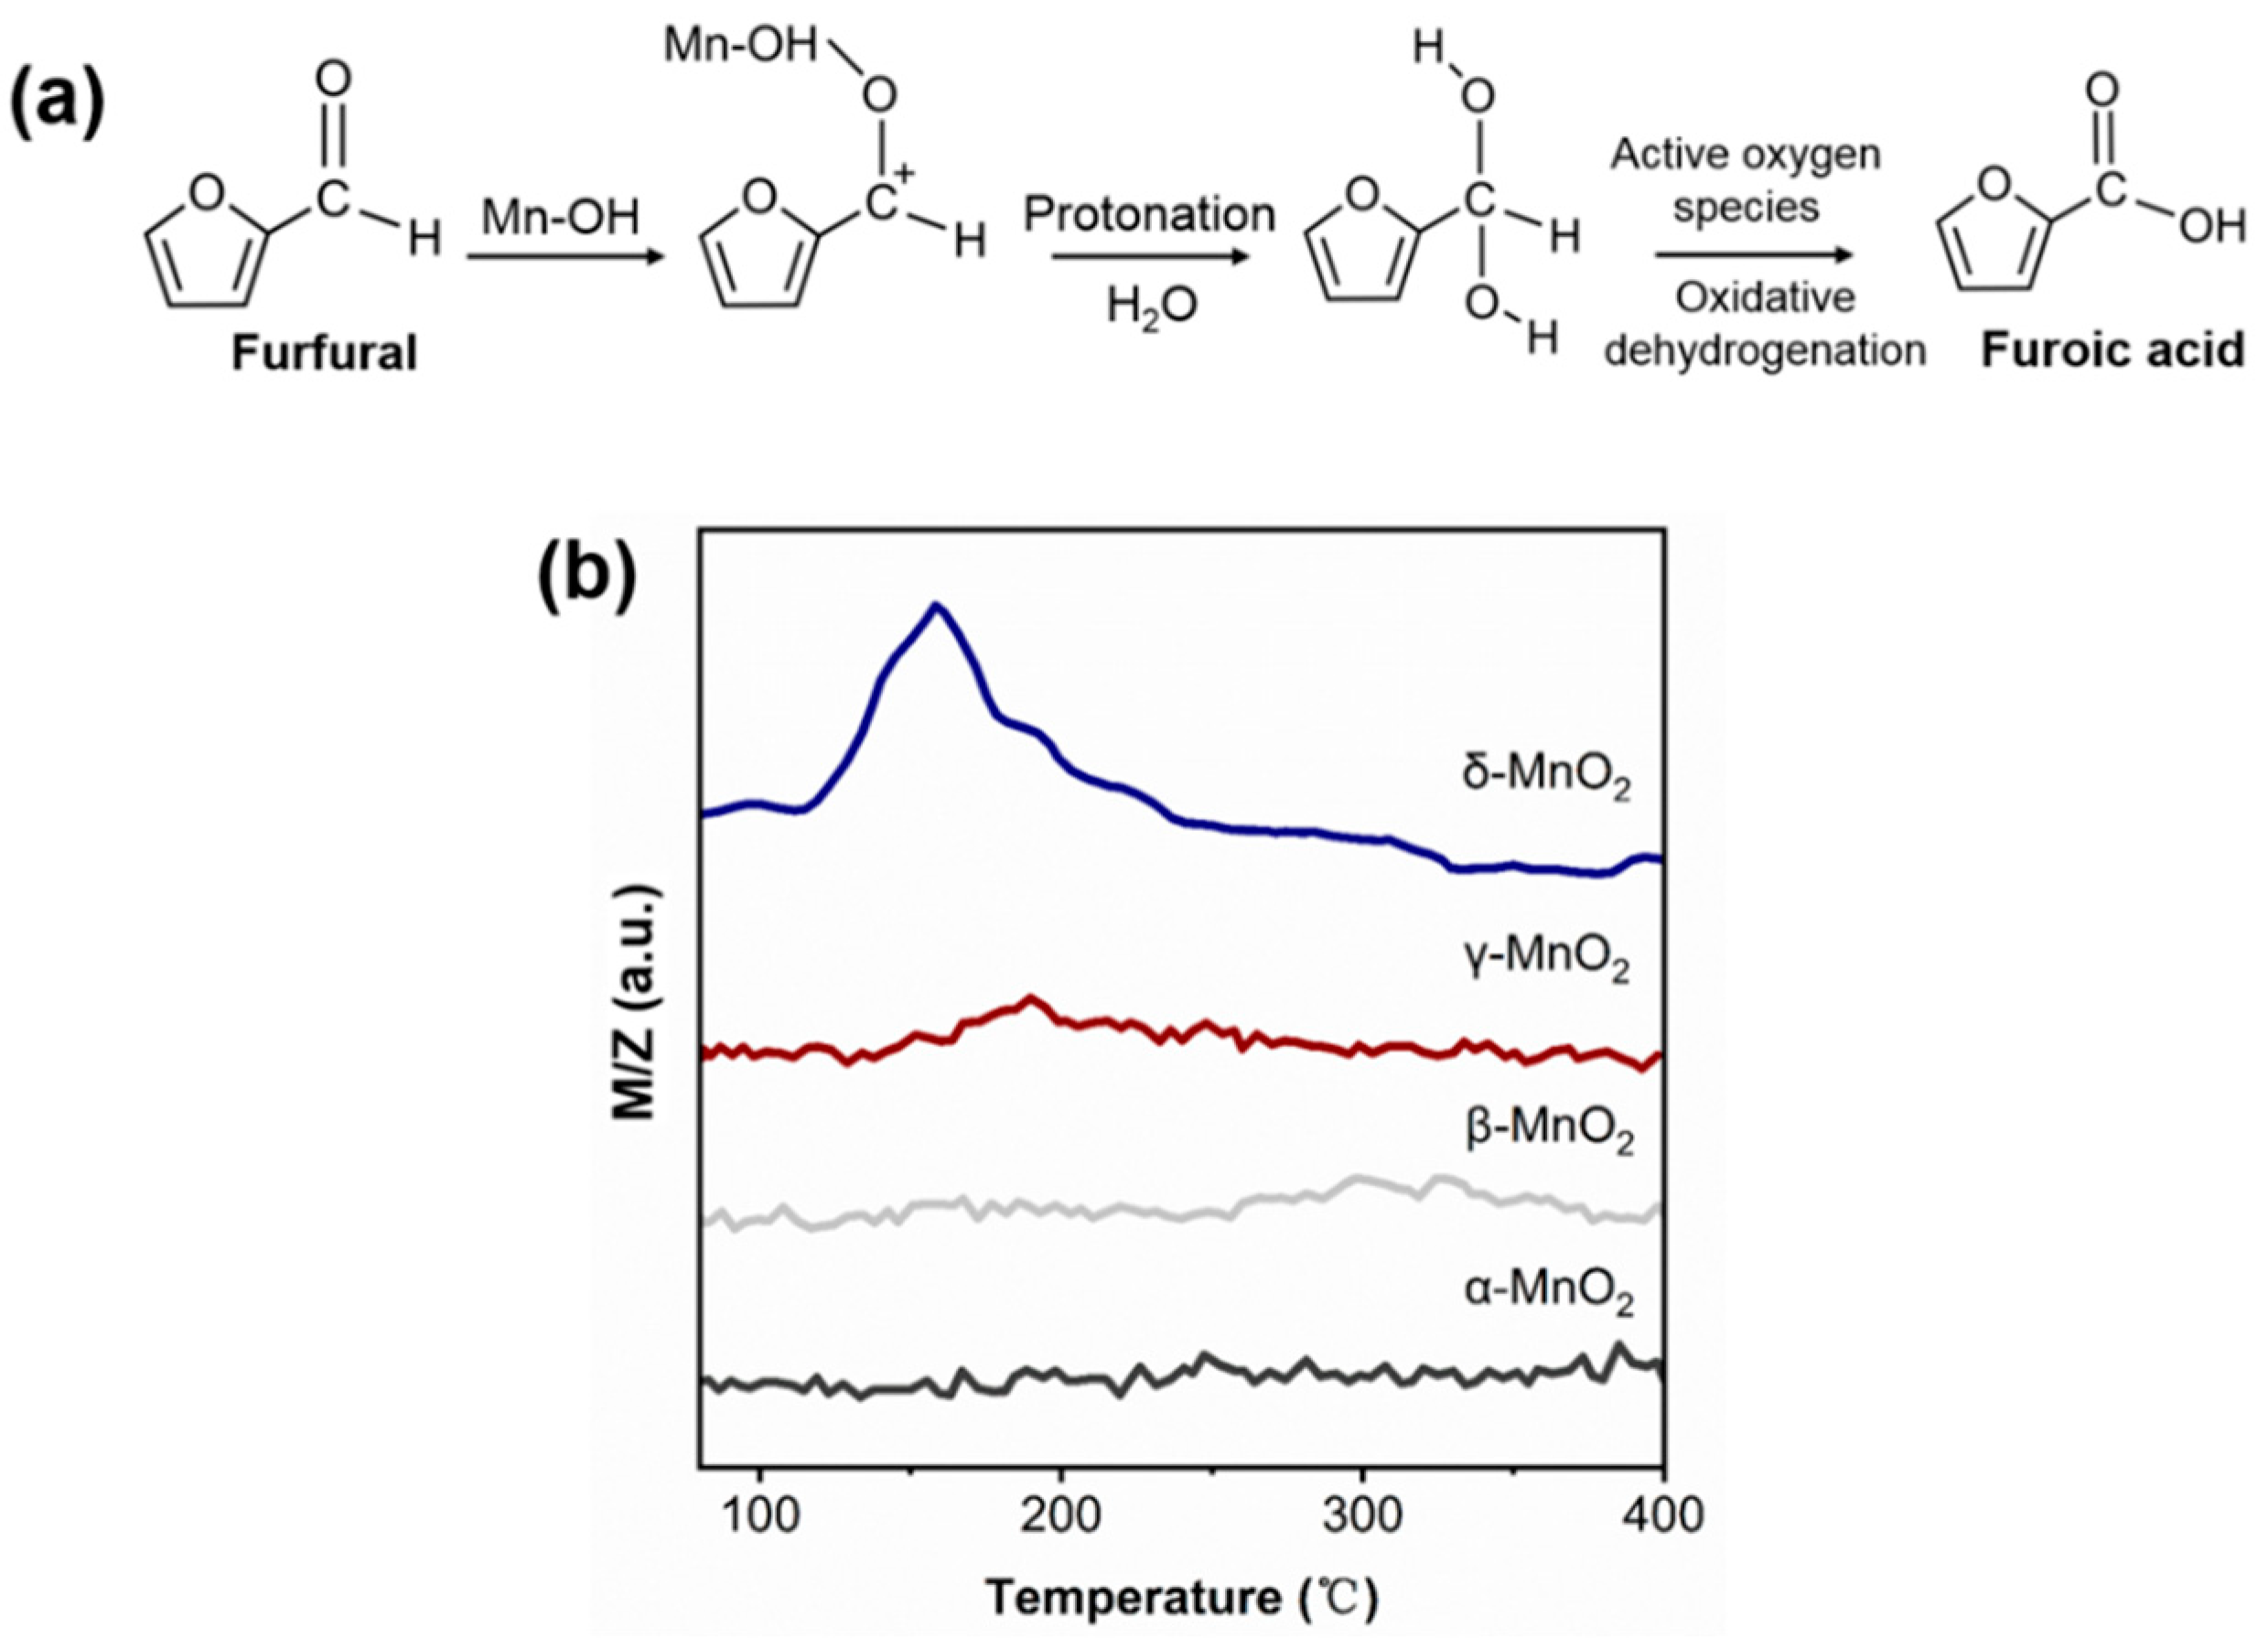
For the oxidation reaction of furfural, it is generally acknowledged that the attack of the aldehyde group by OH− or H+ is essential for the activation of furfural. Under homogeneous alkaline conditions, the free OH− can attack the aldehyde group leading to opening the C=O bond of furfural. As there is no free OH− under base-free conditions over MnO2, it is speculated that the attack of the aldehyde group of furfural might be due to the inherent hydroxyl group of MnO2 (see Figure 8a). To verify this deduction, the furfural-TPD was carried out over α-, β-, γ- and δ-MnO2 (see Figure 8b). On δ-MnO2, a big desorption peak corresponding to furfural appeared at 160 °C, but almost no furfural desorption peak was observed on α-, β-, and γ-MnO2. And this trend is consistent with the changing trend of hydroxyl amount over different MnO2 in IR results. Thus, it can be deduced that the inherent hydroxyl group on MnO2 plays an active role in furfural activation. And this deduction was supported by the formaldehyde oxidation over CeO2 or TiO2 catalyst in the literature [42,43].
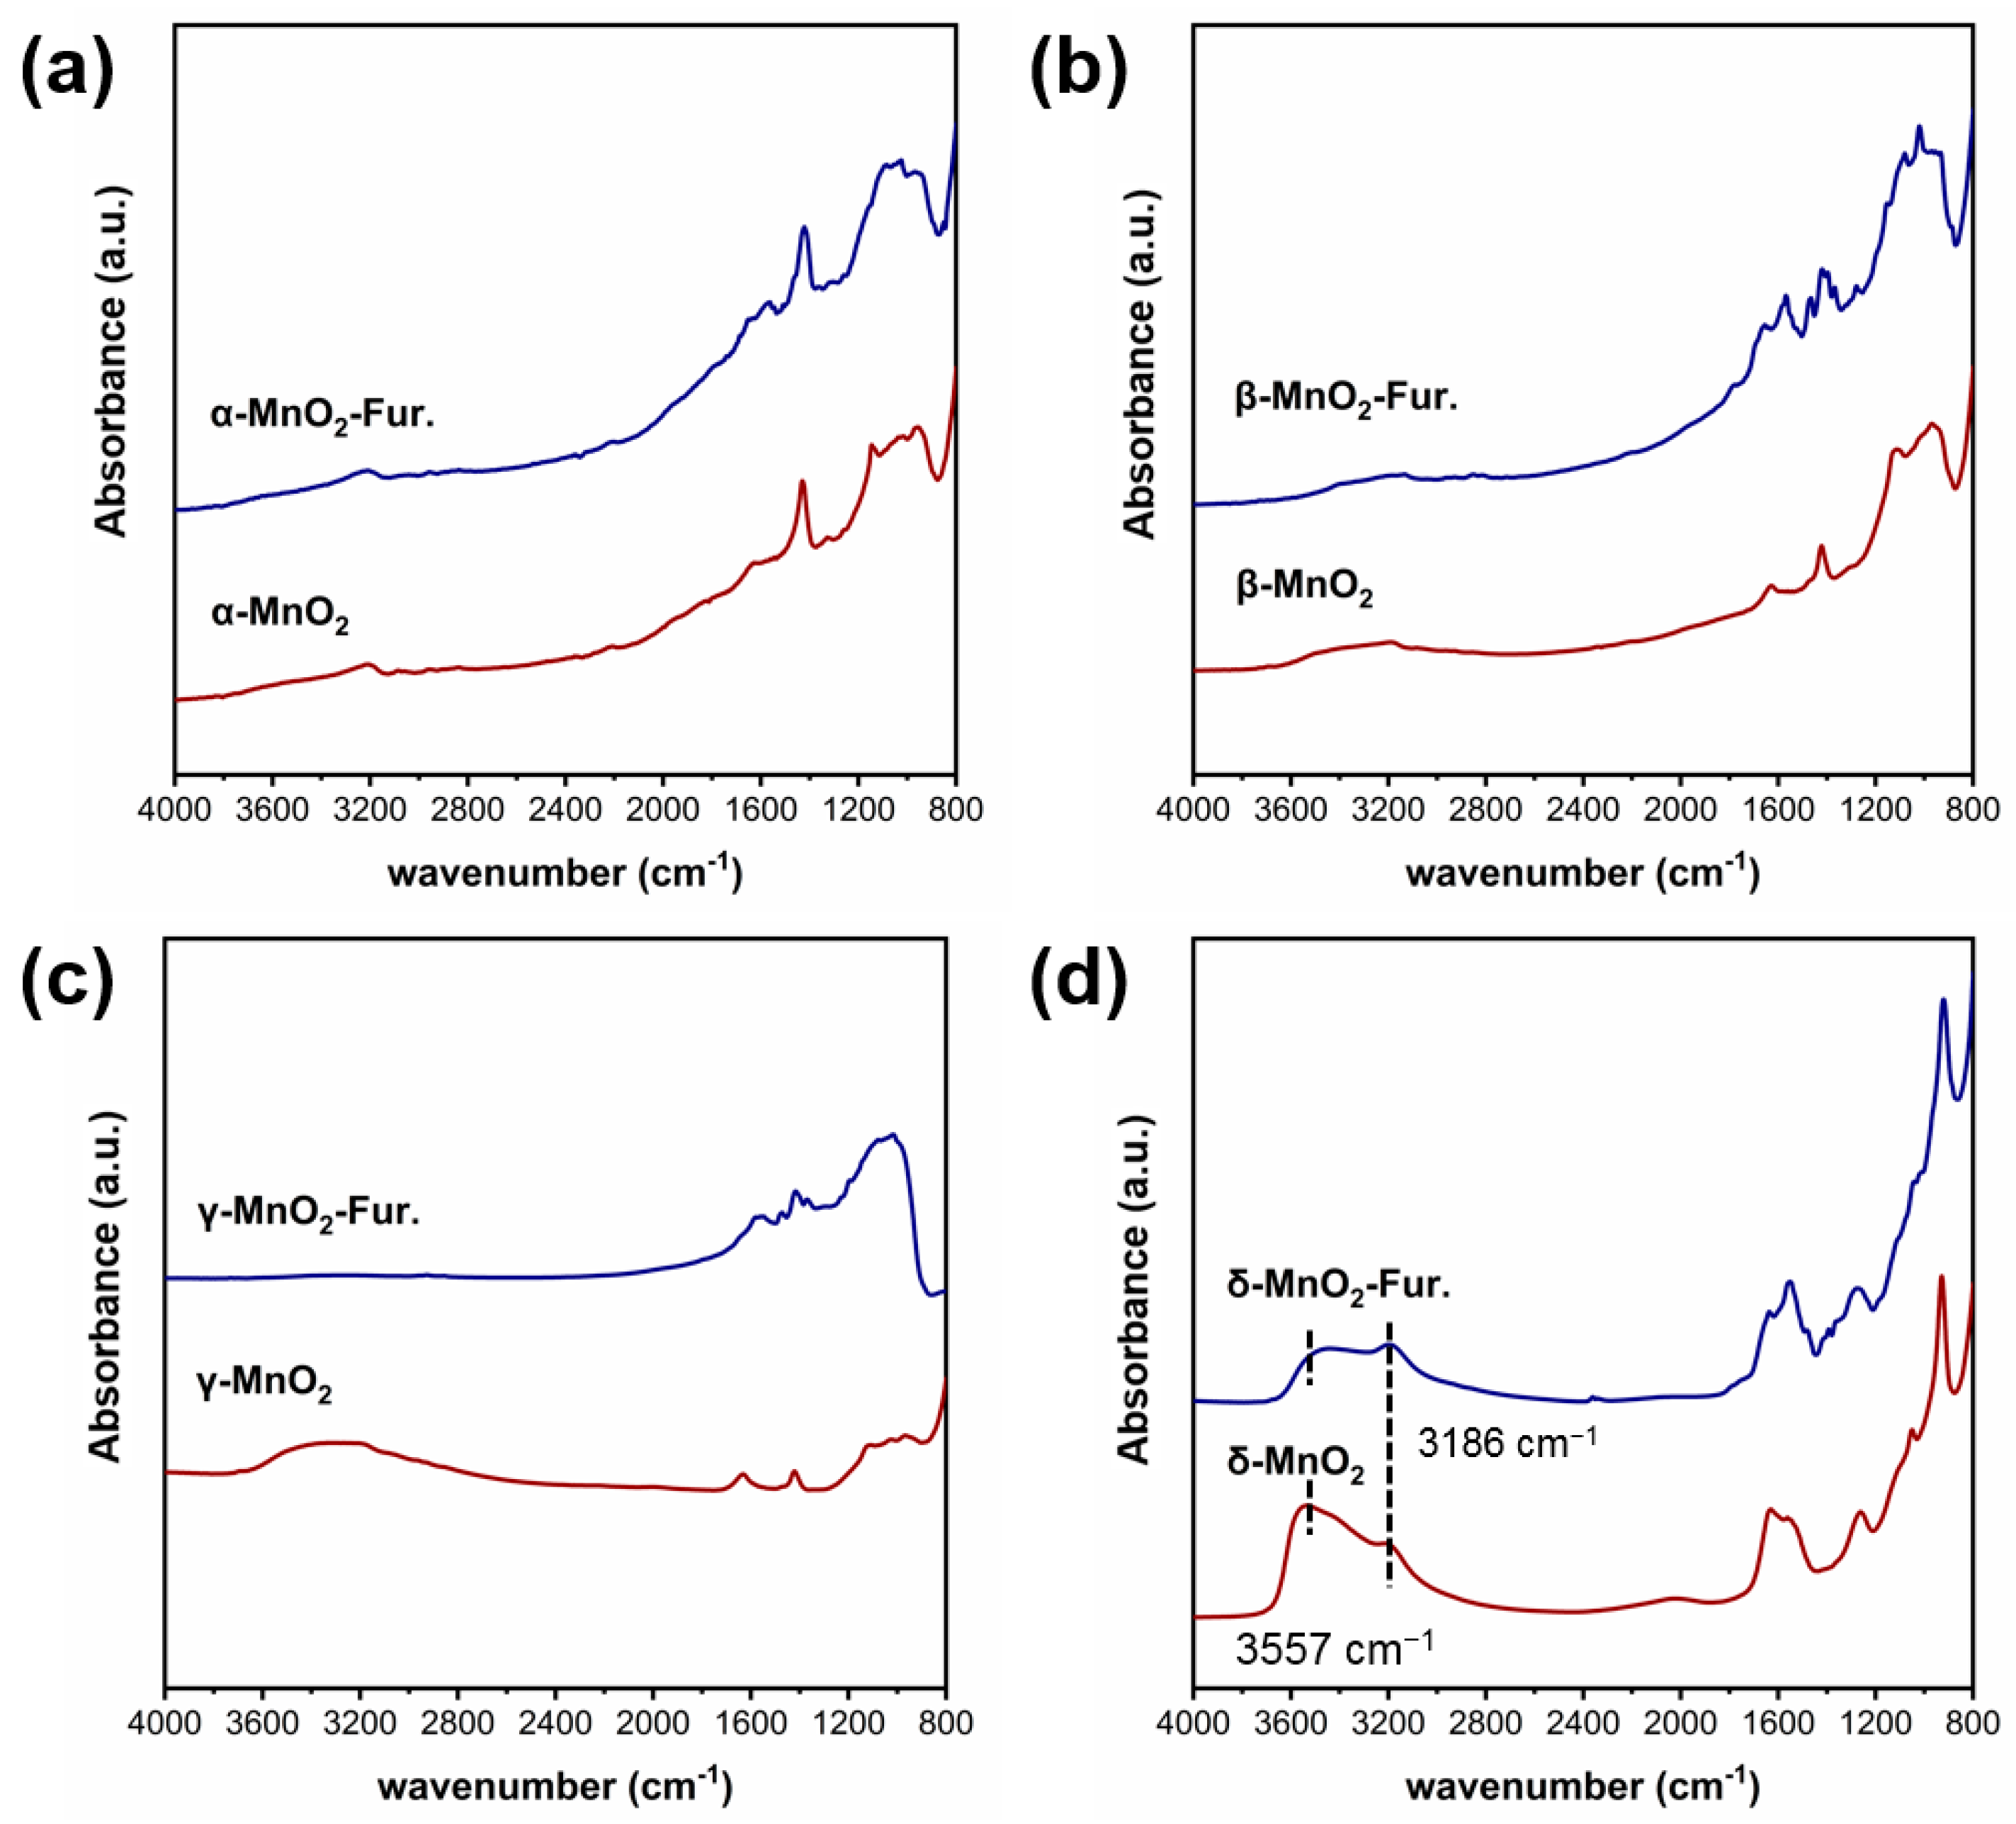
To verify the above deductions, the infrared spectra of different MnO2 before and after the adsorption of furfural were characterized by the furfural-IR technique (see Figure 9). The peaks at 3186 cm−1 and 3557 cm−1 are attributed to hydroxyl groups [33,44,45]. Before furfural adsorption, the hydroxyl group was only found on γ-MnO2 and δ-MnO2, with the corresponding peak intensity stronger on δ-MnO2 than γ-MnO2. However, after the adsorption of furfural, the hydroxyl peaks in both γ-MnO2 and δ-MnO2 are much weaker compared with the pure γ-MnO2 and δ-MnO2 without any change of other groups, which indicated that the inherent hydroxyl group on MnO2 may act as an attacking agent for aldehyde group of furfural.
2.4.2. The Role of Active Oxygen Species of MnO2
It is generally realized that oxidation ability and the amount of activated oxygen play an important role in the activation of oxygen and facilitation of intermediates in aldehyde oxidation reactions [22,42]. The H2-TPR and O2-TPD results in the present study show that the δ-MnO2 has both the strongest ability to activate oxygen and the most abundant active oxygen species (desorption peaks below 400 °C), which might be beneficial to active oxygen and promote the conversion of the geminal diol intermediates in the furfural oxidation reaction.
3. Conclusions
In summary, δ-MnO2 has the weakest Mn-O bond, which can be easily broken to produce the most abundant active oxygen species, giving rise to the beneficial oxidation of intermediates. Moreover, the plentiful inherent hydroxyl groups on δ-MnO2 can activate the aldehyde group of furfural and favors furfural conversion. The activation behavior of the hydroxyl group on the aldehyde group allows the reaction to occur under base-free conditions. Thus, a 99.04% furfural conversion and 100% furoic acid selectivity can be obtained on δ-MnO2. Moreover, the δ-MnO2 shows super stability after three reaction cycles.
4. Materials and Methods
Ammonium persulfate ((NH4)2S2O8, 99.99%, 7727-54-0), ammonium sulfate ((NH4)2SO4, 99.99%, 7783-20-2), manganese sulfate monohydrate (MnSO4·H2O, 99.99%, 10034-96-5), potassium permanganate (KMnO4, 99%, 7722-64-7) and Furfural (C5H4O2, 99%, 98-01-1) were used in the catalyst synthesis process, all of which were purchased from Aladdin (Shanghai, China).
4.1. Preparation of MnO2 with Different Crystalline Forms
The synthesis steps of α-MnO2 were as follows: 0.056 mol of (NH4)2S2O8, 0.056 mol of MnSO4·H2O, and 0.14 mol of (NH4)2SO4 were added into 140 mL of deionized water and stirred for 30 min until fully dissolved, then transferred to 200 mL of PTFE liner and hydrothermally heated at 140 °C for 12 h. After cooling, the obtained precipitate was filtered and washed three times with deionized water and finally dried in a static air oven at 80 °C for 12 h. The obtained catalyst was recorded as α-MnO2.
The synthesis steps of β-MnO2 were as follows: 0.056 mol of (NH4)2S2O8, 0.056 mol of MnSO4·H2O were added into 140 mL of deionized water and stirred for 30 min until fully dissolved, then transferred to 200 mL of PTFE liner and hydrothermally heated at 140 °C for 12 h. After cooling, the obtained precipitate was filtered and washed three times with deionized water and finally dried in a static air oven at 80 °C for 12 h. The obtained catalyst was recorded as β-MnO2.
The synthesis steps of γ-MnO2 were as follows: 0.056 mol of (NH4)2S2O8, 0.056 mol of MnSO4·H2O were added into 140 mL of deionized water and stirred for 30 min until fully dissolved, then transferred to 200 mL of PTFE liner and hydrothermally heated at 90 °C for 12 h. After cooling, the obtained precipitate was filtered and washed three times with deionized water and finally dried in a static air oven at 80 °C for 12 h. The obtained catalyst was recorded as γ-MnO2.
The synthesis steps of δ-MnO2 were as follows: 0.024 mol of KMnO4 and 0.004 mol of MnSO4·H2O were added into 140 mL of deionized water and stirred for 30 min until fully dissolved, then transferred to 200 mL of PTFE liner and hydrothermally heated at 160 °C for 12 h. After cooling, the obtained precipitate was filtered and washed three times with deionized water and finally dried in a static air oven at 80 °C for 12 h. The obtained catalyst was recorded as δ-MnO2.
4.2. Evaluation of Catalysts
The evaluation of the catalyst was carried out in a 100 mL stainless-steel magnetic stirring batch reactor. In general, 50 mg of furfural, 10 mL of deionized water, and 200 mg of catalyst were loaded into the batch reactor, replaced with pure oxygen five times, charged with 1 Mpa of pure oxygen, and raised to 100 °C for 1 h. The experimental parameters were changed with additional explanations in the text. The reactor was cooled immediately after the completion of the reaction, and the resulting mixture was filtered through a syringe filter equipped with a 22 μm PTEF membrane. The filtrate was diluted and analyzed by high-performance liquid chromatography with the following chromatographic detection conditions. The mobile phase ratio was acetonitrile: water = 1:1, and the detection wavelength was 220 nm. The carbon equilibrium of the reaction was calculated by standard solutions. The equations for each parameter in Table 1 are as follows:
Conver. = (nFF in − nFF out(by HPLC))/nFF in × 100%
nFF in: Furfural feed molarity, nFF out Molarity of furfural in the product detected by HPLC.
Propo.FA = nfuroic acid(by HPLC)/nproduct (by HPLC) × 100%
nfuroic acid represents the molar amount of furoic acid in the product detected by HPLC, and nproduct represents the sum of the molar amounts of all products detected by HPLC.
Carbon balance = (nFF out(by HPLC) + nFA out(by HPLC))/nFF in
nFF in: Furfural feed molarity, nFF out: Molarity of furfural in the product, nFA out: Molarity of furoic acid.
4.3. Catalyst Reuse
The used catalyst was filtered out, soaked in 100 mL 50% ethanol/50% sodium hydroxide (1M) mixture for 6 h, then warmed up to 80 °C and stirred for 2 h, and finally filtered and washed five times, dried at 60 °C for 1 h and used in the reaction.
4.4. Catalyst Characterization
H2-TPR: The H2-TPR was tested on a Tianjin Xianquan TP-5080 Automatic Multi-use Adsorption Instrument (Xianquan Industrial and Trading Co., Ltd., Tianjing, China) with 50 mg catalyst (20–40 mesh), purged under a reducing gas (5% H2/95% Ar) atmosphere for 30 min to a smooth baseline under room temperature with a gas flow rate of 30 mL/min. The temperature was programmed to 800 °C from room temperature at a ramp rate of 10 °C/min, and the H2 consumption was measured by TCD.
O2-TPD: The O2-TPD procedure was as follows, using 50 mg of catalyst (20–40 mesh) in quartz tubes purged at 50 °C for 30 min under an Ar atmosphere, followed by the introduction of 5% O2/95% Ar (30 mL/min) without pretreatment for 1 h to saturate the O2 on the sample surface, and then switching to pure argon for 40 min to a smooth baseline. Finally, the temperature was increased from 50 °C to 900 °C at a 10 °C/min rate in an argon atmosphere. The m/z was used to monitor O2 and H2O by a mass spectrometer (IPI GAM200, Pfeiffer Vacuum GmbH (Hessen, Germany)).
XRD: The crystalline phase of the catalyst was tested using an X-ray diffraction (XRD) analyzer (PANalytical X’pert3, Malvern Panalytical Ltd., Overijssel, The Netherlands) with the parameters Cu target, Kα (λ = 1.54056 Å), 40 kV tube voltage, and 40 mA tube current.
SEM: Morphological observation of the catalyst using a scanning electron microscope (JSM-7001F, JEOL Ltd., Beijing, China). The sample powder adheres to the conductive adhesive with an operating voltage of 10 KV.
XPS: XPS analysis was performed using an AXIS ULTRADLD X-ray photoelectron spectrometer (Kratos Ltd., Manchester, UK). The spectra were charge-corrected using a C1s signal located at 284.5 eV. The spectra of all samples were fitted using the XPS PEAK41 software (Kratos Ltd., UK), and the peaks were resolved using an 80% Gaussian/20% Lorentzian model function.
Raman: Raman spectroscopy was performed on a LabRAM HR Evolution Raman instrument (Horiba Ltd., Kyoto, Japan). The excitation source was an argon ion laser 532 nm visible Raman spectral line (laser power:100 mW, Acq. time: 100 s, Accumulations: 1, Hole:150). The instrument was calibrated with silica before testing.
Ex situ DRIFTS: Diffuse reflectance infrared experiments were performed on a Nicolet iS10 infrared spectrometer (Thermo Fisher Scientific Inc., Shanghai, China, spectra resolution: 8 cm−1, scans averaged: 64).
TG: Thermogravimetric curves of the catalysts were measured on a Setaram TGA-92 platform (Setaram Ltd., Bourges, France). About 10 mg of the sample was purged under N2 at room temperature for 30 min and then ramped up from room temperature to 900 °C under N2 at a ramp rate of 5 °C/min.
Ex situ DRIFTS Furfural-IR: After ~50 mg catalyst acquisition of ordinary diffuse reflectance IR, the spectrum was acquired by adding 5 μL of pure furfural dropwise on the catalyst. The specific details are purging it for 10 min under an argon atmosphere (60 mL/min) by warming up to 80 °C in the in-situ pool (spectra resolution: 8 cm−1, scans averaged: 64).
Furfural-TPD: 50 mg of catalyst was loaded into the reaction furnace, furfural was placed in the wash bottle ice bath thermostat (0 °C), and Ar was passed through the furfural wash bottle at a flow rate of 30 mL/min to bring the furfural vapor into the reaction furnace. Next, the product was adsorbed for 30 min until saturation (The mass spectral signal of furfural is not changing) at 80 °C, and then argon purge (30 mL/min) was switched to for 40 min until the baseline was smooth. Finally, the product was desorbed under an Ar atmosphere at a rate of 10 °C/min up to 400 °C, and the desorbed product was detected using mass spectrometry (InProcess Instruments Ltd., Beijing, China).
Supplementary Materials
The following supporting information can be downloaded at: https://www.mdpi.com/article/10.3390/catal13040663/s1, Table S1: BET data for different crystalline MnO2. Table S2: JCPDS main peaks data of different crystalline MnO2. Figure S1: XPS S 2p binding energy of MnO2 with different crystal types. Figure S2: Ex situ DRIFTS spectra of pure furfural. Figure S3: Reactor for the oxidation of furfural to furoic acid.
Author Contributions
Investigation, X.W., H.G. and D.L.; writing—original draft preparation, X.W.; writing—review and editing, X.W., H.G., L.J. and D.L.; supervision, L.J., Y.X., B.H. and D.L.; project administration, H.G., L.J., Y.X., B.H. and D.L.; funding acquisition, H.G., L.J. and D.L. All authors have read and agreed to the published version of the manuscript.
Funding
This research was funded by financial support from Shanxi Science and Technology Major Project, grant number 202005D121002 and “The Natural Science Foundation of Shanxi Province, grant number 20210302123007”. And “The Shanxi Key R&D Programme 202102090301022”.
Data Availability Statement
Not applicable.
Conflicts of Interest
The authors declare no conflict of interest.
References
- Mariscal, R.; Maireles-Torres, P.; Ojeda, M.; Sádaba, I.; López Granados, M. Furfural: A renewable and versatile platform molecule for the synthesis of chemicals and fuels. Energy Environ. Sci. 2016, 9, 1144–1189. [Google Scholar] [CrossRef]
- Banerjee, A.; Dick, G.R.; Yoshino, T.; Kanan, M.W. Carbon dioxide utilization via carbonate-promoted C–H carboxylation. Nature 2016, 531, 215–219. [Google Scholar] [CrossRef] [PubMed]
- Jiang, L.; Gonzalez-Diaz, A.; Ling-Chin, J.; Malik, A.; Roskilly, A.P.; Smallbone, A.J. PEF plastic synthesized from industrial carbon dioxide and biowaste. Nat. Sustain. 2020, 3, 761–767. [Google Scholar] [CrossRef]
- Pinna, F.; Olivo, A.; Trevisan, V.; Menegazzo, F.; Signoretto, M.; Manzoli, M.; Boccuzzi, F. The effects of gold nanosize for the exploitation of furfural by selective oxidation. Catal. Today 2013, 203, 196–201. [Google Scholar] [CrossRef] [Green Version]
- Menegazzo, F.; Signoretto, M.; Pinna, F.; Manzoli, M.; Aina, V.; Cerrato, G.; Boccuzzi, F. Oxidative esterification of renewable furfural on gold-based catalysts: Which is the best support? J. Catal. 2014, 309, 241–247. [Google Scholar] [CrossRef] [Green Version]
- Menegazzo, F.; Fantinel, T.; Signoretto, M.; Pinna, F.; Manzoli, M. On the process for furfural and HMF oxidative esterification over Au/ZrO2. J. Catal. 2014, 319, 61–70. [Google Scholar] [CrossRef]
- Ferraz, C.P.; Zieliński, M.; Pietrowski, M.; Heyte, S.; Dumeignil, F.; Rossi, L.M.; Wojcieszak, R. Influence of Support Basic Sites in Green Oxidation of Biobased Substrates Using Au-Promoted Catalysts. ACS Sustain. Chem. Eng. 2018, 6, 16332–16340. [Google Scholar] [CrossRef]
- Douthwaite, M.; Huang, X.; Iqbal, S.; Miedziak, P.J.; Brett, G.L.; Kondrat, S.A.; Edwards, J.K.; Sankar, M.; Knight, D.W.; Bethell, D.; et al. The controlled catalytic oxidation of furfural to furoic acid using AuPd/Mg(OH)2. Catal. Sci. Technol. 2017, 7, 5284–5293. [Google Scholar] [CrossRef] [Green Version]
- Ferraz, C.P.; Navarro-Jaén, S.; Rossi, L.M.; Dumeignil, F.; Ghazzal, M.N.; Wojcieszak, R. Enhancing the activity of gold supported catalysts by oxide coating: Towards efficient oxidations. Green Chem. 2021, 23, 8453–8457. [Google Scholar] [CrossRef]
- Papanikolaou, G.; Lanzafame, P.; Perathoner, S.; Centi, G.; Cozza, D.; Giorgianni, G.; Migliori, M.; Giordano, G. High performance of Au/ZTC based catalysts for the selective oxidation of bio-derivative furfural to 2-furoic acid11This paper in honor of Professor James G. Goodwin, Jr., in the occasion of his 75th birthday, to celebrate his outstanding contribution to catalysis sciences and technology. Catal. Commun. 2021, 149, 106234. [Google Scholar] [CrossRef]
- Daniel, S.; Subbiah, V.P.; Ramaganthan, B.; Kanthapazham, R.; Vanaraj, R. Upgrading the Strategy of Multistage Torrefaction Liquid by the Selective Oxidation Reaction Route Using a Reusable MgO-Based Au/Al2O3 Catalyst. Energy Fuel 2021, 35, 15831–15841. [Google Scholar] [CrossRef]
- Ren, Z.; Yang, Y.; Wang, S.; Li, X.; Feng, H.; Wang, L.; Li, Y.; Zhang, X.; Wei, M. Pt atomic clusters catalysts with local charge transfer towards selective oxidation of furfural. Appl. Catal. B Environ. 2021, 295, 120290. [Google Scholar] [CrossRef]
- Gupta, K.; Rai, R.K.; Dwivedi, A.D.; Singh, S.K. Catalytic Aerial Oxidation of Biomass-Derived Furans to Furan Carboxylic Acids in Water over Bimetallic Nickel–Palladium Alloy Nanoparticles. Chemcatchem 2017, 9, 2760–2767. [Google Scholar] [CrossRef]
- Al Rawas, H.K.; Ferraz, C.P.; Thuriot-Roukos, J.; Heyte, S.; Paul, S.; Wojcieszak, R. Influence of Pd and Pt Promotion in Gold Based Bimetallic Catalysts on Selectivity Modulation in Furfural Base-Free Oxidation. Catalysts 2021, 11, 1226. [Google Scholar] [CrossRef]
- Tian, Q.; Shi, D.; Sha, Y. CuO and Ag2O/CuO Catalyzed Oxidation of Aldehydes to the Corresponding Carboxylic Acids by Molecular Oxygen. Molecules 2008, 13, 948. [Google Scholar] [CrossRef]
- Zhou, H.; Xu, H.; Wang, X.; Liu, Y. Convergent production of 2,5-furandicarboxylic acid from biomass and CO2. Green Chem. 2019, 21, 2923–2927. [Google Scholar] [CrossRef]
- Yu, K.; Lou, L.-L.; Liu, S.; Zhou, W. Asymmetric Oxygen Vacancies: The Intrinsic Redox Active Sites in Metal Oxide Catalysts. Adv. Sci. 2020, 7, 1901970. [Google Scholar] [CrossRef] [PubMed] [Green Version]
- Yu, K.; Liu, Y.; Lei, D.; Jiang, Y.; Wang, Y.; Feng, Y.; Lou, L.-L.; Liu, S.; Zhou, W. M3+O(–Mn4+)2 clusters in doped MnOx catalysts as promoted active sites for the aerobic oxidation of 5-hydroxymethylfurfural. Catal. Sci. Technol. 2018, 8, 2299–2303. [Google Scholar] [CrossRef] [Green Version]
- Zhou, J.; Qin, L.; Xiao, W.; Zeng, C.; Li, N.; Lv, T.; Zhu, H. Oriented growth of layered-MnO2 nanosheets over α-MnO2 nanotubes for enhanced room-temperature HCHO oxidation. Appl. Catal. B Environ. 2017, 207, 233–243. [Google Scholar] [CrossRef]
- Wang, J.; Li, J.; Jiang, C.; Zhou, P.; Zhang, P.; Yu, J. The effect of manganese vacancy in birnessite-type MnO2 on room-temperature oxidation of formaldehyde in air. Appl. Catal. B Environ. 2017, 204, 147–155. [Google Scholar] [CrossRef]
- Wang, J.; Zhang, P.; Li, J.; Jiang, C.; Yunus, R.; Kim, J. Room-Temperature Oxidation of Formaldehyde by Layered Manganese Oxide: Effect of Water. Environ. Sci. Technol. 2015, 49, 12372–12379. [Google Scholar] [CrossRef] [PubMed]
- Liu, H.; Jia, W.; Yu, X.; Tang, X.; Zeng, X.; Sun, Y.; Lei, T.; Fang, H.; Li, T.; Lin, L. Vitamin C-Assisted Synthesized Mn–Co Oxides with Improved Oxygen Vacancy Concentration: Boosting Lattice Oxygen Activity for the Air-Oxidation of 5-(Hydroxymethyl)furfural. ACS Catal. 2021, 11, 7828–7844. [Google Scholar] [CrossRef]
- Hayashi, E.; Yamaguchi, Y.; Kamata, K.; Tsunoda, N.; Kumagai, Y.; Oba, F.; Hara, M. Effect of MnO2 Crystal Structure on Aerobic Oxidation of 5-Hydroxymethylfurfural to 2,5-Furandicarboxylic Acid. J. Am. Chem. Soc. 2019, 141, 890–900. [Google Scholar] [CrossRef]
- Ferraz, C.P.; Da Silva, A.G.; Rodrigues, T.S.; Camargo, P.H.; Paul, S.; Wojcieszak, R. Furfural Oxidation on Gold Supported on MnO2: Influence of the Support Structure on the Catalytic Performances. Appl. Sci. 2018, 8, 1246. [Google Scholar] [CrossRef] [Green Version]
- Rong, S.; Zhang, P.; Liu, F.; Yang, Y. Engineering Crystal Facet of α-MnO2 Nanowire for Highly Efficient Catalytic Oxidation of Carcinogenic Airborne Formaldehyde. ACS Catal. 2018, 8, 3435–3446. [Google Scholar] [CrossRef]
- Saputra, E.; Muhammad, S.; Sun, H.; Ang, H.M.; Tade, M.O.; Wang, S. Different crystallographic one-dimensional MnO2 nanomaterials and their superior performance in catalytic phenol degradation. Environ. Sci. Technol. 2013, 47, 5882–5887. [Google Scholar] [CrossRef] [PubMed]
- Qiu, G.; Huang, H.; Dharmarathna, S.; Benbow, E.; Stafford, L.; Suib, S.L. Hydrothermal Synthesis of Manganese Oxide Nanomaterials and Their Catalytic and Electrochemical Properties. Chem. Mater. 2011, 23, 3892–3901. [Google Scholar] [CrossRef]
- Wang, H.; Luo, Q.; Wang, L.; Hui, Y.; Qin, Y.; Song, L.; Xiao, F.-S. Product selectivity controlled by manganese oxide crystals in catalytic ammoxidation. Chin. J. Catal. 2021, 42, 2164–2172. [Google Scholar] [CrossRef]
- Verdeguer, P.; Merat, N.; Gaset, A. Lead/platinum on charcoal as catalyst for oxidation of furfural. Effect of main parameters. Appl. Catal. A Gen. 1994, 112, 1–11. [Google Scholar] [CrossRef]
- Wang, X.; Li, Y. Synthesis and Formation Mechanism of Manganese Dioxide Nanowires/Nanorods. Chem. A Eur. J. 2003, 9, 300–306. [Google Scholar] [CrossRef]
- Luo, J.; Huang, A.; Park, S.H.; Suib, S.L.; O’Young, C.-L. Crystallization of Sodium−Birnessite and Accompanied Phase Transformation. Chem. Mater. 1998, 10, 1561–1568. [Google Scholar] [CrossRef]
- Yang, D.S.; Wang, M.K. Syntheses and Characterization of Well-Crystallized Birnessite. Chem. Mater. 2001, 13, 2589–2594. [Google Scholar] [CrossRef]
- Xu, Z.; Yu, J.; Jaroniec, M. Efficient catalytic removal of formaldehyde at room temperature using AlOOH nanoflakes with deposited Pt. Appl. Catal. B Environ. 2015, 163, 306–312. [Google Scholar] [CrossRef]
- Zhang, J.; Li, Y.; Wang, L.; Zhang, C.; He, H. Catalytic oxidation of formaldehyde over manganese oxides with different crystal structures. Catal. Sci. Technol. 2015, 5, 2305–2313. [Google Scholar] [CrossRef]
- Jia, J.; Zhang, P.; Chen, L. The effect of morphology of α-MnO2 on catalytic decomposition of gaseous ozone. Catal. Sci. Technol. 2016, 6, 5841–5847. [Google Scholar] [CrossRef]
- Hadjiivanov, K. Chapter Two—Identification and Characterization of Surface Hydroxyl Groups by Infrared Spectroscopy. In Advances in Catalysis; Jentoft, F.C., Ed.; Academic Press: Cambridge, MA, USA, 2014; Volume 57, pp. 99–318. [Google Scholar]
- Gu, H.; Liu, X.; Liu, X.; Ling, C.; Wei, K.; Zhan, G.; Guo, Y.; Zhang, L. Adjacent single-atom irons boosting molecular oxygen activation on MnO2. Nat. Commun. 2021, 12, 5422. [Google Scholar] [CrossRef]
- Li, X.; Wang, Y.; Chen, D.; Li, N.; Xu, Q.; Li, H.; He, J.; Lu, J. A highly dispersed Pt/copper modified-MnO2 catalyst for the complete oxidation of volatile organic compounds: The effect of oxygen species on the catalytic mechanism. Green Energy Environ. 2021, 8, 538–547. [Google Scholar] [CrossRef]
- Xu, T.; Zhang, P.; Zhang, H. Ultrathin δ-MnO2 nanoribbons for highly efficient removal of a human-related low threshold odorant—Acetic acid. Appl. Catal. B Environ. 2022, 309, 121273. [Google Scholar] [CrossRef]
- Zhu, G.; Zhu, W.; Lou, Y.; Ma, J.; Yao, W.; Zong, R.; Zhu, Y. Encapsulate α-MnO2 nanofiber within graphene layer to tune surface electronic structure for efficient ozone decomposition. Nat. Commun. 2021, 12, 4152. [Google Scholar] [CrossRef]
- Chen, D.; Zhang, G.; Wang, M.; Li, N.; Xu, Q.; Li, H.; He, J.; Lu, J. Pt/MnO2 Nanoflowers Anchored to Boron Nitride Aerogels for Highly Efficient Enrichment and Catalytic Oxidation of Formaldehyde at Room Temperature. Angew. Chem. Int. Ed. 2021, 60, 6377–6381. [Google Scholar] [CrossRef]
- Zhang, L.; Bao, Q.; Zhang, B.; Zhang, Y.; Wan, S.; Wang, S.; Lin, J.; Xiong, H.; Mei, D.; Wang, Y. Distinct Role of Surface Hydroxyls in Single-Atom Pt1/CeO2 Catalyst for Room-Temperature Formaldehyde Oxidation: Acid–Base Versus Redox. JACS Au 2022, 2, 1651–1660. [Google Scholar] [CrossRef] [PubMed]
- Chen, X.; He, G.; Li, Y.; Chen, M.; Qin, X.; Zhang, C.; He, H. Identification of a Facile Pathway for Dioxymethylene Conversion to Formate Catalyzed by Surface Hydroxyl on TiO2-Based Catalyst. ACS Catal. 2020, 10, 9706–9715. [Google Scholar] [CrossRef]
- Rong, S.; Zhang, P.; Wang, J.; Liu, F.; Yang, Y.; Yang, G.; Liu, S. Ultrathin manganese dioxide nanosheets for formaldehyde removal and regeneration performance. Chem. Eng. J. 2016, 306, 1172–1179. [Google Scholar] [CrossRef]
- Yang, X.; Makita, Y.; Liu, Z.-h.; Sakane, K.; Ooi, K. Structural Characterization of Self-Assembled MnO2 Nanosheets from Birnessite Manganese Oxide Single Crystals. Chem. Mater. 2004, 16, 5581–5588. [Google Scholar] [CrossRef]
Figure 1.
Recyclability of δ-MnO2 in furfural oxidation reaction (the reaction condition is the same as Entry 23 in Table 1, Propo.FA represents the percentage of furoic acid in the product detected by HPLC).
Figure 1.
Recyclability of δ-MnO2 in furfural oxidation reaction (the reaction condition is the same as Entry 23 in Table 1, Propo.FA represents the percentage of furoic acid in the product detected by HPLC).

Figure 2.
(a) XRD spectra of different crystalline MnO2, (b) SEM morphology of different crystalline MnO2.
Figure 2.
(a) XRD spectra of different crystalline MnO2, (b) SEM morphology of different crystalline MnO2.

Figure 3.
Ex situ DRIFTS spectra of different crystalline MnO2.

Figure 4.
Raman spectrum of different crystalline MnO2.

Figure 5.
(a) DTG curves of different crystalline MnO2 (catalyst weight range: ~10 mg, gas type: nitrogen, flow rates: 30 mL/min, temperature ramp: 5 °C/min.), (b) TG-MS spectra of different crystalline MnO2.
Figure 5.
(a) DTG curves of different crystalline MnO2 (catalyst weight range: ~10 mg, gas type: nitrogen, flow rates: 30 mL/min, temperature ramp: 5 °C/min.), (b) TG-MS spectra of different crystalline MnO2.

Figure 6.
(a) H2-TPR spectra of different crystalline MnO2 (catalyst weight: 50 mg, gas type: 10% H2/Ar, flow rates: 30 mL/min); (b) O2-TPD spectra of different crystalline MnO2 (catalyst weight: 50 mg, gas type: 5% O2/Ar, flow rates: 30 mL/min).
Figure 6.
(a) H2-TPR spectra of different crystalline MnO2 (catalyst weight: 50 mg, gas type: 10% H2/Ar, flow rates: 30 mL/min); (b) O2-TPD spectra of different crystalline MnO2 (catalyst weight: 50 mg, gas type: 5% O2/Ar, flow rates: 30 mL/min).

Figure 7.
Characterization of the oxidation capacity of different crystalline MnO2. (a) XPS spectrum of Mn 3 s; (b) XPS spectrum of O 1 s.
Figure 7.
Characterization of the oxidation capacity of different crystalline MnO2. (a) XPS spectrum of Mn 3 s; (b) XPS spectrum of O 1 s.

Figure 8.
(a) Schematics of the oxidation of furfural to furoic acid; (b) Furfural-TPD spectrum of different crystalline MnO2 (m/z corresponds to the mass signal of furfural).
Figure 8.
(a) Schematics of the oxidation of furfural to furoic acid; (b) Furfural-TPD spectrum of different crystalline MnO2 (m/z corresponds to the mass signal of furfural).

Figure 9.
Ex situ DRIFTS Furfural-IR spectrum of different crystalline MnO2 ((a–d) are the infrared spectra measured at room temperature for α-, β-, γ- and δ-MnO2, respectively).
Figure 9.
Ex situ DRIFTS Furfural-IR spectrum of different crystalline MnO2 ((a–d) are the infrared spectra measured at room temperature for α-, β-, γ- and δ-MnO2, respectively).


Table 1.
Furfural oxidation properties of different crystalline MnO2.
| Catalyst Name | Temperature /(°C) | O2 Pressure/(MPa) | Reaction Time/(h) | Catalyst Weight/(g) | Conver. 1 /(%) | Propo.FA 2/(%) | Productivity/(mmolfuroic acid/gcat/h) | Carbon Balance 3/(%) |
|---|---|---|---|---|---|---|---|---|
| α-MnO2 | 60 | 1 | 1 | 0.2 | 3.48 | 100 | 0.09 | 96.19 |
| α-MnO2 | 80 | 1 | 1 | 0.2 | 3.37 | 100 | 0.09 | 98.47 |
| α-MnO2 | 100 | 1 | 1 | 0.2 | 4.44 | 100 | 0.12 | 95.57 |
| α-MnO2 | 120 | 1 | 1 | 0.2 | 5.02 | 100 | 0.13 | 91.64 |
| β-MnO2 | 60 | 1 | 1 | 0.2 | 3.43 | 100 | 0.09 | 91.26 |
| β-MnO2 | 80 | 1 | 1 | 0.2 | 3.74 | 100 | 0.10 | 90.20 |
| β-MnO2 | 100 | 1 | 1 | 0.2 | 4.48 | 100 | 0.12 | 94.70 |
| β-MnO2 | 120 | 1 | 1 | 0.2 | 5.89 | 100 | 0.15 | 91.22 |
| γ-MnO2 | 60 | 1 | 1 | 0.2 | 5.79 | 100 | 0.15 | 96.67 |
| γ-MnO2 | 80 | 1 | 1 | 0.2 | 5.80 | 100 | 0.15 | 93.68 |
| γ-MnO2 | 100 | 1 | 1 | 0.2 | 6.76 | 100 | 0.18 | 96.13 |
| γ-MnO2 | 120 | 1 | 1 | 0.2 | 9. 23 | 100 | 0.24 | 99.05 |
| δ-MnO2 | 60 | 1 | 1 | 0.2 | 17.03 | 100 | 0.44 | 98.44 |
| δ-MnO2 | 80 | 1 | 1 | 0.2 | 39.09 | 100 | 1.02 | 85.99 |
| δ-MnO2 | 100 | 1 | 1 | 0.2 | 50.07 | 100 | 1.42 | 85.77 |
| δ-MnO2 | 120 | 1 | 1 | 0.2 | 69.68 | 100 | 1.81 | 88.44 |
| δ-MnO2 | 100 | 1 | 3 | 0.2 | 63.52 | 100 | 0.55 | 94.47 |
| δ-MnO2 | 100 | 1 | 6 | 0.2 | 67.06 | 100 | 0.29 | 88.83 |
| δ-MnO2 | 100 | 1 | 12 | 0.2 | 78.37 | 100 | 0.17 | 91.81 |
| δ-MnO2 | 100 | 1 | 24 | 0.2 | 88.54 | 100 | 0.10 | 75.61 |
| δ-MnO2 | 100 | 1 | 12 | 0.05 | 22.23 | 100 | 0.19 | 96.40 |
| δ-MnO2 | 100 | 1 | 12 | 0.2 | 78.37 | 100 | 0.17 | 91.81 |
| δ-MnO2 | 100 | 1 | 12 | 0.3 | 99.04 | 100 | 0.14 | 89.56 |
1 Conver. = (nFF in − nFF out(by HPLC))/nFF in × 100%, nFF in: Furfural feed molarity, nFF out: Molarity of furfural in the product detected by HPLC. 2 Propo.FA = nFA (by HPLC)/nproduct (by HPLC) × 100%, nFA represents the molar amount of furoic acid in the product detected by HPLC, and nproduct represents the sum of the molar amounts of all products detected by HPLC. 3 Carbon balance = (nFF out (by HPLC) + nFA out (by HPLC))/nFF in × 100%, nFF in: Furfural feed molarity, nFF out: Molarity of furfural in the product, nFA out: Molarity of furoic acid in the product. Reaction conditions: The amount of furfural added is 50 mg, the volume of the reactor is 100 mL, and the stirring speed is 500 rpm.
Table 2.
XPS O 1S peak splitting data of different MnO2.
| Catalyst | Oxygen Species Type | Position/Ev | Area Percentage/% |
|---|---|---|---|
| α-MnO2 | OL 1 | 530.06 | 82.6034 |
| OS 2 | 531.44 | 10.5468 | |
| OW 3 | 532.15 | 6.8498 | |
| β-MnO2 | OL | 529.95 | 81.7358 |
| OS | 531.38 | 11.3416 | |
| OW | 532.14 | 6.9227 | |
| γ-MnO2 | OL | 530.02 | 81.0782 |
| OS | 531.42 | 11.3644 | |
| OW | 532.13 | 7.5575 | |
| δ-MnO2 | OL | 529.96 | 58.3633 |
| OS | 530.43 | 27.6973 | |
| OW | 531.70 | 13.9394 |
1 OL: lattice oxygen, 2 OS: active oxygen species, 3 OW: water or oxygen adsorbed on the surface.
Disclaimer/Publisher’s Note: The statements, opinions and data contained in all publications are solely those of the individual author(s) and contributor(s) and not of MDPI and/or the editor(s). MDPI and/or the editor(s) disclaim responsibility for any injury to people or property resulting from any ideas, methods, instructions or products referred to in the content. |
© 2023 by the authors. Licensee MDPI, Basel, Switzerland. This article is an open access article distributed under the terms and conditions of the Creative Commons Attribution (CC BY) license (https://creativecommons.org/licenses/by/4.0/).
Share and Cite
MDPI and ACS Style
Wu, X.; Guo, H.; Jia, L.; Xiao, Y.; Hou, B.; Li, D. Effect of MnO2 Crystal Type on the Oxidation of Furfural to Furoic Acid. Catalysts 2023, 13, 663. https://doi.org/10.3390/catal13040663
AMA Style
Wu X, Guo H, Jia L, Xiao Y, Hou B, Li D. Effect of MnO2 Crystal Type on the Oxidation of Furfural to Furoic Acid. Catalysts. 2023; 13(4):663. https://doi.org/10.3390/catal13040663
Chicago/Turabian StyleWu, Xu, Heqin Guo, Litao Jia, Yong Xiao, Bo Hou, and Debao Li. 2023. "Effect of MnO2 Crystal Type on the Oxidation of Furfural to Furoic Acid" Catalysts 13, no. 4: 663. https://doi.org/10.3390/catal13040663
Note that from the first issue of 2016, this journal uses article numbers instead of page numbers. See further details here.