Article

Effect of Urea as a Shape-Controlling Agent on the Properties of Bismuth Oxybromides

1
Department of Applied and Environmental Chemistry, University of Szeged, Rerrich Béla Sqr. 1, H-6720 Szeged, Hungary
2
Centre of Nanostructured Materials and Bio-Nano-Interfaces, Institute for Interdisciplinary Research on Bio-Nano-Sciences, Babes-Bolyai University, Treboniu Laurian 42, RO-400271 Cluj-Napoca, Romania
3
Laboratory for Advanced Materials and Applied Technologies, Institute for Research, Development and Innovation in Applied Natural Sciences, Babes-Bolyai University, Fântânele Str. 30, RO-400294 Cluj-Napoca, Romania
4
Department of Biosystems Engineering, Faculty of Engineering, University of Szeged, Moszkvai Blvd. 9, H-6725 Szeged, Hungary
5
Institute of Physical Metallurgy, Metal Forming and Nanotechnology, Faculty of Materials and Chemical Engineering, University of Miskolc, Miskolc-Egyetemváros, C/2-5, H-3515 Miskolc, Hungary
*
Authors to whom correspondence should be addressed.
These authors contributed equally to this work.
Catalysts 2023, 13(3), 616; https://doi.org/10.3390/catal13030616
Submission received: 15 February 2023 / Revised: 10 March 2023 / Accepted: 14 March 2023 / Published: 20 March 2023

Abstract

:
Bismuth oxybromides were prepared via a solvothermal method by applying different urea amounts during synthesis. The effects of the urea ratio on the morpho–structural properties and photocatalytic activity of the samples were investigated. X-ray diffraction, diffuse reflectance spectroscopy, infrared spectroscopy, Raman spectroscopy, scanning electron microscopy, and surface tension measurements were carried out to characterize the samples. Their photoactivity was evaluated by the photocatalytic degradation of rhodamine B and ibuprofen under UV and visible light irradiations. The urea ratio notably influenced morphology, particle size distribution, and photoactivity. However, it only had a limited effect on the crystalline composition, primary crystallite size, and band gap of bismuth oxybromides. The formation of Bi-based complexes and degraded urea-based products were observed, which were deduced to influence band gap energies and hence, photoactivity. Predominantly, samples prepared at low urea ratios proved to be the best for both rhodamine B and ibuprofen degradations under both irradiations.

1. Introduction

Due to increasing environmental contamination by various industrial processes, the amount of consumable water has been decreasing, while wastewater treatment is a growing problem. These problems are usually tackled via traditional water treatment technologies. However, they are mostly limited to eliminating only one contaminant during a single purification process. Low-cost, highly efficient advanced oxidation techniques may be an alternative solution. These techniques are based upon oxidative chemical reactions, in which highly reactive free radicals (such as OH or O2) interact with organic compounds [1]. As a result, hazardous compounds can be degraded or converted into harmless products such as water or carbon dioxide. A widely investigated field since the 1970s, heterogeneous photocatalysis encompasses chemical reactions that occur under UV–visible light. TiO2, the most frequently investigated photocatalyst, can be activated by UV photons; however, they account for only ~4% of the solar spectrum. In comparison, the visible region covers ~43%; consequently, photocatalysts that can be activated by visible light, and methods to increase photoactivity [2,3] have been increasingly investigated over the last few decades.
In the last couple of years, it was found that most bismuth oxyhalides (BiOXs; where X represents halide ions) have lower band gap energy than TiO2. Based on the literature, the band gap values of BiOCl, BiOBr, and BiOI are 3.2 eV, 2.7 eV, and 1.8 eV, respectively [4]. Consequently, the latter two can be activated under both UV and visible light. BiOXs are widely used as photocatalysts in the pharmaceutical and chemical sectors and for treating the wastewater of textile industries [5,6].
They can be synthesized via co-precipitation [7], hydrothermal [8], solvothermal [9,10], and microemulsion [11] techniques. Crystallization time and temperature applied during solvothermal synthesis significantly influence the structural, morphological, and optical properties of BiOXs, as well as their photoactivity [12,13]. Their size, morphology, and the direction of crystal growth can be influenced by using various solvents, such as ethylene glycol [14], isopropanol, n-propanol [15], ethanol [16], and 2-methoxy-ethanol [17]. Moreover, compounds such as cetyltrimethylammonium bromide, polyvinylpyrrolidone, sodium dodecyl sulfate, urea, thiourea, or the leaf extract of Azadirachta leaf can be used to control the morphology [18]. Many reports have been published on the shape- and structure-directing role of urea and thiourea. For example, rose-shaped Bi2WO6 microcrystals were successfully synthesized by the addition of urea, resulting in enhanced photocatalytic activity [19]. Urea played an important role in defining the hierarchical rose shape, as without its presence, the morphology of the crystals was undefined. The same shape-changing effect was observed for α-Fe2O3 as well [20]. In both examples, urea influenced the morphology of the hierarchical particles. There are cases when shape-tailoring agents influence the morphology of primary crystallites [21]. Such an investigation was carried out for disc-shaped WO3 nanocrystals, where similarly, urea was the key to obtaining these shape-controlled crystallites. The examples shown so far demonstrate the effect of urea on photocatalysts; however, the same shape modification is also possible for noble metals, such as Au and Pt [22,23].
In this study, we aimed to investigate the morphology of BiOBr photocatalysts as a function of urea used during their synthesis. Their structural, morphological, and optical properties were correlated to their photocatalytic activity.

2. Results and Discussion

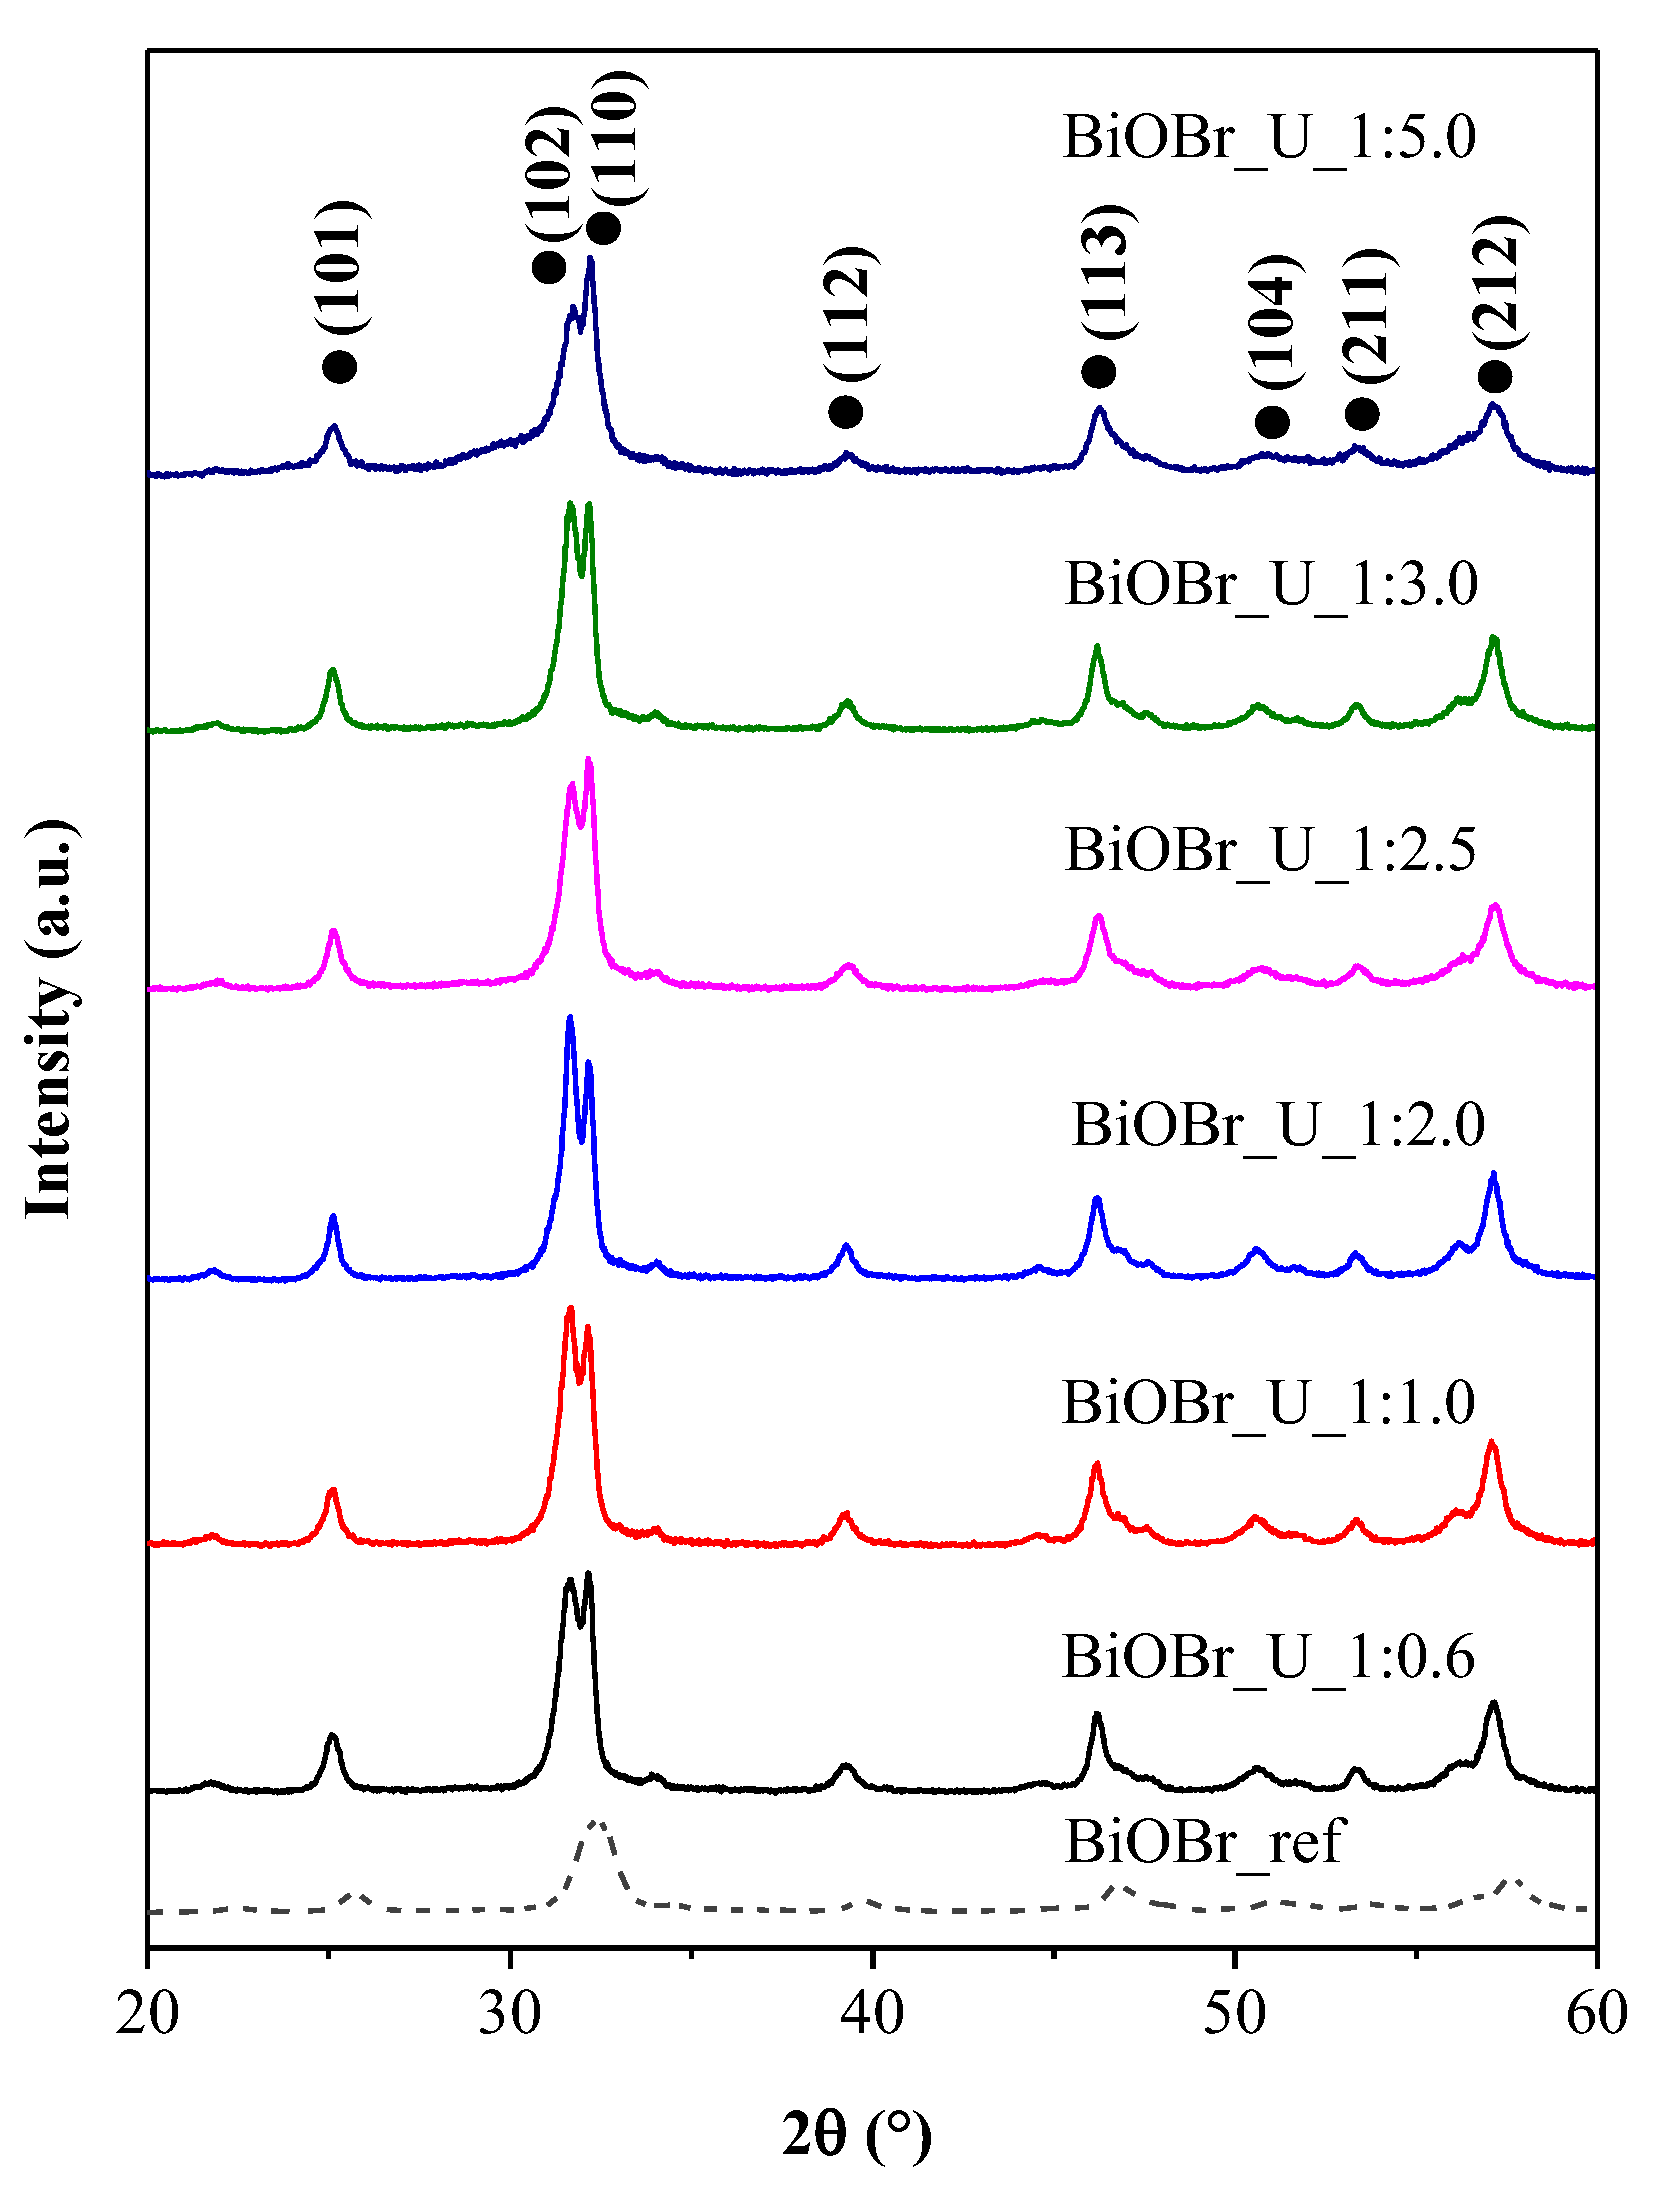
2.1. Structural Analysis

The samples obtained in this work were named as follows: BiOBr_U_X:Y, where X and Y are the molar ratios of BiOBr to urea, respectively (1:0.6, 1.0, 2.0, 2.5, 3.0, and 5.0), and U is short for urea. The reference sample synthesized without urea was named BiOBr_ref. As the first step, the crystalline composition of the samples was investigated via X-ray diffraction (XRD) measurements, and the results are shown in Figure 1. In the XRD patterns of the catalysts synthesized at different urea ratios, characteristic reflections of tetrahedral BiOBr were identified (01-073-2062 [24]). No other compounds or impurities were detected. The most intense diffraction peaks were identified at 31.3° and 32.8° and attributed to the (110) and (102) crystallographic planes of BiOBr, respectively. Increasing the proportion of urea changed the intensity ratios of these planes. BiOBr_U_1:2.5, BiOBr_U_1:3.0, and BiOBr_U_1:5.0 had a lower relative amount of (102) compared to that in BiOBr_U_1:0.6, BiOBr_U_1:1.0, and BiOBr_U_1:2.0. It was deduced that increasing amounts of urea (Bi:urea = 1:2.5, 1:3.0, 1:5.0) were selectively adsorbed on the surface of BiOBr microspheres, thus inducing the growth of the (110) plane. However, the opposite was observed when the ratio of urea reached 3.0, as the intensity of the (102) crystallographic plane increased. This result is in good accordance with the findings of Qin et al. [25]. Primary crystallite sizes were also calculated by using the Scherrer equation. BiOBr_ref had the smallest crystallite size (12.0 nm), while BiOBr_U_1:0.6 also had a relatively small crystallite size of 25.3 nm, and the size of the other catalysts varied between 28.8 and 29.8 nm (Table 1). Above a BiOBr:urea ratio of 1:1, no significant changes were observed.

2.2. Morphology Analysis

Following the XRD measurements, the morphology of the samples was investigated by scanning electron microscopy (SEM), and the results are shown in Figure 2. Based on the SEM results, it can be ascertained that altering the ratio of urea resulted in a similar sphere-like morphology for each BiOBr sample. Other morphologies were also observed, such as cube-like or hierarchic “flower” structures. Some particles also contained cracks and craters. The morphology of particles varied depending on the ratio of urea used. BiOBr_U_1:0.6 contained hierarchic cubes, while BiOBr_U_1:2.0 and BiOBr_U_1:3.0 contained hierarchic flower structures besides microspheres.
By increasing the ratio of urea, the size distribution of BiOBr microspheres became narrower (Figure 2). BiOBr_ref also followed this trend. The ratio of urea influenced the size of hierarchic microspheres, which was in the range of 0.01–3.50 µm. Based on the size distributions, most samples predominantly contained particles of ~1.0 µm. The smallest median value was calculated for BiOBr_U_1:0.6, whereas the biggest one was calculated for BiOBr_ref. The results of size distribution calculations are summarized in Table 1.

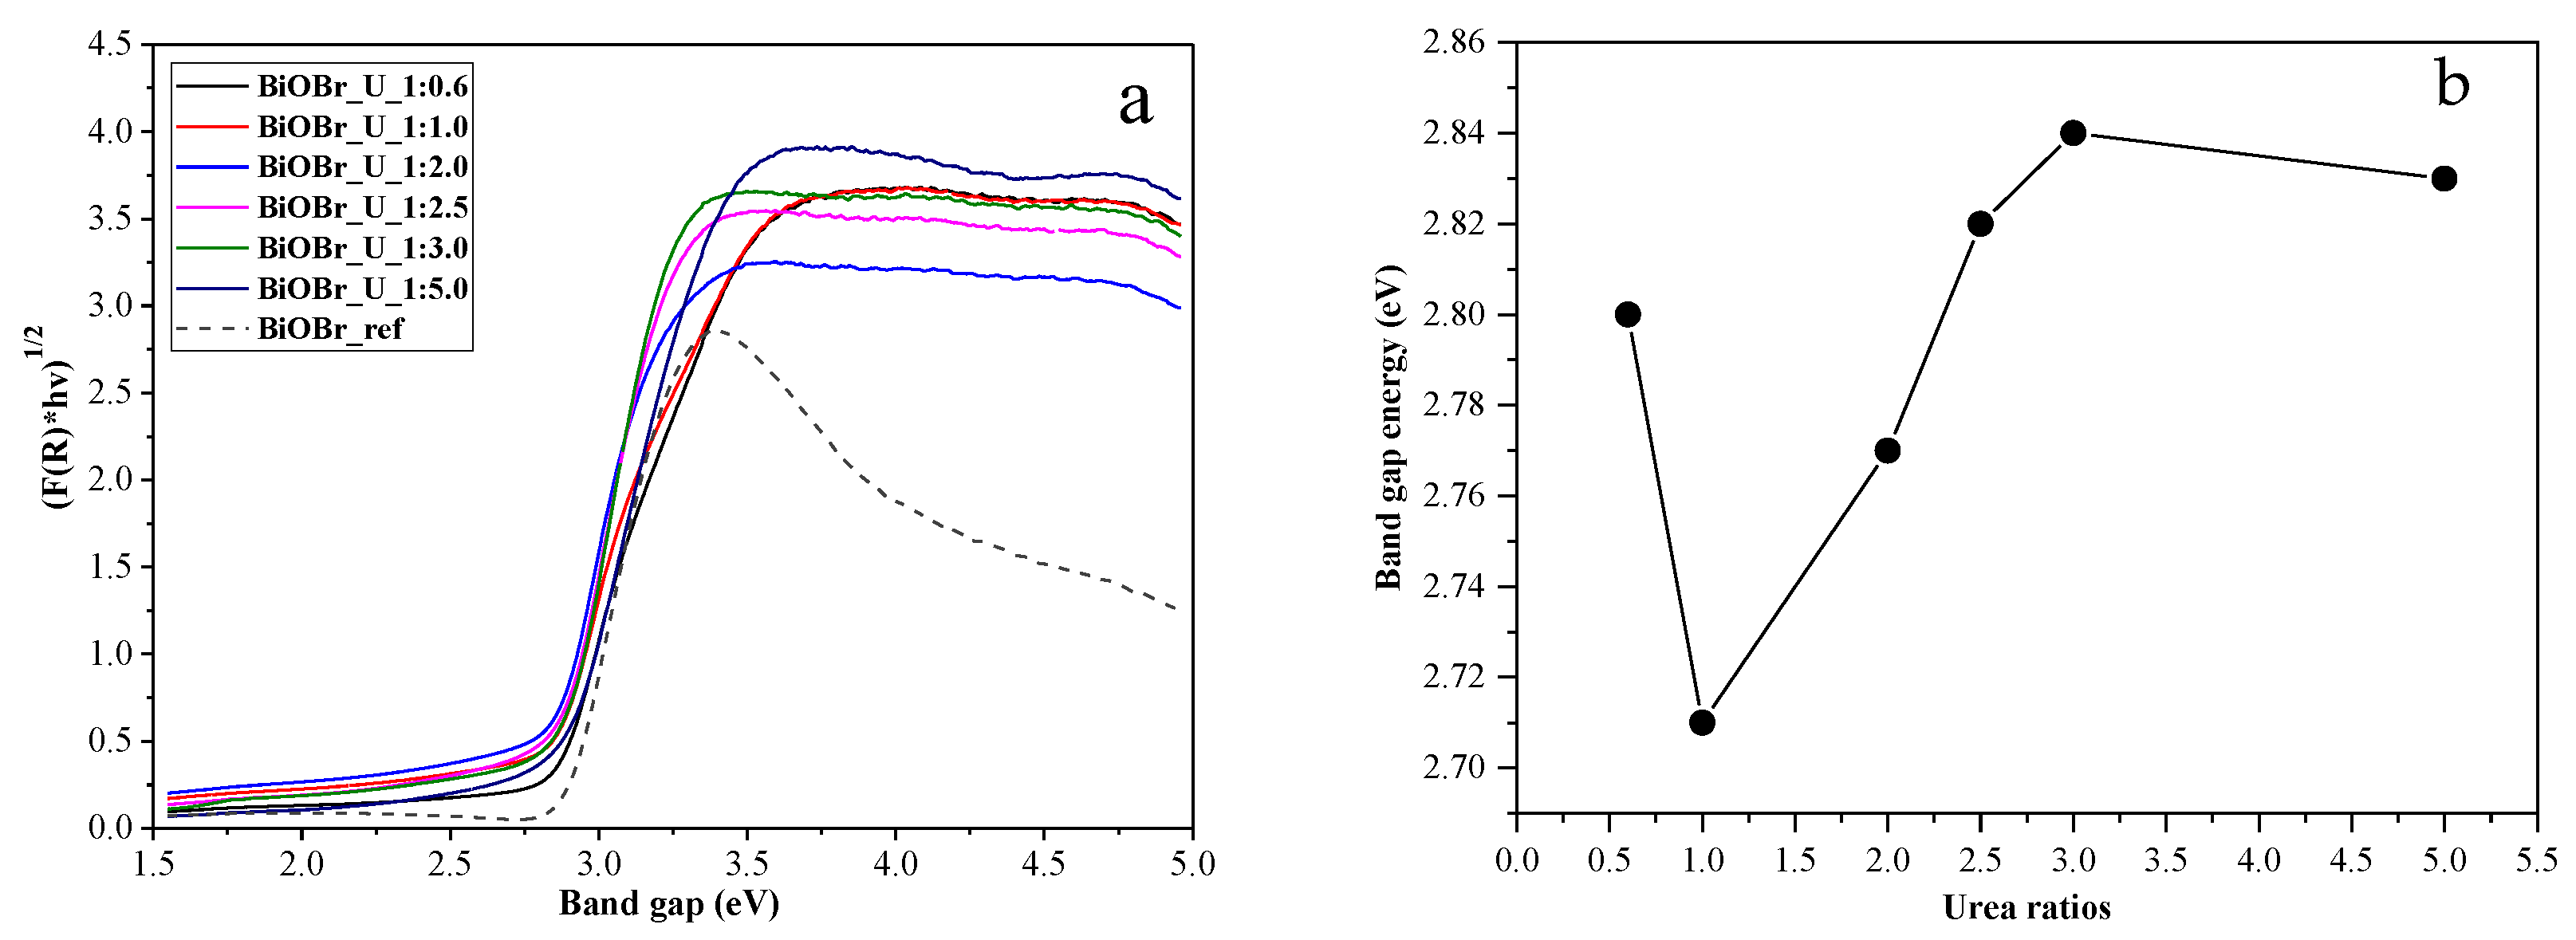
2.3. Optical Properties

As the next step, the light absorption properties were investigated via diffuse reflectance (DR) measurements (Figure 3a). The band gap energies (determined based on the Tauc plots using the Kubelka–Munk method) are summarized in Table 1. The values were close to the ones reported (2.70, 2.87 eV) for other BiOBr catalysts in the scientific literature [26,27]. The difference in the values originates from the slight difference in morphology and particle size distribution. It was ascertained that except for BiOBr_U_1:0.6, band gaps predominantly increased with increasing urea ratio (Figure 3b). BiOBr_U_1:0.6 was the only sample with a noticeable number of cube-shaped crystals. As the urea content was further increased, the cube-shaped crystals disappeared, and the band gap also decreased to 2.71 eV. At higher urea ratios, the band gaps increased until 2.84 eV. The largest band gap (2.90 eV) was observed for BiOBr_ref. Although no major morphological changes were observed, it is clear that this increase coincides with the narrowing particle size distributions (Figure 2). As the latter may be important in determining photocatalytic activity, further investigations were carried out regarding correlations in the following paragraphs.

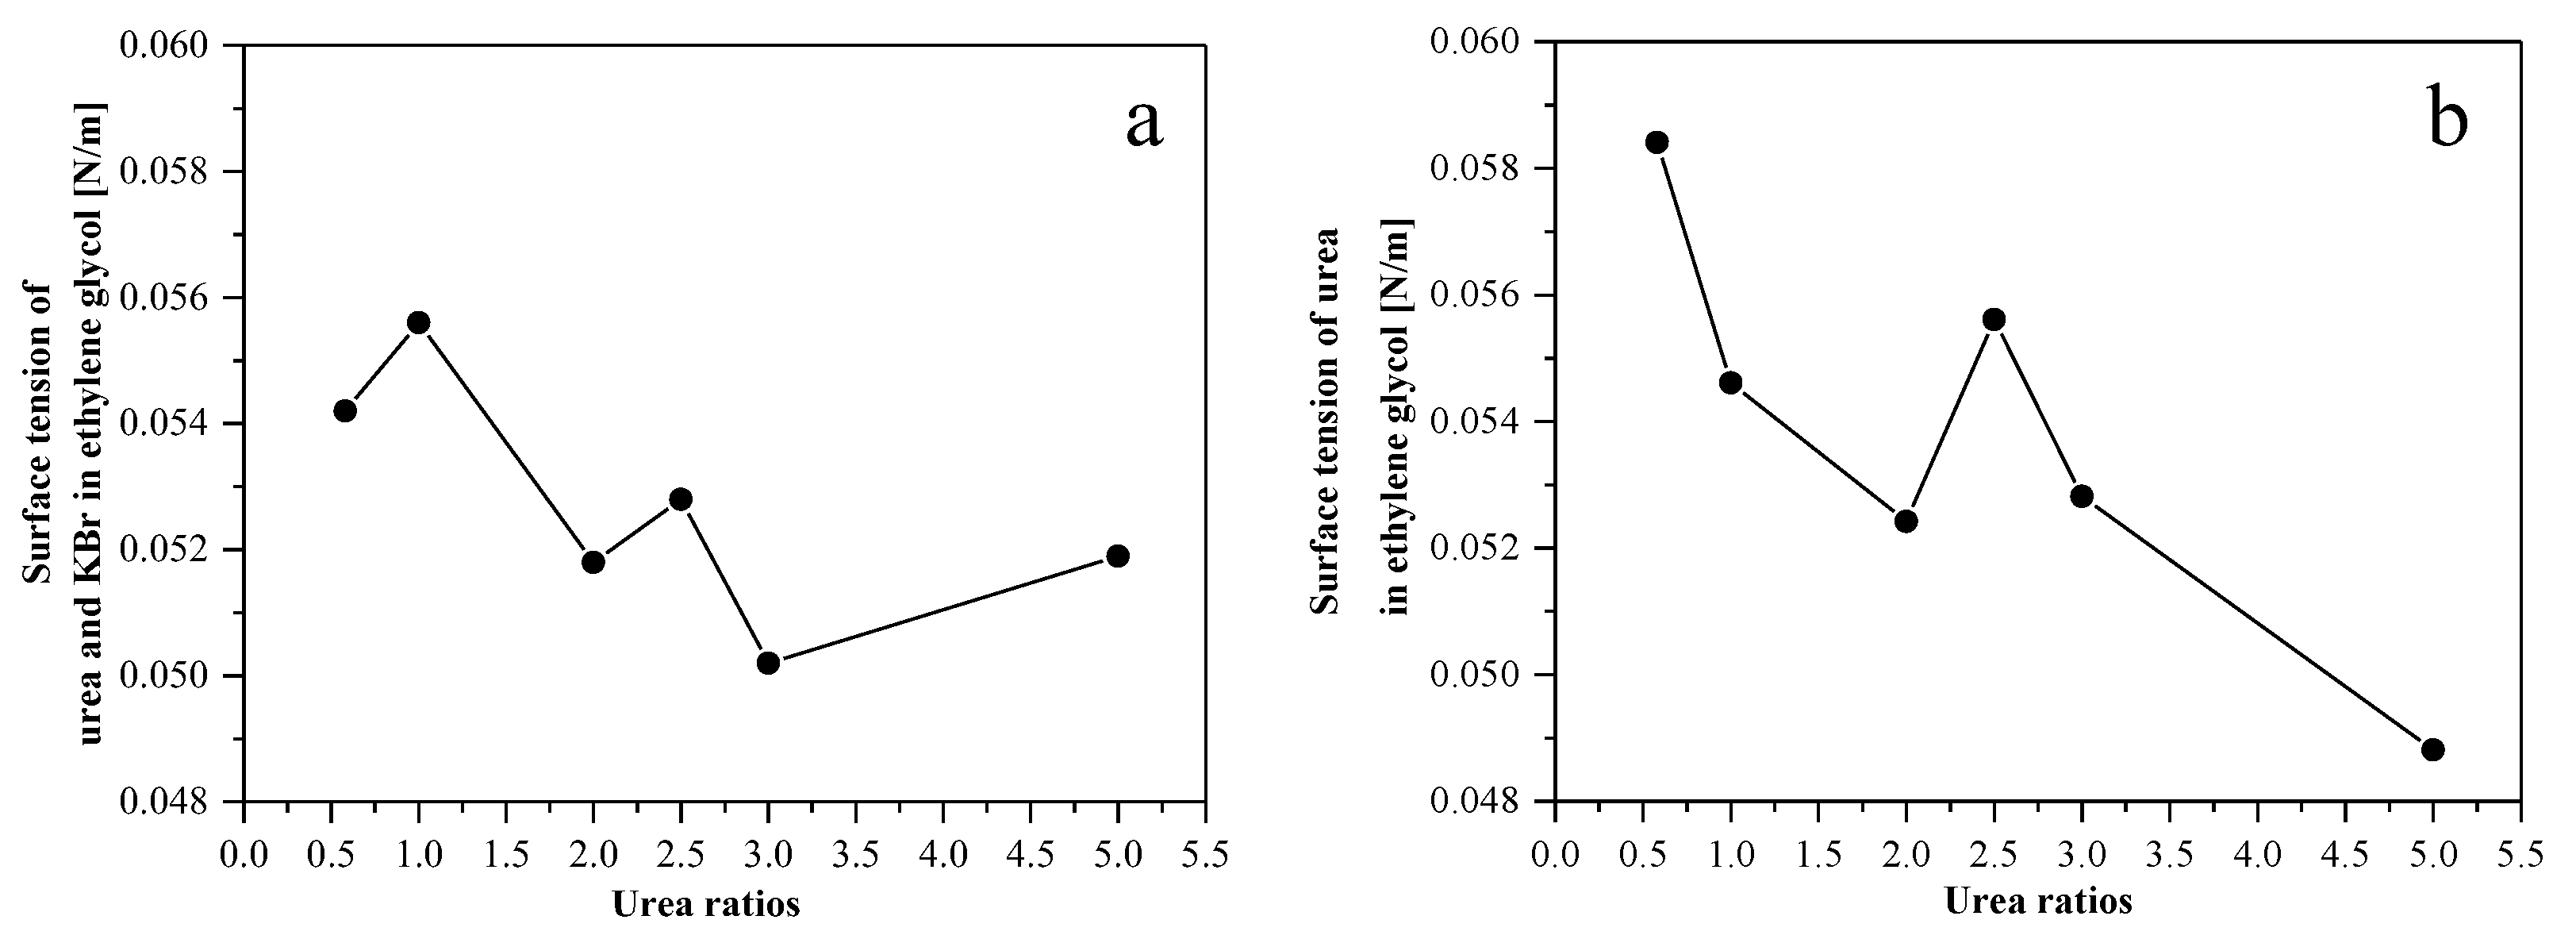
2.4. Importance of Surface Tension during Synthesis

The formation of the nanocrystals and their subsequent aggregation into hierarchical nanostructures is strongly dependent on the surface tension of the synthesis mixture. The surface tension decreased as the amount of urea increased (similar to the effect of surfactants; Figure 4, Table 2) both with and without KBr (the Br anion source). Although no major changes were observed in the morphology, the band gap values followed the trend set by the variations in surface tension (the only exception being BiOBr_U_1:0.6). The particle size distribution also narrowed until reaching a urea ratio of three (BiOBr_U_1:3.0), but after that, the trend was reversed. This shows that the change in the concentration of the shape-tailoring agent does not always influence the shape of the particles.
It is known that using a compound that acts as a surfactant during synthesis will induce changes in particle size. In our case, additionally, urea had multifold effects on the samples. One is the stabilization effect, which manifests by the surfactant surrounding the newly formed crystallites and controlling their growth rate (and sometimes the shape of the crystals as well [28]). The higher the concentration of the surfactant is, the lower primary crystallite size values should be obtained. However, this was not the case, as the crystallite sizes were very similar for all our samples (~29 nm, Table 1). This means that urea only influenced crystallization at a higher level, that is, during the formation of particle aggregates. The hierarchical structures obtained in this work can be seen in Figure 2. As urea is consumed during the formation of hierarchical crystals, it should be attached to the surface of particles and clearly identifiable via spectroscopic means. To reinforce this statement, we carried out infrared (IR) measurements in the following section.

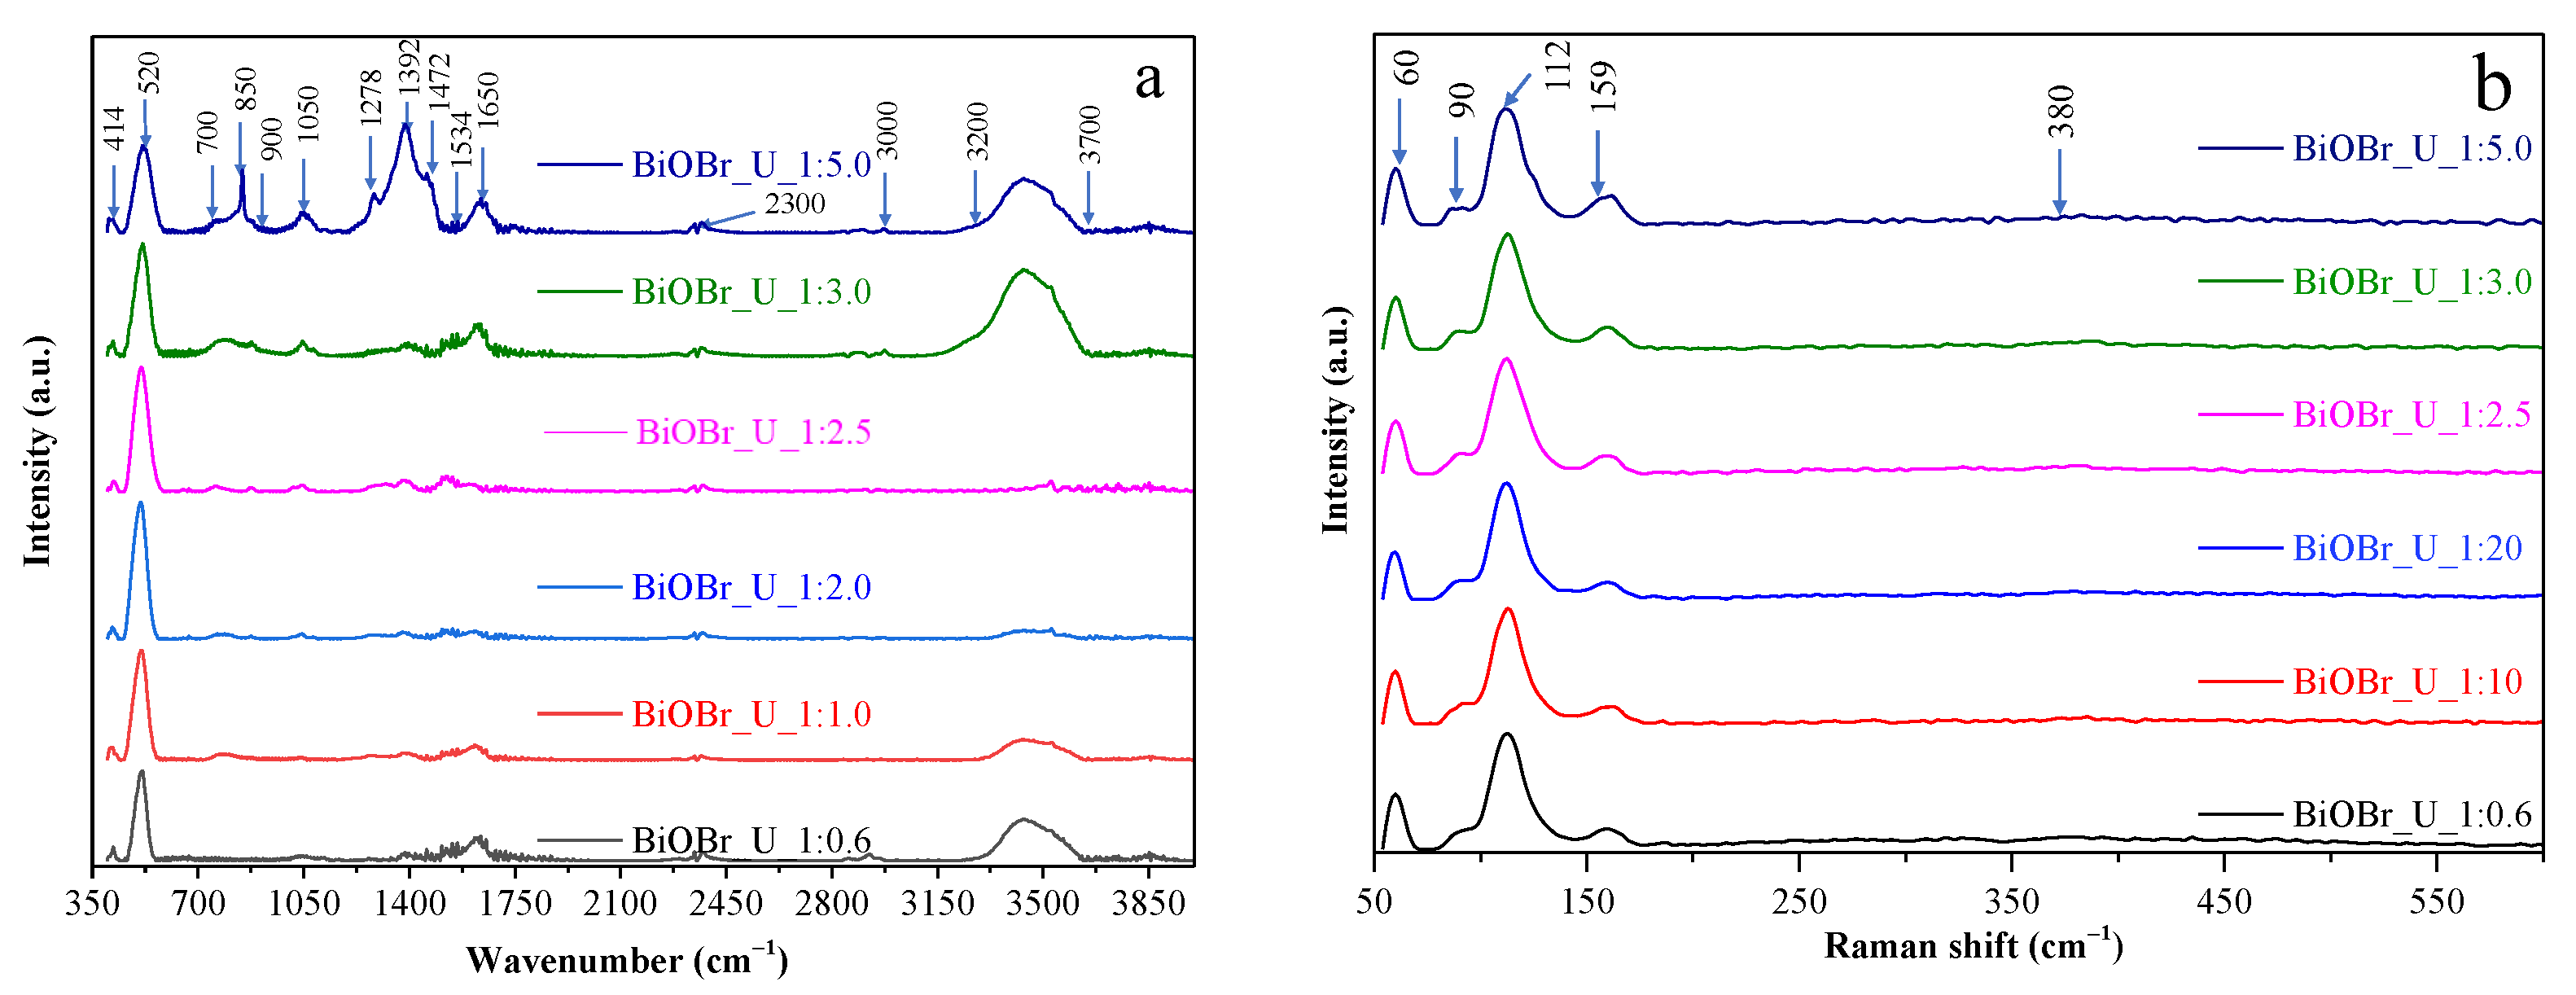
2.5. Infrared and Raman Spectroscopy Results

To investigate the presence of urea (and other organic compounds used during synthesis) on the surface of our samples and make interpretations regarding their photocatalytic activity, we investigated the chemistry of the catalyst surfaces. For this purpose, IR and Raman spectroscopy measurements were carried out, and the results are shown in Figure 5.
In the IR spectra of the samples (Figure 5a), two signal types were considered. One refers to the semiconductor, while the other refers to the presence of organic residues. All oxide-based semiconductors (including mixed oxides and other similar compounds) show the well-known oxide fingerprint region where the vibrations of M–O bonds can be found. In our case, these bands are located at 414 cm−1 and 520 cm−1 [29]. The latter is significantly more intense compared to the former; however, there were no changes in their intensity ratio. This means that the presence of defects or other types of bismuth-based compounds can be ruled out (also confirmed later by Raman spectroscopy). The fingerprint region of the organic compounds [30] was identified between 700 and 900 cm−1 (where usually the out-of-plane vibrations of C–H bonds appear). The intensity of this wide band increased with the increase in urea content. An unusual, sharp signal was also detected at 850 cm−1, overlapping with the fingerprint region in the BiOBr_U_1:5.0 sample. The reason that the appearance of this signal was unexpected is that such sharp bands are extremely rare under 1000 cm−1 and only found in metal complexes as a sign of metal–ligand bonds. The presence of such metal complexes cannot be excluded as some Bi-based amino-group-containing complexes also show this signal [31]. Consequently, Bi-containing surface complexes may form at a high urea concentration. However, their influence on photocatalytic activity is yet to be determined.
C–O stretching vibrations were detected at 1050 cm−1, which originates from the urea decomposing under the applied solvothermal synthesis conditions [30]. The intensity of this band increased with the increase in urea content, as expected. Urea itself was identified in the IR spectra as well due to the presence of its specific absorption bands located at 1392 cm−1 (C–N bending), 1534 cm−1 (N–H bending), and 1650 cm−1 (C=O stretching) [32]. As the concentration of urea increased during the synthesis, the intensity of the bands at 1392 cm−1 and 1650 cm−1 remained unchanged, while that at 1534 cm−1 weakened. In the BiOBr_U_1:5.0 sample, additional small bands appeared at 1278 cm−1 and 1472 cm−1, further reinforcing the formation of a metal complex. These signals can be attributed to the complex interaction between the central metal ion and the ligand. It should also be mentioned that the O–H stretching band (corresponding to the OH groups located on the surface of the catalysts) is also located at ~1650 cm−1, which may interfere with the correct evaluation of this signal [33]. Furthermore, CO2-related bands were also observed at 2300 cm−1 [34]. Additional weak bands were observed that could be attributed to C–H stretching vibrations (sp3 carbon) in the 2900–3000 cm−1 region [33]. Finally, N–H and O–H stretching regions were observed between 3200 and 3700 cm−1 [33]. Although the intensity of these bands varied for the different samples, their significance could not be reliably identified because they overlapped.
The results shown above point out that as the amount of urea was increased, the amount of the bismuth complex increased as well. This statement was based on the slow deformation of the urea signal corresponding to the increasing urea ratios applied during the synthesis. The other property that changed in a similar way was the band gap energy. Hence, the appearance of the complex may have induced the changes observed in Figure 3b. The importance of the organic matter located on the surface of photocatalysts cannot be ignored as they tend to influence the pathway of charge carriers in various ways, as demonstrated before. Additionally, it should be mentioned that no clear signals corresponding to ethylene glycol were observed, which means that the purification procedure was efficient.
Following the IR measurements, the Raman spectra of the samples were also recorded, and the results are shown in Figure 5b. No significant changes were observed in the samples, meaning that crystal defects or the formation of other compounds could not be observed. The main Raman bands could be attributed to Bi–Br vibrations and Bi–O interactions [35]. The latter is an extremely weak and wide Raman signal (centered at 380 cm−1) corresponding to the Eg and Big modes involving the motion of oxygen atoms in the matlockite structure of BiOBr. The sharp bands located below 200 cm−1 are specific to Bi–Br interactions and include both internal and external asymmetric vibrations.

2.6. Photocatalytic Activity

As the last step, the photoactivity of the samples was investigated via the photocatalytic decomposition of rhodamine B (RhB) and ibuprofen (IBP), and the results are summarized in Table 3. Overall, samples prepared at either the lowest or highest urea ratios proved to be the best for both pollutants under both irradiations (Figure S1). Moreover, based on the degradation curves, samples that performed well under UV irradiation performed even better under visible light irradiation and vice versa (Figure S2). BiOBr_U_1:0.6 nearly completely degraded RhB both under UV and visible light irradiations. This might be attributed to its smallest primary crystallite size (hence, highest specific surface area). Considering both irradiations, BiOBr_U_1:1 and BiOBr_U_1:5 performed the best for IBP despite their highest primary crystallite sizes (hence, lowest specific surface areas). This could be explained by the poor adsorption of IBP, which did not affect photoactivity significantly. To investigate the effect of urea addition, BiOBr_ref was also investigated for the degradation of RhB under UV irradiation. After 60 min of UV irradiation, 34.8% RhB was degraded. Thus, it could be ascertained that using urea during the synthesis almost always resulted in better photocatalytic efficiencies.
The degradation results seem to be largely unrelated to the main structural properties, such as the primary crystallite size and the morphology of the particles. This is reinforced by the relatively random variation of the former and the very broad hierarchical particle size distribution (Section 2.1 and Section 2.2). Moreover, the morphology did not vary significantly with the increase in the urea content. However, the following correlation was established based on the band gaps of the catalysts: the photocatalytic activity increases with the band gap (Figure 6) regardless of the applied irradiation (UV or visible) or model pollutant (RhB or IBP). This means that this behavior is a material characteristic rather than a specific case; however, it was observed for other BiOBr samples, too [36]. It is well-known that quantum efficiency is higher at larger band gaps [37], and narrow band gaps facilitate the recombination of photogenerated charge carriers. The highest activity was observed for the sample with the narrowest size distribution of the hierarchical crystals (BiOBr_U_1:3.0). However, BiOBr_U_1:0.6 did not follow this trend, suggesting that there is a minimum urea ratio that must be applied for this photoactivity–band gap correlation to enter the validity region. Although there are values that can be considered outliers in this trend, it should be mentioned that both UV and visible light activities are included for two different compounds.
To analyze the importance of charge carrier dynamics, we studied the photoluminescence (PL) spectra of the samples. When UV-A light was used (excitation at 365 nm, Figure S3a), the observed PL intensity values did not follow the obtained conversion values (Table 3). This means that although the recombination rate and lifetime of charge carriers are key parameters that define photoactivity, in this case, their influence on it was not significant. However, the emission bands located at 413, 440, and 460 nm showed an interesting behavior with the increase in urea content. The PL spectrum of BiOBr_ref, which was synthesized without the addition of urea, did not contain these bands. After the addition of urea (BiOBr_U_1:0.6), the signal at 440 nm appears. Further increasing the urea content (BiOBr_U_1:1) results in all the bands being quenched, while the PL intensity remains high. After reaching the BiOBr:urea ratio of 1:2 and above, the same 3 emission bands appear once again with various intensities. This might mean that the remaining urea on the surface can participate in charge transfer, but it is not the key factor. When visible light was used (excitation at 435 nm, Figure S3b), no specific emission bands appeared. This means that the remaining urea on the surface does not participate in any charge-carrier-related phenomenon.

3. Materials and Methods

3.1. Materials

The photocatalysts were prepared using the following materials: bismuth nitrate pentahydrate (VWR Chemicals, Debrecen, Hungary, 98.0%), potassium bromide (VWR Chemicals, Debrecen, Hungary, 99.0%), ethanol (VWR Chemicals, Debrecen, Hungary, 96.0%), urea (Molar Chemicals, Halásztelek, Hungary, 99%), and ethylene glycol (EG; Sigma-Aldrich, Schnelldorf, Germany, 98%). For the photocatalytic activity measurements, we used ibuprofen sodium salt (IBP; Fluka, Budapest, Hungary, 99.9%) and rhodamine B dye (RhB; Alfa Aesar, Kandel, Germany, 99%). Ultrapure Milli-Q® water was used during the entire study. All reagents were applied without further purification.

3.2. Synthesis of BiOBr

The samples were prepared by a solvothermal crystallization method. First, 2.39 g of bismuth nitrate pentahydrate was dissolved in 50 mL of ethylene glycol. Second, 0.20, 0.35, 0.69, 0.86, 1.03, and 1.72 g of urea were added to the solution to modify the morphology of the samples. Third, potassium bromide was added in a stoichiometric amount (0.58 g) to set the ratio of Bi:Br to 1:1. The solution was kept at 50 °C for 30 min, then transferred to a Teflon®-lined autoclave, which was placed in an oven (Binder BD 115) for 3 h at 120 °C. After the synthesis was finished, the autoclave was allowed to cool down naturally to room temperature. The precipitate was washed with 1.0 L of Milli-Q water and 0.5 L of ethanol via vacuum filtration. Finally, the samples were dried at 40 °C for 12 h. A reference sample was also synthesized in the same way presented above but without using urea.

3.3. Characterization Methods

The optical properties of samples were investigated by diffuse reflectance (DR) spectroscopy. The spectra of the samples were recorded in the λ = 250–800 nm region with a JASCO-V650 spectrophotometer (Jasco, Tokyo, Japan) equipped with an ILV-724-type integration sphere. The indirect band gap values were calculated by the Kubelka–Munk and Tauc plot methods [38]. The first-order derivative spectrum (dR/dλ) was also considered.
Morphology and size distributions were examined by scanning electron microscopy (SEM). For this purpose, a Hitachi S-4700 Type II microscope (Hitachi, Tokyo, Japan) was used. A cold field emission source was operated in the range of 5–15 kV. The samples were fixed on carbon tapes mounted on an aluminum sample holder. Finally, the micrographs were analyzed with ImageJ software (1.53k, National Institutes of Health, Bethesda, MD, USA, 2021).
X-ray diffraction (XRD) was used to characterize the crystalline structure and the average size of the primary crystallites via the Scherrer equation [39,40]. The measurements were performed on a Rigaku Miniflex II diffractometer (Rigaku, Neu-Isenburg, Germany) equipped with a graphite monochromator. The following parameters were applied: 20–60° (2θ°) region, 15 mA, 30 kV, λCuKα = 0.15418 nm, and 2° min−1 scan speed.
Infrared (IR) spectra of the samples were recorded using a Bruker Vertex 70 spectrometer (Bruker, Billerica, MA, USA) operated in the wavenumber range from 400 to 4000 cm−1 with a resolution of 4 cm−1. Samples were ground in the presence of KBr and pressed into thin pellets (thickness ~0.3 mm). Raman spectroscopy measurements were carried out with a Bruker Senterra II Raman spectrometer (Bruker, Billerica, MA, USA). For this purpose, a 785 nm laser was applied. The laser power was set to 1 mW, the integration time was 10 s, and the co-addition factor was 5.
The surface tension of the synthesis solution was measured with a 3.5 cm−3 LG-5050-100 stalagmometer (ATS Life Sciences, Wilmad LabGlass, Vineland, NJ, USA). Milli-Q water was used as a reference. The density of the liquids was determined with a pycnometer (10 cm−3) coupled with a thermometer. The following equation was applied for the calculations:
γ = γ w × ρ × n w   ρ w × n
where γ and γw are surface tension values (N m−1), n and nw are the numbers of liquid drops counted during the measurement, ρ and ρw are density values (g cm−3), and w is short for water.
Photoluminescence measurements were carried out at room temperature using a Jasco LP-6500 spectrometer (Jasco, Tokyo, Japan) equipped with a Xenon lamp as excitation source. The spectra were recorded using the following parameters: 1 nm spectral resolution, 3 nm excitation and emission bandwidths 200–900 nm range, and fixed excitation wavelengths (365 and 435 nm).

3.4. Assessment of Photocatalytic Efficiency Using RhB and IBP as Model Pollutants

The photocatalytic activity of the samples was evaluated by the degradation of RhB and IBP aqueous solutions. The parameters for each degradation test were the following: csuspension = 1 g L−1, constant airflow (to provide dissolved oxygen), continuous stirring, and constant temperature (25 °C). The photoreactor system consisted of either 4 × 24 W for visible irradiation (λ > 400 nm) or 6 × 6 W black light lamps for UV irradiation (λmax ≈ 365 nm). Irradiation time was 1 h in all cases. Photocatalyst suspensions were placed into a double-walled glass reactor surrounded by a thermostatic jacket. The temperature was set to 25 °C, and during the visible light experiments, 1 M sodium nitrite solution was recirculated to absorb UV photons. The suspensions were stirred for 10 min in the dark to reach adsorption–desorption equilibrium. The experiments were performed as follows: 1.5 mL of sample was taken every 10 min in the first hour, then every 20 min in the second hour. The initial concentrations of the model pollutants were C0,RhB = 0.1 mM or C0,IBP = 0.1 mM. Then, the samples were centrifuged for 180 s at a rotational speed of 13,400 revolutions per minute and filtered with a Filtratech 0.25 µm syringe filter. The concentrations of RhB and IBP were measured with a JASCO V-650 spectrophotometer (Jasco, Tokyo, Japan). The detection wavelengths were 554 nm for RhB and 222 nm for IBP.

4. Conclusions

Fine-tuning the concentration of a shape-tailoring agent (urea) during the synthesis of BiOBr might have various effects on the final product. Contrary to expectations, the morphology did not change significantly with the concentration of urea. Minor changes were observed in the primary particle sizes, hierarchical crystal size distributions, and morphology. Based on infrared spectroscopy measurements, urea residues remained on the surface of particles, emphasizing the size-tuning effect. Moreover, Bi-based complexes and urea degradation products were also observed as the intensity of the corresponding bands increased with the concentration of urea. The formation of these species was inferred to influence the band gap energy of the samples. Even though these changes were minor, the photocatalytic activity varied greatly depending on the applied irradiation (UV or visible) and model pollutant (ibuprofen or rhodamine B). Increasing band gap values correlated reasonably well with increasing photocatalytic activities. Higher quantum efficiency and suppressed charge carrier recombination were among the underlying causes of the findings. However, an overall activity-defining parameter cannot be clearly pointed out.

Supplementary Materials

The following supporting information can be downloaded at: https://www.mdpi.com/article/10.3390/catal13030616/s1, Figure S1: Correlation between the urea ratio of the synthesis mixture and the efficiency of the photocatalysts for (a) rhodamine B and (b) ibuprofen degradation under UV and visible light. Figure S2: Degradation curves obtained during the photocatalytic oxidation of rhodamine B and ibuprofen by urea-modified BiOBr photocatalysts under UV and visible light irradiation. Figure S3: Photoluminescence spectra of various BiOBr samples under (a) UV (365 nm) and (b) visible light excitation (435 nm).

Author Contributions

V.M.: investigation, conceptualization, writing—original draft. Z.P.: conceptualization, supervision, writing—review and editing. E.B.: investigation. T.G.: conceptualization, writing—review and editing. G.V.: supervision, funding acquisition. K.H.: supervision, funding acquisition. All authors have read and agreed to the published version of the manuscript.

Funding

This study was financed by the 2019-2.1.13-TÉT_IN-2020-00015 and the Indo-Hungarian TÉT (TÉT_15_IN-1–2016–0013) projects. T. Gyulavári is grateful for the financial support of the NKFI-PD-138248 project. KH thanks the financial support of the Hungarian National Research, Development and Innovation Office—NKFIH (SNN_143949).

Data Availability Statement

Data are contained within the article or Supplementary Material.

Conflicts of Interest

The authors declare no conflict of interest.

References

  1. Andreozzi, R. Advanced oxidation processes (AOP) for water purification and recovery. Catal. Today 1999, 53, 51–59. [Google Scholar] [CrossRef]
  2. Liu, D.; Li, H.; Gao, R.; Zhao, Q.; Yang, Z.; Gao, X.; Wang, Z.; Zhang, F.; Wu, W. Enhanced visible light photoelectrocatalytic degradation of tetracycline hydrochloride by I and P co-doped TiO2 photoelectrode. J. Hazard. Mater. 2021, 406, 124309. [Google Scholar] [CrossRef]
  3. Liu, D.; Li, C.; Zhao, C.; Zhao, Q.; Niu, T.; Pan, L.; Xu, P.; Zhang, F.; Wu, W.; Ni, T. Facile synthesis of three-dimensional hollow porous carbon doped polymeric carbon nitride with highly efficient photocatalytic performance. Chem. Eng. J. 2022, 438, 135623. [Google Scholar] [CrossRef]
  4. Zhao, L.; Zhang, X.; Fan, C.; Liang, Z.; Han, P. First-principles study on the structural, electronic and optical properties of BiOX (X=Cl, Br, I) crystals. Phys. B Condens. Matter 2012, 407, 3364–3370. [Google Scholar] [CrossRef]
  5. Li, H.; Qin, F.; Yang, Z.; Cui, X.; Wang, J.; Zhang, L. New Reaction Pathway Induced by Plasmon for Selective Benzyl Alcohol Oxidation on BiOCl Possessing Oxygen Vacancies. J. Am. Chem. Soc. 2017, 139, 3513–3521. [Google Scholar] [CrossRef] [PubMed]
  6. Xiao, X.; Jiang, J.; Zhang, L. Selective oxidation of benzyl alcohol into benzaldehyde over semiconductors under visible light: The case of Bi12O17Cl2 nanobelts. Appl. Catal. B Environ. 2013, 142–143, 487–493. [Google Scholar] [CrossRef]
  7. Cao, J.; Xu, B.; Lin, H.; Luo, B.; Chen, S. Chemical etching preparation of BiOI/BiOBr heterostructures with enhanced photocatalytic properties for organic dye removal. Chem. Eng. J. 2012, 185–186, 91–99. [Google Scholar] [CrossRef]
  8. Jiang, Z.; Yang, F.; Yang, G.; Kong, L.; Jones, M.O.; Xiao, T.; Edwards, P.P. The hydrothermal synthesis of BiOBr flakes for visible-light-responsive photocatalytic degradation of methyl orange. J. Photochem. Photobiol. A Chem. 2010, 212, 8–13. [Google Scholar] [CrossRef]
  9. Huo, Y.; Zhang, J.; Miao, M.; Jin, Y. Solvothermal synthesis of flower-like BiOBr microspheres with highly visible-light photocatalytic performances. Appl. Catal. B Environ. 2012, 111–112, 334–341. [Google Scholar] [CrossRef]
  10. Mera, A.C.; Moreno, Y.; Contreras, D.; Escalona, N.; Meléndrez, M.F.; Mangalaraja, R.V.; Mansilla, H.D. Improvement of the BiOI photocatalytic activity optimizing the solvothermal synthesis. Solid State Sci. 2017, 63, 84–92. [Google Scholar] [CrossRef]
  11. Mao, D.; Ding, S.; Meng, L.; Dai, Y.; Sun, C.; Yang, S.; He, H. One-pot microemulsion-mediated synthesis of Bi-rich Bi4O5Br2 with controllable morphologies and excellent visible-light photocatalytic removal of pollutants. Appl. Catal. B Environ. 2017, 207, 153–165. [Google Scholar] [CrossRef]
  12. Li, R.; Ren, H.; Ma, W.; Hong, S.; Wu, L.; Huang, Y. Synthesis of BiOBr microspheres with ethanol as self-template and solvent with controllable morphology and photocatalytic activity. Catal. Commun. 2018, 106, 1–5. [Google Scholar] [CrossRef]
  13. Wang, H.-T.; Shi, M.-S.; Yang, H.-F.; Chang, N.; Zhang, H.; Liu, Y.-P.; Lu, M.-C.; Ao, D.; Chu, D.-Q. Template-free synthesis of nanosliced BiOBr hollow microspheres with high surface area and efficient photocatalytic activity. Mater. Lett. 2018, 222, 164–167. [Google Scholar] [CrossRef]
  14. Arthur, R.; Ahern, J.; Patterson, H. Application of BiOX Photocatalysts in Remediation of Persistent Organic Pollutants. Catalysts 2018, 8, 604. [Google Scholar] [CrossRef] [Green Version]
  15. Mi, Y.; Li, H.; Zhang, Y.; Du, N.; Hou, W. Synthesis and photocatalytic activity of BiOBr nanosheets with tunable crystal facets and sizes. Catal. Sci. Technol. 2018, 8, 2588–2597. [Google Scholar] [CrossRef]
  16. Jia, M.; Hu, X.; Wang, S.; Huang, Y.; Song, L. Photocatalytic properties of hierarchical BiOXs obtained via an ethanol-assisted solvothermal process. J. Environ. Sci. 2015, 35, 172–180. [Google Scholar] [CrossRef] [PubMed]
  17. Yang, Y.; Geng, L.; Guo, Y.; Guo, Y. Morphology evolution and excellent visible-light photocatalytic activity of BiOBr hollow microspheres. J. Chem. Technol. Biotechnol. 2017, 92, 1236–1247. [Google Scholar] [CrossRef]
  18. Garg, S.; Yadav, M.; Chandra, A.; Sapra, S.; Gahlawat, S.; Ingole, P.P.; Todea, M.; Bardos, E.; Pap, Z.; Hernadi, K. Facile Green Synthesis of BiOBr Nanostructures with Superior Visible-Light-Driven Photocatalytic Activity. Materials 2018, 11, 1273. [Google Scholar] [CrossRef] [Green Version]
  19. Kása, Z.; Baia, L.; Magyari, K.; Hernádi, K.; Pap, Z. Innovative visualization of the effects of crystal morphology on semiconductor photocatalysts. Tuning the Hückel polarity of the shape-tailoring agents: The case of Bi2WO6. Cryst. Eng. Comm. 2019, 21, 1267–1278. [Google Scholar] [CrossRef]
  20. Tadic, M.; Trpkov, D.; Kopanja, L.; Vojnovic, S.; Panjan, M. Hydrothermal synthesis of hematite (α-Fe2O3) nanoparticle forms: Synthesis conditions, structure, particle shape analysis, cytotoxicity and magnetic properties. J. Alloys Compd. 2019, 792, 599–609. [Google Scholar] [CrossRef]
  21. Wolcott, A.; Kuykendall, T.R.; Chen, W.; Chen, S.; Zhang, J.Z. Synthesis and characterization of ultrathin WO3 nanodisks utilizing long-chain poly(ethylene glycol). J. Phys. Chem. B 2006, 110, 25288–25296. [Google Scholar] [CrossRef] [Green Version]
  22. Zhang, Q.; Zang, B.; Wang, S. Surfactant-free synthesis of porous Au by a urea complex. RSC Adv. 2019, 9, 23081–23085. [Google Scholar] [CrossRef] [Green Version]
  23. Wang, W.; Zhao, X.; Shi, H.; Liu, L.; Deng, H.; Xu, Z.; Tian, F.; Miao, X. Shape inducer-free polygonal angle platinum nanoparticles in graphene oxide as oxygen reduction catalyst derived from gamma irradiation. J. Colloid Interface Sci. 2020, 575, 1–15. [Google Scholar] [CrossRef] [PubMed]
  24. Shi, X.; Wang, P.; Li, W.; Bai, Y.; Xie, H.; Zhou, Y.; Ye, L. Change in photocatalytic NO removal mechanisms of ultrathin BiOBr/BiOI via NO3– adsorption. Appl. Catal. B Environ. 2019, 243, 322–329. [Google Scholar] [CrossRef]
  25. Qin, X.; Zhou, M.; Zong, B.; Guo, J.; Gong, J.; Wang, L.; Liang, G. Urea-assisted hydrothermal synthesis of a hollow hierarchical LiNi0.5Mn1.5O4 cathode material with tunable morphology characteristics. RSC Adv. 2018, 8, 30087–30097. [Google Scholar] [CrossRef] [Green Version]
  26. Zhang, X.; Wang, C.Y.; Wang, L.W.; Huang, G.X.; Wang, W.K.; Yu, H.Q. Fabrication of BiOBrxI(1-x) photocatalysts with tunable visible light catalytic activity by modulating band structures. Sci. Rep. 2016, 6, 22800. [Google Scholar] [CrossRef] [Green Version]
  27. Jiang, T.; Shang, C.; Meng, Q.; Jin, M.; Liao, H.; Li, M.; Chen, Z.; Yuan, M.; Wang, X.; Zhou, G. The Ternary Heterostructures of BiOBr/Ultrathin gC3N4/Black Phosphorous Quantum Dot Composites for Photodegradation of Tetracycline. Polymers 2018, 10, 1118. [Google Scholar] [CrossRef] [Green Version]
  28. Koczkur, K.M.; Mourdikoudis, S.; Polavarapu, L.; Skrabalak, S.E. Polyvinylpyrrolidone (PVP) in nanoparticle synthesis. Dalton Trans. 2015, 44, 17883–17905. [Google Scholar] [CrossRef] [PubMed] [Green Version]
  29. Zhao, C.; Liang, Y.; Li, W.; Chen, X.; Tian, Y.; Yin, D.; Zhang, Q. 3D BiOBr/BiOCl heterostructure microspheres with enhanced photocatalytic activity. J. Mater. Sci. Mater. Electron. 2019, 31, 1868–1878. [Google Scholar] [CrossRef]
  30. Stuart, H.B. Infrared Spectroscopy: Fundamentals and Applications; Wiley: New York, NY, USA, 2004. [Google Scholar]
  31. Morsali, A. Syntheses and Characterization of Two New Mixed-Ligand Bismuth(III) Complexes, Crystal Structure of [Bi(phen)2(NO3)(NCS)2(MeOH)]. Z. Naturforsch. B 2005, 60, 389–392. [Google Scholar] [CrossRef]
  32. Timon, V.; Mate, B.; Herrero, V.J.; Tanarro, I. Infrared spectra of amorphous and crystalline urea ices. Phys. Chem. Chem. Phys. 2021, 23, 22344–22351. [Google Scholar] [CrossRef] [PubMed]
  33. Pap, Z.; Karácsonyi, É.; Cegléd, Z.; Dombi, A.; Danciu, V.; Popescu, I.C.; Baia, L.; Oszkó, A.; Mogyorósi, K. Dynamic changes on the surface during the calcination of rapid heat treated TiO2 photocatalysts. Appl. Catal. B Environ. 2012, 111–112, 595–604. [Google Scholar] [CrossRef]
  34. Zhu, S.; Li, T.; Cai, W.-B.; Shao, M. CO2 Electrochemical Reduction As Probed through Infrared Spectroscopy. ACS Energy Lett. 2019, 4, 682–689. [Google Scholar] [CrossRef]
  35. Davies, J.E.D. Solid state vibrational spectroscopy—III[1] The infrared and raman spectra of the bismuth(III) oxide halides. J. Inorg. Nucl. Chem. 1973, 35, 1531–1534. [Google Scholar] [CrossRef]
  36. Sharma, N.; Pap, Z.; Garg, S.; Hernádi, K. Hydrothermal synthesis of BiOBr and BiOBr/CNT composites, their photocatalytic activity and the importance of early Bi6O6(OH)3(NO3)3·1.5H2O formation. Appl. Surf. Sci. 2019, 495, 143536. [Google Scholar] [CrossRef] [Green Version]
  37. Veréb, G.; Gyulavári, T.; Virág, O.; Alapi, T.; Hernadi, K.; Pap, Z. Wavelength Dependence of the Photocatalytic Performance of Pure and Doped TiO2 Photocatalysts—A Reflection on the Importance of UV Excitability. Catalysts 2022, 12, 1492. [Google Scholar] [CrossRef]
  38. Flak, D.; Braun, A.; Mun, B.S.; Park, J.B.; Parlinska-Wojtan, M.; Graule, T.; Rekas, M. Spectroscopic assessment of the role of hydrogen in surface defects, in the electronic structure and transport properties of TiO2, ZnO and SnO2 nanoparticles. Phys. Chem. Chem. Phys. 2013, 15, 1417–1430. [Google Scholar] [CrossRef]
  39. Patterson, A.L. The scherrer formula for X-ray particle size determination. Phys. Rev. 1939, 56, 978. [Google Scholar] [CrossRef]
  40. Spurr, R.A.; Myers, H. Quantitative Analysis of Anatase-Rutile Mixtures with an X-ray Diffractometer. Anal. Chem. 1957, 29, 760–762. [Google Scholar] [CrossRef]
Figure 1. XRD patterns of BiOBr samples prepared at various urea ratios.
Catalysts 13 00616 g001
Figure 2. SEM micrographs of BiOBr samples obtained at different urea ratios and their corresponding size distribution histograms.
Catalysts 13 00616 g002
Figure 3. (a) Diffuse reflectance spectra of the investigated BiOBr photocatalysts after Kubelka–Munk transformation. (b) Dependence of the band gap energy on the urea ratio applied during the synthesis.
Catalysts 13 00616 g003
Figure 4. Changes in the surface tension values with the addition of urea (a) in the presence and (b) absence of KBr.
Catalysts 13 00616 g004
Figure 5. (a) Infrared and (b) Raman spectra of the investigated BiOBr photocatalysts, showing the presence of organic residues on their surface.
Catalysts 13 00616 g005
Figure 6. Correlation between the band gap and degradation efficiency of the samples (the yellow area marks the correlated points, while the red one is the exception for the trend).
Catalysts 13 00616 g006
Table 1. Hierarchical, primary crystallite size, and band gap energy of BiOBr photocatalysts.
Sample NameHierarchical Particle Size (µm)Primary Crystallite Size (nm)Band Gap (eV)
BiOBr_ref0.50–5.5012.02.90
BiOBr_U_1:0.60.39–2.8025.32.80
BiOBr_U_1:1.00.20–2.2029.82.71
BiOBr_U_1:2.00.39–2.0029.32.77
BiOBr_U_1:2.50.19–1.7928.82.82
BiOBr_U_1:3.00.39–2.0029.52.84
BiOBr_U_1:5.00.01–3.5029.72.83
Table 2. Surface tension values calculated in the presence of additives (urea and KBr) in ethylene glycol, using water as a reference.
AdditivesSurface Tension (N m−1)
EG0.05372
EG + U 1:0.6-
EG + U 1:1.00.0546
EG + U 1:2.00.0524
EG + U 1:2.50.0556
EG + U 1:3.00.0528
EG + U 1:5.00.0488
EG + U 1:0.6 + KBr0.0542
EG + U 1:1.0 + KBr0.0556
EG + U 1:2.0 + KBr0.0518
EG + U 1:2.5 + KBr0.0528
EG + U 1:3.0 + KBr0.0502
EG + U 1:5.0 + KBr0.0519
Table 3. Photocatalytic activity of the obtained samples under UV (λmax ≈ 365 nm) and visible light (λ > 400 nm) irradiations for the degradation of rhodamine B and ibuprofen.
Sample NameRhodamine B ConversionIbuprofen Conversion
UV
BiOBr_ref34.8%-
BiOBr_U_1:0.686.0%90.7%
BiOBr_U_1:1.038.0%91.4%
BiOBr_U_1:2.024.1%82.3%
BiOBr_U_1:2.536.8%79.8%
BiOBr_U_1:3.052.1%74.0%
BiOBr_U_1:5.062.7%78.0%
Visible
BiOBr_U_1:0.694.6%82.1%
BiOBr_U_1:1.092.7%83.3%
BiOBr_U_1:2.039.5%43.9%
BiOBr_U_1:2.562.4%64.9%
BiOBr_U_1:3.067.0%74.5%
BiOBr_U_1:5.088.9%77.8%
Disclaimer/Publisher’s Note: The statements, opinions and data contained in all publications are solely those of the individual author(s) and contributor(s) and not of MDPI and/or the editor(s). MDPI and/or the editor(s) disclaim responsibility for any injury to people or property resulting from any ideas, methods, instructions or products referred to in the content.

