Article

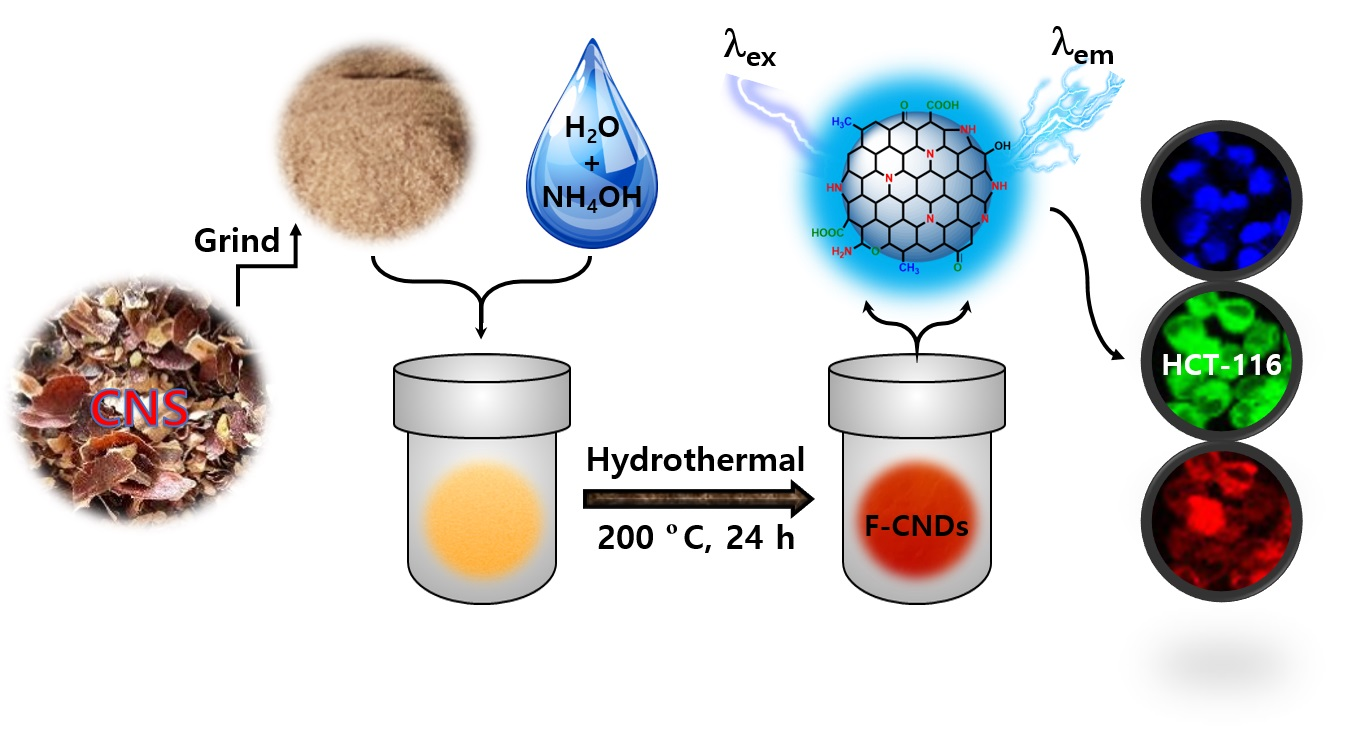
Eco-Friendly Synthesis of Functionalized Carbon Nanodots from Cashew Nut Skin Waste for Bioimaging

by
Somasundaram Chandra Kishore
1,†,
Suguna Perumal
2,†,
Raji Atchudan
3,*,†,
Thomas Nesakumar Jebakumar Immanuel Edison
4,†,
Ashok K. Sundramoorthy
5,†,
Muthulakshmi Alagan
6,
Sambasivam Sangaraju
7 and
Yong Rok Lee
3,*
1
Department of Biomedical Engineering, Saveetha School of Engineering, Saveetha Institute of Medical and Technical Sciences, Saveetha Nagar, Chennai 602105, Tamil Nadu, India
2
Department of Chemistry, Sejong University, Seoul 143747, Republic of Korea
3
School of Chemical Engineering, Yeungnam University, Gyeongsan 38541, Republic of Korea
4
Department of Chemistry, Sethu Institute of Technology, Virudhunagar District, Kariapatti 626115, Tamil Nadu, India
5
Department of Prosthodontics, Saveetha Institute of Medical and Technical Sciences, Saveetha Dental College and Hospitals, Poonamallee High Road, Velappanchavadi, Chennai 600077, Tamil Nadu, India
6
Department of Civil and Environmental Engineering, National Institute of Technical Teachers Training and Research, Chennai 600113, Tamil Nadu, India
7
National Water and Energy Center, United Arab Emirates University, Al Ain P.O. Box 15551, United Arab Emirates
*
Authors to whom correspondence should be addressed.
These authors contributed equally to this work.
Catalysts 2023, 13(3), 547; https://doi.org/10.3390/catal13030547
Submission received: 26 December 2022 / Revised: 8 March 2023 / Accepted: 8 March 2023 / Published: 9 March 2023

Abstract

:
In this study, Anacardium occidentale (A. occidentale) nut skin waste (cashew nut skin waste) was used as a raw material to synthesize functionalized carbon nanodots (F-CNDs). A. occidentale biomass-derived F-CNDs were synthesized at a low temperature (200 °C) using a facile, economical hydrothermal method and subjected to XRD, FESEM, TEM, HRTEM, XPS, Raman Spectroscopy, ATR-FTIR, and Ultraviolet-visible (UV–vis) absorption and fluorescence spectroscopy to determine their structures, chemical compositions, and optical properties. The analysis revealed that dispersed, hydrophilic F-CNDs had a mean diameter of 2.5 nm. XPS and ATR-FTIR showed F-CNDs had a crystalline core and an amorphous surface decorated with –NH2, –COOH, and C=O. In addition, F-CNDs had a quantum yield of 15.5% and exhibited fluorescence with maximum emission at 406 nm when excited at 340 nm. Human colon cancer (HCT-116) cell assays showed that F-CNDs readily penetrated into the cells, had outstanding biocompatibility, high photostability, and minimal toxicity. An MTT assay showed that the viability of HCT-116 cells incubated for 24 h in the presence of F-CNDs (200 μg mL–1) exceeded 95%. Furthermore, when stimulated by filters of three different wavelengths (405, 488, and 555 nm) under a laser scanning confocal microscope, HCT-116 cells containing F-CNDs emitted blue, red, and green, respectively, which suggests F-CNDs might be useful in the biomedical field. Thus, we describe the production of a fluorescent nanoprobe from cashew nut waste potentially suitable for bioimaging applications.

Graphical Abstract

1. Introduction

Carbon nanodots (CNDs) [1], carbonized polymer dots [2], carbon quantum dots [3], graphene quantum dots [4], and other nanoscale carbon particles with dimensions of ~≤10 nm are all regarded as carbon dots (CDs) and are considered a new class of fluorescent carbon-based nanomaterials. Xu et al. accidentally discovered CDs in 2004 while purifying carbon nanotubes [5]. Ever since, a wide range of CDs with various chemical and optical properties have been produced using a number of different techniques. The characteristic features of CDs, which include tunable fluorescence emission [6], aqueous dispersibility [7], chemical inertness [8], biocompatibility [9], and ease of functionalization [10], make them powerful alternative semiconducting nanomaterials. Various biomedical utilities, such as nanoplatforms for biosensors [11], bioimaging [12], drug delivery vehicles [13], and gene transfer [14], are made possible by the ability of CDs to coexist with biological tissues without causing adverse effects. Because of their high fluorescence quantum yields, CDs are used as fluorescent probes in biological samples [15], and can be easily functionalized with biomolecules such as peptides or antibodies. In addition, they have a low photobleaching characteristic nature [16]. CDs are particularly useful for in vivo bioimaging and can be functionalized for targeted drug delivery. Worldwide, one in every six deaths is caused by cancer, which is the second most frequent cause of death. Uncontrolled cell growth is a main characteristic of cancer. For the effective treatment of cancer, early diagnosis is essential. Early cancer detection can help choose the best course of treatment and increase patient survival. Important information about a disease’s course and a patient’s response to therapy is provided by a diagnosis, which aids in modifying the patient’s treatment plan while they are undergoing it [17]. The intriguing physicochemical and optical characteristics of CDs have great potential in the diagnosis and treatment of cancer. Furthermore, CDs can increase the efficacy and delivery of molecules because they are readily absorbed by cells, but more research is required to determine their safety and efficacy for in vivo applications.
Regardless of the synthetic process used to produce nanomaterials, the production of CDs can be categorized as top-down, bottom-up, or physical or chemical. In general, physical techniques involving arc discharge [18], laser ablation [19], and electrochemical etching [20] are hazardous to the environment and difficult to manage. Hydrothermal (HT) [21], ultrasonic [22], microwave-assisted [23], thermal decomposition [24], and electrochemical [25] processes are examples of chemical methods. The HT approach is usually used to produce CDs because it uses mild chemicals and is inexpensive. This approach has been widely employed to prepare a variety of carbon compounds because HT synthesis has negligible toxicological impact. Furthermore, HT conditions can cause reagent solubility, enhance chemical and physical reactions, and enable carbonaceous structures to develop. Conventionally, developing materials with high carbon contents, such as carbon nanotubes, mesoporous carbon, graphene, and graphitic carbon compounds, requires high temperatures (300–800 °C), whereas those produced by dehydration and polymerization are produced at lower temperatures (<300 °C), and often possess various surface functional groups after carbonization. In general, CNDs can be functionalized and doped with heteroatoms to enhance their fluorescence characteristics and quantum yields. Particularly, the HT method has become more popular for the synthesis of functionalized CNDs (F-CNDs) because it is a one-step procedure without additional oxidation and passivation, has gentle reaction parameters, and requires inexpensive equipment.
CDs are noted for their photophysical characteristics, particularly their fluorescence properties [26], which, like structure, morphology, and composition, are sensitive to the precursors and preparation techniques used [27]. In general, CDs are composed of crystalline carbon cores and decorated with carboxylic acid, alcohol, and amine functional groups [28]. Several biosources, such as lemon juice [29], leaf extract [30], grape juice [31], honey [32], hair [33], carrot juice [34], garlic [35], egg [36], betel leaf [37], and food waste [38] are used as CD precursors.
It is generally known that the transitions between intrinsic states cannot fully account for CD optical properties. The emission of many CDs, however, appears to be primarily influenced by surface-related extrinsic contributions, such as emissions from surface defects and surface charge traps. A proper passivation procedure is essential to produce highly fluorescent CDs, and solvents and pH significantly impact CD fluorescence. Research goals in the engineering area include tuning the photophysical and electrochemical properties of CDs by altering ground and excited state properties [39] and modifying the form, chirality, composition, size, and surface chemistry of CDs [40]. In the present study, we sought to develop non-toxic, <10 nm sized CDs compatible with aqueous environments using Anacardium occidentale (A. occidentale) nut skin waste as a precursor for the synthesis of F-CNDs.
Cashew is the popular name for A. occidentale (AO), a member of the Anacardiaceae family, and it is commonly grown in tropical areas of India, Brazil, and Africa. An essential by-product generated during the processing of cashews is the testa (skin) of the cashew kernel. The resulting testa is a potential candidate for commercial exploitation given that cashew kernels are consumed worldwide on an annual basis in excess of 1,000,000 tonnes. It is said to be an excellent source of hydrolyzable tannins. The cashew nut is a significant cash crop worldwide. India produces and exports the most cashew kernels worldwide, making up nearly 50% of all exports. A brown skin, known as testa, completely envelops cashew nuts, and this skin is one of the best sources of hydrolyzable tannins such as catechin, epicatechin, and epigallocatechin [41,42]. The seed testa has the greatest proportion of phenolic compounds that serve as a barrier of protection for the cotyledon in seeds. Furthermore, it also contains high levels of three phenolic acids, viz. syringic, gallic, and p-coumaric acids [43], which confer significant antioxidant activity [44]. In order to understand the possible mechanisms behind the formation of F-CNDs, it is presumed that the testa of cashew nuts consists of hydrolyzable tannins, phenolic acids, and various other molecules. These constituents undergo the process of dehydration, polymerization, and carbonization to form F-CNDs. We investigated AO biomass-derived F-CNDs synthesized using the HT approach at a lower temperature of 200 °C. The best quality F-CNDs with significant fluorescence properties were subjected to cellular imaging of human colon cancer cells.

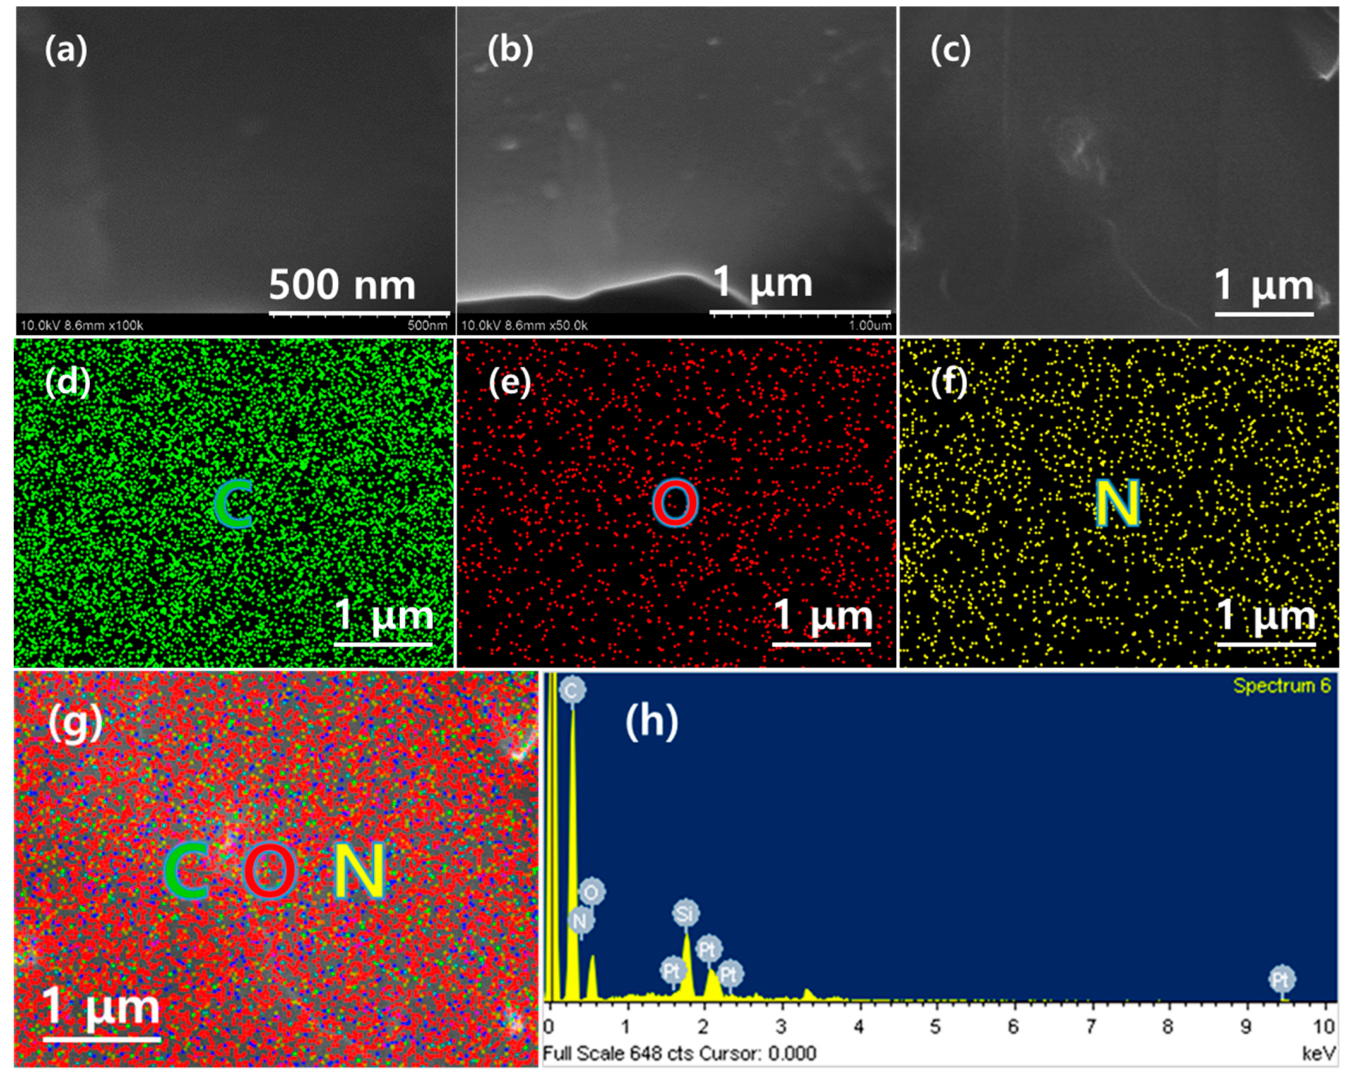
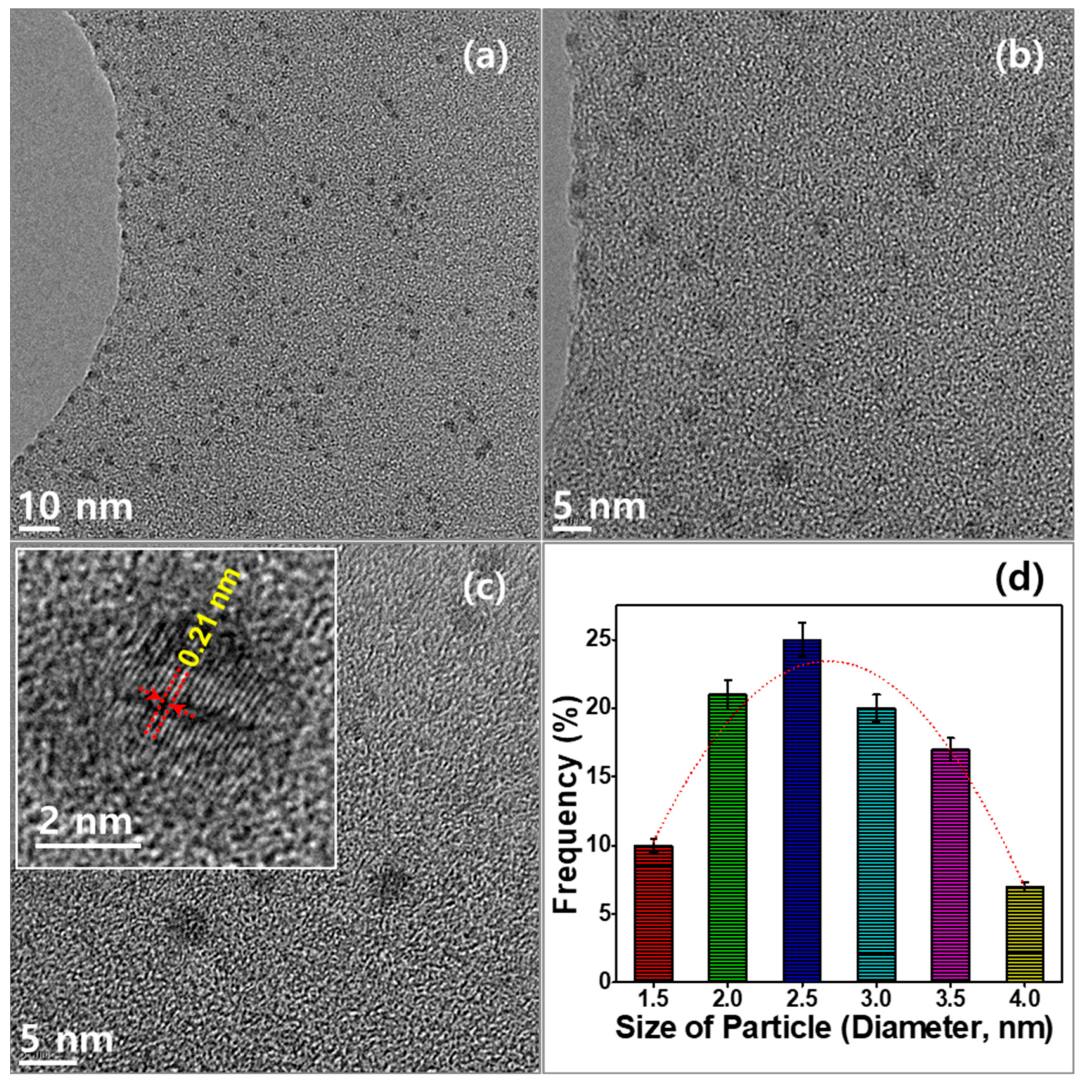
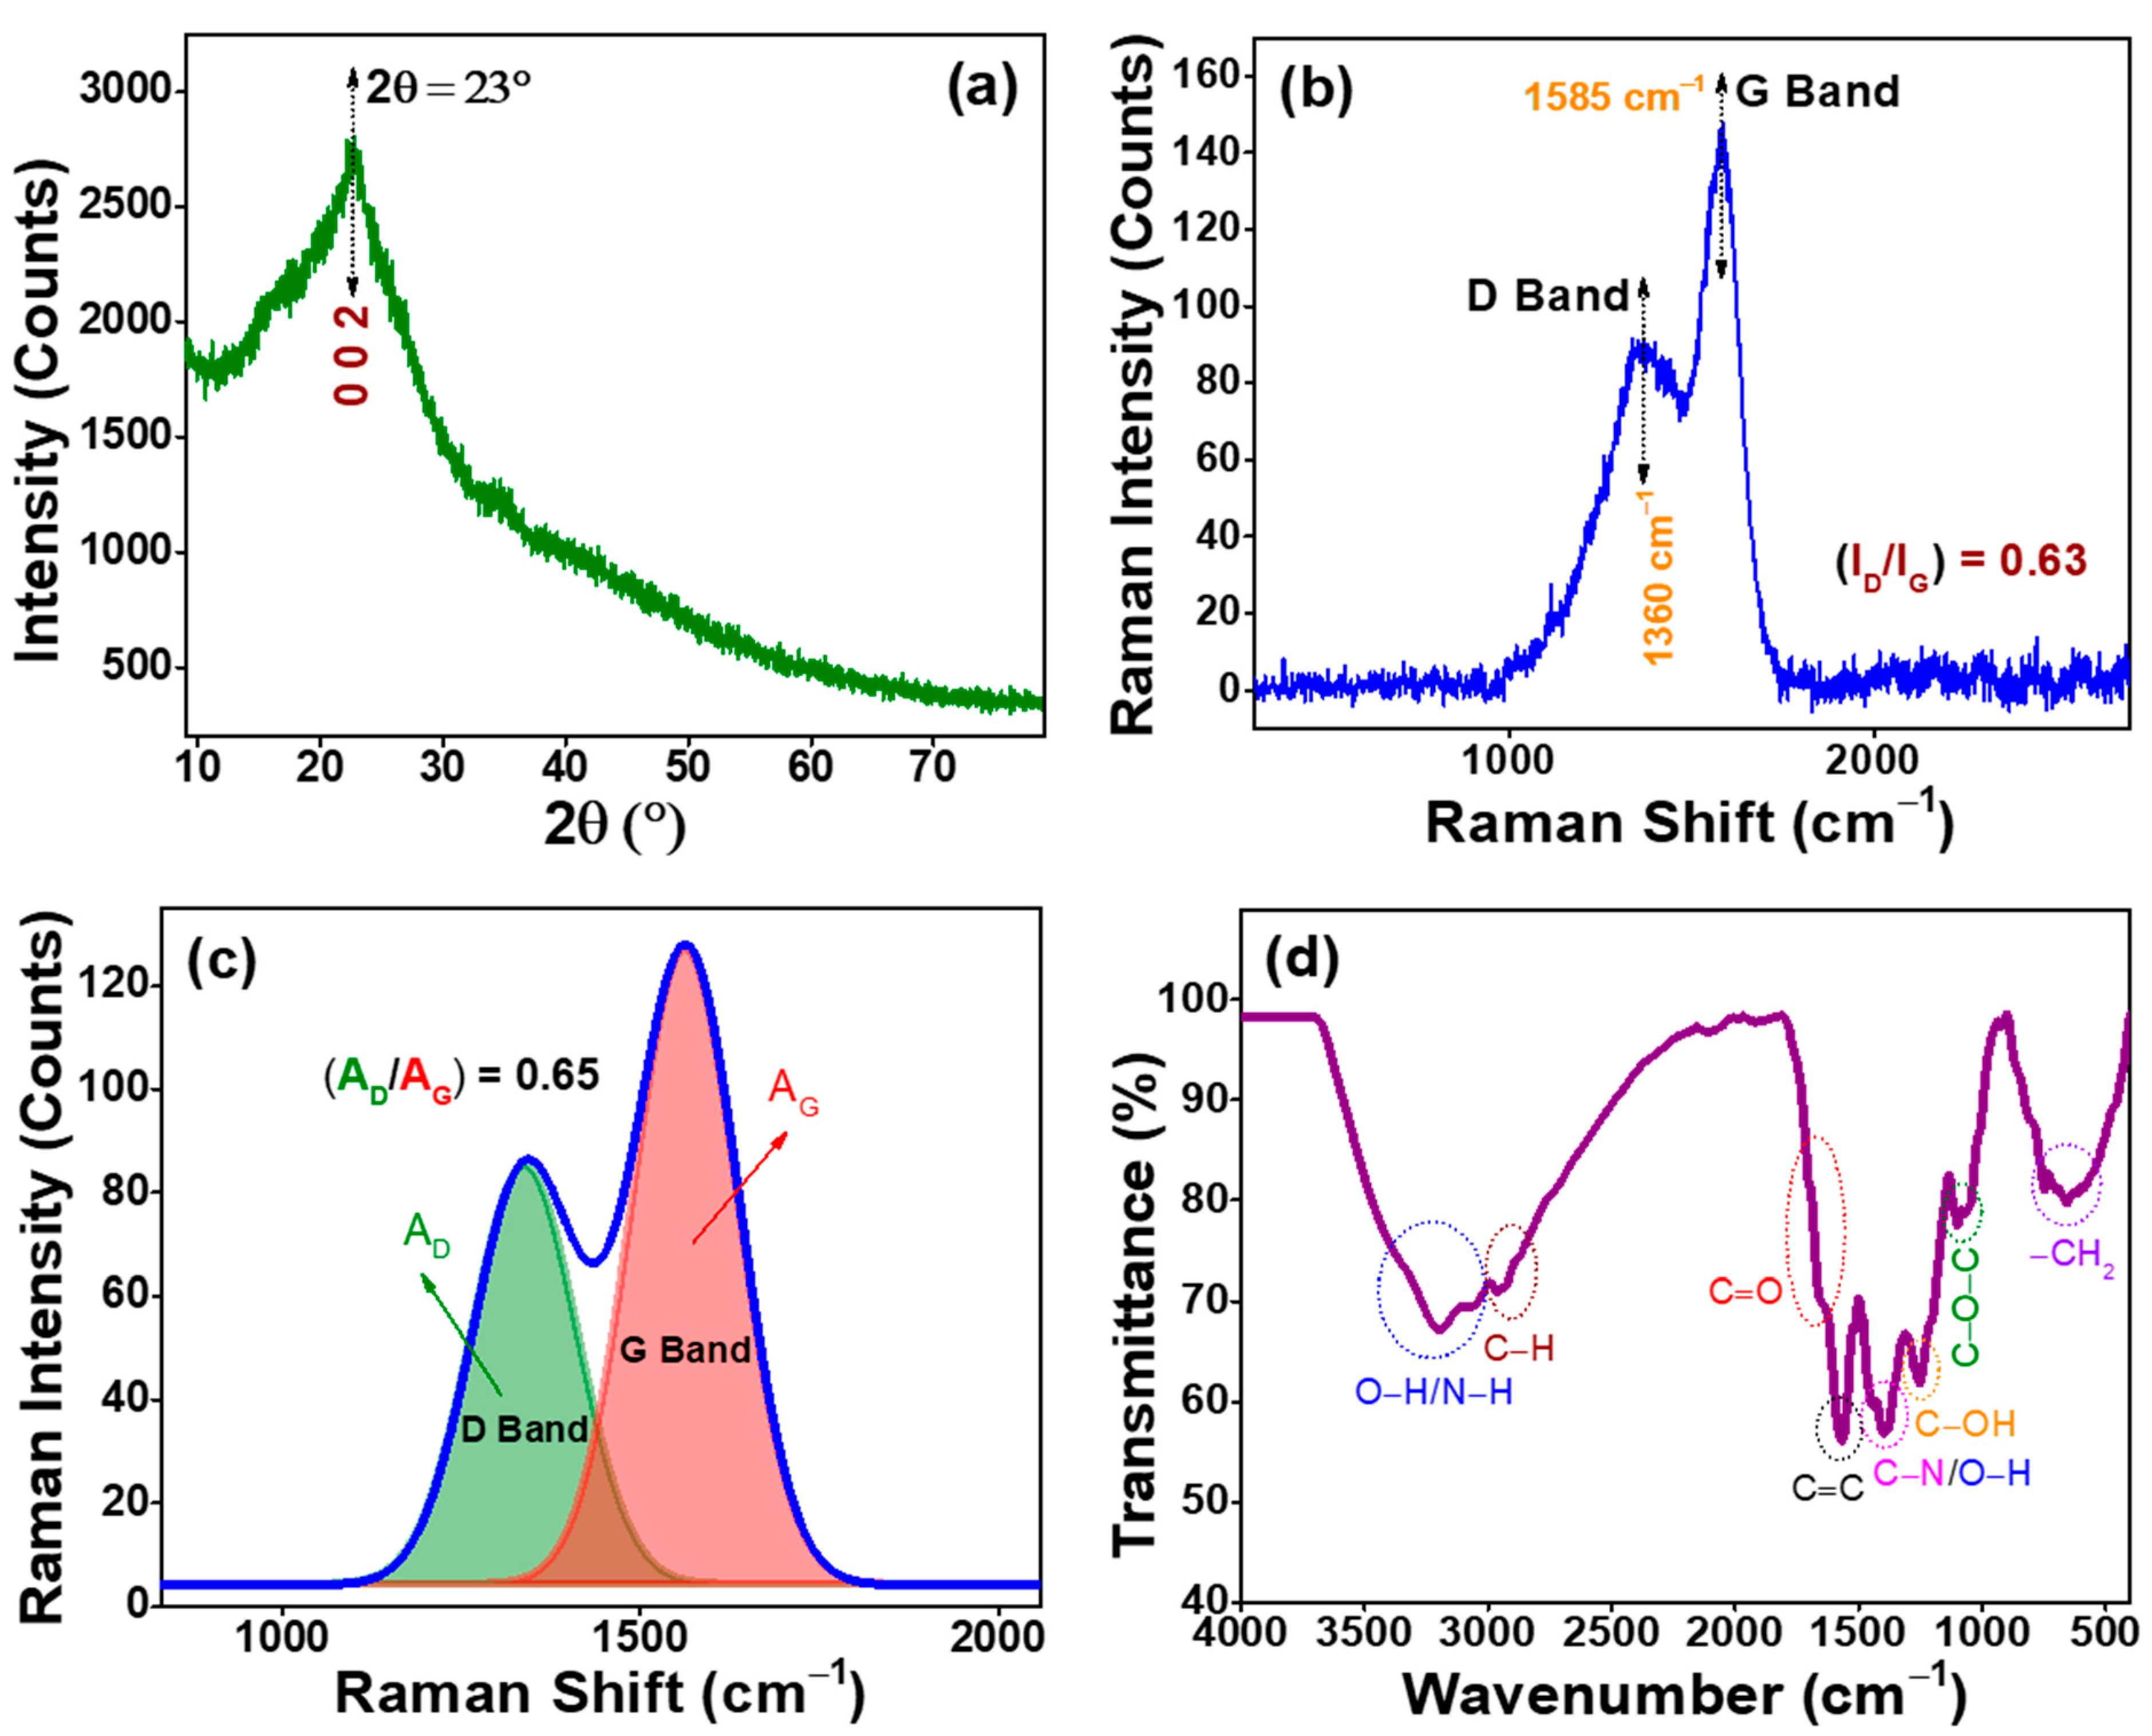
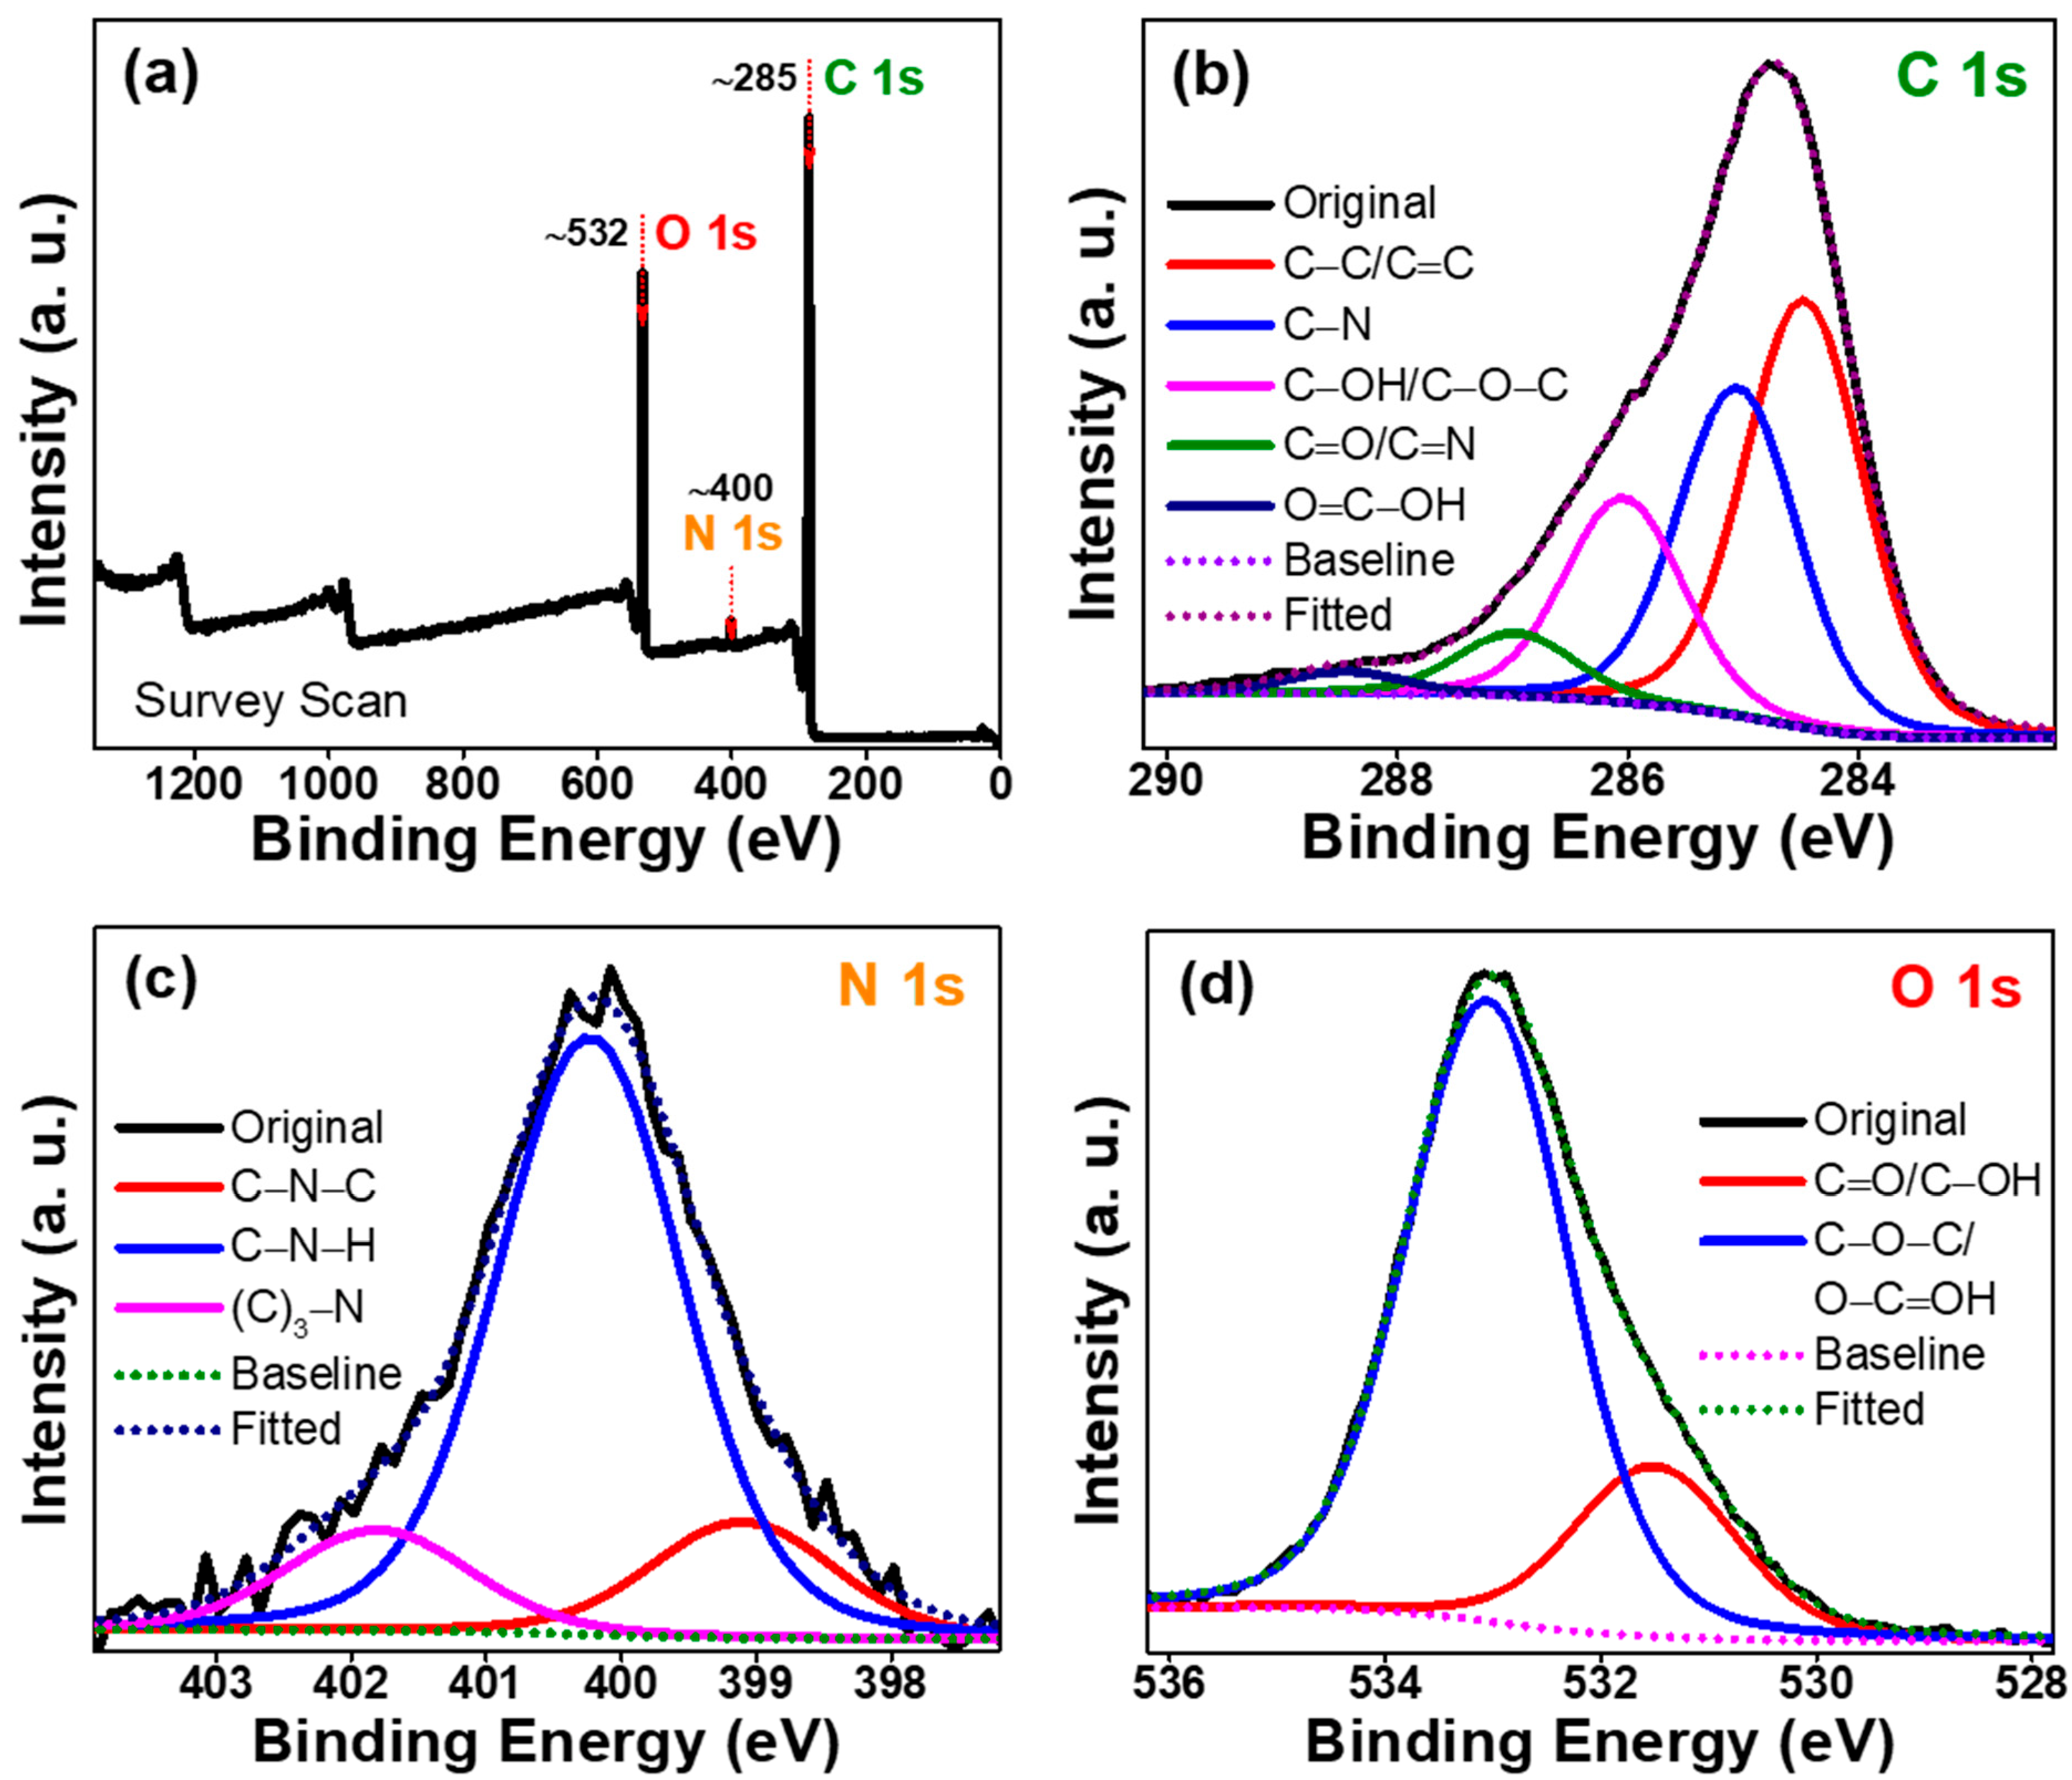
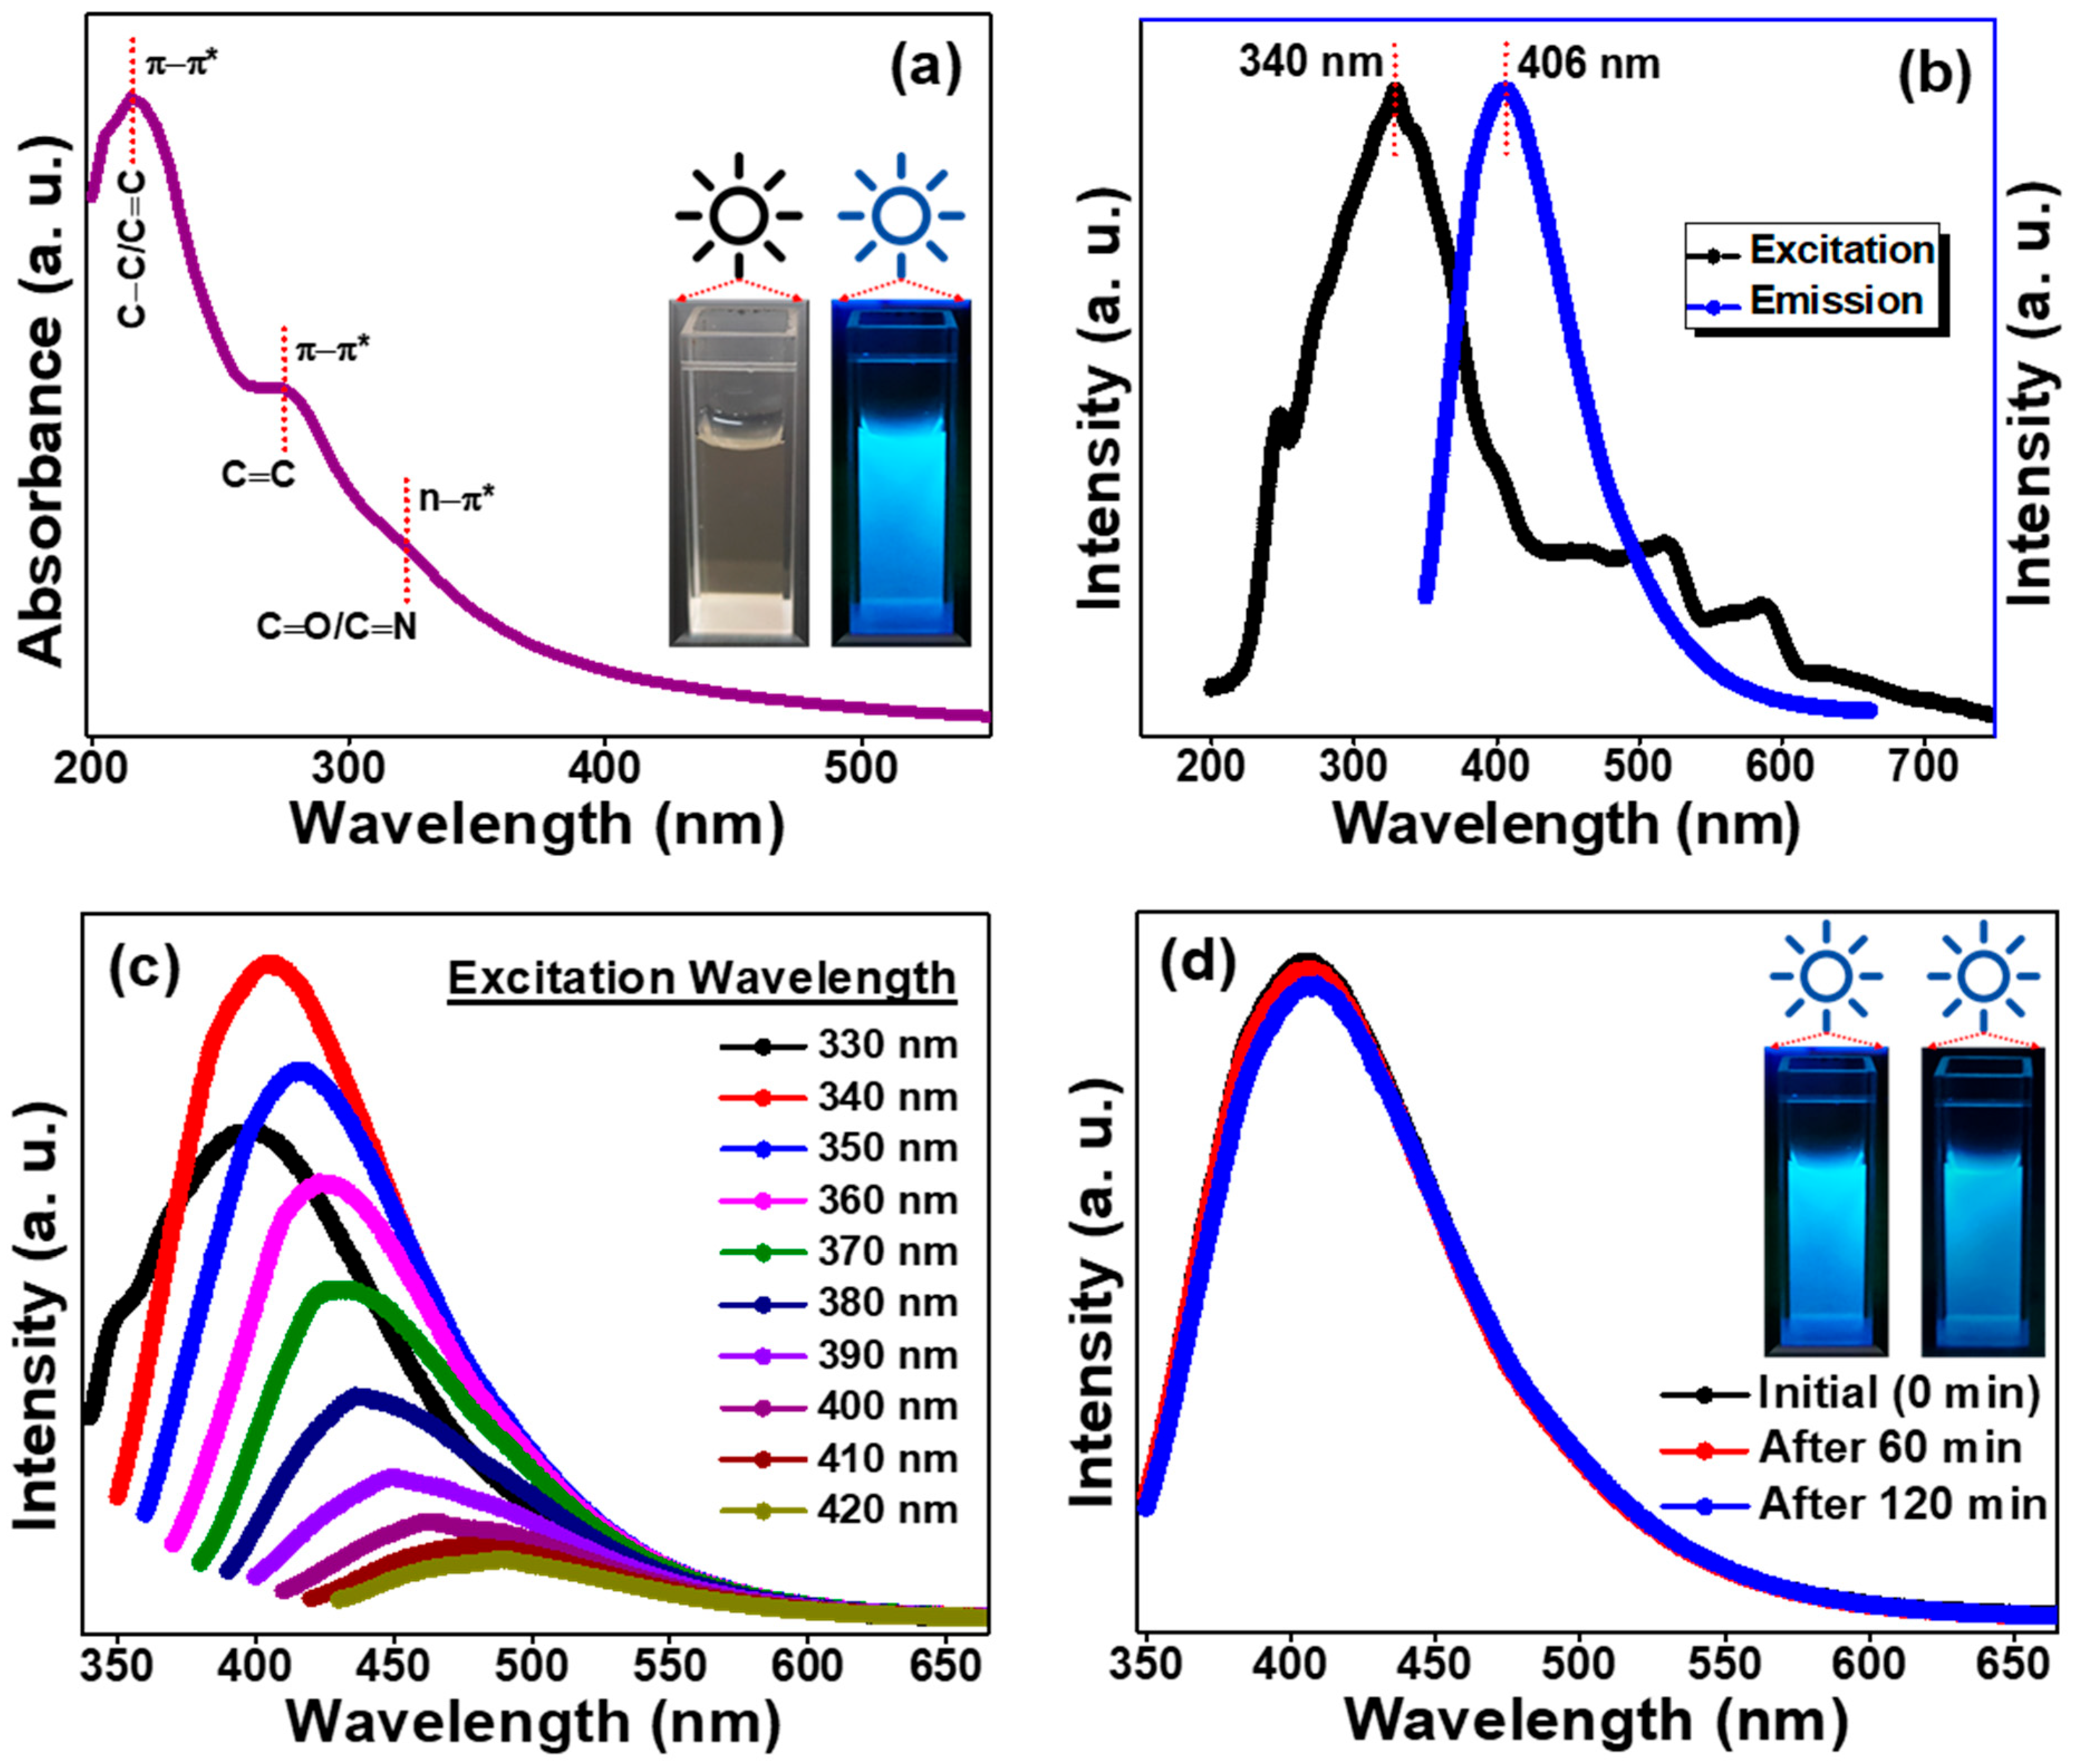
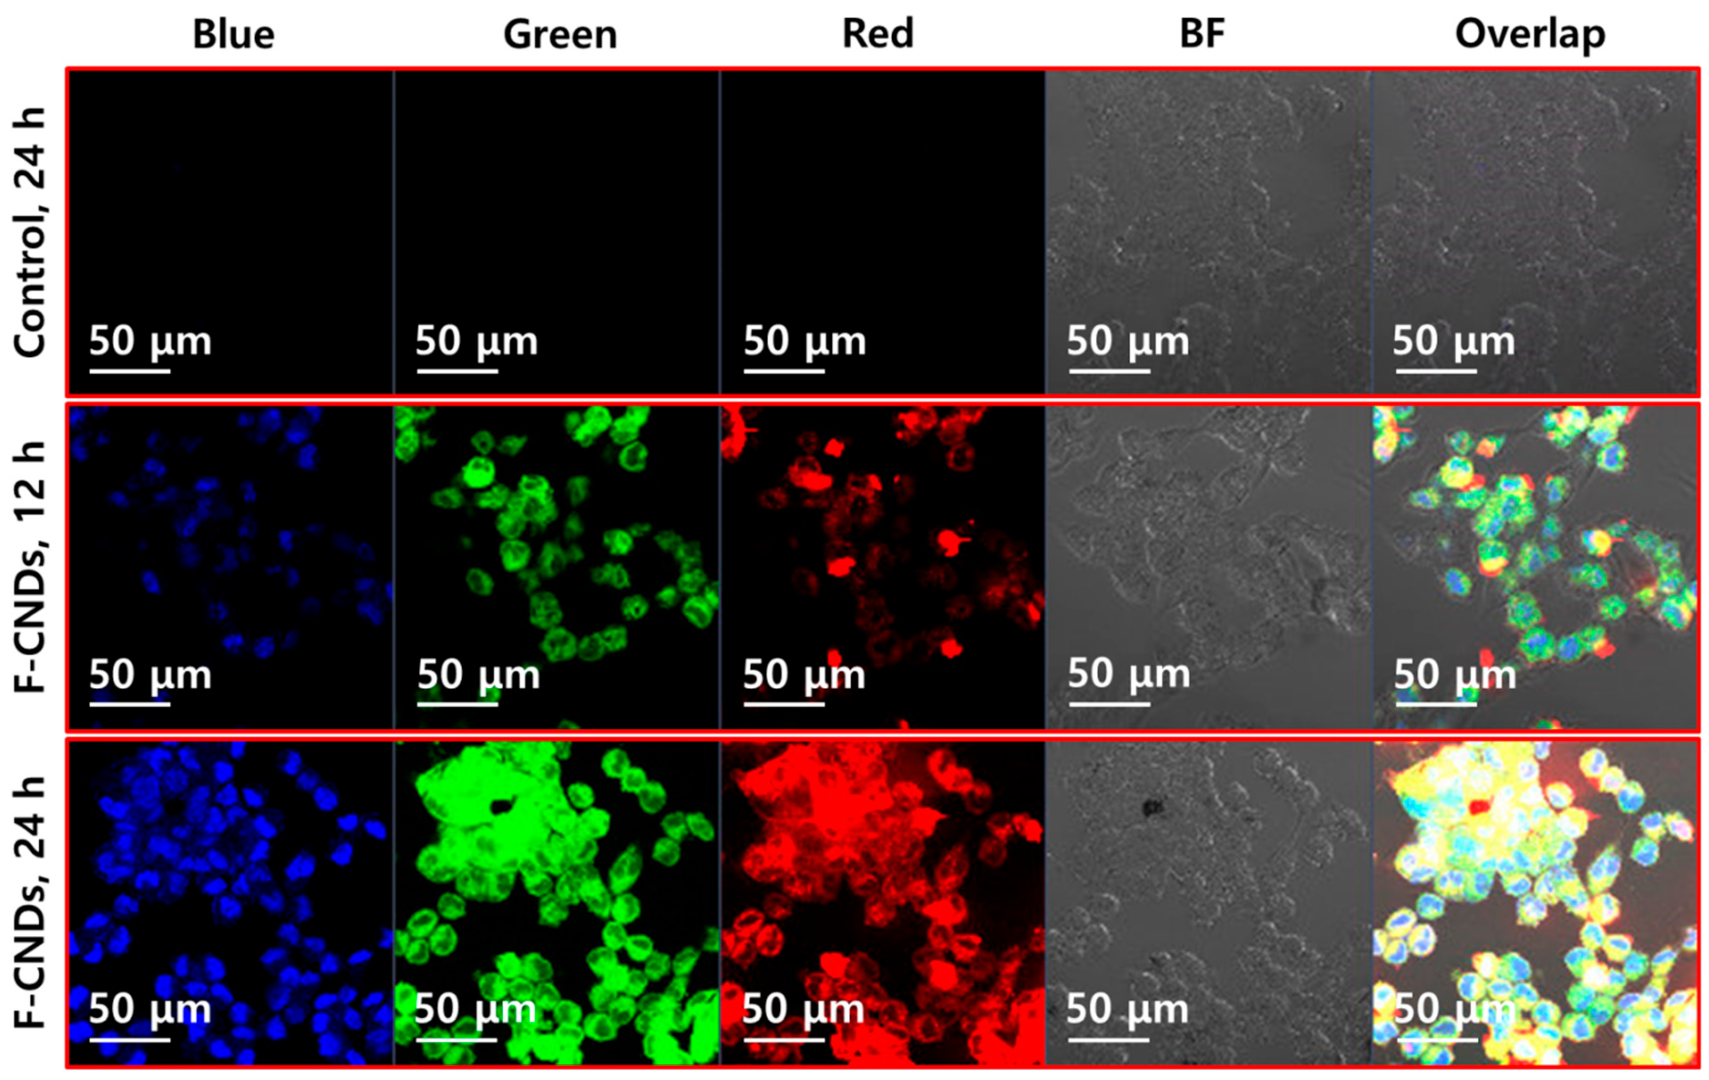
2. Results and Discussion

FESEM images of F-CNDs at different magnifications are provided in Figure 1a–c. F-CNDs formed a thin layer over the surface of the sample holder. EDX revealed the elements present on the surface of F-CNDs (Figure 1d–g). Elements were identified by color, e.g., green, red, and yellow indicated carbon (C), oxygen (O), and nitrogen (N), respectively. O and N were distributed evenly over carbon substrates. EDX peaks shown in Figure 1h confirmed the presence of carbon, nitrogen, oxygen, silicon, and platinum. Silicon and platinum were attributed to sample preparation. For FESEM analysis, F-CNDs were spin-coated on silicon wafers and sputtered with platinum.
HRTEM was used to determine F-CND morphology and sizes. The morphological features of F-CNDs are well demonstrated by the micrographs in Figure 2a–c. F-CNDs were observed as spherical, well-dispersed dark dots with a few aggregations. In the high magnification, it is clear that F-CNDs were composed of graphitic layers with an interlayer spacing of 0.21 nm (inset in Figure 2c). The particle size distribution of F-CNDs is shown as a histogram in Figure 2d, which was derived via Gaussian particle-size-distribution fitting and by measuring the sizes of 100 randomly selected particles in HRTEM images (Figure 2a. F-CND sizes ranged from 1.5 to 4 nm with a mean particle size of ~2.5 nm).
X-ray powder diffraction was used to determine the crystal phases in F-CNDs. Figure 3a shows that the XRD spectrum of F-CNDs contained a broad peak at 2θ = 23°, corresponding to the (0 0 2) carbon lattice [45]. The shoulder peak at 2θ = 43° was ascribed to the (1 0 0) plane, and the corresponding d-spacing value was 0.21 nm, which agreed well with TEM results. The absence of a sharp peak, corresponding to the formation of an amorphous layer on F-CNDs, suggested the presence of surface functional groups. F-CNDs were also subjected to Raman spectroscopy to determine the purity and degree of graphitization of samples. The Raman spectrum of F-CNDs is shown in Figure 3b. Two prominent peaks corresponding to carbon D and G bands were observed at 1360 and 1585 cm–1, respectively [46]. These bands correspond to the disorder (vibration of sp3 carbon atom) and graphitic nature (vibration of sp2 carbon atom) of carbon materials and had an intensity ratio (ID/IG) of 0.63 [47,48], which confirmed a graphitic nature and a few surface defects [48,49]. The deconvoluted Raman spectrum shown in Figure 3c was used to assess the degree of graphitization in F-CNDs. Areas of the D and G bands (AD and AG, respectively) were used to calculate the areal D to G ratio (AD/AG), which was 0.65. This value indicates the formation of graphitized F-CNDs with minimal surface disorder or few defects. Surface disorder could be due to functional groups or edge effects. An ATR-FTIR (attenuated total reflectance-Fourier transform infrared) spectrum of F-CNDs provided information about surface functional groups (Figure 3d). The hydrophilic nature of the F-CNDs was confirmed by the presence of N–H and O–H stretching vibrations at 3500–3100 cm–1 [50,51]. Peaks between 2870 and 2962 cm–1 were assigned to the C–H asymmetric and symmetric stretch [52]. The presence of carboxyl/carbonyl groups was confirmed by C=O and C=C stretching vibration peaks at 1670 and 1575 cm–1, respectively [53]. The peaks between 1021 and 1120 cm–1 indicated the presence of the C–O–C group, and peaks at 1445, 1260, and 1397 cm–1 were ascribed to–C–N, C–OH and bending vibrations of N–H and O–H, respectively [54]. Out-of-plane stretching vibrations of C–H were confirmed by an absorption band at 665 cm–1 and were attributed to the carboxylic groups on F-CNDs [55]. These findings show that F-CNDs were composed of C, N, and O and decorated with–COOH, –OH, and –C–N groups.
X-ray photoelectron spectroscopy (XPS) was used to determine the elemental composition, type of bonding, and nature of functional groups. An XPS spectrum of F-CNDs is provided in Figure 4a. The peaks observed at the binding energies (BEs) of 285, 400, and 532 eV indicated the presence of C 1 s, N 1 s, and O 1 s, respectively. Interestingly, the atomic ratio of carbon to other elements was 3:1, and the atomic weight percentages of carbon, nitrogen, and oxygen were 75, 4, and 21%, respectively. Furthermore, the high-resolution XPS spectrum of C 1 s (Figure 4b) was deconvoluted into five distinct peaks. The binding energy (BE) of the peak at 284.5 eV corresponded to the C=C/C–C bond of the sp2 and sp3 graphitic structure of F-CNDs [56,57]. The binding energy peak at 285.1 eV corresponded to the pyridinic C–N–C bonds of F-CNDs. The presence of C–OH/C–O–C was confirmed by the peak at 286.1 eV, corresponding to hydroxyl bound to carbon [58]. The peak at 287.0 eV corresponded to C=N/C=O bonds representing pyrrolic nitrogen and carbonyl groups (–C=O) [58], whereas the presence of carboxyl groups (O=C–OH) was confirmed by the peak at 288.5 eV [57]. Figure 4c depicts the XPS spectrum of N 1 s, which exhibited three deconvoluted peaks signifying the presence of pyridinic nitrogen (C–N–C), pyrrolic nitrogen (C–N–H), and graphitic nitrogen (C3–N bonds) with Bes of 399.2, 400.2, and 401.7 eV, respectively [59,60], and showing that F-CND carbon had been doped with nitrogen. Notably, fluorescence results from the ability of excited nitrogen-doped carbon to emit light. The chemical type and concentration of nitrogen, carbon structure, and the conditions used for material synthesis can all affect the mechanism of nitrogen-doped carbon fluorescence. However, in most cases, movements of nitrogen electrons to lower energy levels are responsible. The XPS spectrum of O 1 s (Figure 4d) had two deconvoluted peaks at BE 531.5 and 533.1 eV corresponding to C=O/C–OH and C–O–C/O–C=OH, respectively [61]. These findings imply that the surfaces of F-CNDs had –OH, –C–N, and –COOH groups, which provide hydrophilicity and dispersibility in water. Furthermore, ATR-FTIR results were in line with XPS results.
The optical properties of F-CNDs were evaluated using Ultraviolet-visible (UV–vis) absorption and fluorescence spectroscopy. The UV–vis absorption spectrum of F-CNDs (Figure 5a) exhibited two prominent peaks at 217 and 275 corresponding to π–π* transitions of C–C/C=C and C=C, respectively. In addition, a shoulder was observed at 323, corresponding to the n–π* transition of C=O or C=N [62]. The inset in Figure 5a demonstrates the dispersion of F-CNDs in water and the difference between exposure to daylight or 365 nm UV light. F-CNDs were dispersed thoroughly in aqueous solvents, and UV exposure resulted in a color change from pale yellow to cyan. This phenomenon was ascribed to the different functional groups on F-CNDs.
F-CNDs exhibited maximum fluorescence at 406 nm when excited at 340 nm (Figure 5b); that is, a Stokes shift of 66 nm occurred. The magnitude of a Stokes shift can significantly impact the practical use of fluorescence. For instance, a significant Stokes shift can improve biological imaging by lowering background noise and increasing the signal-to-noise ratio. However, in some situations, such as in fluorescence resonance energy transfer, a slight spectral overlap between excitation and emission spectra is required to enable energy transfer between fluorescent molecules. The effects of fluorescence excitation wavelengths in the range of 330–420 nm on the emission spectrum of F-CNDs are shown in Figure 5c. Interestingly, the intensity of the emission spectrum increased upon increasing the excitation wavelength from 330 to 340 nm but reduced upon increasing it from 340 to 420 nm, and maximum emission intensity was observed at 340 nm. A normalized excitation-dependent emission spectrum (Figure S1) implies a redshift in the 395 to 495 nm wavelength range. The shift primarily results from electron transfer from the conjugated surface functional groups narrowing the energy gap. Presumably, if an emitting molecule or fluorophore is in a different environment than the absorbing molecule, a redshift in emission could also occur. In addition, some types of fluorescence, such as two-photon fluorescence, in which two photons of lower energy are simultaneously absorbed, can also cause a redshift. The photostability of F-CNDs was studied by continuously irradiating them with 365 nm UV light at a power of 4 W for 0–120 min (Figure 5d). The intensities of the emission spectra obtained were unchanged without any decay in emission, which confirmed the photostability of F-CNDs. Furthermore, prolonged UV exposure for 120 min caused no color change or precipitate formation (inset of Figure 5d). In addition, the quantum yield of F-CNDs was calculated to be 15.5%. These characteristics of F-CNDs might be due to a wide range of particle sizes, interactions caused by quantum confinement, and the presence of different functional groups.
In the carbon core of CDs, sp2-conjugated frameworks are typically accompanied by a number of imperfect sp2 domains. These areas will generate or induce surface energy traps that can serve as exciton capture sites, leading to fluorescence associated with the surface defect state. Therefore, surface flaws are responsible for visible light multicolor emissions from CDs. The band gap primarily controls the emission wavelength and is influenced by a wide range of variables, including CD surface chemistry, synthesis techniques, and edge configuration. Due to the epoxy, carboxyl, and hydroxyl groups present in the sp2 clusters, which encompass an extensive spectrum of size distribution, various band gap energies exhibit a variety of emission spectra. Two main types of mechanisms underlie luminescence, namely, quantum confinement in nanometric structures and those involving radiative relaxation of excited states attained by different functional groups within CDs [63]. Furthermore, pyrolytic processing and partial thermal decomposition of precursors cause the formation of intermediate organic fluorophores [64]. Based on our results, we suggest the emission properties of F-CDs are probably due to radiative transitions within or between functional groups on the surfaces of F-CNDs.
F-CNDs emit controllable fluorescence, have appropriate quantum yields, high water dispersibility, low cytotoxicity, and excellent biocompatibility, and do not exhibit photobleaching. The produced F-CNDs were used for cellular imaging without modification. MTT cell viability test results for HCT-116 cells (a human colon cancer cell line) at F-CND concentrations of 0 to 200 μg mL–1 are shown in Figure S2. The bar chart provides a comparison between the viabilities of F-CND treated and untreated cells (controls) and shows a slight decrease (from 100 to 97%) in cell viabilities with increasing concentration of F-CNDs from 0 to 200 μg mL–1. This observation indicated good compatibility and low cytotoxicity of F-CNDs with a human colon cancer cell line, and cytotoxicity does not lead to cell death even at higher concentrations of 200 μg mL–1, which is an essential property required for F-CNDs to make them suitable for bioimaging of cells. To comprehend the dynamics, one must first understand how F-CNDs become internalized within cells, tissues, or cellular cytoskeleton components. Actin filaments, Microtubules, and intermediate filaments are intracellular components that actively collaborate with cancer cells. Confocal microscopy was used to investigate the bioimaging characteristics of F-CNDs in human colon cancer cells. Figure 6 contains confocal microscopy photographs of HCT-116 cells, treated or not with F-CNDs, taken using different wavelength filters, viz. 405 (blue), 488 (green), and 555 nm (red) after exposure to bright field illumination for 12 or 24 h. No emission was observed from untreated HCT-116 cells, whereas fluorescence was observed from human colon cancer cells treated with F-CNDs when 405, 488, or 555 nm filters were used, which produced blue, green, and red emissions, respectively. The overlapping image was multicolored (Figure 6), indicating excitation wavelength-dependent emission characteristics. Upon increasing the exposure time from 12 h to 24 h, enhancement in the intensity of fluorescence is well observed from the image. It has been well established that F-CNDs are easily internalized and uniformly distributed in human colon cancer cells. Therefore, these results show that F-CNDs are candidate fluorescent nanoprobes for imaging human colon cancer cells.

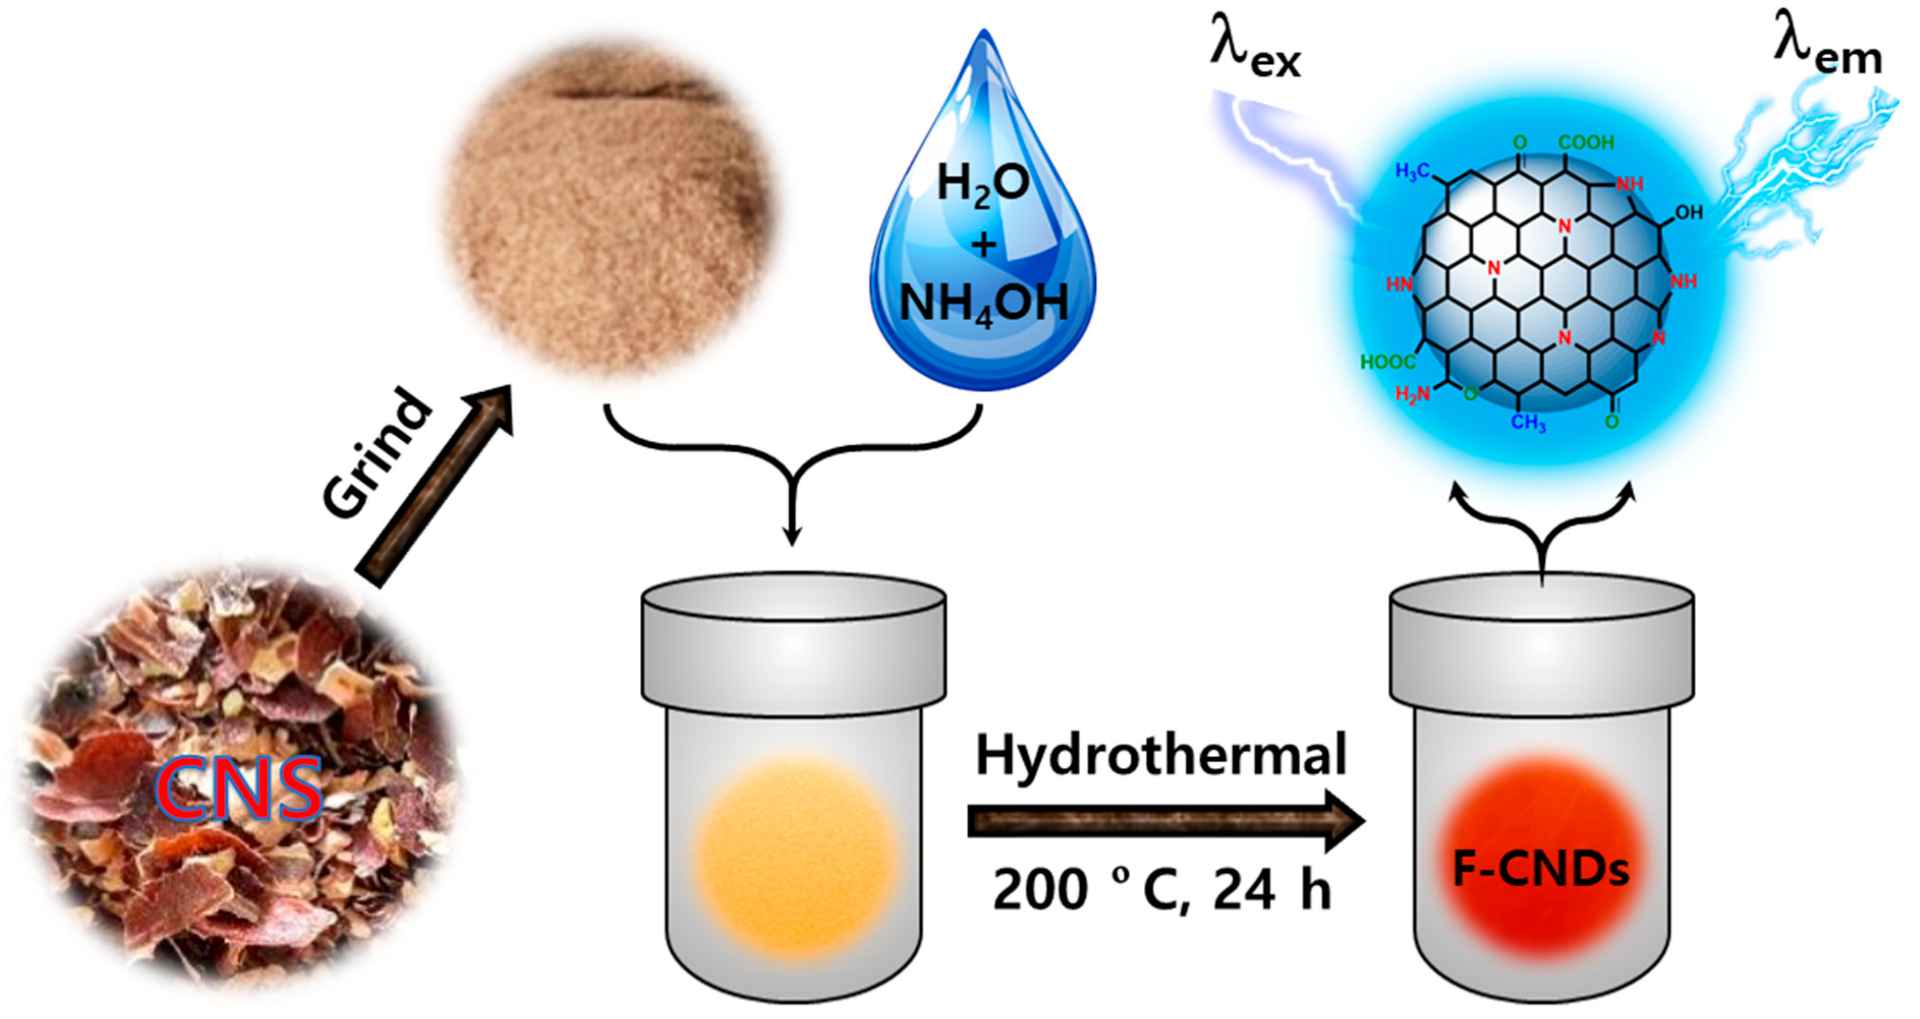
3. Materials and Methods

3.1. Materials

Cashew nut skin waste was collected from Tamil Nadu, India. Aqueous ammonia (NH4OH, 25%) was purchased from Sigma-Aldrich, Republic of Korea. Phosphate buffered saline (PBS), N-(2-hydroxyethyl)piperazine-N’-(2-ethane sulfonic acid) (HEPES), p-formaldehyde, quinine sulfate, and dimethyl sulfoxide (DMSO) were purchased from Sigma-Aldrich, Republic of Korea. 3-(4,5-dimethylthiazol-2-yl)-2,5-diphenyltetrazolium bromide (MTT) was purchased from Generay Biotech, Shanghai, China. HCT-116 human colon cancer cells were purchased from ATCC, CCL-247, Manassas, VA, USA. All the chemicals were used as purchased and distilled water was used throughout this study.

3.2. The Synthesis of Functionalized Carbon Nanodots

F-CNDs were synthesized using washed, dried, and ground cashew nut skins. The whitish-brown powder obtained was added to 50 mL of water with 1 mL of 25% ammonium hydroxide solution and placed in an autoclave at 200 °C for 24 h. Large carbon particles were eliminated via filtration, and the filtrate was passed through a mixed cellulose ester membrane filter with a pore size of 0.22 μm, frozen in liquid nitrogen, and dried at below −80 °C in a freeze dryer. The F-CNDs obtained were used in subsequent experiments. Scheme 1 shows the synthesis procedure of F-CNDs from cashew nut skin waste using the hydrothermal-carbonization.

4. Conclusions

Using a single-step method, cashew nut skin waste was used to synthesize F-CNDs using a simple hydrothermal route at a very low temperature without any further modifications that were quite economical. The formations of F-CNDs were considered to be due to the dehydration, polymerization, and carbonization of hydrolyzable tannins, and phenolic acids present in the testa of cashew nuts. F-CNDs exhibited a graphitic structure at the core with few surface defects as determined by XRD and Raman Spectroscopy. F-CNDs had a mean particle size of 2.5 nm and were composed of carbon, nitrogen, and oxygen decorated with functional groups (C=O, –OH, –NH2, and –COOH), as determined by XPS and ATR-FTIR, which conferred F-CNDs with significant hydrophilicity and dispersibility. F-CNDs had excellent fluorescent properties and exhibited maximum emission at 406 nm when excited at 340 nm due to radiative transitions within or between functional groups present on the surfaces of F-CNDs. F-CNDs were photostable, had a quantum yield of 15.5%, and at concentrations of 0–200 μg mL−1 returned MTT viability greater than 95% for HCT-116 cells. F-CNDs thus proved to have remarkable biocompatibility and low cytotoxicity with the cancer cell line. Confocal microscopy of human colon cancer cells treated with or without F-CNDs revealed blue, green, and red emissions when exposed to 405, 488, and 555 nm light, respectively, in addition to a bright field. After increasing the time of exposure from 12 h to 24 h, significant enhancement in the intensity of fluorescence was observed. Our results show nano-sized, cashew-nut-skin-derived F-CNDs have a graphitized core structure and are surface functionalized by organic moieties. They are suitable nanoprobes for bioimaging, drug delivery, and cell labeling. In the near future, a material that is safe for the delivery of anticancer drugs could be developed using the successful integration of F-CNDs with anticancer drugs.

Supplementary Materials

The following are available online at https://www.mdpi.com/article/10.3390/catal13030547/s1. Instrumentation methods, quantum yield measurements, photobleaching measurements, cell culture, cell viability assay, and microscopy results. Figure S1. Fluorescence excitation-dependent emission normalized-spectra of synthesized F-CNDs; Figure S2. Cell viability MTT assay results. The bar chart provides a comparison of the viabilities of F-CND treated cells and untreated controls.

Author Contributions

Investigation and writing of the original draft, S.C.K.; visualization, reviewing the original draft, and editing, S.P.; conceptualization, data curation, formal analysis, investigation, and writing the original draft, R.A.; formal analysis and investigation T.N.J.I.E.; investigation and visualization, A.K.S.; investigation and validation, M.A.; formal analysis and visualization, S.S.; project administration and supervision, Y.R.L. The authors contributed equally to this work. All authors have read and agreed to the published version of the manuscript.

Funding

This research received no external funding.

Data Availability Statement

Not applicable.

Conflicts of Interest

The authors declare no conflict of interest.

References

  1. Wang, B.; Lu, S. The light of carbon dots: From mechanism to applications. Matter 2022, 5, 110–149. [Google Scholar] [CrossRef]
  2. Yao, X.; Lewis, R.E.; Haynes, C.L. Synthesis Processes, Photoluminescence Mechanism, and the Toxicity of Amorphous or Polymeric Carbon Dots. Acc. Chem. Res. 2022, 55, 3312–3321. [Google Scholar] [CrossRef]
  3. Yuan, T.; Meng, T.; Shi, Y.; Song, X.; Xie, W.; Li, Y.; Li, X.; Zhang, Y.; Fan, L. Toward phosphorescent and delayed fluorescent carbon quantum dots for next-generation electroluminescent displays. J. Mater. Chem. C 2022, 10, 2333–2348. [Google Scholar] [CrossRef]
  4. Ghaffarkhah, A.; Hosseini, E.; Kamkar, M.; Sehat, A.A.; Dordanihaghighi, S.; Allahbakhsh, A.; van der Kuur, C.; Arjmand, M. Synthesis, applications, and prospects of graphene quantum dots: A comprehensive review. Small 2022, 18, 2102683. [Google Scholar] [CrossRef] [PubMed]
  5. Xu, X.; Ray, R.; Gu, Y.; Ploehn, H.J.; Gearheart, L.; Raker, K.; Scrivens, W.A. Electrophoretic analysis and purification of fluorescent single-walled carbon nanotube fragments. J. Am. Chem. Soc. 2004, 126, 12736–12737. [Google Scholar] [CrossRef]
  6. Li, J.; Gong, X. The Emerging Development of Multicolor Carbon Dots. Small 2022, 18, 2205099. [Google Scholar] [CrossRef]
  7. Falara, P.P.; Zourou, A.; Kordatos, K.V. Recent advances in Carbon Dots/2-D hybrid materials. Carbon 2022, 195, 219–245. [Google Scholar] [CrossRef]
  8. Hebbar, A.; Selvaraj, R.; Vinayagam, R.; Varadavenkatesan, T.; Kumar, P.S.; Duc, P.A.; Rangasamy, G. A critical review on the environmental applications of carbon dots. Chemosphere 2022, 313, 137308. [Google Scholar] [CrossRef]
  9. Biswal, M.R.; Bhatia, S. Carbon Dot Nanoparticles: Exploring the Potential Use for Gene Delivery in Ophthalmic Diseases. Nanomaterials 2021, 11, 935. [Google Scholar] [CrossRef]
  10. Guo, R.; Li, L.; Wang, B.; Xiang, Y.; Zou, G.; Zhu, Y.; Hou, H.; Ji, X. Functionalized carbon dots for advanced batteries. Energy Storage Mater. 2021, 37, 8–39. [Google Scholar] [CrossRef]
  11. Wang, F.-T.; Wang, L.-N.; Xu, J.; Huang, K.-J.; Wu, X. Synthesis and modification of carbon dots for advanced biosensing application. Analyst 2021, 146, 4418–4435. [Google Scholar] [CrossRef]
  12. Kaur, P.; Verma, G. Converting fruit waste into carbon dots for bioimaging applications. Mater. Today Sustain. 2022, 18, 100137. [Google Scholar] [CrossRef]
  13. Tang, J.; Kong, B.; Wu, H.; Xu, M.; Wang, Y.; Wang, Y.; Zhao, D.; Zheng, G. Carbon nanodots featuring efficient FRET for real-time monitoring of drug delivery and two-photon imaging. Adv. Mater. 2013, 25, 6569–6574. [Google Scholar] [CrossRef]
  14. Kashkoulinejad-Kouhi, T.; Sawalha, S.; Safarian, S.; Arnaiz, B. A carbon-based nanocarrier for efficient gene delivery. Ther. Deliv. 2021, 12, 311–323. [Google Scholar] [CrossRef]
  15. Shi, L.; Yang, J.H.; Zeng, H.B.; Chen, Y.M.; Yang, S.C.; Wu, C.; Zeng, H.; Yoshihito, O.; Zhang, Q. Carbon dots with high fluorescence quantum yield: The fluorescence originates from organic fluorophores. Nanoscale 2016, 8, 14374–14378. [Google Scholar] [CrossRef] [PubMed]
  16. Xiong, Y.; Schneider, J.; Reckmeier, C.J.; Huang, H.; Kasák, P.; Rogach, A.L. Carbonization conditions influence the emission characteristics and the stability against photobleaching of nitrogen doped carbon dots. Nanoscale 2017, 9, 11730–11738. [Google Scholar] [CrossRef] [PubMed]
  17. Pourmadadi, M.; Rahmani, E.; Rajabzadeh-Khosroshahi, M.; Samadi, A.; Behzadmehr, R.; Rahdar, A.; Ferreira, L.F.R. Properties and application of carbon quantum dots (CQDs) in biosensors for disease detection: A comprehensive review. J. Drug Deliv. Sci. Technol. 2023, 80, 104156. [Google Scholar] [CrossRef]
  18. Nagarajan, D.; Gangadharan, D.; Venkatanarasimhan, S. Synthetic strategies toward developing carbon dots via top-down approach. In Carbon Dots in Analytical Chemistry; Elsevier: Amsterdam, The Netherlands, 2023; pp. 1–13. [Google Scholar]
  19. Hu, S.-L.; Niu, K.-Y.; Sun, J.; Yang, J.; Zhao, N.-Q.; Du, X.-W. One-step synthesis of fluorescent carbon nanoparticles by laser irradiation. J. Mater. Chem. 2009, 19, 484–488. [Google Scholar] [CrossRef]
  20. Bao, L.; Zhang, Z.L.; Tian, Z.Q.; Zhang, L.; Liu, C.; Lin, Y.; Qi, B.; Pang, D.W. Electrochemical tuning of luminescent carbon nanodots: From preparation to luminescence mechanism. Adv. Mater. 2011, 23, 5801–5806. [Google Scholar] [CrossRef] [PubMed]
  21. Atchudan, R.; Kishore, S.C.; Gangadaran, P.; Edison, T.N.J.I.; Perumal, S.; Rajendran, R.L.; Alagan, M.; Al-Rashed, S.; Ahn, B.-C.; Lee, Y.R. Tunable fluorescent carbon dots from biowaste as fluorescence ink and imaging human normal and cancer cells. Environ. Res. 2022, 204, 112365. [Google Scholar] [CrossRef] [PubMed]
  22. Manoharan, P.; Dhanabalan, S.C.; Alagan, M.; Muthuvijayan, S.; Ponraj, J.S.; Somasundaram, C.K. Facile synthesis and characterisation of green luminescent carbon nanodots prepared from tender coconut water using the acid-assisted ultrasonic route. Micro Nano Lett. 2020, 15, 920–924. [Google Scholar] [CrossRef]
  23. Jiang, J.; He, Y.; Li, S.; Cui, H. Amino acids as the source for producing carbon nanodots: Microwave assisted one-step synthesis, intrinsic photoluminescence property and intense chemiluminescence enhancement. Chem. Commun. 2012, 48, 9634–9636. [Google Scholar] [CrossRef] [PubMed]
  24. Ortega-Liebana, M.; Chung, N.; Limpens, R.; Gomez, L.; Hueso, J.; Santamaria, J.; Gregorkiewicz, T. Uniform luminescent carbon nanodots prepared by rapid pyrolysis of organic precursors confined within nanoporous templating structures. Carbon 2017, 117, 437–446. [Google Scholar] [CrossRef]
  25. Ming, H.; Ma, Z.; Liu, Y.; Pan, K.; Yu, H.; Wang, F.; Kang, Z. Large scale electrochemical synthesis of high quality carbon nanodots and their photocatalytic property. Dalton Trans. 2012, 41, 9526–9531. [Google Scholar] [CrossRef]
  26. Atchudan, R.; Kishore, S.C.; Edison, T.N.J.I.; Perumal, S.; Vinodh, R.; Sundramoorthy, A.K.; Babu, R.S.; Alagan, M.; Lee, Y.R. Highly fluorescent carbon dots as a potential fluorescence probe for selective sensing of ferric ions in aqueous solution. Chemosensors 2021, 9, 301. [Google Scholar] [CrossRef]
  27. Lou, Q.; Yang, X.; Liu, K.; Ding, Z.; Qin, J.; Li, Y.; Lv, C.; Shang, Y.; Zhang, Y.; Zhang, Z. Pressure-induced photoluminescence enhancement and ambient retention in confined carbon dots. Nano Res. 2022, 15, 2545–2551. [Google Scholar] [CrossRef]
  28. Ji, Z.; Sheardy, A.; Zeng, Z.; Zhang, W.; Chevva, H.; Allado, K.; Yin, Z.; Wei, J. Tuning the functional groups on carbon nanodots and antioxidant studies. Molecules 2019, 24, 152. [Google Scholar] [CrossRef] [Green Version]
  29. Ding, H.; Zhou, X.; Qin, B.; Zhou, Z.; Zhao, Y. Highly fluorescent near-infrared emitting carbon dots derived from lemon juice and its bioimaging application. J. Lumin. 2019, 211, 298–304. [Google Scholar] [CrossRef]
  30. Duarah, R.; Karak, N. Facile and ultrafast green approach to synthesize biobased luminescent reduced carbon nanodot: An efficient photocatalyst. ACS Sustain. Chem. Eng. 2017, 5, 9454–9466. [Google Scholar] [CrossRef]
  31. Wang, S.; Huo, X.; Zhao, H.; Dong, Y.; Cheng, Q.; Li, Y. One-pot green synthesis of N, S co-doped biomass carbon dots from natural grapefruit juice for selective sensing of Cr (VI). Chem. Phys. Impact 2022, 5, 100112. [Google Scholar] [CrossRef]
  32. Mandani, S.; Dey, D.; Sharma, B.; Sarma, T.K. Natural occurrence of fluorescent carbon dots in honey. Carbon 2017, 119, 569–572. [Google Scholar] [CrossRef]
  33. Sun, D.; Ban, R.; Zhang, P.-H.; Wu, G.-H.; Zhang, J.-R.; Zhu, J.-J. Hair fiber as a precursor for synthesizing of sulfur-and nitrogen-co-doped carbon dots with tunable luminescence properties. Carbon 2013, 64, 424–434. [Google Scholar] [CrossRef]
  34. Liu, Y.; Liu, Y.; Park, M.; Park, S.-J.; Zhang, Y.; Akanda, M.R.; Park, B.-Y.; Kim, H.Y. Green synthesis of fluorescent carbon dots from carrot juice for in vitro cellular imaging. Carbon Lett. 2017, 21, 61–67. [Google Scholar] [CrossRef] [Green Version]
  35. Zhao, S.; Lan, M.; Zhu, X.; Xue, H.; Ng, T.-W.; Meng, X.; Lee, C.-S.; Wang, P.; Zhang, W. Green synthesis of bifunctional fluorescent carbon dots from garlic for cellular imaging and free radical scavenging. ACS Appl. Mater. Interfaces 2015, 7, 17054–17060. [Google Scholar] [CrossRef] [PubMed]
  36. Pramanik, S.; Chatterjee, S.; Kumar, G.S.; Devi, P.S. Egg-shell derived carbon dots for base pair selective DNA binding and recognition. Phys. Chem. Chem. Phys. 2018, 20, 20476–20488. [Google Scholar] [CrossRef] [PubMed]
  37. Atchudan, R.; Gangadaran, P.; Edison, T.N.J.I.; Perumal, S.; Sundramoorthy, A.K.; Vinodh, R.; Rajendran, R.L.; Ahn, B.-C.; Lee, Y.R. Betel leaf derived multicolor emitting carbon dots as a fluorescent probe for imaging mouse normal fibroblast and human thyroid cancer cells. Phys. E: Low-Dimens. Syst. Nanostructures 2022, 136, 115010. [Google Scholar] [CrossRef]
  38. Park, S.Y.; Lee, H.U.; Park, E.S.; Lee, S.C.; Lee, J.-W.; Jeong, S.W.; Kim, C.H.; Lee, Y.-C.; Huh, Y.S.; Lee, J. Photoluminescent green carbon nanodots from food-waste-derived sources: Large-scale synthesis, properties, and biomedical applications. ACS Appl. Mater. Interfaces 2014, 6, 3365–3370. [Google Scholar] [CrossRef]
  39. Lou, Q.; Ni, Q.; Niu, C.; Wei, J.; Zhang, Z.; Shen, W.; Shen, C.; Qin, C.; Zheng, G.; Liu, K. Carbon nanodots with nearly unity fluorescent efficiency realized via localized excitons. Adv. Sci. 2022, 9, 2203622. [Google Scholar] [CrossRef]
  40. Song, Z.; Shang, Y.; Lou, Q.; Zhu, J.; Hu, J.; Xu, W.; Li, C.; Chen, X.; Liu, K.; Shan, C.X. A Molecular Engineering Strategy for Achieving Blue Phosphorescent Carbon Dots with Outstanding Efficiency Above 50%. Adv. Mater. 2022, 35, 2207970. [Google Scholar] [CrossRef]
  41. Paramashivappa, R.; Kumar, P.P.; Vithayathil, P.; Rao, A.S. Novel method for isolation of major phenolic constituents from cashew (Anacardium occidentale L.) nut shell liquid. J. Agric. Food Chem. 2001, 49, 2548–2551. [Google Scholar] [CrossRef]
  42. Chandrasekara, N.; Shahidi, F. Antioxidative potential of cashew phenolics in food and biological model systems as affected by roasting. Food Chem. 2011, 129, 1388–1396. [Google Scholar] [CrossRef]
  43. Mathew, A.; Parpia, H. Polyphenols of cashew kernel testa. J. Food Sci. 1970, 35, 140–143. [Google Scholar] [CrossRef]
  44. Edison, T.N.J.I.; Atchudan, R.; Sethuraman, M.G.; Lee, Y.R. Reductive-degradation of carcinogenic azo dyes using Anacardium occidentale testa derived silver nanoparticles. J. Photochem. Photobiol. B Biol. 2016, 162, 604–610. [Google Scholar] [CrossRef]
  45. Jayaweera, S.; Yin, K.; Ng, W.J. Nitrogen-doped durian shell derived carbon dots for inner filter effect mediated sensing of tetracycline and fluorescent ink. J. Fluoresc. 2019, 29, 221–229. [Google Scholar] [CrossRef]
  46. Temerov, F.; Belyaev, A.; Ankudze, B.; Pakkanen, T.T. Preparation and photoluminescence properties of graphene quantum dots by decomposition of graphene-encapsulated metal nanoparticles derived from Kraft lignin and transition metal salts. J. Lumin. 2019, 206, 403–411. [Google Scholar] [CrossRef]
  47. Dager, A.; Baliyan, A.; Kurosu, S.; Maekawa, T.; Tachibana, M. Ultrafast synthesis of carbon quantum dots from fenugreek seeds using microwave plasma enhanced decomposition: Application of C-QDs to grow fluorescent protein crystals. Sci. Rep. 2020, 10, 12333. [Google Scholar] [CrossRef] [PubMed]
  48. Hussain, S.; Shah, K.A.; Islam, S. Investigation of effects produced by chemical functionalization in single-walled and multi-walled carbon nanotubes using Raman spectroscopy. Mater. Sci.-Pol. 2013, 31, 276–280. [Google Scholar] [CrossRef]
  49. Atchudan, R.; Muthuchamy, N.; Edison, T.N.J.I.; Perumal, S.; Vinodh, R.; Park, K.H.; Lee, Y.R. An ultrasensitive photoelectrochemical biosensor for glucose based on bio-derived nitrogen-doped carbon sheets wrapped titanium dioxide nanoparticles. Biosens. Bioelectron. 2019, 126, 160–169. [Google Scholar] [CrossRef]
  50. Tammina, S.K.; Yang, D.; Koppala, S.; Cheng, C.; Yang, Y. Highly photoluminescent N, P doped carbon quantum dots as a fluorescent sensor for the detection of dopamine and temperature. J. Photochem. Photobiol. B Biol. 2019, 194, 61–70. [Google Scholar] [CrossRef]
  51. Atchudan, R.; Edison, T.N.J.I.; Chakradhar, D.; Perumal, S.; Shim, J.-J.; Lee, Y.R. Facile green synthesis of nitrogen-doped carbon dots using Chionanthus retusus fruit extract and investigation of their suitability for metal ion sensing and biological applications. Sens. Actuators B: Chem. 2017, 246, 497–509. [Google Scholar] [CrossRef]
  52. Souza da Costa, R.; Ferreira da Cunha, W.; Simenremis Pereira, N.; Marti Ceschin, A. An Alternative Route to Obtain Carbon Quantum Dots from Photoluminescent Materials in Peat. Materials 2018, 11, 1492. [Google Scholar] [CrossRef] [Green Version]
  53. Campos, B.; Abellán, C.; Zougagh, M.; Jimenez-Jimenez, J.; Rodríguez-Castellón, E.; da Silva, J.E.; Ríos, A.; Algarra, M. Fluorescent chemosensor for pyridine based on N-doped carbon dots. J. Colloid Interface Sci. 2015, 458, 209–216. [Google Scholar] [CrossRef] [PubMed]
  54. Wu, G.; Feng, M.; Zhan, H. Generation of nitrogen-doped photoluminescent carbonaceous nanodots via the hydrothermal treatment of fish scales for the detection of hypochlorite. RSC Adv. 2015, 5, 44636–44641. [Google Scholar] [CrossRef]
  55. Gong, J.; An, X.; Yan, X. A novel rapid and green synthesis of highly luminescent carbon dots with good biocompatibility for cell imaging. New J. Chem. 2014, 38, 1376–1379. [Google Scholar] [CrossRef]
  56. Wang, M.; Wan, Y.; Zhang, K.; Fu, Q.; Wang, L.; Zeng, J.; Xia, Z.; Gao, D. Green synthesis of carbon dots using the flowers of Osmanthus fragrans (Thunb.) Lour. as precursors: Application in Fe3+ and ascorbic acid determination and cell imaging. Anal. Bioanal. Chem. 2019, 411, 2715–2727. [Google Scholar] [CrossRef]
  57. Atchudan, R.; Edison, T.N.J.I.; Perumal, S.; Vinodh, R.; Sundramoorthy, A.K.; Babu, R.S.; Lee, Y.R. Morus nigra-derived hydrophilic carbon dots for the highly selective and sensitive detection of ferric ion in aqueous media and human colon cancer cell imaging. Colloids Surf. A Physicochem. Eng. Asp. 2022, 635, 128073. [Google Scholar] [CrossRef]
  58. Zhang, R.; Chen, W. Nitrogen-doped carbon quantum dots: Facile synthesis and application as a “turn-off” fluorescent probe for detection of Hg2+ ions. Biosens. Bioelectron. 2014, 55, 83–90. [Google Scholar] [CrossRef] [PubMed]
  59. Hu, Q.; Gong, X.; Liu, L.; Choi, M.M. Characterization and analytical separation of fluorescent carbon nanodots. J. Nanomater. 2017, 2017, 1804178. [Google Scholar] [CrossRef] [Green Version]
  60. Atchudan, R.; Edison, T.N.J.I.; Perumal, S.; Muthuchamy, N.; Lee, Y.R. Hydrophilic nitrogen-doped carbon dots from biowaste using dwarf banana peel for environmental and biological applications. Fuel 2020, 275, 117821. [Google Scholar] [CrossRef]
  61. Siddique, A.B.; Pramanick, A.K.; Chatterjee, S.; Ray, M. Amorphous carbon dots and their remarkable ability to detect 2, 4, 6-trinitrophenol. Sci. Rep. 2018, 8, 9770. [Google Scholar] [CrossRef] [Green Version]
  62. Wang, W.; Chen, J.; Wang, D.; Shen, Y.; Yang, L.; Zhang, T.; Ge, J. Facile synthesis of biomass waste-derived fluorescent N, S, P co-doped carbon dots for detection of Fe 3+ ions in solutions and living cells. Anal. Methods 2021, 13, 789–795. [Google Scholar] [CrossRef] [PubMed]
  63. Stan, L.; Volf, I.; Stan, C.S.; Albu, C.; Coroaba, A.; Ursu, L.E.; Popa, M. Intense Blue Photo Emissive Carbon Dots Prepared through Pyrolytic Processing of Ligno-Cellulosic Wastes. Nanomaterials 2023, 13, 131. [Google Scholar] [CrossRef] [PubMed]
  64. Fu, M.; Ehrat, F.; Wang, Y.; Milowska, K.Z.; Reckmeier, C.; Rogach, A.L.; Stolarczyk, J.K.; Urban, A.S.; Feldmann, J. Carbon dots: A unique fluorescent cocktail of polycyclic aromatic hydrocarbons. Nano Lett. 2015, 15, 6030–6035. [Google Scholar] [CrossRef] [PubMed]
Figure 1. (ac) FE-SEM images of functionalized carbon nanodots (F-CNDs; (dg) EDX elemental mapping images of F-CNDs (d) carbon, (e) oxygen, (f) nitrogen, and (g) overlapping image showing all elements; (h) EDX spectrum of F-CNDs.
Catalysts 13 00547 g001
Figure 2. (ac) HRTEM images of synthesized F-CNDs at different magnifications and (d) a particle size distribution histogram.
Catalysts 13 00547 g002
Figure 3. (a) Powder XRD pattern, (b) Raman spectrum, (c) deconvoluted Raman spectrum, and (d) ATR-FTIR spectrum of synthesized F-CNDs.
Catalysts 13 00547 g003
Figure 4. (a) XPS-survey spectrum and high-resolution XPS spectra of (b) C 1 s, (c) N 1 s, and (d) O 1 s of synthesized F-CNDs.
Catalysts 13 00547 g004
Figure 5. (a) UV-vis absorption spectrum (inset: photographic images of synthesized F-CNDs in aqueous solution under daylight (left) and 365 nm UV light (right)); (b) fluorescence excitation and emission spectra, and (c) fluorescence excitation-dependent emission spectra of synthesized F-CNDs. (d) Fluorescence emission spectra of synthesized F-CNDs before and after continuous irradiation with 365 nm UV light (inset: photographic images of synthesized F-CNDs in aqueous suspension under 365 nm UV light before (0 min) and after (120 min) continuous irradiation with 365 nm UV).
Catalysts 13 00547 g005
Figure 6. Confocal microscopy fluorescence images of human colon cancer cells treated with or without F-CNDs and the synthesized F-CNDs treated for 12 and 24 h with the concentration of 100 μg mL−1 using different excitation filters 405, 488, and 555 nm (blue, green, and red, respectively) as well as bright-field illumination.
Catalysts 13 00547 g006
Scheme 1. Hydrothermal synthesis of functionalized carbon nanodots from cashew nut skin waste.
Catalysts 13 00547 sch001
Disclaimer/Publisher’s Note: The statements, opinions and data contained in all publications are solely those of the individual author(s) and contributor(s) and not of MDPI and/or the editor(s). MDPI and/or the editor(s) disclaim responsibility for any injury to people or property resulting from any ideas, methods, instructions or products referred to in the content.

