
Photodynamic Light-Triggered Release of Curcumin from Hierarchical FAU Zeolite


1
Faculty of Chemistry, Adam Mickiewicz University, Uniwersytetu Poznańskiego 8, 61-614 Poznań, Poland
2
Department of Chemistry and Biochemistry, Kent State University, Kent, OH 44242, USA
*
Authors to whom correspondence should be addressed.
Catalysts 2023, 13(2), 394; https://doi.org/10.3390/catal13020394
Submission received: 2 January 2023
/
Revised: 6 February 2023
/
Accepted: 7 February 2023
/
Published: 11 February 2023
(This article belongs to the Special Issue Advances in the Synthesis and Applications of Transition/Noble Metal Oxide Photocatalysts)
Abstract
:Photodynamic therapy (PDT) is a method used in the treatment of various diseases and represents a promising alternative to classical active substance release methods. According to the United States National Institute of Health, this therapy exploits the health-promoting potential of active substances, referred to as “photosensitizers”, and radiation of specific energy. Curcumin is a natural “photosensitizer” that exhibits anti-inflammatory, antioxidant, and anti-cancer effects. Despite the novelty and innovation of PDT, the method is limited by the difficulty of using “photosensitizers” such as curcumin because of its low solubility in water, which hinders the clinical application of this technique. The use of a “photosensitizer” along with suitable carriers such as hierarchical zeolites is a potential strategy to offset this difficulty. Therefore, the objective of this study was to develop the photodynamic release of curcumin from hierarchical zeolites using the classical open-circuit release method and a novel closed-circuit release technique involving light of different wavelengths. Based on the obtained data, it was possible to unequivocally state that the speed and efficiency of curcumin release from the zeolite carrier is influenced by light with a wavelength in the range of 430–525 nm (blue-cyan-green). As much as 53.24% of the active substance was released upon light exposure.
1. Introduction
The intensive development of medicine in recent years has undeniably contributed to an increase in life expectancy, as well as to people’s awareness of taking care of their health. The result of these changes is an increase in demand for new and improved drugs and an improvement in the way they are delivered [1]. An important part of each therapy is to deliver a given drug to the specific site in the body and to release it during preferred times. Classical methods of active substance release are based on the fact that the delivered active molecules rapidly increase their concentration in plasma, and next, their concentration is exponentially decreased as the drug is excreted or metabolized. The disadvantage of such a system is the limited control over the rate of drug release and the site of administration of the therapeutic substance. A way to maintain an adequate therapeutic level of the drug for a longer period and its release in a controlled manner is the use of active substance carriers [2,3]. Such carriers should have a well-defined relationship between the dose and the therapeutic effect of the active substance. Furthermore, the effect achieved by administration of active substance should be at least comparable to the effect obtained with the use of a conventional drug/supplement form [4].
Among others, the following materials are used as drug carriers: carbon materials, polymeric materials, and in general, porous materials [5,6]. Porous materials, according to the IUPAC (International Union for Pure and Applied Chemistry) classification, are solids having internal spaces that can be filled with a gas or liquid with chemical properties different from the solid [7]. These spaces are called pores, channels, or fissures, and their length is much greater than their width (ranges from 1–100 nm). Among porous materials, the most popular types of active substance carriers are structurally ordered materials such as zeolites, or hierarchical zeolites, which are recently popular [6,8].
In recent years, hierarchical zeolites have been the object of intensive studies because they can be very good carriers for various active substances [9,10,11,12]. Hierarchical zeolites are materials that possess so-called secondary porosity (mainly mesopores, i.e., pores between 2 and 50 nm) in addition to micropores, which have sizes below 2 nm according to the IUPAC classification [13]. Hierarchical zeolites can be successfully used, for example, in catalysis [14], adsorption, or medicine [15]. Hierarchical zeolites are also used as carriers for therapeutic substances that can be released in a sustained manner due to their unique properties [16]. These materials have high biocompatibility and nontoxicity to various types of cells and tissues [17,18]. It is important to find carriers and therapeutic substances with the lowest possible toxicity and the highest possible efficacy. One of the strategies with high promise is the use of active substances isolated from plants [19].
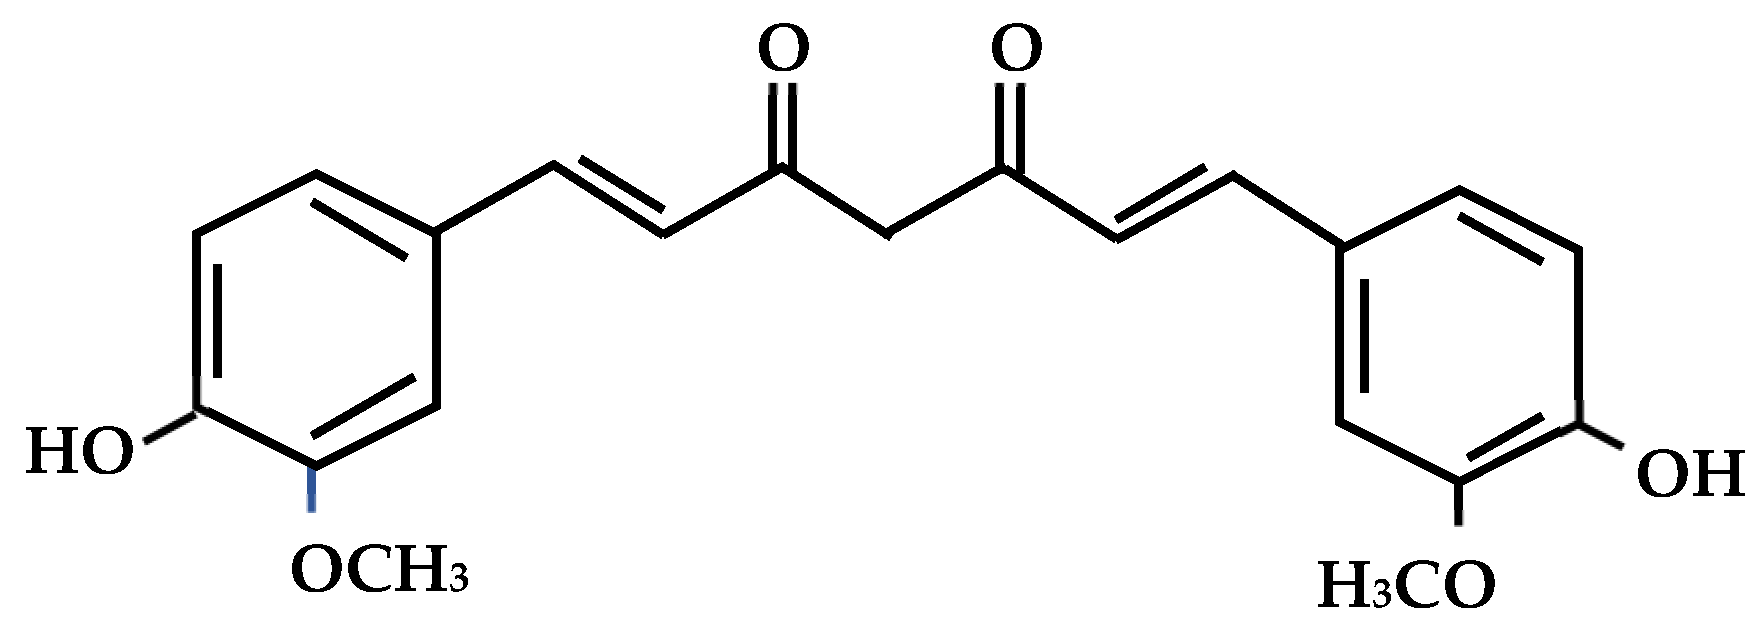
Plants have played a very important role in history. In addition to their use as food and spices, they have been used as medicinal substances for thousands of years [20,21]. The most popular plant-derived substance used as a therapeutic agent in recent years is curcumin, which was isolated from the root of Curcuma longa (Figure 1).
It is a natural substance that belongs to the polyphenol group and has a long history of medicinal uses. The most used part of this plant is the rhizome [23], which consists of a wide range of compounds, including nonvolatile bioactive curcuminoids (curcumin, dimethoxycurcumin, and bisdemethoxycurcumin) and compounds present in the oil (mono- and sesquiterpenoids) [24,25]. It is currently used in the treatment of various diseases such as cardiovascular diseases, asthma, diabetes, bronchitis, rheumatoid arthritis, psoriasis, AIDS, and most importantly, it is used in the treatment of cancer [26,27,28]. Despite its numerous benefits, curcumin exhibits very poor bioavailability and very low blood and tissue concentrations; this is due to its poor absorption, rapid metabolism, and rapid systemic elimination [29,30]. To improve the properties of this active substance, special agents are used that can increase its bioavailability. A good example of a substance that improves curcumin properties is piperine, a known bioavailability enhancer, which is a major component of black pepper [31,32].
Plant-based controlled drug delivery systems have been developed to increase the therapeutic efficacy of drugs while reducing their side effects and patient discomfort. Parameters related to the material surface area, pore size, geometry, and possible reactions of the carrier with the surrounding environment are some of the many factors that are extremely important when designing drug delivery systems [2]. The classical methods for the release of active substances in the human body often do not produce the expected therapeutic effects; thus, new methods of delivery and release of the therapeutic substance are sought. Recent studies confirm that curcumin is a potential active substance used in photodynamic therapies [33].
Photodynamic therapy (PDT) is a minimally invasive therapy that can have significant advantages in the treatment of a variety of diseases compared to conventional methods, such as fewer side effects, high spatial–temporal precision, and rapid healing of healthy tissue [34]. This therapy uses a light-activated drug called a “photosensitizer” (PS) or “photosensitizing agent” to kill cancer cells. The light source can be a laser or, for example, a light-emitting diode (LED). The photodynamic reaction is based on the principle that a “photosensitizer” stored in target cells or tissues can be activated by absorbing sufficient light energy to produce radicals and reactive oxygen species (ROS). “Photosensitizers”, when activated by light of the appropriate wavelength, probably undergo a chemical reaction by two types of mechanisms [35,36]. In the type I reaction, the radical ions and free radicals are formed by an electron/hydrogen transfer process between the “photosensitizer” and the substrate molecules [37]. In the type II reaction (the main process in PDT), highly cytotoxic singlet oxygen (1O2) is formed by an energy transfer process from PS to molecular oxygen [35,38].
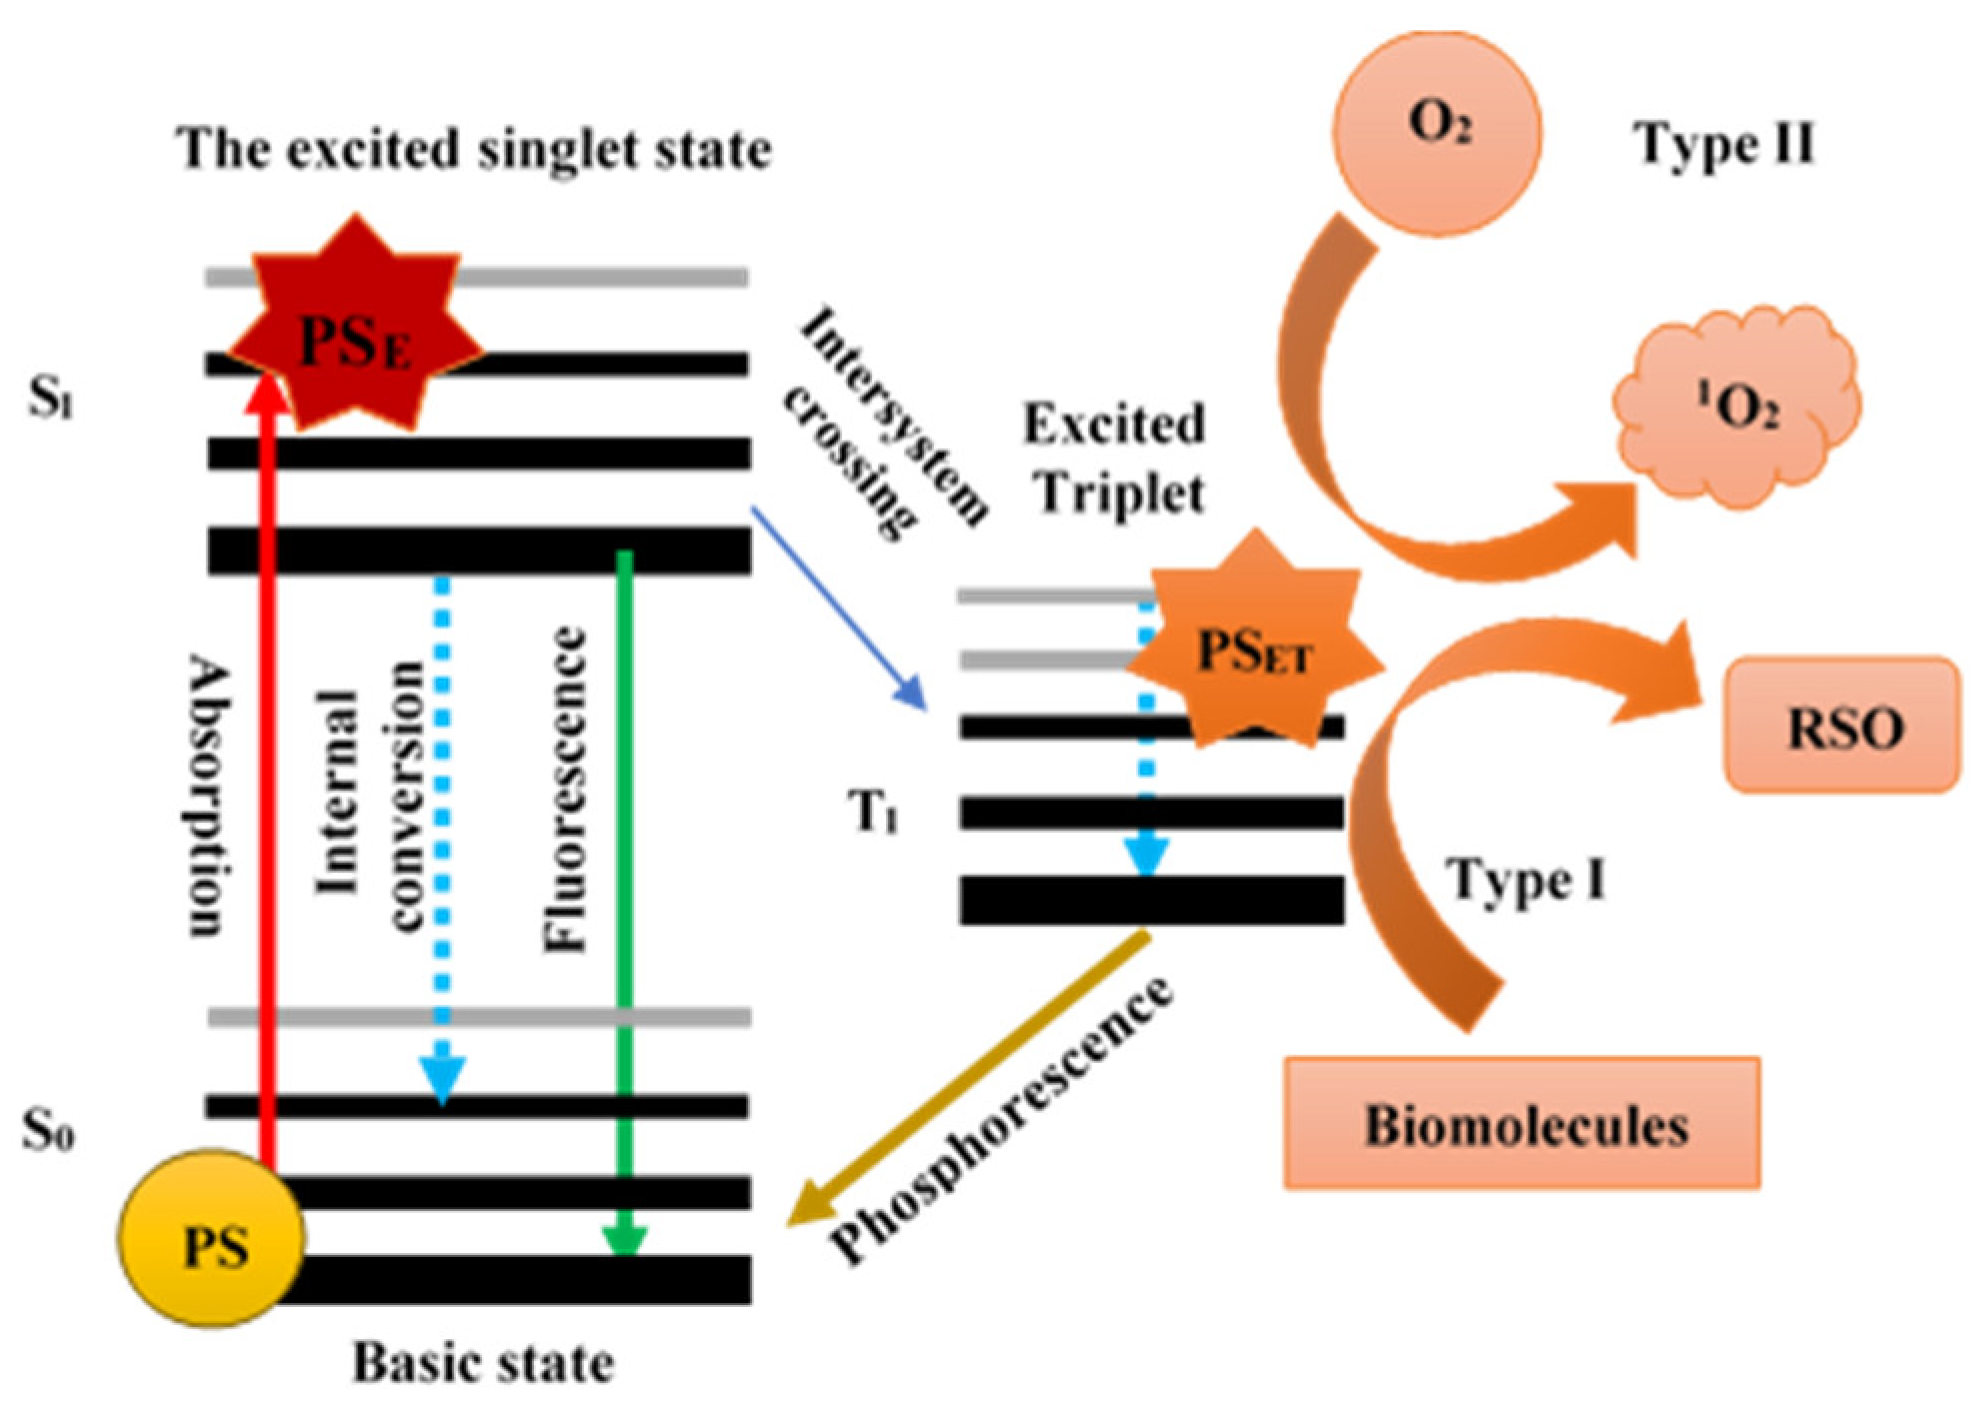
To better understand PDT, the mechanism of this process needs to be investigated. A detailed process of PDT involves a “photosensitizer” absorbing a sufficient dosage of light (hv), which causes an excitation from the ground state (S0) to a high-energy singlet state (S1). The latter state is extremely unstable, which results in the loss of energy and decay back to the ground state via fluorescence emission or heat production. Additionally, the excited singlet state can undergo the so-called “intersystem transition” to create a long-lived excited triplet state (T1), which shows higher stability than S1. A PS molecule in the T1 state can decay back to its ground state in two ways via: (1) transfer of energy to molecular oxygen (3O2) to form singlet oxygen (1O2) and PS in the ground state, and (2) formation of free radicals and “photosensitizer” anion radicals by hydrogen or electron transfer. Singlet oxygen and radical anions can react with oxygen to produce ROS, which can damage most types of biomolecules, including amino acids, lipids, and nucleic acids, thus inducing cell death and necrosis in proximal tissues (Figure 2) [39].
Currently, PDT is used in many localized precancerous conditions, solid tumors, oral precancerous lesions, and dermatologic squamous cell carcinoma of the head and neck [40,41,42,43,44,45,46]. In addition to cancer treatment, photodynamic therapy has become an intriguing new treatment modality in age-related macular degeneration (AMD) [47] and polypoidal choroidal vasculopathy (PCV) [41,48,49,50]. However, conventional photodynamic therapy also suffers from several problems, such as the depth of penetration of light into tissues and the efficiency of PS activation [51,52], oxygen dependence and oxygen consumption during PDT [53,54,55], PS biodistribution at the target site, and persistent skin and eye photosensitivity [56,57,58,59].
The aim of this study was to develop a method for the photodynamic release of curcumin from hierarchical zeolites, prepared based on faujasite-type zeolite and structure-directing agents, which enable the prolonged release of curcumin from the carrier under the influence of light in the range of 200 to 800 nm. Recently, we have published a paper regarding curcumin encapsulation [60]. In this paper, we present potential medical application of such a new curcumin-hierarchical zeolite hybrid.
2. Results
2.1. X-ray Diffraction Studies
XRD is a useful method for the preliminary evaluation of nanometer-sized materials, such as hierarchical zeolites.
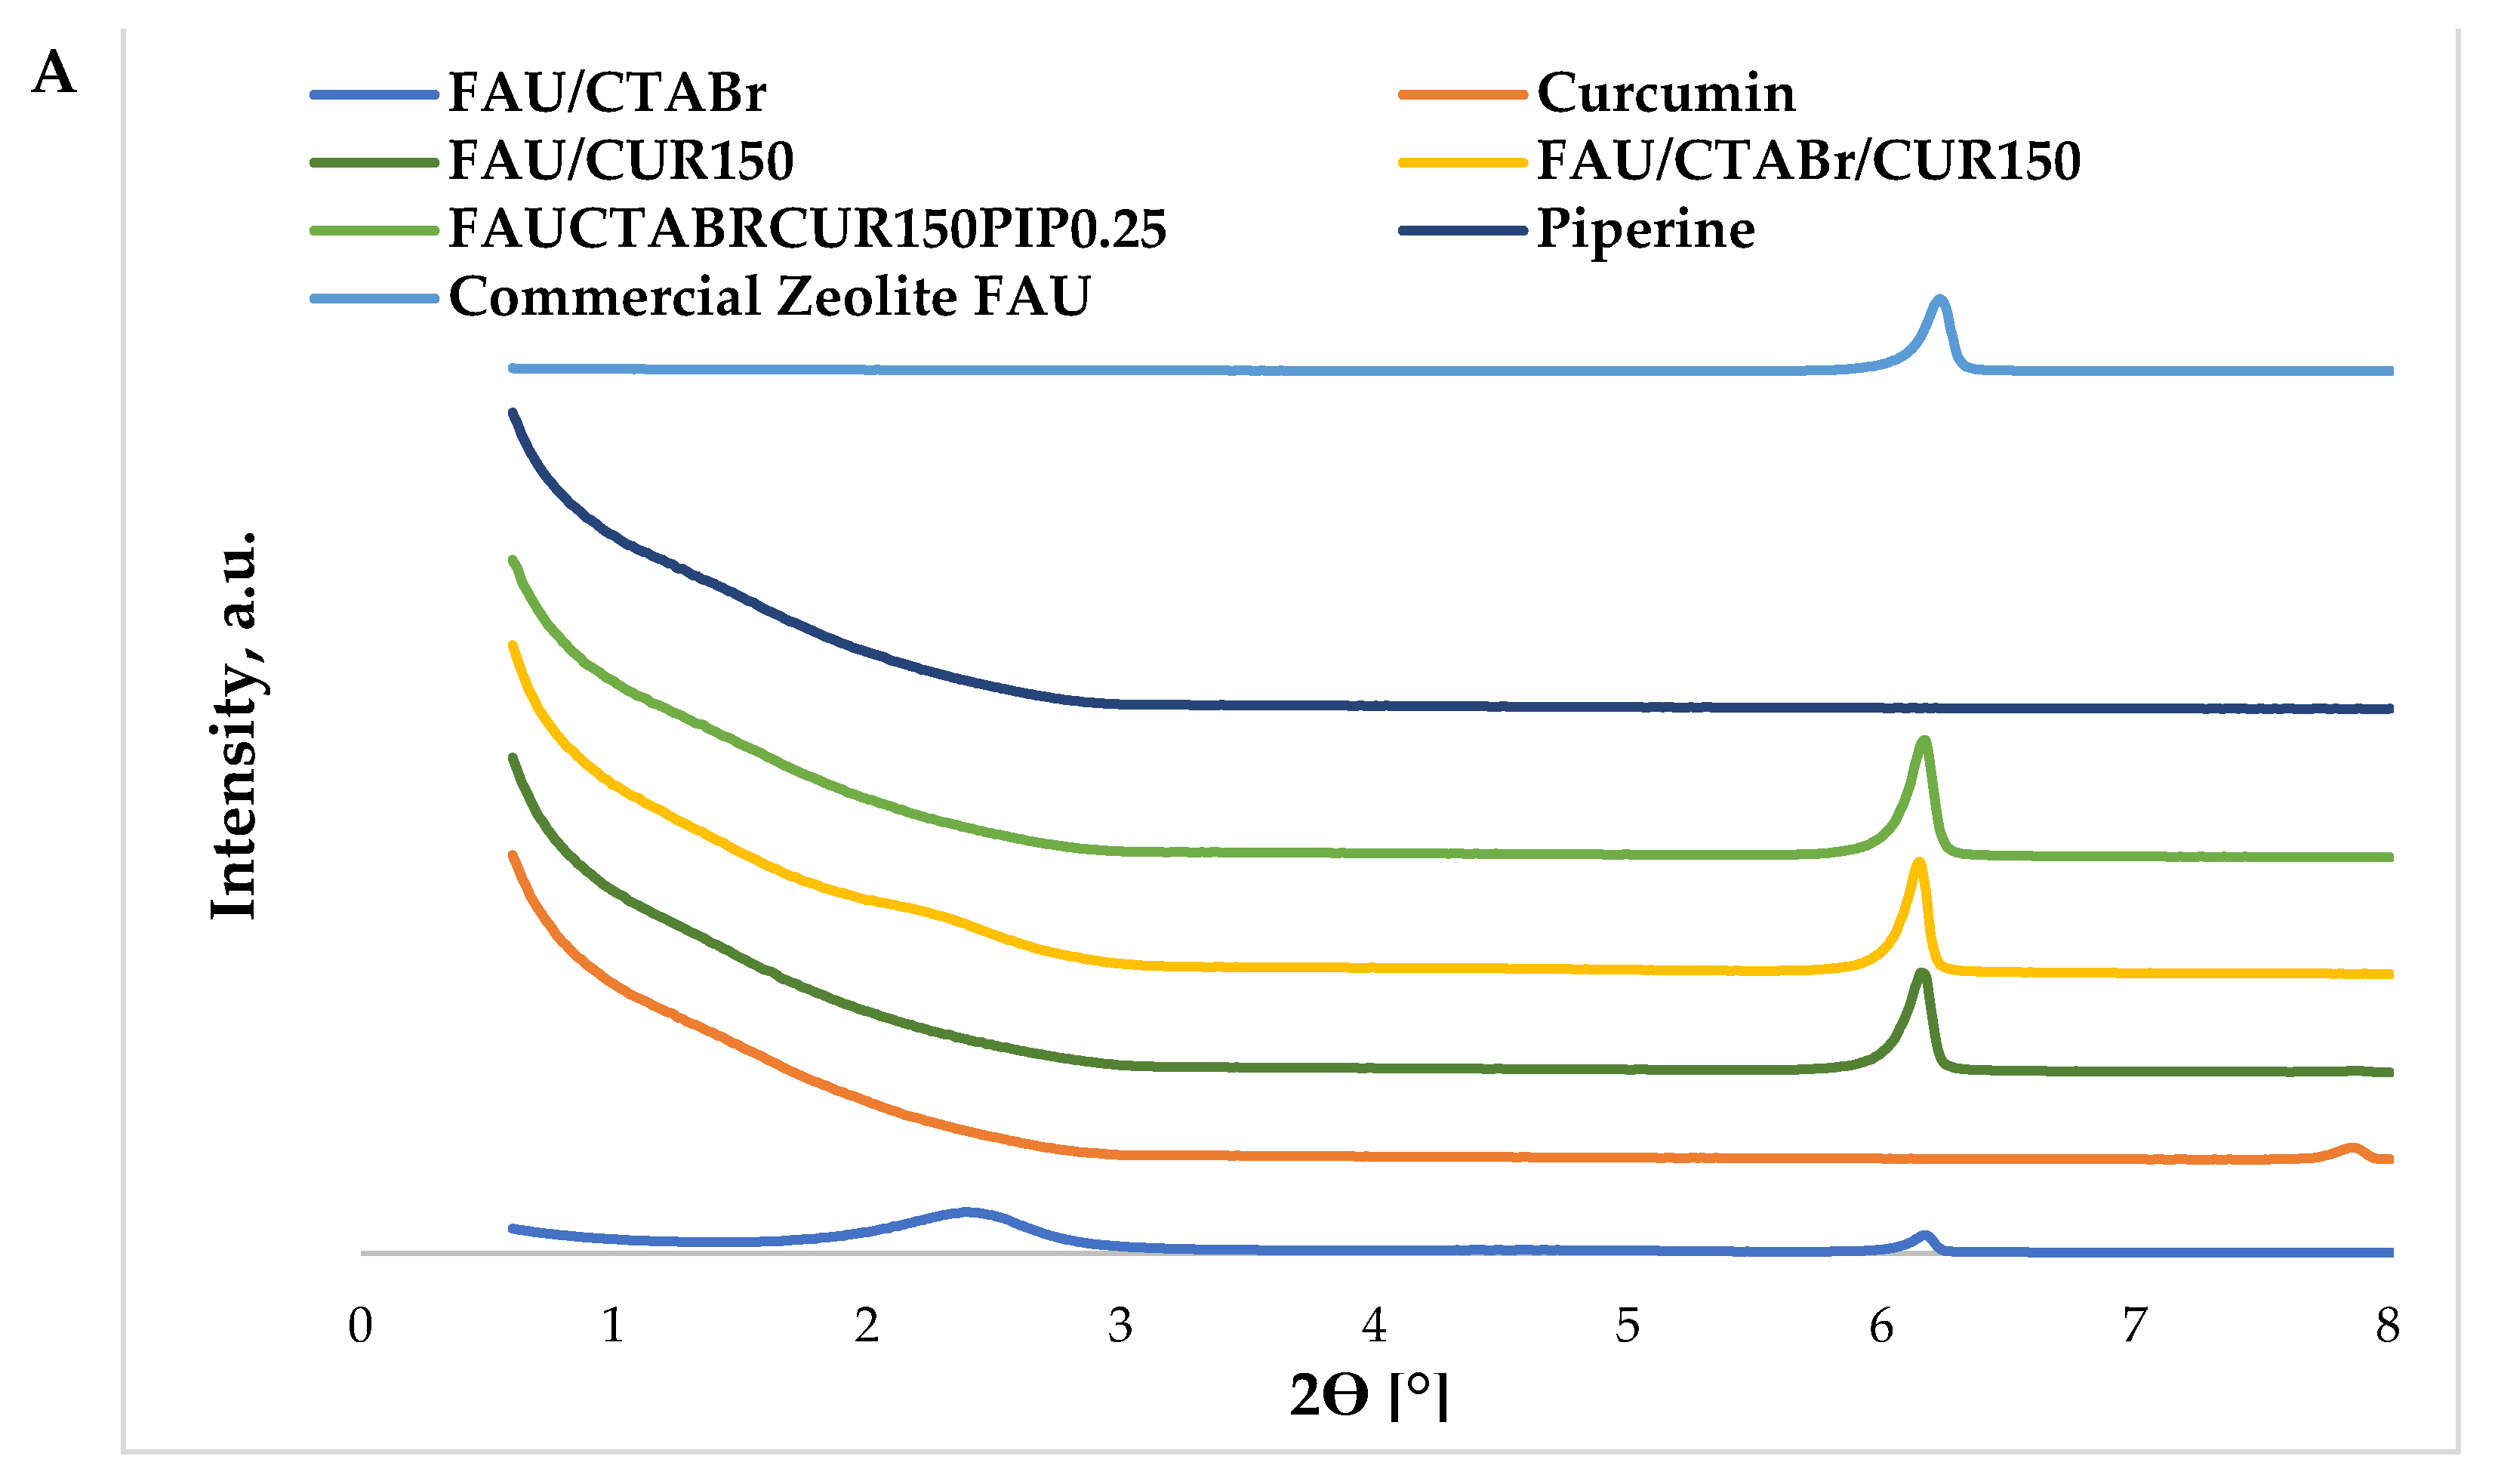
The diffractograms presented in the low-angle range (panel A in Figure 3) juxtapose commercial FAU zeolite, pure curcumin, and hierarchical zeolites without curcumin and with curcumin applied. For the pure hierarchical zeolites, a broad and strong signal visible at 2θ~2.5° confirms the presence of additional mesopores in the hierarchical structure. This signal is not observed in the XRD pattern of commercial material and pure curcumin. A small reflection at an angle of 2ϴ at about 7.5~8.0° is observed on the diffractogram of the pure active substance; this is a characteristic reflection for curcumin. This signal is not visible for zeolite samples packed with the active substance. In the case of XRD patterns of curcumin-loaded samples, a small signal visible in the range of 2θ~2.5° confirms the presence of additional mesopores of the hierarchical materials [61]. Compared to pure hierarchical zeolite (FAU/CTABr), the diffractograms of curcumin-loaded materials show that the intensity of reflections weakens and shifts toward higher angles, which may be due to the pore filling or a decrease in the contrast of X-ray scattering between the organic part and the channel walls of the silicate skeleton [62].
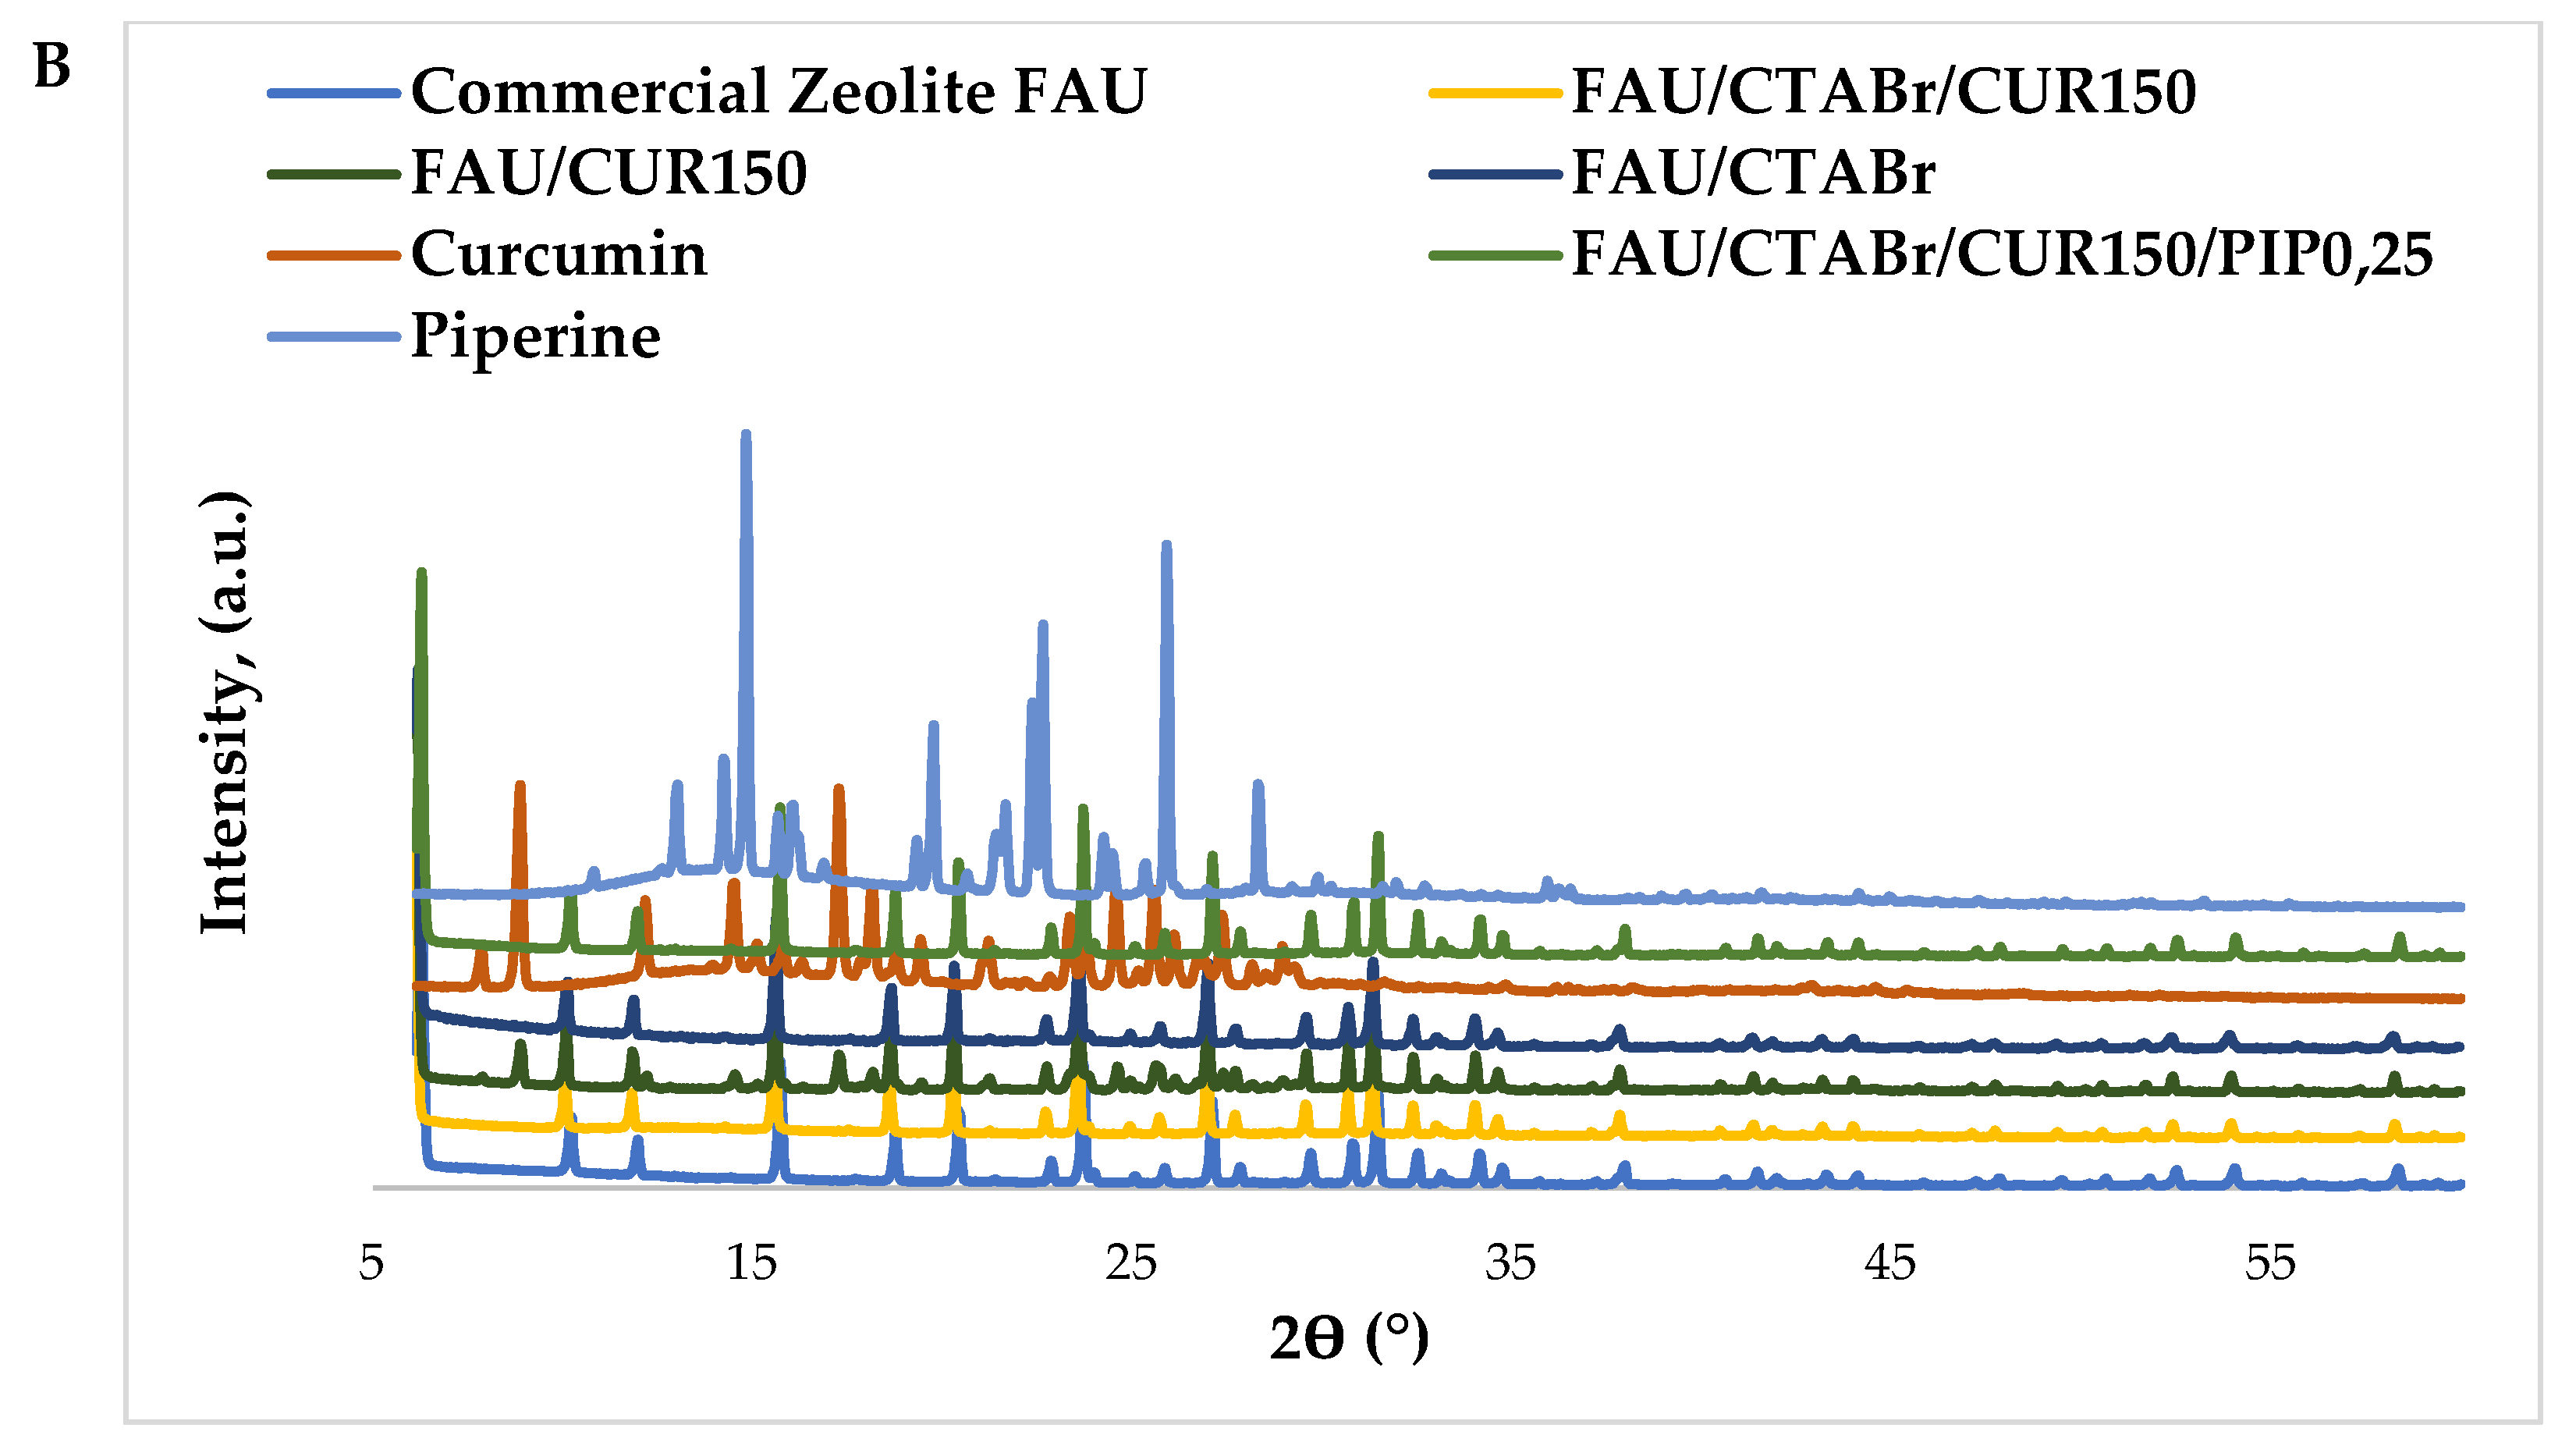
By analyzing the high-angle diffractograms of the tested materials (panels B in Figure 3), one can see that the crystalline structure of the microporous commercial FAU-type zeolite is preserved. The pure curcumin diffractogram shows two distinct sharp reflections at angles of 2ϴ = 9.0° and 17.4°, which are not observed in the diffractograms of the curcumin-loaded materials. Analyzing the diffractograms of pure hierarchical zeolites and those loaded with curcumin, no significant changes are visible in the characteristic peaks of the zeolite after loading with the active substance, indicating that the structure did not change during the curcumin incorporation process [61].
2.2. Nitrogen Adsorption/Desorption Isotherms
Through sorption studies, it is possible to determine the textural properties of the obtained materials, namely, the specific surface area, the volumes of micropores and mesopores, the total pore volume, the pore size, and the pore size distribution.
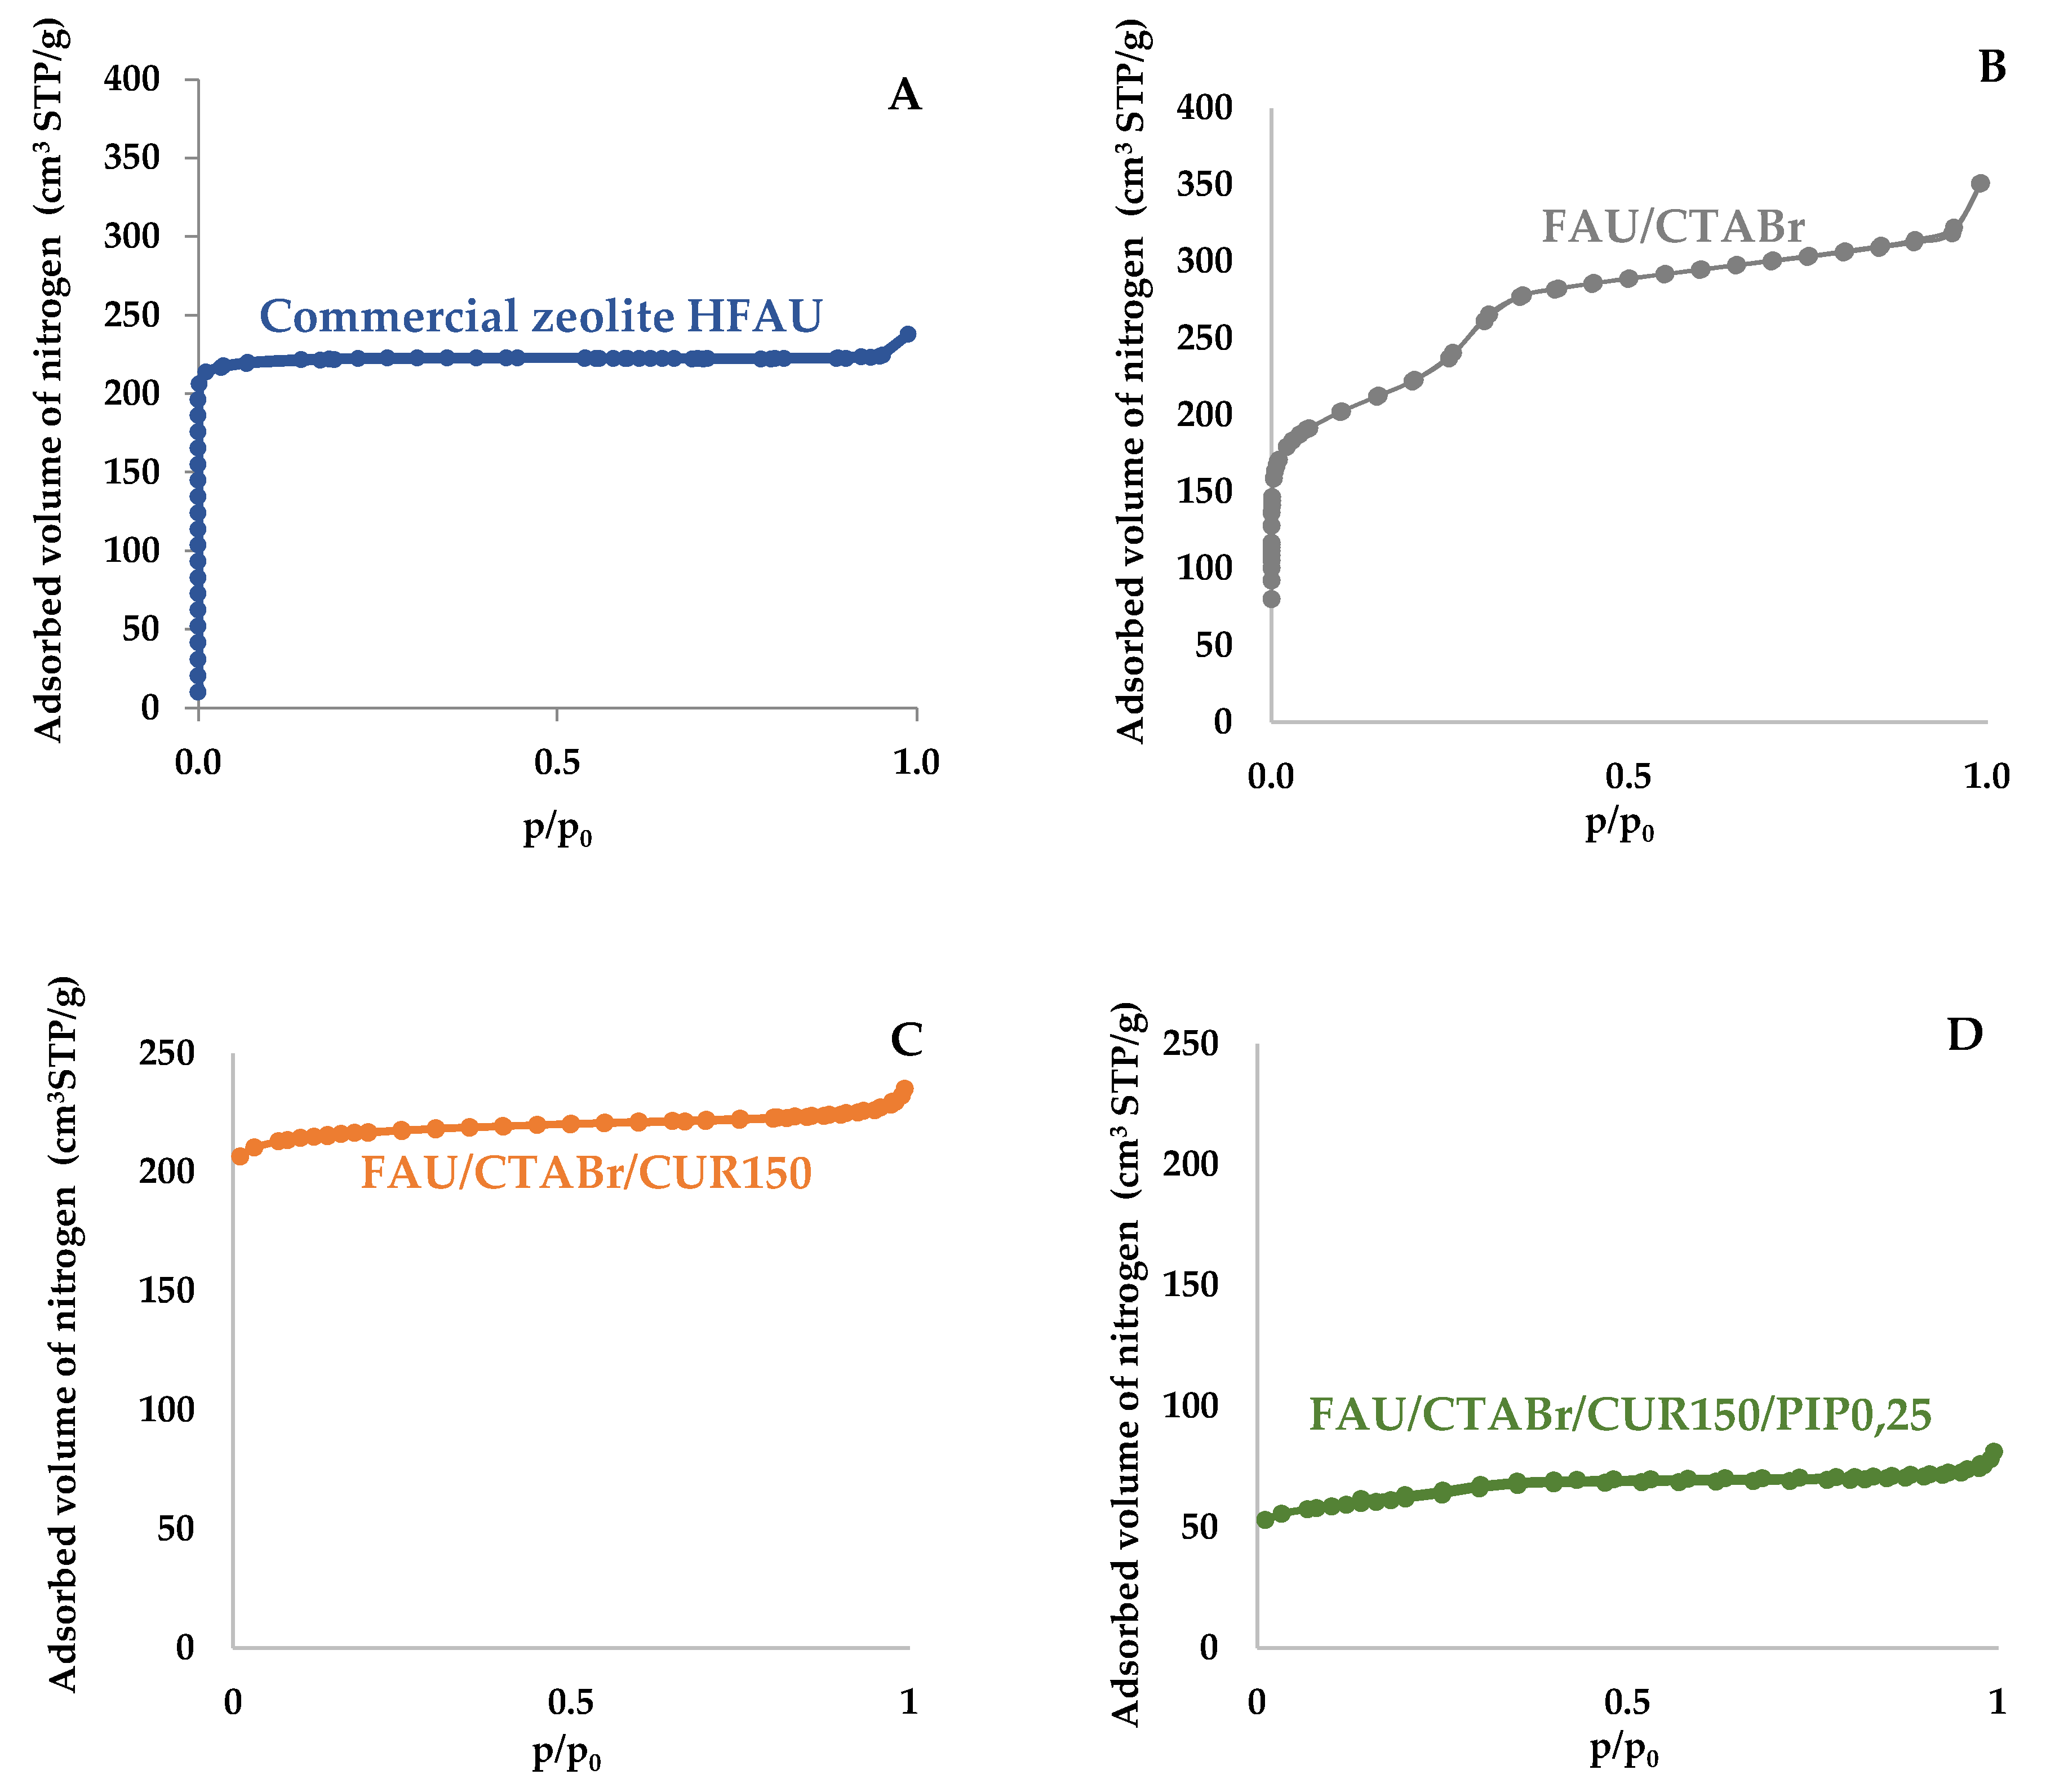
By analyzing individual nitrogen adsorption/desorption isotherms, one can estimate the type of isotherm. The isotherm for commercial FAU-type zeolite (panel A in Figure 4) is type I according to the IUPAC classification. Type I adsorption isotherms, which sharply rise at low pressures, are typical for microporous solids. For hierarchical zeolites synthesized based on CTABr and TEOS, the resulting isotherms are a mixture of type I and IVb. According to the IUPAC classification, the type IVb isotherm is characteristic for materials with conical and cylindrical mesopores (panel B in Figure 4). Zeolite materials with incorporated curcumin and those containing curcumin and piperine are also a mixture of type I and type IVb (panels C and D in Figure 4). Based on the isotherms shown in Figure 4, it is possible to confirm both the presence of micropores, which are directly related to the crystal structure of zeolites (primary porosity), and mesopores (secondary porosity) created as a result of the modification procedure [63].
The specific surface area (SBET) for the zeolite samples was obtained by the Brunauer–Emmett–Teller (BET) method and varies from 203 to 892 m2/g. The largest SBET value is for the hierarchical zeolite based on CTABr. On the contrary, the zeolite materials containing curcumin and piperine showed the lowest specific surface area compared to the commercial zeolite. As can be seen from the adsorption measurements, the specific surface area and average pore size of the functionalized FAU-type hierarchical zeolite decrease with increasing amounts of active ingredient (Table 1). It is believed that during evaporation of acetone and incorporation of curcumin because of its hydrophobic nature, curcumin may agglomerate into nanoparticles of larger sizes. This is because hydrophilic silanol groups are present on the surface of the carrier material [64].
Furthermore, partial amorphization of the layered phase of hierarchical zeolites during curcumin anchoring may also contribute to the observed decrease in the obtained parameters [65].
The data presented demonstrate the introduction of an additional modifying agent into zeolite materials. All the results confirm the successful application of curcumin to the zeolite carrier.
2.3. FT-IR Spectroscopy
The functional groups of the zeolite carriers were characterized by the FT-IR method (Figure 5). Infrared spectroscopy is one of the most versatile research methods that use infrared radiation absorption.
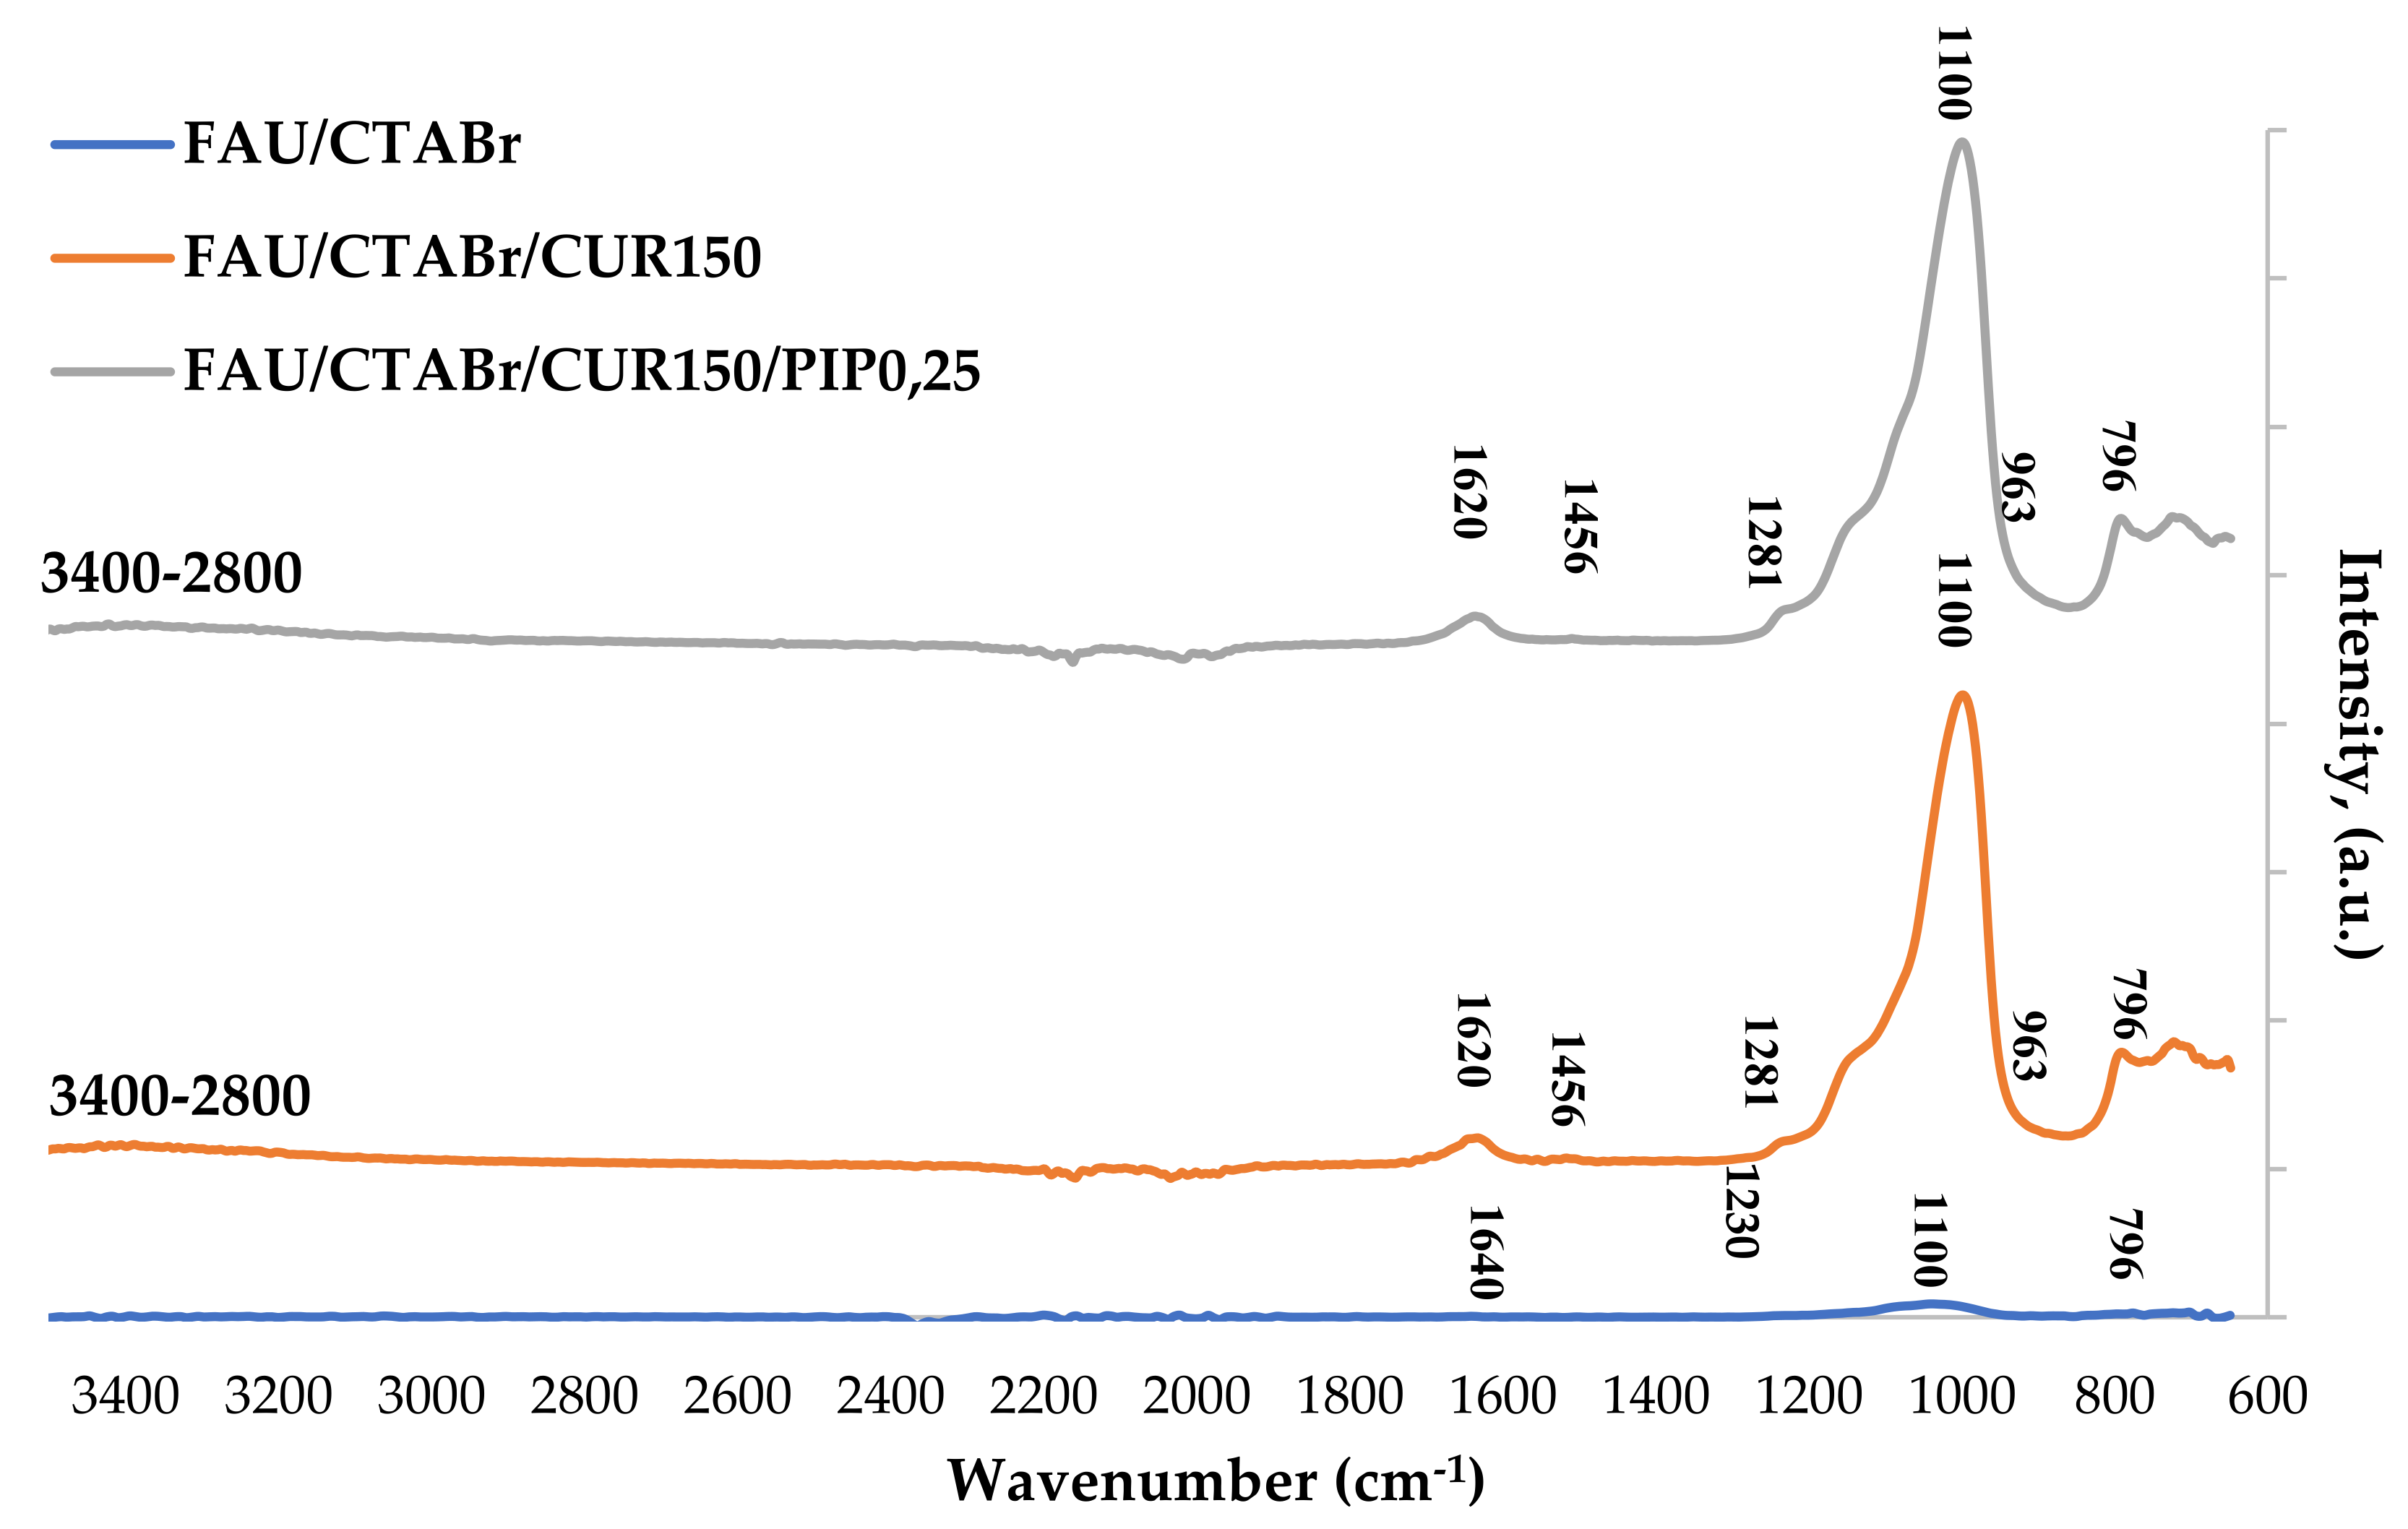
The absorption band at about 1230 cm−1 on the FT-IR spectrum of pure hierarchical zeolite (FAU/CTABr) can be attributed to the valence stretching vibrations for asymmetric Si-O-Si bonds. The band at ~796 cm−1 may come from valence-stretching vibrations of the symmetric Si-O-Si bonds. The absorption band at about 1650 cm−1 may refer to the bending vibrations in physically adsorbed water molecules. The band at about 1100 cm−1 is attributed to the asymmetric vibrations of the Si-O-Si of the silica matrix. Characteristic bands corresponding to lattice vibrations have also been observed between 1700 and 800 cm−1. The broadband at 1013 cm−1 is related to the asymmetric stretching vibrations of the Si-O groups, while the band at 1640 cm−1 can be associated with O-H deformation [66].
Several most characteristic bands have been assigned to the spectrum of pure curcumin, including bands at 2917, 2849, and 1427 cm−1, which can be attributed to HC stretching vibrations and deformation vibrations of methyl groups. The bands at 1627 and 1502 cm−1 correspond to C=C, C=O, and C-C stretching vibrations of the benzene ring, while olefinic C-H bending vibrations appear at 1438 cm−1 and aromatic C-O stretching vibrations at 1274 cm−1. The bands at 1025 and 963 cm−1 can be assigned to C-O stretching and out-of-plane bending of aromatic C-H bonds, respectively [67].
Evidence for an interaction between curcumin molecules and the FAU zeolite backbone was also confirmed using Fourier transform infrared (FT-IR) spectroscopy. For the FAU/CUR150 and FAU/CUR150/PIP0.25 complexes, characteristic bands are found at approximately 1456 cm−1 (C═C) and 1620 cm−1 (C═N). For curcumin-loaded zeolite, the FT-IR spectrum shows bands in the 3000−2800 cm−1 region with two specific bands (2917 and 2849 cm−1) that occur in the spectrum of pure curcumin but not in the spectrum of FAU zeolite. Therefore, these bands can be attributed to the presence of curcumin in the hierarchical zeolite. The characteristic bands of curcumin are also shifted from 1506 to 1512 cm−1, from 1438 to 1442 cm−1, and from 1274 to 1281 cm−1 due to the formed hydrogen bonding between the carrier’s hydroxyl groups and the functional groups of curcumin such as phenolic hydroxyls, enolic C-OH and methoxyl groups [68].
2.4. Elemental Analysis
Elemental analysis was accomplished to obtain the exact composition of the zeolite samples studied. The results show the estimated carbon and hydrogen content (wt.%) in the tested materials (Table 2). The elemental analysis confirmed the effective modification of both the commercial FAU type material and the hierarchical zeolites with curcumin.
Elemental analysis of pure curcumin shows the presence of 30.26 wt.% C and 4.61 wt.% H, which can be attributed to the structure of the active substance (curcumin contains up to 21 carbon atoms and 20 hydrogen atoms). According to data from the literature, the theoretical values of carbon and hydrogen in curcumin are similar to those obtained experimentally [69]. While carbon % in the commercial zeolite FAU and hierarchical zeolite is very small (below 1%); this percentage is much higher after introducing curcumin into both commercial FAU-type zeolite and hierarchical zeolite, which confirms a successful incorporation of curcumin in the pores and on the surface of the materials studied.
2.5. Thermogravimetric Studies
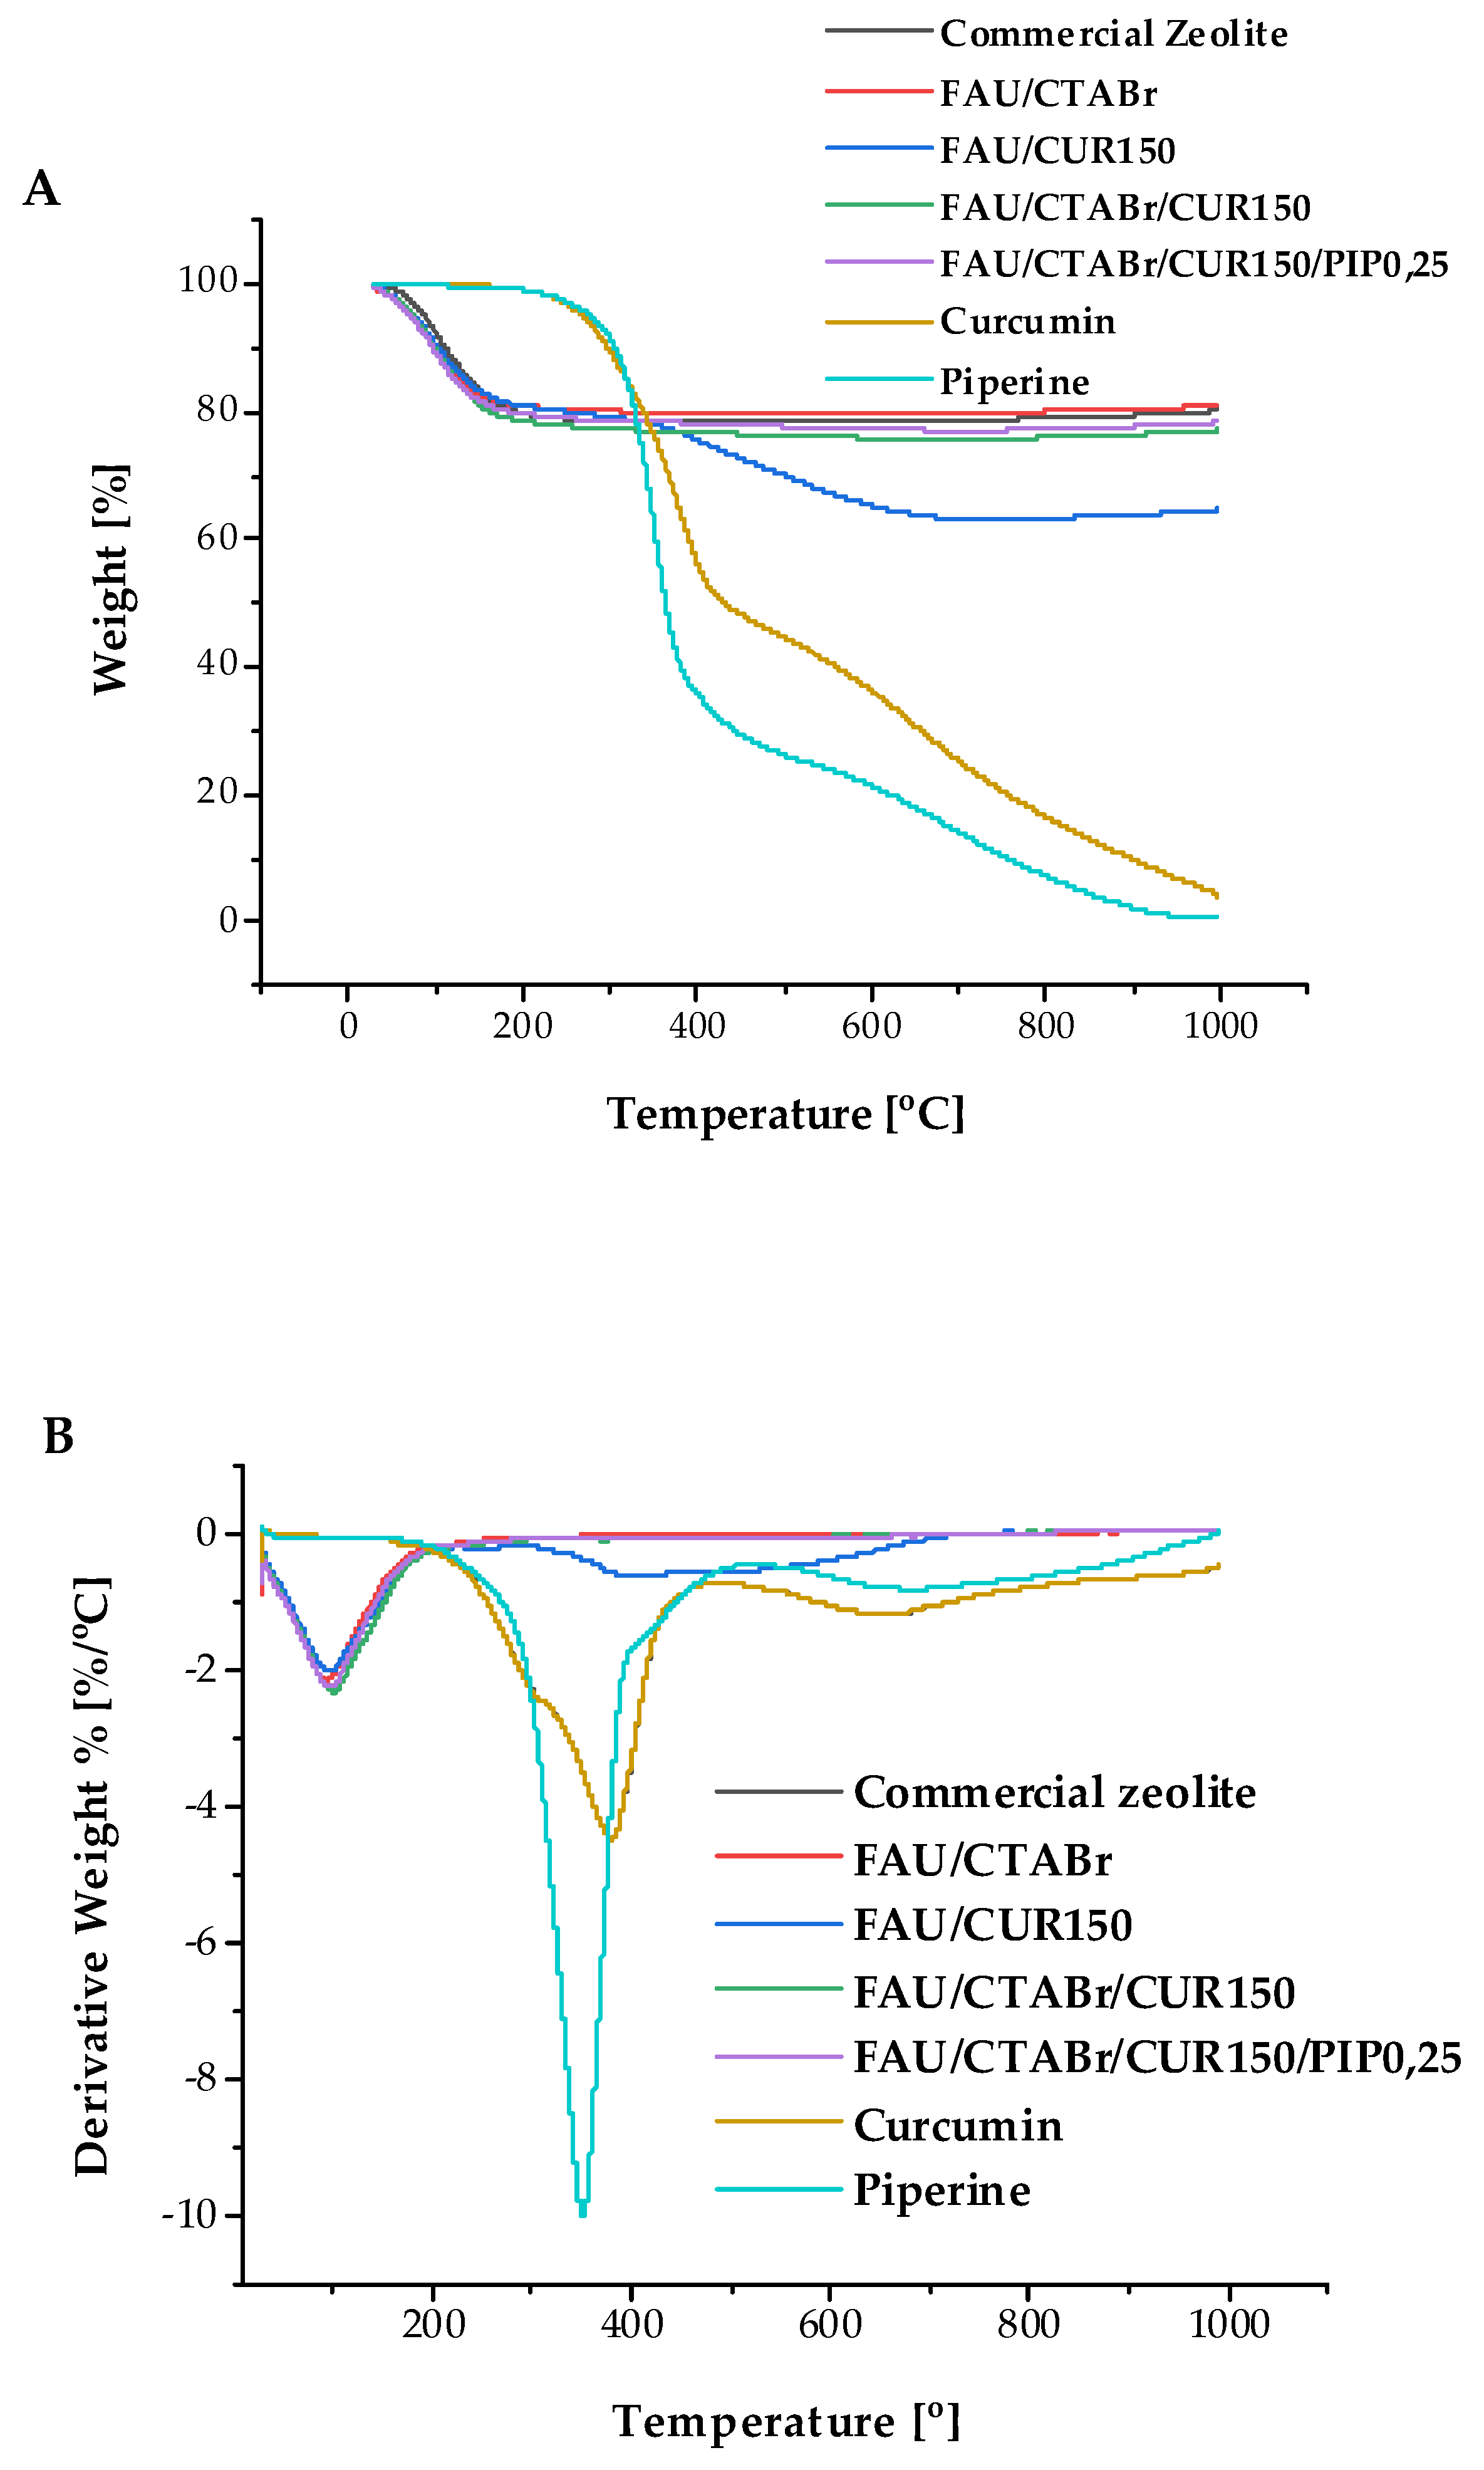
Figure 6 shows the TG (panel A in Figure 6) and DTG (panel B in Figure 6) profiles of commercial zeolite, hierarchical zeolites, active substances, and zeolites with incorporated curcumin and piperine.
The TG profiles (panel A in Figure 6) for both commercial zeolite FAU and hierarchical zeolite with and without active substances (FAU/CTABr, FAU/CTABr/CUR150, FAU/CTABr/CUR150/PIP0,25) show that the mass loss starts at temperatures as low as ~50 °C, which is directly related to the dehydration of the samples [70]. The thermograms of the materials containing curcumin (FAU/CTABr/CUR150, FAU/CTABr/CUR150/PIP0,25) mainly show the mass loss associated with water loss, which may indicate the incorporation of curcumin into the pores of the zeolite. Two significant mass losses can be observed for the commercial FAU zeolite containing curcumin (FAU/CUR150). The first one that occurs at around 50 °C (a loss of ~5.00%) is directly related to the loss of water from the zeolite material. On the other hand, the second one (a mass loss of 25.00%) is observed at around 340 °C and is related to the mass loss of curcumin on the surface of the commercial zeolite [71]. The TG curve of pure curcumin shows the mass loss starting at about 200 °C. The observed mass loss is 100% at 1000 °C, which means that curcumin has been completely decomposed. Thermal decomposition of curcumin occurs in two stages. TG analysis suggests that stage (I) is due to the decomposition of functional groups in curcumin, and stage (II) is due to decomposition of two benzene rings in curcumin. Analyzing the TG profile of piperine, a mass loss is observed at approximately 210 °C. The TG curve of piperine shows the mass loss of about 38.00% at 344 °C and almost 65.00% at 500 °C [72,73].
The DTG profiles (panel B in Figure 6) indicate the presence of exothermic effects typical for the FAU zeolite and the materials synthesized on its basis, which do not cause structural changes. The curves obtained are the result of thermal dehydration, during which a given material releases physically and chemically bound water. The DTG curves for all synthesized materials show an intense peak at 100 °C, resulting from the onset of thermal dehydration. At about 300 °C, the stabilization of the system occurs, hence the lack of effect on the DTG curve [70]. A commercial zeolite containing curcumin is an exception, since its mass loss occurs in two steps as explained above, and stabilization of the system occurs only at about 800 °C. In the DTG thermogram, thermal decomposition of pure curcumin occurs in two stages. There is an inflection point (broad downward peak) at about 300 °C on the DTG curve, which can be considered as the end point of stage I. Thus, stage I, in which the mass loss is 50%, starts at about 200 °C and ends at about 450 °C. Stage II, whose mass loss exceeds 50%, begins at about 425 °C and gradually continues to 1000 °C, which is associated with a DTG peak at about 650 °C. The DTG curves for piperine show an intense peak at 350 °C, resulting from the onset of thermal dehydration [72,73]. Similar results were presented elsewhere [70,71,72,73].
2.6. Scanning Electron Microscopy (SEM)
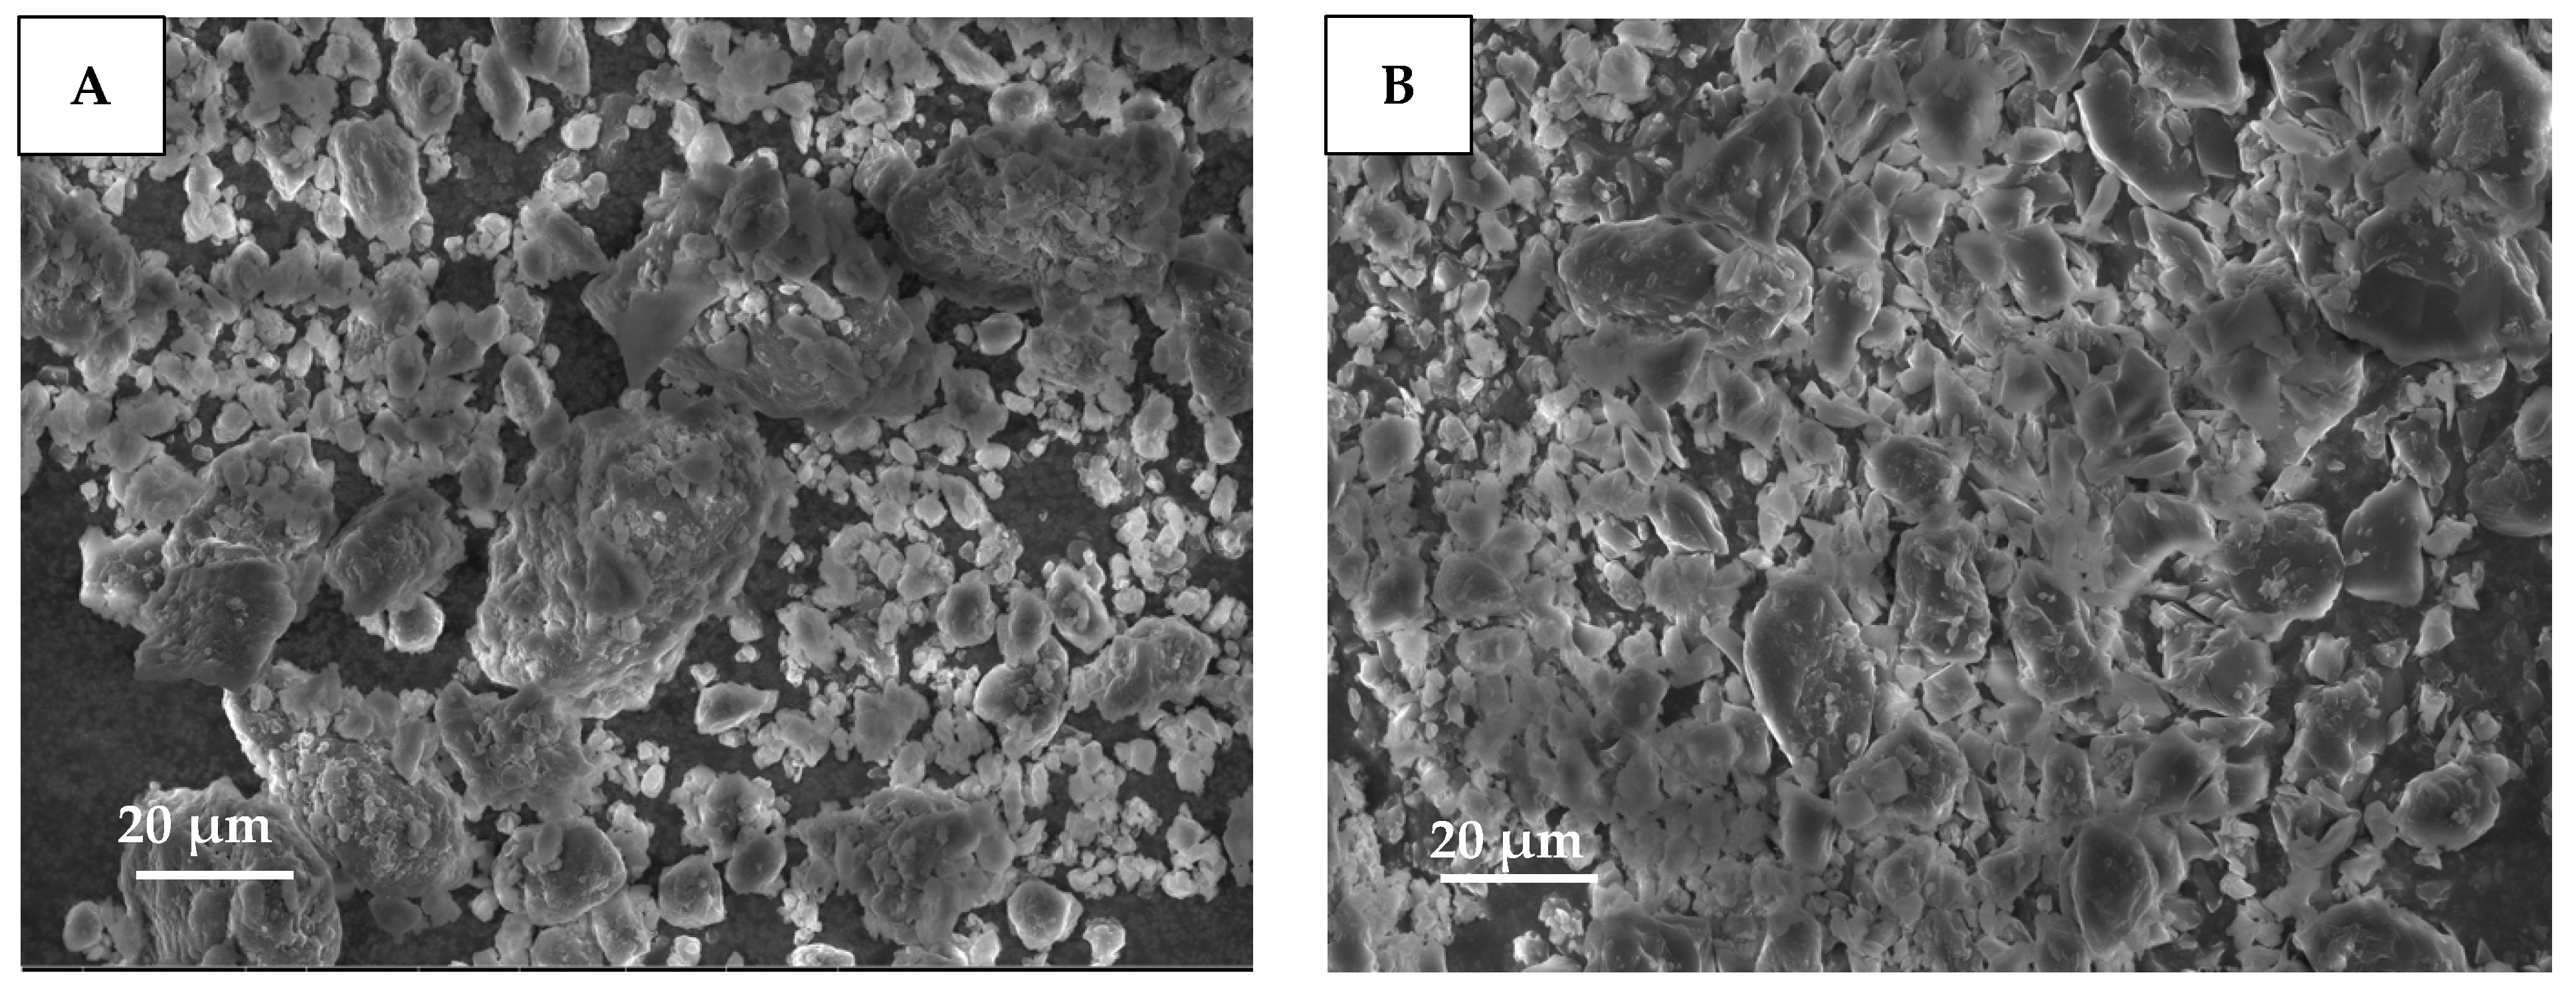
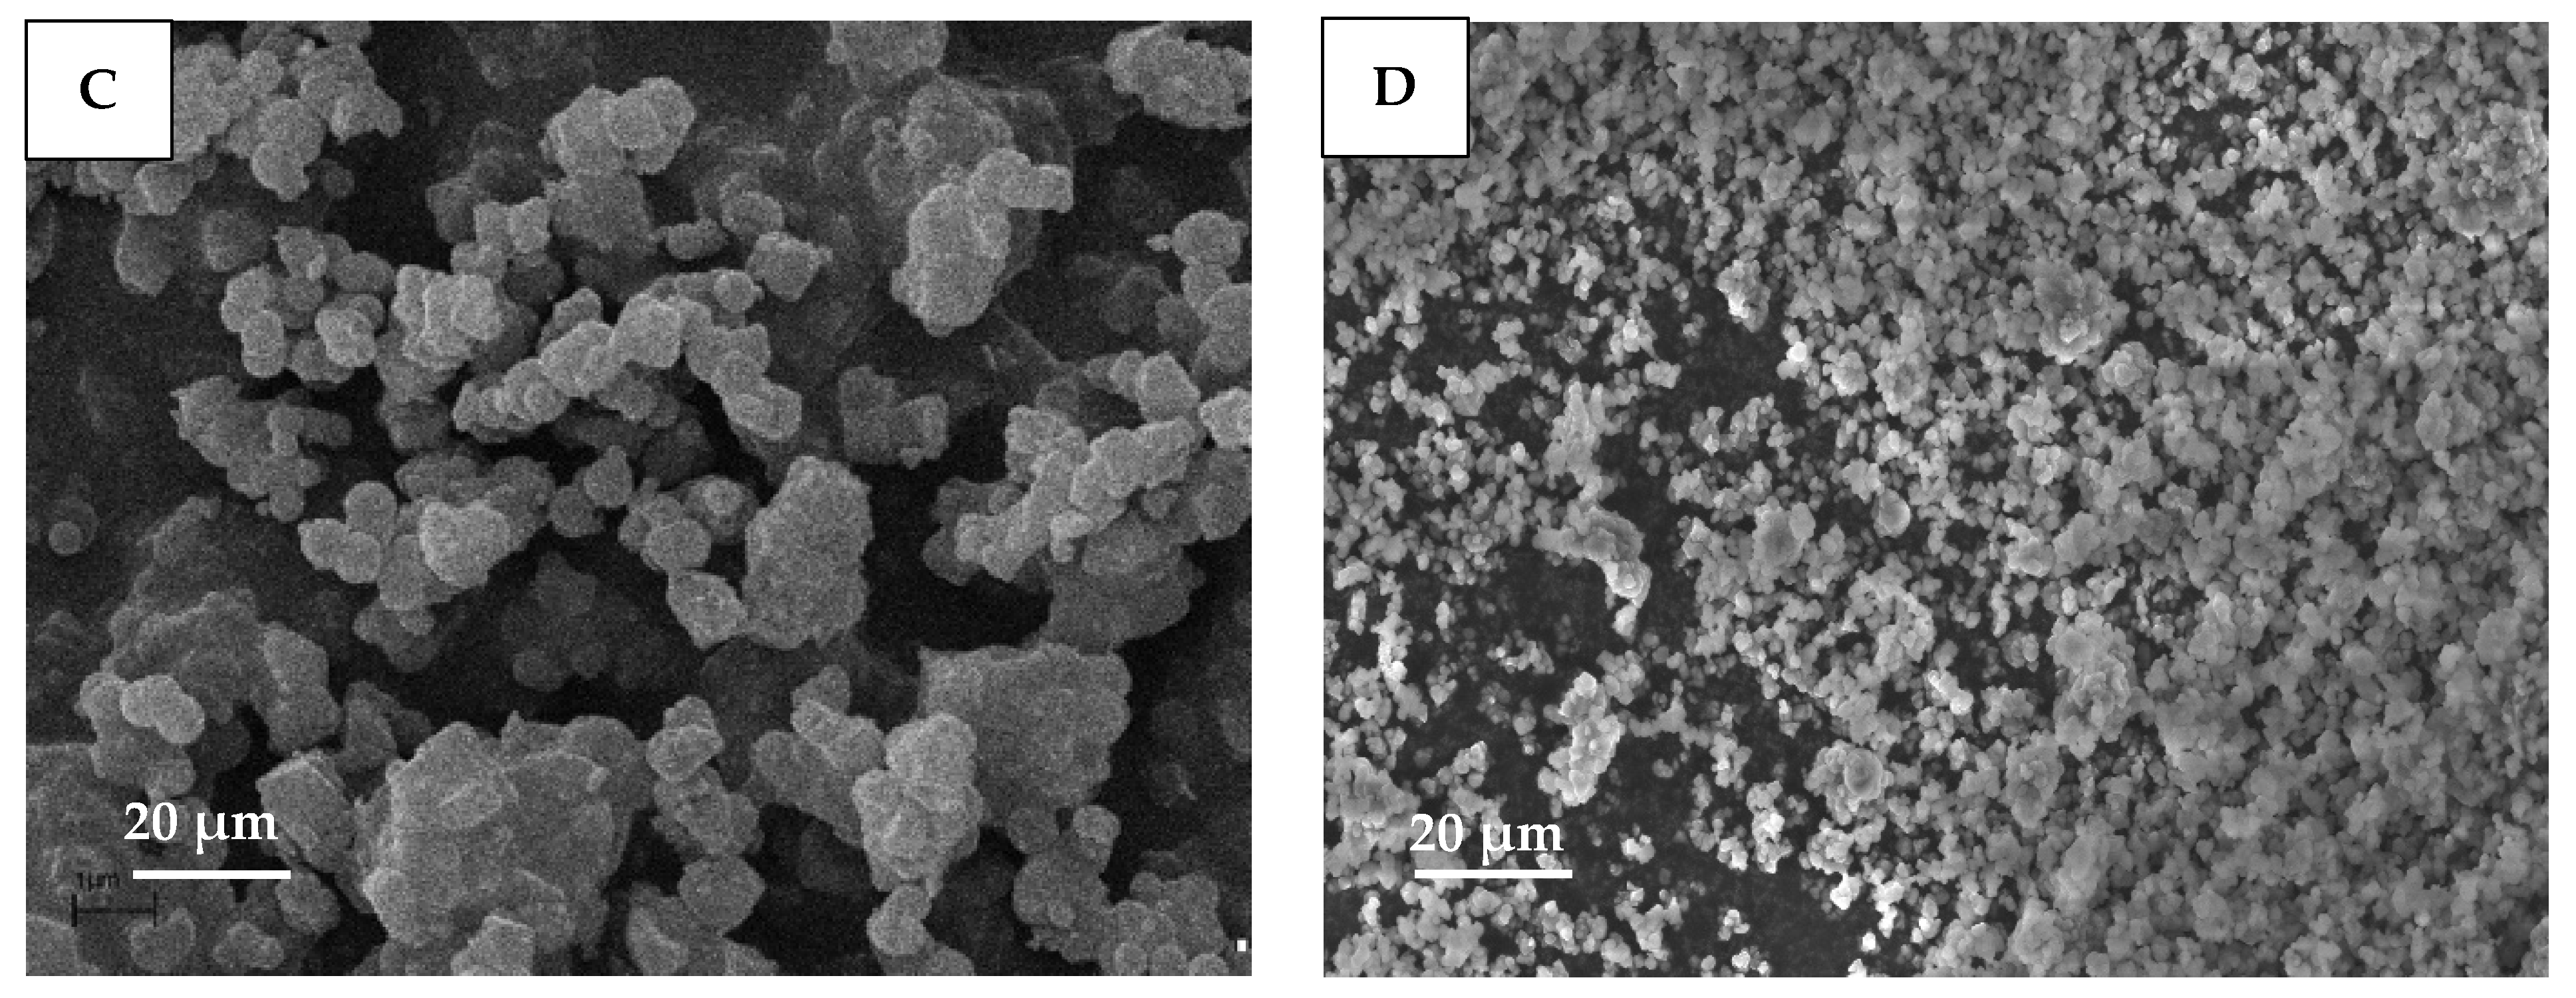
Scanning electron microscopy (SEM) was used to determine the morphology of the zeolite materials before and after incorporation of curcumin. SEM images of the materials studied at 20 μm magnifications are shown in Figure 7.
Figure 7 shows SEM images of curcumin, piperine, pure hierarchical zeolite, and hierarchical zeolite with curcumin. The image of pure curcumin (panel A in Figure 7) shows irregularities in shape and average particle size. In the case of piperine (panel B in Figure 7), more regular and smoother structures are visible, having somewhat smaller particles than those of curcumin. The SEM microscopic image of the pure hierarchical zeolite (panel C in Figure 7) shows agglomerates with irregular shape and visible roughness. However, the SEM image of hierarchical zeolite with curcumin (panel D in Figure 7) shows no significant changes in the size and morphology of the curcumine after being introduced into zeolite. It can be concluded that curcumin can be adsorbed on the surface of the zeolite or in pores, and this process has no significant effect on the size and morphology of hierarchical zeolite [67,68,74,75,76]. It was previously stated that on the hydroxylated surfaces, such as zeolitic ones, curcumine is well dispersed [77].
2.7. Confocal Microscopy
Through confocal microscopy, the autofluorescence of pure curcumin was observed. By monitoring the sample, the incorporation of the active ingredient into the structure and onto the surfaces of the FAU-type hierarchical zeolite was confirmed (Figure 8).
Curcumin has fluorescent properties; thus, the autofluorescence changes observed on the images help us locate curcumin in hierarchical zeolites. The highest autofluorescence intensity is visible for pure curcumin, and with the changes in curcumin autofluorescence shown above, we can assess the distribution of curcumin (localization) in the hierarchical zeolite. For hierarchical zeolite samples with incorporated curcumine, the active ingredient was found to be concentrated in the form of small clusters [78]. In addition, confocal microscopy studies show negligible autofluorescence properties of pure hierarchical zeolites. Observing confocal microscope images of the material with applied curcumin and piperine, one can see that the autofluorescence of the active ingredient is much lower (piperine was applied in smaller amounts, and thus, the distribution of this ingredient is much more homogeneous). It is presumed that this is due to the overshadowing of curcumin molecules by piperine molecules (piperine has autofluorescence properties as well).
2.8. Encapsulation Efficiency and Loading Capacity of Curcumin
Encapsulation efficiency (EE) and loading capacity (LC) are important factors to consider when evaluating the success of a DDS. The release of the active substance from hierarchical zeolites and the target effectiveness of the carriers containing curcumin depend on the EE and LC values [79]. The results of the encapsulation efficiency and loading capacity of curcumin into hierarchical zeolites are presented in Table 3.
The encapsulation efficiency of curcumin is the highest in the case of FAU/CTABr/CUR150/PIP0,25 (78.9%) and loading capacity (20.4%). The lowest efficiency of curcumin encapsulation is for commercial FAU zeolite (FAU/CUR150; 55.8%), and the loading capacity is 9.7%. As expected, the best parameters are for hierarchical zeolite.
2.9. UV–Visible Spectroscopy
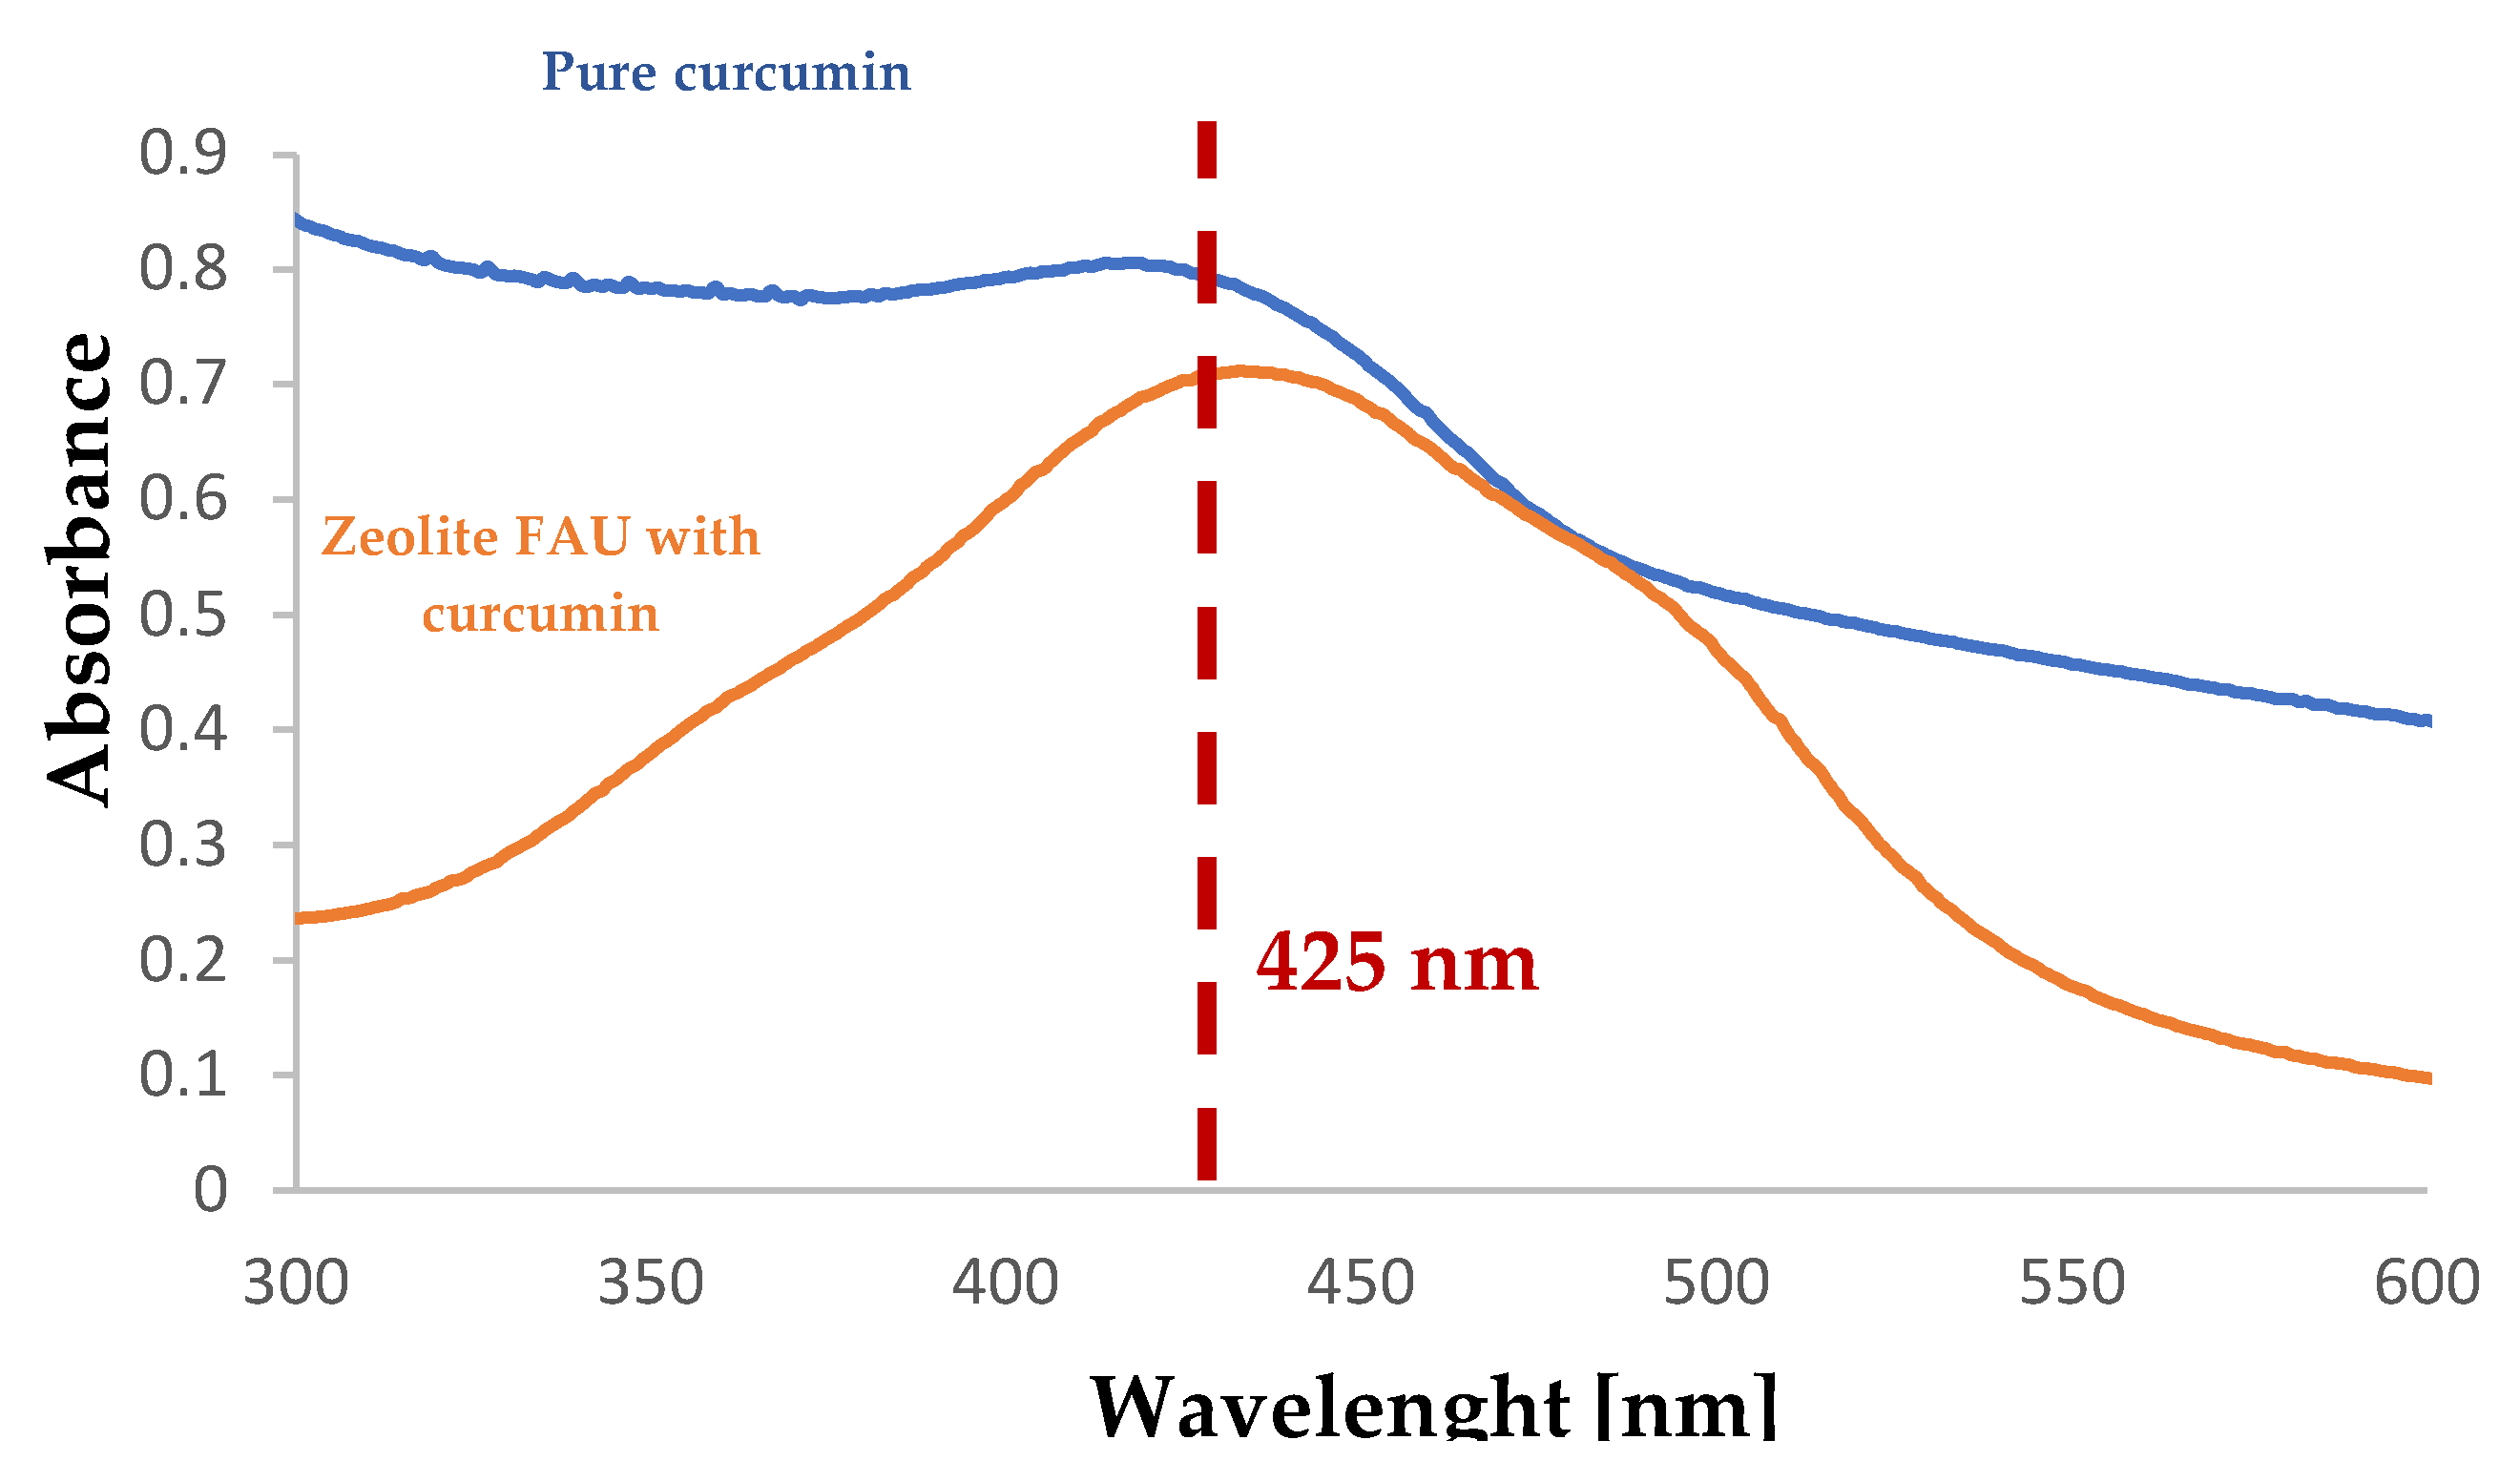
UV–vis spectroscopy makes it possible to determine the absorption properties of the tested compound. Each substance has a characteristic UV–vis spectrum and wavelength. According to literature data, pure curcumin has a wavelength of 415–430 nm [80]. Figure 9 shows the UV–vis spectra of pure curcumin in acetone and curcumin loaded on zeolite in acetone.
After the loading process, solutions of pure curcumin and zeolite with loaded curcumin were separated by sedimentation and analyzed by UV–vis spectroscopy. In the UV–vis spectra (Figure 9), the presence of curcumin and curcumin residues when combined with zeolite FAU was confirmed by the appearance of an intense band at λmax = 425 nm.
2.10. Open System Release Study of Curcumin
The controlled release of active substances from pharmaceutical compounds is important for evaluating their efficacy. The subject of this study was the release of curcumin from zeolite materials into the acceptor fluid, which was phosphate buffer (pH = 5.8) with glycerine. The use of UV–vis spectroscopy in release studies allows us to determine the release kinetics of the bioactive substance from the carrier to the acceptor medium. As a result of the release of curcumin from the hierarchical zeolite, there is a change in its concentration in the acceptor solution. Thus, the amount of substance released is calculated based on the observed change in absorbance over time according to the Lambert–Beer law. This measurement was carried out at the analytical wavelength of the test compound (425 nm). The results of the in vitro release kinetics of the active substance are presented in the form of a release profile showing the dependence of the % release of the active substance on time. The availability of the active substance is measured under laboratory conditions and determines the amount of substance that is released from the carrier and passes into the acceptor fluid. Active substance release studies were conducted for the FAU/CTABr/CUR150 system. Each measurement was repeated three times, and the mean value and standard deviation were calculated. Figure 10 shows the curcumin release profiles from hierarchical zeolites.
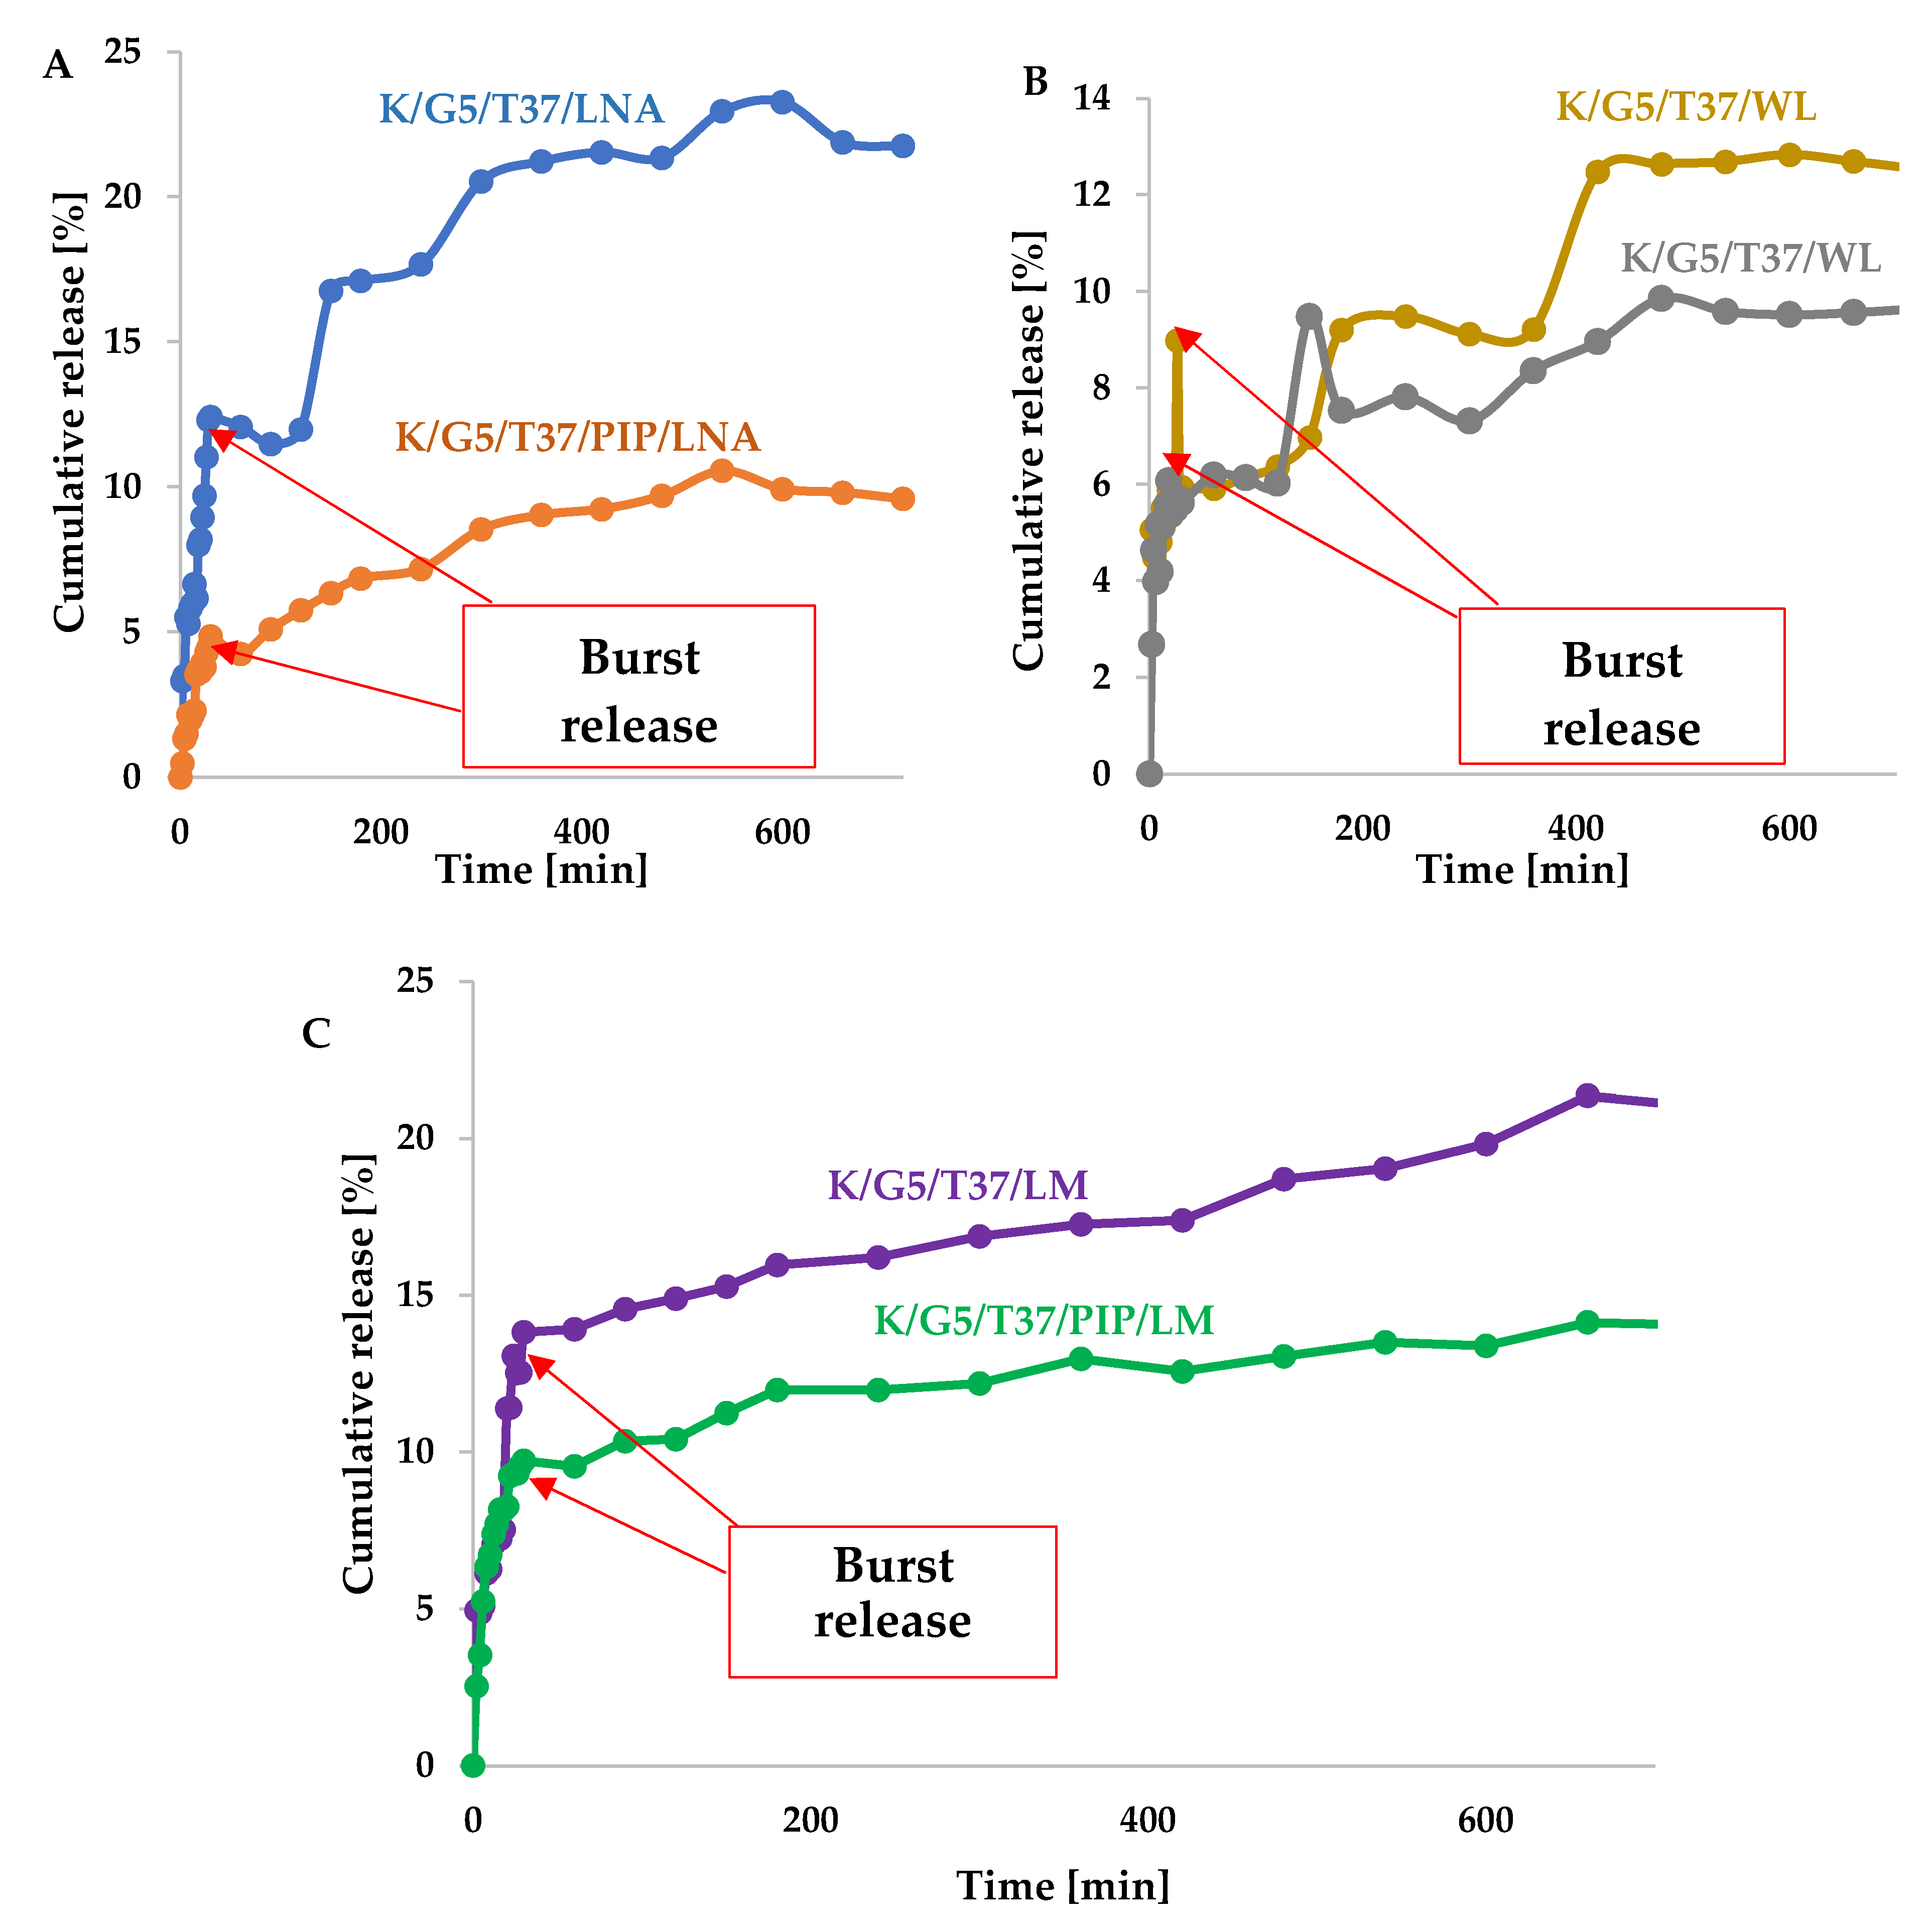
As shown in Figure 10, the curcumin release from hierarchical zeolites in simulated gastrointestinal media shows an initial burst-type release in the first 30 min. This release may be related to the surface-bound curcumin molecules on the surface of the zeolite materials [73]. Next, a continuous release is visible for 720 min (12 h). The curcumin release process from hierarchical zeolites under artificial and natural light (panel A in Figure 10) is rapid in 30 min, after which the process slows down, and the substance is gradually released. The carrier containing curcumin, in this case, shows a higher % release (about 25%) compared to hierarchical zeolite containing curcumin and piperine (about 11%). This fact may be related to the blocking of curcumin by larger piperine molecules. When the release of curcumin from the zeolite material is carried out in the absence of light, the release is much slower, and the active ingredient is released at a much lower rate. Analysis of data displayed in panel B of Figure 10 shows that % release of curcumin from the same material in the absence of light is twice as small. This is analogous to the carrier that contains curcumin and piperine. A completely different situation is encountered in the case of curcumin release with access to three types of light (panel C in Figure 10). The active ingredient in both cases (with and without piperine) is gradually released, and the final release rates are approximately 25% and 15%, respectively. The release of curcumin from hierarchical zeolite is limited due to its low solubility and variable or low light intensities. The whole process was carried out under daylight, room light, and fume hood [81].
2.11. Study of Curcumin Release in a Closed System
The photodynamic release of curcumin in a special reactor equipped with LEDs was carried out several times. The process of photodynamic release of active substance was carried out for FAU/CTABr/CUR150. The study started by checking the effect of the wavelength emitted by LEDs on curcumin release. Preliminary conclusions were obtained after testing all available types of LEDs (Table 4). Each of the experiments was repeated three times.
The most optimal wavelength is 500 nm (CYAN). However, to further improve the release of curcumin, the testing was conducted by combining several wavelengths emitted by LEDs and by checking their effect on the release of the active substance (Table 5). Each of the experiments was repeated three times.
Each test was conducted three times to verify the repeatability of the method. After a series of tests, the most favorable wavelength emitted by the LEDs was selected. The focus was on blue, cyan, and green, as well as their combinations. All results are summarized in graphs (Figure 11).
As can be seen from the graph, the most favorable wavelength for the photodynamic release of curcumin from the zeolite carrier is 430–550 nm (Blue–Cyan–Green). At this wavelength range, the active substance is released up to 53.24% ± 0.54 in about 3 h, indicating a good efficiency of its photodynamic release.
2.12. Potential Mechanism of Photodynamic Light-Triggered Release of Curcumin from Hierarchical Zeolites
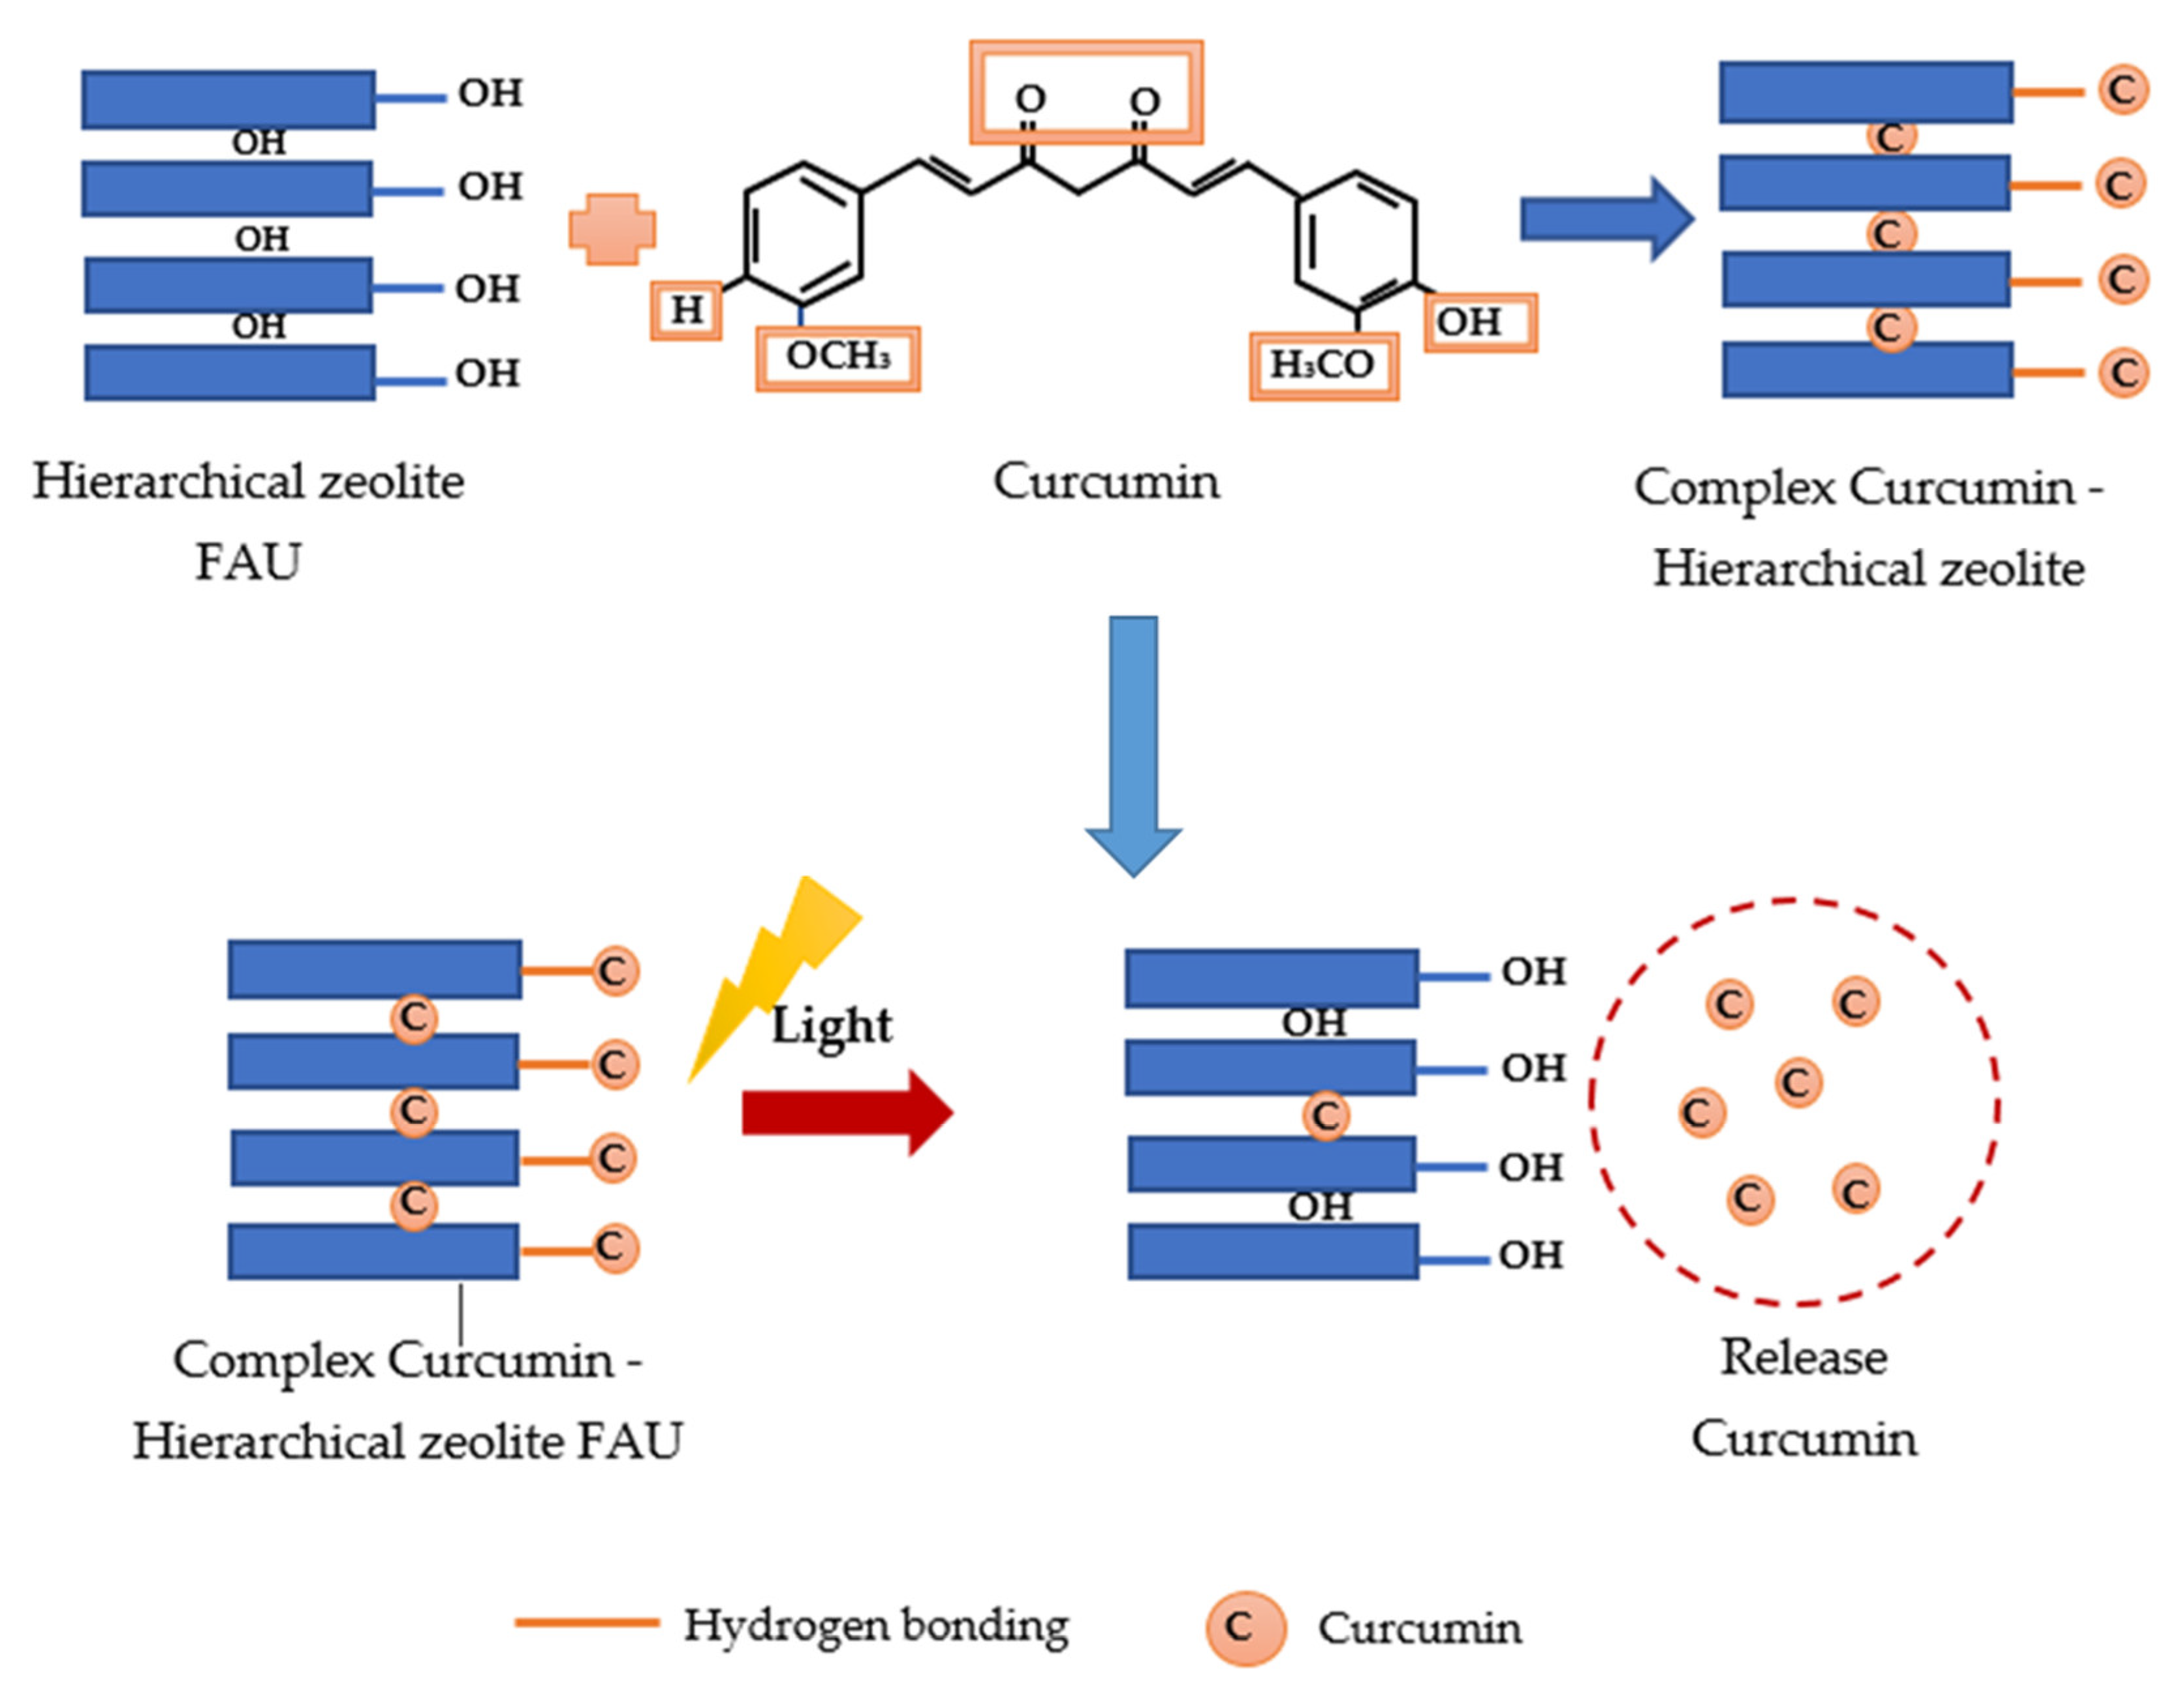
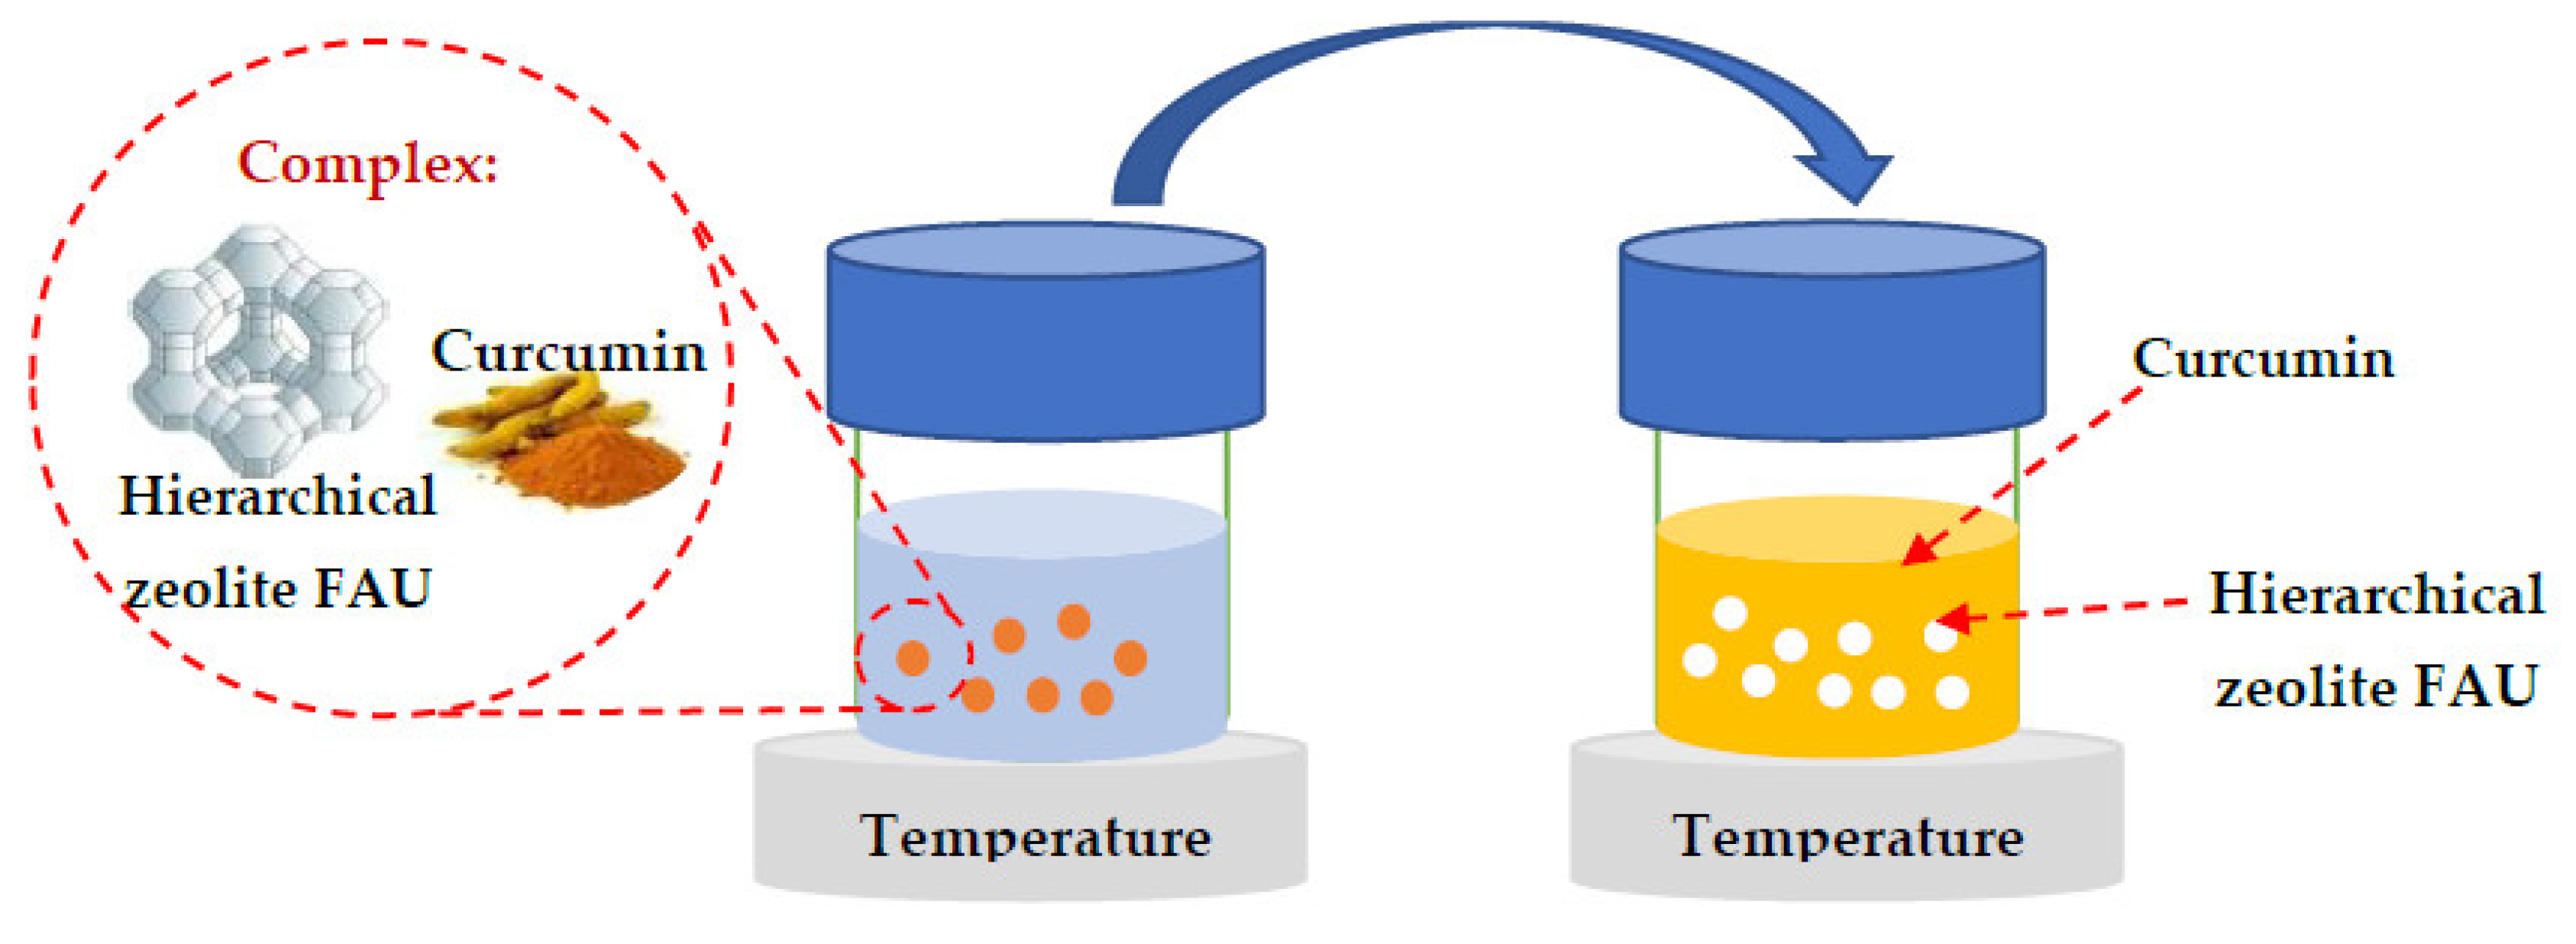
The exact mechanism of photodynamic release of curcumin from the zeolite carrier is shown in Figure 12.
Curcumin loaded inside and on the surface of the FAU-type hierarchical zeolite was released with the help of light of the appropriate wavelength. During the laboratory tests, a series of tests were carried out using seven different types of light, and a combination of several of them was also checked. The conducted research gave a lot of information, due to which it was possible to choose a specific wavelength that will enable the best efficiency of the process. Due to the tests carried out, it is assumed that the curcumin anchored on the surface of the zeolite is detached first followed by the one that was built into the pores of the carrier. Curcumin is linked to hierarchical zeolite by hydrogen bonds. The use of light of the appropriate wavelength breaks the hydrogen bonds, which releases the curcumin into the phosphate buffer at pH = 5.8.
2.13. Study of the Kinetics of Curcumin Release from Hierarchical Zeolite
Another aspect of this study was evaluation of the selected kinetic models (zero-order, first-order, and Higuchi) by using experimental data for curcumin release from hierarchical zeolites. By analyzing the kinetics of the release of the active substance from the respective carriers, it is possible to assess the rate of release process. To evaluate the release kinetics of curcumin, the corresponding correlation plots presented in Table 5 were prepared, and then, the correlation coefficient R2 was determined for the obtained release profiles. Table 5 summarizes the results for the open system release.
Based on the analysis of the values of the R2 parameter calculated for the release profiles of curcumin from hierarchical zeolites, the release of the active substance from all the analyzed carriers follows the first-order model due to the highest R2 correlation coefficient compared to the other kinetic models. The good fit of the empirical data to the kinetic model provides some information about the mechanism of diffusion of curcumin molecules from the zeolite carrier.
3. Materials and Methods
3.1. Materials
Commercial FAU zeolite was purchased from Alfa Aesar by Thermo Fisher Scientific (Kandel, Germany). Curcumin (purity > 90%) was purchased from ROTH, Poland. The piperine was purchased from TriMen Chemicals SA (Lodz, Poland). Substances needed for the preparation of the phosphate buffer solution (pH = 5.8) were purchased: sodium hydroxide czda-basic 98.8% purchased from POCH Basic (Gliwice, Poland), potassium diphosphate purchased from Sigma-Aldrich Sp. z.o.o (Poznań, Poland). Vegetable glycerin 99.5% was purchased from P. P. H. “STANLAB” Sp. J. (Lublin, Poland). Ethyl alcohol was bought from P. P. H. “STANLAB” Sp. J. (Lublin, Poland). Tween 80 was purchased from Sigma-Aldrich Sp. z.o.o (Poznań, Poland). All other chemicals and solvents were analytical grade and used without further purification.
3.2. Incorporation of Curcumin to Hierarchical Zeolite-Type FAU
To incorporate curcumin (CUR) to hierarchical zeolite type FAU, 250.00 mg of zeolite carrier was added into 10.00 mL of acetone. Next, 200.00 mg of curcumin was added to the resulting mixture, and the whole mixture was placed on a magnetic stirrer, where the active substance was applied at room temperature for 20 h. Next, the mixture was filtered, and the resulting product was dried in air at room temperature for 16 h to eliminate residual solvent. For comparison, the application process of curcumin along with piperine was carried out. The same amounts of carrier and active ingredient (CUR) were used, and 0.5 mg of piperine was added, and the whole process was identical as described above for incorporation of pure curcumin. After the process was completed, the percentage of curcumin to the selected carrier (%LOAD) was calculated. The efficiency of the application of curcumin to the hierarchical zeolite type FAU was determined using Equation (1).
Equation (1). Expression to determine the curcumin % in zeolite carrier [31].
3.3. Optimization of the Curcumin Release from Hierarchical Zeolites
Both the optimization process and all experiments were conducted using hierarchical zeolite synthesized with the structure-directing agent CTABr (hexadecyltrimethylammonium bromide) with curcumin. A sample containing piperine was also tested. During optimization of the curcumin release (CUR) from a given carrier, the following factors were considered: the type of permeation promoter (glycerol, ethanol, Tween 80), the amount of permeation promoter (1.00 and 5.00 mL), the temperature of the curcumin release process (37 and 43 °C), the effect of light used (no light, artificial light, natural light, and simultaneous natural and artificial light) and whether the addition of piperine affects the release of the active substance (Table 6).
The materials were designated by their respective acronyms: C/X/TY/LY, where C—hierarchical zeolite/curcumin (CUR) complex (2.00 mg), X—type of permeation promoter (G: glycerol, E: ethyl alcohol, TW: Tween 80), TY—temperature used during the release (T37—release temperature of 37 °C, and T43—release temperature changed from 37 °C to 43 °C during the process), LY—type of light used (LN—natural light, LA—artificial light, LNA—natural and artificial light, LM—mixed light (natural light, artificial light, and an additional light source of 36 W and luminous flux of 2900 lm), WL—no light). Additionally, the effect of piperine addition on the curcumin release process was verified and designated as PIP.
Characteristic wavelength related to the maximum absorbance of curcumin in each solvent was observed at 425 nm.
The optimal conditions for the release of curcumin (CUR) from the hierarchical zeolite type FAU are: glycerol as the permeation promoter in the amount of 5.00 mL, temperature of 37 °C, the most convenient type of light is mixed light (natural light, artificial light, and additional light source of 36 W and a luminous flux of 2900 lm). The same conditions were also used for the experiment without piperine.
3.4. Curcumin Release from Hierarchical Zeolites
3.4.1. Curcumin Release in an Open System
A temperature-controlled magnetic stirrer and a Varian Cary 50 Bio UV–vis spectrophotometer were used to evaluate the release kinetics of curcumin from the hierarchical zeolite. Then, 2.00 mg of the carrier containing curcumin (0.68 mg of pure curcumin) was weighed in a glass bottle (dry sample), and 20.00 mL of phosphate buffer, pH 5.8, was added. Furthermore, a permeation promoter was introduced, in our case glycerol at 5.00 mL, to accelerate curcumin release. The permeation promoter was used as a stabilizer because curcumin is unstable in phosphate buffer and only releases minimally. The process temperature was maintained at 37 °C, and the release process was carried out for 24 h, with measurements every 2 min for the first 30 min, then every 30 min for 2.5 h, after which measurements were carried out every 1 h for 9 h. The release rate of curcumin was determined by UV–vis in the range of 200 to 800 nm (Figure 13). Each experiment was repeated three times.
At a predetermined time, approximately 3.00 mL of the reaction mixture was taken and centrifuged for 1 min. The centrifuged mixture was transferred into a measuring cell, which was then placed in a UV–vis spectrophotometer.
- Preparation Procedure for the Different Components of Curcumin Release
To release curcumin from the hierarchical zeolite-type FAU, the acceptor fluid and sample were prepared, respectively.
- Preparation of the Acceptor Fluid
An acceptor solution that is a mixture of glycerol and phosphate buffer with a pH of 5.8 (1:4, v/v) was used to study the release kinetics of curcumin from hierarchical zeolites. To prepare the phosphate buffer, 17.60 g of potassium dihydrogen phosphate (V) (KH2PO4) was weighed in a glass beaker, and thę weight was dissolved in 1000.00 mL of demineralized water. In a separate vessel, 4.07 g of sodium hydroxide (NaOH) was dissolved in 1000.00 mL of demineralized water. The phosphate buffer was prepared by combining 732.00 mL of NaOH solution with the previously prepared KH2PO4 solution. After thorough mixing of the components of the buffer, its pH value was measured, which was 5.8.
- Sample preparation
First, 2.00 mg of hierarchical zeolite containing curcumin and 5.00 mL of glycerin as the permeation promoter were weighed. The material was then placed in a glass bottle, and the material was poured with 20.00 mL of phosphate buffer. The entire bottle was secured with a screw cap and placed on a magnetic stirrer where the whole process was carried out. The process temperature was maintained at 37 °C. Curcumin release studies were carried out in phosphate buffer at pH 5.80. The process of evaluating curcumin release kinetics was carried out for 24 h. The release parameters were determined as shown in Table 7 and Table 8.
The percentage of the release of active ingredients from hierarchical zeolites was calculated based on the following equation [81]:
where: Ap—absorbance of the sample (a.u.), Aw—absorbance of the standard (a.u.), mw—mass of the standard (mg), mp—mass of active substance contained in the sample (mg), Cw—purity of the standard (a.u.), Dw—dilution of the standard (a.u.), Vw—the volume of the standard solution (mL), Vp—the volume of phosphate buffer (mL).
Equation (2). The formula for calculating the percent release of curcumin from the carrier [82].
3.4.2. Curcumin Release in a Closed System
The photodynamic release of curcumin was carried out in a special reaction chamber equipped with a magnetic stirrer with heating function and LEDs, which were characterized by the corresponding emitted wavelength (Table 9).
The reaction chamber was sealed to prevent access to any other light source. The test sample was irradiated with each type of light to see which has the greatest effect on the curcumin release process. For photodynamic release studies of curcumin, the same conditions were used for the standard release process of the active substance.
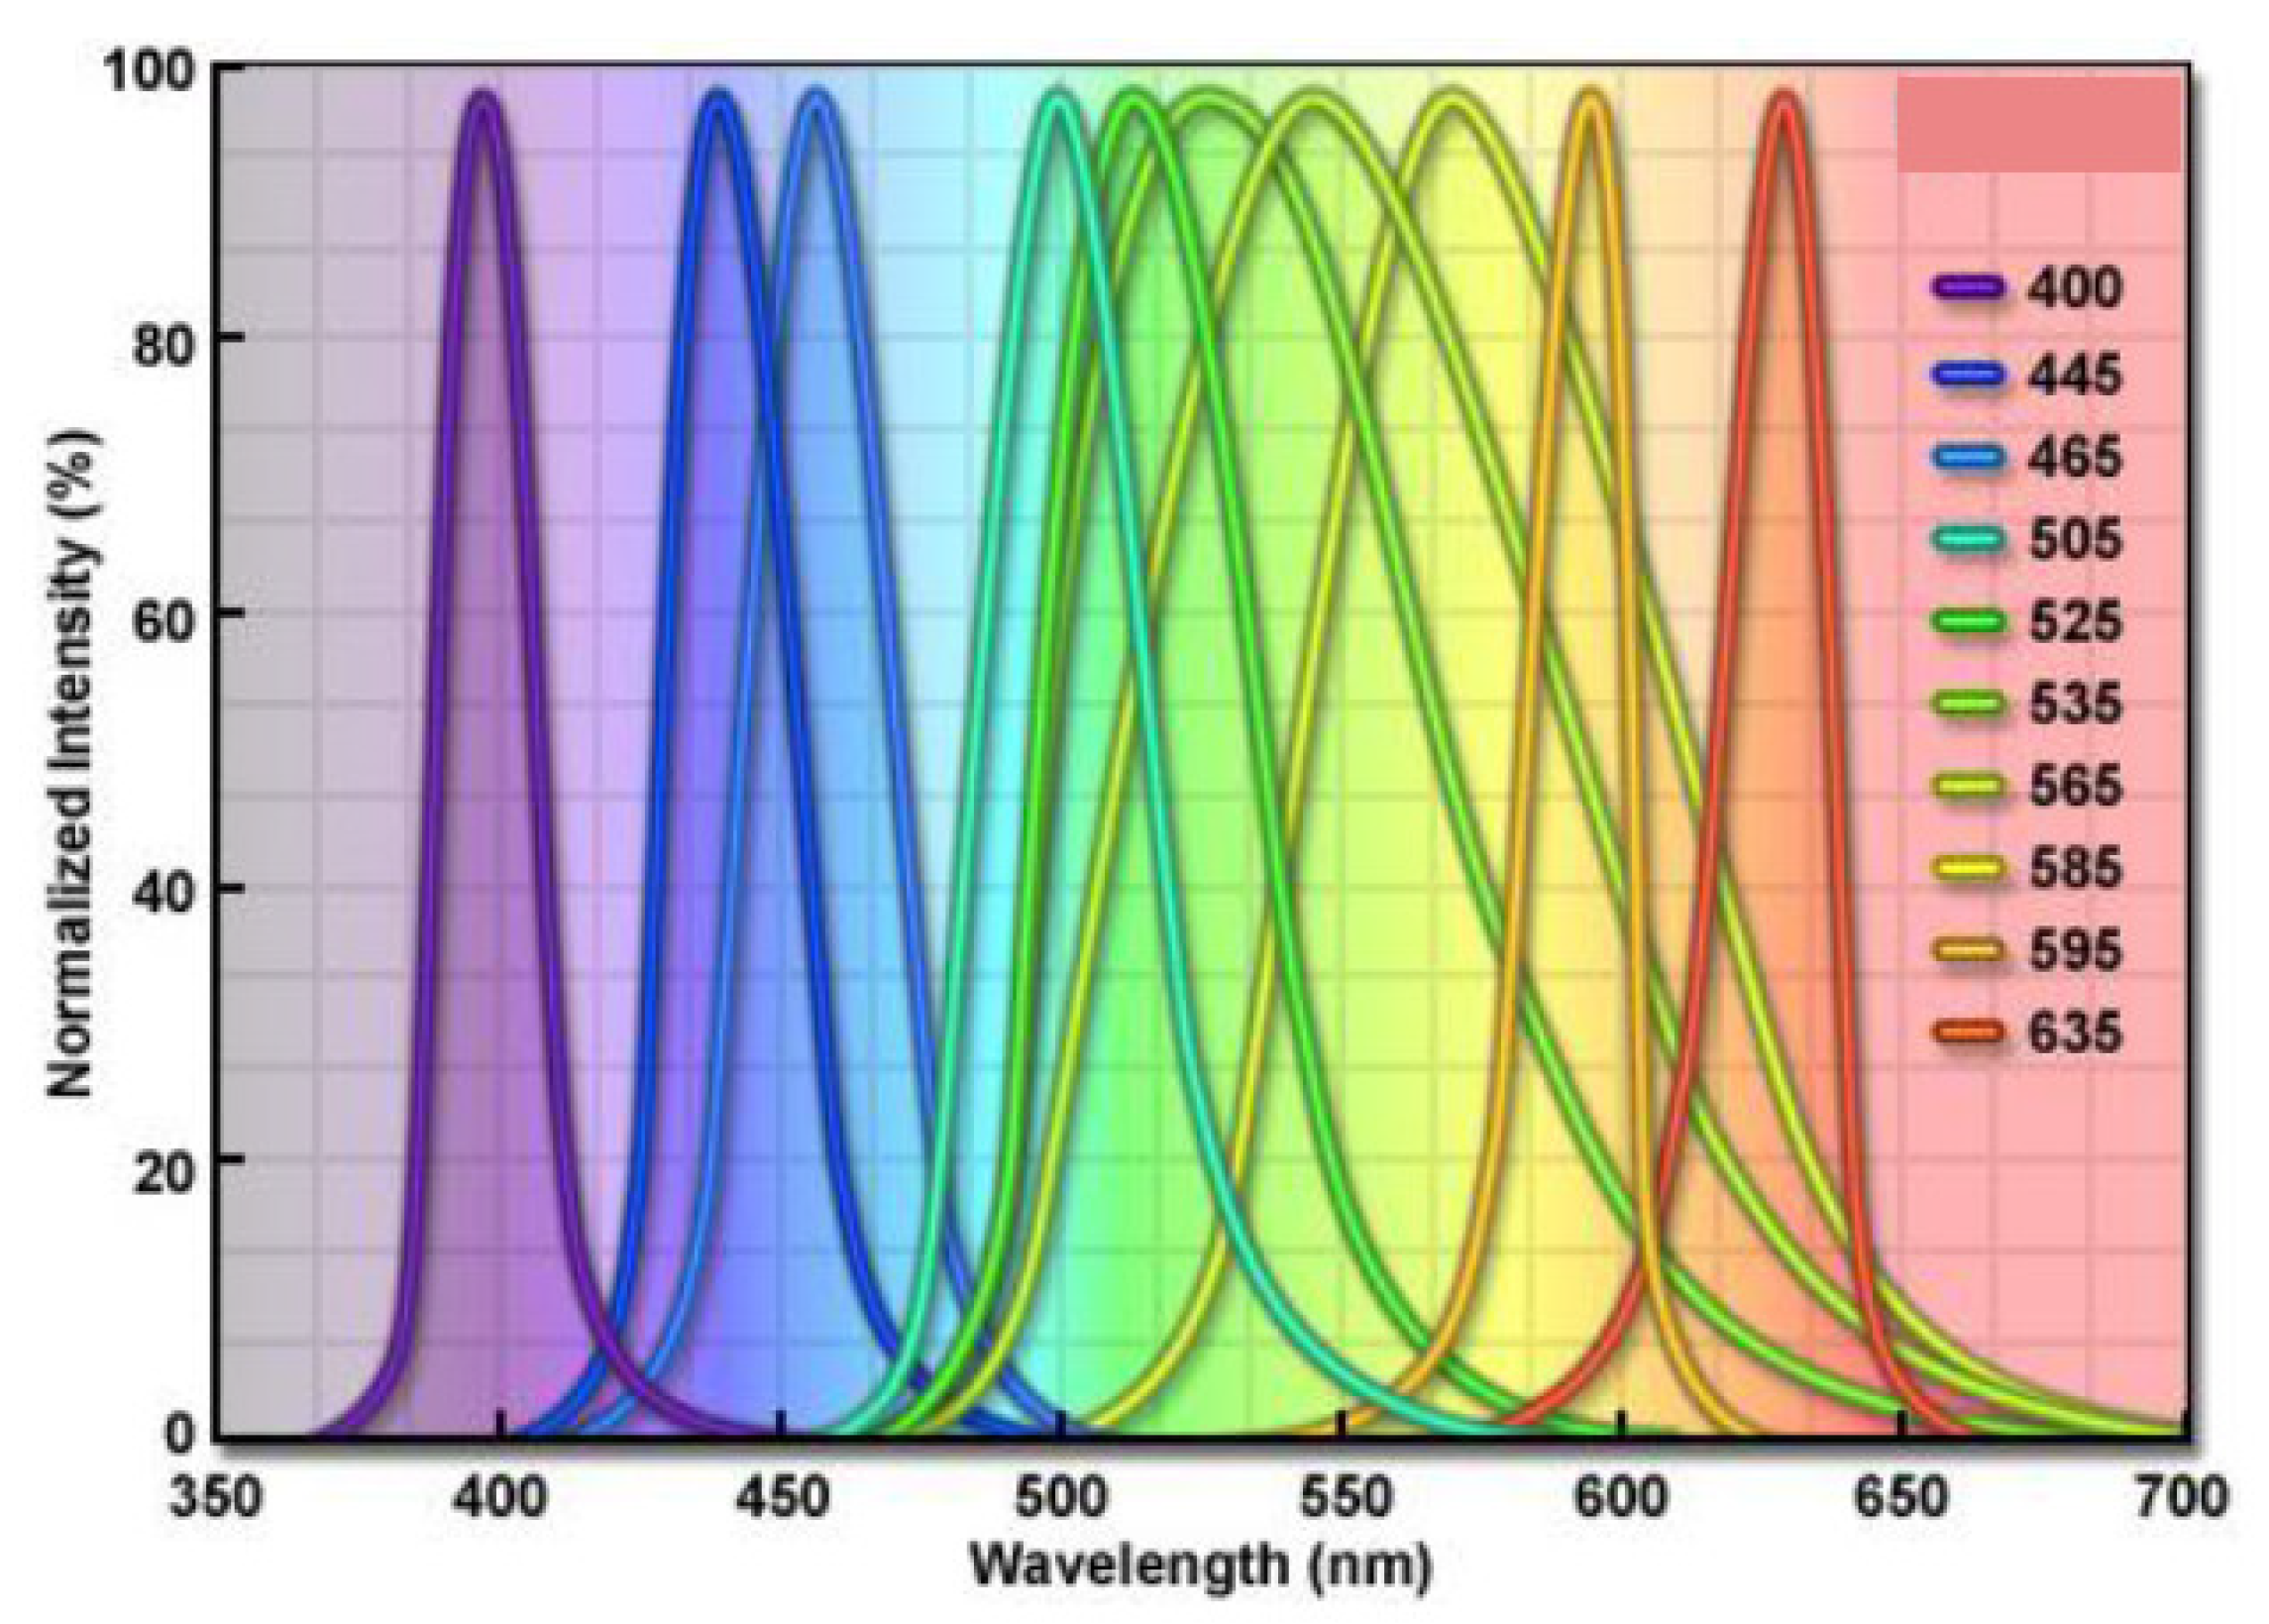
Figure 14 shows the excitation profiles of the light sources used during the study of curcumin release from hierarchical zeolites of the FAU type.
In addition, the effect of the overlap of several wavelengths emitted by the LEDs used was demonstrated:
- blue and green—450 and 525 nm;
- cyan and green—500–525 nm;
- blue and cyan—450–500 nm;
- blue, green and cyan—450–525 nm;
- yellow and red and yellow—595–630 nm.
3.5. Characterization of Materials
Curcumin-loaded zeolite carriers were characterized by using the following techniques:
- X-ray diffraction (XRD);
- Low-temperature N2 adsorption/desorption;
- Fourier transform infrared spectroscopy (FT-IR);
- Elemental analysis;
- Thermogravimetric analysis (TG);
- Scanning electron microscopy (SEM);
- Confocal microscopy;
- Release of the active substance.
3.5.1. X-ray Diffraction
X-ray diffraction patterns for hierarchical zeolites with curcumin were measured on a Bruker D8 ADVANCE powder diffractometer with a Johansson monochromator (Bruker; X Cu-Kα = 0.15406 nm). These patterns were obtained in the range of small angles (SAXD: 2 = 0.6–0.8°) with a scan rate of 0.02°/3 s and the range of wide angles (WAXD: 2 = 6.0–60.0°) with a scan rate of 0.05°/1 s.
3.5.2. Low-Temperature Nitrogen Adsorption/Desorption Isotherms
Low-temperature nitrogen adsorption/desorption isotherms were performed using an ASAP 2420 MICROMERITICS instrument. The test samples were degassed under vacuum at 120 °C for 24 h before measurement. The isotherms were obtained at ca. −196 °C, in the relative pressure range p/p0 from 0.02 to 1.00.
3.5.3. Fourier Transform IR Spectroscopy
Characterization of the individual functional groups was performed by using Fourier transform IR spectroscopy. For this purpose, a Cary 630 FTIR spectrometer (Agilent Technologies) with an attenuated total reflection (ATR) element (ZnSe crystal) was employed. All spectra were recorded at room temperature in the range of 4000–650 cm−1, with a resolution of 16 cm−1. For each sample, 72 scans were recorded. In addition, 8 background scans were performed.
3.5.4. Elemental Analysis
Elemental composition analysis of hierarchical zeolites with incorporated curcumin was performed on a FLASH 2000, THERMO SCIENTIFIC apparatus. The apparatus for organic elemental analysis uses the method of dynamic complete combustion of samples (2–200 mg) in an electronically temperature-controlled reduction–oxidation furnace.
3.5.5. Thermogravimetric Analysis TG
Thermogravimetric analysis was performed using a Netzsch TG 209 Libra apparatus. The temperature range of the test was from 30 to 995 °C, with a standard rate of temperature change of 10 °C/min. The test consisted of heating a small amount of the sample placed in a measuring crucible made of aluminum oxide. During the analysis, the change (loss) of mass and temperature of the sample during a specified time in a nitrogen atmosphere was continuously recorded.
3.5.6. Scanning Electron Microscopy SEM
The microstructure analysis and morphology of the hierarchical zeolites loaded with curcumin were determined by scanning electron microscopy (SEM, Quanta FEG 250 (FEI)) under a low-pressure vacuum (70 Pa) and 10 kV beam acceleration voltage. Samples of zeolite materials were placed on a 400 mesh carbon-coated copper grid. Under the influence of the electron beam, the sample emitted various signals that were picked up by the detector and converted into an image of the sample.
3.5.7. Confocal Microscopy
Confocal microscopy was used to obtain high-quality images and reconstruct images in three dimensions. Before taking images using a confocal microscope (Zeiss Axiovert 200 M), the obtained zeolite materials were applied to a coverslip. Curcumin autofluorescence was excited using a 488 nm laser.
3.5.8. Encapsulation Efficiency and Loading Capacity of Curcumin
The encapsulation efficiency (EE) and loading capacity (LC) of the curcumin were evaluated based on the concentration of unencapsulated curcumin in the supernatant. The unencapsulated curcumin in the supernatant was previously dissolved in ethanol prior to the centrifugation process and then analyzed using a high-performance liquid chromatograph (Varian 920-LC, Agilent Technologies, Santa Clara, CA, USA) coupled with a UV–vis detector. The chromatographic determination of curcumin in the supernatant involved the quantification of the unincorporated active ingredient present in the fluid. The EE of curcumin was calculated by Equation (3) while the LC was calculated by Equation (4) [84].
3.5.9. UV–Visible Spectroscopy
UV–vis measurements were made with the Varian Cary 50 Bio UV–Vis spectrophotometer in the range of 300–600 nm (curcumin absorption peak λmax = 425 nm). Curcumin solutions were diluted with pure acetone and measured in quartz cells with an optical path length of 1 cm.
3.5.10. Curcumin Release from Hierarchical Zeolites
Hierarchical zeolite curcumin release tests were performed according to two techniques described in Section 3.3 and Section 3.4.
4. Conclusions
Curcumin is a compound that has numerous advantages; however, due to its low water solubility and high photosensitivity, its clinical applications are limited. Therefore, it was important to select a suitable carrier, which turned out to be a hierarchical zeolite obtained by proper treatment of a commercial FAU-type zeolite. Studies on curcumin release from hierarchical zeolites were carried out under simulated gastrointestinal conditions using two methods. The first is the classical method of releasing the active substance in the open circulation. Using this method, curcumin is released much more slowly and to a much smaller extent. This is probably because curcumin is very sensitive to light. Therefore, the photodynamic release of curcumin from zeolite carriers proved to be a more advantageous and efficient method. Curcumin was released much faster, and the percentage of release was twice as high as that achieved by the classical release method. The results of our study show that the percentage of curcumin released from hierarchical zeolites is higher for the photodynamic release process. This observation was confirmed by XRD analysis, showing the presence of curcumin in the pores of the hierarchical zeolites, and confirming strong interactions of the zeolite with the active substance. SEM analysis showed a stable structure of the hierarchical zeolite, the integrity of which was preserved after curcumin loading. Using confocal microscopy, it was possible to locate the active substance in the carrier. These results confirmed the presence of curcumin in the FAU zeolite carrier and support the potential use of this porous material as a drug carrier.
Author Contributions
E.M.: methodology, visualization, data curation, writing—original draft; A.F.-G.: conceptualization, methodology, data curation, writing—editing; M.J.: data curation; writing—editing; I.N.: conceptualization, methodology; data curation; funding acquisition, project administration, writing—editing. All authors have read and agreed to the published version of the manuscript.
Funding
The work was carried out within the project “Advanced biocomposites for tomorrow’s economy BIOG-NET”, funded by the Foundation for Polish Science from the European Regional Development Fund (POIR.04.04.00-00-1792/18-00).
Data Availability Statement
The data presented in this study are available upon request from the authors.
Conflicts of Interest
The authors declare no conflict of interest.
References
- Allen, T.M.; Cullis, P.R. Drug delivery systems: Entering the mainstream. Science 2004, 303, 1818–1822. [Google Scholar] [CrossRef] [PubMed]
- Regi, M.V.; Balas, F.; Arcos, D. Mesoporous Materials for Drug Delivery. Angew. Chem. Int. Ed. 2007, 46, 7548–7558. [Google Scholar] [CrossRef] [PubMed]
- Regi, M.V. Ordered Mesoporous Materials in the Context of Drug Delivery Systems and Bone Tissue Engineering. Chem. Eur. J. 2006, 12, 5934–5943. [Google Scholar] [CrossRef]
- Rathbone, M.J.; Hadgraft, J.; Roberts, M.S.; Lane, M.E. Modified-Release Drug Delivery Technology, 2nd ed.; CRC Press: Boca Raton, FL, USA, 2008; pp. 303–321. [Google Scholar]
- Rámila, A.; Muňoz, B.; Pérez-Pariente, J.; Vallet-Regí, M. Mesoporous MCM-41 as drug host system. J. Sol-Gel Sci. Technol. 2003, 26, 1199–1202. [Google Scholar] [CrossRef]
- Horcajada, P.; Rámila, A.; Pérez-Pariente, J.; Vallet-Regí, M. Influence of Pore Size of MCM-41 Matrices on Drug Delivery Rate. Microporous Mesoporous Mater. 2004, 68, 105–109. [Google Scholar] [CrossRef]
- Rouquerol, J.; Avnir, D.; Fairbridge, C.W.; Everett, D.H.; Haynes, J.M.; Pernicone, N.; Ramsay, J.D.F.; Sing, K.S.W.; Unger, K.K. Recommendations for the characterization of porous solids (Technical Report). IUPAC Pure Appl. Chem. 1994, 66, 1739–1758. [Google Scholar] [CrossRef]
- Andersson, J.; Rosenhoim, J.; Areva, S.; Linden, M. Influences of Material Characteristics on Ibuprofen Drug Loading and Release Profiles from Ordered Micro- and Mesoporous Silica Matrices. Chem. Mater. 2004, 16, 4160–4167. [Google Scholar] [CrossRef]
- Feliczak-Guzik, A. Hierarchical zeolites: Synthesis and catalytic properties. Microporous Mesoporous Mater. 2018, 259, 33–45. [Google Scholar] [CrossRef]
- Jia, X.; Khan, W.; Wu, Z.; Choi, J.; Yip, A.C.K. Modern synthesis strategies for hierarchical zeolites: Bottom-up versus top-down strategies. Adv. Powder Technol. 2019, 30, 467–484. [Google Scholar] [CrossRef]
- Verboekend, D.; Milina, M.; Mitchell, S.; Ramírez, J.P. Hierarchical Zeolites by Desilication: Occurrence and Catalytic Impact of Recrystallization and Restructuring. Cryst. Growth Des. 2013, 13, 5025–5035. [Google Scholar] [CrossRef]
- Ding, K.; Corma, A.; Maciá-Agulló, J.A.; Hu, J.G.; Krämer, S.; Stair, P.C.; Stucky, G.D. Constructing hierarchical porous zeolites via kinetic regulation. J. Am. Chem. Soc. 2015, 137, 11238–11241. [Google Scholar] [CrossRef] [PubMed]
- Baerlocher, C.; McCusker, L.B.; Olson, D.H. Atlas of Zeolite Framework Types, 6th ed.; Elsevier: Amsterdam, The Netherlands, 2007; pp. 140–141. [Google Scholar]
- Bacakova, L.; Vandrovcova, M.; Kopova, I.; Jirka, I. Applications of zeolites in biotechnology and medicine–a review. Biomater. Sci. 2018, 6, 974–989. [Google Scholar] [CrossRef] [PubMed]
- Hartmann, M.; Machoke, A.G.; Schwieger, W. Catalytic test reactions for the evaluation of hierarchical zeolites. Chem. Soc. Rev. 2016, 45, 3313–3330. [Google Scholar] [CrossRef] [PubMed]
- Elsatar, A.G.A.; Farag, M.M.; Youssef, H.F.; Salih, S.A.; Mounier, M.M.; El-Meliegy, E. Different zeolite systems for colon cancer therapy: Monitoring of ion release, cytotoxicity and drug release behavior. Prog. Biomater. 2019, 8, 101–113. [Google Scholar] [CrossRef] [PubMed]
- Kralj, M.; Pavelic, K. Medicine on a small scale: How molecular medicine can benefit from self-assembled and nanostructured materials. EMBO Rep. 2003, 4, 1008–1012. [Google Scholar] [CrossRef] [PubMed]
- Thom, D.C.; Davies, J.E.; Santerre, J.P.; Friedman, S. The hemolytic and cytotoxic properties of a zeolite-containing root filling material in vitro. Oral Surg. Oral Med. Oral Pathol. Oral Radiol. Endodontol. 2003, 95, 101–108. [Google Scholar] [CrossRef]
- Piasek, A.; Bartoszek, A.; Namieśnik, J. Substancje pochodzenia roślinnego przeciwdziałające kardiotoksyczności towarzyszącej chemioterapii nowotworów. Adv. Hyg. Exp. Med. 2009, 63, 142–158. [Google Scholar]
- Goldman, P. Herbal medicines today and the roots of modern pharmacology. Ann. Intern. Med. 2001, 135, 594–600. [Google Scholar] [CrossRef]
- Robinson, M.M.; Zhang, X. The World Medicines Situation 2011. In Traditional Medicines: Global Situation, Issues and Challenges, 3rd ed.; World Health Organization: Geneva, Switzerland, 2011. [Google Scholar]
- Anand, P.; Thomas, S.G.; Kunnumakkara, A.B.; Sundaram, C.; Harikumar, K.B.; Sung, B.; Tharakan, S.T.; Misra, K.; Priyadarsini, I.K.; Rajasekharan, K.N.; et al. Biological Activities of Curcumin and its Analogues (Congeners) Made by Man and Mother Nature. Biochem. Pharmacol. 2008, 76, 1590–1611. [Google Scholar] [CrossRef]
- Lakshmi, S.; Padmaja, G.; Remani, P. Antitumour Effects of Isocurcumenol Isolated from Curcuma zedoaria Rhizomes on Human and Murine Cancer Cells. Int. J. Med. Chem. 2011, 2011, 253962. [Google Scholar] [CrossRef]
- Itokawa, H.; Shi, Q.; Akiyama, T.; Morris-Natschke, S.L.; Lee, K.H. Recent advances in the investigation of curcuminoids. Chin. Med. 2008, 3, 11. [Google Scholar] [CrossRef] [PubMed]
- Lobo, R.; Prabhu, K.S.; Shirwaikar, A.; Shirwaikar, A. Curcuma zedoaria Rosc. (white turmeric): A review of its chemical, pharmacological and ethnomedicinal properties. J. Pharm. Pharmacol. 2009, 61, 13–21. [Google Scholar] [CrossRef] [PubMed]
- Goel, A.; Kunnumakkara, A.B.; Aggarwal, B.B. Curcumin as “Curecumin”: From kitchen to clinic. Biochem. Pharmacol. 2008, 75, 787–809. [Google Scholar] [CrossRef] [PubMed]
- Nagahama, K.; Utsumi, T.; Kumano, T.; Maekawa, S.; Oyama, N.; Kawakami, J. Discovery of a new function of curcumin which enhances its anticancer therapeutic potency. Sci. Rep. 2016, 60, 30962. [Google Scholar] [CrossRef]
- Jun, X.L.; Xiang-Fe, H.; Hang, L.Z. Anti-Cancer Agents. Med. Chem. 2012, 12, 210–211. [Google Scholar]
- Anand, P.; Kunnumakkara, A.B.; Newman, R.A.; Aggarwal, B.B. Bioavailability of Curcumin: Problems and Promises. Mol. Pharm. 2007, 4, 807–818. [Google Scholar] [CrossRef]
- Toden, S.; Goel, A. The Holy Grail of Curcumin and its Efficacy in Various Diseases: Is Bioavailability Truly a Big Concern? J. Restorat. Med. 2017, 6, 27–36. [Google Scholar] [CrossRef]
- Han, H.K. The effects of black pepper on the intestinal absorption and hepatic metabolism of drugs. Expert Opin. Drug Metab. Toxicol. 2011, 7, 721–729. [Google Scholar] [CrossRef]
- Shoba, G.; Joy, D.; Joseph, T.; Majeed, M.; Rajendran, R.; Srinivas, P.S. Influence of piperine on the pharmacokinetics of curcumin in animals and human volunteers. Planta Med. 1998, 64, 353–356. [Google Scholar] [CrossRef]
- Photodynamic Therapy to Treat Cancer. Available online: http://www.cancer.gov/cancertopics/factsheet/Therapy/photodynamic (accessed on 10 January 2022).
- Silva, L.P.; Magalhães, C.M.; Montenegro, A.N.; Ferreira, P.J.; Duarte, D.; Rodríguez-Borges, J.E.; Vale, N.; Esteves da Silva, J.C.G. Study of the combination of self-activating photodynamic therapy and chemotherapy for cancer treatment. Biomolecules 2019, 9, 384. [Google Scholar] [CrossRef]
- Moret, F.; Reddi, E. Strategies for optimizing the delivery to tumors of macrocyclic photosensitizers used in photodynamic therapy (pdt). J. Porphyr. Phthalocyanines 2017, 21, 239–256. [Google Scholar] [CrossRef]
- Cheng, Y.; Cheng, H.; Jiang, C.; Qiu, X.; Wang, K.; Huan, W.; Yuan, A.; Wu, J.; Hu, Y. Perfluorocarbon nanoparticles enhance reactive oxygen levels and tumour growth inhibition in photodynamic therapy. Nat. Commun. 2016, 6, 8785–8793. [Google Scholar] [CrossRef] [PubMed]
- Agostinis, P.; Berg, K.; Cengel, K.A.; Foster, T.H.; Girotti, A.W.; Gollnick, S.O.; Hahn, S.M.; Hamblin, M.R.; Juzeniene, A.; Kessel, D. Photodynamic therapy of cancer: An update. CA Cancer J. Clin. 2011, 61, 250–281. [Google Scholar] [CrossRef] [PubMed]
- Wu, W.; Shao, X.; Zhao, J.; Wu, M. Controllable photodynamic therapy implemented by regulating singlet oxygen efficiency. Adv. Sci. 2017, 4, 1700113. [Google Scholar] [CrossRef] [PubMed]
- Yang, Q.Q.; Farha, A.K.; Kim, G.; Gul, K.; Gan, R.Y.; Corke, H. Antimicrobial and anticancer applications and related mechanisms of curcumin-mediated photodynamic treatments. Trends Food Sci. Technol. 2020, 97, 341–354. [Google Scholar] [CrossRef]
- Tuanwei, L.; Lifeng, Y. Functional Polymer Nanocarries for Photodynamic Therapy. Pharmaceuticals 2018, 11, 2–4. [Google Scholar]
- Lee, S.C.; Seong, Y.S.; Kim, S.S.; Koh, H.J.; Kwon, O.W. Photodynamic therapy with verteporfin for polypoidal choroidal vasculopathy of the macula. Ophthalmologica 2004, 218, 193–201. [Google Scholar] [CrossRef]
- Choudhary, S.; Nouri, K.; Elsaie, M.L. Photodynamic therapy in dermatology: A review. Lasers Med. Sci. 2009, 24, 971–980. [Google Scholar] [CrossRef]
- Chrepa, V.; Kotsakis, G.A.; Pagonis, T.C.; Hargreaves, K.M. The effect of photodynamic therapy in root canal disinfection: A systematic review. J. Endod. 2014, 40, 891–898. [Google Scholar] [CrossRef]
- Cieplik, F.; Buchalla, W.; Hellwig, E.; Al-Ahmad, A.; Hiller, K.A.; Maisch, T.; Karygianni, L. Antimicrobial photodynamic therapy as an adjunct for treatment of deep carious lesions-a systematic review. Photodiagn. Photodyn. Ther. 2017, 18, 54–62. [Google Scholar] [CrossRef]
- Marchal, S.; Dolivet, G.; Lassalle, H.P.; Guillemin, F.; Bezdetnaya, L. Targeted photodynamic therapy in head and neck squamous cell carcinoma: Heading into the future. Lasers Med. Sci. 2015, 30, 2381–2387. [Google Scholar] [CrossRef] [PubMed]
- Vohra, F.; Al-Kheraif, A.A.; Qadri, T.; Hassan, M.I.; Ahmed, A.; Warnakulasuriya, S.; Javed, F. Efficacy of photodynamic therapy in the management of oral premalignant lesions. A systematic review. Photodiagn. Photodyn. Ther. 2015, 12, 150–159. [Google Scholar] [CrossRef] [PubMed]
- Goldstein, M.; Heilweil, G.; Barak, A.; Loewenstein, A. Retinal pigment epithelial tear following photodynamic therapy for choroidal neovascularization secondary to AMD. Eye 2005, 19, 1315–1324. [Google Scholar] [CrossRef] [PubMed]
- Silva, R.M.; Figueira, J.; Cachulo, M.L.; Duarte, L.; Faria de Abreu, J.R.; Cunha-Vaz, J.G. Polypoidal choroidal vasculopathy and photodynamic therapy with verteporfin. Graefes Arch. Clin. Exp. Ophthalmol. 2005, 243, 973–979. [Google Scholar] [CrossRef] [PubMed]
- Akaza, E.; Yuzawa, M.; Mori, R. Three-year follow-up results of photodynamic therapy for polypoidal choroidal vasculopathy. Jpn. J. Ophthalmol. 2011, 55, 39–44. [Google Scholar] [CrossRef] [PubMed]
- Muslubas, I.S.; Hocaoglu, M.; Arf, O.; Ozdemir, H.; Karacorlu, M. Treatment outcomes in patients with polypoidal choroidal vasculopathy. Turk. J. Ophthalmol. 2016, 46, 16–20. [Google Scholar] [CrossRef]
- Kachynski, A.V.; Pliss, A.; Kuzmin, A.N.; Ohulchanskyy, T.Y.; Baev, A.; Qu, J.; Prasad, P.N. Photodynamic therapy by in situ nonlinear photon conversion. Nat. Photon. 2014, 8, 455–461. [Google Scholar] [CrossRef]
- Wang, S.; Zhang, L.; Dong, C.; Su, L.; Wang, H.; Chang, J. Smart ph-responsive upconversion nanoparticles for enhanced tumor cellular internalization and near-infrared light-triggered photodynamic therapy. Chem. Commun. 2015, 51, 406–408. [Google Scholar] [CrossRef]
- Wang, W.; Lin, L.; Ma, X.; Wang, B.; Liu, S.; Yan, X.; Li, S.; Tian, H.; Yu, X. Light-induced hypoxia-triggered living nanocarriers for synergistic cancer therapy. ACS Appl. Mater. Interfaces 2018, 10, 19398–19407. [Google Scholar] [CrossRef]
- Wang, P.; Li, X.; Yao, C.; Wang, W.; Zhao, M.; El-Toni, A.M.; Zhang, F. Orthogonal near-infrared upconversion co-regulated site-specific o2 delivery and photodynamic therapy for hypoxia tumor by using red blood cell microcarriers. Biomaterials 2017, 125, 90–100. [Google Scholar] [CrossRef]
- Li, J.; Meng, X.; Deng, J.; Lu, D.; Zhang, X.; Chen, Y.; Zhu, J.; Fan, A.; Ding, D.; Kong, D. Multifunctional micelles dually responsive to hypoxia and singlet oxygen: Enhanced photodynamic therapy via interactively triggered photosensitizer delivery. ACS Appl. Mater. Interface 2018, 10, 17117–17128. [Google Scholar] [CrossRef] [PubMed]
- Lin, S.; Yang, L.; Shi, H.; Du, W.; Qi, Y.; Qiu, C.; Liang, X.; Shi, W.; Liu, J. Endoplasmic reticulum-targeting photosensitizer hypericin confers chemo-sensitization towards oxaliplatin through inducing pro-death autophagy. Int. J. Biochem. Cell Biol. 2017, 87, 54–68. [Google Scholar] [CrossRef] [PubMed]
- Tian, X.; Zhu, Y.; Zhang, M.; Luo, L.; Wu, J.; Zhou, H.; Guan, L.; Battaglia, G.; Tian, Y. Localization matters: A nuclear targeting two-photon absorption iridium complex in photodynamic therapy. Chem. Commun. 2017, 53, 3303–3306. [Google Scholar] [CrossRef]
- Shibu, E.S.; Hamada, M.; Murase, N.; Biju, V. Nanomaterials formulations for photothermal and photodynamic therapy of cancer. J. Photochem. Photobiol. C Photochem. Rev. 2013, 15, 53–72. [Google Scholar] [CrossRef]
- Voon, S.H.; Kiew, L.V.; Lee, H.B.; Lim, S.H.; Noordin, M.I.; Kamkaew, A.; Burgess, K.; Chung, L.Y. In vivo studies of nanostructure-based photosensitizers for photodynamic cancer therapy. Small 2014, 10, 4993–5013. [Google Scholar] [CrossRef] [PubMed]
- Musielak, E.; Feliczak-Guzik, A.; Jaroniec, M.; Nowak, I. Modification and Functionalization of Zeolites for Curcumin Uptake. Materials 2022, 15, 6316. [Google Scholar] [CrossRef] [PubMed]
- Jyoti, K.; Baunthiyal, M.; Singh, A. Characterization of silver nanoparticles synthesized using Urtica dioica Linn. leaves and their synergistic effects with antibiotics. J. Radiat. Res. Appl. Sci. 2016, 9, 217–227. [Google Scholar] [CrossRef]
- Maulvi, F.A.; Lakdawala, D.H.; Shaikh, A.A.; Desai, A.R.; Choksi, H.H.; Vaidya, R.J.; Ranch, K.M.; Koli, A.R.; Vyas, B.A.; Shah, D.O. In vitro and in vivo evaluation of novel implantation technology in hydrogel contact lenses for controlled drug delivery. J. Control. Release 2016, 226, 47–56. [Google Scholar] [CrossRef]
- Thommes, M.; Kaneko, K.; Neimark, A.V.; Olivier, J.P.; Reinoso, F.R.; Rouquerol, J.; Sing, K.S.W. Physisorption of Gases, with Special Reference to the Evalua-tion of Surface Area and Pore Size Distribu-tion (IUPAC Technical Report). Pure Appl. Chem. 2015, 87, 1051–1069. [Google Scholar] [CrossRef]
- Kim, S.; Philippot, S.; Fontanay, S.; Duval, R.E.; Lamouroux, E.; Canilho, N.; Pasc, A. pH-and glutathione-responsive release of curcumin from mesoporous silica nanoparticles coated using tannic acid–Fe(III) complex. RSC Adv. 2015, 5, 90550–90558. [Google Scholar] [CrossRef]
- Moradi, P.; Hajjami, M.; Tahmasbi, B. Fabricated copper catalyst on biochar nanoparticles for the synthesis of tetrazoles as antimicrobial agents. Polyhedron 2020, 175, 114169–114180. [Google Scholar] [CrossRef]
- Chaudhuri, H.; Dash, S.; Ghorai, S.; Pal, S.; Sarkar, A. SBA-16: Application for the removal of neutral, cationic, and anionic dyes from aqueous medium. J. Environ. Chem. Eng. 2016, 4, 157–166. [Google Scholar] [CrossRef]
- Ameri, A.; Taghizadeh, T.; Kiakalaieh, A.T.; Forootanfar, H.; Mojtabavi, S.; Jahandar, H.; Tarighi, S.; Faramarzi, M.A. Bio-removal of phenol by the immobilized laccase on the fabricated parent and hierarchical NaY and ZSM-5 zeolites. J. Taiwan Inst. Chem. Eng. 2021, 120, 300–312. [Google Scholar] [CrossRef]
- Preisig, D.; Haid, D.; Varum, F.J.O.; Bravo, R.; Alles, R.; Huwyler, J.; Puchkov, M. Drug loading into porous calcium carbonate microparticles by solvent evaporation. Eur. J. Pharm. Biopharm. 2014, 87, 548–558. [Google Scholar] [CrossRef]
- Jayandran, M.; Haneefa, M.M.; Balasubramanian, V. Characterization and comparative studies of turmeric oleoresin derived from selected turmeric plants. Asian J. Pharm. Sci. Technol. 2015, 5, 18–21. [Google Scholar]
- Ribeiro, S.P.S.; Martins, R.C.; Barbosa, G.M.; Rocha, M.; Landesmann, A.; Nascimento, M. Influence of the zeolite acidity on its synergistic action with a flame-retarding polymeric intumescent formulation. J. Mat. Sci. 2020, 54, 619–630. [Google Scholar] [CrossRef]
- Karimi, M.; Habibizadeh, M.; Rostamizadeh, K.; Khatamian, M.; Divband, B. Preparation and characterization of nanocomposites based on different zeolite frameworks as carriers for anticancer drug: Zeolite Y versus ZSM-5. Pol. Bull. 2019, 76, 2233–2252. [Google Scholar] [CrossRef]
- Sun, X.Z.; Williams, G.R.; Hou, X.X.; Zhu, L.M. Electrospun curcumin-loaded fibers with potential biomedical applications. Carbohydr. Polym. 2013, 94, 147–153. [Google Scholar] [CrossRef]
- Chen, Z.; Xia, Y.; Liao, S.; Huang, Y.; Li, Y.; He, Y.; Tong, Z.; Li, B. Thermal degradation kinetics study of curcumin with nonlinear methods. Food Chem. 2014, 155, 81–86. [Google Scholar] [CrossRef]
- Amosa, M.; AlKhatib, M.; Jami, M.; Jimat, D.; Uthman, O.; Muyibi, S. Morphological synthesis and environmental application of ZSM-5 zeolite crystals from combined low-water and fluoride syntheses routes. Adv. Environ. Biol. 2014, 8, 613–625. [Google Scholar]
- Kolev, T.M.; Velcheva, E.A.; Stamboliyska, B.A.; Spiteller, M. DFT and experimental studies of the structure and vibrational spectra of Curcumin. Int. J. Quantum Chem. 2005, 102, 1069–1079. [Google Scholar] [CrossRef]
- Li, X.; Yang, Q.; Ouyang, J.; Yang, H.; Chang, S. Chitosan modified halloysite nanotubes as emerging porous microspheres for drug carrier. Appl. Clay Sci. 2016, 126, 306–312. [Google Scholar] [CrossRef]
- Ishtiaq, M.; Asghar, S.; Khan, I.U.; Iqbal, M.S.; Khalid, S.H. Development of the Amorphous Solid Dispersion of Curcumin: A Rational Selection of Polymers for Enhanced Solubility and Dissolution. Crystals 2022, 12, 1606. [Google Scholar] [CrossRef]
- Tiwari, A.; Singh, A.; Garg, N.; Randhawa, J.K. Curcumin encapsulated zeolitic imidazolate frameworks as stimuli responsive drug delivery system and their interaction with biomimetic environment. Sci. Rep. 2017, 7, 12598–12610. [Google Scholar] [CrossRef]
- Hudiyanti, D.; Al Khafiz, M.F.; Anam, K.; Siahaan, P.; Christa, S.M. In Vitro Evaluation of Curcumin Encapsulation in Gum Arabic Dispersions under Different Environments. Molecules 2022, 27, 3855. [Google Scholar] [CrossRef]
- Kuźmińska, J.; Sobczak, A.; Wierzchowski, M.; Gośliński, T.; Jelińska, A. Historia i chemia kurkuminy. Farmacja Współczesna 2021, 14, 140–145. [Google Scholar]
- Rezaei, A.; Fathi, M.; Jafari, S.M. Nanoencapsulation of hydrophobic and low-soluble food bioactive compounds within different nanocarriers. Food Hydrocoll. 2019, 88, 146–162. [Google Scholar] [CrossRef]
- Prokopowicz, M.; Różycki, K.M. Innovation in cosmetics. World Sci. News 2017, 72, 448–456. [Google Scholar]
- Education in microscopy and digital imaging. Available online: https://zeiss-campus.magnet.fsu.edu/articles/lightsources/leds.html (accessed on 29 January 2023).
- Al Khafiz, M.F.; Hikmahwati, Y.; Anam, K.; Hudiyanti, D. Key conditions of alpha-tocopherol encapsulation in gum Arabic dispersions. ScopeIndex 2019, 10, 2622–2627. [Google Scholar]
Figure 1.
Structural formula of the keto form of curcumin (based on [22]).
Figure 1.
Structural formula of the keto form of curcumin (based on [22]).

Figure 2.
Schematic Jablonski-type diagram illustrating the mechanism of PDT (adapted with permission from ref. [39] 2022, Elsevier). Notation: PS—photosensitizer; PSES—PS excited singlet state; PSET—PS excited triplet state; ROS—reactive oxygen species; 1O2—singlet oxygen.
Figure 2.
Schematic Jablonski-type diagram illustrating the mechanism of PDT (adapted with permission from ref. [39] 2022, Elsevier). Notation: PS—photosensitizer; PSES—PS excited singlet state; PSET—PS excited triplet state; ROS—reactive oxygen species; 1O2—singlet oxygen.

Figure 3.
Low-angle diffractograms (panel (A)) and high-angle diffractograms (panel (B)) of pure curcumin and hierarchical materials based on commercial zeolite of FAU type, and high-angle diffractograms of pure hierarchical zeolite.
Figure 3.
Low-angle diffractograms (panel (A)) and high-angle diffractograms (panel (B)) of pure curcumin and hierarchical materials based on commercial zeolite of FAU type, and high-angle diffractograms of pure hierarchical zeolite.


Figure 4.
Nitrogen desorption/desorption isotherms for (A) commercial FAU-type zeolite, (B) hierarchical zeolite, (C) hierarchical zeolite with curcumin, and (D) hierarchical zeolite with curcumin and piperine.
Figure 4.
Nitrogen desorption/desorption isotherms for (A) commercial FAU-type zeolite, (B) hierarchical zeolite, (C) hierarchical zeolite with curcumin, and (D) hierarchical zeolite with curcumin and piperine.

Figure 5.
FT−IR spectra of hierarchical materials obtained from commercial FAU-type zeolite modified with curcumin.
Figure 5.
FT−IR spectra of hierarchical materials obtained from commercial FAU-type zeolite modified with curcumin.

Figure 6.
Thermograms of (A) TG and (B) DTG of the samples studied.

Figure 7.
SEM mages of (A) curcumin, (B) piperine, (C) FAU/CTABr, (D) FAU/CTABr/CUR150.


Figure 8.
Confocal microscope images showing: (A) curcumin, (B) pure hierarchical zeolite, (C) hierarchical zeolite with incorporated curcumin, and (D) hierarchical zeolite with incorporated curcumin and piperine.
Figure 8.
Confocal microscope images showing: (A) curcumin, (B) pure hierarchical zeolite, (C) hierarchical zeolite with incorporated curcumin, and (D) hierarchical zeolite with incorporated curcumin and piperine.


Figure 9.
UV–vis spectra of pure curcumin solution and curcumin after adsorption on FAU zeolite.

Figure 10.
The light-induced release profile of curcumin from hierarchical zeolites; (A): the curcumin release process from hierarchical zeolites under artificial and natural light; (B): the curcumin release process from hierarchical zeolites in the absence of light; (C): the curcumin release process from hierarchical zeolites under mixed light (natural light, artificial light, and an additional light source of 36 W and luminous flux of 2900 lm).

Figure 11.
The release profile of curcumin from hierarchical zeolites using the photodynamic release method.
Figure 11.
The release profile of curcumin from hierarchical zeolites using the photodynamic release method.

Figure 12.
Scheme of photorelease of curcumin from the surface and interior of hierarchical FAU-type zeolite.
Figure 12.
Scheme of photorelease of curcumin from the surface and interior of hierarchical FAU-type zeolite.

Figure 13.
Schematic of the standard release of curcumin from the zeolite carrier.

Figure 14.
Excitation profiles of the light sources used (adapted with permission from ref. [83] 2023, Zeiss).
Figure 14.
Excitation profiles of the light sources used (adapted with permission from ref. [83] 2023, Zeiss).


Table 1.
Selected textural properties for materials based on commercial zeolite type FAU.
| Materials | Surface Area (m2/g) | Pore Volume (cm3/g) | ||
|---|---|---|---|---|
| SBET | Total Pore Volume | Volume of Micropores | Mesopore Volume | |
| Commercial zeolite FAU | 718 | 0.37 | 0.30 | 0.05 |
| FAU/CTABr | 892 | 0.49 | 0.19 | 0.30 |
| FAU/CTABr/CUR150 | 688 | 0.35 | 0.31 | 0.04 |
| FAU/CTABr/CUR150/ PIP0,25 | 203 | 0.12 | 0.06 | 0.06 |
Table 2.
Elemental analysis of curcumin, commercial FAU zeolite, and hierarchical materials before and after curcumin incorporation.
Table 2.
Elemental analysis of curcumin, commercial FAU zeolite, and hierarchical materials before and after curcumin incorporation.
| Sample Name | %C | %H |
|---|---|---|
| Commercial zeolite FAU | 0.74 | 0.35 |
| Curcumin | 30.26 | 4.61 |
| FAU/CTABr | 0.02 | 2.28 |
| FAU/CUR150 | 5.69 | 2.64 |
| FAU/CTABr/CUR150 | 17.30 | 3.24 |
| FAU/CTABr/CUR150/PIP0.25 | 19.23 | 2.52 |
Table 3.
Encapsulation efficiency (EE) and loading capacity (LC) of curcumin into hierarchical zeolites.
Table 3.
Encapsulation efficiency (EE) and loading capacity (LC) of curcumin into hierarchical zeolites.
| Sample | Active Substance | EE (% ± SD) | LC (% ± SD) |
|---|---|---|---|
| FAU/CUR150 | Curcumin | 55.8 ± 0.62 | 9.7 ± 0.52 |
| FAU/CTABr/CUR150 | Curcumin | 69.6 ± 0.12 | 14.7 ± 0.22 |
| FAU/CTABr/CUR150/PIP0,25 | Curcumin and Piperine | 78.9 ± 0.45 | 20.4 ± 0.16 |
Table 4.
Selecting the appropriate light length for the photodynamic release of curcumin from hierarchical zeolites.
Table 4.
Selecting the appropriate light length for the photodynamic release of curcumin from hierarchical zeolites.
| Wavelength | Color | % Release | ±SD |
|---|---|---|---|
| 365–370 | UV | 12.64% | ±0.70 |
| 450 | Blue | 18.28% | ±0.27 |
| 500 | Cyan | 47.99% | ±0.18 |
| 525 | Green | 36.98% | ±0.43 |
| 595 | Yellow | 18.38% | ±0.32 |
| 620–630 | Red | 25.11% | ±0.26 |
Table 5.
Summary of combined wavelengths relevant to the release of curcumin from the zeolite carrier.
Table 5.
Summary of combined wavelengths relevant to the release of curcumin from the zeolite carrier.
| Color | Wavelength | % Release | ±SD |
|---|---|---|---|
| Blue–Green | 450 and 525 nm | 45.89% | ±0.21 |
| Cyan–Green | 500–525 nm | 51.20% | ±0.33 |
| Blue–Cyan–Green | 430–550 | 53.24% | ±0.54 |
| Yellow–Red | 450–525 nm | 31.07% | ±0.12 |
| Multi-colored | 365–630 nm | 23.48% | ±0.61 |
Table 6.
Rate constants and half-life of curcumin release.
| Material | Kinetic Model | Total Amount Released [%] | ||
|---|---|---|---|---|
| 0 Order | 1st Order | Higuhi | ||
| R2 | R2 | R2 | ||
| Open system | ||||
| K/G5/T37/LNA | 0.7745 | 0.7953 | 0.7745 | 23.28 |
| K/G5/T37/PIP/LNA | 0.8103 | 0.8195 | 0.8103 | 10.57 |
| K/G5/T37/WL | 0.8151 | 0.8262 | 0.8144 | 12.84 |
| K/G5/T37/PIP/WL | 0.6675 | 0.6795 | 0.6675 | 9.65 |
| K/G5/T37/LM | 0.6693 | 0.6961 | 0.6693 | 21.35 |
| K/G5/T37/PIP/LM | 0.5836 | 0.6044 | 0.5836 | 14.13 |
| Fotodynamic release | ||||
| Cyan | 0.6063 | 0.6486 | 0.6063 | 46.26 |
| Green-Blue | 0.5360 | 0.5747 | 0.5360 | 41.29 |
| Blue-Cyan-Green | 0.5939 | 0.6398 | 0.5939 | 50.46 |
Table 7.
Parameter optimization in the photodynamic release of curcumin.
| Sample | Stabilizer | Stabilizer Quantity (mL) | Process Temperature (°C) | Type of Light |
|---|---|---|---|---|
| C/G1/T37/LNA | Glycerin | 1 | 37 | natural light artificial light |
| C/E1/T37/LNA | Ethyl alcohol | 1 | 37 | natural light artificial light |
| C/TW1/T37/LNA | Tween 80 | 1 | 37 | natural light artificial light |
| C/G5/T37/LM | Glycerin | 5 | 37 | natural light artificial light additional light source |
| C/G5/T37/NL | Glycerin | 5 | 37 | no light |
| C/G5/T43/LNA | Glycerin | 5 | 43 | natural light artificial light |
| C/G5/T37/PIP/LM | Glycerin | 5 | 37 | natural light artificial light additional light source |
| C/G5/T37/PIP/NL | Glycerin | 5 | 37 | no light |
| C/G5/T37/PIP/LNA | Glycerin | 5 | 43 | natural light artificial light additional light source |
Table 8.
Parameters of the study of curcumin release from hierarchical zeolites.
| Measurement Parameter | Parameter Value |
|---|---|
| Process temperature | 37 °C |
| Agitator speed | 200 RPM/min |
| Testing time | 24 h |
| Media quantity | 2.00 mg |
| Amount of promoter | 5.00 mL |
| Buffer volume | 20.00 mL |
Table 9.
Spectral colors depend on the wavelength band.
| Wavelength Range (nm) | Perceived Color |
|---|---|
| 365–370 | UV |
| 395–405 | UV |
| 450 | Blue |
| 500 | Cyan |
| 525 | Green |
| 595 | Yellow |
| 620–630 | Red |
Disclaimer/Publisher’s Note: The statements, opinions and data contained in all publications are solely those of the individual author(s) and contributor(s) and not of MDPI and/or the editor(s). MDPI and/or the editor(s) disclaim responsibility for any injury to people or property resulting from any ideas, methods, instructions or products referred to in the content. |
© 2023 by the authors. Licensee MDPI, Basel, Switzerland. This article is an open access article distributed under the terms and conditions of the Creative Commons Attribution (CC BY) license (https://creativecommons.org/licenses/by/4.0/).
Share and Cite
MDPI and ACS Style
Musielak, E.; Feliczak-Guzik, A.; Jaroniec, M.; Nowak, I. Photodynamic Light-Triggered Release of Curcumin from Hierarchical FAU Zeolite. Catalysts 2023, 13, 394. https://doi.org/10.3390/catal13020394
AMA Style
Musielak E, Feliczak-Guzik A, Jaroniec M, Nowak I. Photodynamic Light-Triggered Release of Curcumin from Hierarchical FAU Zeolite. Catalysts. 2023; 13(2):394. https://doi.org/10.3390/catal13020394
Chicago/Turabian StyleMusielak, Ewelina, Agnieszka Feliczak-Guzik, Mietek Jaroniec, and Izabela Nowak. 2023. "Photodynamic Light-Triggered Release of Curcumin from Hierarchical FAU Zeolite" Catalysts 13, no. 2: 394. https://doi.org/10.3390/catal13020394
Note that from the first issue of 2016, this journal uses article numbers instead of page numbers. See further details here.