Article

Influence of Synthesis Methodology on the Properties and Catalytic Performance of Tin, Niobium, and Tin-Niobium Oxides in Fructose Conversion

by
Thatiane Veríssimo dos Santos Martins
,
Dhara Beatriz de Amorim Pryston
,
Simoni Margareti Plentz Meneghetti
* and
Mario Roberto Meneghetti
*
Group of Catalysis and Chemical Reactivity, Institute of Chemistry and Biotechnology, Federal University of Alagoas, Av. Lourival Melo Mota, Tabuleiro do Martins, Maceió 57072-970, Brazil
*
Authors to whom correspondence should be addressed.
Catalysts 2023, 13(2), 285; https://doi.org/10.3390/catal13020285
Submission received: 23 December 2022 / Revised: 23 January 2023 / Accepted: 25 January 2023 / Published: 27 January 2023

Abstract

:
Pure and mixed oxides were synthesized using three methods, namely, coprecipitation, hydrothermal treatment using CTAB and Pechini treatment using glycerol, and investigated for the transformation of fructose, aiming to determine the influence of textural, structural, and acid-base properties on conversion and selectivity. All systems led to fructose conversion in an aqueous medium, and the factors that influenced the transformation were the textural and structural properties, as well as the number of acid sites present in the catalysts. The best conversions were observed using mixed oxides, highlighting SnNb (CTAB) and SnNb (GLY), showing the importance of the modulation of properties using the synthesis method. All systems were selective mainly for 5-HMF (5-hydroxymethylfurfural) and, to a lesser extent, for the products of the retro-aldolic route, and this selectivity was preserved, regardless of the catalytic system used.

1. Introduction

The dependence of society on fossil sources to produce chemicals and energy has generated several environmental and economic concerns, and research has been intensified to establish environmentally friendly alternatives [1,2]. Renewable biomass, in particular carbohydrates, is an excellent candidate for use as a raw material that facilitates the transition from the fossil industry to biorefineries, since it is abundant, presents excellent cost-effectiveness and constitutes a promising starting material for obtaining a wide range of products of great industrial interest, many of which are considered commodities [3,4].
Among carbohydrates, fructose is considered an important chemical platform to produce chemical inputs such as glucose, 5-hydroxymethylfurfural (5-HMF), glyceraldehyde, pyruvaldehyde, lactic acid, dihydroxyacetone, formic acid, acetic acid and levulinic acid [5,6,7,8]. Thus, the search for active catalytic systems in the conversion of fructose has been growing, and it is worth mentioning that the nature of the catalysts directs the routes in the transformation of sugars, thereby improving the conversion results of these pathways [9,10].
The reactions conducted in the presence of homogeneous catalytic systems are more selective and efficient than those conducted in heterogeneous systems [11]. However, the disadvantages related to equipment corrosion, difficulty in separating the final product and limitations during recycling and reuse of the catalyst [11,12] drive the quest for efficient heterogeneous catalysts that are easy to separate and reuse.
Among them, metal oxides have attracted great attention as attractive solid catalysts for biomass conversion, since they have unique properties such as thermal and chemical stability, typically having a dual character due to the presence of Lewis and Brønsted acid sites [11,12,13]. Despite some promising results with the use of monometallic oxides, the strategy of synthesizing mixed oxides aims to modulate the textural and chemical properties of the system by strengthening the thermal and chemical stability. One example is based on reports of the use of tin oxide and niobium in biorefinery processes [14,15,16,17,18,19].
The weak Lewis-acidity of the tin species was considered a determining factor in the isomerization reaction [20]. The use of sulfated tin oxide prepared by hydrothermal synthesis applied in the esterification of levulinic acid was also reported, and the results showed that the chemical structure and catalytic performance of these sulfated materials strongly depend on the treatment of nanoparticles before the sulfate procedure [21]. Studies of mesoporous tin oxides applied in the acetalization of glycerol under solvent-free conditions demonstrated that the activity is intrinsically related to the structure and acidity of these systems [22].
Niobium oxide has a wide range of applications in various industrial sectors [19], and studies have shown its catalytic potential, with high selectivity to 5-HMF (5-hydroxymethylfurfural) due to its high Bronsted-acidity [19]. Other work reported that its acidic properties are essential for the conversion of glucose into levulinic acid [23].
Considering all the properties of the pure oxides mentioned above, it is assumed that the mixed oxides of these materials can represent interesting systems in the field of biomass transformation, as they constitute new materials with physicochemical characteristics and particular catalytic properties compared to pure oxides. It is important to note that these properties can be modulated through different synthesis methods with controlled morphologies, particle sizes, crystalline structures and amounts/natures of acidic sites. In the case of a synthetic approach, it is necessary to apply a simple method that can result in materials with adequate catalytic efficiency.
In a recent study by our research group, pure and mixed oxides based on tin and niobium were synthesized using the Pechini method. In this case, the possibility of using glycerol instead of ethylene glycol in the esterification step was demonstrated, thus generating materials with excellent properties, which were obtained via a greener synthesis-process [24].
In this work, aiming to expand the information available on the influence of the synthesis methodology on the properties of this type of material, coprecipitation, surfactant-modeled-hydrothermal (CTAB) and Pechini (using glycerol) methods were used. Complementarily, a study was carried out to determine the influence of their textural, structural, and acid-base properties on the transformation of fructose. According to the research carried out, this is the first time that oxides based on tin and niobium have been synthesized by different methods and applied in this reaction.

2. Results and Discussion

Catalytic systems based on tin and niobium oxides were obtained by (co)precipitation, modeled by the CTAB template and by the Pechini method, using glycerol as the polyol [24]. Such systems were characterized and investigated in the conversion of fructose, aiming to determine how their properties drive this reaction.

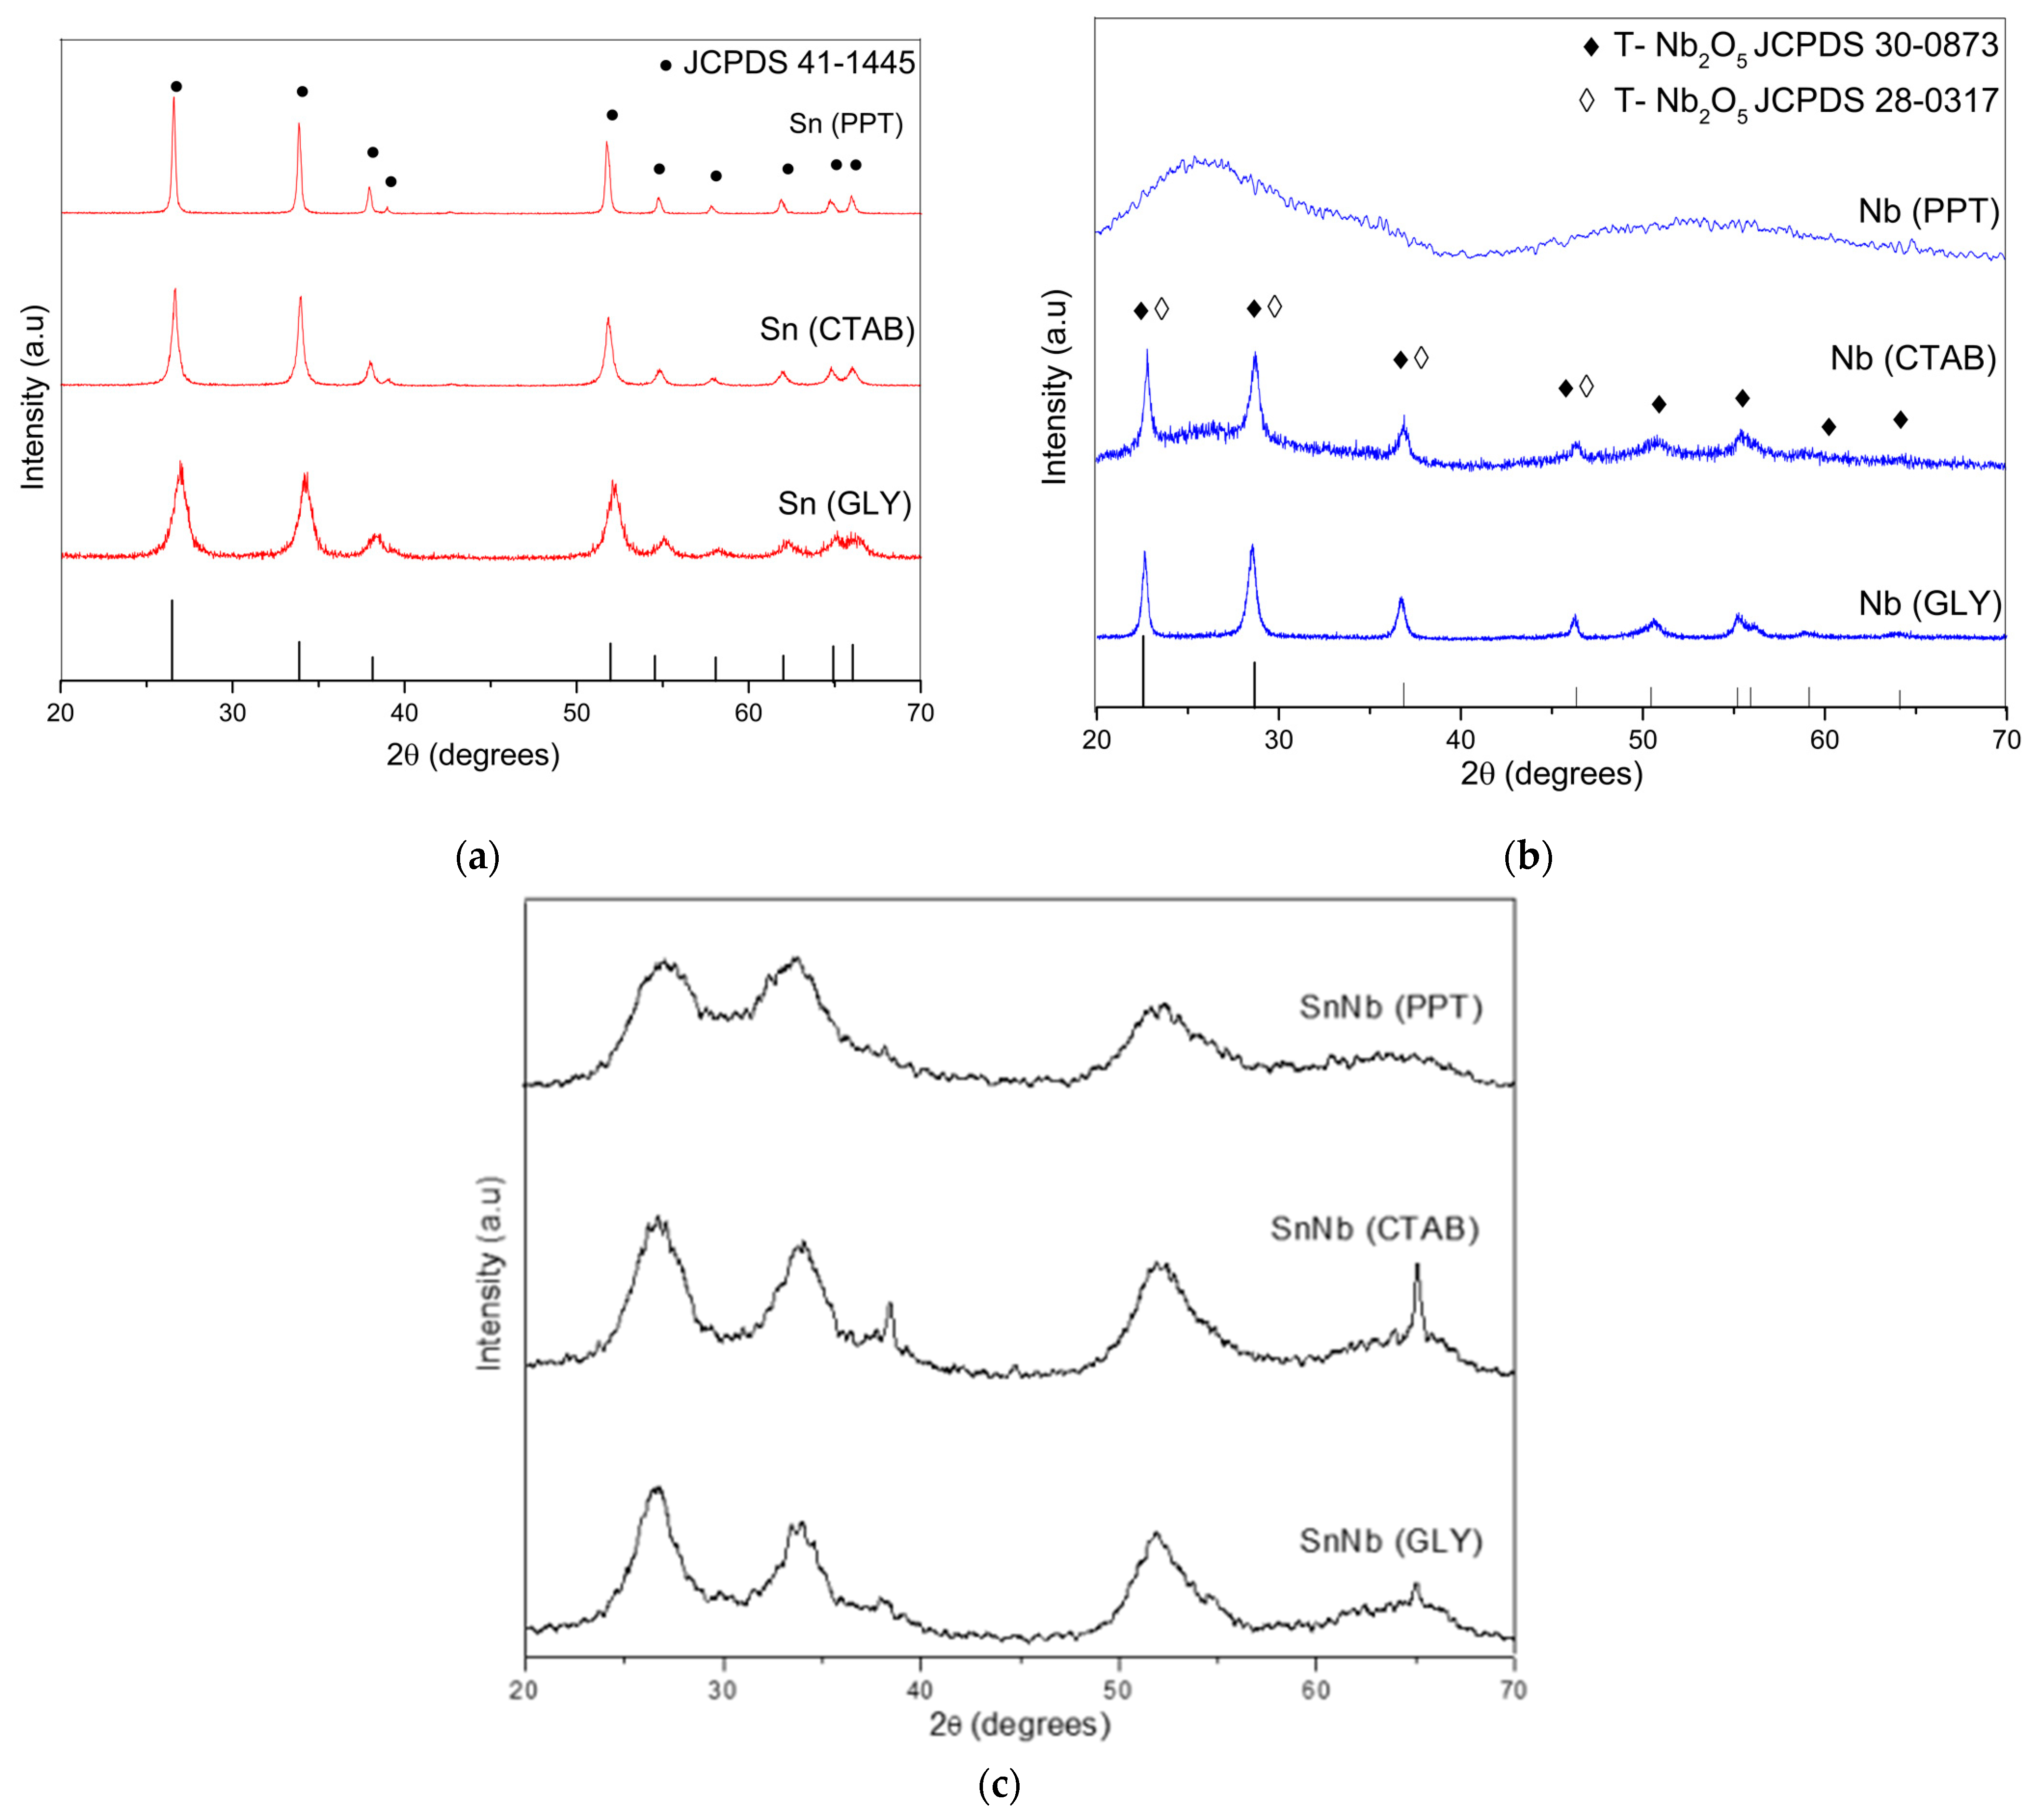
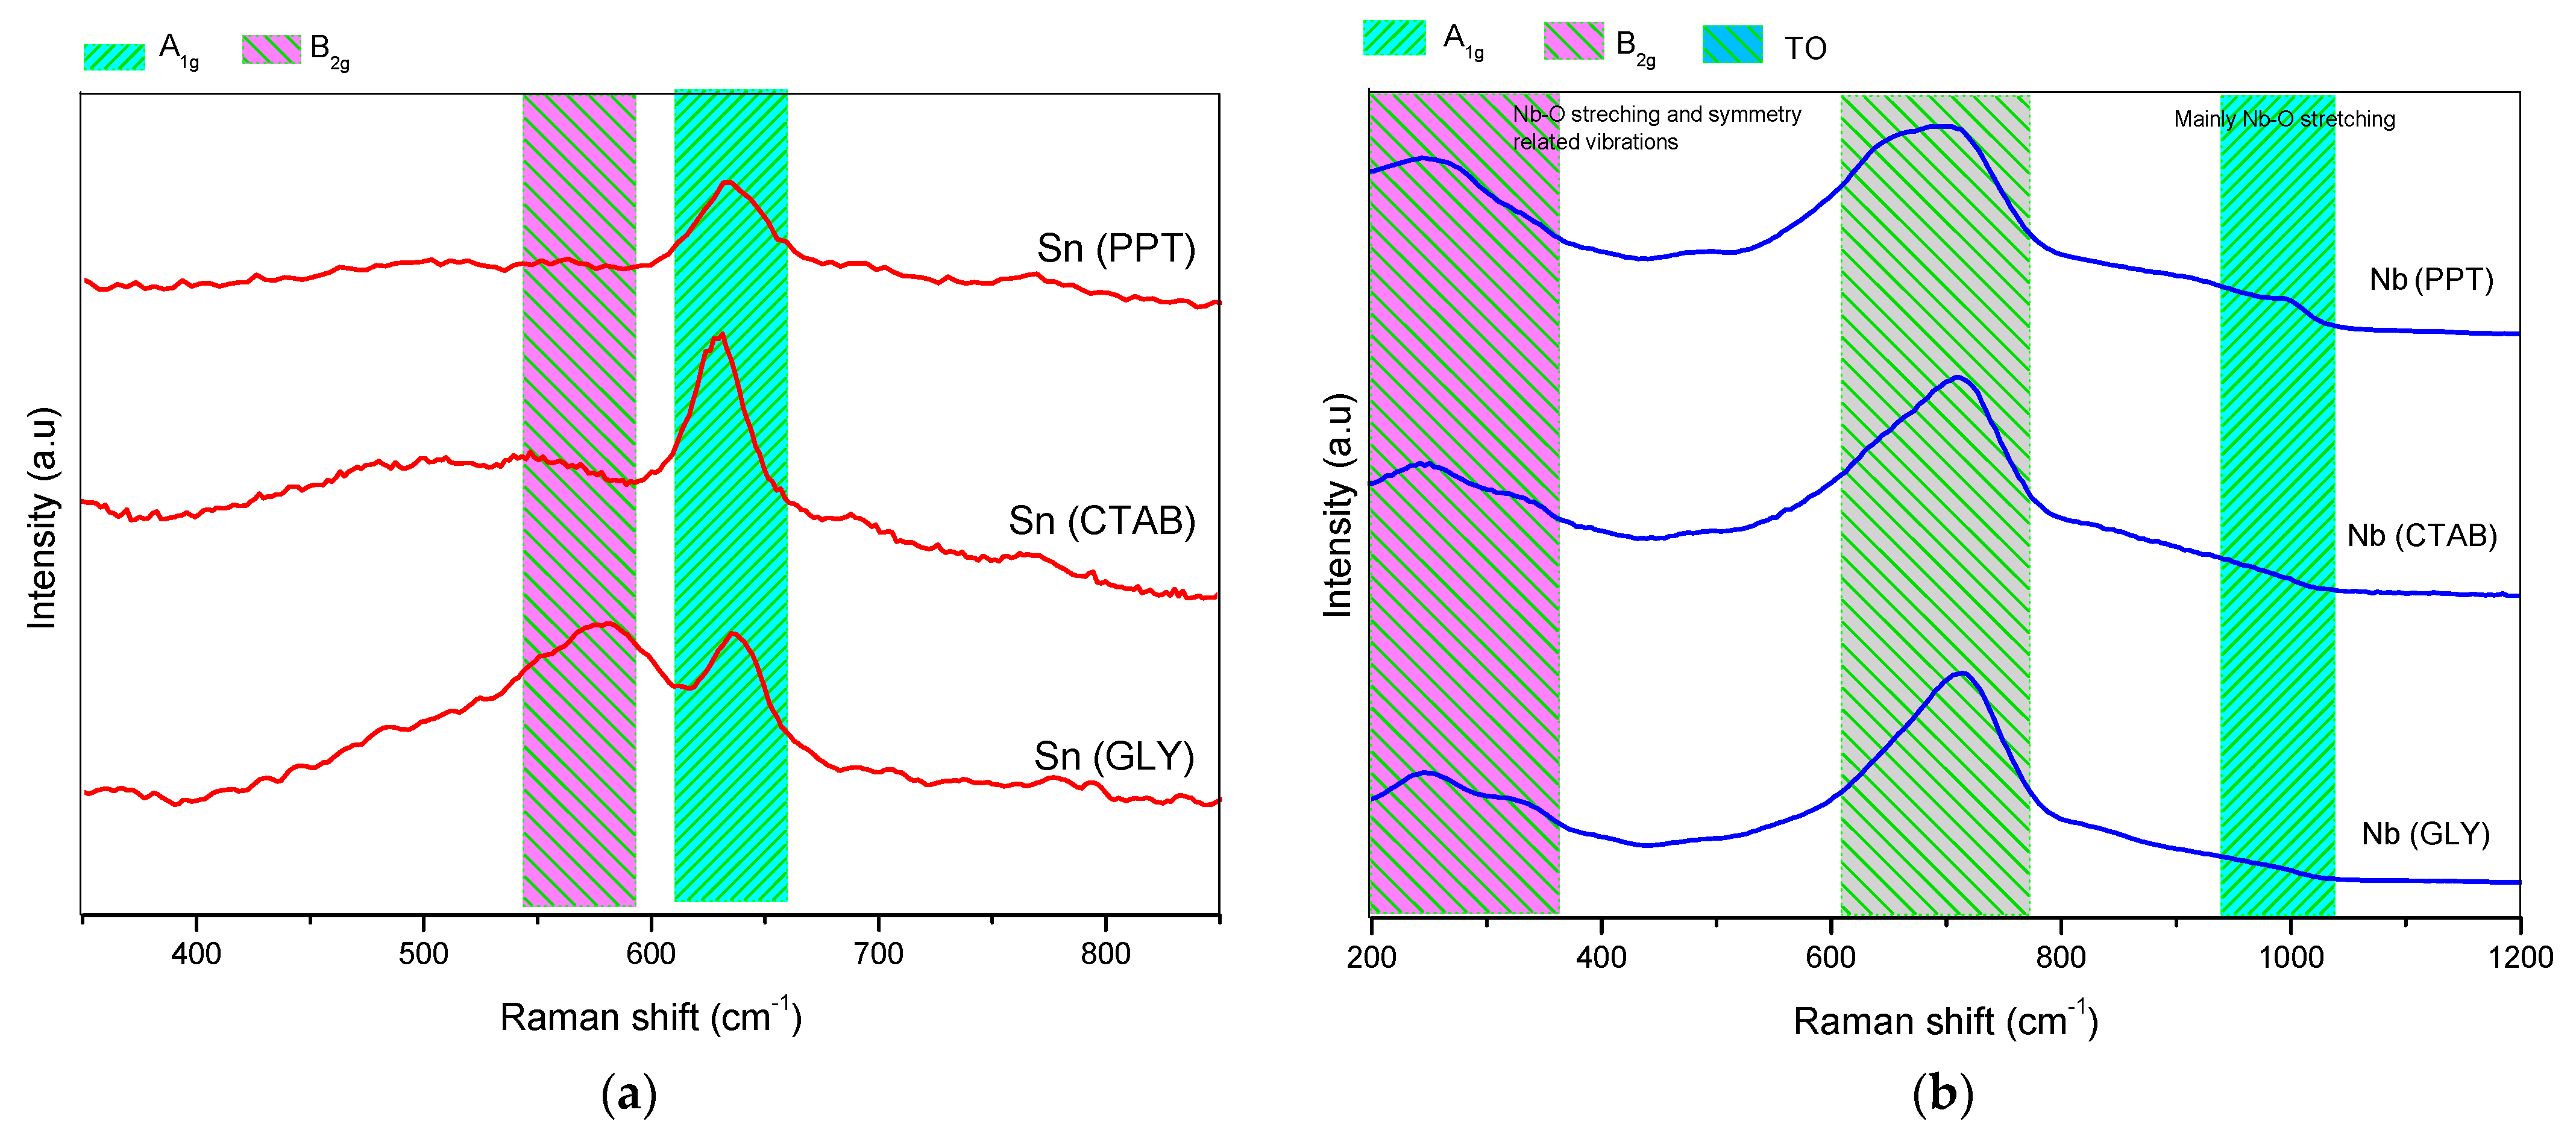
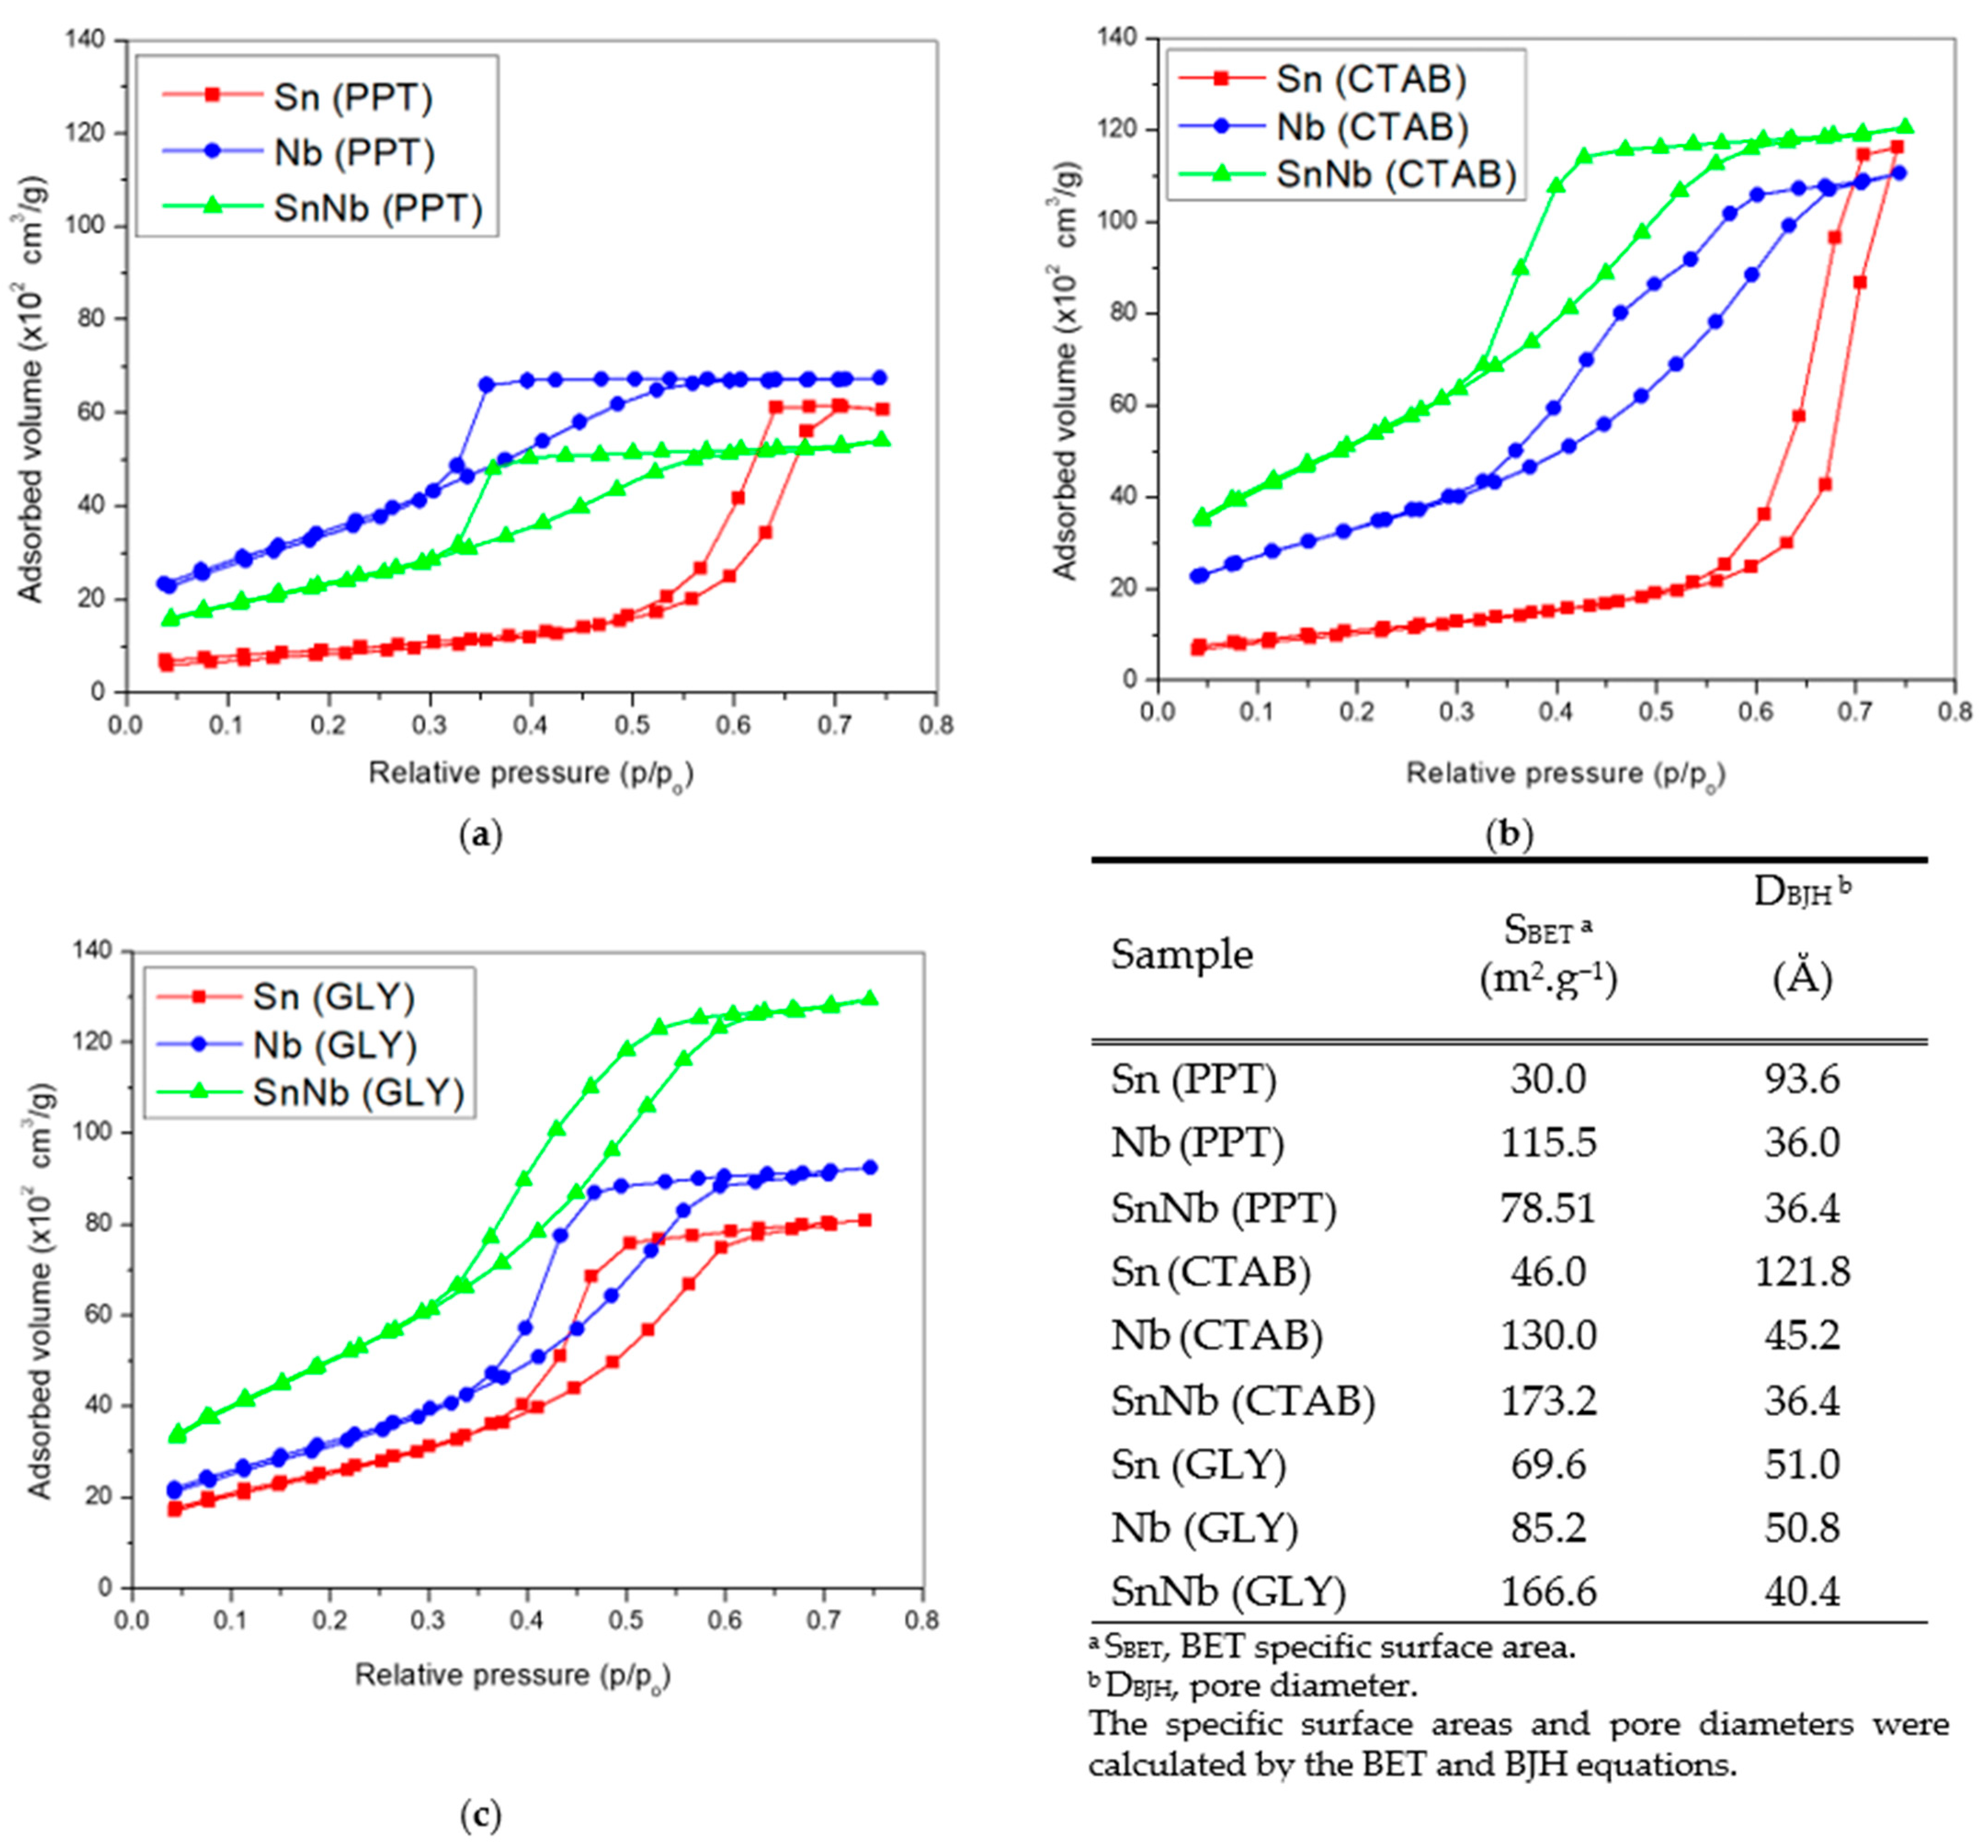
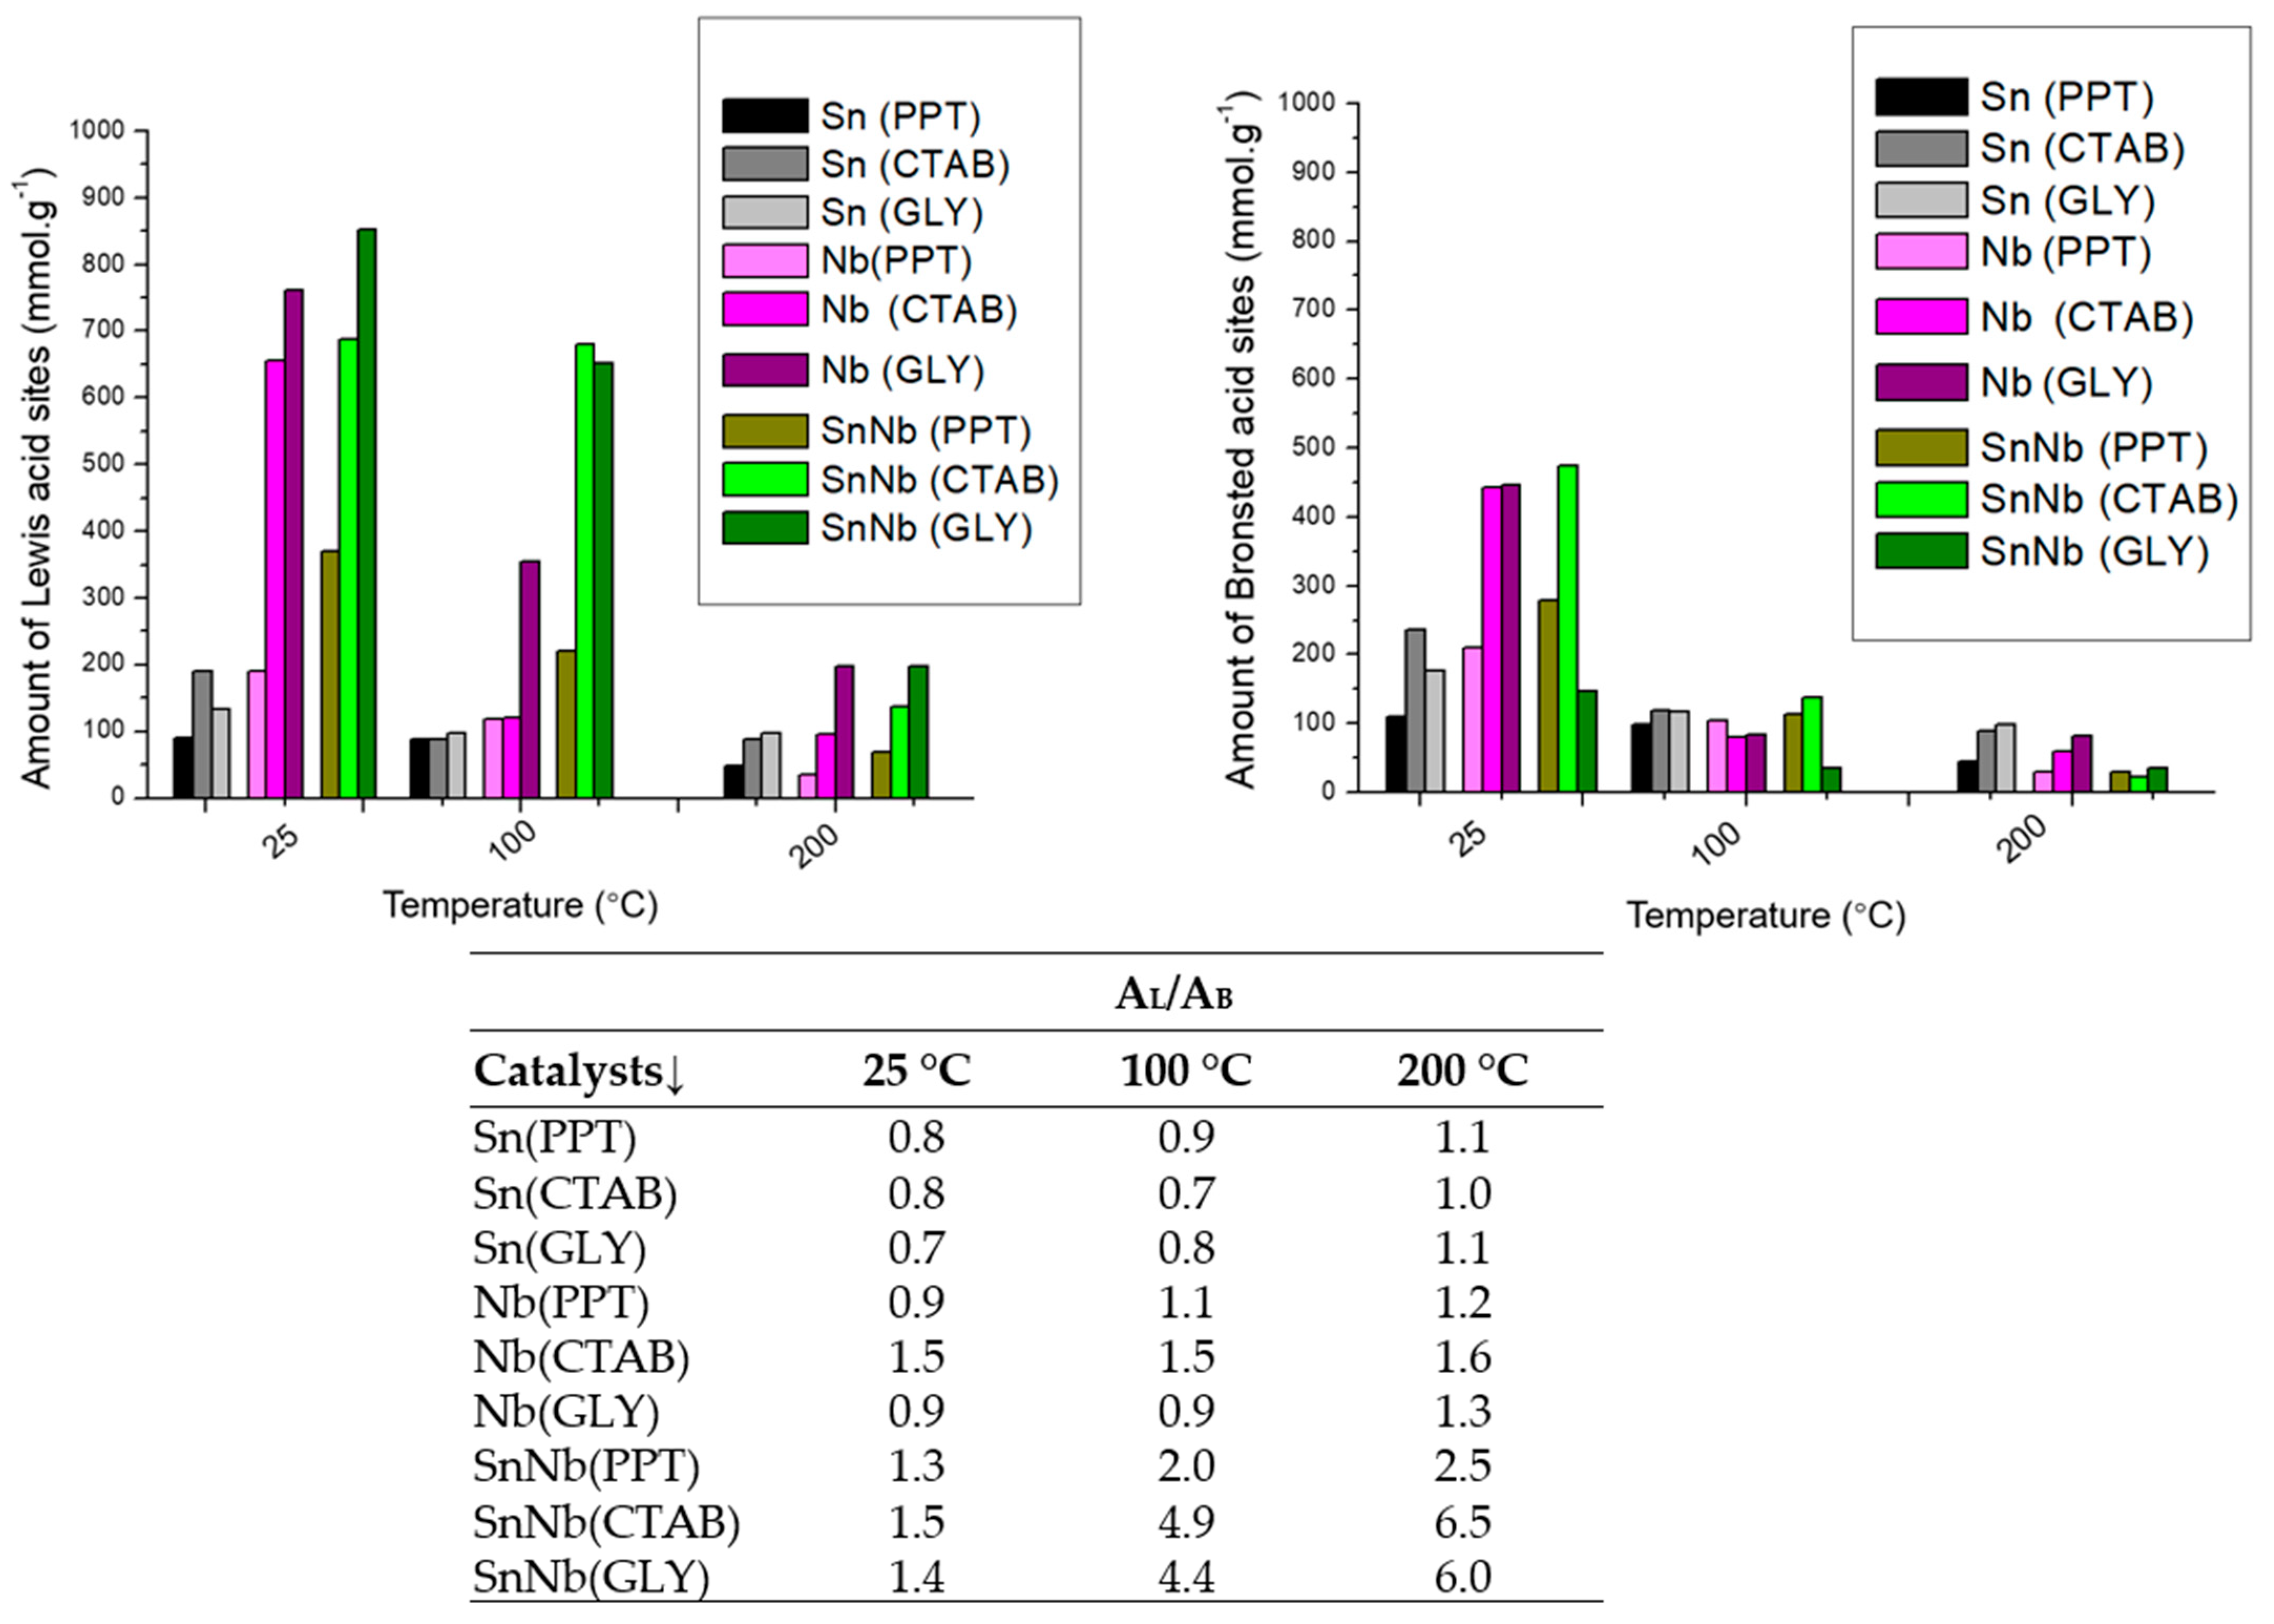
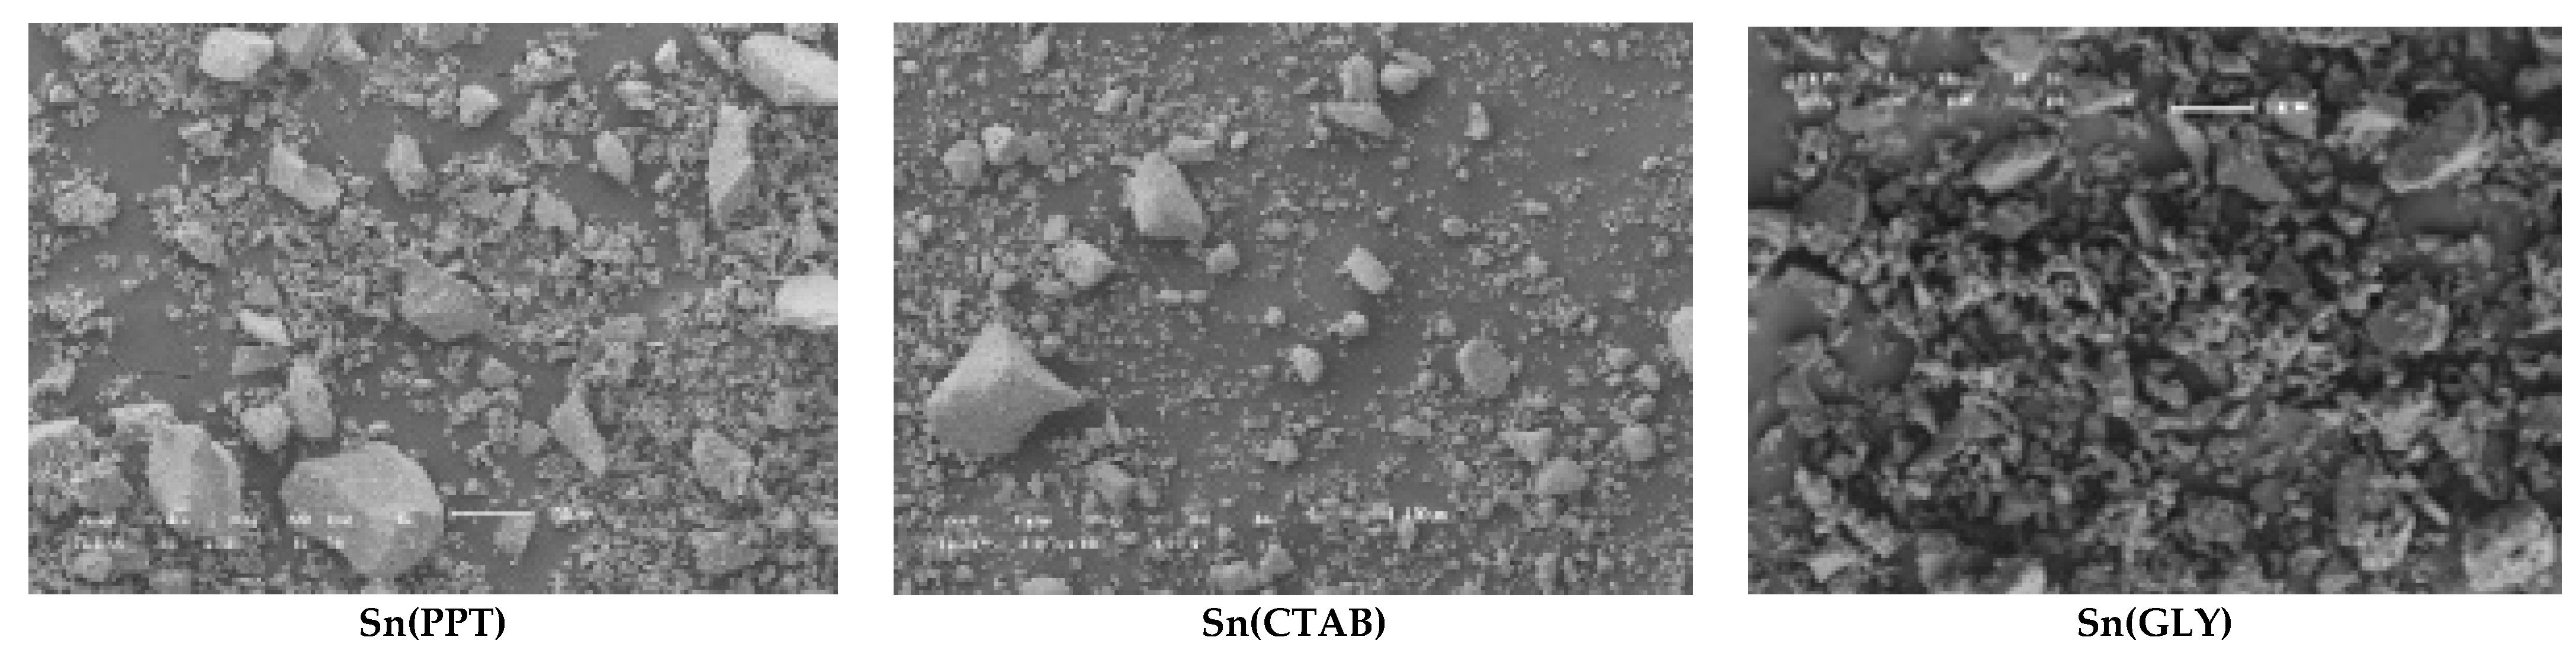
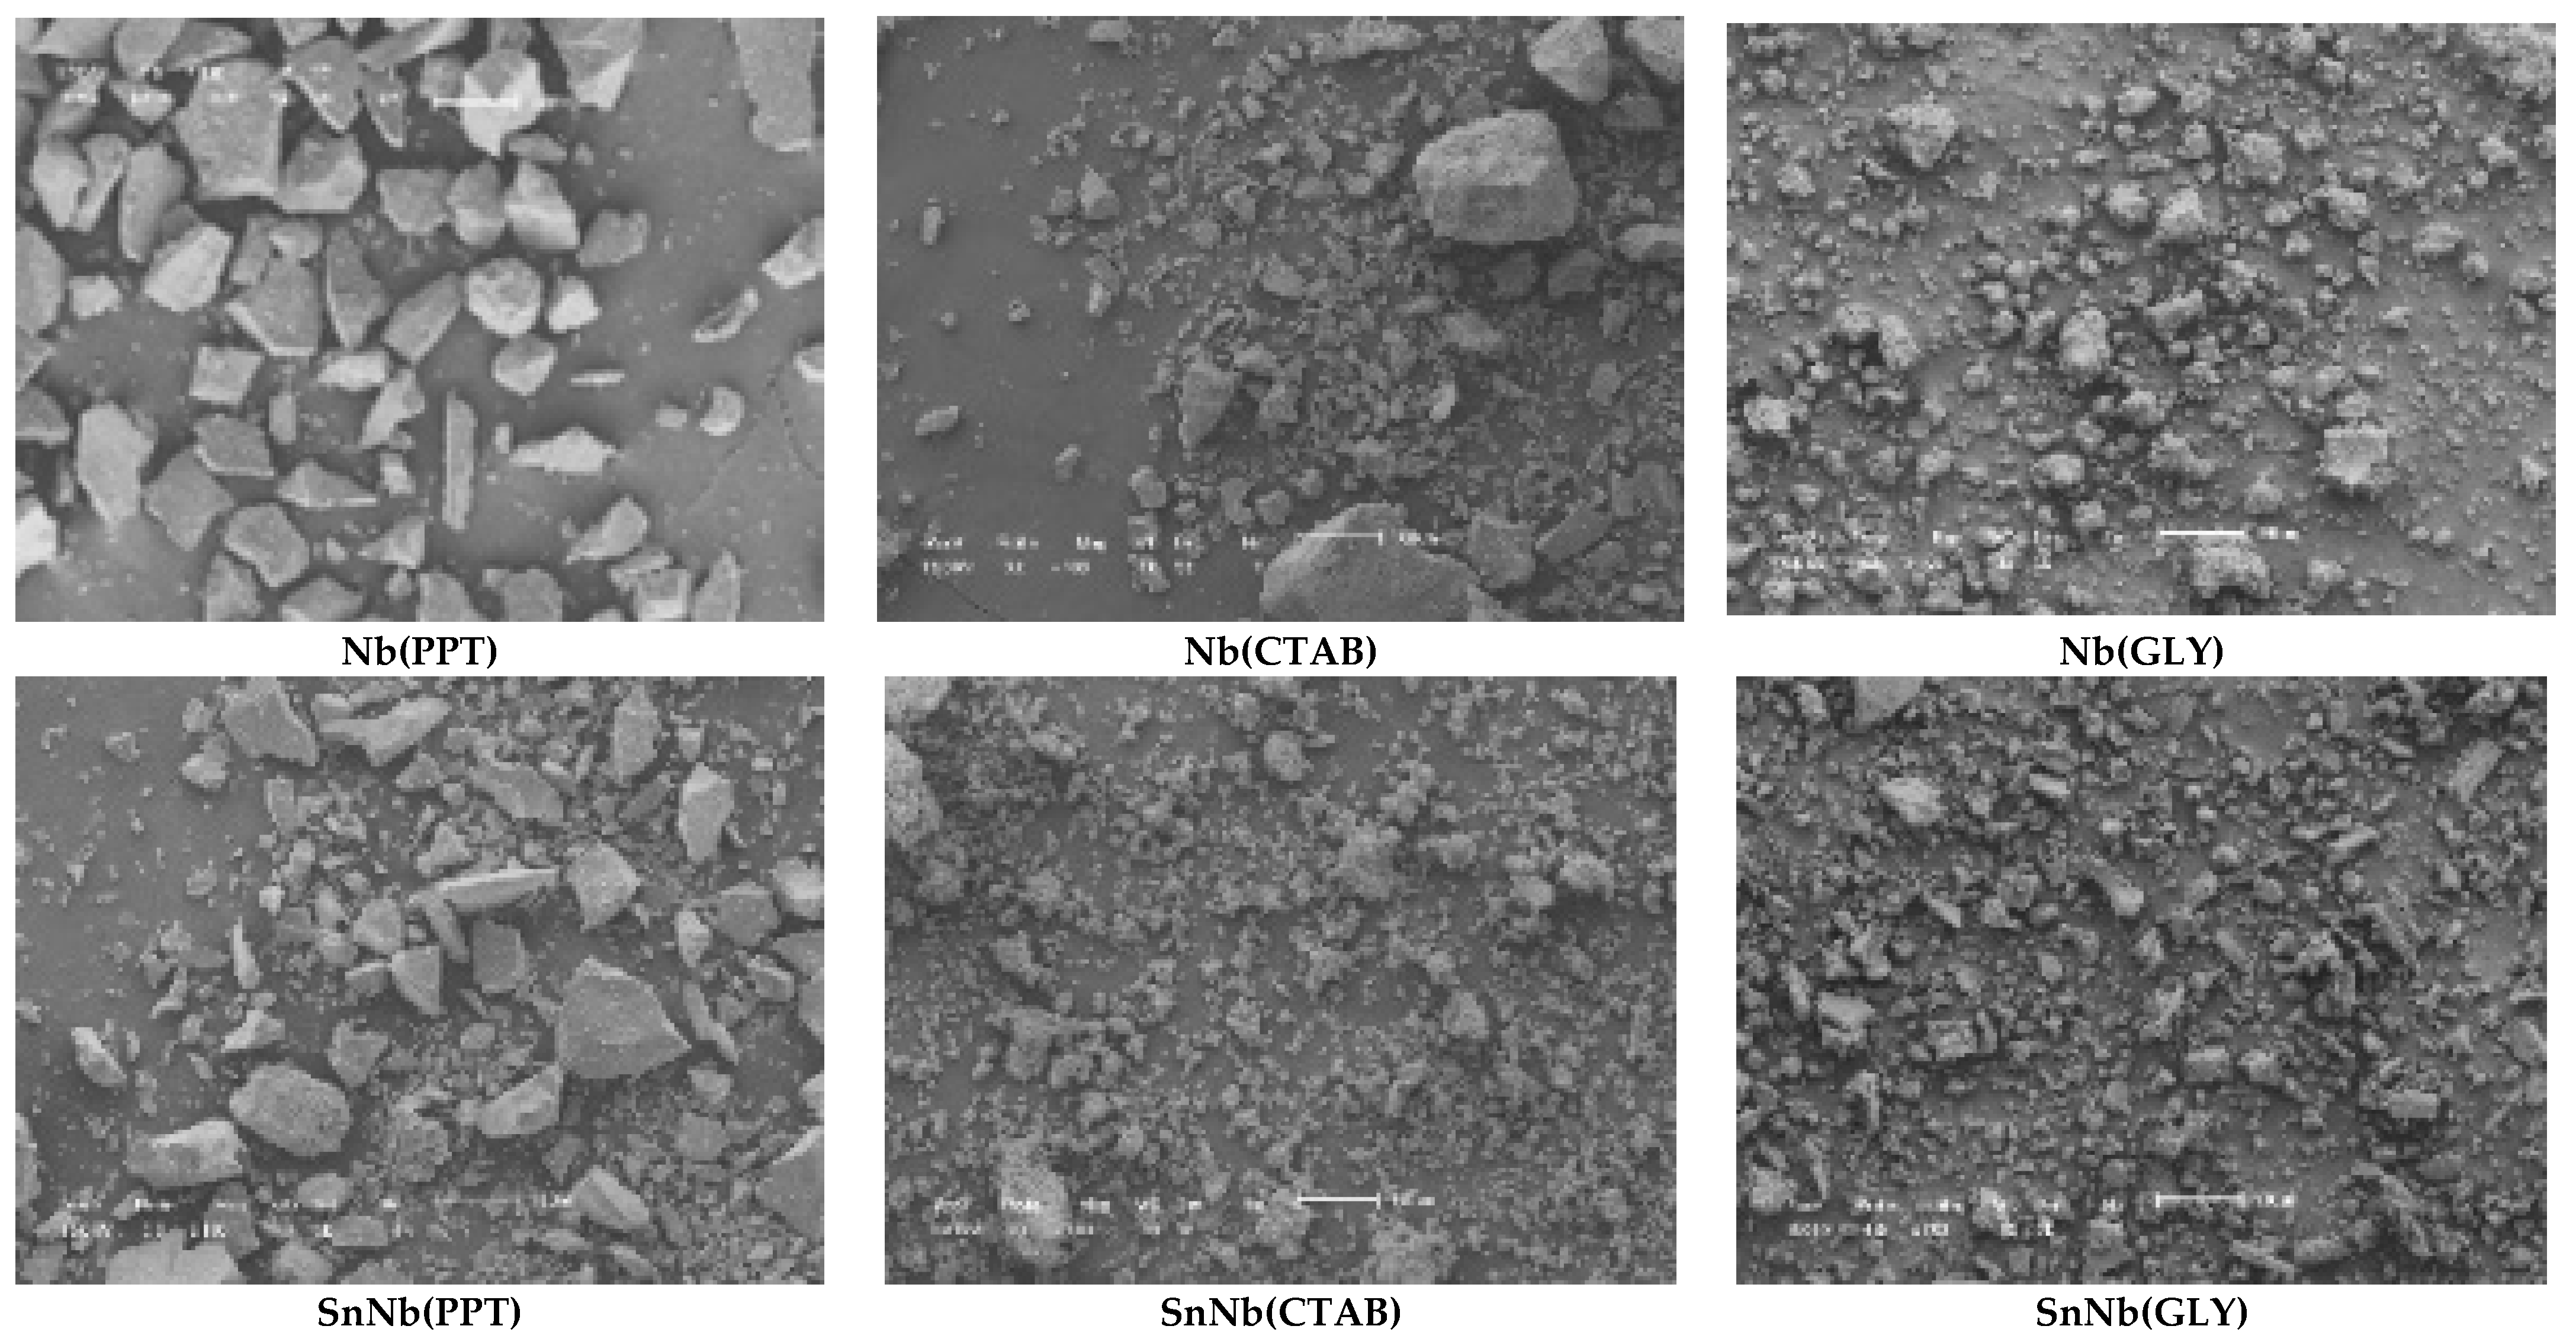
2.1. Characterization of the Catalysts

Initially, for the mixed oxides, the amount of niobium present in the materials was determined, and values of 11.6, 15.8 and 16.9% were attained for SnNb (PPT), SnNb (CTAB) and SnNb (GLY), respectively [24].
The X-ray diffraction patterns of the various materials are shown in Figure 1. For the pure tin oxides, despite the synthesis method used, the signals present in the diffractograms (Figure 1a) confirm the polycrystalline and single-phase nature of the systems. In this case, tin oxides can be classified as tetragonal rutile (JCPDS no. 41-1445), as confirmed by the crystallographic planes (110), (101), (200), (211), (220), (002) (310), (112), (301), (202) and (321). Comparatively, Sn(PPT) showed a narrowing of the diffraction peaks, suggesting a gradual increase in crystallinity due to crystallite agglomeration. The tin oxides synthesized by the other methods showed a considerable decrease in intensity in the reflection plane (110), which suggests that there is great disorder generated in the material [22].
XRD patterns for niobium oxide are shown in Figure 1b. Nb(PPT) showed an amorphous profile, but Nb(CTAB) and Nb(GLY) showed the crystallographic planes (001), (180), (181), (002), (321), (182), (215), (216) and (481), which indicate the predominance of the orthorhombic phase (T Nb2O5-JCPDS 30-0873) [25]. However, it is not possible to rule out the presence, to a lesser extent, of the pseudohexagonal phase with crystallographic planes in (001), (100), (101), (002), (110) and (102) (TT Nb2O5-JCPDS 280317). The most accentuated differences are noticed in the range between 25 and 40°, and it is important to note that the positions of the signals referring to the hexagonal phase and the orthorhombic phases are so close that it is difficult to differentiate between the two. This result is attributed to the presence of vacancies or impurities in the materials [26,27].
For all mixed oxides (Figure 1c), it is possible to observe the predominant presence of the tetragonal phase, with broader and less-intense signals compared to the precursors, suggesting that the difference in ionic radii due to the replacement of Sn4+ by Nb5+ caused the distortion of the cell lattice of SnO2. Analyzing the diffractograms, it is possible to verify the fact that there was an enlargement of the reflection peaks, which may be related to the crystallite size and the short-range disorder.
The spectra in the mid-infrared region are shown in Figure 2. For SnO2, the presence of a broad band in the range of 497 and 662 cm−1 was observed, which is attributed to the O-Sn-O and Sn-O stretching modes and SnO2 flexion [28,29]. For niobium oxides, typical vibrations were observed in the range of 410 to 931 cm−1, giving rise to a broad band attributed to the vibrations of the Nb-O-Nb bonds of the slightly distorted octahedral NbO6 and the symmetrical stretching of the Nb-O species present in highly distorted environments [30]. The signal at 1625 cm−1 can be attributed to water molecules adsorbed on the surface of this material. There is also the presence of a band at 3412 cm−1, probably due to the vibration of the Nb-OH bond [30].
The mixed oxides presented vibrations similar to the pure ones. There is a broad band in the region between 410 and 931 cm−1 that is attributed to the symmetrical and asymmetrical stretching of metal-oxygen bonds, respectively. The signal at 3412 cm−1 and the bands at ~1100 cm−1 and 1350–1400 cm−1 can be attributed to bound metal-OH [31].
Some characteristics of the oxides were investigated using Raman spectroscopy (see Figure 3). It is important to remember that the SnO2 synthesized by the various synthesis protocols has a rutile structure (more stable phase) and belongs to the space group D 4 h 14 (P42/mnm) [32]. Among these vibrations, the A1g, B1g, B2g and Eg modes are active in Raman, while A2u, Eu and B1u are infrared active and optically inactive [33]. It has already been reported in the literature that the A1g, B1g and B2g bands indicate the vibration modes of the Sn-O bonds, while the Eg band reveals the oxygen vacancies [32]. The SnO2 Raman spectrum (Figure 3a) mainly exhibited two bands at approximately 630 and 770 cm−1, which are attributed to vibration modes A1g and B2g, respectively. This fact is a strong indication that SnO2 has a tetragonal structure. In addition to the two signals, there is another weak signal at approximately 694 cm−1, which is attributed to the IR-active A2u LO mode (the mode of longitudinal optical-phonons). Another mode was detected at 572 cm−1, attributed to the smaller particle-size of SnO2 [34].
Raman spectra of the niobium oxides are shown in Figure 3b, and the low-resolution signal located at 990 cm−1 is attributed to the vibration modes of A1g(ν1) of the octahedral NbO6 [35,36]. The signals that appear between 200 and 300 cm−1 are characteristic of the bending modes of the Nb–O–Nb bonds [37], and the signals present in the range of 400–800 cm−1 are attributed to symmetric and asymmetric stretching of the Nb-O-Nb bond [37]. A signal observed at approximately ∼700 cm−1 is attributed to the orthorhombic Nb2O5 TO mode [35]. The Nb2O5 samples synthesized by the various methods belong to the space group (P212121). In this crystalline structure, there are two Nb5+ sites, and the first Nb5+ is bonded to four O2- atoms, to form corner-sharing NbO4 tetrahedra. The second Nb5+ is bonded to six O2- atoms, to form NbO6 octahedrons [36].
Figure 3c shows the spectra of the mixed oxides. The band at approximately 632 cm−1 is attributed to the A1g mode associated with symmetrical stretching of the Sn-O bond [37]. Considering that mixed oxides are formed by Sn, O and Nb atoms and that the crystalline structure of tin oxide belongs to the P42/mnm point group and tetragonal Bravais lattice, it can be inferred that the crystalline structure is distorted by the insertion of niobium atoms into the lattice, causing the appearance of oxygen vacancies during synthesis. This network-sharing promotes the appearance of defects, and this same phenomenon has already been reported in other studies, for metal oxides [38].
For all spectra of pure or mixed oxide (Figure 3) it is not possible to discard the presence of the band related to the Eg mode, which is a strong indicator of oxygen vacancies. The appearance of this band is expected at approximately 474 cm−1, and just a low resolution signal is observed in some cases.
DRS UV–vis spectra were also produced (Figure 4), and provide important information about the nature of niobium and tin atoms in these systems. The UV–Vis DRS spectra for the SnO2 samples (Figure 4a) showed an intense absorption band at approximately 300 nm, due to the high binding-energy, which is characteristic of cassiterite, and the strong interaction of the ligand-to-metal-charge-transfer (LMCT)-type [39]. For Nb2O5 samples (Figure 4b), bands at approximately 350 nm were observed, corresponding to orthorhombic and/or hexagonal geometries [40].
The spectra of mixed oxides synthesized by different methods (Figure 4c) are different from those of pure materials, and such evidence is also corroborated by XRD and Raman spectroscopy. Previous studies suggest that the tendency to change the absorption maximum to shorter wavelengths (200–250 nm) may be indicative of the superposition of tetrahedral Sn species and the strong interaction with octahedral niobium species (formation of Nb-O-Sn bonds), indicating charge-transfer transitions between atoms [41].
The textural properties and the nitrogen adsorption- and desorption-isotherms are shown in Figure 5. According to IUPAC, they are type IV with H1 hysteresis loops, suggesting that cylindrical channels are well defined. Sn(PPT) and Nb(PPT) are detected in areas of 30 and 115.5 m2g−1, respectively. However, SnNb(PPT) showed a decrease in surface area (78.51 m2g−1) when compared to Nb(PPT), which can be attributed to the agglomeration of metallic cations during the synthesis process.
For SnNb(CTAB), there was an increase in surface area, which suggests that the presence of the template influences this parameter, as there is a reduction in the aggregation of metallic cations, since the hydrogen atoms of the hydroxyl groups (-OH groups) related to the metallic species can interact with the main cationic groups (C16H33)(CH3)3N+ (hydrophilic groups) of CTAB micelles, disfavoring the crystallization of individual cations. This same increasing effect is observed in the case of SnNb(GLY), and there are indications that the higher surface-area values of mixed oxides can be attributed to the strong interaction between species, which inhibits individual crystallization, reducing the number of clusters and the particle growth [42,43].
The thermal analyses of the materials were evaluated, and the presence of organic matter was not verified through the TG curves (Figure S1, Supplementary Materials). All oxides suffer a mass loss (between 0.8 and 12%) in just one step in the temperature range of 100 to 150 °C, corresponding to the release of physiosorbed water, suggesting that the materials exhibit thermal stability in the evaluated range.
The catalytic activity of materials such as oxides can be driven by the presence of acidic sites. Therefore, it is important to know the nature, quantity and strength of the acid sites present in their structures. Thus, the acid properties of the solids were studied by monitoring the pyridine adsorption using infrared spectroscopy, to assess the presence of Lewis and Brønsted acid-sites (Figure S2, Supplementary Information). The bands at 1445, 1540 and 1489 cm−1 were attributed to Lewis acid sites, Brønsted acids, and the overlapping of these sites, respectively [11]. For all SnO2 samples, weak vibrations were observed, corresponding to the presence of Lewis and/or Brønsted acid-sites.
For all Nb2O5 samples, signs similar to those found in the literature were observed, since this system consists mainly of NbO6 distorted octahedra and NbO4 tetrahedra, and the surface hydroxyl groups (-OH) function as Brønsted acid sites, while the tetrahedra function as Lewis acid sites [44,45]. From this perspective, structural variation in the oxides leads to changes in the nature of acidic sites and in their strength [46]. In addition, the use of Nb2O5 in aqueous reactions suggests a “water-tolerant solid-acid catalysts” system, and this type of system proves to be resistant to water, in contrast to the classic Lewis acids such as AlCl3, which suffer severe poisoning by water, undergoing deactivation due to the strong coordination of water in the metallic center (Lewis acids) or hydrolytic decomposition of the system [47]. In this work, Nb2O5 showed intense absorption-bands for Brønsted acid sites and weak and/or moderate bands for Lewis acid sites.
Some studies indicate that the properties of mixed oxides strongly depend on the preparation method employed, and it was observed in the present study that with the presence of niobium in the lattice, there was also an increase in the Lewis–Brønsted ratio (IA/IB), mainly for SnNb(CTAB) and SnNb(GLY), resulting in catalytic systems with high synergy and an improved balance in acid strength (Figure 6). It should be noted that SnNb(PPT) did not have such a sharp increase in (AL/AB) as was observed in the others, clearly showing the influence of the synthesis method on its properties.
To evaluate the resistance and stability of the acid sites, pyridine was used, and infrared spectra were acquired at 100, 200 and 300 °C. When pyridine is chemically absorbed at Lewis or Brønsted acid-sites, according to the temperature required to break such interactions, it can be considered weak (below 200 °C), moderate (between 200 and 300 °C) or strong (above 300 °C). For SnO2, weak vibrations related to Lewis and/or Brønsted acid-sites were observed. For Nb2O5, strong vibrations were observed for the Brønsted acid sites, and weak and/or moderate interactions were also detected for the Lewis acid sites. On the other hand, for the mixed oxides, a better-resolved profile of the spectra was observed, with more prominent signals related to the Lewis acids, and Brønsted-related bands also detected, in addition to the overlap of both species (Figure S2, Supplementary Information). This can be better observed by examining the AL/AB results, where the significant increase is notorious for all temperatures (Figure 6). The modulation of these characteristics in mixed oxides is essential to make this system more versatile for application in various biorefinery platforms [38].
In this context, it is evident that the synthesis of SnNb was fundamental for a balance between the Lewis and Brønsted acid-sites, which allows these systems to become more versatile for application in different biorefinery platforms. In previous studies, it was found that the number, nature and relative strength of acid sites in some materials can be adjusted using different synthetic strategies, including the use of templates and different calcination temperatures [22].
SEM micrographs of the materials are shown in Figure 7, and the images for SnNb(CTAB) and SnNb(GLY) showed great similarity, indicating the formation of materials with morphological disorder due to the greater interaction among the species during synthesis, resulting in the formation of smaller particles. Similar behavior was observed in the synthesis of porous, spherical materials from different oxides (Ce, Fe and Mn), since the functionality of the reagent species played an important role in the structure, and using glycerol instead of ethylene glycol resulted in smaller channels [48].

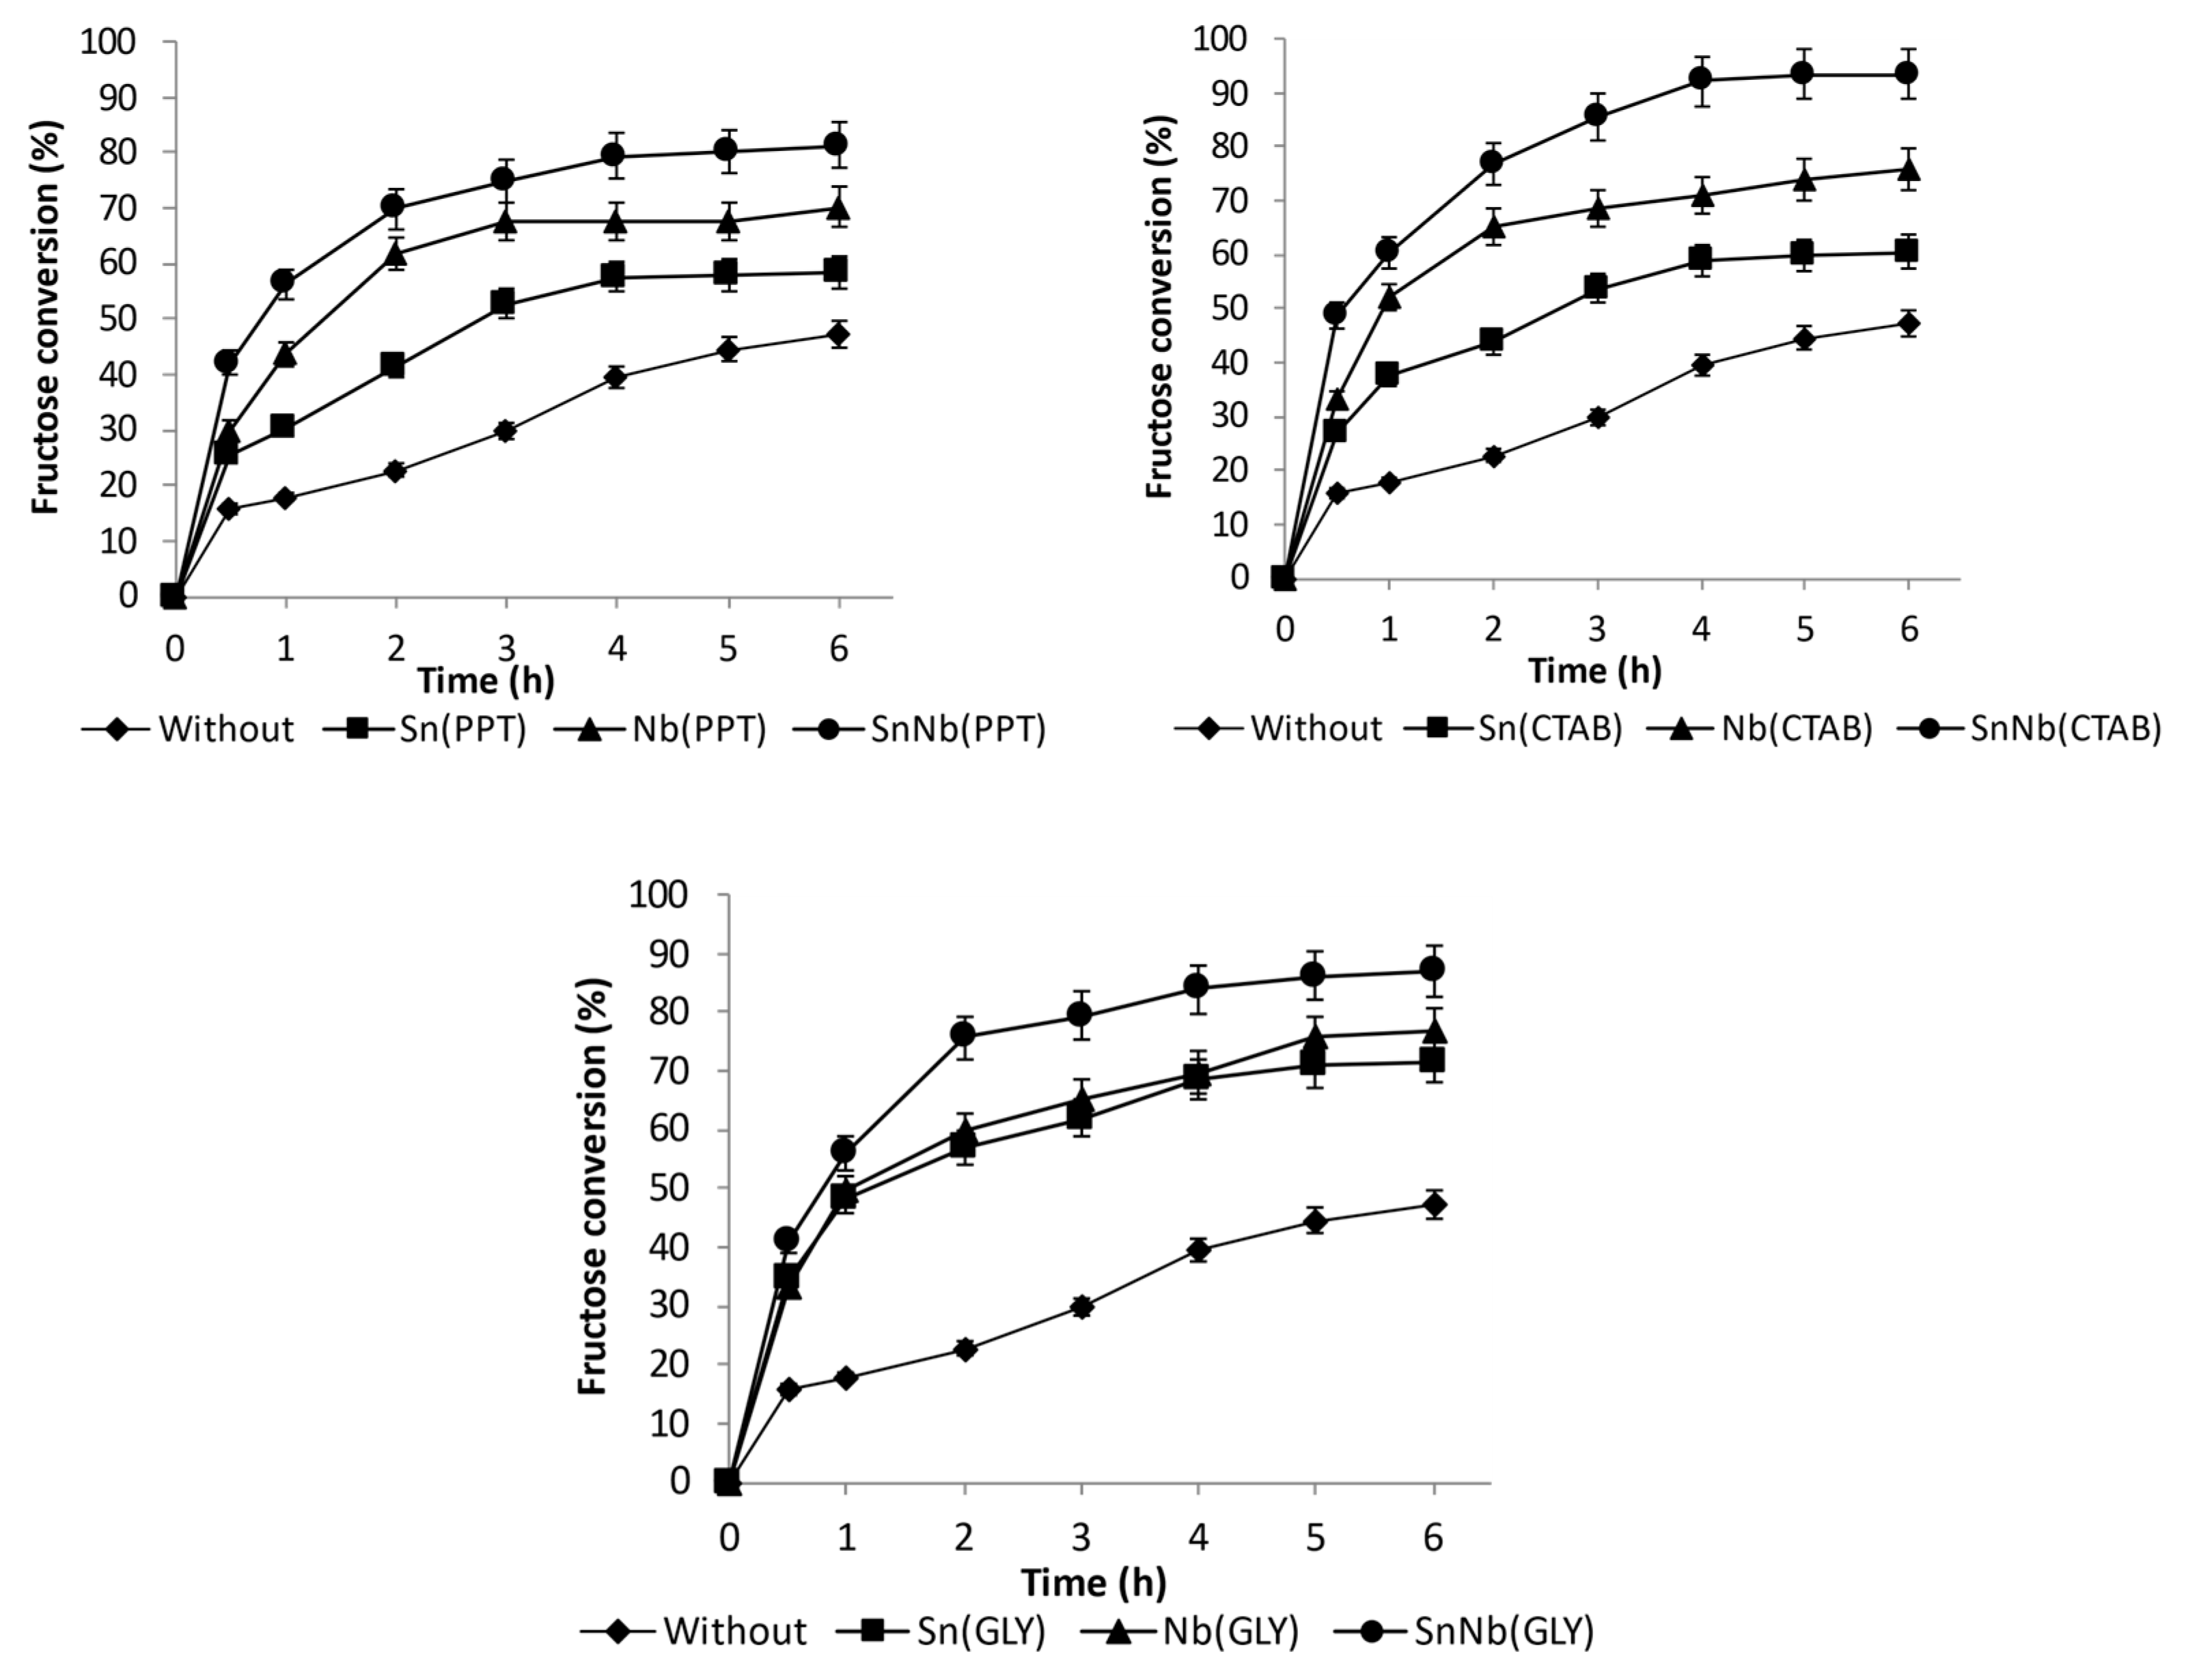
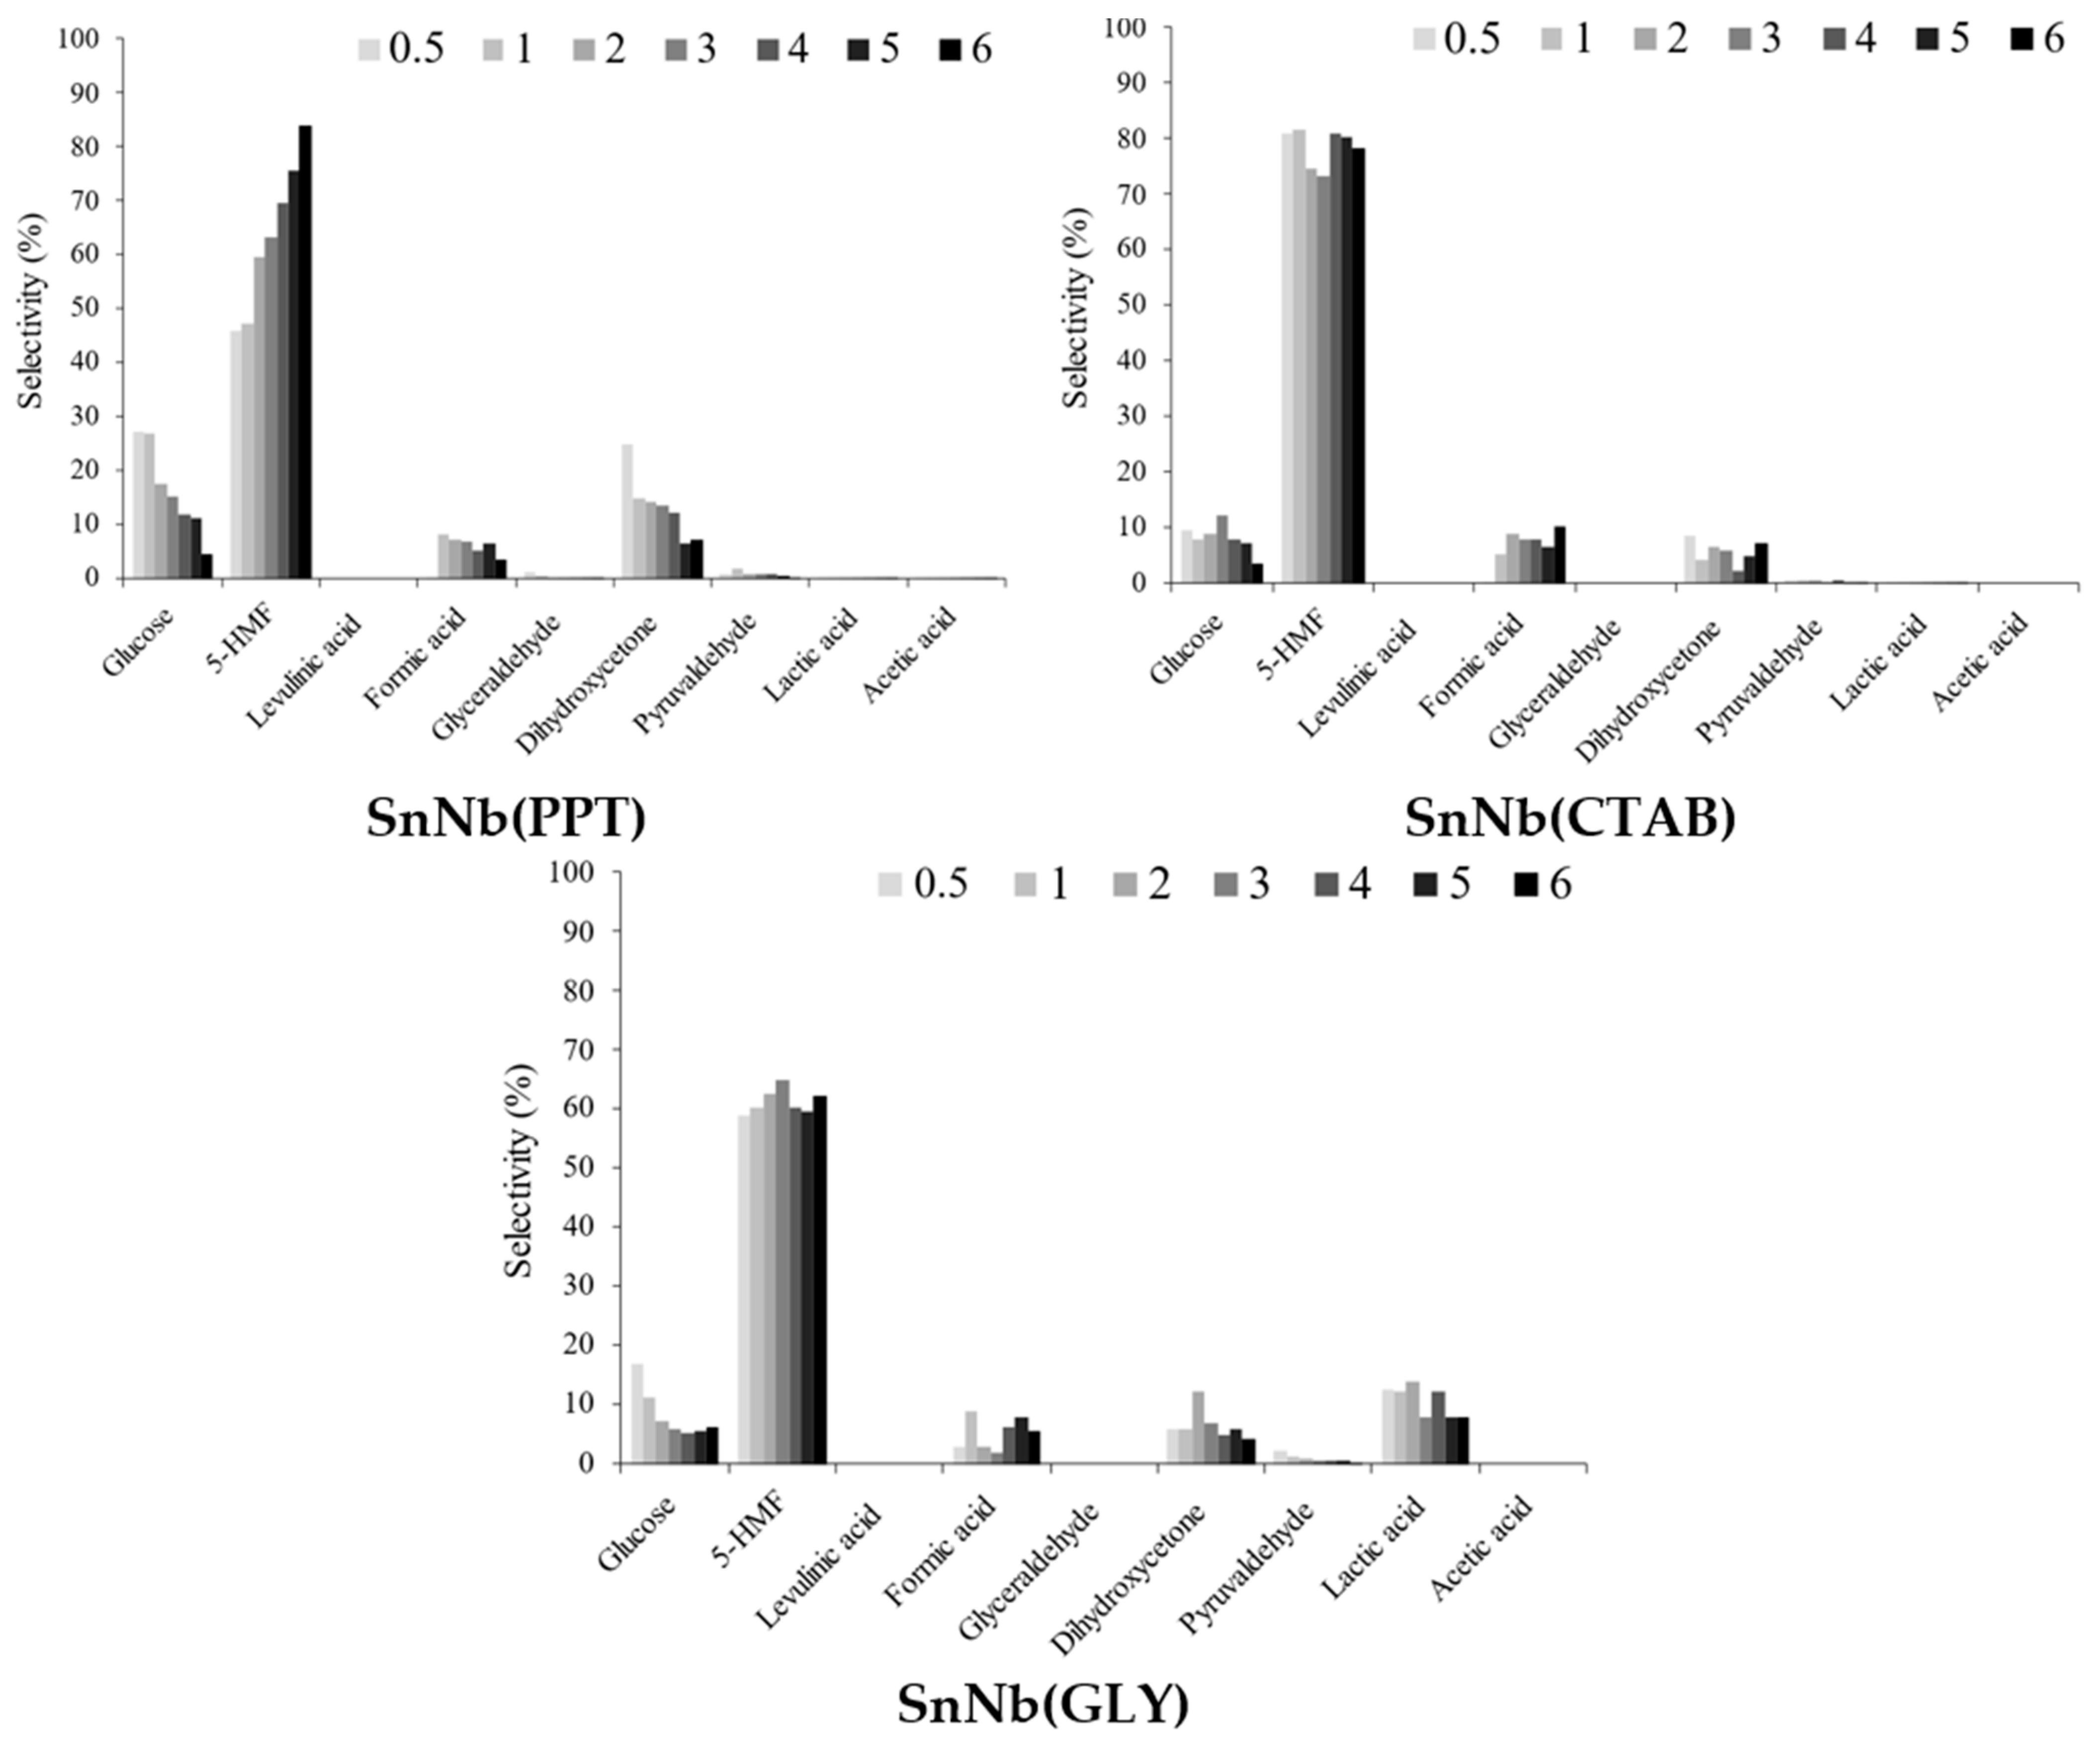
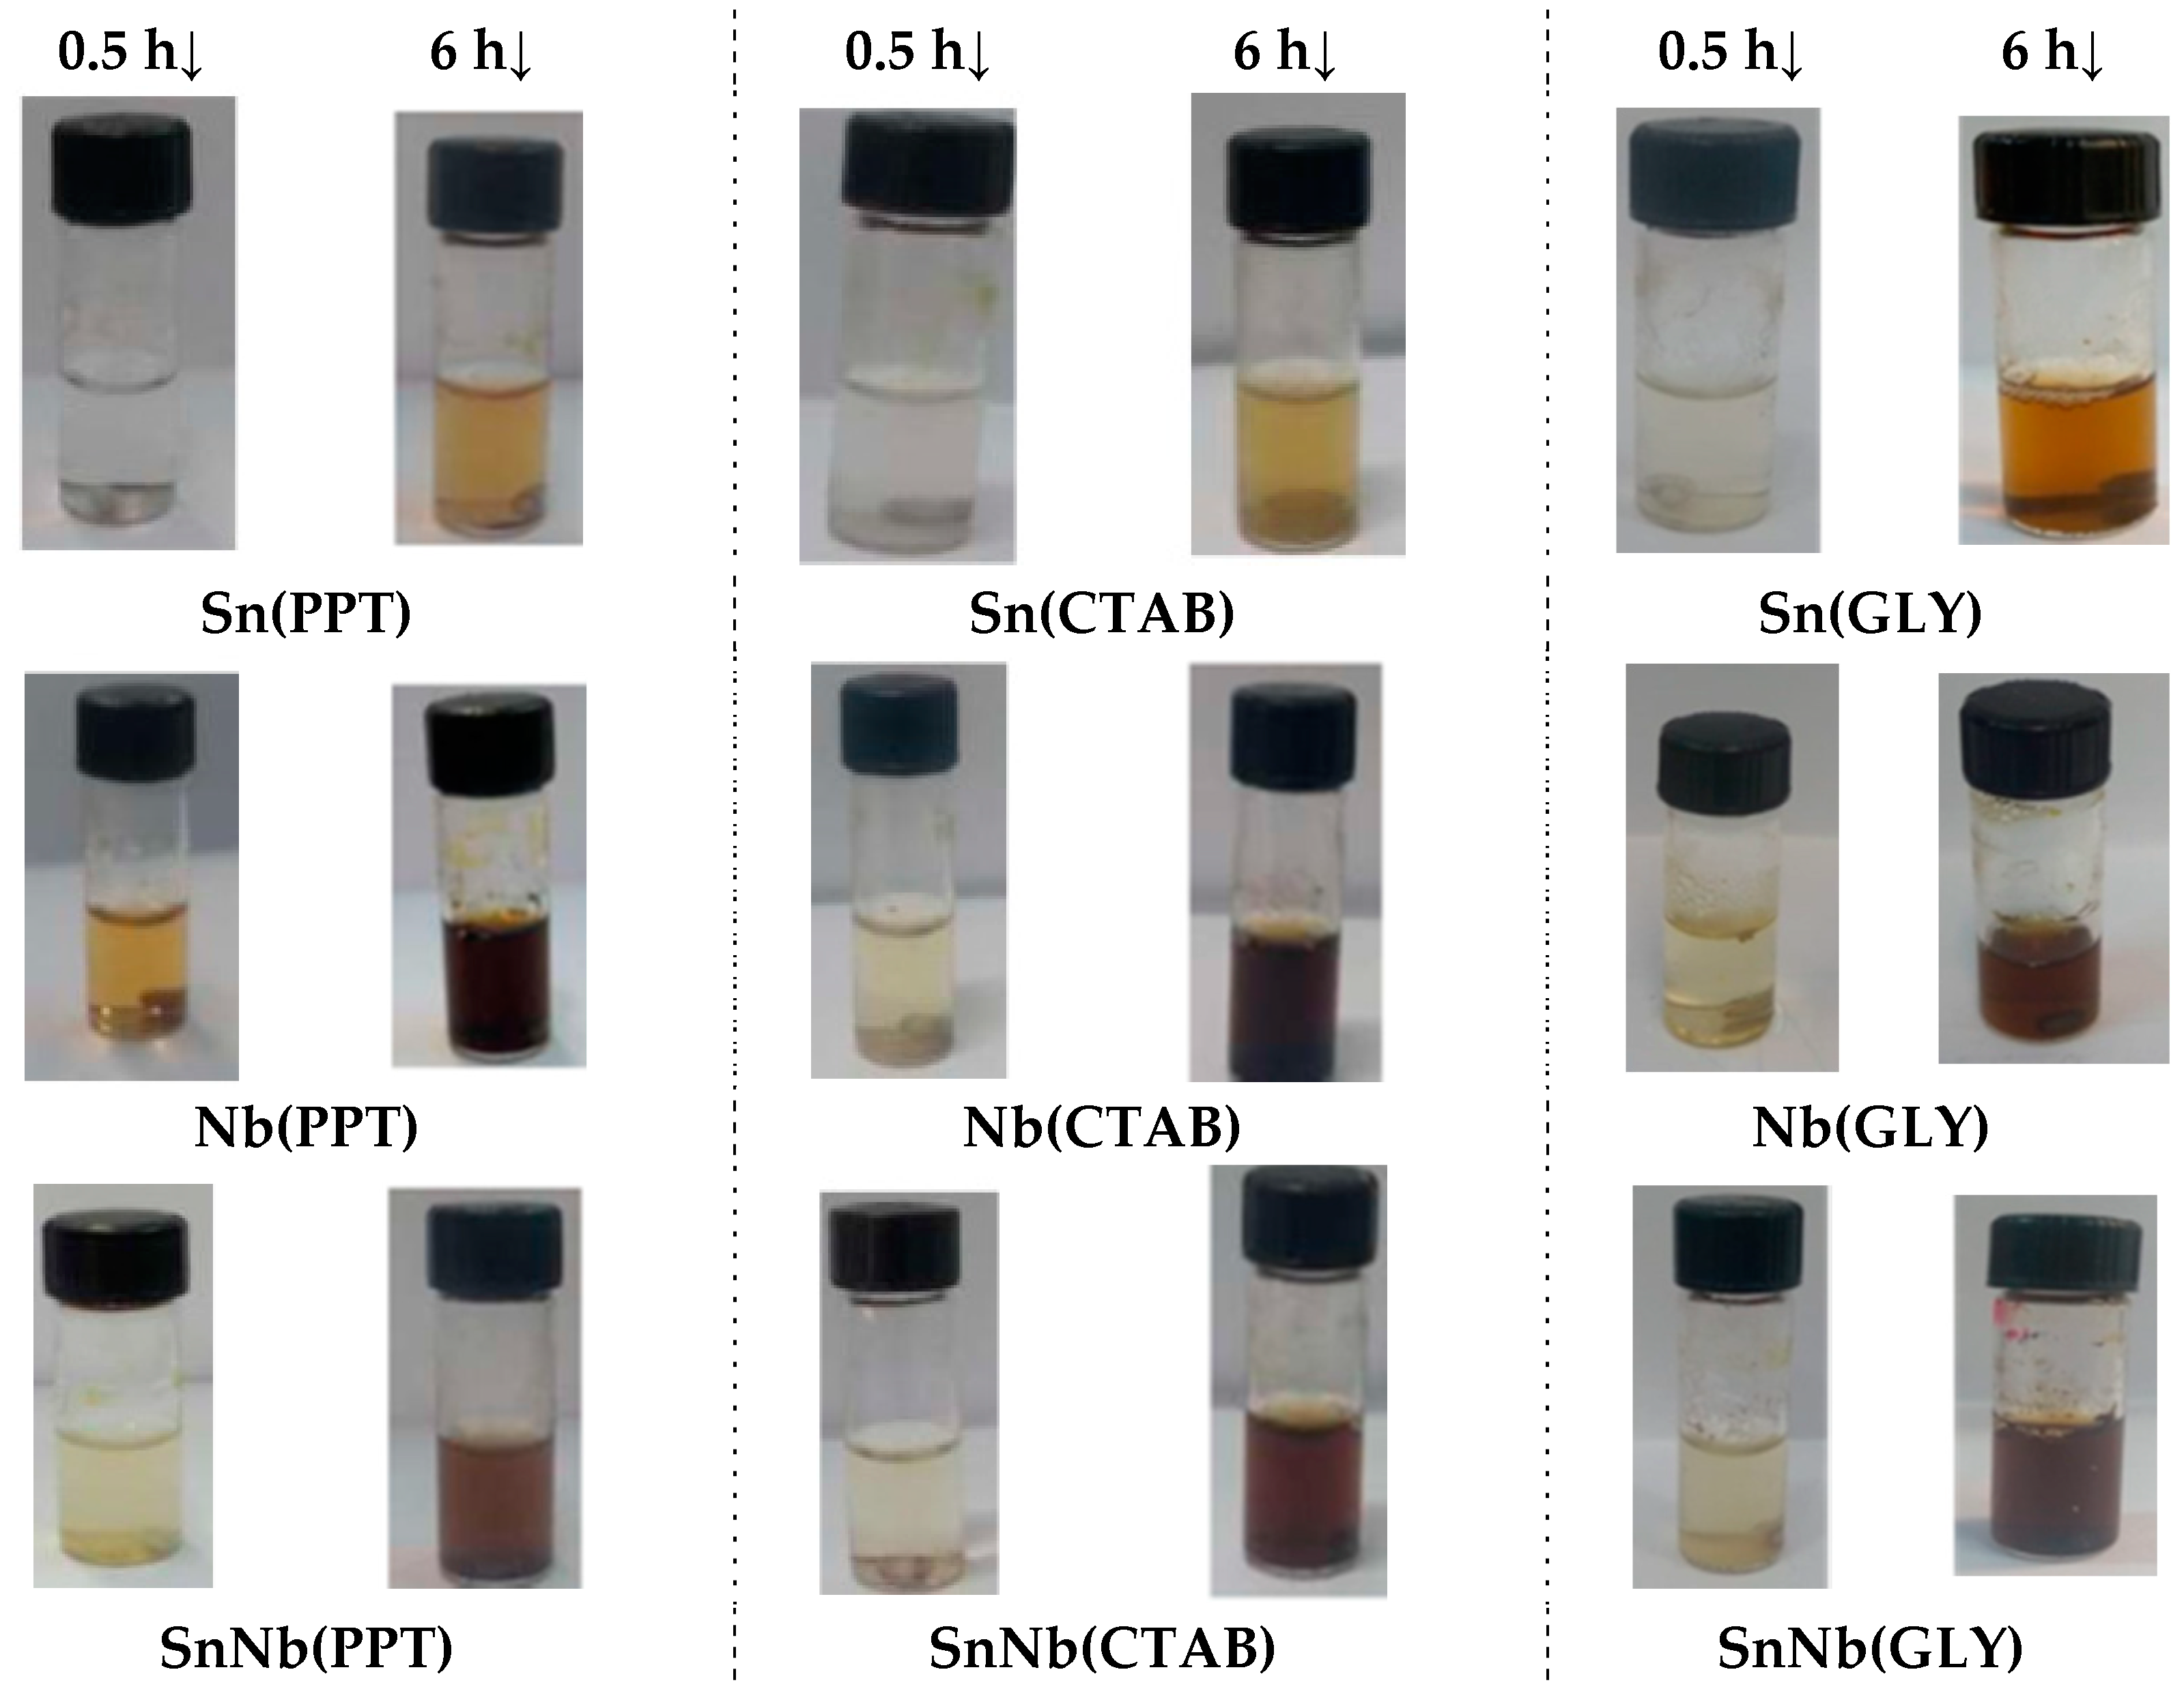
2.2. Catalytic Assays in Fructose Transformation

The series of oxides based on tin and niobium obtained by various synthesis methods were investigated as catalysts in the conversion of fructose in an aqueous medium, at 150 °C (see Figure 8 and Figure S6, Supplementary Information). Using the mixed oxides, significantly higher values of fructose conversion were achieved than those observed for the pure oxides. For example, the conversion was 75.7, 76.9 and 69.8% in 2 h of reaction when using SnNb (G), SnNb (CTAB) and SnNb (PPT), respectively, and this tendency was maintained during the investigated reaction time.
The co-precipitation method, often referred to as analogous to the sol-gel process, is an efficient chemical route for obtaining metal oxides, and has the advantages of obtaining high yields and purity, being easily reproducible and having a low cost [49,50]. The method that uses surfactant is known to provide a greater interaction between the reagents, minimizing possible diffusion-restrictions during the synthesis. In this case, the presence of the template directly influences the modulation of the specific surface area and pore size, as there is a reduction in the aggregation of metallic cations, due to their interaction with the cationic groups, for example with CTAB, disfavoring the individual crystallization of the cations [22,42,43]. The methodology developed by Pechini, in which the metal cations are chelated and, with the help of polyalcohol, are cross-linked to create a gel through the esterification, allows for a wide distribution of metallic cations throughout the polymer structure, promoting an increase in the surface area and improving the distribution of metals in the polymeric network, and being quite suitable for the manufacture of highly pure oxides [15,51].
Among all systems, the SnNb(CTAB) and SnNb(GLY) systems provided the highest fructose conversions, and in addition to containing the highest numbers of acidic sites, they have the highest surface areas, of 173.2 and 166.6 m2g−1, respectively. SnNb(PPT) has practically half of the surface area of these materials (78.51 m2g−1). The larger surface area promotes better contact between substrate and catalyst, and, as already mentioned, when using template (CTAB) or the Pechini method a greater interaction between species occurs during synthesis, providing greater homogeneity of the material. As evidence of this, using these two methods it was possible to achieve a higher niobium content in the materials (15.8% in SnNb(CTAB), 16.9% in SnNb(GLY), and only 11.6% in SnNb(PPT)). In addition, it is important to note that the results obtained using Raman spectroscopy and DRS analysis for the mixed oxides suggest the occurrence of a structural distortion, which can cause the appearance of oxygen vacancies during synthesis, resulting in defects which constitute active sites for fructose conversion. [17].
The soluble products formed during the transformation of fructose included glucose, 5-HMF (5-hydroxymethylfufural), levulinic acid, formic acid, glyceraldehyde, dihydroxyacetone, pyruvaldehyde, lactic acid and acetic acid. The selectivity profiles are shown in Figure 9 for mixed oxides (for pure oxides, in Figure S7, Supplementary Information), and all systems exhibit great selectivity for 5-HMF and, to a lesser extent, for products of the retro-aldolic pathway (lactic acid and its intermediates glyceraldehyde, dihydroxyacetone and pyruvaldehyde). In general, a trend toward a decrease in selectivity to 5-HMF (5-hydroxymethylfurfural) is observed with an increase in AL/AB (Figure 6), confirming that the Brønsted acid sites present in the material are mainly responsible for the dehydration of fructose. The Lewis acid sites play a fundamental role in the isomerization of glucose into fructose and in the retro-aldolic pathway.
During these reactions, some insoluble or partially soluble products may be formed, causing turbidity and brown coloration in the samples. Such materials, known as humines, are formed mainly by the polymerization of fructose or the decomposition of 5-HMF (5-hydroxymethylfufural), due to high temperatures, long reaction-times or the nature of the catalyst [52,53]. Regardless of the synthesis method, the qualitative analysis of the reactional samples (Figure 10) allows us to infer that using niobium oxides considerably increases the coloring and turbidity, while using tin oxides produces the smallest change in these properties. By using mixed oxides, the formation of low-solubility products was significantly reduced, in comparison to the use of pure niobium-oxides. Therefore, the structural and textural changes and the number of acid sites observed in mixed oxides resulted in better conversions, maintaining the advantage of reduced humine-formation.
The possibility of recovery and reuse of the catalyst is of great importance in the processes of biorefineries, and in previous studies the chemical stability of some of these mixed oxides was evidenced, as the catalyst can be recovered and reused for four cycles, and no leaching of species for the reaction medium was observed [24,54].
Finally, a comparison with studies involving bifunctional catalysts applied in fructose conversion in aqueous medium reported in the literature, allows us to indicate that the systems discussed here have great potential, as conversions of 75.7, 76.9 and 69.8% were observed at 2 h of reaction when using SnNb (G), SnNb (CTAB) and SnNb (PPT), respectively. In addition, it is important to highlight the fact that all systems exhibit high selectivity for 5-HMF and, to a lesser extent, for products from the retro-aldol pathway. To exemplify, studies using mixed oxides of cerium and niobium (25, 50 and 75% of Nb2O5) obtained using the coprecipitation method, led to fructose conversions lower than 75%, and the maximum selectivity for 5-HMF was around 45%. The reuse of the 25% CeO2/75% Nb2O5 catalyst showed a reduction in the catalytic activity after the first reaction [55]. In the same way, the use of mixed tin-oxides containing different proportions of molybdenum (SnMoX, X = 5, 25, 50 and 75%), taken by the precipitation method, were evaluated in the conversion of fructose compared to pure oxides. Regarding the mixed oxides, using SnMo25 at 150 °C a conversion of 73.2% was observed. However, a change in selectivity was observed as the Mo content in the materials increased. Thus, the SnMo5 system showed high selectivity for 5-HMF (~75%), while for SnMo25 the selectivity for this product was very low (approximately 20%), with a preferential tendency for products from the retro-aldol pathway. In terms of stability, SnMo25 was used in six cycles, and no significant decrease in yield, selectivity or substantial leaching were detected [13].

3. Materials and Methods

3.1. Materials

Tin(IV) chloride (99.995% trace-metals basis, Sigma–Aldrich, St. Louis, MI, USA)), niobium(V) chloride (>99.995%, Sigma–Aldrich), citric acid (>99.0%, Sigma–Aldrich), ammonium hydroxide (Sigma–Aldrich), nitric acid (>65.0%, Sigma–Aldrich), glycerol (>99.0%, Sigma–Aldrich), ethylene glycol (>99.0%, Sigma–Aldrich), cetyltrimethylammonium bromide (CTAB) (>99.0%, Sigma–Aldrich) and fructose (>99.0%, Sigma–Aldrich) were obtained commercially, and used as received. Sulfuric acid (>95%) was purchased from Dynamics.

3.2. Preparation of Catalysts Using the Coprecipitation Method

Pure and mixed catalysts were obtained using aqueous solutions of tin chloride (IV) and/or niobium chloride (V) (SnCl4 and/or NbCl5) at a concentration of 0.1 mol/L, and coprecipitation was achieved by the slow addition of ammonium hydroxide. Soon after, the precipitated material was left to rest for 4 h and then vacuum filtered, washed with deionized water, and dried at 115 °C for 8 h. The material obtained was sieved with a 100-mesh granulometry sieve, and then macerated for further analysis. Finally, the solids were calcined at 500 °C, for 4 h.

3.3. Preparation of Catalysts Using the CTAB-Surfactant-Template Method

Initially, 9 g of the surfactant cetyltrimethylammonium bromide (CTAB) was dissolved in 75 mL of deionized water under constant stirring, to ensure the homogeneity of the system. Then, 12 mL of NH4OH (25% wt.) dissolved in 48 mL of distilled water was added under stirring. The metal precursors (tin chloride (IV) and/or niobium chloride (V)) were dissolved in 150 mL of deionized water and added dropwise to this first solution under constant stirring, until a white paste was formed. This suspension was maintained under stirring for 3 h, followed by aging at 25 °C for 48 h. The obtained product was filtered, washed, dried, macerated and calcined at 500 °C, for 4 h.

3.4. Preparation of Catalysts Using the Modified Pechini Method

Initially, solutions of tin chloride (IV) and/or niobium chloride (V) (SnCl4 and/or NbCl5) and citric acid, with concentrations of 0.479, 0.462 and 1.66 mol/L were prepared using a mass ratio of 3:1 (citric acid: metal). Then, this material was stirred and heated to 70 °C. Upon reaching the desired temperature, the material was removed from the system and immersed in an ice bath, to promote the onset of precipitation. Subsequently, the solution was returned to the stirring system, and ammonium hydroxide was gradually added for 4 h, until complete precipitation. Then, the citrate was filtered, washed, and dried at 120 °C. The formed citrates were dissolved in distilled water and nitric acid. Then, glycerol was added in a molar proportion of 60:40, in relation to the amount of citric acid. The solution was heated to 70 °C under stirring to promote the polymerization reaction. After the elimination of nitrous oxides and water, the resin was obtained, and finally, the solid was crushed and heated at 350 °C for 3 h to eliminate the polymeric matrix, and calcinated at 500 °C for 4 h.

3.5. Characterization of the Catalysts

All materials were macerated in a mortar and sieved (100 mesh), and the description of the catalysts and the codes used for their identification are shown in Table 1.
For catalyst characterization, X-ray-diffraction (XRD) measurements were performed using a Shimadzu diffractometer, model XRD-6000, and a Cu Kα radiation (1.5418 Å) source with a nickel filter to obtain wide-angle diffraction patterns in the 2θ = 3–40° range. Crystallite size (nm) was calculated using the Debye–Scherrer equation. Nitrogen-adsorption measurements were performed at 77.15 K, using a gas-adsorption analyzer (Micromeritics, model ASAP-2020). The textural properties were estimated from N2 adsorption isotherms, using the Brunauer–Emmett–Teller (BET) equation and Barrett–Joyner–Halenda (BJH) method. Before the analysis, all the samples were pretreated under vacuum at 423.15 K for 24 h. Thermogravimetric (TG/DTG) analyses were performed using a Shimadzu analyzer, model DTG-60H, with an N2 flow-rate of 40 mL·min1 in the temperature range of 30–800 °C at a heating rate of 10 °C·min1. Fourier-transform-infrared (FTIR) spectra were obtained with a Shimadzu IR Prestige 21 infrared spectrophotometer, using tablets of potassium bromide (KBr). Eighty scans were performed in transmittance mode in the spectral range of 4000–400 cm1 at a resolution of 4.0 cm1. Raman spectroscopy was performed at ~30 °C, using a 532 nm laser, 10 mW power, 100× objective, and 16 data acquisitions in 120 s with respect to silica on HORIBA scientific equipment, model XploRA. The UV–Vis-DRS spectra were obtained on a Shimadzu model UV-2600 at a resolution of 8 cm1. Scanning-electron-microscopy analyses were performed on a Shimadzu instrument, model SSX-550 Superscan, with a tungsten filament. Initially, the samples were metallized in a Sanyu Electron instrument, quick coater SC-701, for 8 min with a 10 mA gold current target.

3.6. Fructose Conversion

All experiments were performed in 4 mL closed reactors under magnetic stirring and heating, at several reaction times. The fructose solution (0.016 g of fructose in 2 mL of deionized water) and 1.5 × 10⁻³ g of catalysts were used. Conversion, yield, and selectivity were calculated from the results of quantification using HPLC. For this, the reaction product was filtered using 0.45 μm porosity membrane-filters (MilliporeTM), and then injected into a chromatograph (HPLC) with refractive-index (IR) detection. The analyses were performed on a SHIMADZU (Japan) model CTO-20A liquid chromatograph with an isocratic pump, RID-10A refractive index detector and manual injection system, with a sampling handle of 20 μL. The chromatographic column Varian MetaCarb H Plus 300 × 7.8 mm and precolumn Varian MetaCarb H Plus were obtained from Varian (Palo Alto, CA, USA), operating with a column temperature of 55 °C, and the eluent was a sulfuric acid solution (0.005 mol·L−1) with a flow of 0.70 mL·min−1. For the quantification of the reaction products, calibration curves of standard solutions were prepared. The chromatograms obtained were treated using LabSolutions software (Shimadzu Corporation 2010, Kyoto, Japan). The fructose conversion and the yield and selectivity of each product formed were calculated as presented in the Supplementary Information. For reuse studies, the catalyst was removed from the reaction medium by centrifugation, and calcined at 550 °C for 4 h.

4. Conclusions

Using the catalysts presented in this study, it was possible to efficiently convert fructose in an aqueous medium, and the factors that influenced the transformation were the textural and structural properties, as well as the number of acid sites. The materials that presented the best conversions were the mixed oxides, with a prominence of SnNb(CTAB) and SnNb(GLY), showing the importance of the modulation of properties using the synthesis method. All systems were selective mainly for 5-HMF (5-hydroxymethylfurfural) and, to a lesser extent, for the products of the retro-aldolic route, and this selectivity was preserved, regardless of the catalytic system used. The reuse test for SnNb(GLY), which showed stability for four cycles with no significant reduction in terms of conversion, suggested that the hydrophobic characteristics of the rutile structure of SnO2 in contrast to Nb2O5 resulted in water-tolerant acid sites.

Supplementary Materials

The following supporting information can be downloaded at: https://www.mdpi.com/article/10.3390/catal13020285/s1: Information concerning fructose conversion, yield and selectivity of each product formed, Figure S1: Thermal profiles (TG) of the catalysts: (a) Sn(PPT), Sn(CTAB) and Sn(GLY); (b) Nb(PPT), Nb(CTAB) and Nb(GLY); and (c) SnNb(PPT), SnNb(CTAB) and SnNb(GLY); Figure S2: FTIR spectra using pyridine as probe molecule: (a) Sn(PPT), Sn(CTAB) and Sn(GLY); (b) Nb(PPT), Nb(CTAB) and Nb(GLY); and (c) SnNb(PPT), SnNb(CTAB) and SnNb(GLY); Figure S3. Scanning electron microscopy (SEM) images of the catalysts Sn(PPT), Sn(CTAB) and Sn(GLY).; Figure S4. Scanning electron microscopy (SEM) images of the catalysts Nb(PPT), Nb(CTAB) and Nb(GLY).; Figure S5. Scanning electron microscopy (SEM) images of the catalysts SnNb(PPT), SnNb(CTAB) and SnNb(GLY).; Figure S6. Fructose conversion at 150 °C using (a) Sn(PPT), Sn(CTAB) and Sn(GLY), (b) Nb(PPT), Nb(CTAB) and Nb(GLY) and (c) Nb(GLY) SnNb(PPT) SnNb(CTAB) and SnNb(GLY).; Figure S7. Selectivity for soluble products identified in the fructose conversion at 150 °C using 1.5 × 10⁻³ g of catalyst (a) Sn(PPT) and Nb(PPT); (b) Sn(CTAB) and Nb(CTAB); (c) Sn(GLY) and Nb(GLY).; Table S1: Yield (%) for soluble products identified in the fructose conversion at 150 °C in absence of catalyst or using 1.5 × 10⁻³ g of catalyst (a) Sn(PPT) and Nb(PPT); (b) Sn(CTAB) and Nb(CTAB); (c) Sn(GLY) and Nb(GLY).

Author Contributions

Conceptualization, T.V.d.S.M., D.B.d.A.P., S.M.P.M. and M.R.M.; methodology, T.V.d.S.M., D.B.d.A.P., S.M.P.M. and M.R.M..; investigation, T.V.d.S.M., D.B.d.A.P., S.M.P.M. and M.R.M.; resources, S.M.P.M. and M.R.M.; writing—original draft preparation, T.V.d.S.M., D.B.d.A.P., S.M.P.M. and M.R.M.; writing—review and editing, T.V.d.S.M., D.B.d.A.P., S.M.P.M. and M.R.M.; visualization, T.V.d.S.M., D.B.d.A.P., S.M.P.M. and M.R.M.; supervision, S.M.P.M. and M.R.M.; project administration, S.M.P.M. and M.R.M.; funding acquisition, S.M.P.M. and M.R.M. All authors have read and agreed to the published version of the manuscript.

Funding

This research was supported by the National Council for Scientific and Technological Development (CNPq), the Brazilian Federal Agency for the Improvement of Higher Education (CAPES), the Brazilian Innovation Agency (FINEP), and the Alagoas Research Foundation (FAPEAL). T.V.d.S.M. and D.B.d.A.P. express their appreciation for fellowships granted by CAPES and CNPq. S.M.P.M. and M.R.M. thank CNPq for research fellowships.

Data Availability Statement

Not applicable.

Acknowledgments

The authors also thank the LSCAT/CTEC/UFAL, TecNano/ICF/UFAL, and GON/IF/UFAL teams for their contributions.

Conflicts of Interest

The authors declare no conflict of interest.

References

  1. Binder, J.B.; Raines, R.T. Simple Chemical Transformation of Lignocellulosic Biomass into Furans for Fuels and Chemicals. J. Am. Chem. Soc. 2009, 131, 1979–1985. [Google Scholar] [CrossRef] [PubMed]
  2. Wang, W.; Gu, Y.; Zhou, C.; Hu, C. Current Challenges and Perspectives for the Catalytic Pyrolysis of Lignocellulosic Biomass to High-Value Products. Catalysts 2022, 12, 1524. [Google Scholar] [CrossRef]
  3. Corma, A.; Iborra, S.; Velty, A. Chemical Routes for the Transformation of Biomass into Chemicals. Chem. Rev. 2007, 107, 2411–2502. [Google Scholar] [CrossRef]
  4. Wu, X.; Fu, J.; Lu, X. Hydrothermal Decomposition of Glucose and Fructose with Inorganic and Organic Potassium Salts. Bioresour. Technol. 2012, 119, 48–54. [Google Scholar] [CrossRef] [PubMed]
  5. Qu, Y.; Huang, C.; Zhang, J.; Chen, B. Efficient Dehydration of Fructose to 5-Hydroxymethylfurfural Catalyzed by a Recyclable Sulfonated Organic Heteropolyacid Salt. Bioresour. Technol. 2012, 106, 170–172. [Google Scholar] [CrossRef]
  6. Lee, Y.-Y.; Wu, K.C.-W. Conversion and Kinetics Study of Fructose-to-5-Hydroxymethylfurfural (HMF) Using Sulfonic and Ionic Liquid Groups Bi-Functionalized Mesoporous Silica Nanoparticles as Recyclable Solid Catalysts in DMSO Systems. Phys. Chem. Chem. Phys. 2012, 14, 13914–13917. [Google Scholar] [CrossRef]
  7. Mascal, M.; Nikitin, E.B. High-Yield Conversion of Plant Biomass into the Key Value-Added Feedstocks 5-(Hydroxymethyl)Furfural, Levulinic Acid, and Levulinic Esters Via5-(Chloromethyl)Furfural. Green Chem. 2010, 12, 370–373. [Google Scholar] [CrossRef]
  8. Upare, P.P.; Yoon, J.-W.; Kim, M.Y.; Kang, H.-Y.; Hwang, D.W.; Hwang, Y.K.; Kung, H.H.; Chang, J.-S. Chemical Conversion of Biomass-Derived Hexose Sugars to Levulinic Acid over Sulfonic Acid-Functionalized Graphene Oxide Catalysts. Green Chem. 2013, 15, 2935. [Google Scholar] [CrossRef]
  9. Zaera, F. Nanostructured Materials for Applications in Heterogeneous Catalysis. Chem. Soc. Rev. 2013, 42, 2746–2762. [Google Scholar] [CrossRef]
  10. Armor, J.N. A History of Industrial Catalysis. Catalysts 2011, 163, 3–9. [Google Scholar] [CrossRef]
  11. Fernandes Barbosa, F.; Pinheiro Braga, T. Catalytic Conversion of Glycerol to Acetol and Acrolein Using Metal Oxides: Surface Reactions, Prospects and Challenges. ChemCatChem 2022, 15, e202200950. [Google Scholar] [CrossRef]
  12. dos Santos, T.V.; da Silva Avelino, D.O.; Meneghetti, M.R.; Meneghetti, S.M.P. Mixed Oxides Based on SnO2 Impregnated with MoO3: A Robust System to Apply in Fructose Conversion. Catal. Commun. 2018, 114, 120–123. [Google Scholar] [CrossRef]
  13. dos Santos, T.V.; dos Santos Brainer, N.; de Amorin Pryston, D.B.; da Silva Avelino, D.O.; Dornelas, C.B.; Meneghetti, M.R.; Meneghetti, S.M.P. Study of Neat and Mixed Sn(IV) and Mo(VI) Oxides for Transesterification and Esterification: Influence of the Substrate on Leaching. Catal. Lett. 2019, 149, 3132–3137. [Google Scholar] [CrossRef]
  14. Bayu, A.; Abudula, A.; Guan, G. Reaction Pathways and Selectivity in Chemo-Catalytic Conversion of Biomass-Derived Carbohydrates to High-Value Chemicals: A Review. FPT 2019, 196, 106162. [Google Scholar] [CrossRef]
  15. Grigorev, M.E.; Mikhailov, S.P.; Bykov, A.V.; Tiamina, I.Y.; Nikoshvili, L.Z.; Sulman, M.G.; Vasiliev, A.L.; Sidorov, A.I.; dos Santos, T.V.; Meneghetti, M.R.; et al. Surface Interactions with the Metal Oxide Surface Control Ru Nanoparticle Formation and Catalytic Performance. Colloids Surf. A Physicochem. Eng. Asp. 2021, 610, 125722. [Google Scholar] [CrossRef]
  16. Almerindo, G.I.; Probst, L.F.D.; Campos, C.E.M.; de Almeida, R.M.; Meneghetti, S.M.P.; Meneghetti, M.R.; Clacens, J.-M.; Fajardo, H.V. Magnesium Oxide Prepared via Metal–Chitosan Complexation Method: Application as Catalyst for Transesterification of Soybean Oil and Catalyst Deactivation Studies. J. Power Sources 2011, 196, 8057–8063. [Google Scholar] [CrossRef] [Green Version]
  17. Yu, Z.; Lu, X.; Liu, C.; Han, Y.; Ji, N. Synthesis of γ-Valerolactone from Different Biomass-Derived Feedstocks: Recent Advances on Reaction Mechanisms and Catalytic Systems. Renew. Sustain. Energy Rev. 2019, 112, 140–157. [Google Scholar] [CrossRef]
  18. Yang, F.; Tang, J.; Ou, R.; Guo, Z.; Gao, S.; Wang, Y.; Wang, X.; Chen, L.; Yuan, A. Fully Catalytic Upgrading Synthesis of 5-Ethoxymethylfurfural from Biomass-Derived 5-Hydroxymethylfurfural over Recyclable Layered-Niobium-Molybdate Solid Acid. Appl. Catal. B Environ. 2019, 256, 117786. [Google Scholar] [CrossRef]
  19. Kreissl, H.T.; Nakagawa, K.; Peng, Y.-K.; Koito, Y.; Zheng, J.; Tsang, S.C.E. Niobium Oxides: Correlation of Acidity with Structure and Catalytic Performance in Sucrose Conversion to 5-Hydroxymethylfurfural. J. Catal. 2016, 338, 329–339. [Google Scholar] [CrossRef]
  20. Xia, M.; Shen, Z.; Xiao, S.; Peng, B.; Gu, M.; Dong, W.; Zhang, Y. Synergistic Effects and Kinetic Evidence of a Transition Metal-Tin Modified Beta Zeolite on Conversion of Miscanthus to Lactic Acid. Appl. Catal. A-Gen 2019, 583, 117126. [Google Scholar] [CrossRef]
  21. Popova, M.; Shestakova, P.; Lazarova, H.; Dimitrov, M.; Kovacheva, D.; Szegedi, A.; Mali, G.; Dasireddy, V.; Likozar, B.; Wilde, N.; et al. Efficient Solid Acid Catalysts Based on Sulfated Tin Oxides for Liquid Phase Esterification of Levulinic Acid with Ethanol. Appl. Catal. A-Gen. 2018, 560, 119–131. [Google Scholar] [CrossRef]
  22. Manjunathan, P.; Marakatti, V.S.; Chandra, P.; Kulal, A.B.; Umbarkar, S.B.; Ravishankar, R.; Shanbhag, G.V. Mesoporous Tin Oxide: An Efficient Catalyst with Versatile Applications in Acid and Oxidation Catalysis. Catal. Today 2018, 309, 61–76. [Google Scholar] [CrossRef]
  23. Wei, W.; Yang, H.; Wu, S. Efficient Conversion of Carbohydrates into Levulinic Acid over Chromium Modified Niobium Phosphate Catalyst. Fuel 2019, 256, 115940. [Google Scholar] [CrossRef]
  24. dos Santos, T.V.; Pryston, D.B.A.; Assis, G.C.; Meneghetti, M.R.; Meneghetti, S.M.P. Tin, Niobium and Tin-Niobium Oxides Obtained by the Pechini Method Using Glycerol as a Polyol: Synthesis, Characterization and Use as a Catalyst in Fructose Conversion. Catal. Today 2021, 379, 62–69. [Google Scholar] [CrossRef]
  25. Kato, K.; Tamura, S. Die Kristallstruktur von T -Nb2O5. Acta Crystallogr. Sect. B Struct. Crystallogr. Cryst. Chem. 1975, 31, 673–677. [Google Scholar] [CrossRef]
  26. Quinelato, A.L.; Longo, E.; Leite, E.R.; Varela, J.A. Synthesis of Nanocrystalline Tetragonal Zirconia by a Polymeric Organometallic Method. Appl. Organomet. Chem. 1999, 13, 501–507. [Google Scholar] [CrossRef]
  27. Prado, A.G.S.; Bolzon, L.B.; Pedroso, C.P.; Moura, A.O.; Costa, L.L. Nb2O5 as Efficient and Recyclable Photocatalyst for Indigo Carmine Degradation. Appl. Catal. B Environ. 2008, 82, 219–224. [Google Scholar] [CrossRef]
  28. Sagadevan, S.; Podder, J. Investigation on Structural, Surface Morphological and Dielectric Properties of Zn-Doped SnO2 Nanoparticles. Mater. Res. 2016, 19, 420–425. [Google Scholar] [CrossRef]
  29. Elci, A.; Demirtas, O.; Ozturk, I.M.; Bek, A.; Nalbant Esenturk, E. Synthesis of Tin Oxide-Coated Gold Nanostars and Evaluation of Their Surface-Enhanced Raman Scattering Activities. J. Mater. Sci. 2018, 53, 16345–16356. [Google Scholar] [CrossRef]
  30. Castro, D.C.; Cavalcante, R.P.; Jorge, J.; Martines, M.A.U.; Oliveira, L.C.S.; Casagrande, G.A.; Machulek Jr., A. Synthesis and Characterization of Mesoporous Nb2O5 and Its Application for Photocatalytic Degradation of the Herbicide Methylviologen. J. Braz. Chem. Soc. 2015, 27, 303–313. [Google Scholar]
  31. da Conceição, L.R.V.; Carneiro, L.M.; Rivaldi, J.D.; de Castro, H.F. Solid Acid as Catalyst for Biodiesel Production via Simultaneous Esterification and Transesterification of Macaw Palm Oil. Ind. Crops Prod. 2016, 89, 416–424. [Google Scholar] [CrossRef]
  32. Azam, A.; Habib, S.; Salah, N.; Ahmed, F. Microwave-Assisted Synthesis of SnO2 Nanorods for Oxygen Gas Sensing at Room Temperature. IJN 2013, 8, 3875–3882. [Google Scholar] [CrossRef] [PubMed] [Green Version]
  33. Xu, G.; Zhang, Y.-W.; Sun, X.; Xu, C.-L.; Yan, C.-H. Synthesis, Structure, Texture, and CO Sensing Behavior of Nanocrystalline Tin Oxide Doped with Scandia. J. Phys. Chem. B 2005, 109, 3269–3278. [Google Scholar] [CrossRef]
  34. Mariammal, R.N.; Ramachandran, K.; Renganathan, B.; Sastikumar, D. On the Enhancement of Ethanol Sensing by CuO Modified SnO2 Nanoparticles Using Fiber-Optic Sensor. Sens. Actuators B Chem. 2012, 169, 199–207. [Google Scholar] [CrossRef]
  35. Varghese, B.; Haur, S.C.; Lim, C.-T. Nb2O5 Nanowires as Efficient Electron Field Emitters. J. Phys. Chem. C 2008, 112, 10008–10012. [Google Scholar] [CrossRef]
  36. Zhao, Y.; Zhou, X.; Ye, L.; Chi Edman Tsang, S. Nanostructured Nb2O5 Catalysts. Nanotechnol. Rev. 2012, 3, 17631. [Google Scholar]
  37. Yu, A.; Frech, R. Mesoporous Tin Oxides as Lithium Intercalation Anode Materials. J. Power Sources 2002, 104, 97–100. [Google Scholar] [CrossRef]
  38. Zuo, J.; Xu, C.; Liu, X.; Wang, C.; Wang, C.; Hu, Y.; Qian, Y. Study of the Raman spectrum of nanometer SnO2. J. Appl. Phys. 1994, 75, 1835–1836. [Google Scholar] [CrossRef]
  39. Soltan, W.B.; Lassoued, M.S.; Ammar, S.; Toupance, T. Vanadium Doped SnO2 Nanoparticles for Photocatalytic Degradation of Methylene Blue. J. Mater. Sci. Mater. Electron. 2017, 28, 15826–15834. [Google Scholar] [CrossRef]
  40. Morais, L.A.; Adán, C.; Araujo, A.S.; Guedes, A.P.M.A.; Marugán, J. Synthesis, Characterization, and Photonic Efficiency of Novel Photocatalytic Niobium Oxide Materials. Glob. Chall. 2017, 1, 1700066. [Google Scholar] [CrossRef] [PubMed]
  41. Scotti, N.; Ravasio, N.; Evangelisti, C.; Psaro, R.; Penso, M.; Niphadkar, P.; Bokade, V.; Guidotti, M. Epoxidation of Karanja (Millettia Pinnata) Oil Methyl Esters in the Presence of Hydrogen Peroxide over a Simple Niobium-Containing Catalyst. Catalysts 2019, 9, 344. [Google Scholar] [CrossRef] [Green Version]
  42. Lee, D.-U.; Jang, S.-R.; Vittal, R.; Lee, J.; Kim, K.-J. CTAB Facilitated Spherical Rutile TiO2 Particles and Their Advantage in a Dye-Sensitized Solar Cell. Sol. Energy 2008, 82, 1042–1048. [Google Scholar] [CrossRef]
  43. Casino, S.; Di Lupo, F.; Francia, C.; Tuel, A.; Bodoardo, S.; Gerbaldi, C. Surfactant-Assisted Sol Gel Preparation of High-Surface Area Mesoporous TiO2 Nanocrystalline Li-Ion Battery Anodes. J. Alloys Compd. 2014, 594, 114–121. [Google Scholar] [CrossRef]
  44. Nakajima, K.; Baba, Y.; Noma, R.; Kitano, M.; Kondo, J.N.; Hayashi, S.; Hara, M. Nb2O5·nH2O as a Heterogeneous Catalyst with Water-Tolerant Lewis Acid Sites. J. Am. Chem. Soc. 2011, 133, 4224–4227. [Google Scholar] [CrossRef]
  45. Nowak, I.; Ziolek, M. Niobium Compounds: Preparation, Characterization, and Application in Heterogeneous Catalysis. Chem. Rev. 1999, 99, 3603–3624. [Google Scholar] [CrossRef]
  46. Skrodczky, K.; Antunes, M.M.; Han, X.; Santangelo, S.; Scholz, G.; Valente, A.A.; Pinna, N.; Russo, P.A. Niobium Pentoxide Nanomaterials with Distorted Structures as Efficient Acid Catalysts. Commun. Chem. 2019, 2, 129. [Google Scholar] [CrossRef] [Green Version]
  47. Siddiki, S.H.; Rashed, M.N.; Ali, M.A.; Toyao, T.; Hirunsit, P.; Ehara, M.; Shimizu, K.I. Lewis Acid Catalysis of Nb2O5 for Reactions of Carboxylic Acid Derivatives in the Presence of Basic Inhibitors. ChemCatChem 2019, 11, 383–396. [Google Scholar] [CrossRef]
  48. Rudisill, S.G.; Hein, N.M.; Terzic, D.; Stein, A. Controlling Microstructural Evolution in Pechini Gels through the Interplay between Precursor Complexation, Step-Growth Polymerization, and Template Confinement. Chem. Mater. 2013, 25, 745–753. [Google Scholar] [CrossRef]
  49. Babooram, K. Novel solution routes to ferroelectrics and relaxors. In Handbook of Advanced Dielectric, Piezoelectric and Ferroelectric Materials; Elsevier: Amsterdam, The Netherlands, 2008; pp. 852–883. [Google Scholar]
  50. Wu, W.; Jiang, C.Z.; Roy, V.A.L. Designed synthesis and surface engineering strategies of magnetic iron oxide nanoparticles for biomedical applications. Nanoscale 2016, 8, 19421–19474. [Google Scholar] [CrossRef]
  51. Dimesso, L. Pechini Processes: An Alternate Approach of the Sol–Gel Method, Preparation, Properties, and Applications. Handb. Sol-Gel Sci. Technol. 2016, 1067–1088. [Google Scholar]
  52. Tsilomelekis, G.; Orella, M.J.; Lin, Z.; Cheng, Z.; Zheng, W.; Nikolakis, V.; Vlachos, D.G. Molecular Structure, Morphology and Growth Mechanisms and Rates of 5-Hydroxymethyl Furfural (HMF) Derived Humins. Green Chem. 2016, 18, 1983–1993. [Google Scholar] [CrossRef] [Green Version]
  53. Hao, H.; Shen, F.; Yang, J.; Qiu, M.; Guo, H.; Qi, X. Synthesis of Sulfonated Carbon from Discarded Masks for Effective Production of 5-Hydroxymethylfurfural. Catalysts 2022, 12, 1567. [Google Scholar] [CrossRef]
  54. dos Santos, T.V.; da Silva Avelino, D.O.; Pryston, D.B.A.; Meneghetti, M.R.; Meneghetti, S.M.P. Tin, Molybdenum and Tin-Molybdenum Oxides: Influence of Lewis and Bronsted Acid Sites on Xylose Conversion. Catal. Today 2022, 394–396, 125–132. [Google Scholar] [CrossRef]
  55. Stošić, D.; Bennici, S.; Rakić, V.; Auroux, A. CeO2–Nb2O5 mixed oxide catalysts: Preparation, characterization and catalytic activity in fructose dehydration reaction. Catal. Today 2012, 192, 160–168. [Google Scholar] [CrossRef]
Figure 1. XRD patterns of the catalysts: (a) Sn(PPT), Sn(CTAB) and Sn(GLY); (b) Nb(PPT), Nb(CTAB) and Nb(GLY); and (c) SnNb(PPT), SnNb(CTAB) and SnNb(GLY).
Catalysts 13 00285 g001
Figure 2. Infrared spectra of the catalysts: (a) Sn(PPT), Sn(CTAB) and Sn(GLY); (b) Nb(PPT), Nb(CTAB) and Nb(GLY); and (c) SnNb(PPT), SnNb(CTAB) and SnNb(GLY).
Catalysts 13 00285 g002
Figure 3. Raman spectra of the catalysts: (a) Sn(PPT), Sn(CTAB) and Sn(GLY); (b) Nb(PPT), Nb(CTAB) and Nb(GLY); and (c) SnNb(PPT), SnNb(CTAB) and SnNb(GLY).
Catalysts 13 00285 g003aCatalysts 13 00285 g003b
Figure 4. DRS-UV–vis spectra of the catalysts: (a) Sn(PPT), Sn(CTAB) and Sn(GLY); (b) Nb(PPT), Nb(CTAB) and Nb(GLY); and (c) SnNb(PPT), SnNb(CTAB) and SnNb(GLY).
Catalysts 13 00285 g004
Figure 5. Nitrogen adsorption- and desorption-isotherms and textural properties of the catalysts: (a) Sn(PPT), Nb(PPT) and SnNb(PPT); (b) Sn(CTAB), Nb(CTAB) and Nb(GLY) and SnNb(CTAB); and (c) Sn(GLY), Nb(GLY) and SnNb(GLY).
Catalysts 13 00285 g005
Figure 6. Amount of Lewis and Bronsted acid-sites and ratio of the number of Lewis and Bronsted acid-sites (AL/AB) of the catalysts.
Catalysts 13 00285 g006
Figure 7. Scanning-electron-microscopy (SEM) images of the catalysts. The scale bar of all images is 100 μm (see Figures S3–S5, Supplementary Information).
Catalysts 13 00285 g007aCatalysts 13 00285 g007b
Figure 8. Fructose conversion at 150 °C using Sn(PPT), Nb(PPT) and SnNb(PPT); Sn(CTAB), Nb(CTAB) and Nb(GLY) and SnNb(CTAB); and Sn(GLY), Nb(GLY) and SnNb(GLY).
Catalysts 13 00285 g008
Figure 9. Selectivity for soluble products identified in the fructose conversion at 150 °C, using 1.5 × 10⁻³ g of SnNb(PPT), SnNb(CTAB) and SnNb(GLY).
Catalysts 13 00285 g009
Figure 10. Visual aspects of the samples during the reaction using catalysts (1.5 × 10⁻³ g) at 150 °C (0.5 and 6 h).
Catalysts 13 00285 g010
Table 1. Code of the catalysts and the respective descriptions.
CodeDescription
Sn(PPT)Pure oxide obtained using the coprecipitation method
Nb(PPT)
SnNb(PPT)Mixed oxide obtained using the coprecipitation method
Sn(CTAB)Pure oxide obtained using CTAB as the template method
Nb(CTAB)
SnNb(CTAB)Mixed oxide obtained using CTAB as the template method
Sn(GLY)Pure oxide obtained using the Pechini method, using glycerol
Nb(GLY)
SnNb(GLY)Mixed oxide obtained using the Pechini method, using glycerol
Disclaimer/Publisher’s Note: The statements, opinions and data contained in all publications are solely those of the individual author(s) and contributor(s) and not of MDPI and/or the editor(s). MDPI and/or the editor(s) disclaim responsibility for any injury to people or property resulting from any ideas, methods, instructions or products referred to in the content.

