Article

Enhanced Removal of Organic Dyes Using Co-Catalytic Ag-Modified ZnO and TiO2 Sol-Gel Photocatalysts

Laboratory of Nanoparticle Science and Technology, Department of General and Inorganic Chemistry, Faculty of Chemistry and Pharmacy, University of Sofia, 1 James Bourchier Blvd., 1164 Sofia, Bulgaria
*
Author to whom correspondence should be addressed.
Catalysts 2023, 13(2), 245; https://doi.org/10.3390/catal13020245
Submission received: 20 December 2022 / Revised: 16 January 2023 / Accepted: 19 January 2023 / Published: 21 January 2023

Abstract

:
Zinc oxide and titanium dioxide semiconductor photocatalysts have been widely utilized in the last few decades for water treatment because of their high photocatalytic efficiency. Recently, a lot of researchers have focused on the improvement of the photocatalytic properties of catalysts through modifying and co-modifying them with different metals and nonmetals. These co-catalytic ions improve the photocatalytic activity of ZnO and TiO2 by reducing its energy band gap. This might be useful in wastewater treatment for the photocatalytic degradation of organic contaminants. In this study, we prepared semiconductor films that were surface-modified with Ag co-catalyst layers via the photo-fixation of Ag (I) ions with varied concentrations (10−2–10−4 M) in the water phase under UV illumination for the first time. The photocatalytic behavior was evaluated by the degradation of malachite green and methylene blue under UV and visible light irradiation. The ZnO/Ag and TiO2/Ag samples showed a faster degradation of malachite green compared to methylene blue due to the formation of stable intermediates by the reaction of OH radicals with the triarylmethane dye (C=C bond) during the photocatalysis. The co-catalytic-silver-modified films had a higher photocatalytic efficiency in comparison with the pure nanostructures. The dye photodegradation rate constants increased in the following order: pure films < films modified with Ag, 10−4 M < films modified with Ag10−3 M < films modified with Ag10−2 M. The Ag modification and the heterojunction of the composites contributed to trapping and transfer of the electrons. Therefore, the photogenerated charges had a longer lifetime, resulting in a strengthened photocatalytic ability of the ZnO/Ag and TiO2/Ag films.

1. Introduction

Dyes are one of the most dangerous pollutants used in many industrial sectors, such as the textiles, clinical substances, and food and cosmetics industries. They are difficult to degrade by conventional methods [1]. Therefore, the World Health Organization and the European Union recommend maximum doses that should not be exceeded when using these dyes. The reason for this is to prevent damage to human and animal health in the environment [2]. In recent years, scientific researchers have focused on developing new techniques and methods to overcome these problems, which are related to the purification of wastewater from industries, homes and businesses. Water pollution is a major problem considering the increasing demand due to the increasing population, global warming and water scarcity in arid regions [3].
Nowadays, advanced oxidation processes (AOPs) are used much more because they make the degradation of pollutants into easily degradable by-products or their complete mineralization to CO2 and H2O possible. These processes are based on the formation of superoxide ions and hydroxyl radicals with an oxidizing power greater than that of traditional oxidants such as Cl2 or O3. These radicals can partially or completely mineralize most organic compounds [4,5].
Some of the main water pollutants include pharmaceutical drugs, phenol compounds, detergents, herbicides, pesticides, surfactants and dyes [6,7,8,9,10]. Our goal in this study was to eliminate two organic pollutants, namely malachite green (MG) and methylene blue (MB), using AOPs under UV irradiation. These substances belong to the group of triarylmethane dyes. The two dyes are most commonly used as colorants in various fields such as the textile, paper, pharmaceutical and food industries or in diagnostics, training and research laboratories. Despite all their positives, these dyes are known to have genotoxic and carcinogenic properties [11].
Heterogeneous photocatalysis is a promising method for the removal of many organic materials and the conversion of toxic inorganic materials into harmless compounds [12]. In their nanocrystalline form, titanium dioxide and zinc oxide are well-known semiconductors with photocatalytic activities, and they have great potential for applications such as in environmental purification, pigments, catalyst supports, fillers, coatings, photoconductors, dielectric materials and the generation of hydrogen gas. Their involvement in all these applications is due to their important characteristics such as their non-toxicity, high photosensitivity, low cost, high photostability towards light, suitable electronic band structures, catalytic activity and oxidative power and good transparency as thin films [13]. Therefore, they are effective photocatalysts because their photoinduced electron–hole pairs (e/h+) are strong oxidizing and reducing agents for pollutant decomposition. However, TiO2 and ZnO catalysts are partially limited by their wide band gap energy (Eg > 3 eV), fast recombination and low charge transfer rates of their photoinduced electron–hole pairs [14]. The heterojunction between semiconductor catalysts via properly matching band energy levels can enhance light absorption to the UV–visible region and enable the efficient separation of photo-induced charge carriers [15]. Several metals (Cu, Au, Pt and Ag) have been used to improve the photocatalytic activity of TiO2 and ZnO [16]. Among them, Ag has proven its ability to reduce the recombination of photogenerated pairs, thereby extending their lifetime [17]. The reason for this is that (i) the Fermi level of Ag is lower than that of semiconductors; (ii) when Ag is on the surface of a catalyst, it acts as an electron trap and (iii) these e- can enhance the rate of oxygen photoreduction, increasing the amount of photogenerated hydroxyl radicals [18]. All this leads to an improved photocatalytic efficiency of the semiconductors. ZnO- and TiO2-nanostructured films can be prepared by different methods, and the most important are metal–organic chemical vapor deposition [19], sol–gel [20], magnetron sputtering [21] and atomic layer deposition [22]. Among all these methods, sol–gel is the simplest and most advanced process [23].
Here, we report a new, simple and inexpensive sol–gel method for the preparation of co-catalyst layers of TiO2 and ZnO films with silver-modified surfaces using, for the first time, a combination of a dip-coating technique and the photo-fixation of Ag (I) ions with different concentrations in water under ultraviolet irradiation. The optical and structural properties of the synthesized materials were characterized by scanning electron microscopy (SEM), X-ray diffraction (XRD), X-ray photoelectron spectroscopy (XPS), electron spin resonance (EPR) and ultraviolet–visible spectroscopy (UV–Vis). The relationship between all these properties and the photocatalytic efficiency of the pure and modified films was clearly established. The influence of the presence of Ag+ on the photocatalytic properties of the semiconductors for the degradation of malachite green and methylene blue was also investigated using UV–vis and TOC analysis.

2. Results and Discussion

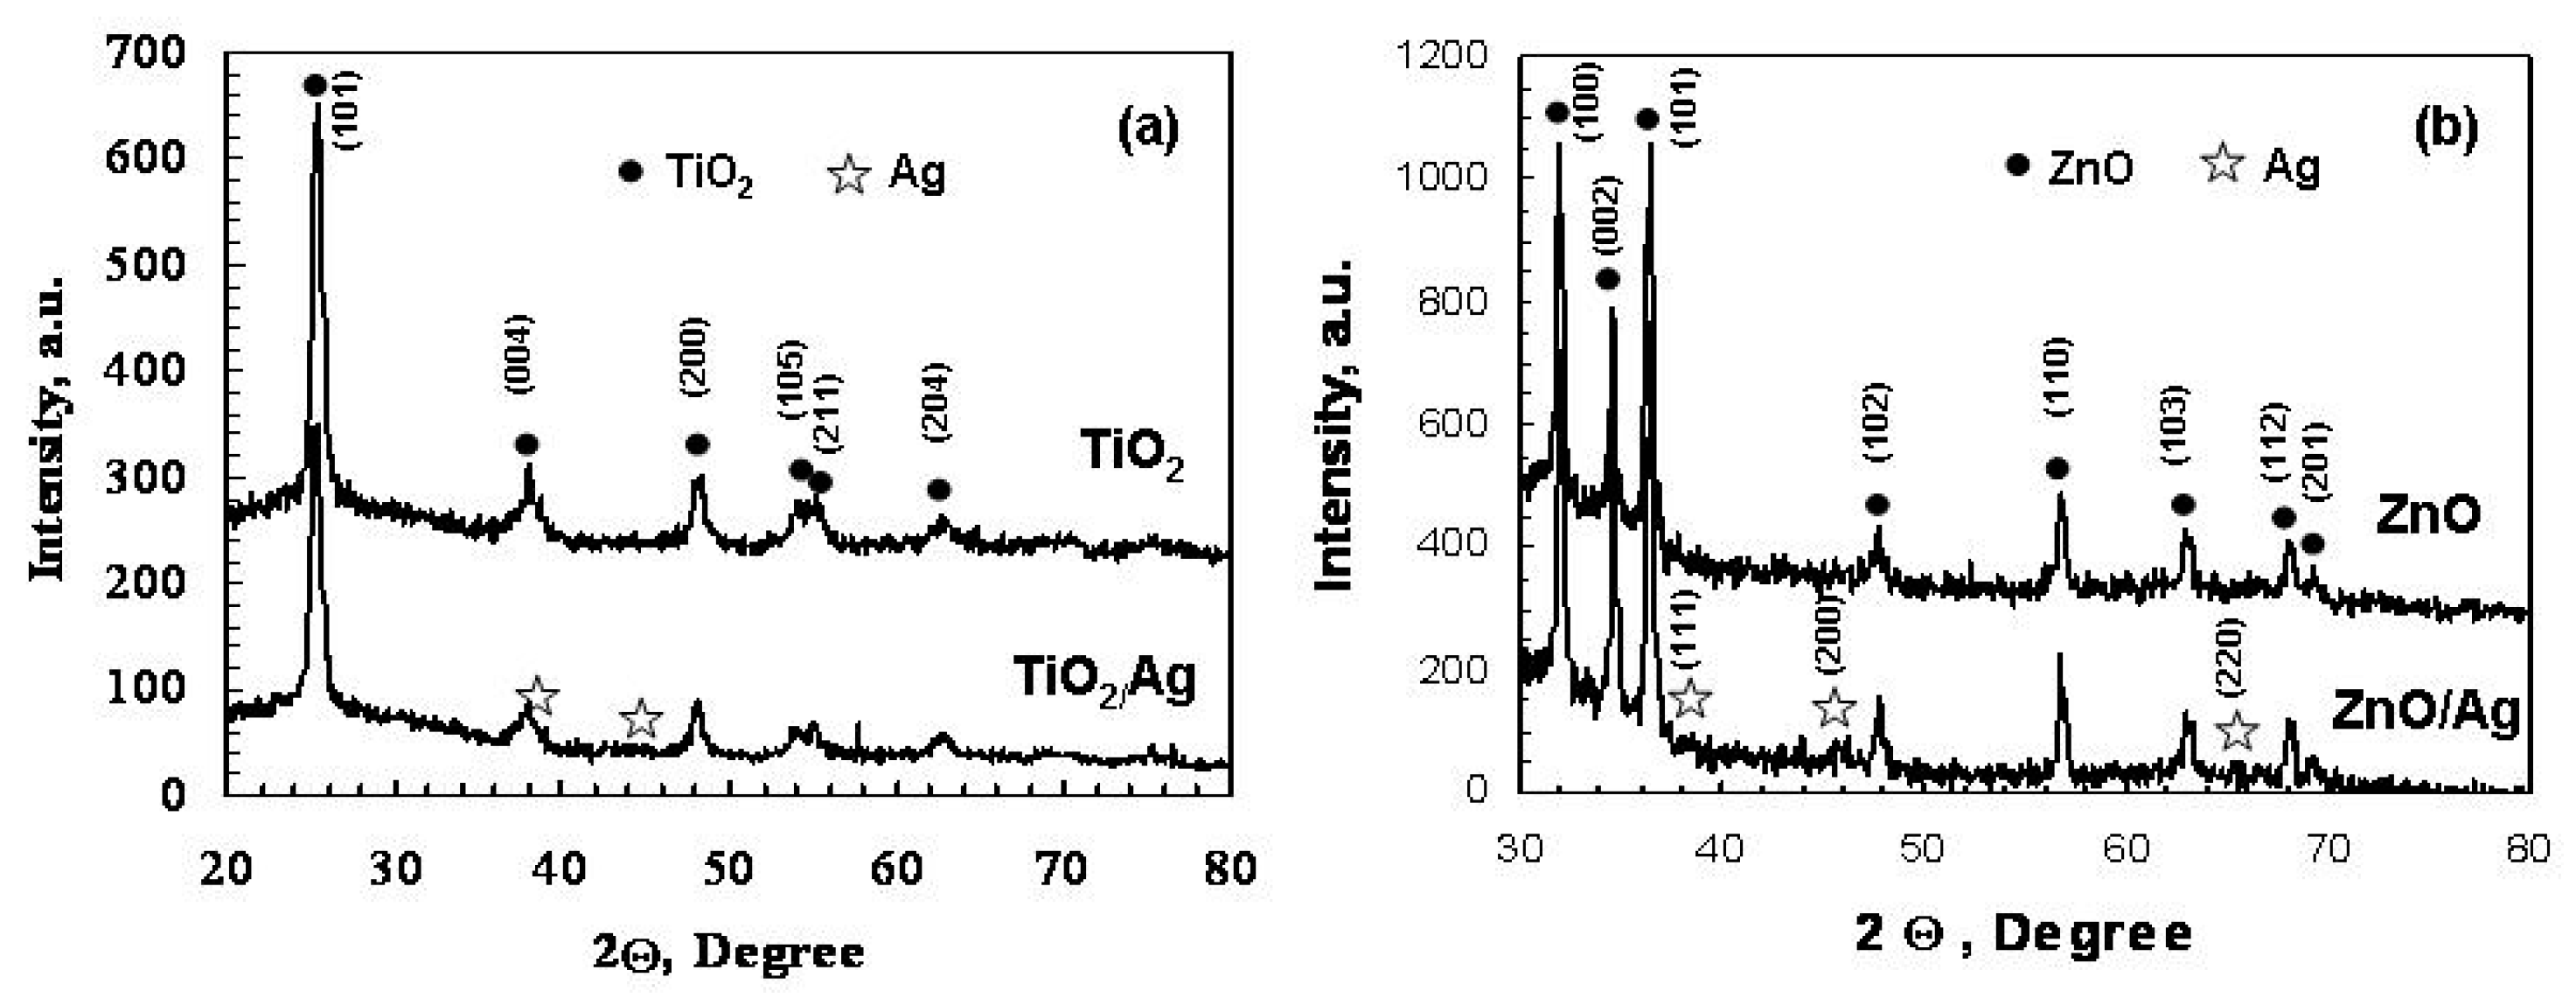
2.1. Structural Characterization

The crystal structure of the prepared pure semiconductor (TiO2, ZnO) and co-catalytic-silver (10−2 M)-modified films were identified by XRD analysis (Figure 1).
The recorded peaks indicated that the main phase of TiO2 and TiO2/Ag films was anatase, as indicated in the standard JCPDS card (96-500-0224). The intense diffraction peaks at 25.45°, 38.35°, 48.35°, 53.91°, 55.07° and 63.2° corresponded to the crystal planes (101), (004), (200), (105), (211) and (204), respectively. The modifying with silver did not alter the anatase structure of the TiO2/Ag films, as shown in Figure 1a. For this reason, the modified TiO2 film did not present additional peaks, which suggested that the Ag was incorporated into the TiO2 structure. Similar patterns have been reported for co-catalytic TiO2 modified with silver ions [24].
The X-ray patterns for the pure and silver-modified ZnO films (Figure 1b) were in concordance with the characteristic peaks of ZnO with a hexagonal structure, and the peaks were indexed with a JCPDS card (96-230-0117). The peaks were observed at 31.94°, 34.67°, 36.51°, 56.84° and 68.18°, which corresponded to the (100), (002), (101), (110) and (201) planes, respectively. Well-defined peaks in the pure ZnO showed a crystalline film with no impurities or other phases indicated in its structure. For the co-catalytic ZnO films modified with Ag, it was observed that the hexagonal crystalline structure remained present. However, when Ag was presented with a concentration 10−2 M, additional peaks appeared located at 38.46, 45.86 and 64.72°, respectively. These peaks corresponded to the planes (111, 200 and 220) of the metallic form of Ag (JCPDS 96-901-3048). The diffraction patterns for the ZnO films were similar, and no pattern distortion or peaks were observed arising from the co-catalysts modified with Ag+ [25].
The XRD results showed that the addition of silver ions did not significantly affect the crystal size. However, when the film was co-catalytic-modified, the intensity of the TiO2 and ZnO peaks decreased. The average crystallite size decreased slightly with the silver concentration (d(TiO2) = 31.2 nm, d(TiO2/Ag) = 26.9 nm, d(ZnO) = 48.4 nm and d(ZnO/Ag) = 42.9 nm), indicating that the crystalline lattice remained almost constant. Table 1 summarizes the structural parameters of the pure and silver-modified (10−2 M) thin films. The unit cell parameters of the silver-modified samples were found to be very close to the unit cell parameters of the pure TiO2 and ZnO films. This study also used the c-axis lattice parameter to estimate the film strain along the c-axis.
The calculations showed positive values, which represented the tensile strain. The estimations presented in Table 1 showed that the strain in the sol–gel-derived films was tensile, and that the modified co-catalytic films exhibited a lower-magnitude tensile strain than the pure samples.
In order to investigate the elements presented on the surface of the samples and their oxidation states, we applied X-ray photoelectron spectroscopy. In particular, we were interested in the oxidation state of the Ag nanoclusters. In Figure 2 the high-resolution XP spectra of the Ag3d photoelectron region (Figure 2a) and the relevant Ag peak, AgMNN (Figure 2b), are shown, which were measured for Ag/TiO2 film.
A closer look at the peak line shape of both the photoelectron and Ag line revealed that silver existed on the surface of the samples with two oxidation states, namely Ag0 and Ag+. The curve-fitting procedure of the Ag3d line showed that the Ag0 peak had a binding energy (BE) of 368.8 eV, whereas the Ag+ had a BE of 367.8 eV. Additionally, we could recognize two features of the Auger peak that showed a 357.2 kinetic energy (KE), characteristic of Ag0, and a 355.8 KE, characteristic of Ag+. A more-sensitive parameter regarding the oxidation state of silver is the modified Auger parameter, which is defined as the sum of the BE of the 3d5/2 photoelectron peak and the KE of the Auger MNN peak (ά = EK(AgMNN) + EB(Ag3d5/2). The calculated numbers were 726.0 eV and 723.6 eV. These values were also calculated for metal silver and silver with a 1+ oxidation state, respectively [26,27]. Using the results of the curve-fitting procedure, we could estimate that the concentration of the Ag+ clusters was three times higher than that estimated for the Ag0 particles. The existence of oxidized silver could also be supposed from the relative concentrations of the presented elements on the surface of the Ag/TiO2 film. We calculated the ratio between the atomic percentage of Ti:O:Ag = 68:24:8. Silver particles were photofixed on the TiO2substrate. Theoretically, we expected a ratio between Ti:O = 1:2, which was not observed in our case. The surface of the sample was enriched with oxygen. The excess of oxygen was attributed to oxygen bonded to the silver and/or oxygen from OH-groups. The existence of Ag+ clusters was also confirmed by EPR measurements.
Figure 3 shows the high-resolution XP spectra of the Ag3d photoelectron region (Figure 3a) and the relevant Ager peak, AgMNN (Figure 3b), measured for the Ag/ZnO film. The line shapes of both the Ag3d photoelectron region and the Ager AgMNN peak revealed that photofixed metal silver particles were present on the surface of the ZnO. The BE of the 3d5/2 peak was defined at 368.4 eV, whereas the KE of the AgMNN peak was at 356.5 eV. The modified Auger parameter was calculated to be 724.9 eV. The value of all the above-mentioned parameters together with the loss structure in the BE ranging from 370.5 eV to 372.5 eV observed in the Ag3d region showed that the detected silver on the ZnO surface had a metallic character. The relative concentration of the elements presented on the surface showed a ratio of Zn:O:Ag = 47:48:5. The ratio between zinc and oxygen was close to the expected theoretical one. The negligible difference was attributed again to oxygen in the OH groups and eventually oxidized silver, which was with a concentration below the resolution of the spectrometer analyzer. Additional speculation was made according to the value of modified Auger parameter, because it was slightly lower than that measured for pure metallic silver, which could be the reason that one could expect the existence of a small quantity of Ag+ clusters or metallic particles covered by thin oxide layer. This speculation was supported by the very low EPR signal of the Ag+ clusters.
In the EPR spectrum of the ZnO films (Figure 4), two signals are recorded at room temperature. The more intensive line recorded at g = 1.957 (S1) is associated with the so-called shallow effective mass donor (SD) center in the ZnO single crystals. Some authors have associated the SD center with Zn-related defects. The second less-intensive line (S2) is detected at a g value of 2.0014. Some authors have attributed this signal with a g factor close to the free electron value of 2.0023 in ZnO to singly ionized oxygen vacancies (V0+) defects. In other works, this has been detected with a similar signal with g = 2.003 and has been attributed to Zn vacancies.
In the EPR spectrum of the Ag-modified ZnO films, the line S3 recorded at g = 2.004 was assigned to the Ag2+ center. Silver entered the TiO2 lattice as an Ag+ ion. Ag+ ions are diamagnetic with a closed 4d10 electronic configuration and do not exhibit any ESR spectra. However, Ag+ ions can lose an electron upon UV irradiation, resulting in the formation of paramagnetic Ag2+ [28]. The lower intensity of the SD center peak (S1) in the ZnO:Ag films indicated a decreased concentration of shallow donors, while the EPR line S2 showed a significant increase in intensity and a slight shift toward a lower magnetic field. The weak intensive signals from 285 mT to 360 mT are due to the glass used to prepare the films.
A narrow signal, T1, with g = 1.99 and g// = 1.96 was recorded in the TiO2 films. This signal has also been detected in colloidal TiO2 anatase, and it was assigned to substitution Ti3+ (T3) in hydrated anatase [29]. After doping with silver, an intensive signal, T2, at g = 2.0038 was recorded. The EPR peak at g ≈ 2.001–2.004 is attributed to oxygen vacancies [29].
The surface micrograph analyses showed that the morphology of the TiO2 films consisted of micro aggregates (sandwich structures), and the ZnO films had a ganglia-like structure, as shown in Figure 5. It was observed that all the samples possessed a homogeneous surface. It was evident from the SEM images that the co-catalytic modified films showed few nanoparticle aggregates on the top over the entire surface, which suggested a better photocatalytic performance of the TiO2/Ag and ZnO/Ag samples.

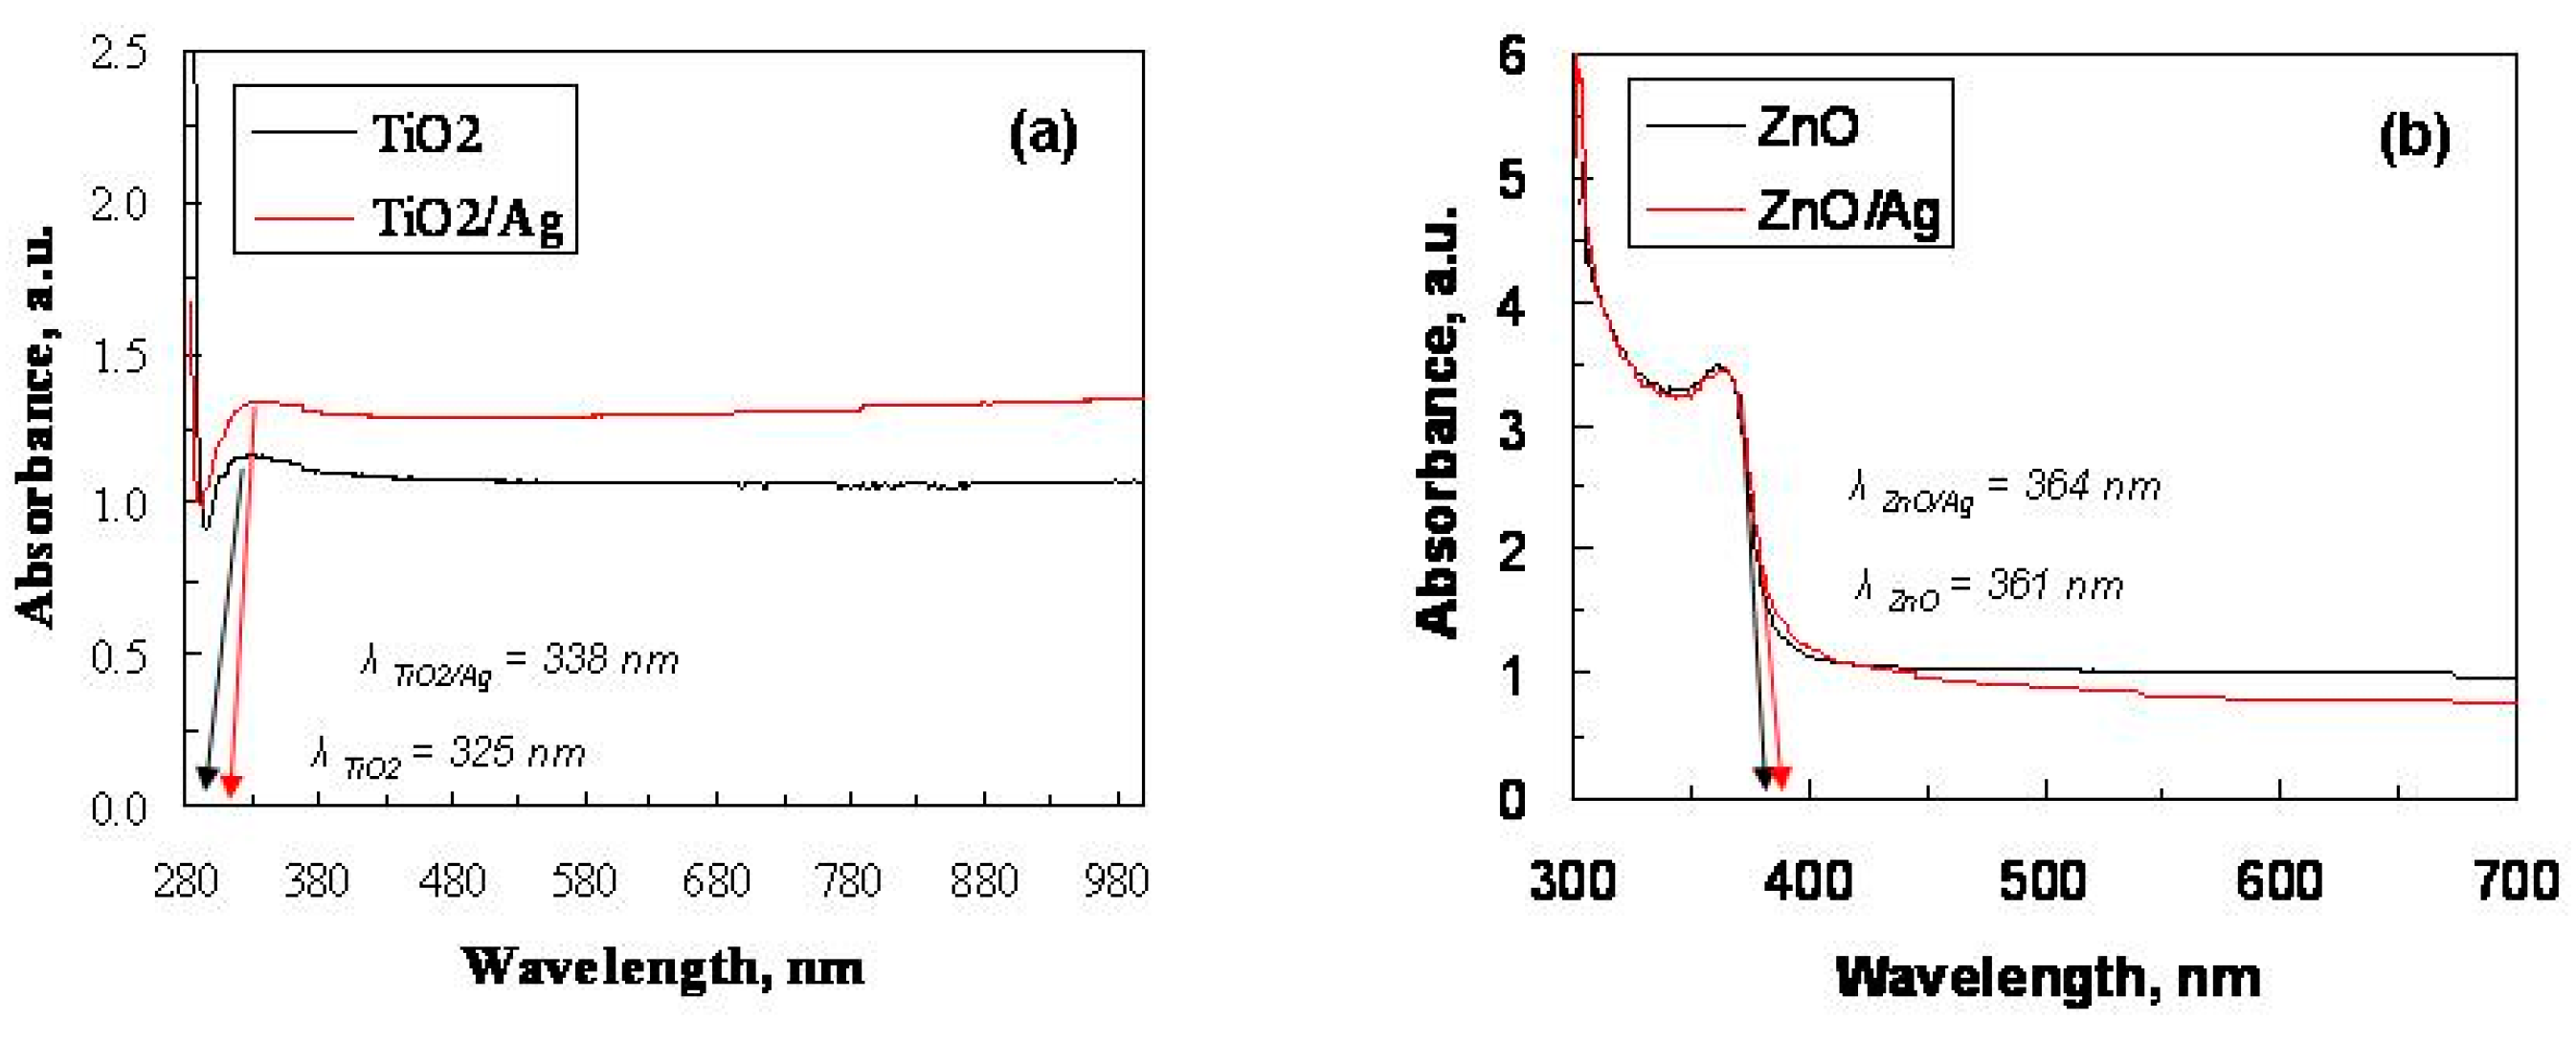
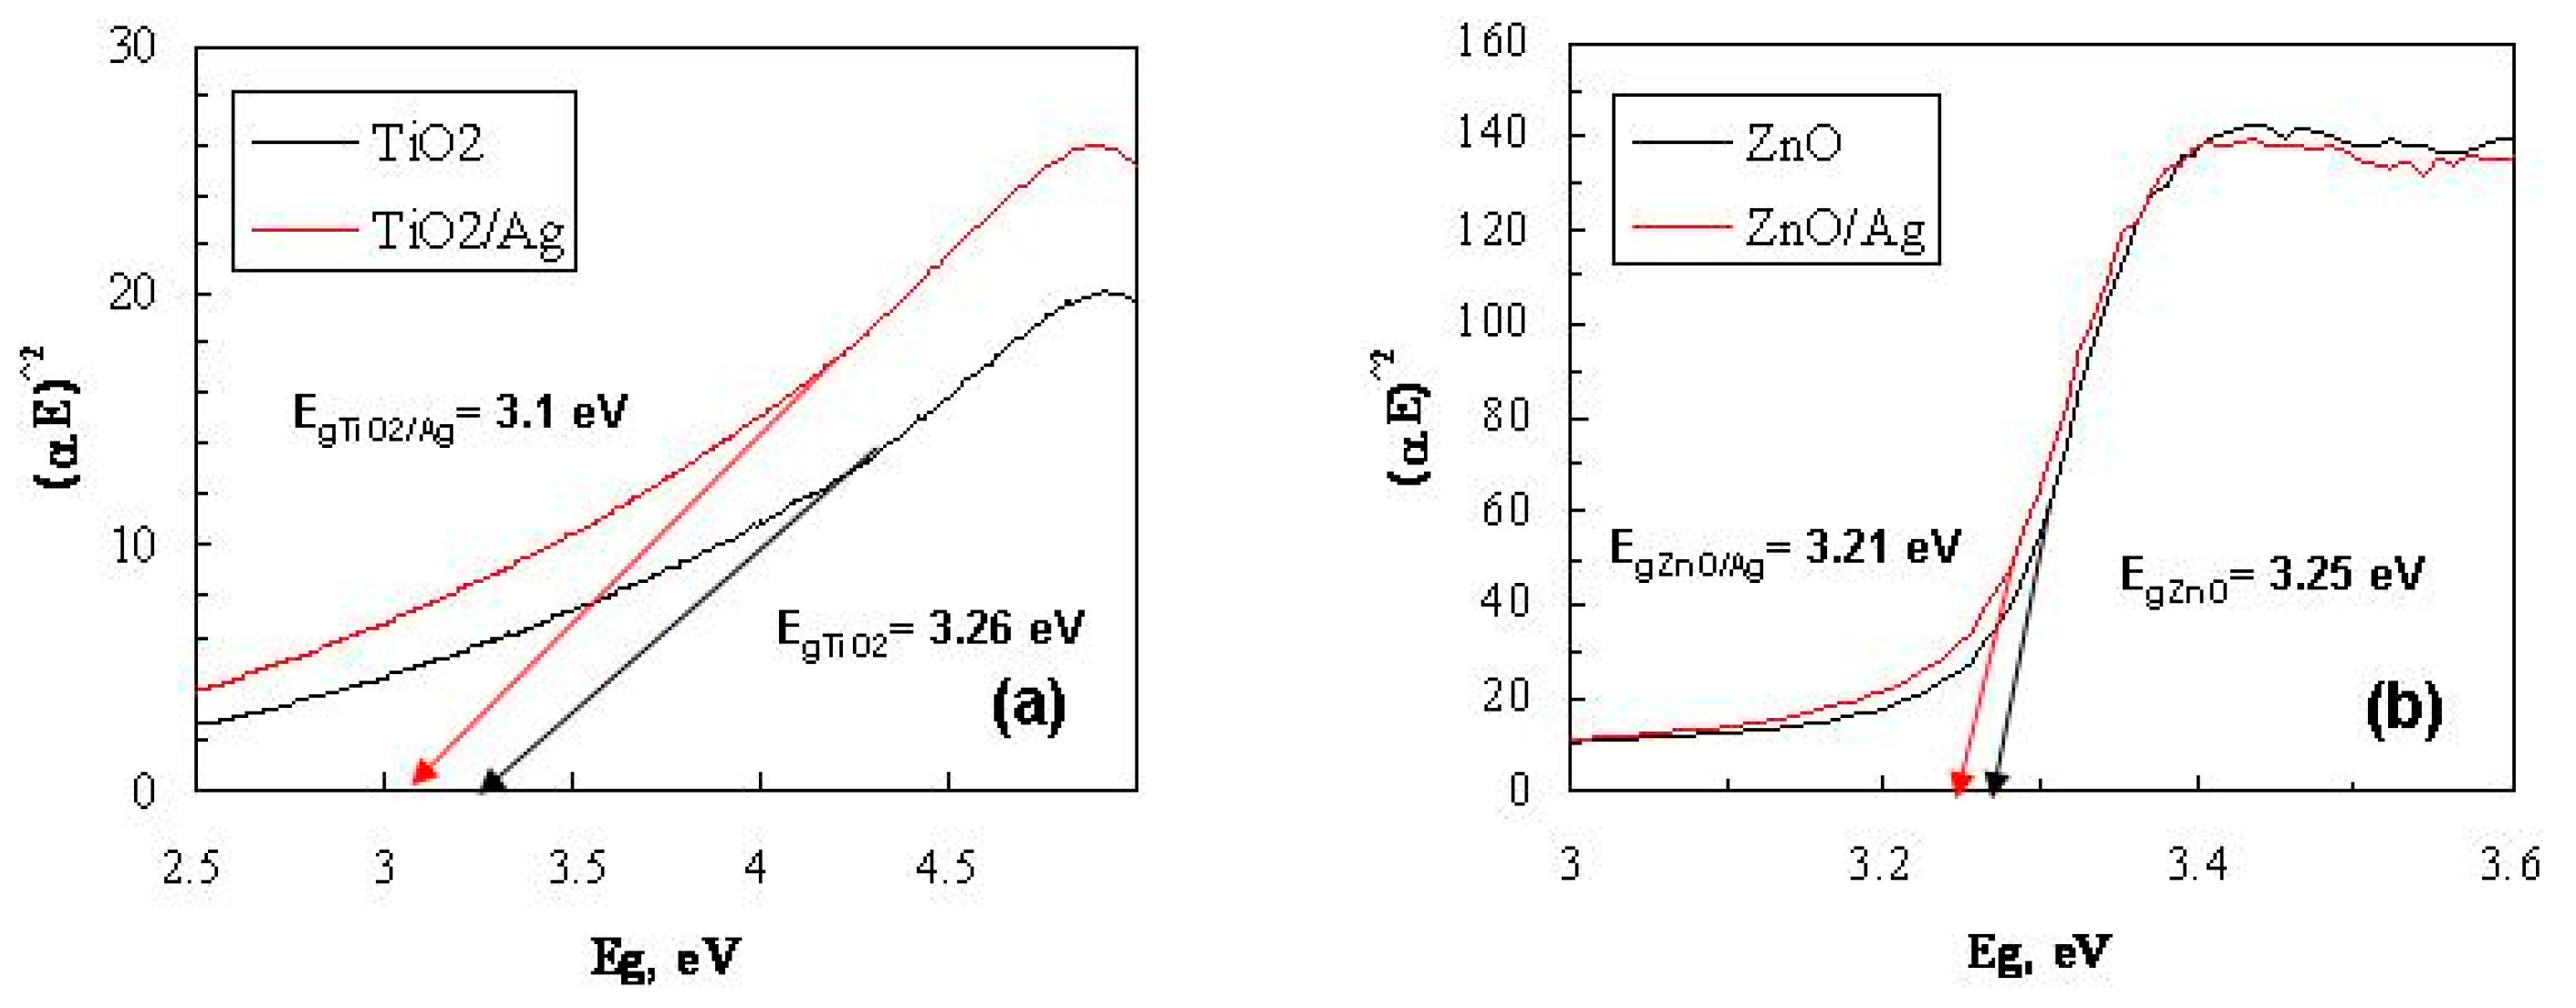
2.2. Optical Characterization

The optical properties of the semiconductors were investigated by UV–vis absorption spectroscopy. It can be seen in Figure 6 that the pure films presented an absorption band around 330–370 nm in the UV region (TiO2 λmax = 325 nm, ZnO λmax = 361 nm), while the co-catalytic silver-modified samples showed a slight shift in the absorption band (TiO2/Ag λmax = 338 nm, ZnO λmax = 364 nm), which was caused by the interaction between the Ag and the semiconductors [30]. This interaction was due to the strong interfacial electronic coupling between the TiO2, ZnO and Ag. This helped to further reduce the loss of light energy [31].
The band gap energy of the prepared semiconductors was calculated using the following equation:
(ahv)2 = A(hvEg)
where the absorption coefficient, Planck’s constant, photon frequency, energy band gap and a constant are α, h, v, Eg and A, respectively. The Eg values were obtained from plots of (αhv)2 verses hv, extrapolating a straight line to the x-axis. The values from the Kubelka–Munk extrapolation vs. the energy band gap of the films are presented in Figure 7 and showed the change in the absorption edge that was attributed to the incorporation of the silver ions into the TiO2 and ZnO. This led to narrowing of the optical band gap with the co-catalytic modification of the semiconductors with Ag.
The decrease in the semiconductor band gap with silver may be due to the renormalization effect of the band gap [31]. The renormalization was due to the exchange interaction (sp-d) in the electrons of the band and the localized electrons (d) of the Ag+. After the possible exchange interaction, there was a modification in the band gap of the TiO2/Ag and ZnO/Ag with reference to pure semiconductors [31]. The TiO2 and ZnO showed a band gap of 3.26 and 3.25 eV, while the band gap value of the co-catalytic silver-modified films decreased to 3.10 and 3.21 eV. The co-catalytic silver-modified TiO2 and ZnO films were able to capture more light-generated electrons, which made them more efficient light-trapping materials in the oxidation and reduction reactions that took place on the surface. Thus, the silver ions reduced the rate of recombination of the photogenerated charge pairs (electron–hole). Therefore, a better photocatalytic activity was expected for the TiO2/Ag and ZnO/Ag films.

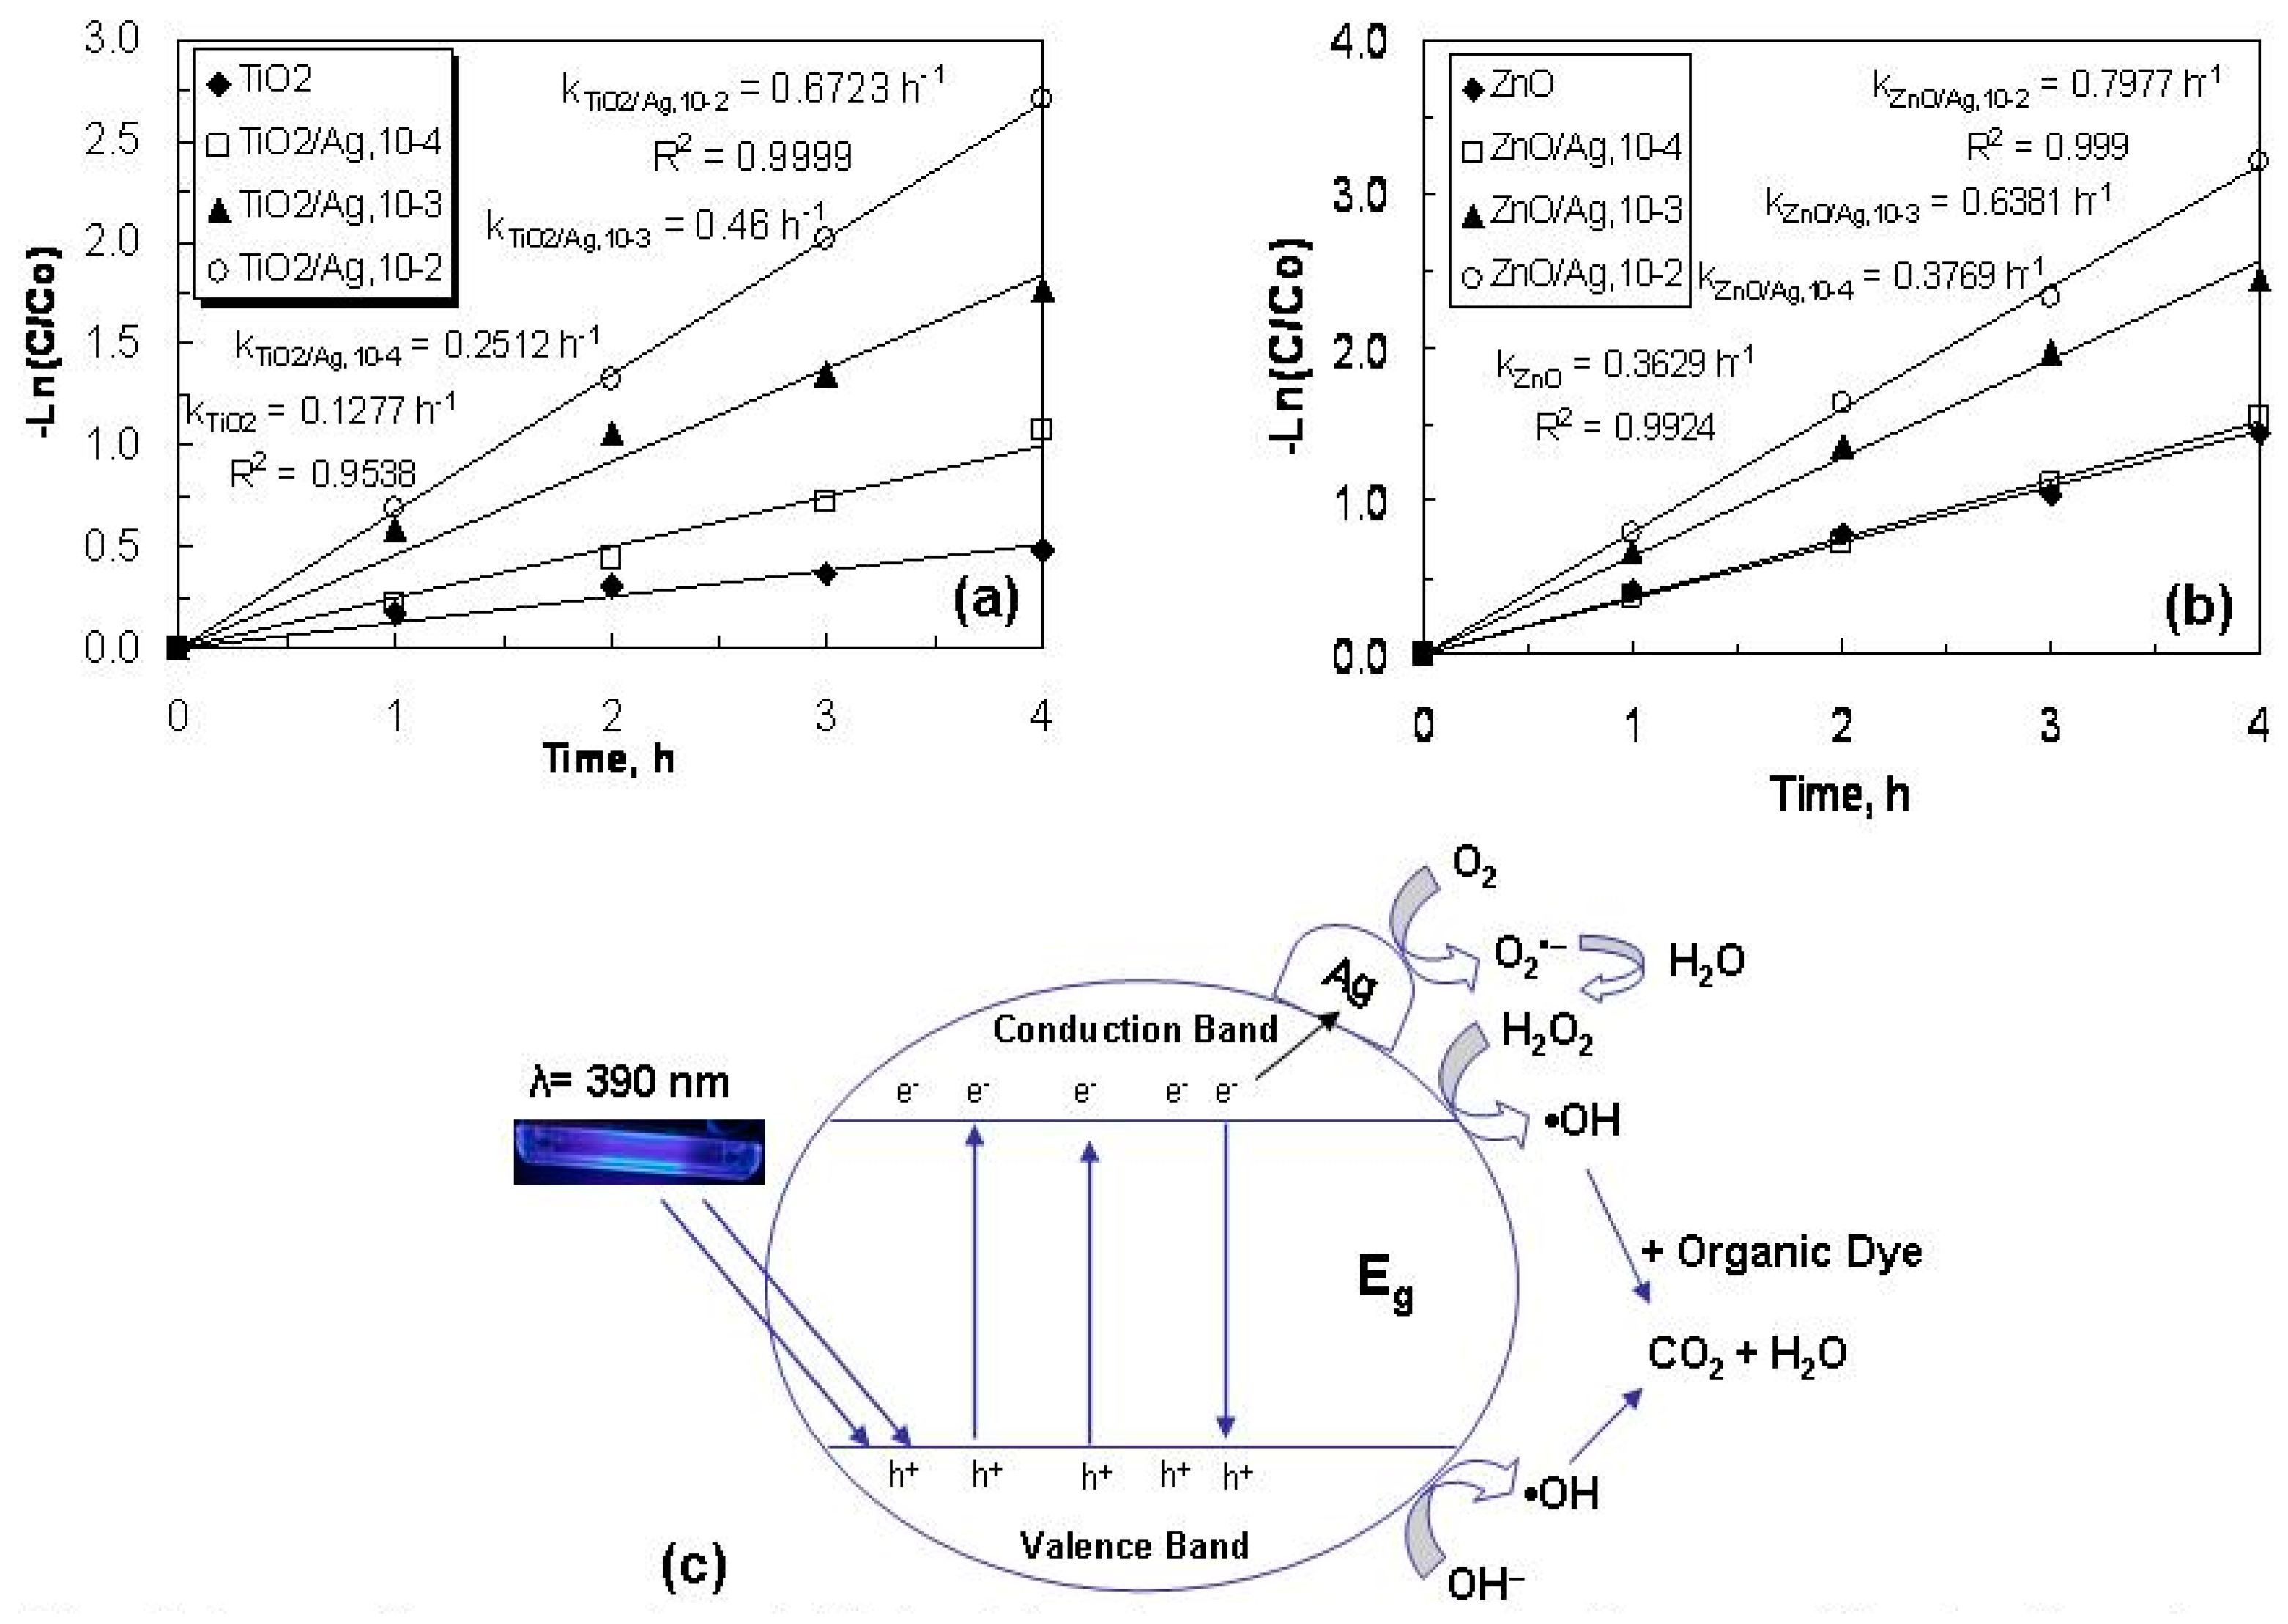
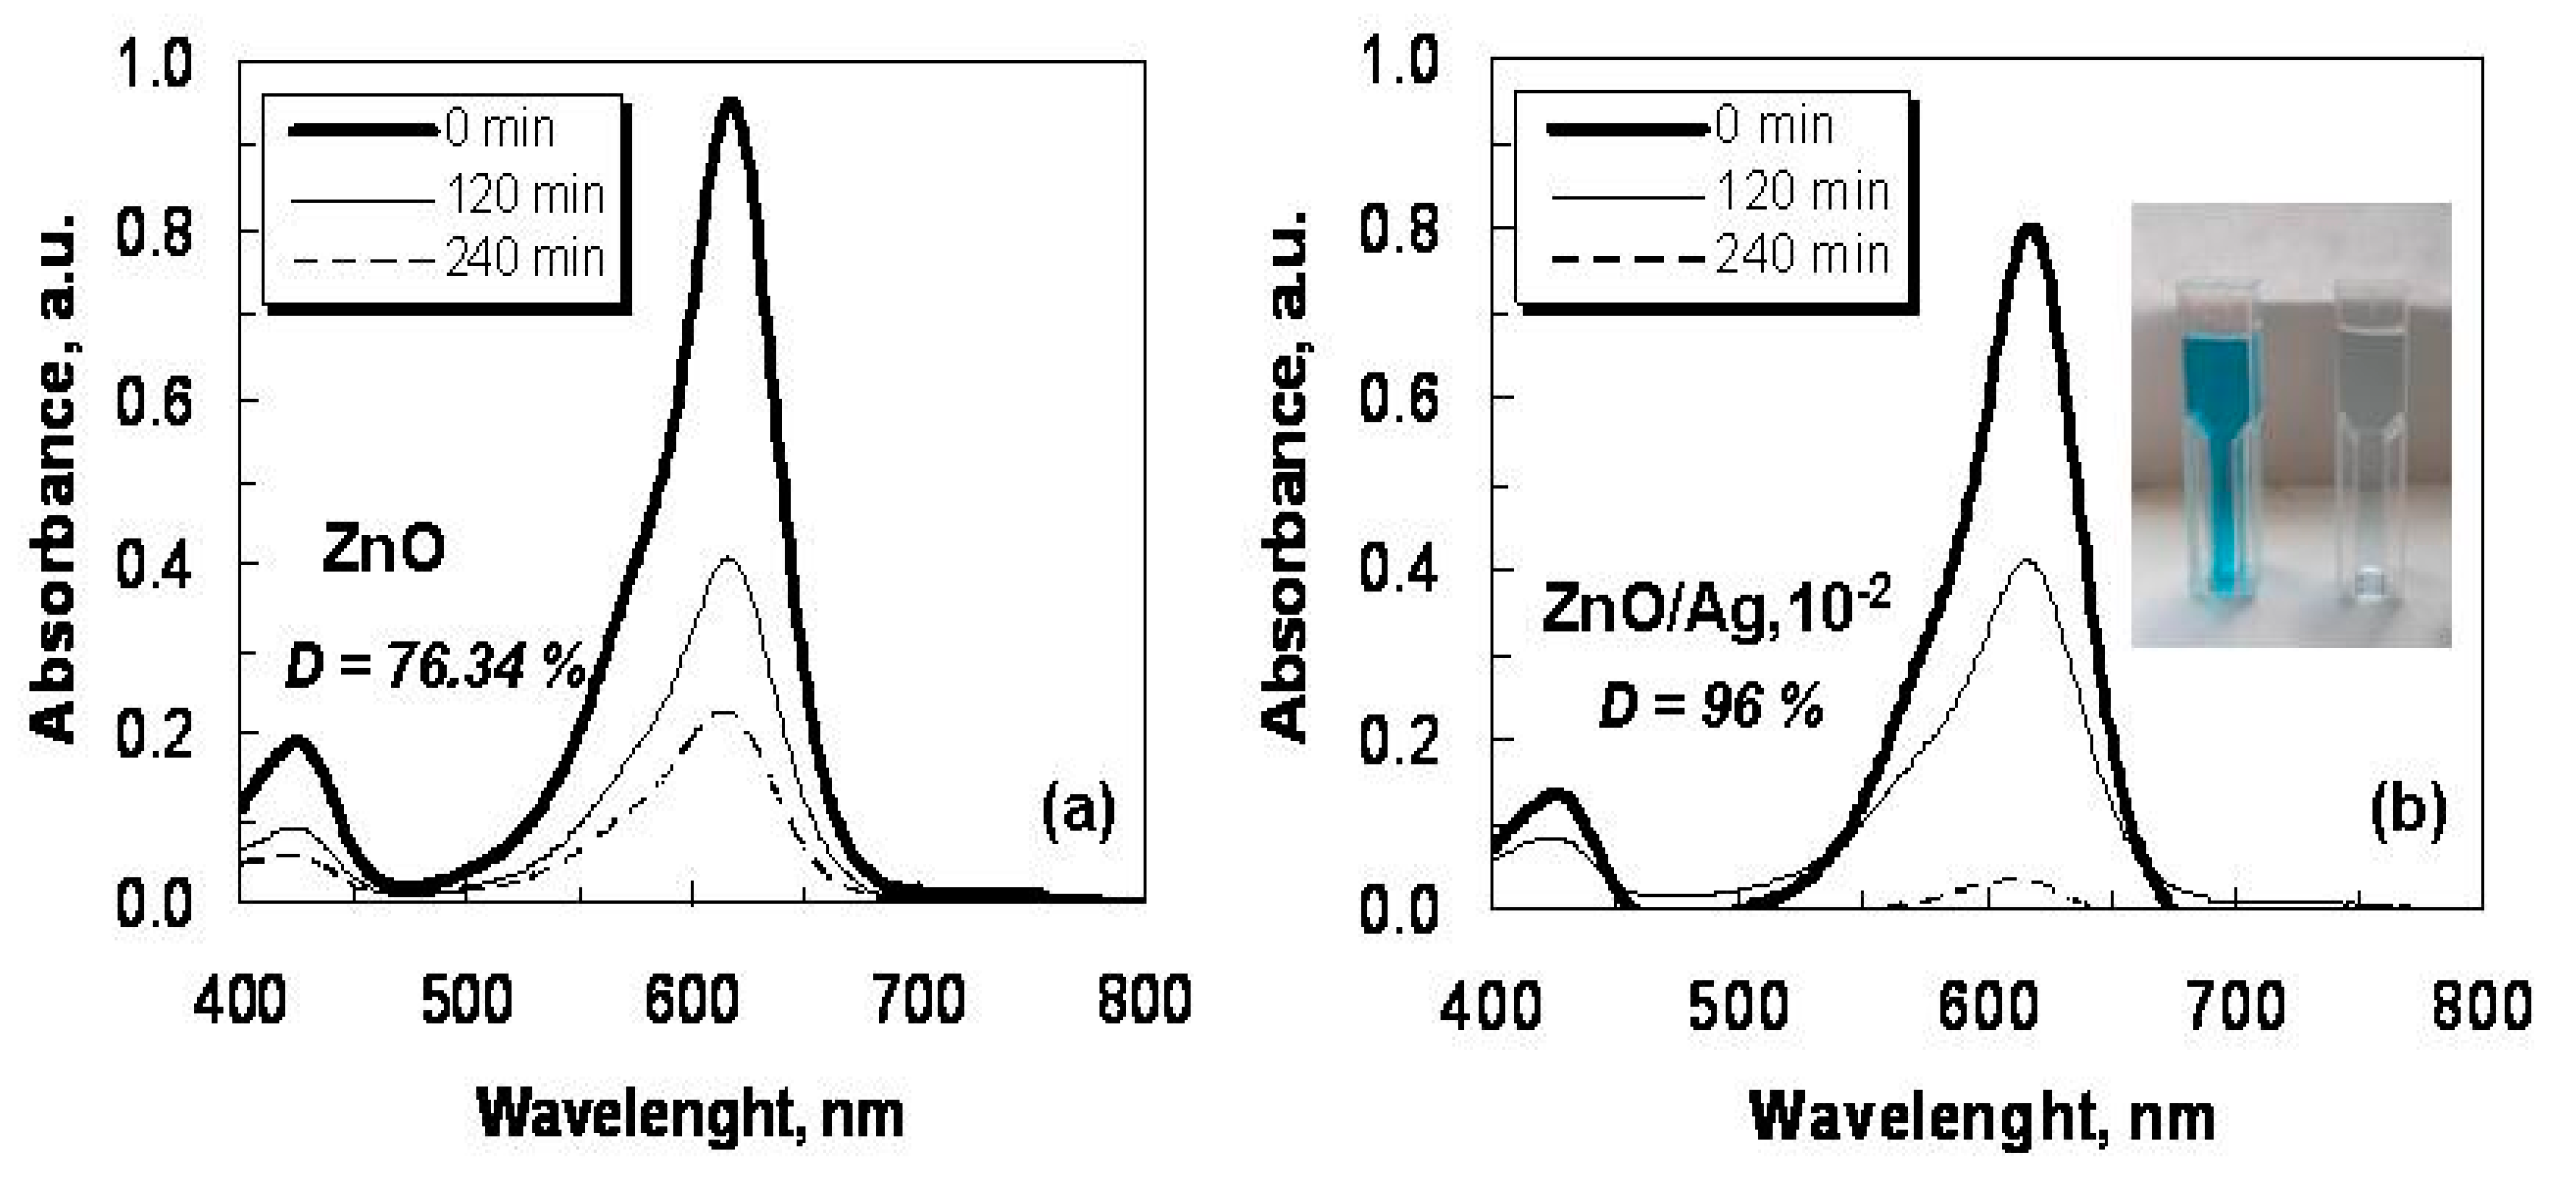
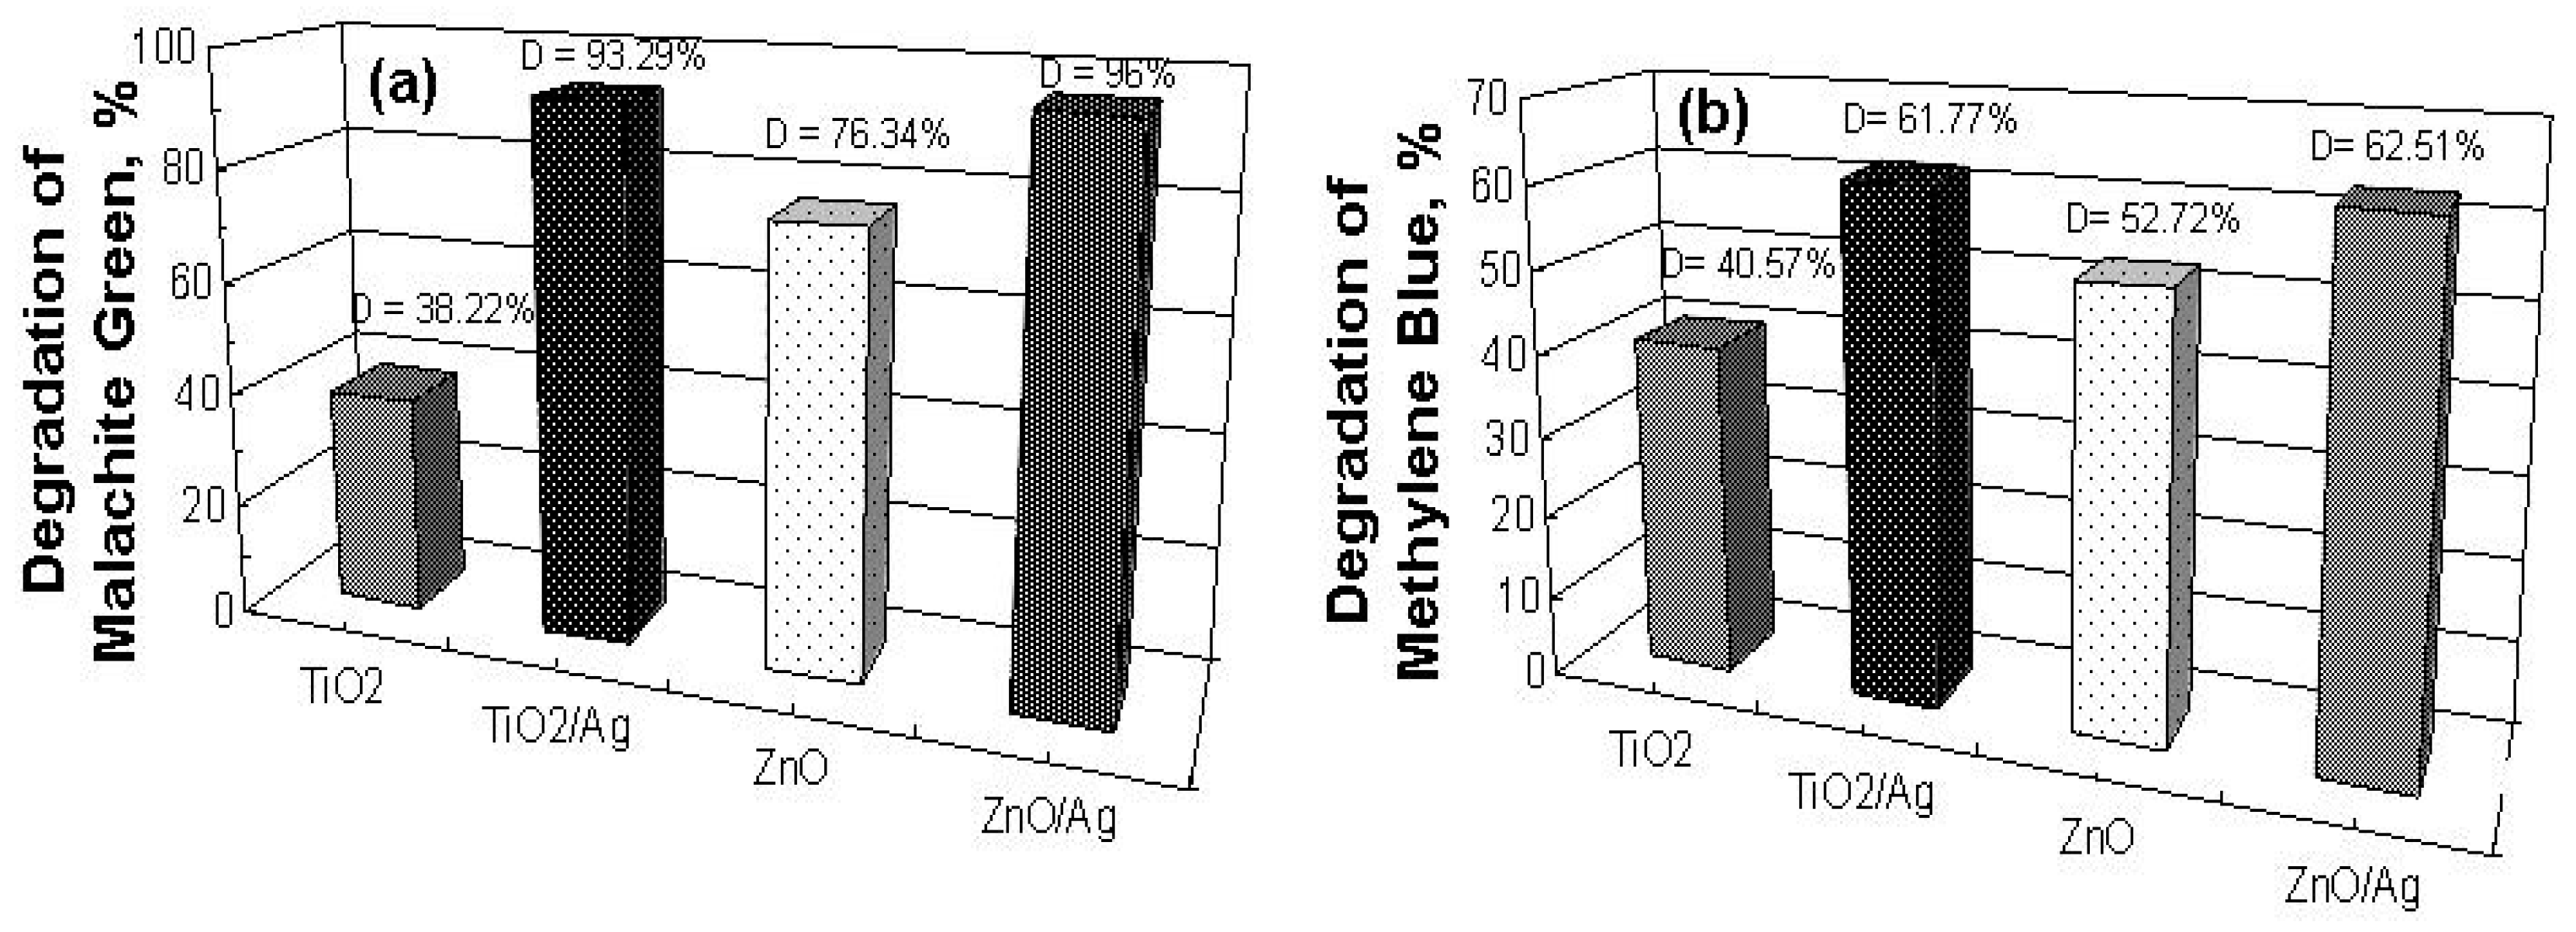
2.3. Photocatalytic Activity

The photocatalytic activities of the pure and co-catalytic silver-modified films were investigated by MG and MB degradation under UV illumination. In order to examine the effect of the co-catalytic modification, we prepared two parallel sol–gel method procedures for the preparation of the TiO2 and ZnO catalysts. For both samples, the efficiency of the catalyst was enhanced significantly upon the addition of silver ions (from 10−4 to 10−2 M), with the degradation rate increased from 0.1277 to 0.6723 h−1 for the titanium dioxide (Figure 8a) and from 0.3629 to 0.7977 h−1 for the zinc oxide samples (Figure 8b). The results obtained, as shown in Figure 8, showed that the photocatalytic reaction was of a pseudo-first-order kinetics. The apparent first-order reaction rate constants were evaluated from the experimental data using a linear regression. All of the correlation coefficients (R2) were higher than 0.947. It is well-known that the photocatalytic efficiency of co-catalytic modified TiO2 and ZnO depends on many factors, such as the synthesis method, light illumination, crystallite size, surface area, etc. Obviously, in our photocatalytic experiments, the presence of silver was beneficial to the photocatalytic behavior of the samples under UV irradiation. No bleaching of the malachite green solution was observed in the absence of the pure and co-catalytic silver-modified semiconductor films.
Figure 8 shows that the silver-modified samples were more efficient than the pure TiO2 and ZnO films in decolorizing the MG and MB. The UV irradiation of the semiconductor generated e/h+ pairs at the illuminated surface. The recombination of these charge carriers reduced the rate of photocatalysis. The positive effect from the co-catalytic modification with silver ions on the efficiency of the TiO2 and ZnO for the photodegradation of the dyes may be explained by silver’s ability to trap electrons. Thus, a more effective electron transfer occurred through adsorption onto the surface molecules than in the case of the pure semiconductors. Oxygen adsorbed onto the photocatalyst surface trapped the electrons and produced superoxide anions. On the other hand, the holes at the semiconductor (TiO2, ZnO) surface could oxidize the adsorbed water or hydroxide ions to produce hydroxyl radicals. Szabo-Bardos et al. [32] showed that electron scavenging by oxygen at the surface of excited semiconductor particles cannot efficiently compete with electron transfer to silver ions. So, the electron transfer to silver ions is rather fast compared to electron transfer to oxygen molecules, and therefore the formation of O2•− is reduced. But in the co-catalytic silver-modified semiconductors with the sol–gel method (TiO2/Ag, ZnO/Ag), the loading of Ag metal on the TiO2 and ZnO surfaces could expedite the transport of photogenerated electrons to the outer systems. The transfer of electrons to the metal deposits resulted in partially negatively charged deposits. The deposits of silver ions on the surface enhanced the photoactivity by accelerating the transfer of electrons to the dissolved oxygen molecules. Therefore, superoxide anion radicals were formed as a result of oxygen reduction by the transfer of trapped electrons from the Ag metal to the oxygen, as can be seen in Figure 8c. The enhancement of the efficiency of the photocatalysts with Ag co-catalytic modification was marked by absorption spectra for these experiments, and these are shown in Figure 9. A significant shift in the absorption maximum wa observed in the silver-modified ZnO.
Figure 10 compares the photocatalytic efficiency of the TiO2 and TiO2/Ag, and the ZnO and ZnO/Ag sol–gel films and shows the time course of the decrease in the concentration of MG under UV and visible light irradiation. The initial concentration of the dye was 5 ppm. No bleaching of the malachite green solution was observed in the absence of the pure and silver-modified films. The photocatalytic experiments showed that the decolorization of the dye by the sol–gel films under UV and visible irradiation followed pseudo-first-order kinetics. The slope of the logarithmic scale linear fits represents the rate constant of photocatalysis k.
As can be seen from Figure 10a,b, the same trend was observed in the photocatalytic processes carried out in the presence of UV and visible light, where the ZnO/Ag films had the highest photocatalytic activity (under UV and visible irradiation, k1 = 0.7977 h−1 and k2 = 0.4319 h−1). The titanium dioxide modified with silver had a higher efficiency (under UV and visible irradiation, k1 = 0.6723 h−1 and k2 = 0.0695 h−1) in comparison with the pure TiO2 film (under UV and visible irradiation, k1 = 0.1277 h−1 and k2 = 0.0545 h−1).
We compared the photocatalytic results with the degradation of dye by the semiconductors in darkness (Figure 10c). The concentration of the organic pollutant decreased without irradiation but was slower in comparison with the respective photocatalytic reactions. The rate of dye degradation by the sol–gel films reached almost a constant value after 4 h (~18%). The decrease in the pollutant concentration was considered as the adsorption of the MG onto the sol–gel films or some kind of dye destruction process taking part on the semiconductors even in darkness (without UV illumination). All these assumptions need further evidence and will be the subject of further future research.
Finally, the tuning of the electronic structure of the TiO2 and ZnO samples by co-catalytic modifying with Ag using the sol–gel technique was successfully achieved. Moreover, their unusual effectiveness encouraged us to apply this test to another organic pollutant in the presence of ultraviolet illumination. The photocatalytic activity of the sol–gel films was investigated for the decolorization of MB by the same procedure as MG and is shown in Figure 11. The photocatalytic experiments related to MB degradation showed the same trend, where the modified films possessed a higher activity (MG—DTiO2/Ag = 93.29%, DZnO/Ag = 96%; MB—DTiO2/Ag = 61.77%, DZnO/Ag = 62.51%) compared to the pure films. This result confirmed the positive effect of Ag on the photoinduced efficiency of TiO2 and ZnO.
The silver co-catalytically modified sol–gel films showed a faster degradation of malachite green compared to methylene blue due to the formation of stable intermediates by the reaction of OH with triarylmethane dye (C=C bond) during the photocatalytic process. The probable mechanisms of the degradation of methylene blue and malachite green, induced by a reaction with OH, have been reported in the literature [33,34]. Houas et al. [33] suggested that in the initial step the hydroxyl radical cleaves the S+=C bond, which in turn induces a ring-opening reaction of the central heterocyclic part. This leads to the degradation of the MB solution. Regarding MG, Ju et al. [34] showed that the initial step of dye decolorization includes a radical attack on the central C atom, which transforms it into a malachite green carbinol base and again leads to the degradation of the pollutant.
Taking into account the above reasoning, it can be concluded that the faster degradation of malachite green, observed in the present study, could be attributed to the facilitated attack of the hydroxyl radical toward the S atom. The reason for this was the increased electron density.
The photocatalytic results were confirmed by TOC analysis. TOC measurements were carried out in order to examine the degradation of both of the dyes (malachite green and methylene blue) after 240 min of UV light illumination, as shown in Figure 12. The TOC percentages for the mineralization of MG and MB were found to be 20.28% and 22.84%, respectively. In comparison with the TiO2, the ZnO catalyst showed higher percentages of TOC removal of the dyes (51.37% and 40.73%), but the trend was the same.
When the semiconductor films were co-catalytically modified with silver ions, the TOC conversion rates of dye photodegradation were increased (MG—49.5% TiO2/Ag, 64.6% ZnO/Ag; MB—37.15% TiO2/Ag, 45.23% ZnO/Ag). On the other hand, the TOC removal percentages of the MG and MB were found to be correspondingly slightly lower than their degradation rate in the photocatalytic processes. The reason for this was the formation of intermediate byproducts.
The TOC measurements showed lower values for malachite green and methylene blue removal than the UV–vis spectroscopy. This was a clear indication that the mineralization went through a complex multistep process including several intermediate products. For example, S. Ray et al. and S. Nayak identified several intermediate products during the photocatalytic oxidation of malachite green and methylene blue [35,36]. All these byproducts have different oxidation potentials when reacting with OH- radicals produced during the photocatalytic process. This leads to different speeds of mineralization for each of the intermediates and therefore their detection during the TOC analysis.

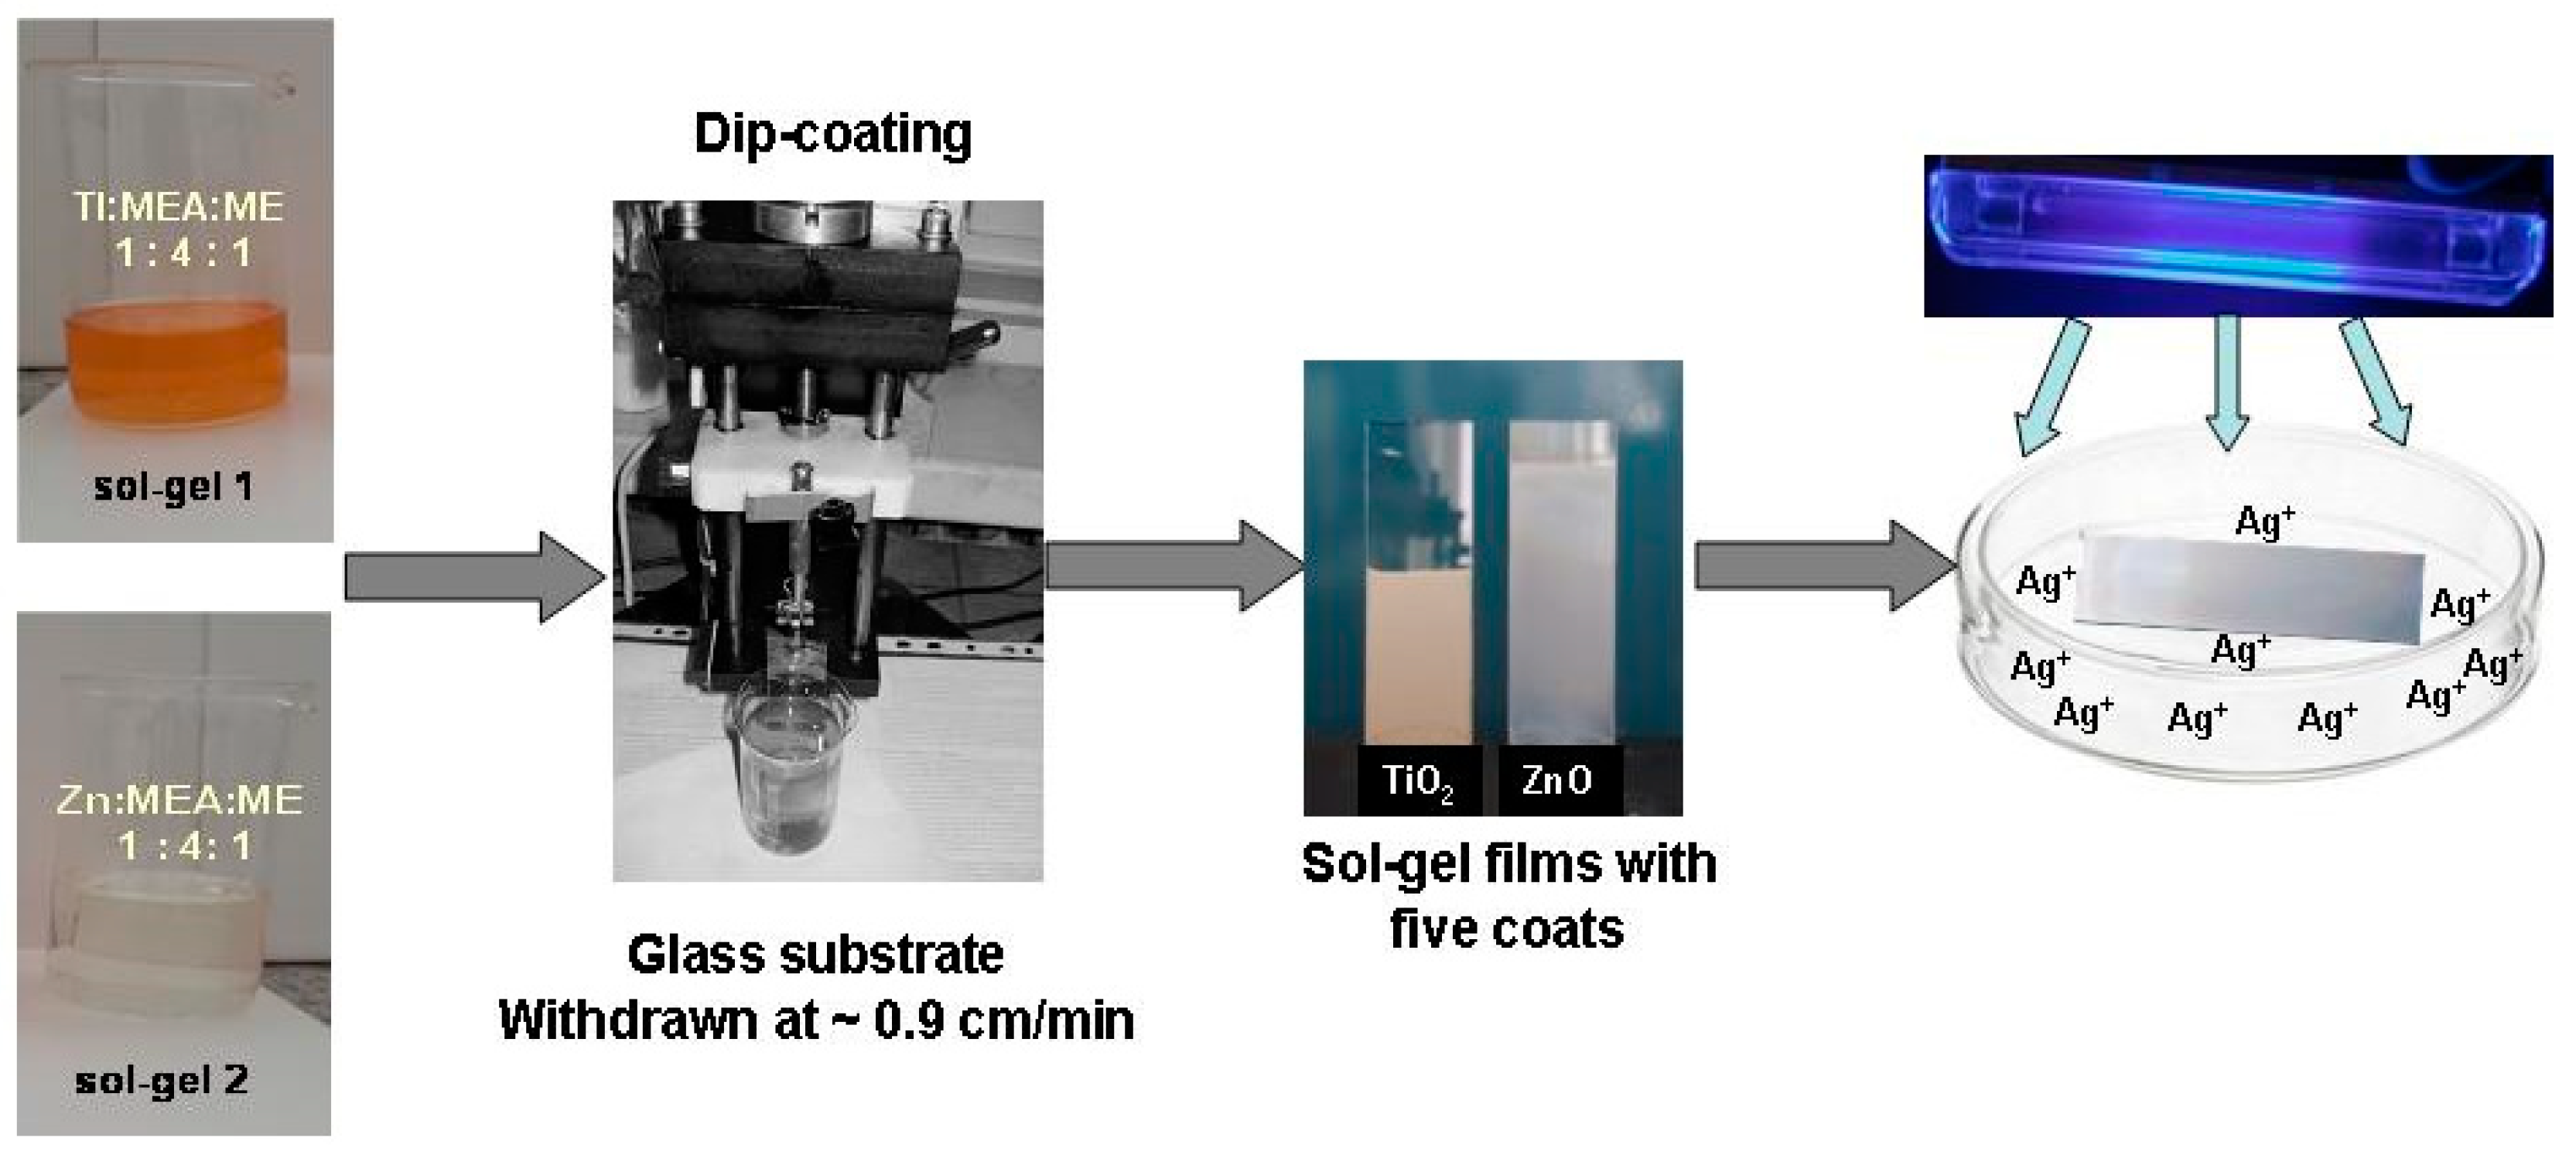
3. Materials and Methods

Nanostructure TiO2 and ZnO thin films were deposited by two sol–gel method procedures using the dip-coating technique on glass substrates (ca. 76 mm Ч 26 mm, ISO-LAB, Wertheim, Germany). Titanium (IV) isopropoxide (Sigma Aldrich, ≥97.0%, Bulington, MA, USA) and zinc acetate dehydrate (Fluka, >99.5%, Buchs, Switzerland) were used as the initial materials for both syntheses. 2-methoxyethanol (Fluka, >99.5%, Buchs, Switzerland) and monoethanolamine (MEA, Fluka, >99.5%, Buchs, Switzerland) were used as a solvent and a stabilizer, respectively. Titanium isopropoxide and zinc acetate dihydrate were dissolved in 2-methoxyethanol in a round-bottomed flask and stirred at room temperature for 15 min. The substances were mixed together with monoethanolamine (Ti:MEA:ME and Zn:MEA:ME, molar ratio 1:4:1). The two resulting solutions were stirred at 60 °C for 1 h to obtain clear and homogenous solutions and then were aged for 1 day at room temperature before application as coating solutions. No visible changes were observed in the solutions upon storing them at room temperature for at least 3–4 months (Figure 13).
The deposition of TiO2 and ZnO films consisted of dip-coating and drying of the material. The glass slides were immersed in the precursor sol and withdrawn at a speed of 0.9 cm/min at room temperature. The films were dried at 100 °C for 10 min after each successive coating to evaporate the solvent and remove organic compounds. After repeating the dip coating and drying procedures five times, the films were annealed at 500 °C for 1 h in the oven to enhance the crystallinity of the dried TiO2 and ZnO sol–gel films.
The heterostructures of TiO2/Ag and ZnO/Ag were prepared by a simple chemical photodeposition method for the first time. The pure semiconductor films were immersed in an aqueous silver nitrate solution with different molar concentrations (10−2–10−4 M) for 20 min in the presence of UV light illumination. After the photo-fixation, the TiO2/Ag and ZnO/Ag films were washed with distilled water and dried at 100 °C for 10 min in order to obtain the final films for the photocatalytic tests.
Powder X-ray diffraction (XRD) was used to confirm the purity and the crystallinity of the as-prepared films using a Siemens D500 (Karlsruhe, Germany)with CuKα radiation within a 2θ range of 20–80° at a step of 0.05° 2θ and a counting time of 2 s/step. The average crystallite sizes were estimated according to Scherrer’s equation. X-ray photoelectron measurements were carried out on an ESCALAB MkII (VG Scientific, now Thermo Scientific, (Manchester, UK) electron spectrometer with a base pressure in the analysis chamber of 5 × 10⁻¹⁰ mbar equipped with a twin-anode MgKα/AlKα non-monochromated X-ray source using excitation energies of 1253.6 and 1486.6 eV, respectively. The measurements were only provided with a AlKα non-monochromated X-ray source. The instrumental resolution was about 1 eV. The data were analyzed using the SpecsLab2 CasaXPS software (2.3.25PR1.). Because of electrostatic sample charging, the energy scale was calibrated by normalizing the Ti2p line to 458.5 eV for the titania-containing sample and that of Zn2p to 1022.0 eV for the zinc-containing sample, respectively. The processing of the measured spectra included a subtraction of the X-ray satellites and a Shirley-type background [37]. The peak positions and areas were evaluated by a symmetrical Gaussian–Lorentzian curve-fitting. The relative concentrations of the different chemical species were determined based on the normalization of the peak areas to their photoionization cross-sections, as calculated by Scofield [38].
The EPR spectra of TiO2 and ZnO were recorded at room temperature. TiO2:Ag and ZnO:Ag films were recorded at 298 K and 123 K with a JEOL JES-FA 100 EPR (Tokyo, Japan) spectrometer operating in the X-band with a standard TE011 cylindrical resonator. A Varied Temperature Controller ES-DVT4 (Tokyo, Japan) was used to record the EPR spectra at low temperatures. The desired temperature was achieved by sending cold gas (liquid nitrogen) to the sample area. The EPR spectra were detected at the following conditions: modulation frequency: 100 kHz, microwave power: 3 mW, modulation amplitude: 0.2 mT, time constant: 0.3 s and sweep time: 2 min.
Each film’s surface morphology was examined with a Hitachi TM4000 (Krefeld, Germany) with an accelerating voltage of 15 kV. The investigated samples were coated with gold by a JFC-1200 fine coater (JEOL, Krefeld, Germany) before observation. The optical transmittance spectra of these films were investigated with an Evolution 300 Thermo Scientific, UV–vis spectrophotometer in a range of 270–1000 nm.
The photocatalytic degradation of the malachite green (MG) and methylene blue (MB) was conducted at room temperature in a photoreactor (200 mL capacity) equipped with a magnetic stirrer (rotating speed controlled by stroboscope) and UV (Sylvania BLB18 W, 315–400 nm of emission range) and visible (150 W LED, V-Tac, emitting 5700 K white, 420–700 nm) lamps. The light power density at the film position was 0.66 mW/cm2 (measured with a research radiometer from Ealing Electro-optics, Inc., (Ettlingen, Germany). The concentration of the dyes after the different times of irradiation was measured using an Evolution 300 Thermo Scientific (Madison, USA), UV-visible spectrophotometer. The concentrations of MG and MB in the aqueous solutions were determined as a function of the irradiation time from the absorbance change at 615 and 666 nm corresponding to the maximum absorption wavelength of the dyes. The kinetics curves were plotted by measuring the concentration in 2 mL aliquots taken periodically. The photocatalytic efficiency D (%) was calculated by the following Equation (2):
D ( % ) = C O C C O 100
C0 is the initial concentration of the dyes and C is the concentration of the dyes after photo-illumination.
The experiments were carried out with four types of samples: pure semiconductor films and films modified with different concentrations of Ag+ (10−2, 10−3, 10−4 M) prepared with five coatings each. The effect of the concentration of Ag+ was evaluated. All photocatalytic tests were performed at a constant stirring rate (500 rpm) at room temperature (25 °C).
To investigate the stability of the pure and modified thin films, some of the photocatalytic experiments were repeated three times using a new dye solution in each measurement with the same 5 ppm concentration. All the photocatalytic results were reproducible, which allowed us to reach a conclusion about the stability of the films. No changes were observed in the morphology of the films, which we found by SEM analysis.
The total organic carbon (TOC) measurements were made for the treated dye solutions using a high-temperature (850 °C) catalytic oxidation method and and Elementar Vario Select TOC analyzer (Langenselbold, Germany). The observed standard deviation was calculated based on three measurements of each sample. The percentage of TOC removal was calculated using the following formula:
T O C ( % ) = T O C 0 T O C t T O C 0 100
where TOC0 is the initial TOC of the malachite green and methylene blue solution and TOCt is the final TOC at time t.

4. Conclusions

In conclusion, we successfully prepared a new, cost-effective and simple fabrication method of co-catalytic silver-modified TiO2 and ZnO sol–gel films using, for the first time, a combination of a dip-coating technique and the photo-fixation of silver ions onto the catalyst film surfaces. The modified nanostructure films had varying concentrations of Ag (10−2, 10−3, 10−4 M). The characterization showed that the semiconductors’ crystal structures were not affected by the modifying process. Both anatase and hexagonal wurtzite phases were identified by X-Ray diffraction. The UV–vis analysis showed that the TiO2/Ag and ZnO/Ag efficiently narrowed their band gaps to 3.1 and 3.21 eV, respectively. The prepared pure and co-catalytic modified catalysts were stable and recyclable and were active under UV light illumination. The trend of the degradation of malachite green in the TiO2 and ZnO species was as follows: 10−2 M Ag-modified > 10−3 M Ag-modified > 10−4 M Ag-modified > pure semiconductor. The photocatalytic results showed that the silver-modified TiO2 and ZnO thin films were promising materials for the degradation of the organic wastes present in polluted water.

Author Contributions

N.K.: methodology, investigation, data curation, writing—original draft, writing—reviewing scientific contents and editing. N.K., A.B., K.P.—All authors have read and agreed to the published version of the manuscript.

Funding

This research was funded by the Bulgarian NSF project KП-06-H59/11.

Data Availability Statement

Not applicable.

Acknowledgments

This work was financially supported by the Bulgarian NSF project KП-06-H59/11. The authors thank the their colleagues at the Faculty of Chemistry and Pharmacy (A. Apostolov, M. Tzvetkov), Institute of Catalysis, Bulgarian of Academic Science (H. Kolev, R. Mladenova) for the support in characterizing and analyses.

Conflicts of Interest

The authors declare no conflict of interest.

References

  1. Robinson, T.; McMullan, G.; Marchant, R.; Nigam, P. Remediation of dyes in textile effluent: A critical review on current treatment technologies with a proposed alternative. Bioresour. Technol. 2001, 77, 247–255. [Google Scholar] [CrossRef] [PubMed]
  2. Ajibade, F.O.; Adelodun, B.; Lasisi, K.H.; Fadare, O.O.; Ajibade, T.F.; Nwogwu, N.A.; Wang, A. Environmental pollution and their socioeconomic impacts. In Microbe Mediated Remediation of Environmental Contaminants; Woodhead Publishing: Cambridge, UK, 2021; pp. 321–354. [Google Scholar]
  3. Wallace, J.S. Increasing agricultural water use efficiency to meet future food production. Agric. Ecosyst. Environ. 2000, 82, 105–119. [Google Scholar] [CrossRef]
  4. Lahmar, H.; Benamira, M.; Douafer, S.; Messaadia, L.; Boudjerda, A.; Trari, M. Photocatalytic degradation of methyl orange on the novel hetero-system La2NiO4/ZnO under solar light. Chem. Phys. Lett. 2021, 742, 137132. [Google Scholar] [CrossRef]
  5. Sidra, B.; Awais, A.; Mohsin, A.R.A.; Abdul, H.; Muhammad, S.; Syed, S.S.; Abdullah, A.K. Photocatalytic degradation of malachite green and methylene blue over reduced graphene oxide (rGO) based metal oxides (rGO-Fe3O4/TiO2) nanocomposite under UV-visible light irradiation. J. Environ. Chem. Eng. 2021, 9, 105580. [Google Scholar]
  6. Dong, X.; Li, Y.; Li, D.; Liao, D.; Qin, T.; Prakash, O.; Kumar, A.; Liu, J. A new 3D 8-connected Cd(ii) MOF as a potent photocatalyst for oxytetracycline antibiotic degradation. CrystEngComm 2022, 24, 6933–6943. [Google Scholar] [CrossRef]
  7. Kaneva, N.; Bojinova, A.; Papazova, K.; Dimitrov, D.; Zaharieva, K.; Cherkezova-Zheleva, Z.; Eliyas, A. Effect of thermal and mechano-chemical activation on the photocatalytic efficiency of ZnO for drugs degradation. Arch. Pharm. Res. 2016, 39, 1418–1425. [Google Scholar] [CrossRef] [PubMed]
  8. Zheng, M.; Chen, J.; Zhang, L.; Cheng, Y.; Lu, C.; Liu, Y.; Singh, A.; Trivedi, M.; Kumar, A.; Liu, J. Metal organic frameworks as efficient adsorbents for drugs from wastewater. Mater. Today Commum. 2022, 31, 103514. [Google Scholar] [CrossRef]
  9. Rao, C.; Zhou, L.; Pan, Y.; Lu, C.; Qin, X.; Sakiyama, H.; Muddassir, H.; Liu, J. The extra-large calixarene-based MOFs-derived hierarchical composites for photocatalysis of dye: Facile syntheses and contribution of carbon species. J. Alloys Compd. 2022, 897, 163178. [Google Scholar] [CrossRef]
  10. Singh, A.; Singh, A.K.; Liu, J.; Kumar, A. Syntheses, design strategies, and photocatalytic charge dynamics of metal–organic frameworks (MOFs): A catalyzed photo-degradation approach towards organic dyes. Catal. Sci. Technol. 2021, 11, 3946–3989. [Google Scholar] [CrossRef]
  11. Kaneva, N.; Bojinova, A.; Papazova, K.; Dimitrov, D. Effect of the substrate on photocatalytic efficiency of ZnO for Malachite Green degradation. J. Chem. Tech. Metall. 2014, 49, 149–156. [Google Scholar]
  12. Simsek, E.B. Solvothermal synthesized boron doped TiO2 catalysts: Photocatalytic degradation of endocrine disrupting compounds and pharmaceuticals under visible light irradiation. Appl. Catal. B Environ. 2017, 200, 309–322. [Google Scholar] [CrossRef]
  13. Kumar, S.G.; Rao, K.S.R.K. Comparison of modification strategies towards enhanced charge carrier separation and photocatalytic degradation activity of metal oxide semiconductors (TiO2, WO3 and ZnO). Appl. Surf. Sci. 2017, 391, 124–128. [Google Scholar] [CrossRef]
  14. Jiang, G.; Li, X.; Wei, Z.; Jiang, T.; Du, X.; Chen, W. Growth of N-doped BiOBr nanosheets on carbon fibers for photocatalytic degradation of organic pollutants under visible light irradiation. Powder Technol. 2014, 260, 84–89. [Google Scholar] [CrossRef]
  15. Wang, N.; Zhou, Y.; Chen, C.; Cheng, L.; Ding, H. A g-C3N4 supported graphene oxide/Ag3PO4 composite with remarkably enhanced photocatalytic activity under visible light. Catal. Commun. 2016, 73, 74–79. [Google Scholar] [CrossRef]
  16. Pérez-González, M.; Tomás, S.A.; Santoyo-Salazar, J.; Gallardo-Hernández, S.; Tellez-Cruz, M.M.; Solorza-Feria, O. Sol-gel synthesis of Ag-loaded TiO2-ZnO thin films with enhanced photocatalytic activity. J. Alloys Compd. 2019, 779, 908–917. [Google Scholar] [CrossRef]
  17. Tao, J.; Gong, Z.; Yao, G.; Cheng, Y.; Zhang, M.; Lv, J.; Shi, S.; He, G.; Jiang, X.; Chen, X.; et al. Effects of hydrothermal time on the morphologies of rutile TiO2 hierarchical nanoarrays and their optical and photocatalytic properties. J. Alloys Compd. 2016, 688, 605–612. [Google Scholar] [CrossRef]
  18. Espino-Estévez, M.R.; Fernández-Rodríguez, C.; González-Díaz, O.M.; Araña, J.; Espinós, J.P.; Ortega-Méndez, J.A.; Doña-Rodríguez, J.M. Effect of TiO2–Pd and TiO2–Ag on the photocatalytic oxidation of diclofenac, isoproturon and phenol. Chem. Eng. J. 2016, 298, 82–95. [Google Scholar] [CrossRef]
  19. Rozyyev, V.; Murphy, J.G.; Barry, E.; Mane, A.U.; Sibener, S.J.; Elam, J.W. Vapor-phase grafting of a model aminosilane compound to Al2O3, ZnO, and TiO2 surfaces prepared by atomic layer deposition. Appl. Surf. Sci. 2021, 562, 149996. [Google Scholar] [CrossRef]
  20. Hakki, H.K.; Allahyari, S.; Rahemi, N.; Tasbihi, M. Surface properties, adherence, and photocatalytic activity of sol–gel dip-coated TiO2–ZnO films on glass plates. CR Chim. 2019, 22, 393–405. [Google Scholar] [CrossRef]
  21. Pérez-González, M.; Tomás, S.A.; Santoyo-Salazar, J.; Morales-Luna, M. Enhanced photocatalytic activity of TiO2-ZnO thin films deposited by dc reactive magnetron sputtering. Ceram. Int. 2017, 43, 8831–8838. [Google Scholar] [CrossRef]
  22. Fouad, S.S.; Parditka, B.; Atyia, H.E.; Baradács, E.; Bekheet, A.E.; Erdélyi, Z. AC conductivity and dielectric parameters studies in multilayer TiO2/ZnO thin films produced via ALD technique. Chin. J. Phys. 2022, 77, 73–80. [Google Scholar] [CrossRef]
  23. Brinker, C.J.; Scherer, G.W. Sol-Gel Science—The Physics and Chemistry of Sol-Gel Processing, 3rd ed.; Academic Press: San Diego, CA, USA; London, UK, 1991; pp. 1–881. [Google Scholar]
  24. Perumal, S.; Gnana, C. Synthesis and characterization studies of solvothermally synthesized undoped and Ag-doped TiO2 nanoparticles using toluene as a solvent. J. Eng. Res. 2014, 4, 184–187. [Google Scholar]
  25. Yıldırım, O.A.; Unalan, H.E.; Durucan, C. Highly efficient room temperature synthesis of silver-doped zinc oxide (ZnO: Ag) nanoparticles: Structural, optical, and photocatalytic properties. J. Am. Ceram. Soc. 2013, 96, 766–773. [Google Scholar] [CrossRef]
  26. Pargar, F.; Kolev, H.; Koleva, D.; Breugel, K. Potentiometric Response of Ag/AgCl Chloride Sensors in Model Alkaline Medium. Adv. Mat. Sci. Eng. 2018, 3, 8135492. [Google Scholar] [CrossRef] [Green Version]
  27. Todorova, S.; Kolev, H.; Shopska, M.; Kadinov, G.; Holgado, G.; Caballero, A. Silver-based catalysts for preferential CO oxidation in hydrogen-rich gases (PROX). Bulg. Chem. Commun. 2018, 50, 17–23. [Google Scholar]
  28. Bhatt, B.C.; Dhabekar, B.; Kumar, R.; Gundu Rao, T.K.; Lakshmanan, A.R. Defect centres and thermoluminescence in CaSO4:Dy, Ag phosphor. Radiat. Prot. Dosim. 2006, 119, 53–56. [Google Scholar] [CrossRef]
  29. Coronado, J.M.; Maira, A.J.; Conesa, J.C.; Yeung, K.L.; Augugliaro, V.; Soria, J. EPR Study of the Surface Characteristics of Nanostructured TiO2 under UV Irradiation. Langmuir 2001, 17, 5368–5374. [Google Scholar] [CrossRef]
  30. Singh, R.; Barman, P.B.; Sharma, D. Synthesis, structural and optical properties of Ag doped ZnO nanoparticles with enhanced photocatalytic properties by photo degradation of organic dyes. J. Mater. Sci. Mater. Electron. 2017, 28, 5705–5717. [Google Scholar] [CrossRef]
  31. Kotlhao, K.; Mtunzi, F.M.; Pakade, V.; Laloo, N.; Ejidike, I.P.; Modise, S.J.; Moutloali, R.M.; Klink, M.J. Enhancing the photocatalytic degradation of selected chlorophenols using Ag/ZnO nanocomposites. MRS Adv. 2018, 3, 2129–2136. [Google Scholar] [CrossRef]
  32. Szabó-Bárdos, E.; Czili, H.; Horváth, A. Photocatalytic oxidation of oxalic acid enhanced by silver deposition on a TiO2 surface. J. Photochem. Photobiol. A 2003, 154, 195–201. [Google Scholar] [CrossRef]
  33. Houas, A.; Lachheb, H.; Ksibi, M.; Elaloui, E.; Guillard, C.; Herrmann, M. Photocatalytic Degradation Pathway of Methylene Blue in Water. Appl. Cat. B Environ. 2001, 31, 145–157. [Google Scholar] [CrossRef]
  34. Ju, Y.; Qiao, J.; Peng, X.; Xu, Z.; Fang, J.; Yang, S.; Sun, C. Photodegradation of malachite green using UV–vis light from two microwave-powered electrodeless discharge lamps (MPEDL-2): Further investigation on products, dominant routes and mechanism. Chem. Eng. J. 2013, 221, 353–362. [Google Scholar] [CrossRef]
  35. Ray, S.K.; Dhakal, D.; Lee, S. Insight into Malachite Green Degradation, Mechanism and Pathways by Morphology-Tuned α-NiMoO4 Photocatalyst. Photochem. Photobiol. 2018, 94, 552–563. [Google Scholar] [CrossRef] [PubMed]
  36. Nayak, S.; Das, K.; Parida, K. Indulgent of the physiochemical features of MgCr-LDH nanosheets towards photodegradation process of methylene blue. J. Colloid Interface Sci. 2023, 634, 121–137. [Google Scholar] [CrossRef] [PubMed]
  37. Shirley, D. High-Resolution X-Ray Photoemission Spectrum of the Valence Bands of Gold. Phys. Rev. B 1972, 5, 4709–4714. [Google Scholar] [CrossRef] [Green Version]
  38. Scofield, J.H. Hartree-Slater subshell photoionization cross-sections at 1254 and 1487 eV. J. Electron. Spectrosc. Relat. Phenom. 1976, 8, 129–137. [Google Scholar] [CrossRef]
Figure 1. XRD patterns of semiconductor films: TiO2 and TiO2/Ag (a), ZnO and ZnO/Ag (b).
Catalysts 13 00245 g001
Figure 2. High-resolution XPS spectra of Ag3d (a) and AgMNN (b) lines measured for Ag/TiO2 film.
Catalysts 13 00245 g002
Figure 3. High-resolution XPS spectra of Ag3d (a) and AgMNN lines measured for Ag/ZnO (b) film.
Catalysts 13 00245 g003
Figure 4. Low-temperature (123 K) EPR spectra of Ag-modified ZnO and TiO2 (A); room-temperature (298 K) EPR spectra of pure ZnO and TiO2 (B).
Catalysts 13 00245 g004
Figure 5. SEM images of TiO2 (a), TiO2/Ag (b), ZnO (c) and ZnO/Ag (d) films.
Catalysts 13 00245 g005
Figure 6. UV–visible patterns of semiconductor films: TiO2 and TiO2/Ag (a), ZnO and ZnO/Ag (b).
Catalysts 13 00245 g006
Figure 7. Linear plots of (αhv)2 versus Eg for semiconductors films: TiO2 and TiO2/Ag (a), ZnO and ZnO/Ag (b), calculated by Equation (1).
Catalysts 13 00245 g007
Figure 8. Logarithmic graphs of malachite green concentration vs. illumination time in the presence of TiO2 and TiO2/Ag (a). ZnO and ZnO/Ag (b) sol–gel films. (c) Probable mechanism of photocatalysis in the co-catalytic Ag-modified TiO2 and ZnO under UV light illumination.
Catalysts 13 00245 g008
Figure 9. Absorbance spectra of the degradation of malachite green using ZnO (a) and ZnO/Ag (b) films.
Catalysts 13 00245 g009
Figure 10. Photocatalytic activity of pure semiconductor and silver-modified (10−2 M) films for degradation of malachite green under (a) UV light, (b) visible illumination and (c) darkness. The initial dye concentration is 5 ppm.
Catalysts 13 00245 g010
Figure 11. Photocatalytic degradation of the organic dyes: Malachite Green (a) and Methylene Blue (b), using pure and co-catalytic Ag+ (10−2 M)-modified semiconductor films.
Catalysts 13 00245 g011
Figure 12. Histograms of TOC conversion after 4 hours of UV illumination.
Catalysts 13 00245 g012
Figure 13. Schematic diagram of sol–gel method for the synthesis of pure and co-catalytic Ag-modified films.
Catalysts 13 00245 g013
Table 1. The structural parameters calculated from XRD patterns of the films.
SampleUnit Cell Parameters, ÅCrystallite Size, nmMicrostrains,
×10−3 a.u.
TiO2a = b = 3.7873; c = 9.507531.27.6
TiO2/Aga = b = 3.7795; c = 9.498626.96.7
ZnOa = b = 3.2524; c = 5.212448.40.9
ZnO/Aga = b = 3.2518; c = 5.210542.90.8
Disclaimer/Publisher’s Note: The statements, opinions and data contained in all publications are solely those of the individual author(s) and contributor(s) and not of MDPI and/or the editor(s). MDPI and/or the editor(s) disclaim responsibility for any injury to people or property resulting from any ideas, methods, instructions or products referred to in the content.

