

Molecular Insights into Substrate Binding of the Outer Membrane Enzyme OmpT


1
Department of Food Science, Foshan University, Foshan 528231, China
2
Laboratoire de Biochimie Théorique, CNRS, Université Paris Cité, 13 rue Pierre et Marie Curie, F-75005 Paris, France
*
Author to whom correspondence should be addressed.
Catalysts 2023, 13(2), 214; https://doi.org/10.3390/catal13020214
Submission received: 30 November 2022
/
Revised: 12 January 2023
/
Accepted: 14 January 2023
/
Published: 17 January 2023
(This article belongs to the Topic Advances in Enzymes and Protein Engineering)
Abstract
:The enzyme OmpT of the outer membrane of Escherichia coli shows proteolytic activity and cleaves peptides and proteins. Using molecular dynamics simulations in a fully hydrated lipid bilayer on a time scale of hundreds of nanoseconds, we draw a detailed atomic picture of substrate recognition in the OmpT-holo enzyme complex. Hydrogen bonds and salt bridges are essential for maintaining the integrity of the active site and play a central role for OmpT in recognizing its substrate. Electrostatic interactions are critical at all stages from approaching the substrate to docking at the active site. Computational alanine scanning based on the Molecular Mechanics Generalized Born Surface Area (MM-GBSA) approach confirms the importance of multiple residues in the active site that form salt bridges. The substrate fluctuates along the axis of the β-barrel, which is associated with oscillations of the binding cleft formed by the residue pairs D210-H212 and D83-D85. Principal component analysis suggests that substrate and protein movements are correlated. We observe the transient presence of putative catalytic water molecules near the active site, which may be involved in the nucleophilic attack on the cleavable peptide bond of the substrate.
1. Introduction
OmpT is a bacterial outer membrane enzyme of Escherichia coli that owes its name to the fact that its expression is temperature dependent [1]. The enzymatic function of OmpT is to digest peptides and proteins, preferably by cleavage of a pair of adjacent basic amino acids [2]. This proteolytic activity is probably involved in DNA excision repair [3] and in the degradation of antimicrobial peptides [4]. OmpT is part of a unique family of integral outer membrane proteases (Omptin). Such omptins exist, for instance, in Salmonella enterica and Yersinia pestis [5,6]. To identify the active site residues that maintain the proteolytic activity of E. coli OmpT, site-directed mutagenesis was performed. Initially, residues S99 and H212 were identified as essential active site residues [7]. Later, catalytic residues D83, D85, D210, and H212 were shown to strongly affect enzymatic activity [8].
The structure of OmpT was determined at 2.6 Å resolution by an X-ray diffraction study, which showed that it contained a ten-stranded antiparallel β-barrel extending far from the lipid bilayer into the extracellular space [9]. The proteolytic site is located in a groove consisting of the extracellular end of the β-barrel. The residue pairs D83-D85 and H212-D210 are located on opposite sides of the active site pocket, ~5 Å apart. The structure suggests that OmpT should not be classified as a serine protease, because the putative catalytic residues S99 and H212 are too far apart (~9 Å) compared to other serine proteases. An alternative proteolytic mechanism was proposed in which a water molecule between D83 and H212 could perform the nucleophilic attack on the cleavable peptide bond. Subsequently, the structure of the related plasminogen activator Pla from Yersinia pestis was determined by an X-ray diffraction study with a resolution of 1.9 Å and the enzyme activity was determined [10]. Pla also belongs to the omptins, and is 50% identical in sequence to OmpT. The structure provides a model for the interaction of Pla with plasminogen substrate. Residues E29, D204, D206, and E217 of Pla can form a negatively charged pocket that is important for recognition of the arginine side chain of the substrate. A water molecule destined for nucleophilic attack on the substrate is located between residues D84 and H208 in the active site. Several other water molecules play an important role in enzymatic activity by linking the residues in the catalytic active site.
Molecular dynamics simulations (MD) are a valuable tool for studying membrane proteins. They are widely used to study the conformational dynamics of membrane proteins in their lipid bilayer environment [11,12,13,14,15]. MD can be used for detailed studies of the recognition mechanism between a receptor and its ligand [16]. In a previous MD study of the OmpT apo enzyme embedded in a lipid bilayer, we showed that the residues in the active site were stabilized by hydrogen bonds and that residues H212 and D83 in particular were frequently bridged by hydrogen bonds. The active site of OmpT remained intact during the simulation, as was observed for related outer membrane enzymes in a comparative study [17]. A model of the holo-enzyme structure obtained by docking the peptide substrate ARRA to OmpT suggested that water molecules might play a role in attacking the carbon atom of the C=O group of the cleavable peptide bond. Subsequently, hybrid coarse-grained (CG)/MM simulations [18] were used to study this holo-enzyme ARRA-OmpT complex so that longer time scales could be sampled at a lower resolution. The simulations showed that the large-scale protein movements affect the function of the enzyme. An important influence of residues S99 and H212 on enzymatic activity was explored by CG/MM simulations of S99A and H212A mutants.
Apart from this earlier study and a docking model with the aprotinin inhibitor [19], to our knowledge, there is currently neither an experimental structure nor a theoretical model of an omptin with bound ligand. Such a model would be very valuable, for example, for designing mutation experiments or for developing further inhibitors. The present study follows up on these previous investigations to refine, validate and complement the earlier model with new analyses. We aim to confirm these results in a fully hydrated lipid bilayer environment and to provide more in-depth analysis of the molecular interactions stabilized during a molecular dynamics simulation.
To obtain detailed insights into the molecular recognition between ligand and receptor [16], we simulated the ARRA-OmpT complex at atomic resolution. This approach allowed us to address some interesting open questions. We focus in particular on the mechanism used by OmpT in recognizing its substrate to obtain a detailed picture of the interactions in the active site. We are partially investigating the role of water, but ultimately quantum chemical approaches are needed to definitively assess whether water plays a role in attacking the substrate’s cleavable peptide bond. In this study, we perform a hundred nanosecond simulation of the ARRA-OmpT-holo enzyme complex. We investigate the substrate mobility within the active site as well as the active site movement modes during the simulation. To investigate the substrate recognition mechanism of OmpT and quantify substrate binding, computational alanine scanning based on the Molecular Mechanics Generalized Born Surface Area (MM-GBSA) approach was used. These energetic data are complemented by umbrella sampling of the ARRA and AKKA ligand. We examine the putative catalytic water molecules around the active site and the likelihood that they act as nucleophilic attackers of the substrate.
2. Results
2.1. Structural Drift and Stability of the Enzyme–Substrate Complex
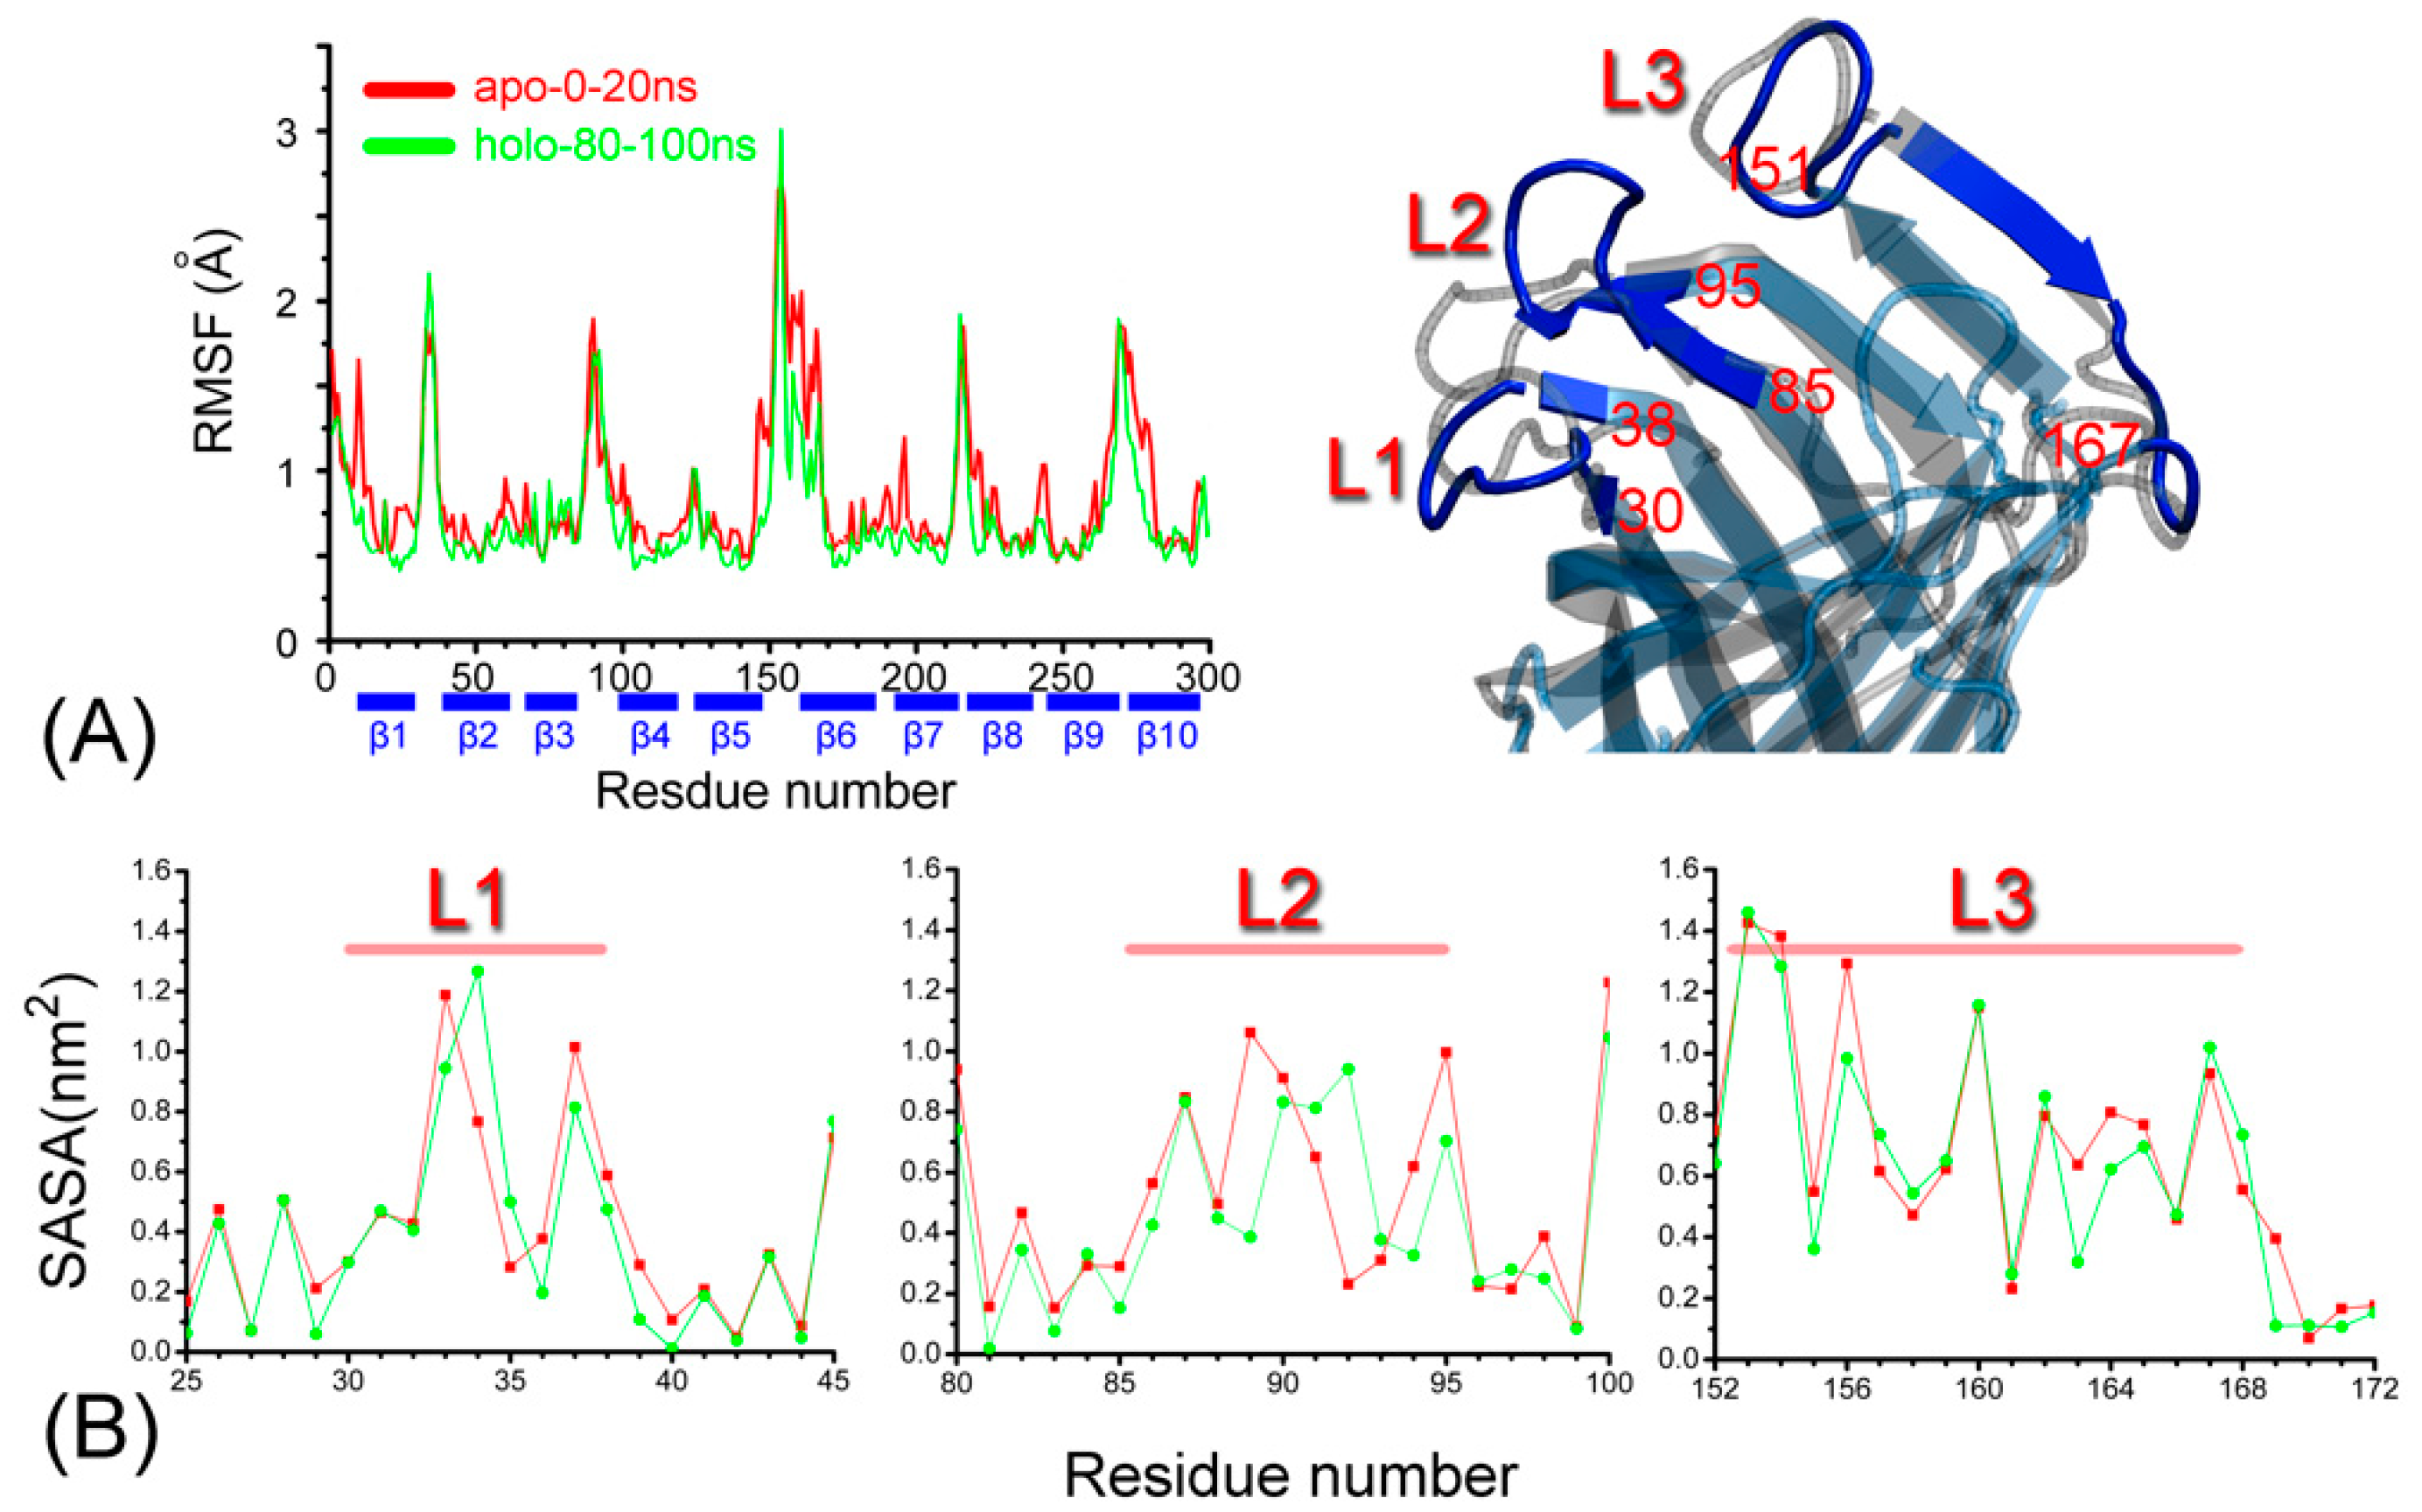
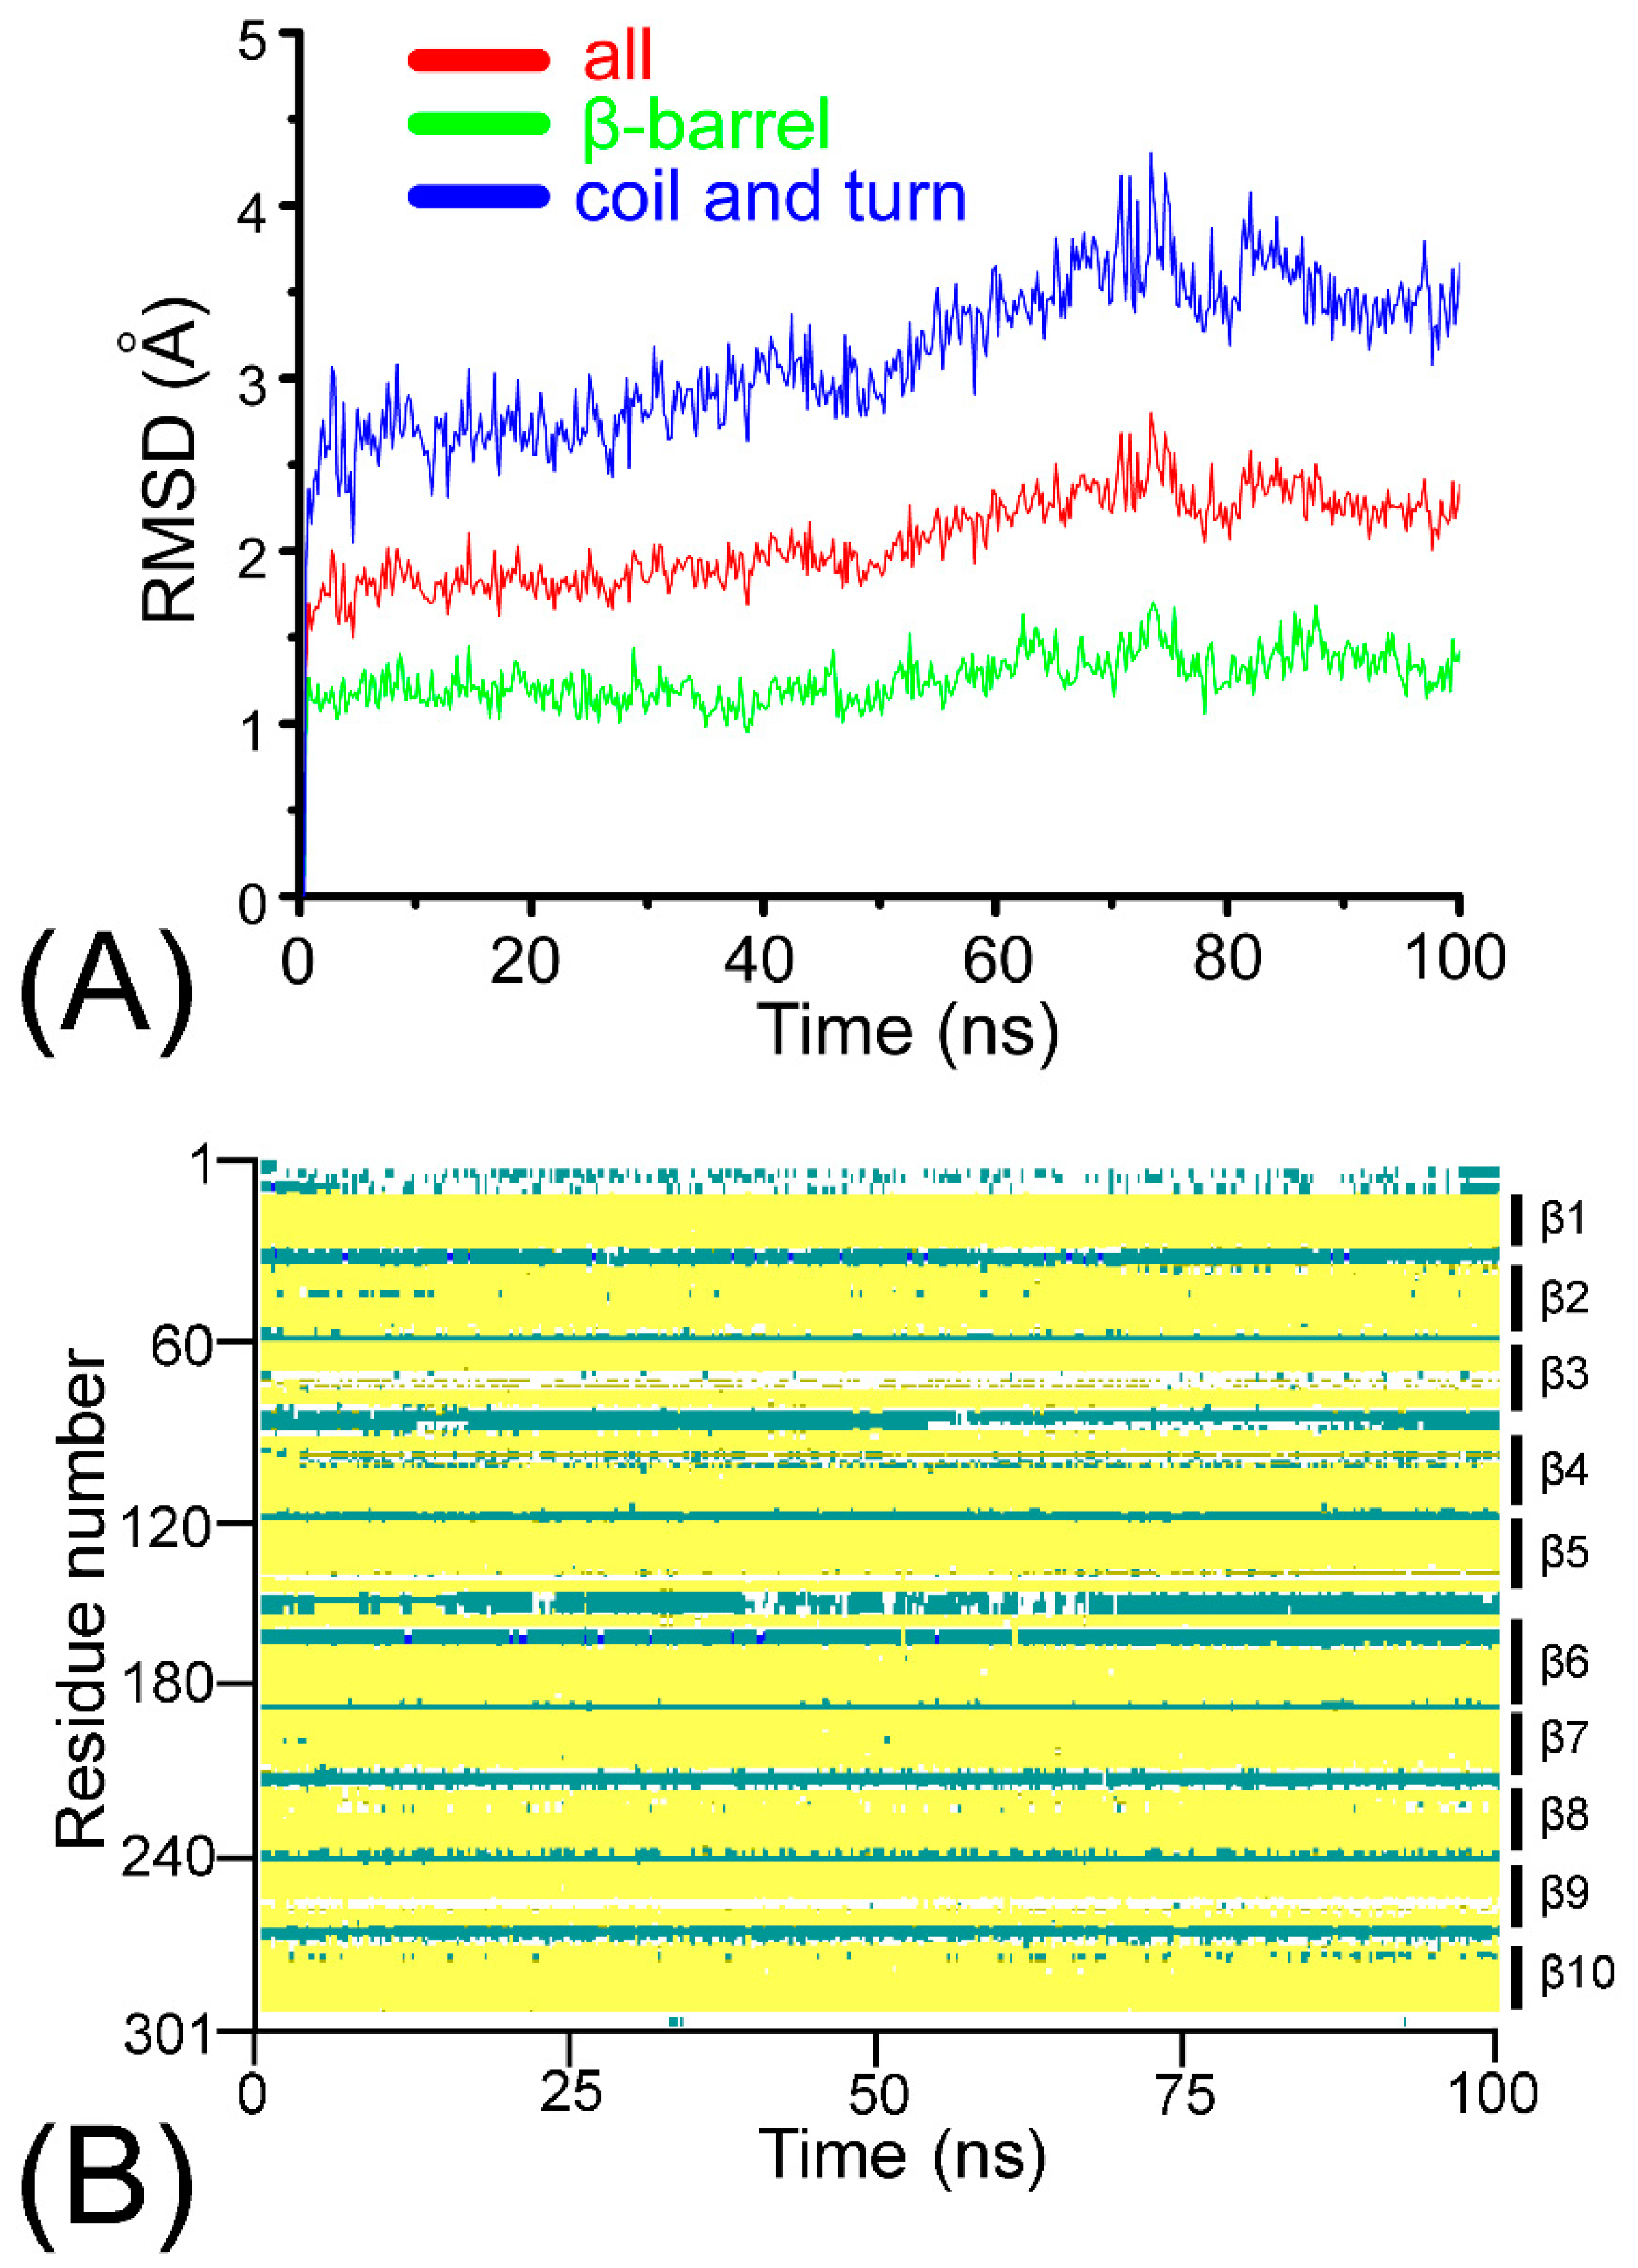
To assess the stability of the ARRA-OmpT complex, we observed its fluctuations and its structural drift with respect to the initial structure of the production MD simulation (see Figure 1A and Figure A1 in Appendix A). At the end of the simulation, the root mean square deviation (RMSD) of the Cα-structure reaches a plateau of just over 2 Å, while the RMSD of the β-barrel is ~0.5 Å lower, consistent with previous reports of its stability [13,20]. The coil and turn regions, which comprise large extracellular loops, exhibit the highest structural drift. Secondary structural analysis confirmed the structural integrity of the ARRA-OmpT complex as described in Appendix A1 (see Figure A1B), with the β-barrel and turn regions maintaining their structure throughout the simulation. Overall, these results indicate the formation of a stable ARRA-OmpT complex. Next, we compare the conformational fluctuations in apo- vs. holo-OmpT. Figure 1A shows the root mean square Cα-fluctuations (RMSFs) as a function of the number of residues in the last 20 ns of the holo simulation compared with the 20 ns simulation of the apo enzyme. Overall, both forms of the enzyme exhibited a very similar fluctuation pattern, suggesting that the presence of the substrate does not significantly affect the dynamics of the rigid barrel scaffold. The pattern reflects a classic alternating fluctuation scheme often observed for such β-barrels, in which the barrel region exhibits minimal dynamics, and the connecting loops or coils show increased flexibility. In fact, the most pronounced comparative fluctuations are observed in the loop regions, while the β-barrels consistently exhibit low fluctuations, with loop L3 showing a broader fluctuation pattern compared to all of the others. Some subtle differences can be observed near the loop regions, but cannot be interpreted without expanding the sampling timescale. Loops L1 to L3 have different conformations in both simulations, as shown in Figure 1B.
2.2. Substrate Mobility towards a Stable Pose within the Active Site
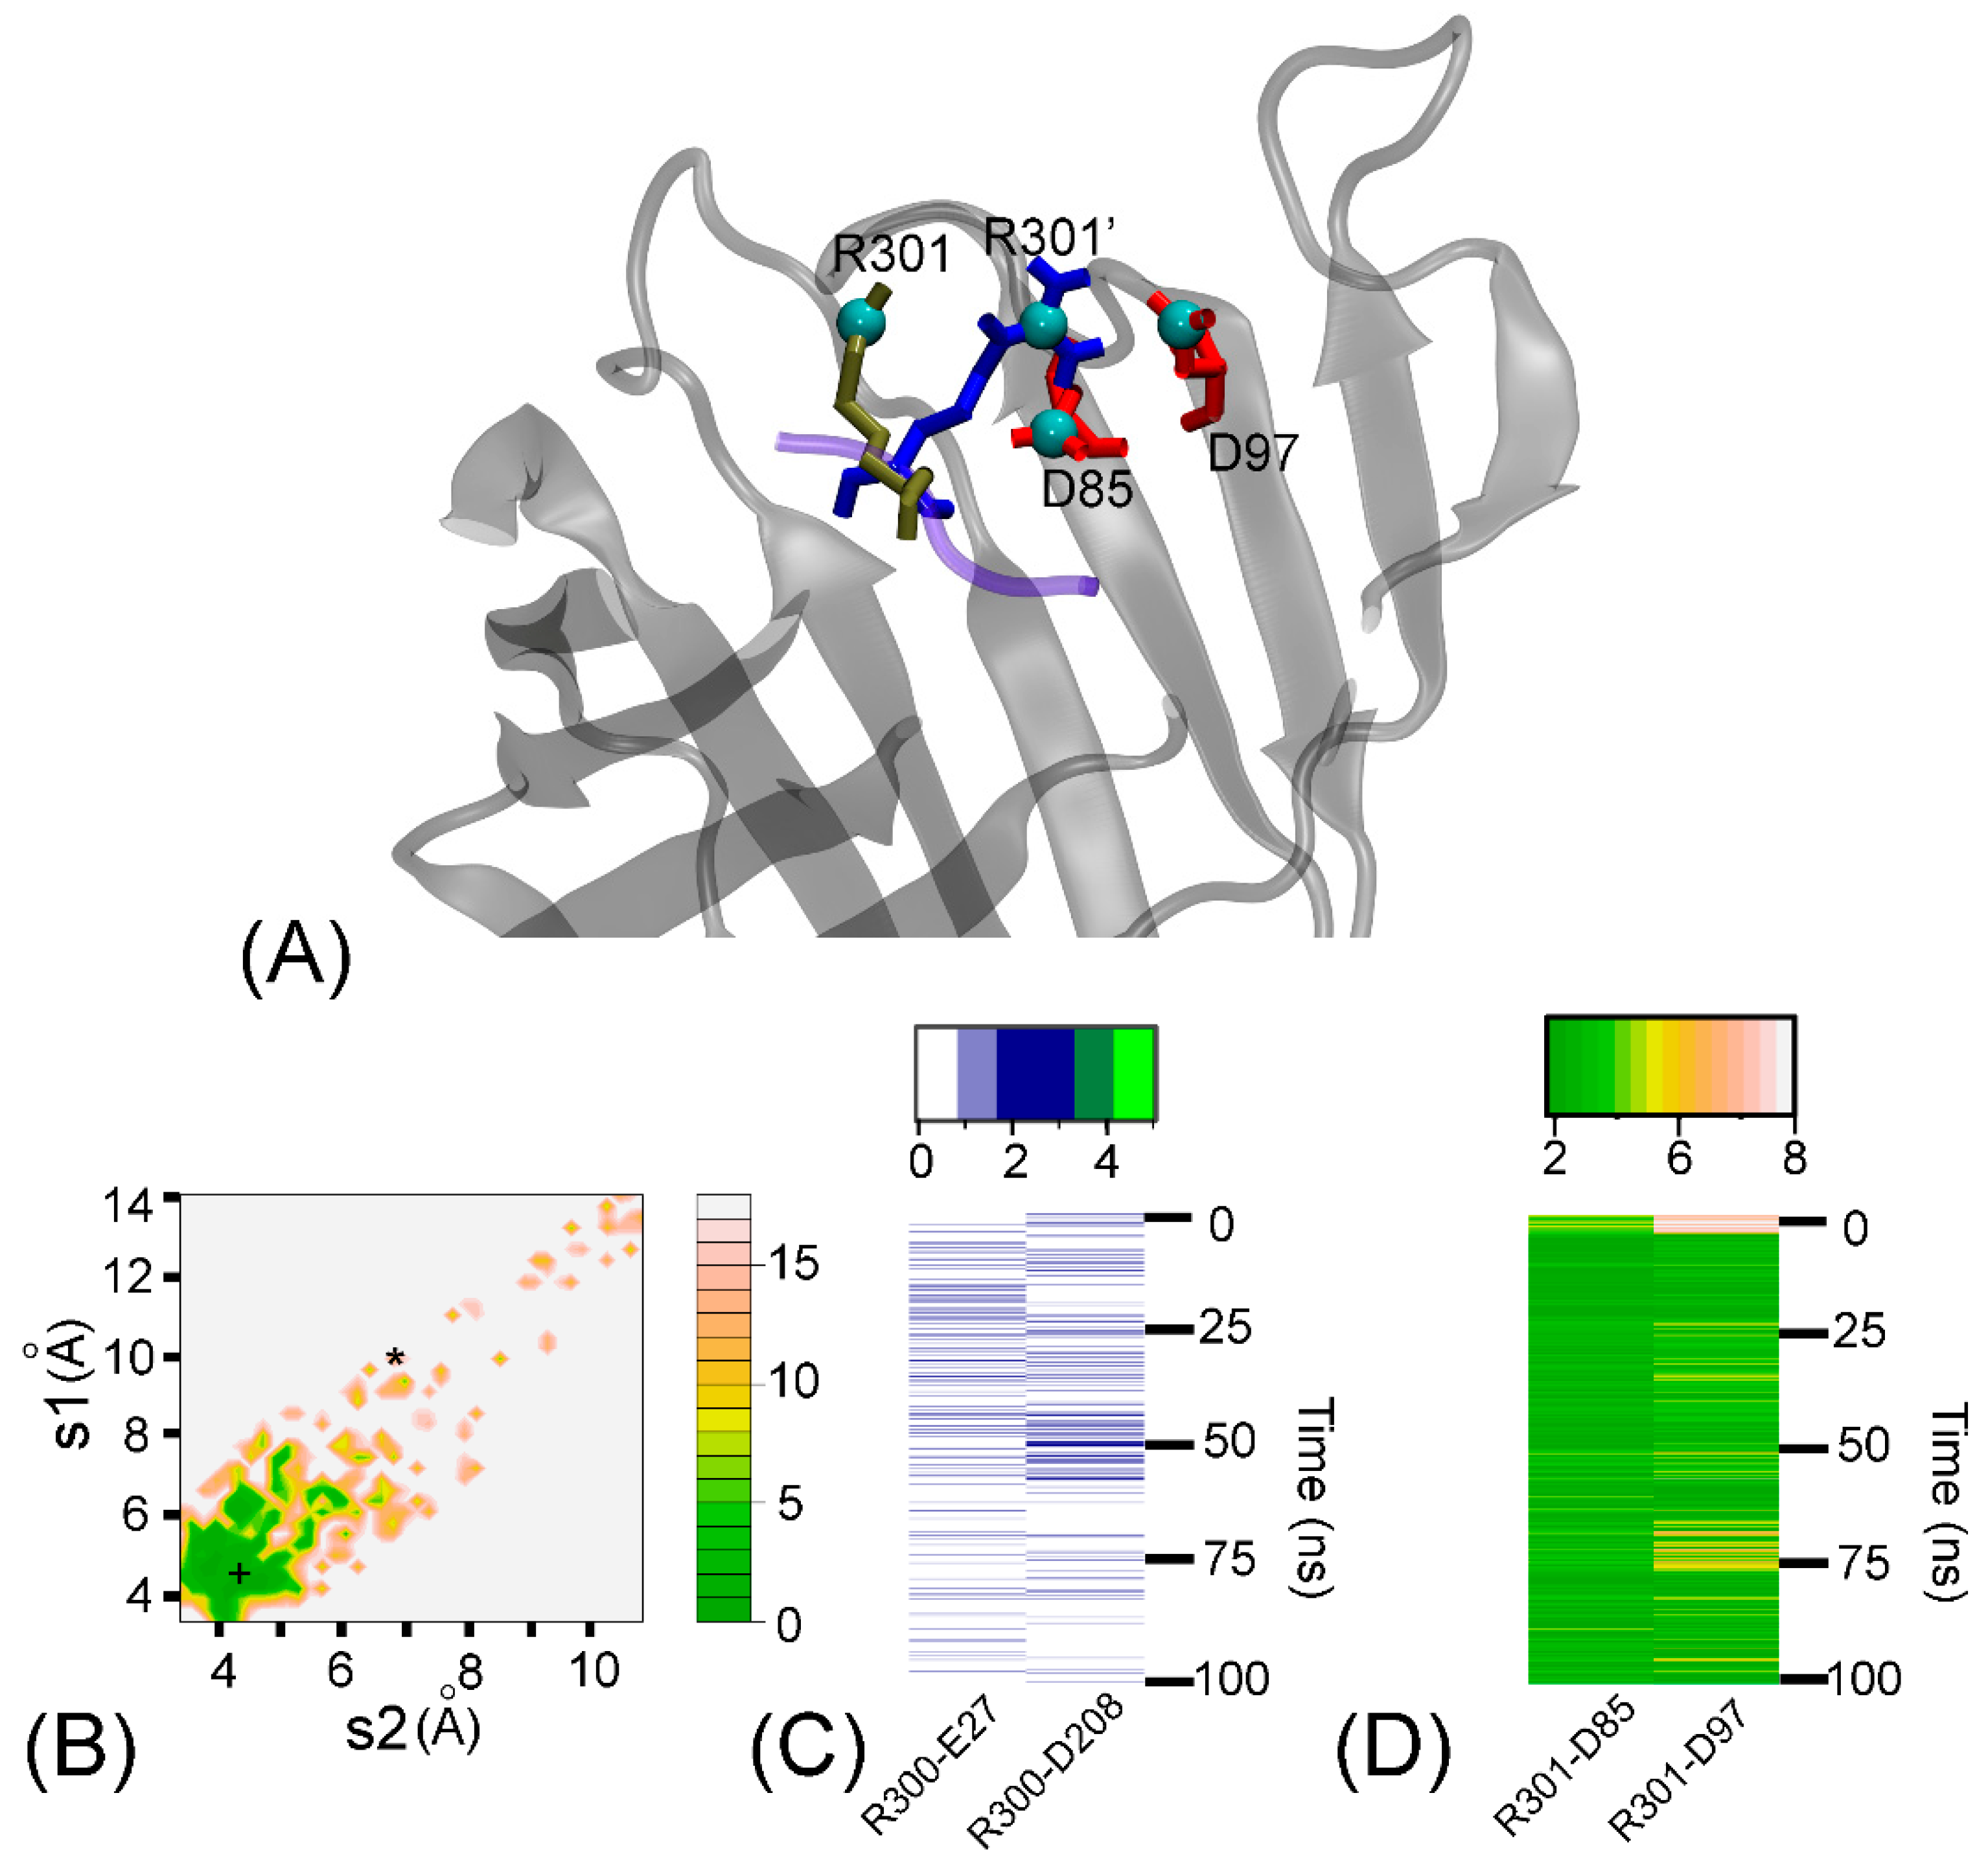
To better understand how OmpT recognizes the R301 residue of the ARRA substrate, we analyzed its position near the presumed binding site, which includes residues D85 and D97, as a function of time (Figure 2A). Using two distances, s1 between atoms R301@CZ and D97@ CG and s2 between atoms R301@CZ and D85@ CG, we plotted the corresponding potential of the average force in Figure 2B. The minimum of the free energy is at (5 Å, 4.5 Å). At the beginning of the simulation, the conformation is far from this minimum, and is at (9.8 Å, 6.9 Å), while the final structure settles at (4.3 Å, 4.3 Å). The pronounced energy minimum on the free energy contour map indicates a significant interaction between R301 and both D97 and D85. We will see later that these two distances make the largest contribution to the binding affinity of R301. In addition to salt bridges, side-chain:side-chain hydrogen bonds were observed in the R300-E27 and R300-D208 residue pairs (Figure 2C). The R301-D97 and R301-D85 interactions were maintained by tight salt bridges (Figure 2D).
2.3. Active Site Modes of Motion Assist Biological Function
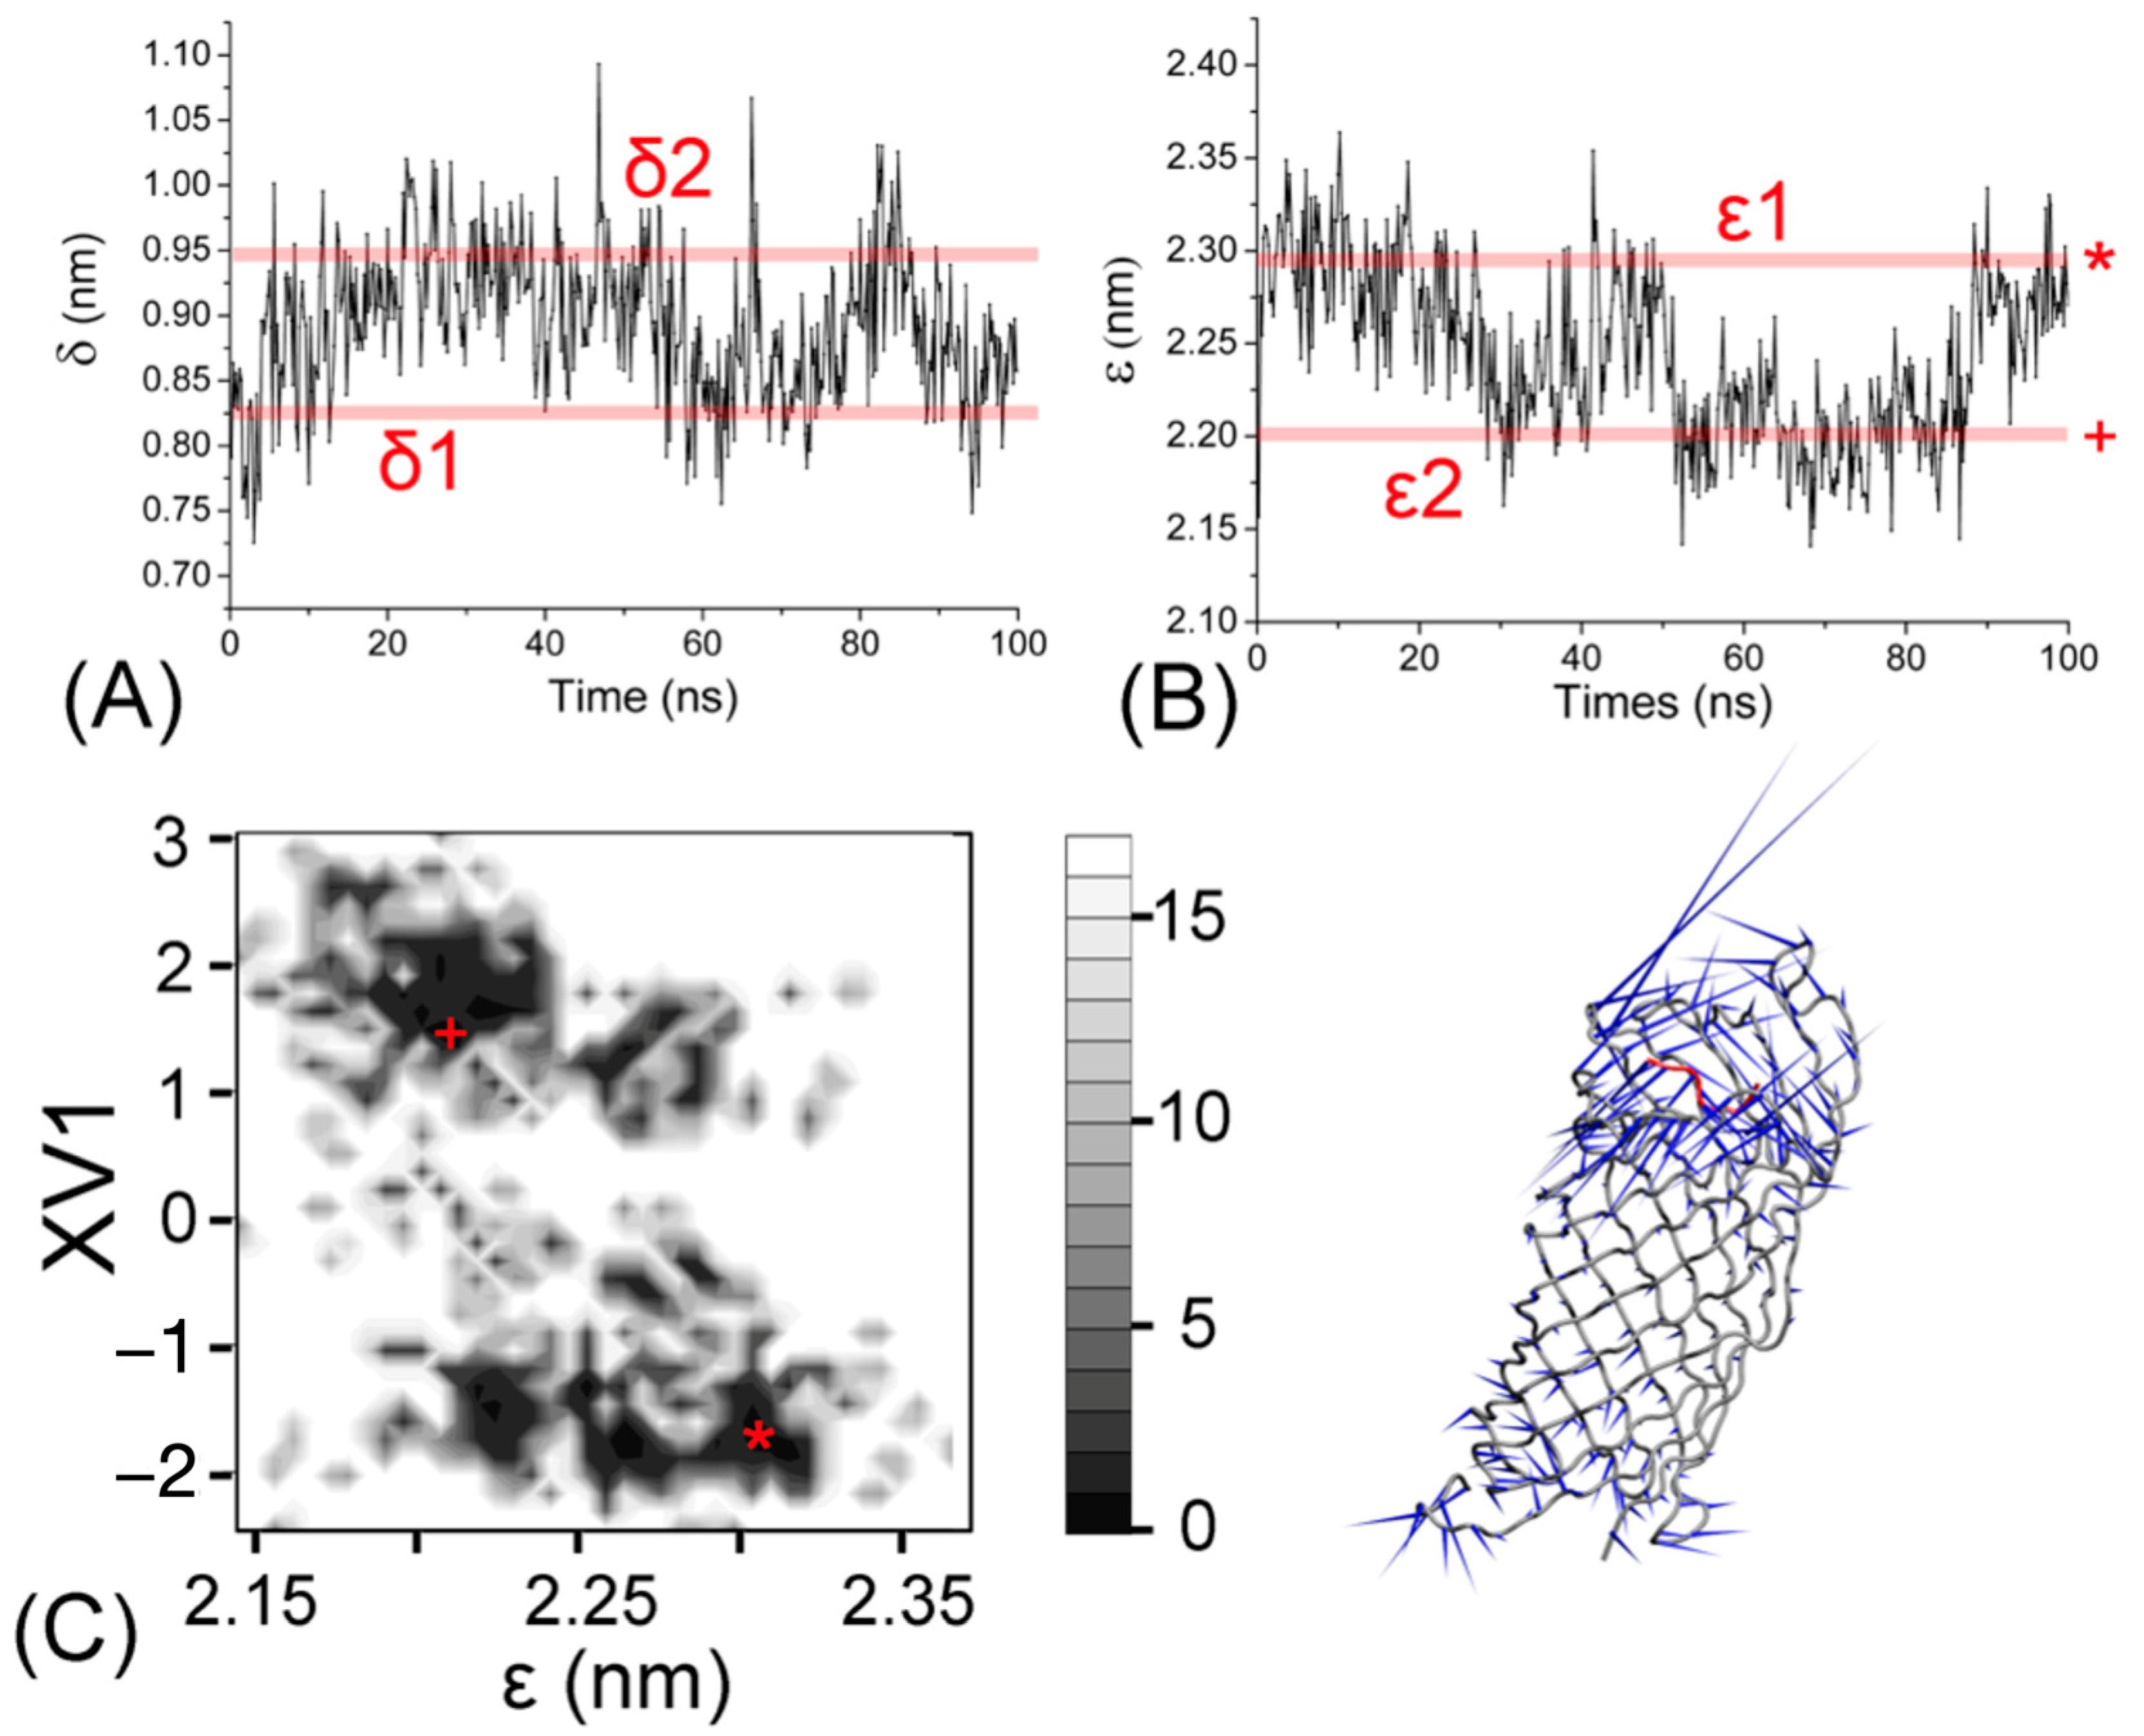
To better understand the structural fluctuations of the ligand within the active site, we calculated the time series of the distances between the catalytic dyad and the substrate. As in our previous work [18], we defined two distances δ and ε from the center of mass of the ARRA peptide, representing the “horizontal” distance δ with respect to the center of mass of the D210-H212 residue pair and the “vertical” distance ε with respect to the center of mass of the entire β-barrel, respectively. The two residue pairs D210-H212 and D83-D85 define the barrel opening and their width has a direct influence on the δ-distance. The interactions of the “catalytic” water with the ARRA peptide observed near residues H212 and D83 (see below) affect the ε-distance. Therefore, these two distances can be used to describe “active” enzyme conformations. Figure 3A,B show that in the first 30 ns of the simulation, the δ-distance increases from 8.2 Å (δ1) to 9.5 Å (δ2), whereas the ε-distance decreases from 23 Å (ε1) to 22 Å (ε2). At these initial stages of the simulation, vibration of the ligand in the horizontal and vertical directions results in a change in the binding cleft associated with increased penetration of the ARRA peptide within the β-barrel. At this stage, the change in δ- and ε-gaps is clearly correlated. From Figure 3B, we can further see that ε1 and ε2 represent two main width distributions occurring during the simulation period. These two principal degrees of opening capture the dominant oscillation of the ligand along the barrel axis. We performed a principal component analysis to investigate whether this gap oscillation is correlated with the movements of the OmpT protein. Figure 3C shows that the first largest eigenvector (V1) is significantly correlated with the ε-distance, with the two most populated regions corresponding to ε1(*) and ε2(+). The movement of the first eigenvectors is visualized using a “porcupine” plot and indicates obvious conformational changes in the ligand binding and active site regions.
2.4. Active Site Intactness Emphasizes a Tight Complex
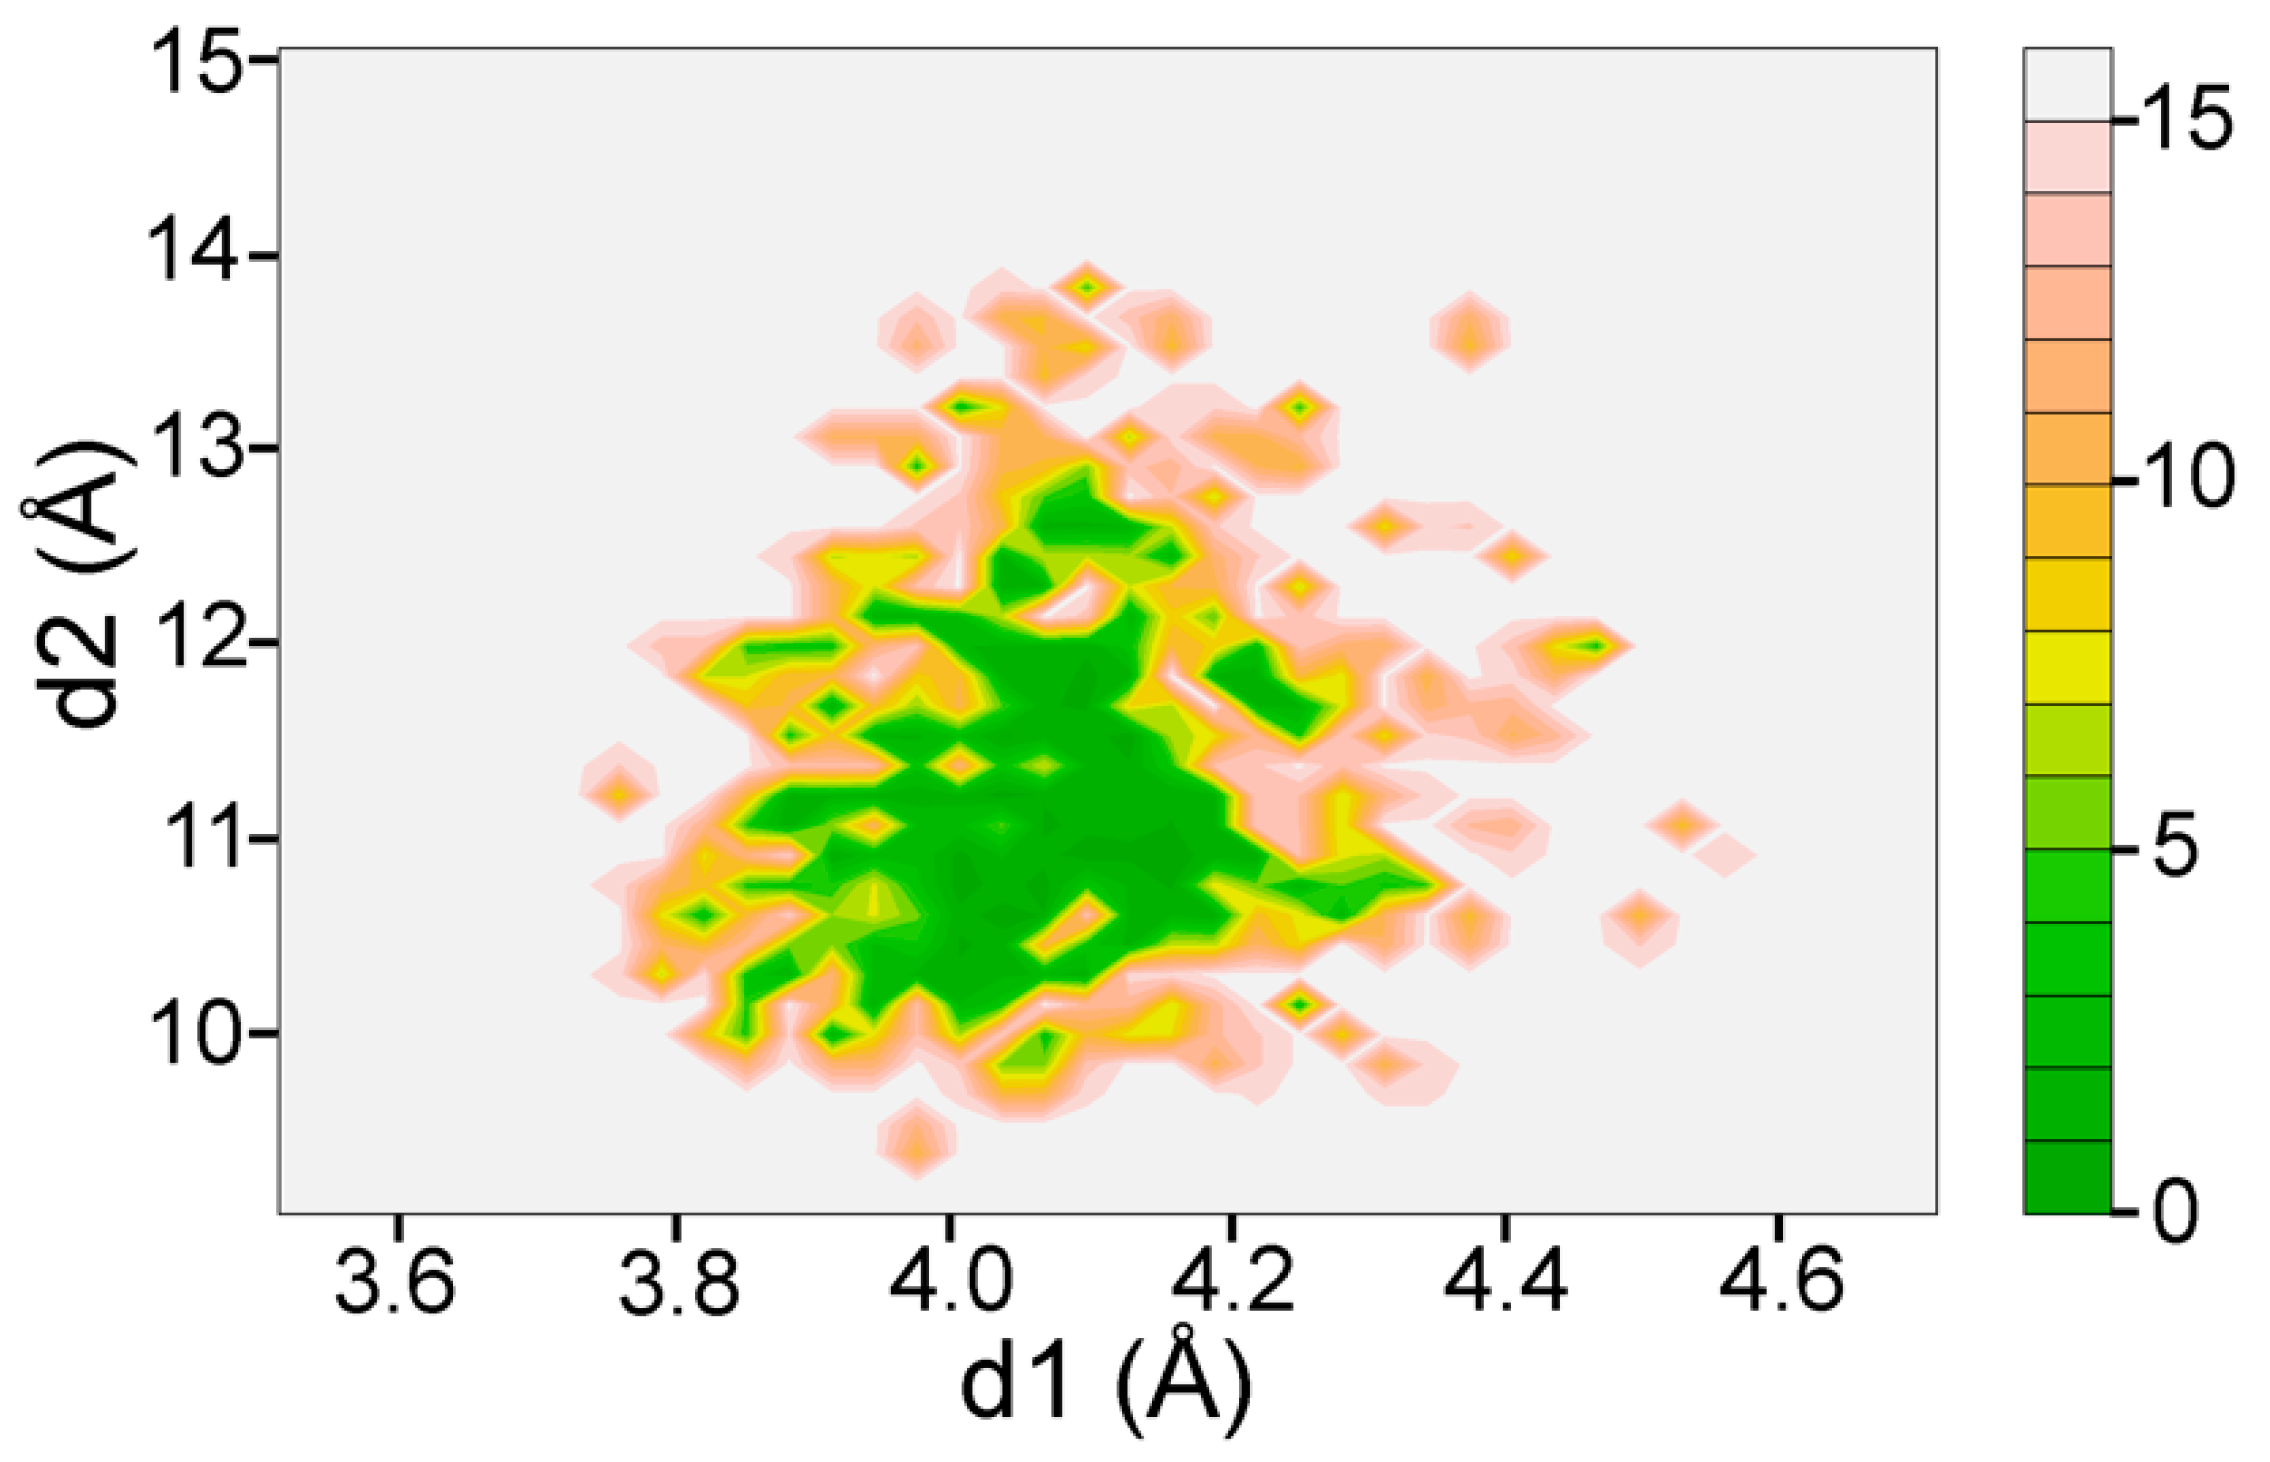
Previous studies have shown that the catalytic triad of several hydrolases—including OmpT—is conserved [17]. To assess the integrity of the active site of OmpT in the holo simulation, we plotted the distances between atoms CG @D210 and CG @H212 (d1) and between atoms CG @D83 and CG @H212 (d2) analogous to the analysis presented in previous work. The lowest free energy in the corresponding landscape (Figure A2 in Appendix A) is in the range of (4.1 Å, 11 Å). This observation indicates that OmpT forms a tight active site conformation throughout the simulation and is consistent with previous results. Due to the presence of the substrate, the d2 spacing is larger than that previously reported for apo-OmpT. Residues D83, D210, and H212 play an important role in maintaining this configuration in the active site.
2.5. Key Interactions Emerge within the Active Site
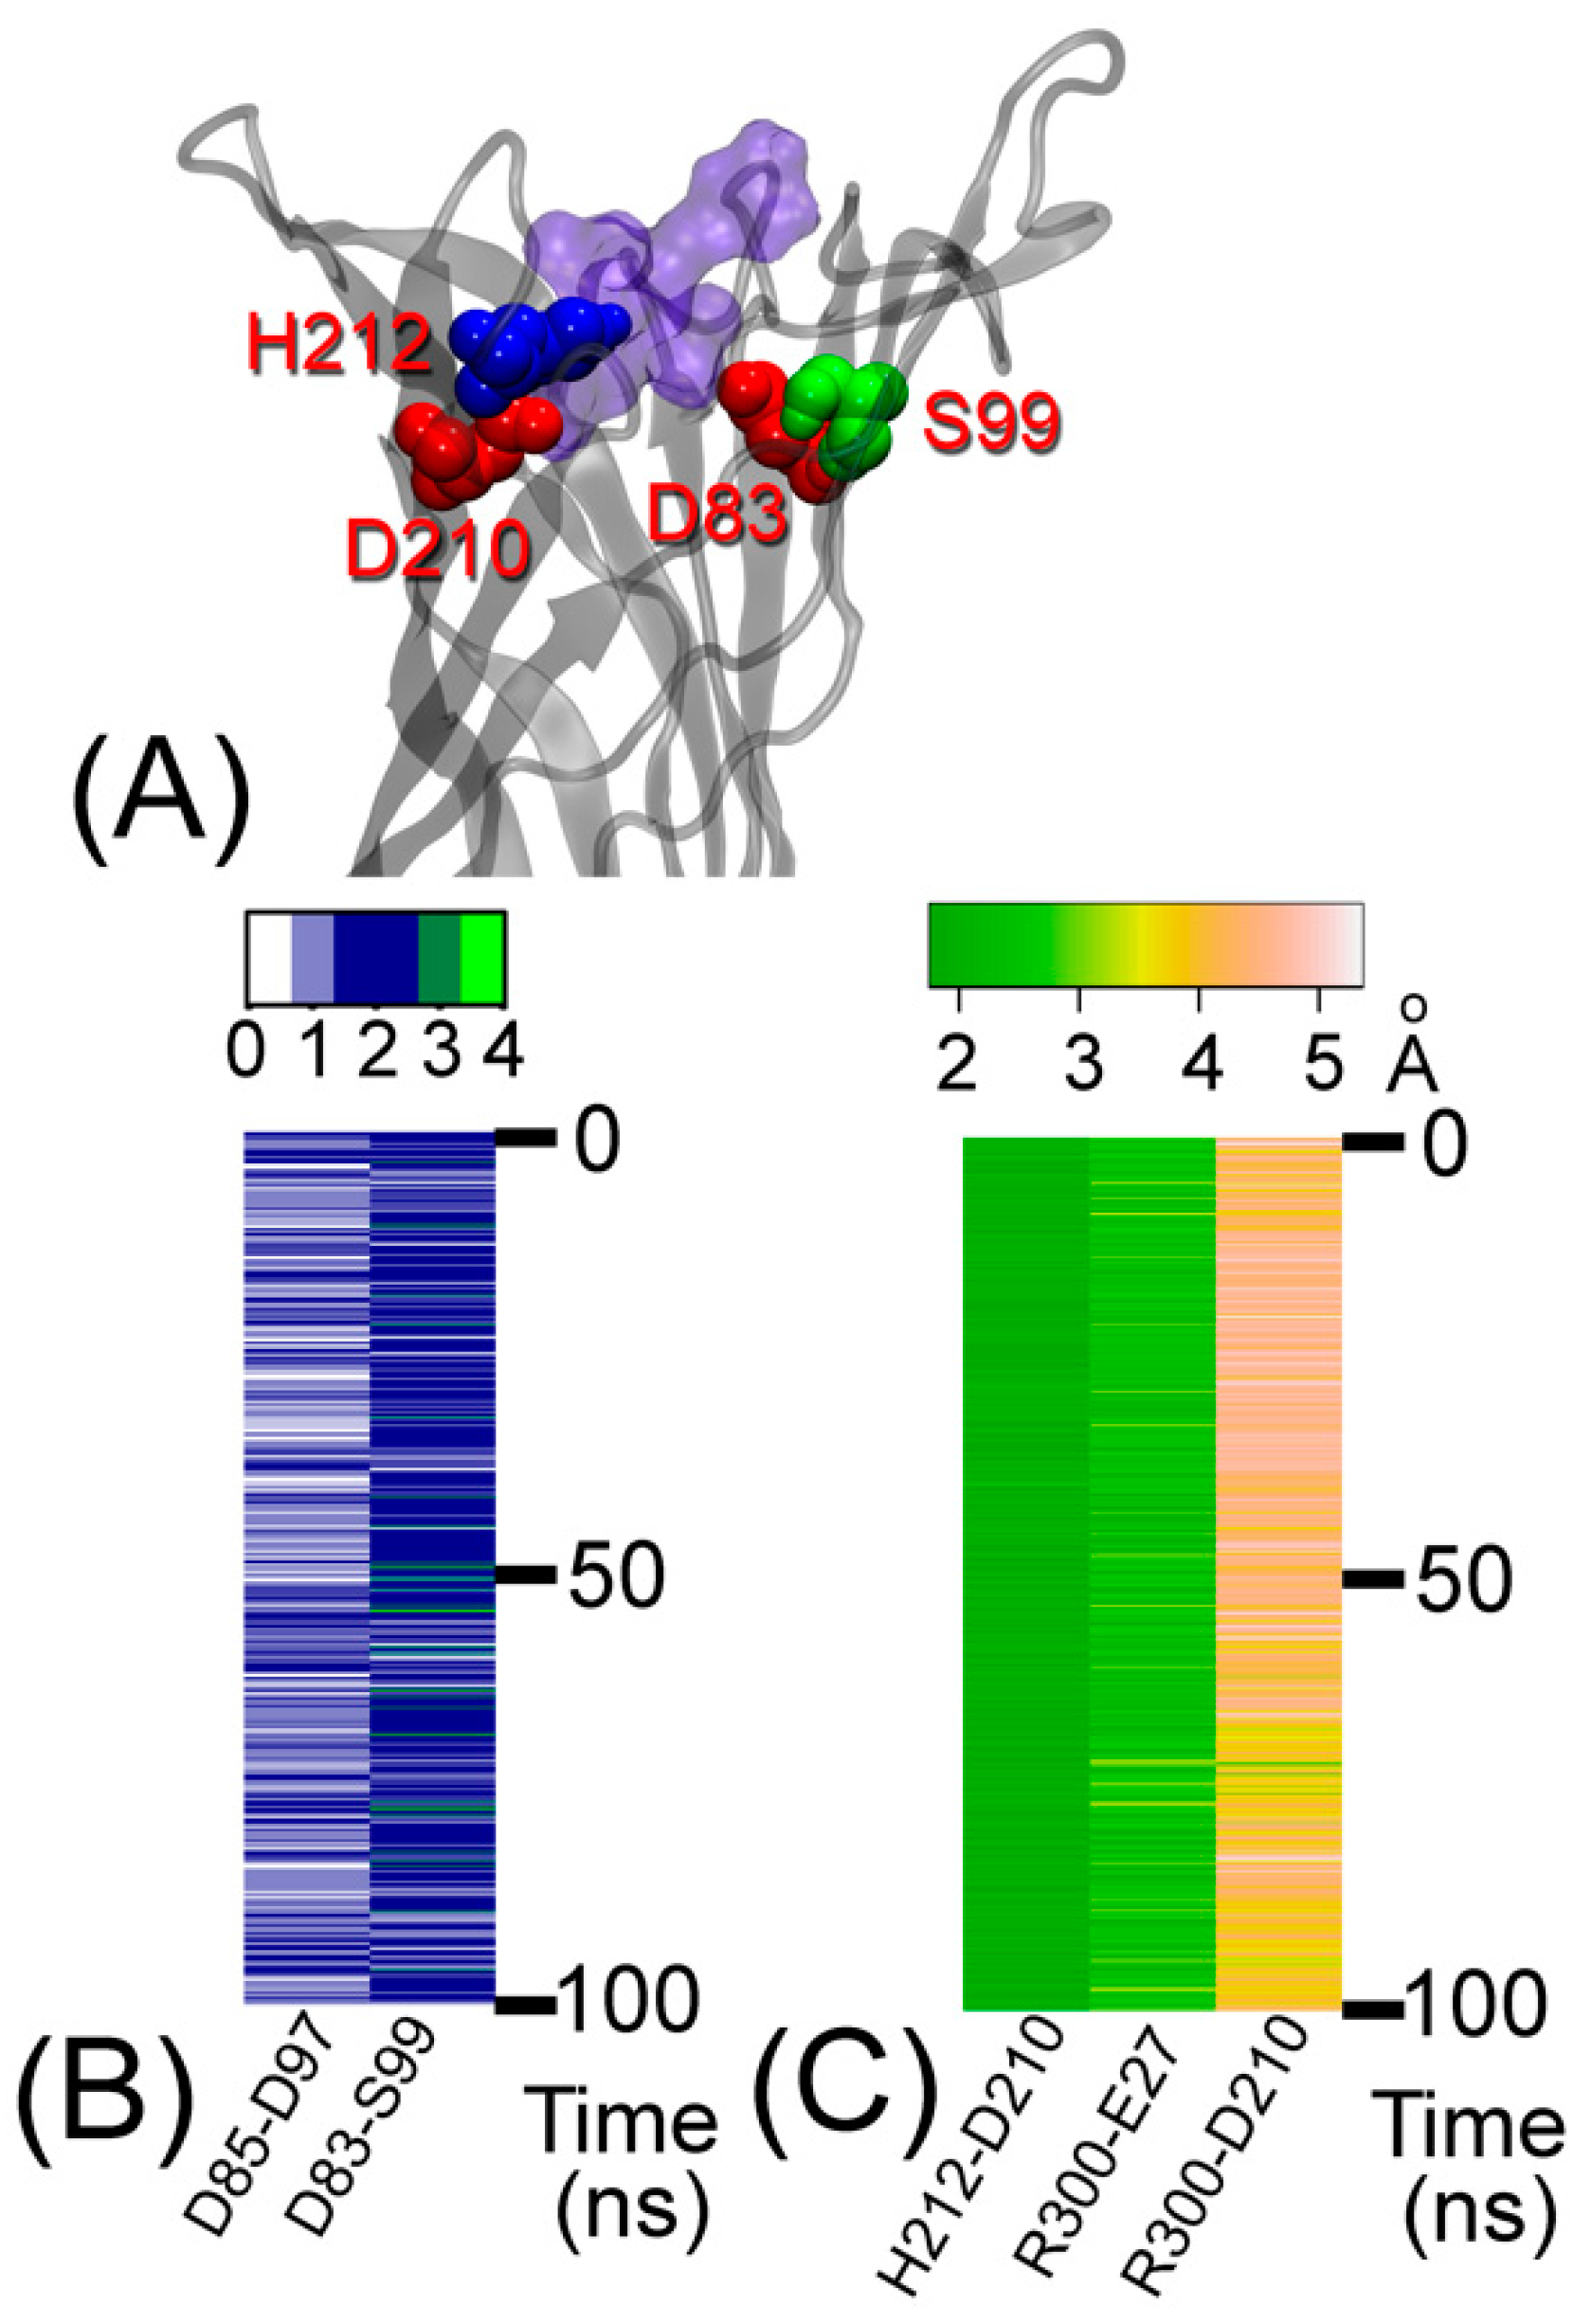
Residues D83, D85, D210, H212, and S99 in the active site of OmpT are stabilized by a network of hydrogen bonds and salt bridges with water molecules and surrounding residues [9,13], and by favorable contacts. The main contacts of the ARRA-OmpT complex are shown in Figure 4 and described in Table 1. The persistent salt bridge for residue pair H212-D210 and hydrogen bonding for D85-D97 confirm the importance of residues D85, D97, D210, and H212 in maintaining the active site [8]. Interestingly, the presence of the substrate significantly weakens the H101-D83 interaction. The stabilizing contacts between residues D83-S99 and an occasionally forming H101-S99 hydrogen bond (not shown) provide an atomistic explanation for the loss of enzyme activity after mutation of S99 to alanine [8]. In addition, residues R300 and R301 belonging to the substrate are in contact with these residues. The key contacts in the active site show a similar pattern in both the holo and apo forms of OmpT (Table 1).
2.6. Quantitative Analysis of Substrate Recognition
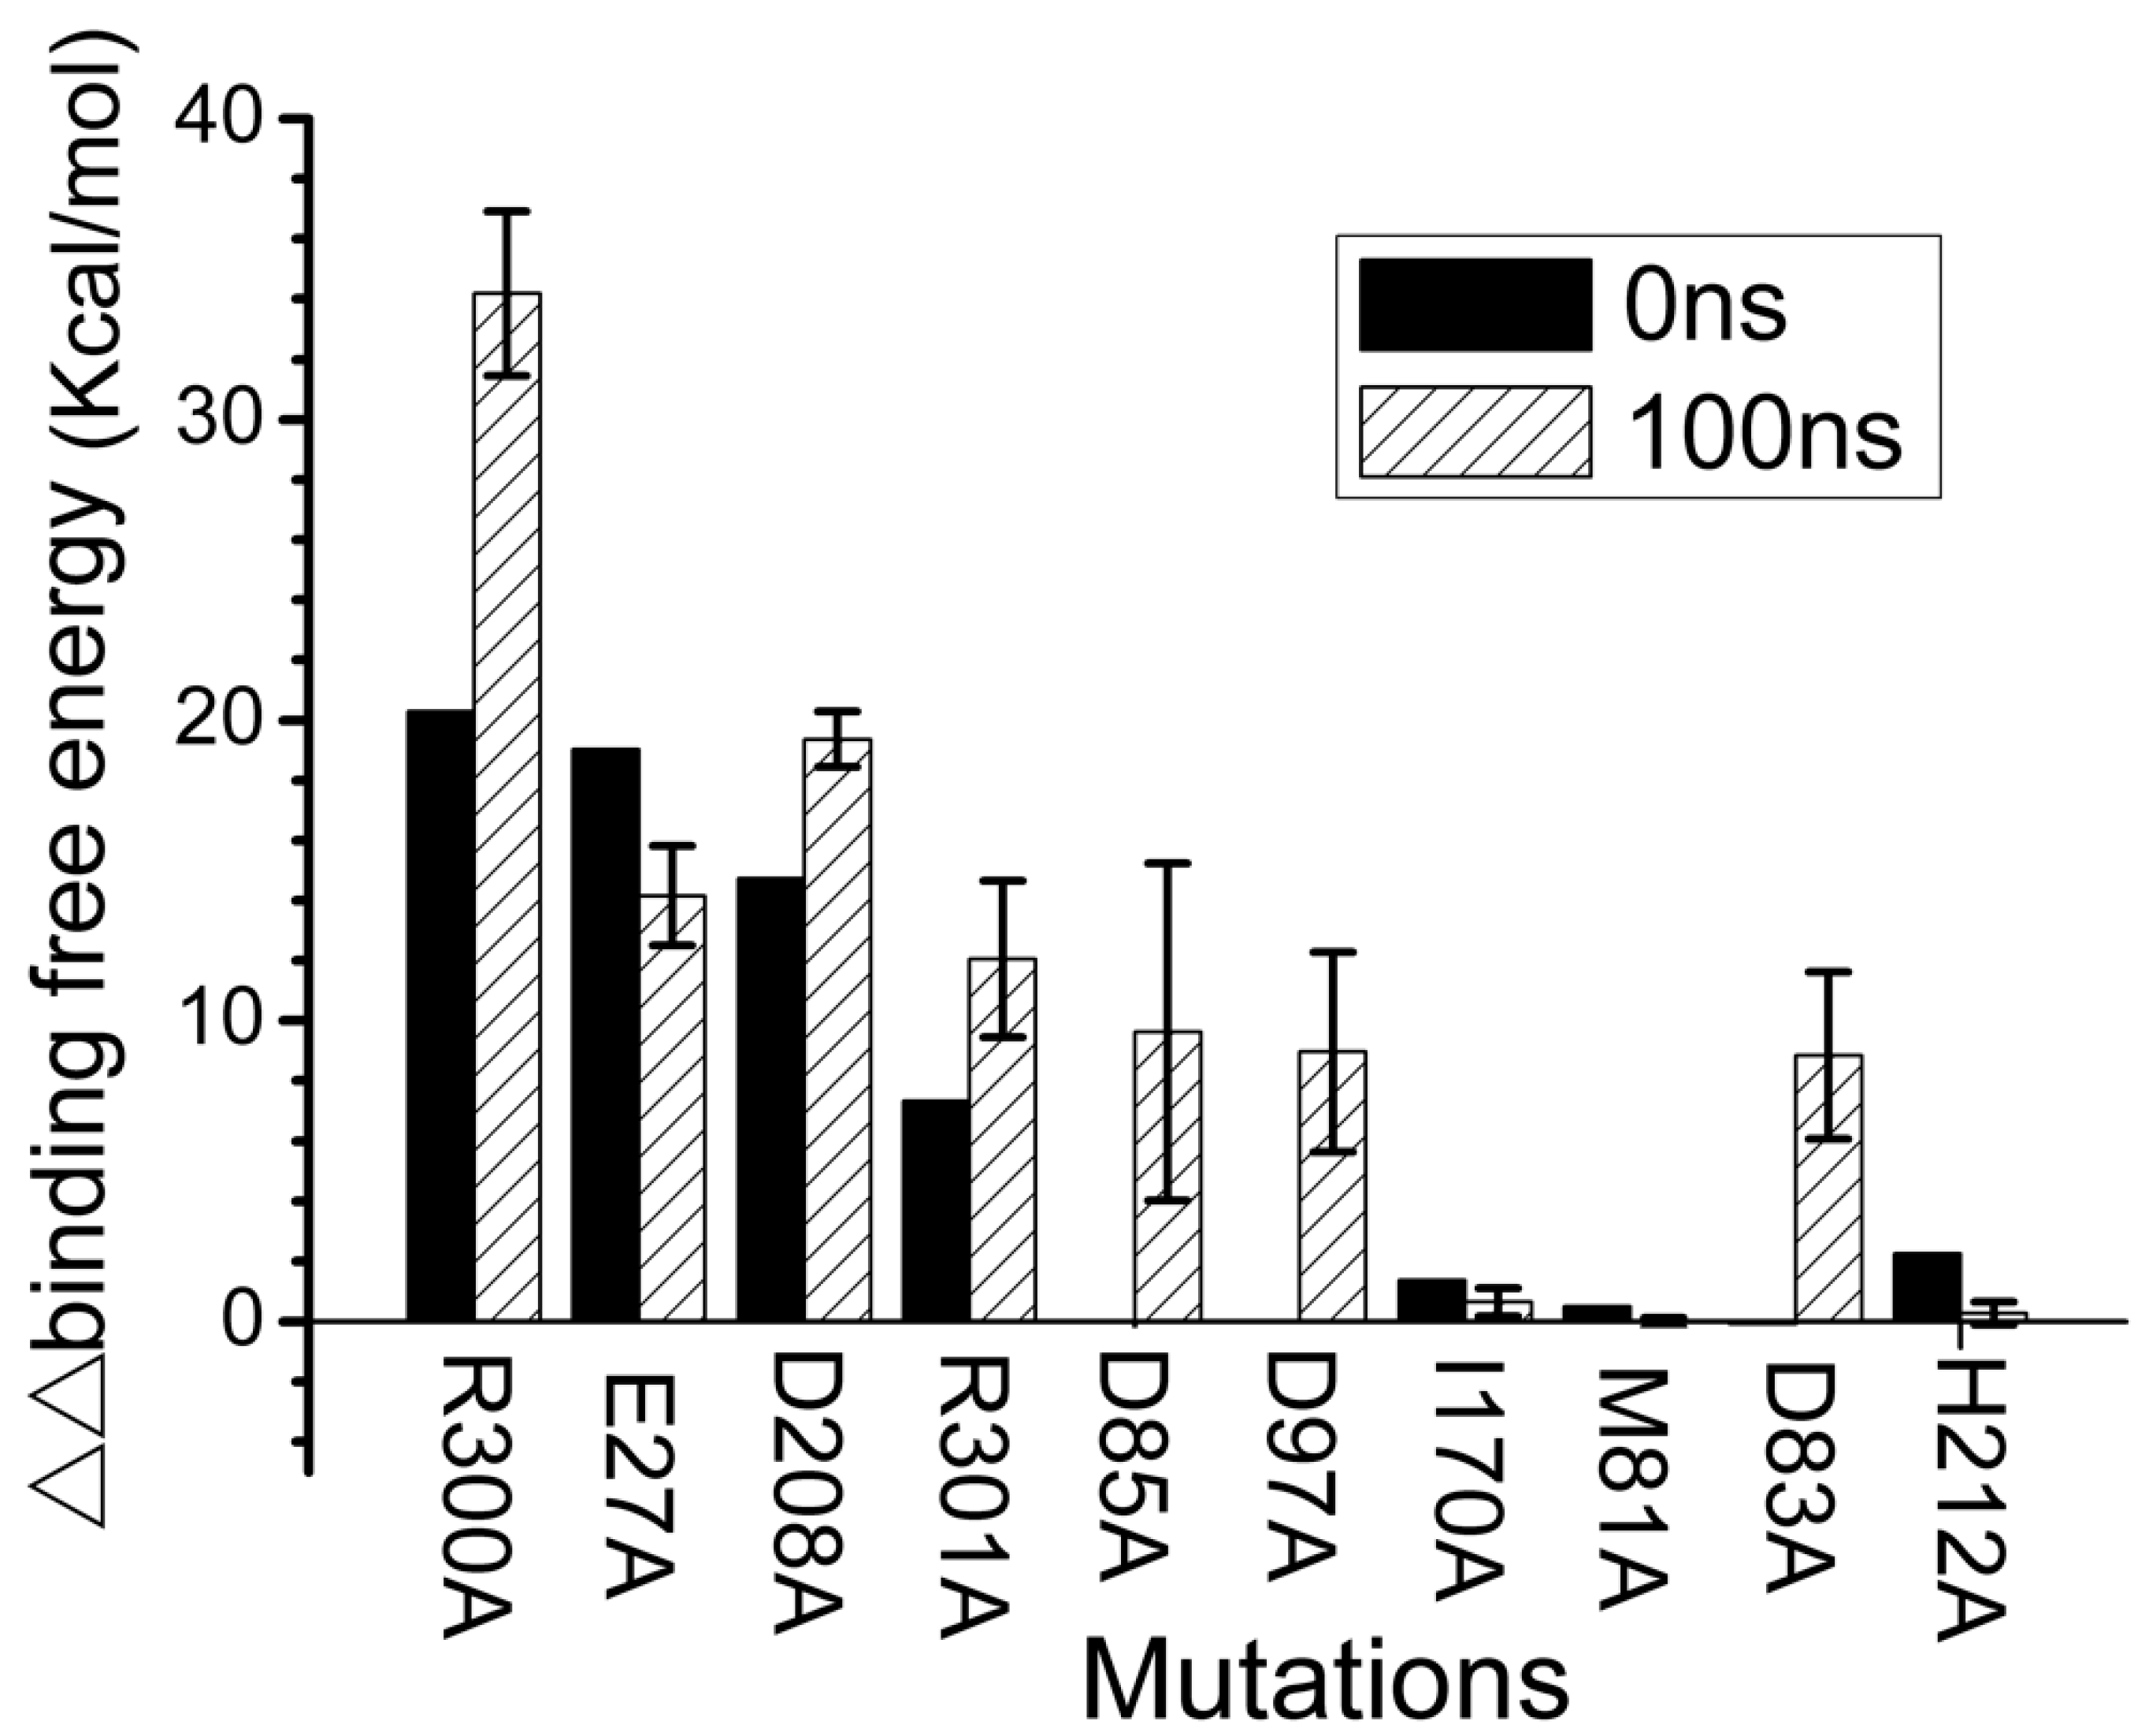
We used computational alanine scanning to quantify the contribution of key residues to molecular recognition in the ARRA-OmpT complex (Figure 5). We selected the first snapshot at 0 ns and ten snapshots during the last 10 ns of the simulation to assess the differences in binding free energies between the mutant and wild-type ARRA-OmpT complex. Figure 5 shows that the R300A mutant leads to a loss of 20.3 kcal/mol in the scan result in the initial structure. This observation highlights the central role that R300 plays in recognition by the OmpT enzyme. Residues E27 and D208 are located within 4 Å of the R300 residue. Initially, their mutation is already largely unfavorable at 19.0 and 14.7 kcal/mol, indicating strong binding affinity. These interactions either strengthen or remain at similar levels during the simulation, as confirmed by the values of 34.2, 14.2, and 19.4 kcal/mol in the scan over the last 10 ns structures. The side-chain:side-chain hydrogen bonds between the R300-E27 and R300-D208 residue pairs appear to maintain these interactions throughout the simulation (Figure 2).
One interesting phenomenon should be highlighted: a change in the free energy of binding of the R301 residue of the ARRA peptide. This residue contributed 7.3 kcal/mol during the initial scanning before the MD simulation. This value increases to 12.1 kcal/mol after 100 ns of simulation, which is most likely related to R301 vibrating toward residues D85 and D97 (Figure 2). These two acidic residues strongly interact with R301 during most of the simulation (Figure 2B), resulting in a loss of 9.6 and 8.9 kcal/mol when they mutate to alanine. It was hypothesized that residues M81 and I170, located at the bottom of the hydrophobic cleft [9], recognize hydrophobic residues of the ligand. To investigate this possibility, we located the A299 residue of the ARRA peptide near M81 and I170 in our docked conformation. Alanine scanning results showed that residues M81 and I170 do not contribute significantly to binding affinity, with low values of 0.5 and 1.4 kcal/mol before and −0.03 and 0.7 kcal/mol after molecular dynamics sampling. They may require more extended hydrophobic regions on the substrate to interact. Residues D83 and H212 were important for maintaining key contacts of the active site residues (Figure 4). D83 clearly contributes to the free energy of the bond in the final 100 ns structure. However, residue H212 does not directly contribute to the energy of ligand recognition.
2.7. Free Energy Profiles from Umbrella Sampling MD Simulations Characterize the Driving Force for Association
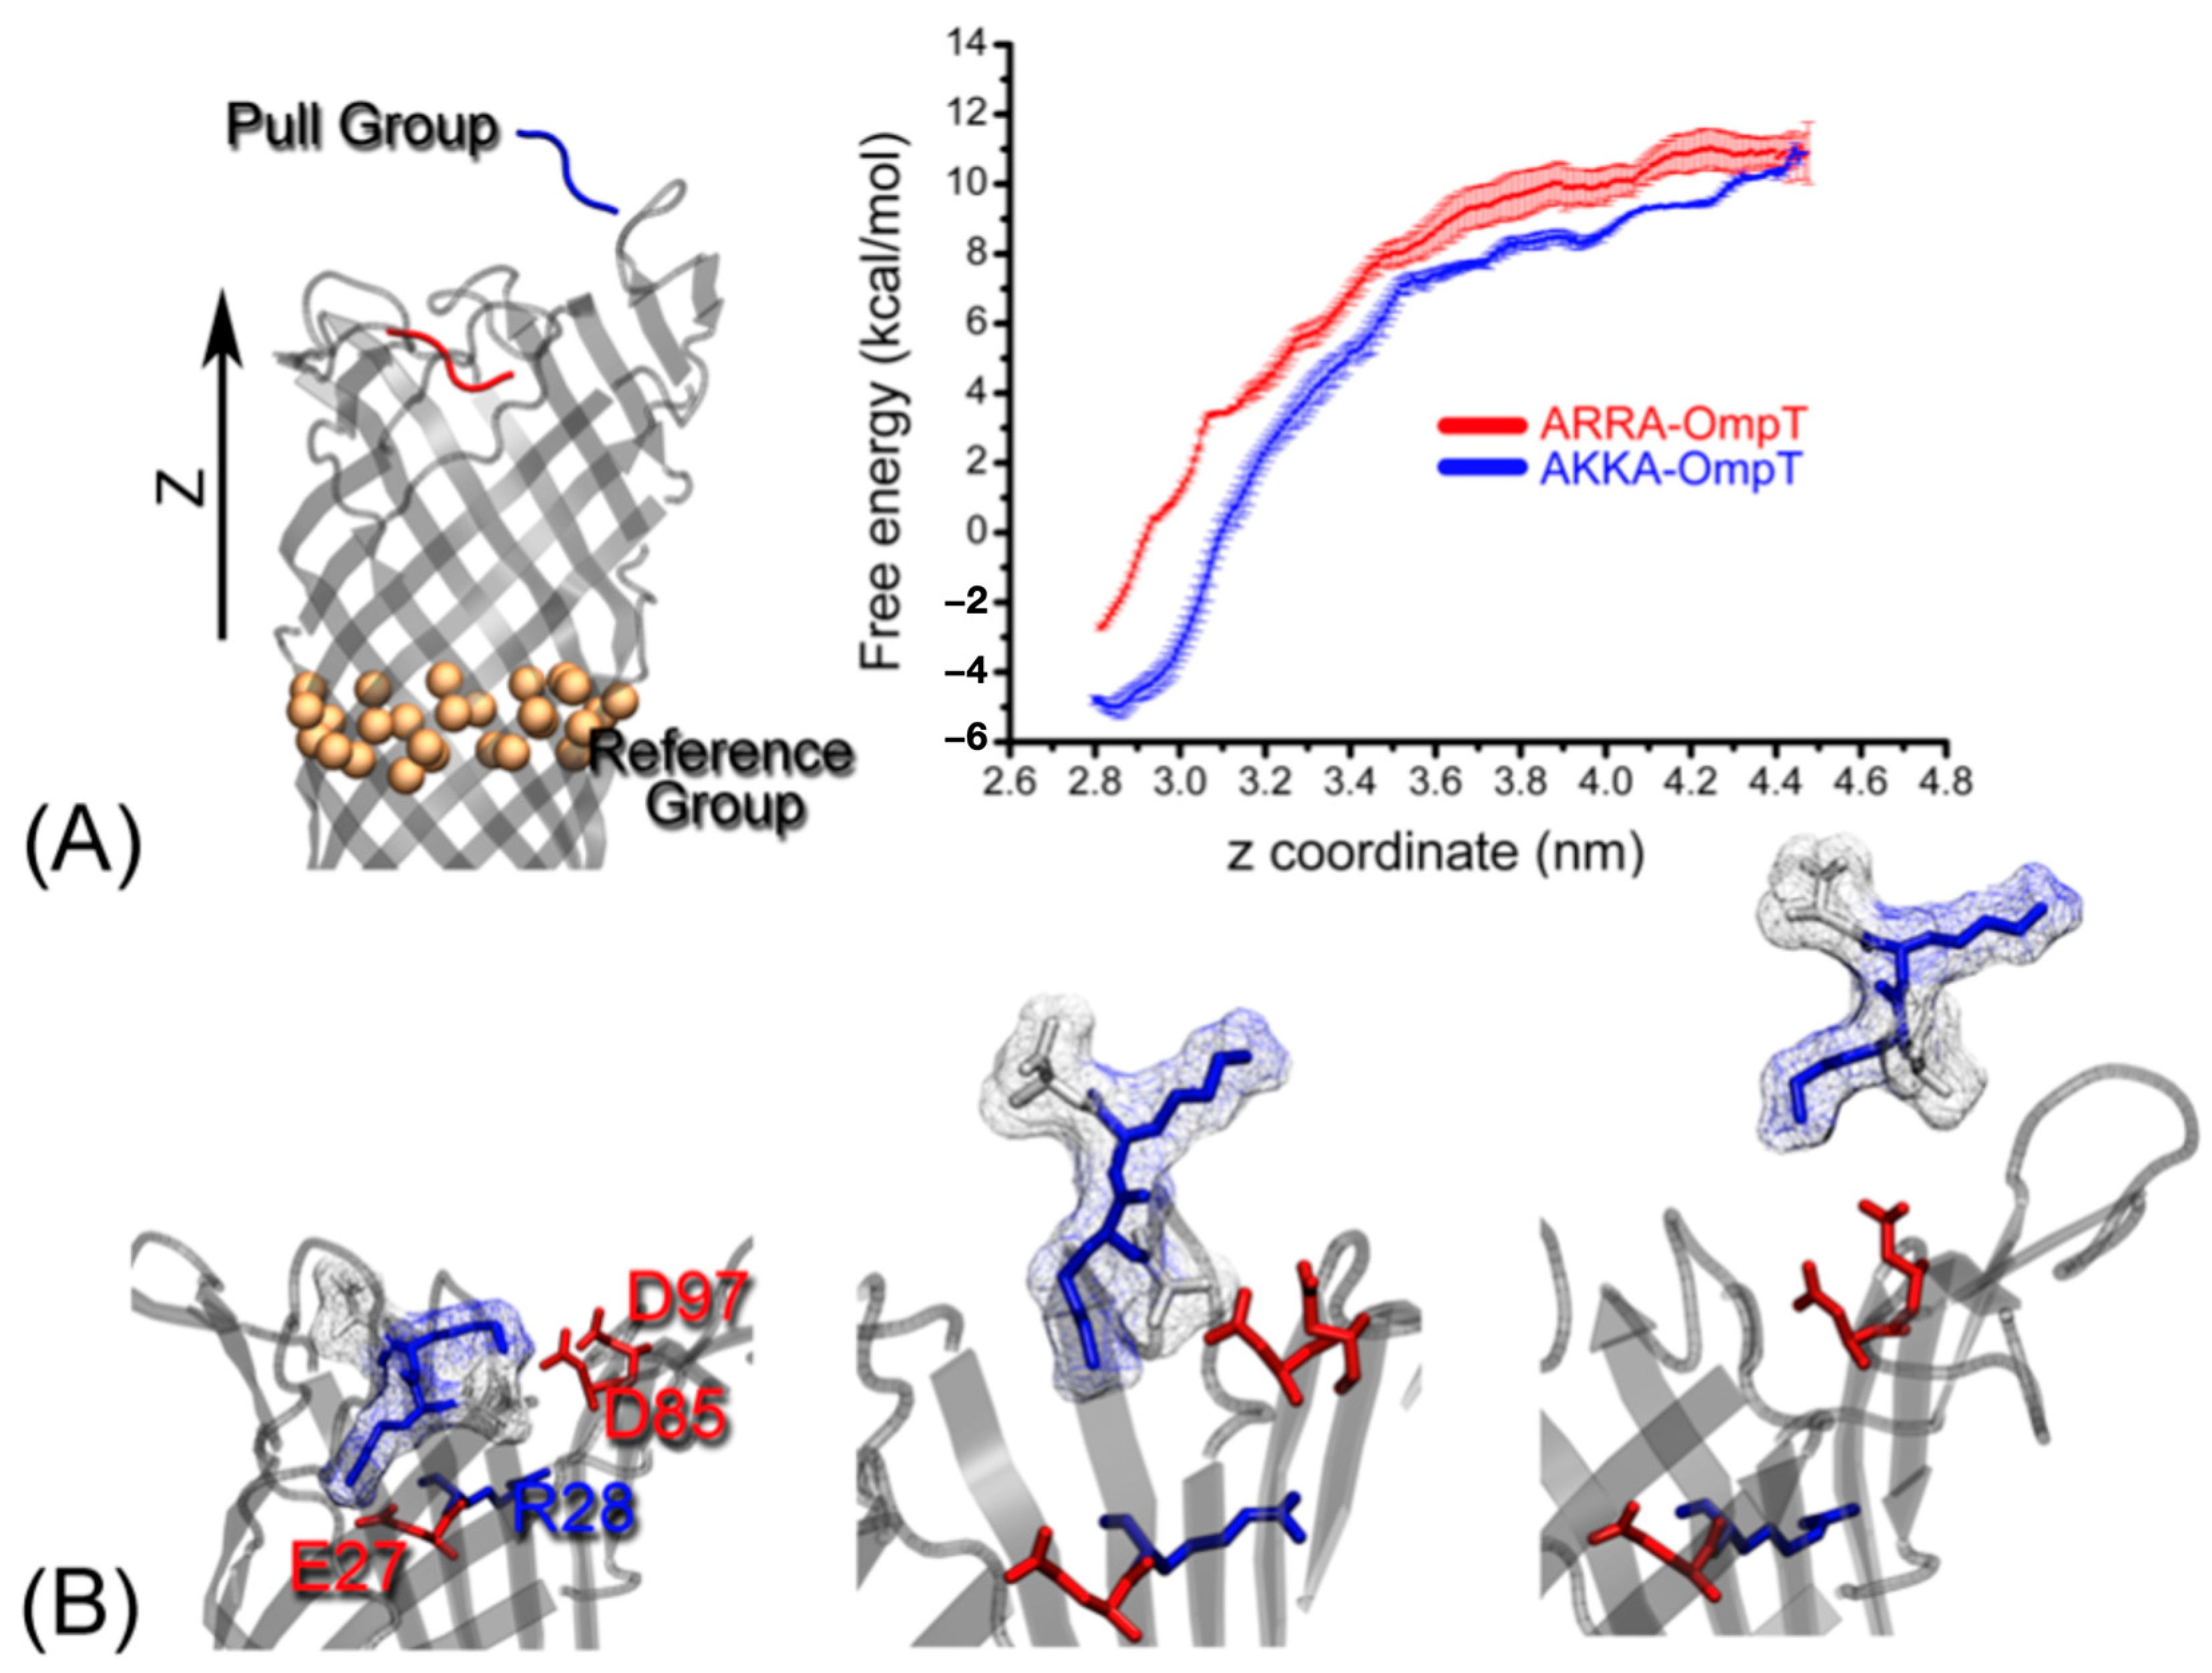
We compared the absolute free energy of binding of the ARRA and AKKA ligands to the OmpT enzyme. We considered the Cα atoms in the middle of the enzyme perpendicular to the OmpT barrel axis as a reference group and pulled the ligand (tensile group) away from OmpT along the z-axis direction (Figure 6A). The free energy recording the COM distance between the pulling and reference groups is shown in Figure 6A. The snapshots extracted in the 2.8 nm, 3.7 nm, and 4.4 nm regions of the COM distance represent the initial, intermediate, and final conformational state of the AKKA-OmpT complex for the umbrella sampling simulations (Figure 6B). As with the AKKA-OmpT complex, the free energy value increases from −4.8 kcal/mol to 7.7 kcal/mol as the COM spacing changes from 2.8 nm to 3.7 nm. In this process, the energy mainly contributes to the ligand AKKA leaving the negatively charged pocket formed by residues E27, D85 and D97 (Figure 6B). Then, the free energy increases to 10.9 kcal/mol when the COM distance reaches 4.4 nm. At this stage, the free energy is used to break the salt bridge between the ligand and the two negatively charged residues D85 and D97. In general, the free energy for the ARRA-OmpT complex shows a similar pattern compared to AKKA-OmpT. The difference of ~2 kcal/mol free energy between these two complexes indicates the strong binding ability of AKKA when recognizing OmpT. We analyzed the evolution of salt bridges during the process in more detail, as shown in Supplementary Figure S1. The side chains in AKKA, especially at position 301, form somewhat stronger and longer-lasting interactions. This difference is particularly visible at about 3.5 nm, where two strong salt bridges are formed by K310 in AKKA, while the corresponding interactions in ARRA are already significantly weakened.
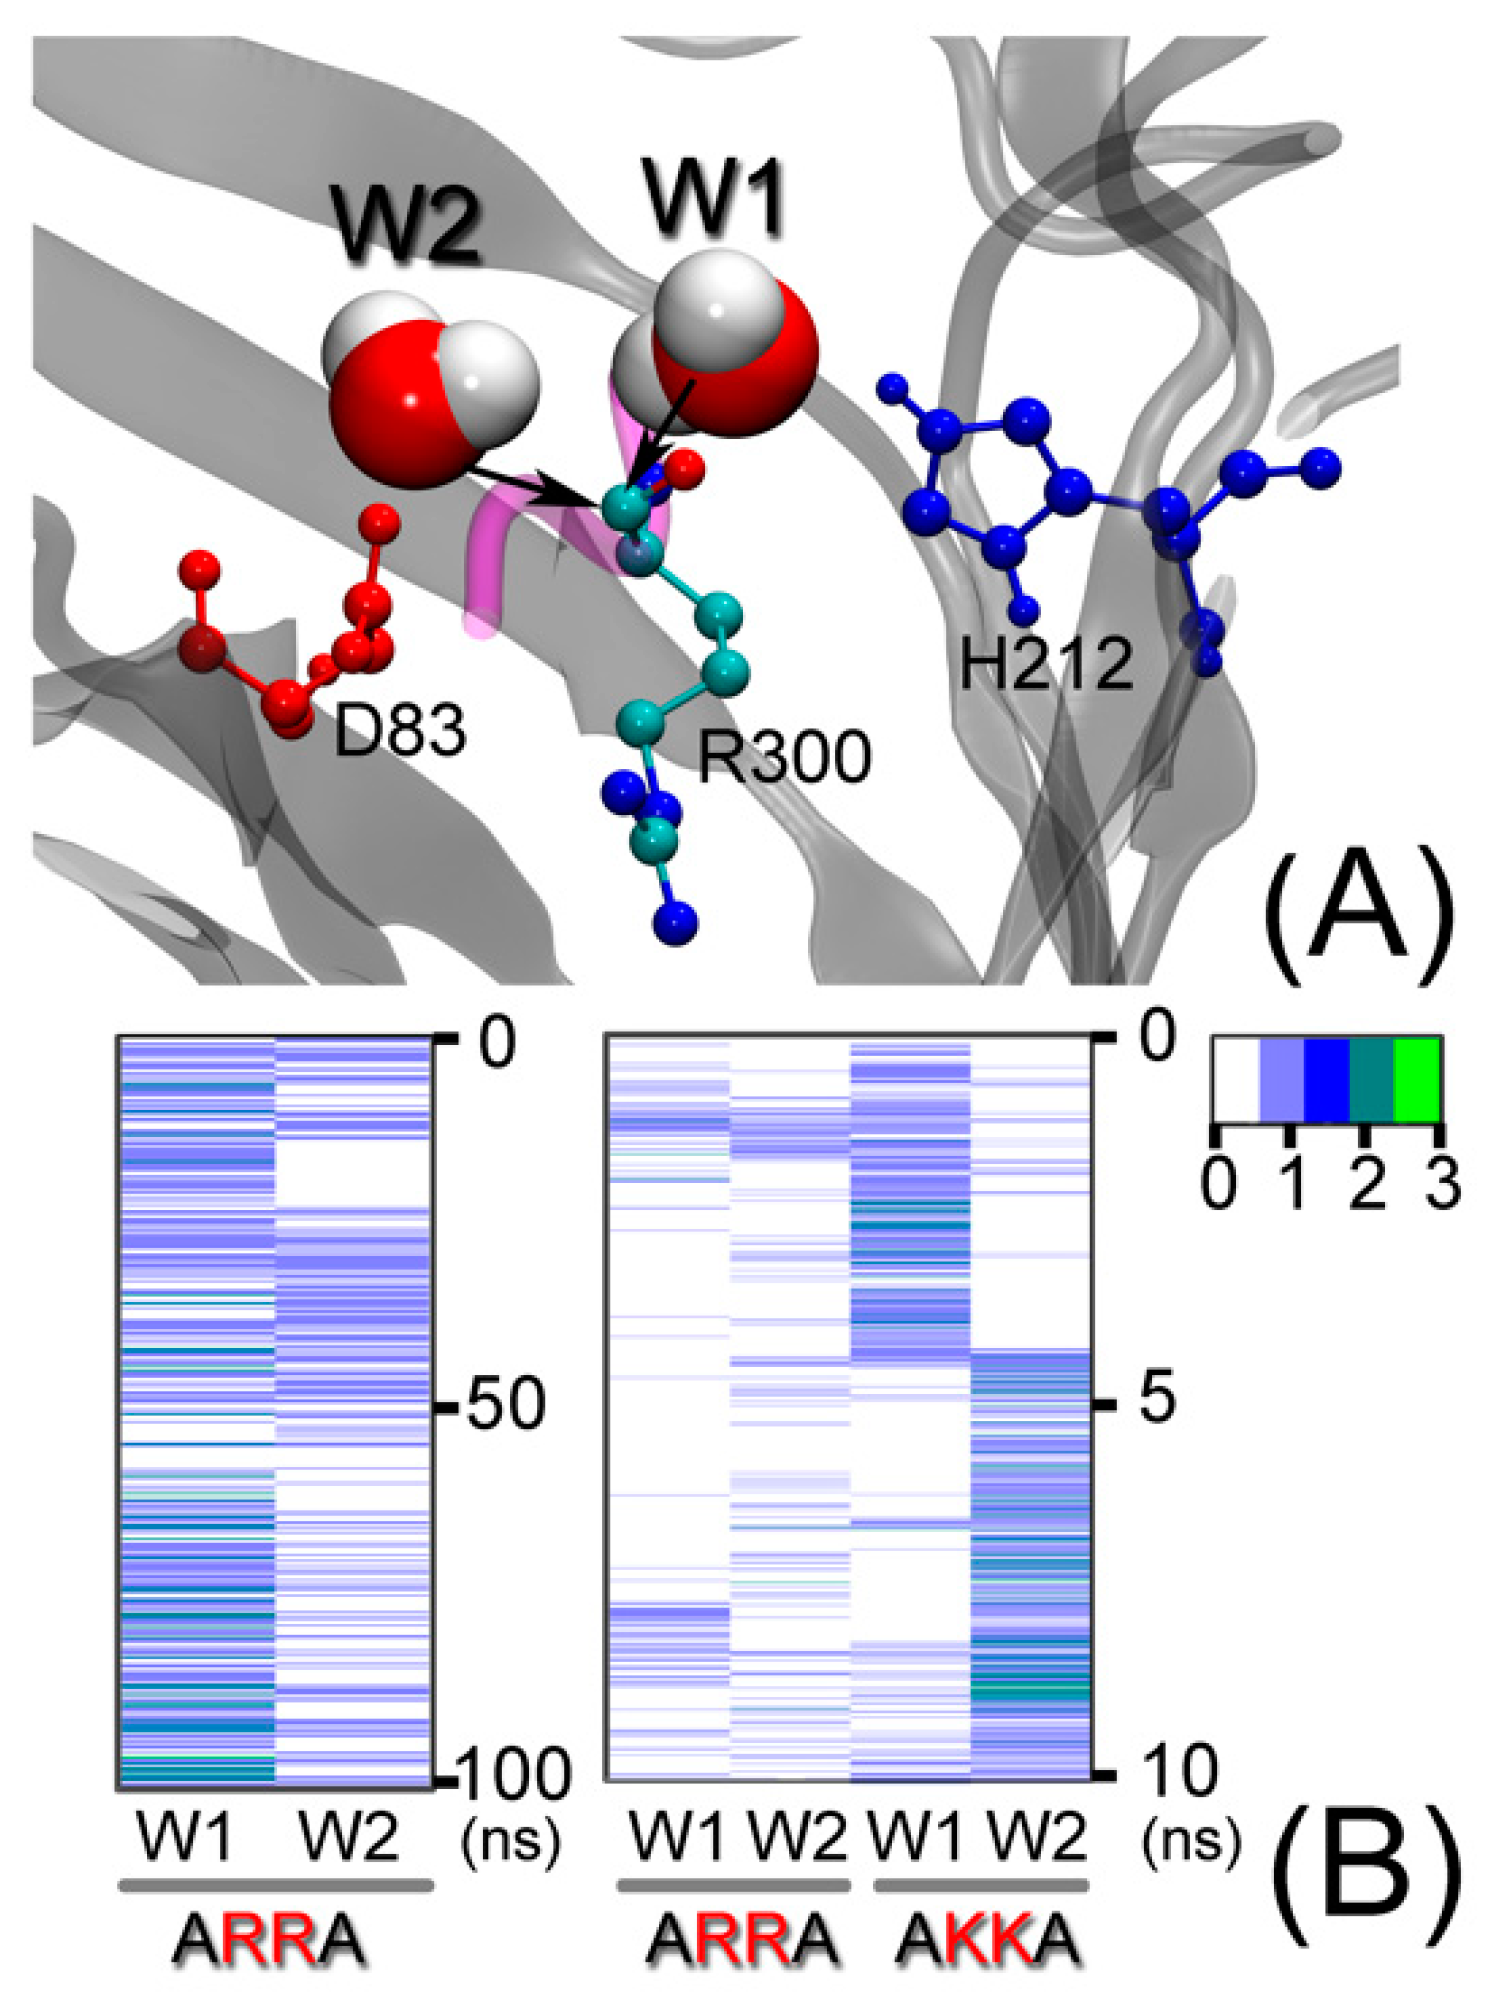
2.8. A Search for Putative Catalytic Water Molecules Yields Two Candidate Poses
Previous reports [9,13] suggest that the catalytic water molecules between residues D83 and H212 in the active site perform a nucleophilic attack on the cleavable peptide bond of the substrate. In the final complex (Figure 7), we indeed observe two water molecules near the cleavable CO-NH peptide bond of R300. The oxygen atoms of these water molecules have the possibility of attacking the carbon atom CO-NH due to their small distance <4 Å. To characterize the presence of such water molecules, we looked for two types of configurations during the simulation: (1) W1 molecules were defined as being within 4 Å of the carbon atom of R300 and simultaneously within 4 Å of the H212 residue. (2) W2 molecules were defined as being within 4 Å of the carbon atom of R300 and simultaneously within 4 Å of the D83 or D85 residues. Figure 7 shows that both types of water molecules are present during most of the simulation time and configurations sometimes alternate between them. We look for these two types of water molecule in the ARRA-OmpT and AKKA-OmpT complex embedded in the POPE membrane during the 10 ns umbrella sampling simulation. These two types of water molecule are also found in this environment. Our observation of the simulation trajectory shows that the water molecules in these two configurations can move far into the extracellular region of OmpT due to strong hydrogen bonding interactions. However, the orbital distribution of the ARRA substrate observed in extended Hückel calculations previously reported in [13] and depicted in the Supplementary Materials Figure S2, indicates that the cleavable peptide is the region most likely to be attacked. This result suggests that water molecules are present that can play a catalytic role by attacking the CO-NH cleavable peptide bond of the R300 residue via its oxygen atom. This observation is a prerequisite for subsequent quantum mechanical calculations required to evaluate the reactivity of water molecules in these positions.
2.9. Lipid–Protein Interactions May Specifically Anchor OmpT within the Membrane
The positioning of the enzyme in the membrane is probably stabilized by finely tuned interactions with the membrane environment. The current simulation on a time scale of 100 ns is not long enough to reliably analyze such interactions, but we provide a preliminary analysis in the Supplementary Materials, Section S2.9, to show the properties that can be characterized, such as the area per lipid, to assess convergence (Supplementary Figure S3), the density distribution in the membrane (Supplementary Figure S4), the number of interactions of DMPC lipids surrounding the ARRA-OmpT complex as a function of time (Supplementary Figure S5), the lateral diffusion coefficients (Supplementary Table S1), and the dominant lipid/protein interactions (Supplementary Table S2).
3. Discussion
We simulated the ARRA-OmpT complex embedded in a DMPC lipid bilayer during a 100 ns all-atom molecular dynamics simulation to capture the protein–ligand dynamics and investigate the substrate recognition of the enzyme. Since the protein barrel scaffold is very robust and stabilizes rapidly, this time scale was sufficient to capture the substrate dynamics within the binding pocket. Convergence of such proteins can already be observed at a 10 ns timescale, as described in [21], except for loop regions. Compared with the previous simulation of apo OmpT [13] and with a coarse-grained simulation of the ARRA-OmpT holo enzyme complex [18], the current simulation sheds additional light on the mechanism of substrate recognition. Structural drift analysis showed that, by and large, the protein remains close to the crystal structure. The loop and beta barrel regions exhibited the highest and lowest fluctuations, respectively, which is similar to a previous MD simulation of OMPLA [11], another outer membrane enzyme. Secondary structure analysis confirmed this stability. Binding of the ARRA substrate to OmpT was maintained throughout the simulation period by hydrogen bonds and strong salt bridges.
Previous crystallization experiments [9] and point mutation experiments [7,8] have shown that residues D83, D85, H210, and H212 in the active site are essential for enzymatic activity. The active site remains intact during simulation in the presence of substrate. The results of the alanine mutation scans confirm the importance of these residues for binding to the short ARRA substrate mimic. Residues H210 and H212 form strong hydrogen bonds that can maintain active site stability. This is consistent with previous comparative analyzes of the active site of several related hydrolases [17].
Mutagenesis experiments [7] have shown that S99 is very important for enzymatic activity. Simulations of the OmpT apo enzyme [13] have shown that S99 can transiently form hydrogen bonds with residue D83. In the present simulation and in a previous coarse-grained simulation [18] of the complex, the S99 residue forms a stable hydrogen bond with D83 throughout the simulation, highlighting its importance for enzymatic activity. In follow-up studies, it would be of interest to compare E. coli OmpT to its equivalent omptin in Yersinia pestis, as many similarities exist between the two proteins [5].
The final structure of the ARRA-OmpT complex may provide a clue to a possible binding mechanism between the ARRA substrate and the OmpT enzyme. Throughout the 100 ns simulation, we observe that strong interactions form between the residue pairs E27-R300 and D208-R300. The importance of these three residues for substrate recognition was suggested by alanine scanning. These interactions were previously observed in simulations [18] and mutagenesis experiments [8]. Our binding pose appears to be qualitatively consistent with a proposed docking model of the inhibitor aprotinin [19] and offers a starting point for further computational studies concerning protein–protein interface design [22].
Residue R301 moves toward residues D85 and D97 during the simulation, although it starts from a position far from the active center. These residues form strong interactions and contribute to the free binding energy of the complex. This result is consistent with those of a previous mutagenesis experiment [8]. As mentioned previously, the substrate in the active site is aligned by electrostatic interactions. This observation is confirmed by Supplementary Video S1, which shows that the electrostatic field lines emanate precisely from the active site cleft and guide the approach of a putative substrate. We have not examined this feature in detail here, but it would lend itself to further visual inspection as described in [23,24] in future studies. The importance of electrostatics is also echoed by the reported analysis of the major salt bridges of the enzyme, be it in the formed complex or upon extraction during the umbrella sampling runs.
As a hydrolase, OmpT exhibits several differences compared to the traditional hydrolase mechanism. It is generally accepted that trypsin uses a negatively charged active site to digest Arg and Lys substrate residues [25,26]. The structure of the trypsin-vasopressin complex [27] shows that R8 of vasopressin is essential for binding the P1 site, and makes direct contact with the D189 recognition residue of trypsin. Our ARRA-OmpT model suggests that OmpT binds the basic substrate residues via its acidic side chains and that the electrostatic interaction energy drives the ligand into the catalytic site.
If OmpT were a conventional serine protease, it would be expected to use a directly interacting serine residue to digest the substrate. In the ARRA-OmpT complex, S99 is an obvious candidate. It stabilizes the active site mainly by forming a hydrogen bond with D83. However, it is unlikely to act directly on the ARRA substrate because the distance between S99 and the cleavable peptide bond averages 9.4 Å in the simulation. This has previously been cited as a reason why OmpT should not be classified as a member of the serine protease family [9].
Water molecules instead of serine were thought to be involved in the catalytic mechanism. In our final complex, some water molecules located between residues H212 and D83 were observed near the cleavable CO-NH bond. The distance between these water molecules and the peptide bond is stable <4 Å during the simulation, and it was assumed that the water molecules play a catalytic role by participating in the nucleophilic attack on the carbon atom of the peptide bond. The catalytic water molecules detected in the active site during the 100 ns simulation may reflect this earlier assumption [9,13].
The effects of protein–lipid interactions on lipid mobility were analyzed throughout the simulation. OmpT has previously been shown to insert into the membrane with a slight tilt [13,28], presumably due to some specificity of its lipid interactions. In our preliminary analysis, the “border” and “free” lipid molecules exhibited differences in both qualitative and quantitative terms. The mobility of the “border” lipids was limited compared with the “free” lipids. These results reflect previous observations on the OmpA-DMPC system [29], KcsA-POPC [29], and OprF-DMPC [30]. For a more thorough and specific study of protein–lipid interactions and dynamics, coarse-grained approaches that can account for larger scale effects such as crowding are more appropriate [31] and start to take into account protein conformational dynamics to some extent [32]. We can perform such calculations in follow-up studies, but automated approaches such as MemProtMD [33] already provide a good resource for comparing lipid interactions for all available omptin structures.
4. Materials and Methods
4.1. Generation of Atomic Models
The atomic coordinates of OmpT used for this study were obtained from the Protein Data Bank [34] (PDB code: 1I78). The substrate docking procedure has been described previously [13], and the appropriate candidates for the ARRA-OmpT complex were determined by a combination of the AUTODOCK program [35], YASARA software [36], and STC software [37]. The protonation state of OmpT was assigned based on pKA calculations using the WHATIF program [38]. The simulation was set up for pH7, with residues E27 and H212 predicted to be protonated, H101 and H268 to be neutral, all other residues in their standard protonation states. The titration curves for these four residues are reported in Supplementary Figure S6 and pKa values are reported in Supplementary Table S3. In this work, the numbering of residues in the ARRA-OmpT complex is consecutive, indicating that the first residue of the ARRA peptide in the complex is actually designated A299. The ARRA-OmpT complex was inserted into a pre-equilibrated, hydrated dimyristoylphosphatidylcholine (DMPC) bilayer using previously described methods [39]. We chose this lipid type to be compatible with our previous work [13] and to allow direct comparison. It should be noted that E. coli has about 70% POPE lipids in its cell membranes, so POPE would represent a more biologically natural environment. On the other hand, the literature suggests a relative insensitivity of OMPs to lipid composition [40]. Na+ and Cl− ions were then added at a concentration of 0.1 M.
4.2. Molecular Dynamics Simulations
Simulations were performed using the GROMACS software package [41,42]. Consistent with the reference simulations of the apo form described in [13], with which we performed comparisons, identical force fields were used to represent proteins and lipids [43] in combination with the SPC water model [44]. Simulations were performed using the NPT ensemble. Temperature was maintained at 310 K using a thermostat [45] with τ = 0.1 ps. Pressure was maintained at 1 bar in all three dimensions by anisotropic coupling of the x, y, and z components using a barostat [45] with τ = 1 ps and a compressibility of 4.5 × 10⁻⁵ bar−1. The time step for integration was 2 fs. The electrostatic interactions were calculated using the Particle-Mesh Ewald (PME) algorithm [46], and the van der Waals forces were treated with a limiting distance of 10 Å. The LINCS algorithm [47] was used to constrain all bond lengths. A production run with a duration of 100 ns was then performed. The results were analyzed using the standard software tools of the GROMACS package [41,42]. Visualization and manipulation of conformations was performed using the programs VMD [48] and UnityMol [49]. Statistical and data analysis was performed using the statistical software package R [50].
4.3. Calculation of Relative Binding Free Energies by MM-GBSA
To further analyze the binding affinity of the ARRA-OmpT complex, we extracted the initial snapshot at 0 ns and ten snapshots during the last 10 ns of the simulation to evaluate the binding free energy. For each snapshot, we performed 600 ps of MD using the Amber 11 program [51] and the GB approach. This method has been shown to be reliable for estimating binding free energy, as indicated previously [16,52,53]. In this study, the implicit generalized Born solvation model was used (igb = 2). The temperature was fixed at 300 K. Unbound interactions were truncated at a distance of 12 Å. The ff99 force field (Parm99) [54] was used throughout the energy minimization and MD simulations. In the MM-GBSA implementation of Amber 11.0, the free energy of the A + B → AB bond was calculated using the following thermodynamic cycle:
Here, T is the temperature, S is the entropy of the solute, is the interaction energy between A and B in the gas phase, and , , and are the free solvation energies of A, B, and AB, which are estimated using a GB surface method [55,56]. That is, = + + , and so on. and are the electrostatic and nonpolar terms, respectively. The binding, angular, and torsional energies represent the intramolecular energy of the complex, while and represent the electrostatic and van der Waals interactions between receptor and ligand. Assuming a constant contribution of for each docked complex, we refer in the discussion to for . The relative free energy of binding was calculated using MM-GBSA for post-processing snapshots from the MD trajectories. The computational alanine scan method in MM-GBSA [57] was used to analyze the importance of residues contributing to the recognition mechanism. The key residues were mutated to alanine and then the difference in binding free energies between mutant and wild-type complexes was calculated based on the MM-GBSA approach. The calculated results were compared with the experimental data.
4.4. Umbrella Sampling to Calculate Potential of Mean Force Profiles
The simulation box for the umbrella sampling simulations contained the ARRA-OmpT (or AKKA-OmpT) complex, 214 POPE lipids, 14836 TIP4P water molecules, 28 chloride ions, and 31 sodium ions. The change in lipids to POPE was unintentional, yet we did not repeat the simulations with DMPC lipids, because the literature suggests a relative insensitivity of OMPs to lipid composition [40]. Note that the ARRA-OmpT pose was extracted from the 84 ns equilibrium run MD and the AKKA-OmpT pose was generated by mutation of two Arg residues from ARRA to Lys. The force field parameters for POPE were taken from GROMOS-87 [43], and the other parameters were described above. After a 3 ns equilibrium run MD for the simulation box, the ARRA ligand (group A) was pulled away from OmpT over 800 ps, using a spring constant of 1000 kJ−1·mol−1·nm−2. The Cα atoms in the center plane perpendicular to the OmpT axis were held as an immobile reference (group B). The center of mass distance (COM) between group A and B was monitored and the region of interest from 2.8 nm to 4.4 nm was divided into 55 equidistant windows (each 0.03 nm wide). For each window simulation, 100 ps equilibrium at constant pressure (NPT) and 1 ns production MD were simulated. The Nose–Hoover thermostat [58,59] was used to maintain temperature and the Parrinello–Rahman barostat [60,61] was used to isotropically control pressure. Data were collected for 1 ns and the last 600 ps of each run was used to create the PMF. The unbiased PMF was calculated using the weighted histogram analysis method (WHAM) [62]. Errors were estimated by performing the above analysis in three trajectory blocks with a length of 200 ps, and taking the average of the block PMFs.
5. Conclusions
This study provides a detailed molecular model of the ARRA-OmpT complex that is quantitatively characterized by computational alanine scanning and therefore can be used as a reference for better rationalization of this system. Residues D83, D85, H210 and H212 are located in the active site and a complex network of hydrogen bonds and salt bridges is formed to maintain the stability of these residues. The hydrogen bonding of S99-D83 reflects the importance of the S99 residue for enzymatic activity. In addition, our model shows that R300 can interact with residues E27 and D208 throughout the simulation, while R301 interacts with D85 and D97 only at the end of the simulation. The importance of these residues contributing to substrate recognition is confirmed and quantified by computational alanine scanning. Our study shows that the oscillation of the substrate along the β-barrel axis is associated with the motions of the binding cleft formed by the two pairs of residues D210-H212 and D83-D85. Principal component analysis suggests that substrate oscillation is correlated with protein motions. Further studies describe the catalytic water positions between residues H212 and D83. The oxygen atom of water is assumed to perform the nucleophilic attack on the carbon atom of the cleavable peptide bond. Thus, the model remains compatible with water-mediated attack, an atypical catalytic mechanism, and provides a plausible starting point for subsequent quantum mechanical studies. Analysis of the protein–lipid interaction shows that free lipids exhibit high lateral diffusion compared to bound lipids, highlighting the fluid character of the bilayer. We take a brief look at the ligand approach phase using umbrella sampling and find that AKKA is about 2 kcal/mol stronger compared to ARRA. Overall, the crucial importance of electrostatic interactions becomes apparent at several stages.
Supplementary Materials
The following supporting information can be downloaded at: https://www.mdpi.com/article/10.3390/catal13020214/s1, Figure S1: Closest contact distances of salt bridges between selected active site residues (E27, D210, D208, D85 and D97) of OmpT and basic residues at positions 300 and 301 of the AKKA (A) and ARRA (B) peptides as a function of the z reaction coordinate used during umbrella sampling for the extraction of the substrate from the active site. The distance of salt bridges was calculated using the smallest native distance between two residues; Figure S2: Result of an extended Hückel calculation, a simplified method for calculating the electronic structure of conjugated molecules, for the ARRA peptide in a docked formation, showing that the LUMO is located at the carbon atom of the central C=O in the peptide bond; Figure S3: Area per lipid relaxation over time for the DMPC bilayer. The plots were obtained from the trajectories of (A) DMPC+ARRA/OmpT, and (B) DMPC+ OmpT [63]; Figure S4: Density profiles of membrane components (headgroups, glycerol ester and acyl chains) along the membrane normal direction. The plots obtained from the trajectories of (A) DMPC+ARRA/OmpT, and (B) DMPC+ OmpT are shown; Figure S5: (A) Number of DMPC lipids contacting OmpT in the apo enzyme (34 lipid molecules) and holo enzyme systems (35 lipid molecules). (B) Number of DMPC atoms in contact with OmpT. The red line describes the number of contacts of the lipid head group (270 atoms), the blue line those of the lipid tails (104 atoms). (C) Cumulative view of some bound and free lipids (defined in the text) during the simulation (saved every 5 ns); Figure S6: Titration curves for the four residues E27, H101, H212 and H238 with a predicted non-standard ionization state at pH7; Table S1: Lateral diffusion coefficients for lipids in the bilayer; Table S2: Dominant lipid/protein interactions [64,65,66]; Table S3: Results for pKa calculations of OmpT in vacuo (“Bare”) or in a dielectric membrane region (“Slab”); Video S1: Animation of OmpT electrostatic field lines [24,67].
Author Contributions
Conceptualization, M.B.; methodology, M.B.; software, Y.Z. and M.B.; validation, Y.Z. and M.B.; investigation, Y.Z. and M.B.; resources, M.B.; writing—original draft preparation, M.B.; writing—review and editing, Y.Z. and M.B.; visualization, Y.Z. and M.B.; supervision, M.B.; project administration, M.B.; funding acquisition, M.B. All authors have read and agreed to the published version of the manuscript.
Funding
This research was funded by the “Initiative d’Excellence” program from the French State, grants “DYNAMO”, ANR-11-LABX-0011, and “CACSICE”, ANR-11-EQPX-0008). M.B. thanks Sesame Ile-de-France for co-funding the display wall used for data analysis.
Data Availability Statement
The data presented in this study, especially the molecular dynamics trajectory, are available upon request from the corresponding author. The data are not publicly available at this time because further efforts are underway in the authors’ laboratory to make the molecular dynamics data widely available and to establish appropriate best practices, which are ongoing. Once this goal is achieved, the relevant data from this study will be deposited and added to the corresponding author’s dataset list permanently available at doi: 10.6084/m9.figshare.21779627.
Acknowledgments
Computations were performed using HPC resources from LBT-HPC. We thank Geoffrey Letessier for technical and HPC support.
Conflicts of Interest
The authors declare no conflict of interest. The funders had no role in the design of the study; in the collection, analyses, or interpretation of data; in the writing of the manuscript; or in the decision to publish the results.
Appendix A
Here we provide complementary analysis results that support the core results presented in the main text. First, we look at simulation stability in terms of structural drift and secondary structures as illustrated in Figure A1.
Figure A1.
(A) Root mean square deviation (RMSD) of the ARRA-OmpT complex with respect to the initial structure for the carbon alpha atoms of all residues (red), the coil and turn structural elements (blue), and the β-barrel (green) during the 100 ns production simulation. (B) Temporal evolution of the secondary structure elements. The beta sheets, turns, and coil regions are shown in yellow, green, and white, respectively. Markers β1 to β10 represent the ten different beta sheets of OmpT.

Specifically, the intactness of the catalytic triad was assessed by plotting the distances between atoms CG @D210 and CG @H212 (d1) and between atoms CG @D83 and CG @H212 (d2). The corresponding sampling and free energy landscape is shown in Figure A2.
Figure A2.
Projection of the free energy landscape representing free energy basins as a function of key distances d1 and d2 characterizing the active site center. The landscape’s free energy basin is concentrated around a narrow conformation of the active site.
Figure A2.
Projection of the free energy landscape representing free energy basins as a function of key distances d1 and d2 characterizing the active site center. The landscape’s free energy basin is concentrated around a narrow conformation of the active site.

References
- Rupprecht, K.R.; Gordon, G.; Lundrigan, M.; Gayda, R.C.; Markovitz, A.; Earhart, C. Omp T: Escherichia coli K-12 Structural Gene for Protein a (3b). J. Bacteriol. 1983, 153, 1104–1106. [Google Scholar] [CrossRef] [Green Version]
- Sugimura, K.; Nishihara, T. Purification, Characterization, and Primary Structure of Escherichia coli Protease VII with Specificity for Paired Basic Residues: Identity of Protease VII and OmpT. J. Bacteriol. 1988, 170, 5625–5632. [Google Scholar] [CrossRef] [Green Version]
- Sedliaková, M.; Masek, F.; Slezáriková, V.; Pirsel, M. The Effect of the OmpT Protease on Excision Repair in UV-Irradiated Escherichia Coli. J. Photochem. Photobiol. B 1997, 41, 245–248. [Google Scholar] [CrossRef]
- Stumpe, S.; Schmid, R.; Stephens, D.L.; Georgiou, G.; Bakker, E.P. Identification of OmpT as the Protease That Hydrolyzes the Antimicrobial Peptide Protamine before It Enters Growing Cells of Escherichia Coli. J. Bacteriol. 1998, 180, 4002–4006. [Google Scholar] [CrossRef] [Green Version]
- Kukkonen, M.; Korhonen, T.K. The Omptin Family of Enterobacterial Surface Proteases/Adhesins: From Housekeeping in Escherichia coli to Systemic Spread of Yersinia pestis. Int. J. Med. Microbiol. 2004, 294, 7–14. [Google Scholar] [CrossRef] [PubMed]
- Haiko, J.; Suomalainen, M.; Ojala, T.; Lähteenmäki, K.; Korhonen, T.K. Invited Review: Breaking Barriers--Attack on Innate Immune Defences by Omptin Surface Proteases of Enterobacterial Pathogens. Innate Immun. 2009, 15, 67–80. [Google Scholar] [CrossRef] [Green Version]
- Kramer, R.A.; Dekker, N.; Egmond, M.R. Identification of Active Site Serine and Histidine Residues in Escherichia coli Outer Membrane Protease OmpT. FEBS Lett. 2000, 468, 220–224. [Google Scholar] [CrossRef] [Green Version]
- Kramer, R.A.; Vandeputte-Rutten, L.; de Roon, G.J.; Gros, P.; Dekker, N.; Egmond, M.R. Identification of Essential Acidic Residues of Outer Membrane Protease OmpT Supports a Novel Active Site. FEBS Lett. 2001, 505, 426–430. [Google Scholar] [CrossRef] [Green Version]
- Vandeputte-Rutten, L.; Kramer, R.A.; Kroon, J.; Dekker, N.; Egmond, M.R.; Gros, P. Crystal Structure of the Outer Membrane Protease OmpT from Escherichia coli Suggests a Novel Catalytic Site. EMBO J. 2001, 20, 5033–5039. [Google Scholar] [CrossRef] [Green Version]
- Eren, E.; Murphy, M.; Goguen, J.; van den Berg, B. An Active Site Water Network in the Plasminogen Activator Pla from Yersinia pestis. Structure 2010, 18, 809–818. [Google Scholar] [CrossRef]
- Baaden, M.; Meier, C.; Sansom, M.S.P. A Molecular Dynamics Investigation of Mono and Dimeric States of the Outer Membrane Enzyme OMPLA. J. Mol. Biol. 2003, 331, 177–189. [Google Scholar] [CrossRef]
- Faraldo-Gómez, J.D.; Smith, G.R.; Sansom, M.S.P. Molecular Dynamics Simulations of the Bacterial Outer Membrane Protein FhuA: A Comparative Study of the Ferrichrome-Free and Bound States. Biophys. J. 2003, 85, 1406–1420. [Google Scholar] [CrossRef] [PubMed] [Green Version]
- Baaden, M.; Sansom, M.S.P. OmpT: Molecular Dynamics Simulations of an Outer Membrane Enzyme. Biophys. J. 2004, 87, 2942–2953. [Google Scholar] [CrossRef] [PubMed] [Green Version]
- Bond, P.J.; Faraldo-Gómez, J.D.; Deol, S.S.; Sansom, M.S.P. Membrane Protein Dynamics and Detergent Interactions within a Crystal: A Simulation Study of OmpA. Proc. Natl. Acad. Sci. USA 2006, 103, 9518–9523. [Google Scholar] [CrossRef] [PubMed] [Green Version]
- Koehler Leman, J.; Ulmschneider, M.B.; Gray, J.J. Computational Modeling of Membrane Proteins. Proteins 2015, 83, 1–24. [Google Scholar] [CrossRef] [PubMed] [Green Version]
- Zhang, Y.; Baaden, M.; Yan, J.; Shao, J.; Qiu, S.; Wu, Y.; Ding, Y. The Molecular Recognition Mechanism for Superoxide Dismutase Presequence Binding to the Mitochondrial Protein Import Receptor Tom20 from Oryza Sativa Involves an LRTLA Motif. J. Phys. Chem. B 2010, 114, 13839–13846. [Google Scholar] [CrossRef]
- Tai, K.; Baaden, M.; Murdock, S.; Wu, B.; Ng, M.H.; Johnston, S.; Boardman, R.; Fangohr, H.; Cox, K.; Essex, J.W.; et al. Three Hydrolases and a Transferase: Comparative Analysis of Active-Site Dynamics via the BioSimGrid Database. J. Mol. Graph. Model. 2007, 25, 896–902. [Google Scholar] [CrossRef] [Green Version]
- Neri, M.; Baaden, M.; Carnevale, V.; Anselmi, C.; Maritan, A.; Carloni, P. Microseconds Dynamics Simulations of the Outer-Membrane Protease T. Biophys. J. 2008, 94, 71–78. [Google Scholar] [CrossRef] [Green Version]
- Brannon, J.R.; Burk, D.L.; Leclerc, J.-M.; Thomassin, J.-L.; Portt, A.; Berghuis, A.M.; Gruenheid, S.; Le Moual, H. Inhibition of Outer Membrane Proteases of the Omptin Family by Aprotinin. Infect. Immun. 2015, 83, 2300–2311. [Google Scholar] [CrossRef] [Green Version]
- Cox, K.; Bond, P.J.; Grottesi, A.; Baaden, M.; Sansom, M.S.P. Outer Membrane Proteins: Comparing X-Ray and NMR Structures by MD Simulations in Lipid Bilayers. Eur. Biophys. J. 2008, 37, 131–141. [Google Scholar] [CrossRef]
- Faraldo-Gómez, J.D.; Forrest, L.R.; Baaden, M.; Bond, P.J.; Domene, C.; Patargias, G.; Cuthbertson, J.; Sansom, M.S.P. Conformational Sampling and Dynamics of Membrane Proteins from 10-Nanosecond Computer Simulations. Proteins 2004, 57, 783–791. [Google Scholar] [CrossRef] [PubMed]
- Delaunay, M.; Ha-Duong, T. Computational Tools and Strategies to Develop Peptide-Based Inhibitors of Protein–protein Interactions. Methods Mol. Biol. 2022, 2405, 205–230. [Google Scholar] [CrossRef] [PubMed]
- Andrei, R.M.; Callieri, M.; Zini, M.F.; Loni, T.; Maraziti, G.; Pan, M.C.; Zoppè, M. Intuitive Representation of Surface Properties of Biomolecules Using BioBlender. BMC Bioinform. 2012, 13 (Suppl. S4), S16. [Google Scholar] [CrossRef] [Green Version]
- Laureanti, J.; Brandi, J.; Offor, E.; Engel, D.; Rallo, R.; Ginovska, B.; Martinez, X.; Baaden, M.; Baker, N.A. Visualizing Biomolecular Electrostatics in Virtual Reality with UnityMol-APBS. Protein Sci. 2020, 29, 237–246. [Google Scholar] [CrossRef] [Green Version]
- Huber, R.; Kukla, D.; Bode, W.; Schwager, P.; Bartels, K.; Deisenhofer, J.; Steigemann, W. Structure of the Complex Formed by Bovine Trypsin and Bovine Pancreatic Trypsin Inhibitor. II. Crystallographic Refinement at 1.9 A Resolution. J. Mol. Biol. 1974, 89, 73–101. [Google Scholar] [CrossRef]
- Krieger, M.; Kay, L.M.; Stroud, R.M. Structure and Specific Binding of Trypsin: Comparison of Inhibited Derivatives and a Model for Substrate Binding. J. Mol. Biol. 1974, 83, 209–230. [Google Scholar] [CrossRef] [PubMed]
- Syed Ibrahim, B.; Pattabhi, V. Trypsin Inhibition by a Peptide Hormone: Crystal Structure of Trypsin-Vasopressin Complex. J. Mol. Biol. 2005, 348, 1191–1198. [Google Scholar] [CrossRef]
- Lanrezac, A.; Laurent, B.; Santuz, H.; Férey, N.; Baaden, M. Fast and Interactive Positioning of Proteins within Membranes. Algorithms 2022, 15, 415. [Google Scholar] [CrossRef]
- Deol, S.S.; Bond, P.J.; Domene, C.; Sansom, M.S.P. Lipid-Protein Interactions of Integral Membrane Proteins: A Comparative Simulation Study. Biophys. J. 2004, 87, 3737–3749. [Google Scholar] [CrossRef] [Green Version]
- Khalid, S.; Bond, P.J.; Deol, S.S.; Sansom, M.S.P. Modeling and Simulations of a Bacterial Outer Membrane Protein: OprF from Pseudomonas Aeruginosa. Proteins 2006, 63, 6–15. [Google Scholar] [CrossRef]
- Goose, J.E.; Sansom, M.S.P. Reduced Lateral Mobility of Lipids and Proteins in Crowded Membranes. PLoS Comput. Biol. 2013, 9, e1003033. [Google Scholar] [CrossRef] [PubMed] [Green Version]
- Ha-Duong, T. Coarse-Grained Models of the Proteins Backbone Conformational Dynamics. Adv. Exp. Med. Biol. 2014, 805, 157–169. [Google Scholar] [CrossRef] [PubMed]
- Stansfeld, P.J.; Goose, J.E.; Caffrey, M.; Carpenter, E.P.; Parker, J.L.; Newstead, S.; Sansom, M.S.P. MemProtMD: Automated Insertion of Membrane Protein Structures into Explicit Lipid Membranes. Structure 2015, 23, 1350–1361. [Google Scholar] [CrossRef] [Green Version]
- Berman, H.M.; Westbrook, J.; Feng, Z.; Gilliland, G.; Bhat, T.N.; Weissig, H.; Shindyalov, I.N.; Bourne, P.E. The Protein Data Bank. Nucleic Acids Res. 2000, 28, 235–242. [Google Scholar] [CrossRef] [PubMed] [Green Version]
- Morris, G.M.; Goodsell, D.S.; Halliday, R.S.; Huey, R.; Hart, W.E.; Belew, R.K.; Olson, A.J. Automated Docking Using a Lamarckian Genetic Algorithm and an Empirical Binding Free Energy Function. J. Comput. Chem. 1998, 19, 1639–1662. [Google Scholar] [CrossRef]
- Krieger, E.; Koraimann, G.; Vriend, G. Increasing the Precision of Comparative Models with YASARA NOVA--a Self-Parameterizing Force Field. Proteins 2002, 47, 393–402. [Google Scholar] [CrossRef]
- Lavigne, P.; Bagu, J.R.; Boyko, R.; Willard, L.; Holmes, C.F.; Sykes, B.D. Structure-Based Thermodynamic Analysis of the Dissociation of Protein Phosphatase-1 Catalytic Subunit and Microcystin-LR Docked Complexes. Protein Sci. 2000, 9, 252–264. [Google Scholar] [CrossRef] [Green Version]
- Vriend, G. WHAT IF: A Molecular Modeling and Drug Design Program. J. Mol. Graph. 1990, 8, 52–56. [Google Scholar] [CrossRef]
- Faraldo-Gómez, J.D.; Smith, G.R.; Sansom, M.S.P. Setting up and Optimization of Membrane Protein Simulations. Eur. Biophys. J. 2002, 31, 217–227. [Google Scholar] [CrossRef]
- Hussain, S.; Bernstein, H.D. The Bam Complex Catalyzes Efficient Insertion of Bacterial Outer Membrane Proteins into Membrane Vesicles of Variable Lipid Composition. J. Biol. Chem. 2018, 293, 2959–2973. [Google Scholar] [CrossRef]
- Van Der Spoel, D.; Lindahl, E.; Hess, B.; Groenhof, G.; Mark, A.E.; Berendsen, H.J.C. GROMACS: Fast, Flexible, and Free. J. Comput. Chem. 2005, 26, 1701–1718. [Google Scholar] [CrossRef] [PubMed]
- Abraham, M.J.; Murtola, T.; Schulz, R.; Páll, S.; Smith, J.C.; Hess, B.; Lindahl, E. GROMACS: High Performance Molecular Simulations through Multi-Level Parallelism from Laptops to Supercomputers. SoftwareX 2015, 1–2, 19–25. [Google Scholar] [CrossRef] [Green Version]
- van Gunsteren, W.; Berendsen, H. Gromos-87 Manual; Biomos: Groningen, The Netherlands, 1987. [Google Scholar]
- Berendsen, H.; Postma, J.; van Gunsteren, W.; DiNola, A.; Hermans, J. Intermolecular Forces; D. Reidel: Dordrecht, The Netherlands, 1981. [Google Scholar]
- Berendsen, H.J.C.; Postma, J.P.M.; van Gunsteren, W.F.; DiNola, A.; Haak, J.R. Molecular Dynamics with Coupling to an External Bath. J. Chem. Phys. 1984, 81, 3684–3690. [Google Scholar] [CrossRef] [Green Version]
- Essmann, U.; Perera, L.; Berkowitz, M.L.; Darden, T.; Lee, H.; Pedersen, L.G. A Smooth Particle Mesh Ewald Method. J. Chem. Phys. 1995, 103, 8577–8593. [Google Scholar] [CrossRef] [Green Version]
- Hess, B.; Bekker, H.; Berendsen, H.J.C.; Fraaije, J.G.E.M. LINCS: A Linear Constraint Solver for Molecular Simulations. J. Comput. Chem. 1997, 18, 1463–1472. [Google Scholar] [CrossRef]
- Humphrey, W.; Dalke, A.; Schulten, K. VMD: Visual Molecular Dynamics. J. Mol. Graph. 1996, 14, 33–38. [Google Scholar] [CrossRef]
- Martinez, X.; Baaden, M. UnityMol Prototype for FAIR Sharing of Molecular-Visualization Experiences: From Pictures in the Cloud to Collaborative Virtual Reality Exploration in Immersive 3D Environments. Acta Crystallogr. D Struct. Biol. 2021, 77, 746–754. [Google Scholar] [CrossRef]
- R Core Team. R: A Language and Environment for Statistical Computing; R. Foundation for Statistical Computing: Vienna, Austria, 2013. [Google Scholar]
- Case, D.; Darden, T.; Cheatham, T., III; Simmerling, C.; Wang, J.; Duke, R.; Luo, R.; Walker, R.; Zhang, W.; Merz, K.; et al. AMBER 11; University of California: San Francisco, CA, USA, 2010. [Google Scholar]
- Shao, J.; Zhang, Y.; Yu, J.; Guo, L.; Ding, Y. Isolation of Thylakoid Membrane Complexes from Rice by a New Double-Strips BN/SDS-PAGE and Bioinformatics Prediction of Stromal Ridge Subunits Interaction. PLoS ONE 2011, 6, e20342. [Google Scholar] [CrossRef] [Green Version]
- Strockbine, B.; Rizzo, R.C. Binding of Antifusion Peptides with HIVgp41 from Molecular Dynamics Simulations: Quantitative Correlation with Experiment. Proteins 2007, 67, 630–642. [Google Scholar] [CrossRef]
- Wang, J.; Cieplak, P.; Kollman, P.A. How Well Does a Restrained Electrostatic Potential (RESP) Model Perform in Calculating Conformational Energies of Organic and Biological Molecules? J. Comput. Chem. 2000, 21, 1049–1074. [Google Scholar] [CrossRef]
- Qiu, D.; Shenkin, P.S.; Hollinger, F.P.; Still, W.C. The GB/SA Continuum Model for Solvation. A Fast Analytical Method for the Calculation of Approximate Born Radii. J. Phys. Chem. A 1997, 101, 3005–3014. [Google Scholar] [CrossRef]
- Tsui, V.; Case, D.A. Molecular Dynamics Simulations of Nucleic Acids with a Generalized Born Solvation Model. J. Am. Chem. Soc. 2000, 122, 2489–2498. [Google Scholar] [CrossRef]
- Massova, I.; Kollman, P.A. Computational Alanine Scanning To Probe Protein−Protein Interactions: A Novel Approach To Evaluate Binding Free Energies. J. Am. Chem. Soc. 1999, 121, 8133–8143. [Google Scholar] [CrossRef]
- Nosé, S. A Unified Formulation of the Constant Temperature Molecular Dynamics Methods. J. Chem. Phys. 1984, 81, 511–519. [Google Scholar] [CrossRef] [Green Version]
- Hoover, W.G. Canonical Dynamics: Equilibrium Phase-Space Distributions. Phys. Rev. A Gen. Phys. 1985, 31, 1695–1697. [Google Scholar] [CrossRef] [PubMed] [Green Version]
- Parrinello, M.; Rahman, A. Polymorphic Transitions in Single Crystals: A New Molecular Dynamics Method. J. Appl. Phys. 1981, 52, 7182–7190. [Google Scholar] [CrossRef]
- Nosé, S.; Klein, M.L. Constant Pressure Molecular Dynamics for Molecular Systems. Mol. Phys. 1983, 50, 1055–1076. [Google Scholar] [CrossRef]
- Kumar, S.; Rosenberg, J.M.; Bouzida, D.; Swendsen, R.H.; Kollman, P.A. THE Weighted Histogram Analysis Method for Free-Energy Calculations on Biomolecules. I. The Method. J. Comput. Chem. 1992, 13, 1011–1021. [Google Scholar] [CrossRef]
- Balgavý, P.; Dubnicková, M.; Kucerka, N.; Kiselev, M.A.; Yaradaikin, S.P.; Uhríková, D. Bilayer Thickness and Lipid Interface Area in Unilamellar Extruded 1,2-Diacylphosphatidylcholine Liposomes: A Small-Angle Neutron Scattering Study. Biochim. Biophys. Acta. 2001, 1512, 40–52. [Google Scholar] [CrossRef] [Green Version]
- Kramer, R.A.; Brandenburg, K.; Vandeputte-Rutten, L.; Werkhoven, M.; Gros, P.; Dekker, N.; Egmond, M.R. Lipopolysaccharide Regions Involved in the Activation of Escherichia coli Outer Membrane Protease OmpT. Eur. J. Biochem. 2002, 269, 1746–1752. [Google Scholar] [CrossRef]
- Eren, E.; van den Berg, B. Structural Basis for Activation of an Integral Membrane Protease by Lipopolysaccharide. J. Biol. Chem. 2012, 287, 23971–23976. [Google Scholar] [CrossRef] [PubMed] [Green Version]
- Sinsinbar, G.; Gudlur, S.; Metcalf, K.J.; Mrksich, M.; Nallani, M.; Liedberg, B. Role of Lipopolysaccharide in Protecting OmpT from Autoproteolysis during In Vitro Refolding. Biomolecules. 2020, 10, 922. [Google Scholar] [CrossRef] [PubMed]
- Jurrus, E.; Engel, D.; Star, K.; Monson, K.; Brandi, J.; Felberg, L.E.; Brookes, D.H.; Wilson, L.; Chen, J.; Liles, K.; et al. Improvements to the APBS Biomolecular Solvation Software Suite. Protein Sci. 2018, 27, 112–128. [Google Scholar] [CrossRef] [PubMed]
Figure 1.
(A) The root mean square carbon alpha fluctuations (RMSF) and (B) the solvent accessible surface area (SASA) as a function of the residue number for the ARRA-OmpT complex. A structural snapshot highlights the position of the L1, L2, and L3 loops on the secondary structure of the enzyme, as seen from above the membrane. The numbers of the residues are given for reference.

Figure 2.
(A) Superposition of two conformations of the R301 residue of the ARRA-OmpT complex at 0 ns (brown) and at 100 ns (blue). The neighboring residues D85 and D97 of OmpT are in close contact with R301 and are highlighted in red. (B) The two-dimensional free energy landscape as a function of distances s1 and s2 (defined in the text) for the 100 ns simulation. The asterisk (*) and cross (+) indicate the distances for the first and last simulation snapshots, respectively. (C) Time series of the number of hydrogen bonds between selected active site residues (E27 and D208) of OmpT and basic residue R300 of the ARRA peptide. Hydrogen bonds were calculated with a donor-acceptor distance of 3.5 Å and an angle of 35° between donor-H-acceptor positions. (D) Time series of closest contact distances of salt bridges between selected active site residues (D97 and D85) of OmpT and basic residue R301 of the ARRA peptide. The distance of salt bridges was calculated using the smallest native distance between two residues.

Figure 3.
Temporal evolution of the distances δ (A) and ε (B) defined in the text. The boundaries of these oscillating values are given as lines δ1, δ2, ε1, and ε2. (C) Boltzman-weighted 2D energy plot of the eigenvector of the first principal component XV1 (vertical) against the ε-distance distribution (horizontal). The two observed minima are labeled according to their correspondence with the ε1- (*) and ε2-distance (+) limits. The porcupine diagram of the first eigenvector for the simulation of ARRA-OmpT. The model is shown as a backbone trace. The arrows at each backbone atom indicate the direction of the eigenvector.

Figure 4.
(A) The major active site residues in the extracellular part of OmpT. (B) Number of hydrogen bonds between active site residues plotted against time for the holo–protein system. Hydrogen bonds were calculated using a donor–acceptor distance of 3.5 Å and an angle of 35° between donor–H–acceptor positions. (C) Salt bridge interactions between active site residues (H212-D210, R300-E27, and R300-D210) plotted against time. Salt bridge distance was calculated using the smallest native distance between two residues.

Figure 5.
Binding affinities estimated by computer-assisted alanine scanning for mutations of the ARRA-OmpT complex (). results for 10 single mutations in either OmpT or ARRA in the initial structure at 0 ns (black) and averaged over 10 structures at the end of the 100 ns simulation (shaded; error bars represent standard deviations). For D85, D97, and D83, there was no interaction at 0 ns. The corresponding bars with the value zero are not displayed.

Figure 6.
(A) The reference group and the pull group are used for umbrella sampling. The ligand backbone is shown as tube in red and blue, representing the initial and final positions of the ligand moving away from OmpT in the z-direction, shown next to the free energy landscape for binding of the ARRA and AKKA ligands to OmpT. (B) Three different snapshots were selected for umbrella sampling with the COM distance between the reference and pull groups being 2.8, 3.7, and 4.4 nm, respectively.

Figure 7.
Two putative water molecules possibly involved in the catalytic mechanism (A). The black arrow describes the direction of a nucleophilic attack on the cleavable peptide bond of substrate residue R300. (B) The occupancy of the two types of “catalytic” water position, W1 and W2 (defined in the text), is indicated by a colored bar as a function of simulation time.


Table 1.
Selected distances (in Å) within the active site of the protein.
| Distance Id | Description | Holo form Distance 1,2 in Å | Apo form Distance 1,3 in Å |
|---|---|---|---|
| Active Site Core | |||
| A | H212-D210 | 1.813 (±0.101) | 1.875 (±0.136) |
| B | H@D85-O@D97 | 2.018 (±0.216) | 2.010 (±0.351) |
| Involving S99 | |||
| C | O@D83-H@S99 | 1.948 (±0.228) | 2.024 (±0.321) |
| Involving Substrate | |||
| D | R300-E27 | 2.337 (±0.319) | \ |
| E | R300-D210 | 3.804 (±0.390) | \ |
| F | R301-D85 | 2.766 (±0.556) | \ |
| G | R301-D97 | 2.888 (±1.133) | \ |
1 Distance was averaged during the last 10 ns of the entire simulation. Values in parentheses represent the standard deviation of the averaged distance. 2,3 Distance was calculated for the holo enzyme ARRA-OmpT and the apo enzyme OmpT, respectively.
Disclaimer/Publisher’s Note: The statements, opinions and data contained in all publications are solely those of the individual author(s) and contributor(s) and not of MDPI and/or the editor(s). MDPI and/or the editor(s) disclaim responsibility for any injury to people or property resulting from any ideas, methods, instructions or products referred to in the content. |
© 2023 by the authors. Licensee MDPI, Basel, Switzerland. This article is an open access article distributed under the terms and conditions of the Creative Commons Attribution (CC BY) license (https://creativecommons.org/licenses/by/4.0/).
Share and Cite
MDPI and ACS Style
Zhang, Y.; Baaden, M. Molecular Insights into Substrate Binding of the Outer Membrane Enzyme OmpT. Catalysts 2023, 13, 214. https://doi.org/10.3390/catal13020214
AMA Style
Zhang Y, Baaden M. Molecular Insights into Substrate Binding of the Outer Membrane Enzyme OmpT. Catalysts. 2023; 13(2):214. https://doi.org/10.3390/catal13020214
Chicago/Turabian StyleZhang, Yubo, and Marc Baaden. 2023. "Molecular Insights into Substrate Binding of the Outer Membrane Enzyme OmpT" Catalysts 13, no. 2: 214. https://doi.org/10.3390/catal13020214
Note that from the first issue of 2016, this journal uses article numbers instead of page numbers. See further details here.