Article

Redrawing HER Volcano with Interfacial Processes—The Role of Hydrogen Spillover in Boosting H2 Evolution in Alkaline Media

by
Sanjin J. Gutić
1,
Dino Metarapi
2,
Aleksandar Z. Jovanović
3,
Goitom K. Gebremariam
3,4,
Ana S. Dobrota
3,
Bojana Nedić Vasiljević
3 and
Igor A. Pašti
3,*
1
Department of Chemistry, Faculty of Science, University of Sarajevo, 71000 Sarajevo, Bosnia and Herzegovina
2
National Institute of Chemistry, 1000 Ljubljana, Slovenia
3
Faculty of Physical Chemistry, University of Belgrade, 11000 Belgrade, Serbia
4
Department of Chemistry, National Higher Education and Research Institute, Mai Nefhi College of Science, Asmara 12676, Eritrea
*
Author to whom correspondence should be addressed.
Catalysts 2023, 13(1), 89; https://doi.org/10.3390/catal13010089
Submission received: 26 November 2022 / Revised: 28 December 2022 / Accepted: 28 December 2022 / Published: 1 January 2023

Abstract

:
The requirements for the efficient replacement of fossil fuel, combined with the growing energy crisis, places focus on hydrogen production. Efficient and cost-effective electrocatalysts are needed for H2 production, and novel strategies for their discovery must be developed. Here, we utilized Kinetic Monte Carlo (KMC) simulations to demonstrate that hydrogen evolution reaction (HER) can be boosted via hydrogen spillover to the support when the catalyst surface is largely covered by adsorbed hydrogen under operating conditions. Based on the insights from KMC, we synthesized a series of reduced graphene-oxide-supported catalysts and compared their activities towards HER in alkaline media with that of corresponding pure metals. For Ag, Au, and Zn, the support effect is negative, but for Pt, Pd, Fe, Co, and Ni, the presence of the support enhances HER activity. The HER volcano, constructed using calculated hydrogen binding energies and measured HER activities, shows a positive shift of the strong binding branch. This work demonstrates the possibilities of metal–support interface engineering for producing effective HER catalysts and provides general guidelines for choosing novel catalyst–support combinations for electrocatalytic hydrogen production.

Graphical Abstract

1. Introduction

Hydrogen Evolution Reaction (HER) has always had a special place in the hearts of electrochemists. However, as outlined by Strmcnik et al. [1], even after more than 70 years of active research, significant technological problems hindered the widespread use of water electrolysis for hydrogen production. Irrespective of whether it is about HER in acidic or alkaline media [2,3], the authors have outlined three key issues related to the widespread use of electrolysis for H2 production: (1) low energy efficiency, (2) poor stability of the electrodes under operating conditions, and (3) no proper replacement for noble metals which are the best catalysts for this purpose [1]. However, the acute energy crisis amplifies the search for new solutions for efficient H2 production.
To this day, different classes of materials have been used for HER. These include pure metallic phases (noble and non-noble metals, with Ni being the industrial standard for HER in alkaline media), alloys (Ni-based alloys being the best known, such as NiMo), transition metal oxyhydroxides, carbides, sulfides, and others [4,5,6,7,8]. With different materials classes available, understanding catalytic trends is of great importance. Considering the HER activity, catalytic activities of different metals are usually rationalized in the form of the volcano plot, initially defined by Trasatti [9], which was modernized using HER activities in acidic media, the hydrogen adsorption energies from the DFT calculations by Nørskov et al. [10], and revisited by Quaino et al. [11]. The DFT energies-based volcano was also demonstrated for HER in alkaline media [12]. Being a consequence of the Sabatier principle [13], the volcano curve assembles sp metals, coinage metals, and d-metals. Their HER catalytic activities (measured as the exchange current density, j0) span over six orders of magnitude, which is essentially the consequence of different affinities towards hydrogen adsorption. However, other catalytic activity descriptors besides hydrogen–metal bond strength are also considered in the modern literature [1], while it was suggested that three key parameters are essential to understanding HER catalytic trends. These include Hads and OHads energetics, the nature of proton (hydrogen) donors, and the presence of spectating species.
The traditional [9] and DFT-based [10,12] HER volcanoes assemble monometallic catalysts. However, the Hads energetics-based search using optimal H binding strength, corresponding to the apex of HER volcano, is used quite generally. However, it is well-accepted that interfacial processes can affect HER activity, such as the interfacial dissociation of water at transition-metal oxy-hydroxides-decorated metallic surfaces [14,15]. On the other hand, hydrogen spillover has been known for a long time [16,17] and was considered of high importance for the electrocatalytic process [18,19], but also others, such as hydrogen storage [20]. Thus, there is a question of whether it is possible to use interfacial processes to change the volcano’s shape, shift it towards higher HER activities, or move its apex towards cheaper HER catalysts. Pt generally shows exceptional HER activity in acidic media but much lower in alkaline [21]. Hence, all three scenarios could be possible in the case of HER in alkaline solutions. By utilizing the interfacial process of hydrogen spillover, some highly active catalysts have been developed, being functional either in acidic [22] or alkaline media [23,24]. For example, Tan et al. [22] performed a large-scale theoretical screening of hydrogen-spillover-based binary catalysts, identifying 11 possible candidates for new electrocatalysts, of which Pt1Ir1-MoS2 was experimentally prepared. This catalyst displayed excellent HER activity in acidic media, as predicted.
This work also begins with theoretical analysis but at the level of Kinetic Monte Carlo (KMC) simulations. In contrast to electronic structure calculations, such as the ones based on DFT, the KMC simulations performed here do not provide insight into any new physical or chemical process other than those fed to the code. However, it allows the analysis of the system evolution at spatial and temporal scales which are currently inaccessible by DFT, assuming that the rates of elementary processes are reasonable. First, based on the results of KMC simulations, we have derived some general guidelines for choosing catalyst-support combinations. Then, using generally available data for hydrogen adsorption energetics and relying on previous experience with reduced graphene oxide (rGO) as catalyst support [23,24], a series of M@rGO catalysts (M = Ag, Au, Ni, Fe, Co, Pt, Pd, or Zn) was prepared by electrodeposition route. HER activity measurements indicated the positive effect of the rGO support for metals that bind Hads strongly, in agreement with the prediction from KMC, thus changing the position of the strongly binding HER volcano branch.

2. Results and Discussion

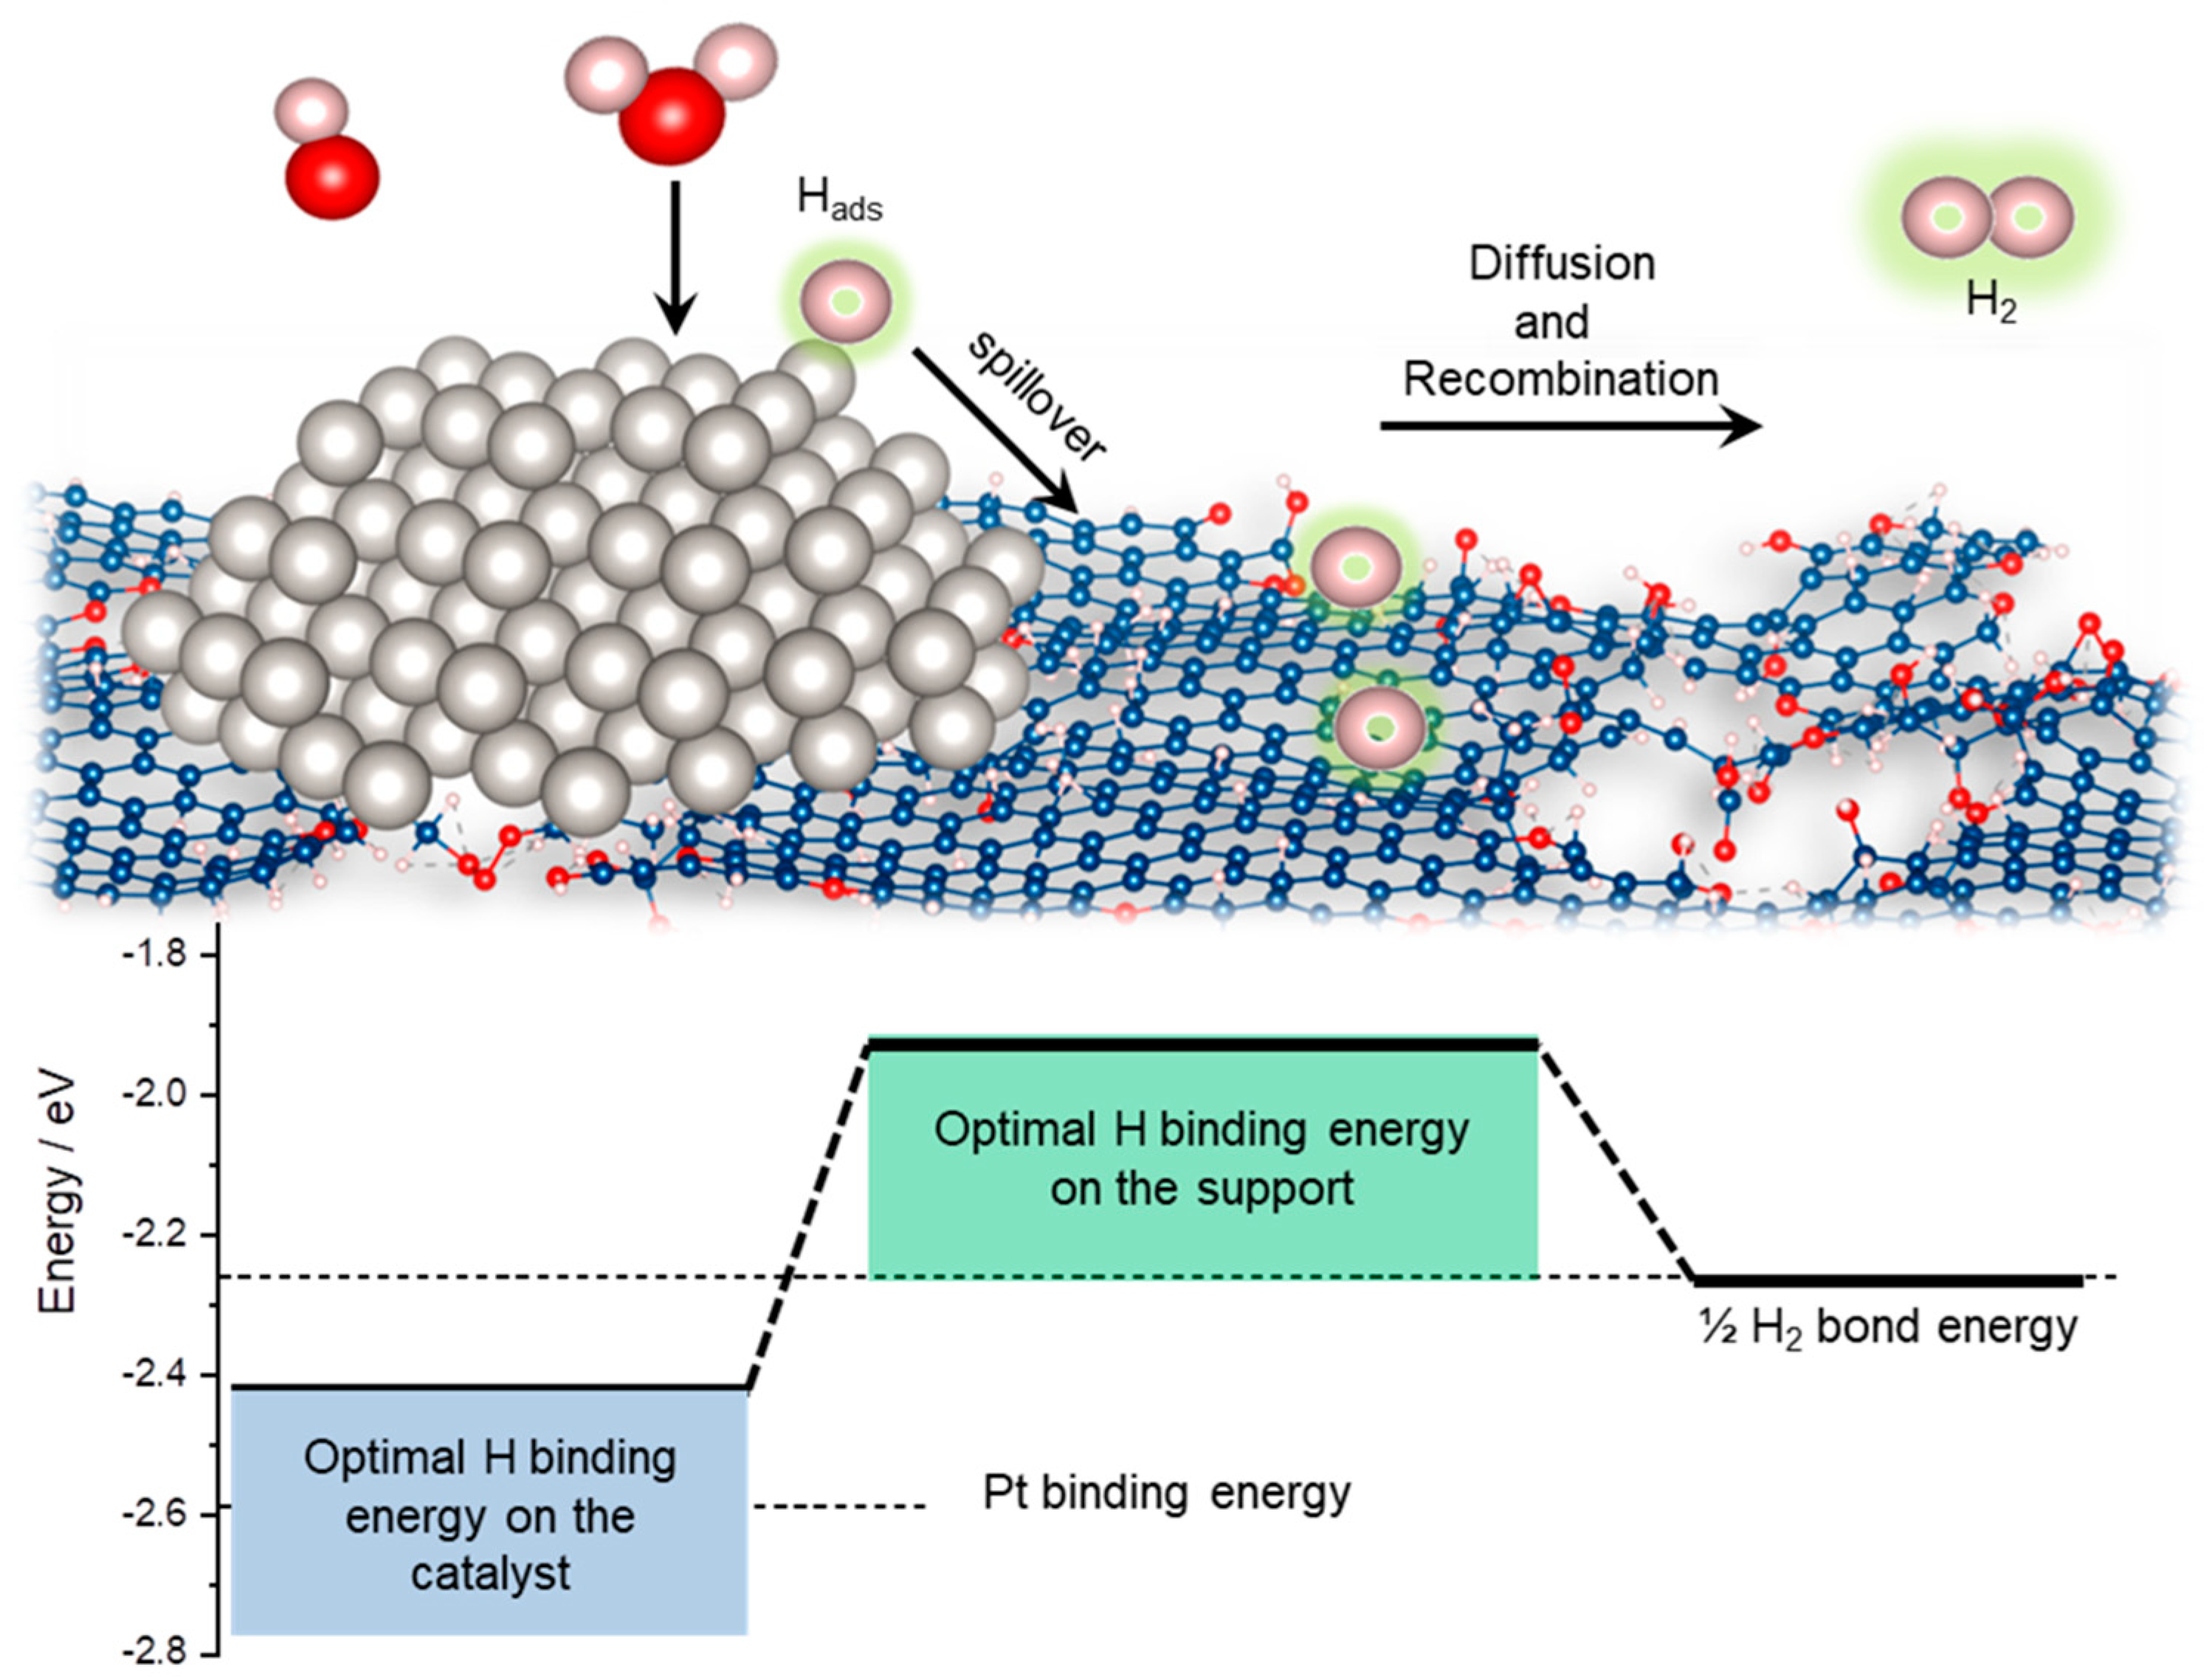
2.1. KMC Simulations—Model

Here, we consider hydrogen evolution in alkaline media, which starts with the water dissociation step to form adsorbed hydrogen on the catalyst surface (Volmer reaction):
H2O + e + (*C) → Hads + OH
where *C is the free adsorption site at the catalyst surface. In the next steps, Hads is removed from the surface either by Tafel (Equation (2)) or Heyrovsky reaction (Equation (3)):
Hads + Hads → H2 + 2(*C)
H2O + e + Hads → H2 + (*C) + OH.
HER will proceed via the above mechanism on the catalyst that is not supported or supported on a surface that cannot accept Hads, i.e., when hydrogen spillover is not operative. The overall reaction will either go through the Volmer–Tafel or Volmer–Heyrovsky combination [25]. For our consideration, such a scenario can be denoted as a “surface path”. If the catalyst is on a support that can accept Hads, equilibrium will be established between Hads on the catalyst surface and the fraction of Hads which has spilled on the support [25]:
Hads(*C) + (*S) → (*C) + Hads(*S)
where (*S) represents an adsorption site at the support surface. Now, Hads, which is on the support, can recombine to form H2:
Hads(*S) + Hads (*S) → H2 + 2(*S).
This path will be denoted as the “interface path”. Hads species adsorbed at the catalyst and support are not static, and surface diffusion occurs. Surface mobility is also a prerequisite for the spillover process to take place. Thus, Hads diffusion processes on C and S surfaces are essential parts of the interface path for HER.
Thus, the dynamics of our model systems is described by the processes mentioned above, split into direct and reversed ones. The geometry of the system contains 130 × 130 unit cells. Considering the usual sizes of transition metals lattice constants, this size would approximately match the 50 × 50 nm fraction of the surface. Domains of this size cannot be considered using first-principles calculations but are large enough to describe cooperative interactions between the catalyst and the support using KMC calculations. The cells represent adsorption sites; each site is described either as a catalyst site or a support site. When defining the system configurations, we kept the circular shape of catalysts islands on the support. However, considering the work of Chanda et al. [23], where HER was boosted by depositing reduced graphene oxide onto the Ni surface, we also considered another case where circular support islands are deposited onto the catalyst surface. To be more precise, this would correspond to a decorated catalyst surface, but for the sake of simplicity, we kept the same notation for the decorator (S) as for the support. It is possible because the interface length is what counts in our KMC model, while geometric effects are subtle (i.e., Hads transfer over convex or concave interface).
Similar to our previous work [26], we have performed conceptual modeling of HER on the supported (decorated) catalysts, where the reaction rates were 10n, where n is an integer number. It is in line with the fact that different elementary processes considered in our model have similar activation barriers. For example, all the elementary processes in H2 dissociation and spillover from Pd atoms to Au(111) and Cu(111), including surface diffusion, have kinetic barriers between 0.12 and 0.18 eV [27]. Moreover, Nilekar et al. [28] have shown that surface diffusion barriers on transition metals are approx. 12% of the adsorbate binding energy, thus for hydrogen 0.20–0.30 eV. HER activation energies on transition metal surfaces fall in a similar range as those for surface diffusion but also depend on the surface orientation [25]. Taking that the Arrhenius equation describes the rate constants of elementary processes, the reaction rate change from 0.01 to 100 corresponds to the activation energy change in the range ±0.12 eV. Thus, for n ranging from −2 to 2, the relative rates correspond to small variations in activation energies of different elementary processes considered in our model. Reported H2 rates are dimensionless but would correspond to the experimentally measured currents.

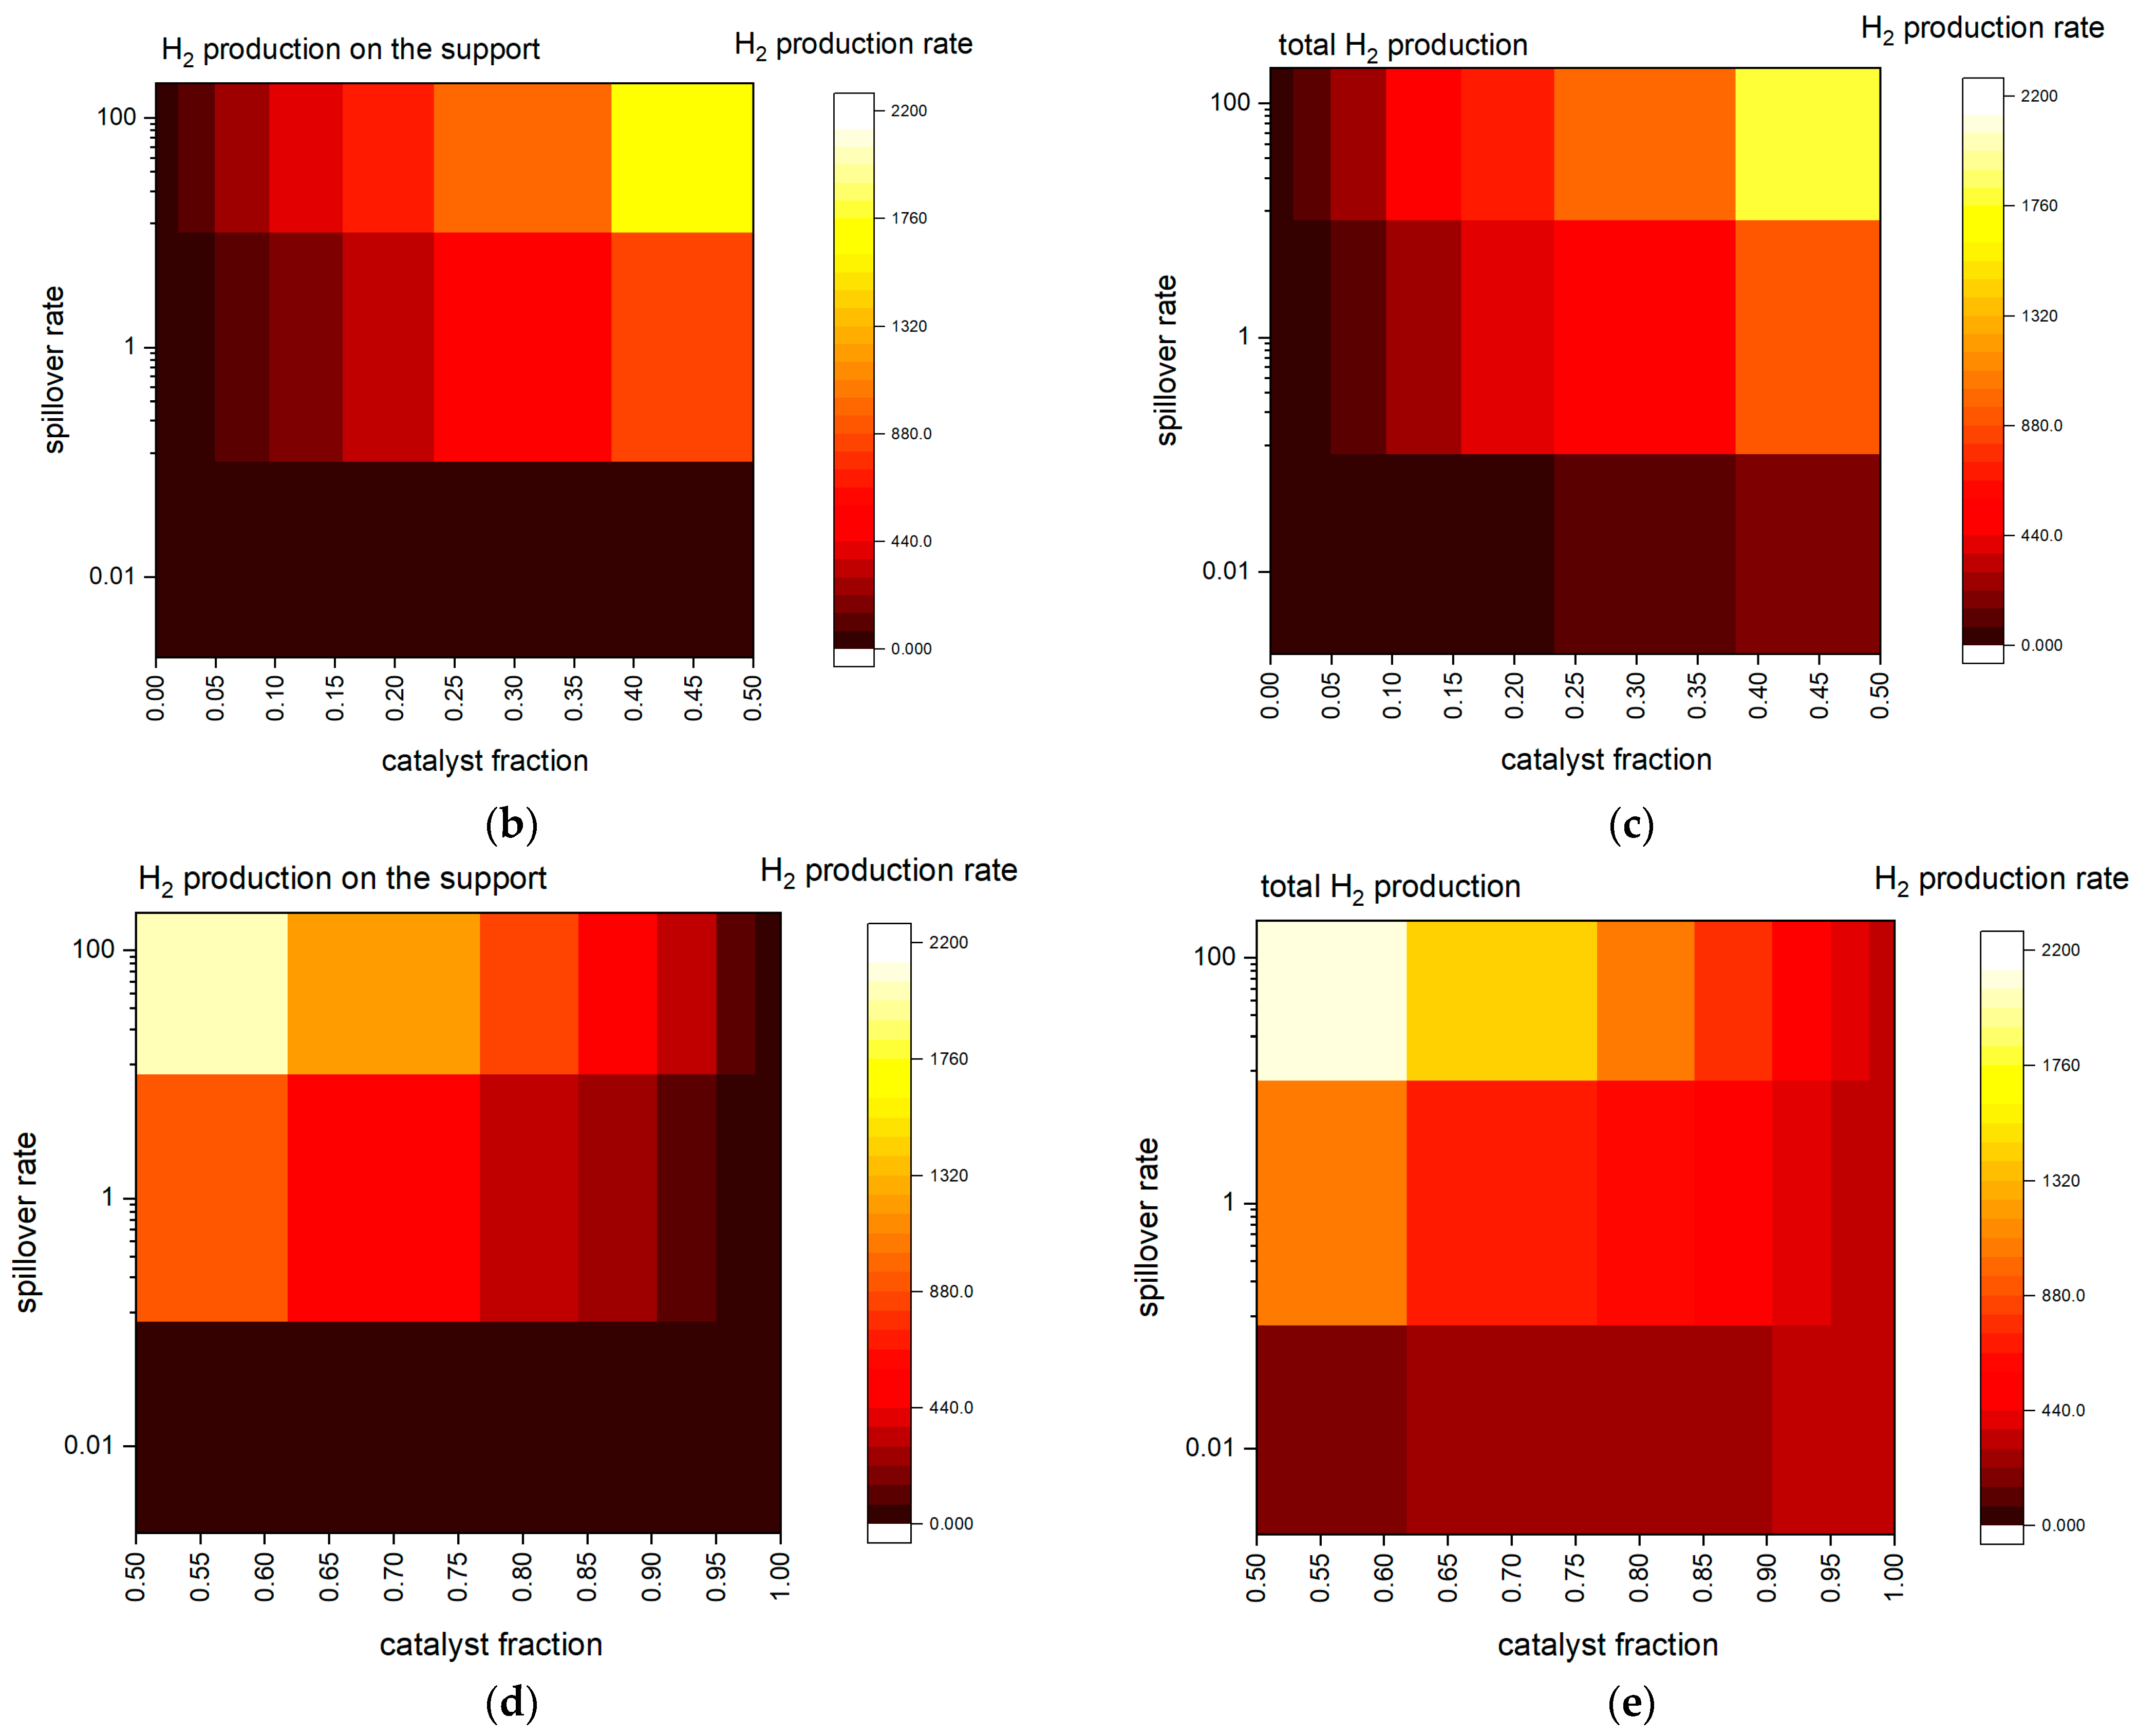
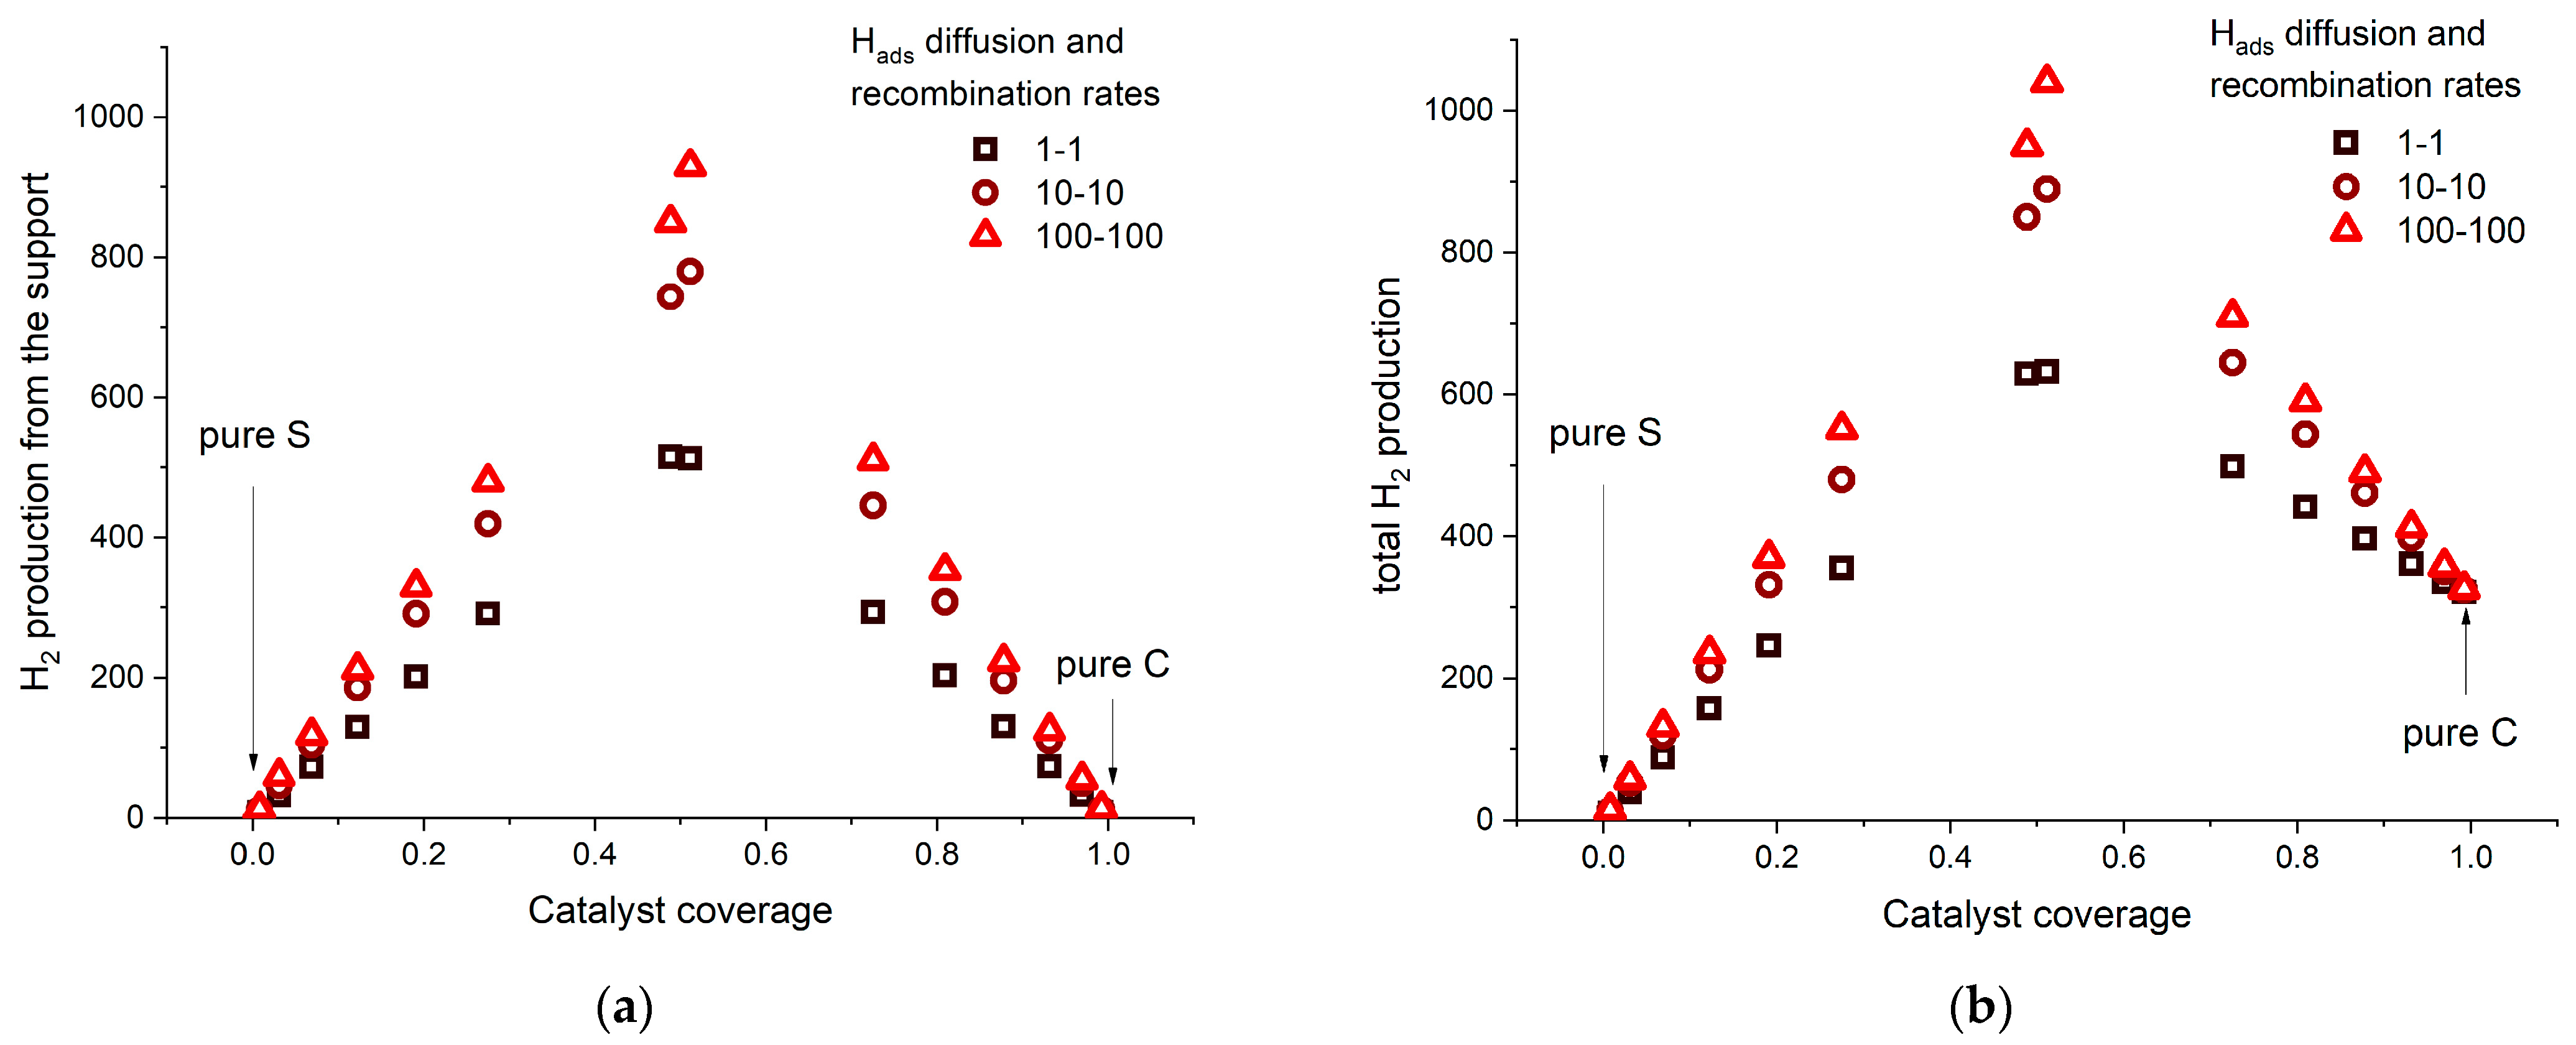
2.2. KMC Simulations—Insights

In the first set of calculations, we considered the case when Equation (1) is slower than all the other processes in the model (formal rate 0.01, all the other rates 1 or higher). This situation corresponds to slow water dissociation and formation of Hads, which is generally considered cumbersome for HER in alkaline media [29,30]. However, the situation is different for high HER overvoltages, where Hads formation becomes faster and Hads removal becomes the rate-determining step (RDS). For example, in the case of polycrystalline Ni, it was explicitly shown that the Heyrovsky reaction is the RDS at higher HER overvoltages, while the surface coverage by Hads is high. However, the metallic surfaces that bind Hads weakly, such as Ag and Au, will retain a low water dissociation rate and Hads coverage. In this case, the spillover rate and Hads desorption rate from S do not affect the total H2 production, while negligible amounts of H2 are formed via reaction (5). In this case, metal coverage by Hads is very low, below 0.01 monolayer (ML). Thus, Hads has a low probability of spilling on the support, irrespective of the spillover rate. For such a scenario, we can conclude that spillover has no significant effect on H2 production. Additionally, catalyst dispersion does not affect the H2 production rate in this case.
The next case corresponds to HER at high overpotentials on metals that strongly bind Hads. Based on the results from [29,30], we set the Heyrovsky reaction to be the RDS, rate 0.01, excluded the Tafel reaction from the mechanism, while all the other rates were 1, except that of spillover (Equation (4)). In this case, the spillover rate was varied from 0.01 to 100. For each combination of elementary process rates, three different dispersions were considered. These were 1, 4, and 16 uniformly distributed catalysts islands of different sizes, but the support coverage by metal was 0.125 ML in each case. Another scenario was when support was placed over metal in identical configurations, thus giving metal coverage of 0.875 ML. After the equilibration of each system, the H2 production rate from support, total H2 production, metal coverage by Hads, and support coverage by Hads were determined (Figure 1). The results show that with the increasing spillover rate, the H2 production becomes faster, while the support has the dominant role in the case of catalyst@support (C@S) configuration (Figure 1a,b). Along with increasing dispersion, the catalyst coverage by Hads decreases while the support coverage increases. In the case of the support@catalyst (S@C) configuration, the production from the support is practically identical to that at C@S for the same set of reaction rates. However, the overall H2 production is much larger as many more catalyst sites contribute to H2 production far from the C–S interface. Nevertheless, if the overall rates of H2 production are compared for the fastest spillover case, the rate of H2 production in the S@C system is only two times higher compared to the C@S configuration, while there are seven times more catalyst sites. Thus, the interface path significantly contributes to the overall H2 production. Moreover, spillover contributes to the cleaning of catalyst sites and prevents its poisoning by Hads.
In the next set of simulations, we considered the effects of metal coverage. Different numbers of catalyst/support islands were placed uniformly on the support/catalyst (Figure 2a). In parallel, we varied the rates of Hads diffusion on the support (Equation (4)) and the rate of H2 desorption from the support (Equation (5)) between 1 and 100. However, for one simulation, we set the rates of the processes (4) and (5) to be equal (thus, 1–1, 10–10, and 100–100). Namely, diffusion barrier scales with Hads binding energy [28], while Hads recombination will also be faster for the weaker binding surfaces. For each pair of the considered rate, spillover rate amounting to 0.01, 1, and 100 was tested. Figure 2b–e shows the results for the 100–100 pair of rates of reaction (4) and (5).
While increasing the spillover rate, the production of H2 from the S phase increases, and the Hads coverage on the metal phase decreases. For the C@S configuration, the overall production increases with the catalyst fraction and reaches the maximum for the metal coverage of 0.5 ML. On the other side, the overall production for the S@C configuration decreases with the catalyst fraction, and it is maximal for the catalyst fraction of 0.5 ML. The results suggest that the C–S interface has a key role. When the spillover rate is fast (or at least has a comparable rate with the other processes in the system), most hydrogen is produced at the support and the C–S interface. On the other hand, if the diffusion of Hads on the support is not faster than other processes in the system (and Hads recombination on it, in our simulation), the majority of hydrogen generated in the system is produced at the C–S interface on its S side. Such an H2 production distribution is clearly visible by spatial maps of H2 production in the C@S configuration when all the rates are set to 1, except the rate of Heyrovsky reaction (set to 0.01, Figure 2a).
However, a unified picture can be presented, showing that when going from low catalyst coverage on the support, the H2 production increases, while it further decreases when it becomes larger than 0.5 ML (Figure 3, spillover rate set to 1). At that point, the C–S boundary length starts to decrease. Therefore, if the spillover path has the dominant role in H2 production, this will decrease the overall H2 production rate and result in a volcano shape curve of the H2 production rate versus metal fraction on the support. Of course, in realistic conditions, the position of the apex would depend on the actual rates of all the processes in the system and the coverage of support by the catalyst phase, but such dependency was already demonstrated for the case of Ni deposited on reduced graphene oxide (rGO).

2.3. Choosing the Catalyst—Support Combination

From the obtained results, we can derive some specific guidelines regarding the choice of a suitable catalyst@support combination with high HER activity. They relate to the choice of the catalyst with the optimal Hads affinity and the support with lower Hads activity so that it cannot promote the formation of Hads but can accept Hads from the catalyst. If the support satisfies this condition, Hads diffusion and recombination will also be fast, so the contribution of the spillover path will be high. To find a proper catalyst/support combination, we go along the HER volcano in alkaline media [12]. We concentrate at the apex of the volcano curve so that the catalyst/support system will have high activity even without the spillover contribution. Knowing that Pt is the most active metal for HER, which is related to the optimal strength of the Hads–Pt bond, as the catalysts we choose metals with hydrogen binding energy (EH) EH = EH(Pt) ± 0.15 eV. This criterion is met for Fe, Co, Ni, Ru, Rh, Pd, Ir, and Pt as possible catalysts [12,31]. All these metals have appreciable HER activities, and at high HER overpotentials, the catalyst coverage by Hads is high. Now we have to choose adequate support for each of these metals.
We want supports with a low affinity towards Hads so that H2 can form relatively easily. For this reason, we set the lower limit of the EH on the support to −2.26 eV. As the bond energy of H2 is 4.52 eV, Hads formation on the support will be endothermic with respect to the gas phase H2. Now we must choose the upper limit of the EH on the support. We set it as EH(C) + 0.65 eV. It means that Hads bonding on the support should be less favored than on the catalyst surface by 0.65 eV to the maximum. This criterion also imposes the highest possible thermodynamic barrier for the Hads transfer from the catalyst to the support to 0.65 eV (Figure 4). This value has been chosen so it can be overcome at room temperature [32]. Hence, for the set of the chosen catalysts, EH on the support ranges between −2.26 eV and −1.92 eV. This condition for H binding energy is fulfilled for rGO. Thus, based on our previous findings [33,34], we analyze several metal–rGO combinations in terms of their HER activities and compare them with pure metal phases. We note that the scheme presented in Figure 4 is an extreme case in which H binding on the support does not favor Hads formation. However, it is possible to have stronger bonding on the support so that the H2 formation stages along the reaction pathway are completely uphill from the thermodynamic point of view. For example, other criteria were applied in Ref. [22], focusing on the Gibbs energy for the hydrogen adsorption process (ΔGH). Catalysts with −0.45 eV < ΔGH < 0 and supports with |ΔGH| < 0.15 eV were considered. The overall rate depends on the kinetic barriers of each process, which are not easy to estimate at this point.

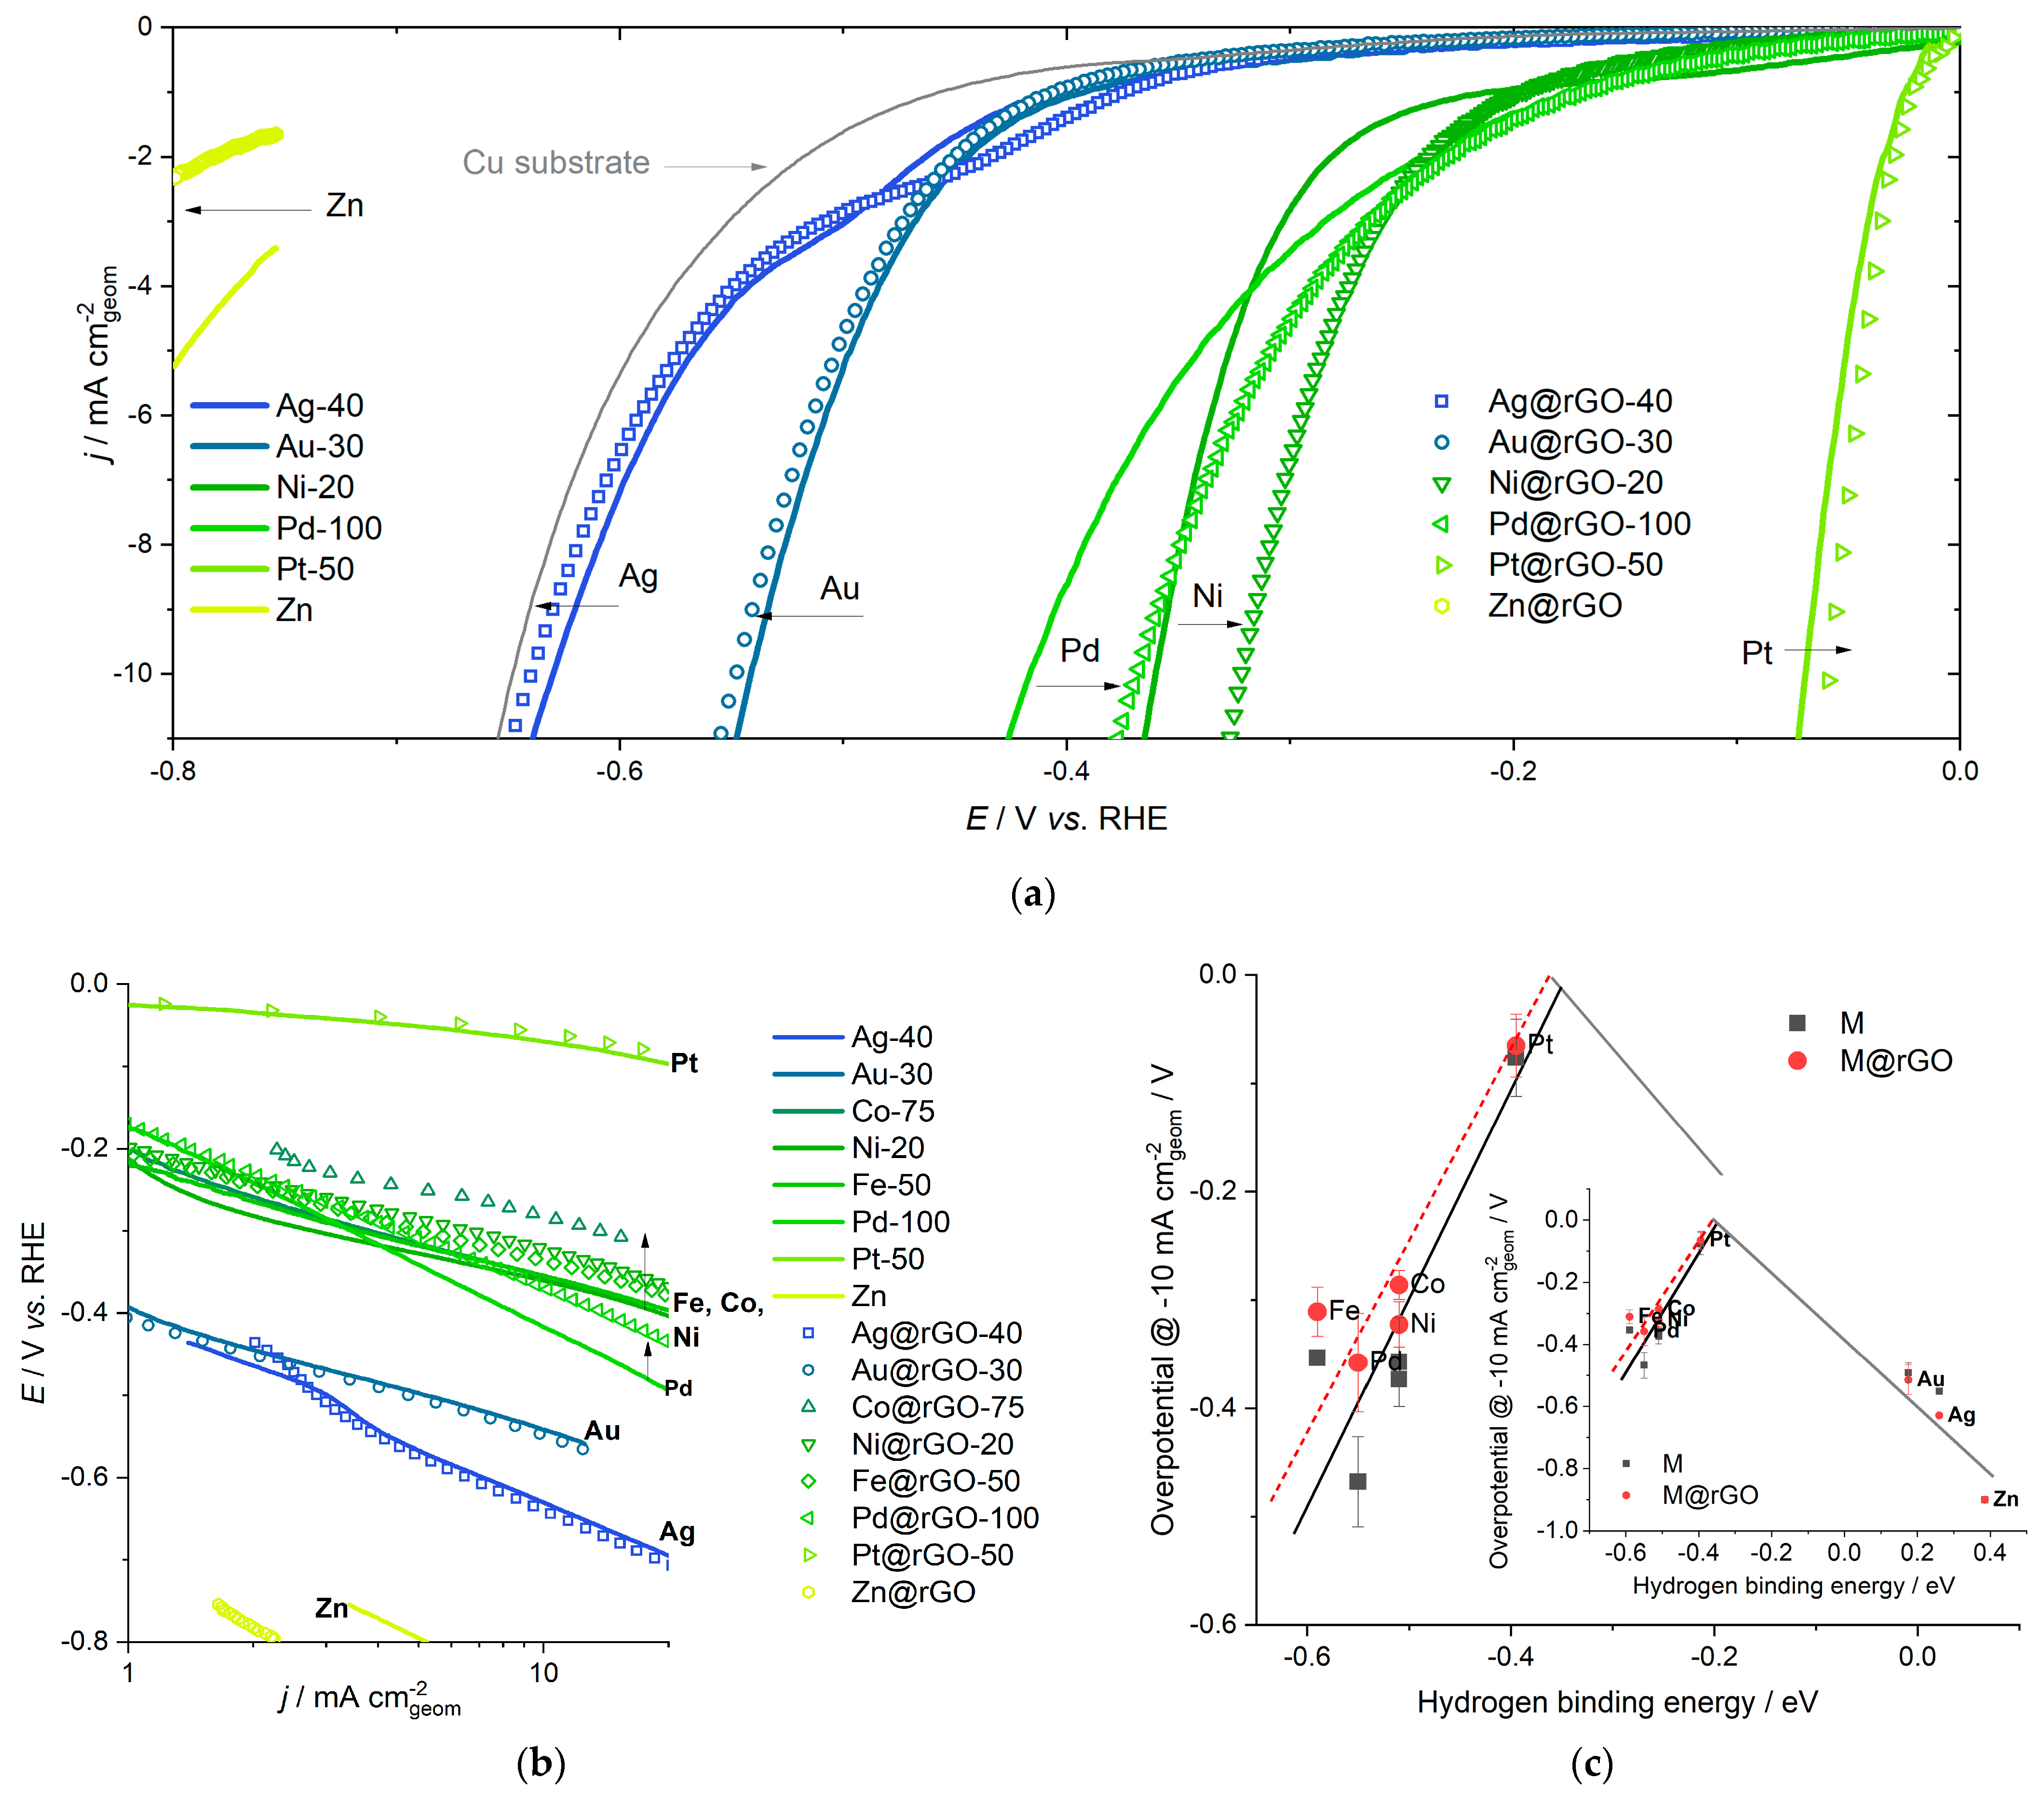
2.4. Trends in Hydrogen Evolution Reaction

Based on the considerations in Section 2.2 and Section 2.3, it is likely that the hydrogen spillover process can boost the HER rate on metals where HER takes place at high surface coverage by Hads. If one considers general trends in HER catalytic activities in the form of a volcano curve [12], the obtained results actually suggest that the spillover process can affect HER for metals located on the strong binding branch of HER volcano. Thus, a positive effect can be expected for Fe, Co, Ni, Pd, and Pt (and also Ru, Rh, and Ir, as discussed). On the other hand, the effects of hydrogen spillover should be absent for metals that bind Hads weakly (such as Ag, Au, Zn). To check for this, we performed a series of simultaneous graphene oxide reduction and metal deposition experiments, which is the methodology previously demonstrated as effective for Ni@rGO composite deposition [33,34]. Details of procedures are provided in Section 4.2. We investigated rGO-supported electrodeposited Ag, Au, Co, Fe, Ni, Pd, Pt, and Zn electrodes and estimated their HER activity by HER overpotential at 10 mA cm−2 geometric (η10) [35]. The obtained results (Figure 5a,b) suggest good agreement with our assumptions. Namely, Ag, Au, and Zn show similar or lower activity when deposited on rGO, compared to direct deposition on the Cu substrate (note that η10 of the Cu substrate was found to be −0.65 V—somewhat lower than that of electrodeposited Ag, Figure 5a).
On the other hand, all the other catalysts display positive shifts in η10 when deposited at rGO. The effect was checked for different electrodeposition times and verified for a large number of electrodes. Pd showed surprisingly low activity, but when deposited on rGO, its electrocatalytic activity increased. In fact, the effect of the rGO support was the most prominent for Pd and Co, while Fe and Ni displayed similar activity enhancements (Figure 5b). Using the estimated η10 values for metals deposited on the Cu substrate and M@rGO catalysts and the calculated hydrogen binding energies (DFT, Section 4.3), we have constructed the HER volcano curve (Figure 5c). The overall shape of the curve agrees with previous findings for alkaline media [12], but the most important are the changes in the strong binding branch. Namely, the entire branch shifts to lower HER overvoltages (absolute values) for the considered metals.
The obtained results on the HER activity trends are in rather good agreement with the results of KMC simulations and derived assumptions regarding the scenarios in which the spillover process will boost HER activity. The case of Ni is in line with our previous studies, while the behavior of Fe and Co follows Ni closely. It is not surprising since these three metals have similar HER activity in alkaline media. The prominent effect of rGO on the activity of Pd might be explained by surface cleaning and reduction of the H sorption by Pd, but this is only speculation that should be checked. Nevertheless, such a mechanism in the case of Pd deposited on carbon surfaces has been considered relevant for hydrogen storage applications [36,37]. Importantly, hydrogen spillover was also considered for Pt-doped activated carbon and confirmed experimentally using inelastic neutron scattering [38]. Reduction in the Ni-hydride formation [23] could also be the reason why the spillover effect is so prominent in the case of nickel (Figure 5a).

3. Discussion

The presented results clearly indicate that interfacing metals that strongly bind hydrogen with rGO enhance the HER rate. The behavior of studied metals is consistent for different deposition times (Figure 6). Moreover, in some cases, the trends follow the ones predicted by KMC regarding activity increase to a certain point, followed by the decrease upon further support coverage with the catalyst. Such a trend is well represented in the case of Ni and also visible to some extent for Fe (Figure 6). Overall, the interfacing process contributes to HER, but it must be noted that the general shape of the volcano curve is preserved and dominantly determined by Hads energetics at the catalyst’s surface.
Obviously, the contribution of the interface path observed experimentally is not as prominent as in the KMC simulations, but these should be considered only as guidelines. Moreover, we note that the contribution from the interfacial effects would be highly beneficial in the case of finely dispersed particles (Figure 1, effects of dispersion), but these are difficult to obtain using electrodeposition. For some of the support–catalysts combinations presented here, there are strong indications that hydrogen spillover is operative, as mentioned before [36,37,38]. However, we must note that there are also opposing views, at least for the Pd–graphene systems [39,40]. These theoretical calculations suggested the absence of H spillover from small Pd clusters deposited on the graphene surface. However, it might also be that the graphene surfaces in these studies were too perfect. Namely, pristine graphene binds Hads very weakly, while the bonding becomes much stronger once defects and functional groups are introduced on the surface [41]. Thus, perfect graphene does not satisfy the criteria for the support given in Section 2.3. In fact, we have previously shown that in the case of Ni deposited on different graphene-based surfaces, positive effects are seen for rGO, which contains a large number of defects and a certain fraction of oxygen functional groups in the basal plane [33]. However, the effect was absent when Ni was deposited on well-ordered graphene nanoplatelets with well-defined graphitic structure, preserved sp2 basal plane, and oxygen functional groups at the edge sites. Thus, while we have demonstrated the effect for a series of metals on rGO, we believe that other supports can also be utilized to boost HER via spillover, such as low-cost alloys, different nanostructured carbons, metal oxides, and others. However, it is crucial that chosen supports fulfill necessary thermodynamic and kinetic conditions, as discussed in Section 2.3.
The lack of techniques for visualizing phenomena is a general problem of spillover-focused studies, as noted in [18]. However, the harmony between the theoretical assumptions and the experimental results stands in favor of the proposed mechanism. Namely, in [22], the spillover process was not directly visualized, but the conformation was indirect through the value of the Tafel slope. However, it is important to observe that the identified catalyst–support combination, Pt1Ir1-MoS2 showed much lower HER onset potential compared to Pt in an acidic medium but higher HER activity at large HER overvoltages. This result perfectly agrees with our work, as it corresponds to high surface coverage by Hads where spillover is expected to be operative. It also supports our standing point that the conclusions derived from KMC are valid for both acidic and alkaline solutions.
So far, the benefits of the Ni–rGO combination have been shown for the rGO-modified Ni foam [23] as well as for Ni deposited on rGO [33,34]. To reinforce the effects of interfacing Ni and rGO, we prepared a Ni@rGO composite using direct electrochemical deposition from the GO-containing electrodeposition bath and compared its activity to the Ni deposit obtained under identical conditions in the absence of GO (Figure 7a). Clearly, the activity of the Ni@rGO electrode is much higher compared to the pure Ni counterpart. A positive shift in the HER overpotential is in the range of those reported in Figure 6 for Ni deposited on drop-casted GO films. Additionally, the morphology is different. In the case of Ni (Figure 7b), dendritic deposits are obtained, while Ni@rGO shows flake-like morphology (Figure 7c). In other words, Ni@rGO retained the morphology of GO, while Ni is deposited on the surface of GO sheets. There is one more very important point to note. When M@rGO composites are made, either by electrodeposition on the drop-casted GO film or by co-deposition of metal and rGO, there is always less metal deposited in the case of rGO-containing deposits. If the constant current conditions are applied, a certain fraction of charge is used to reduce GO, which is clearly visible in the significant depolarization of the electrode during the electrodeposition process in the presence of GO [33].
For these reasons, modest improvements in HER activity, resulting from forming the M–rGO interface, would become much more prominent if the currents were normalized to the mass of active metal. Another point relates to the electrochemically active surface area (ESA). Although there is much less metal deposited, it might be that its dispersion is higher. Reliable determination of ESA for all the studied metals is not an easy task, especially when deposited on rGO. If capacitance measurements are the only way to do it, it is not possible to separate catalyst response from that of support. Different dispersions of Ni are indeed seen in Figure 7b,c—in the case of Ni@rGO, some small particles can be observed. However, cyclic voltammetry (Figure 7a, inset) shows a similar response of the two electrodes in the region of Ni oxidation, with that of the pure Ni electrode being somewhat larger. This result clearly indicates that the ESAs of these two electrodes are very similar and that the lower amount of Ni in Ni@rGO is compensated for by its higher dispersion. In turn, HER activities presented in Figure 7a correctly represent the relation between intrinsic HER activities of Ni and Ni@rGO, while it should be noted that the mass-specific activity of Ni@rGO is much higher than that of pure Ni electrode. We also note that similar ESAs allow for comparison of HER activities in spite largely different catalyst morphologies, as in alkaline media diffusion limitations are not expected.
Finally, we suggest that the strategy for choosing metal catalyst–support combinations can be generalized. First, the conclusions derived from KMC simulations are valid in both acidic and alkaline media as long as the catalyst coverage by Hads is high under HER operating conditions. In these cases, the spillover process is beneficial for boosting HER activity. Thus, one could choose the catalyst–support combination based on the computational screening of hydrogen binding energies. A large number of reports have accumulated in the literature, providing datasets for hydrogen binding energies, such as [22,31]. These and other datasets can be applied to search for novel catalyst–support combinations quickly. Guidelines are given in Section 2.3 and can be less strict, except for the condition relating to the difference in binding energies on the catalyst, and the support—barrier larger than 0.65 eV is unlikely to be overcome unless high-temperature conditions are operative.

4. Materials and Methods

4.1. KMC Simulations

KMCLib v1.1 [42] was used for all KMC simulations. All elementary processes (rare events) with their assumed reaction rates, along with the system’s initial configuration defined on a regular grid in space, were provided to the code. The system was then propagated in time, from state to state, on the free energy landscape defined by the provided elementary processes and rates. Simulations were provided enough time to equilibrate, and the statistics were then collected, including integral H2 production rates on the support, overall H2 production rate, hydrogen coverage of the catalyst and the support, and spatial maps of H2 production (normalized from 0 to 1).

4.2. Metal Deposition on Drop-Casted-GO Films

Electrochemical formation of M@rGO composites and electrochemical measurements were performed in a standard three-electrode cell with Ag/AgCl (satd. KCl) as a reference and graphite rod as a counter electrode. Electrolytes were de-aerated using ultra-pure argon. The cell was connected to the potentiostat/galvanostat PAR 263A (Princeton Applied Research, TN, USA) coupled with a 5210 Dual Phase Analog Lock-in Amplifier for the impedance measurements, controlled by the POWERSuite software package (Princeton Applied Research, TN, USA). The potentials were recalculated to the reversible hydrogen electrode (RHE) scale as ERHE = EAg/AgCl + 0.197 V + 0.059 V × pH.
Metals and M@rGO composites were deposited onto electrolytic-quality copper substrates, which were precisely cut to the geometric surface area of 0.2826 cm2. Copper substrates were cleaned in concentrated hydrochloric acid, acetone, and water. Graphene-oxide (ACS Graphene Oxide Powder) thin films were drop-casted from aqueous ethanol suspension on the substrate and dried under vacuum. The deposition was carried out directly on Cu substrates or prepared GO-modified Cu substrates. The composition of the electrodeposition baths and the deposition conditions are provided in Table 1. Such prepared electrodes are denoted as M-t or M@rGO-t, where t is the deposition time in seconds.
HER polarization curves were measured using linear voltammetry of HER (10 mV s−1) in Ar-purged 1 mol dm−3 aqueous KOH using the above-described cell configuration.

4.3. Co-Deposition of Ni and rGO and the Measurements of HER Activity

Ni and Ni@rGO were deposited on polished Ti rod (diameter of cross section area 3 mm) from the electrodeposition bath containing 0.2 mol dm−3 H3BO3 + 0.5 mol dm−3 NH4Cl + 0.125 mol dm−3 NiSO4, with the addition of 0.1 g dm−3 GO (Graphenea, San Sebastian, Spain) for the production of Ni@rGO. The deposition was performed under constant current conditions (−50 mA cm−2) for 90 s. The deposition was performed in a two-electrode electrochemical cell, with an upwards-positioned Ti rod and spiral Ni electrode placed symmetrically around the Ti rod. After the deposition, the electrodes were washed with deionized water and transferred into the three-electrode electrochemical cell for HER measurements.
Electrochemical measurements were carried out using IVIUM Vertex.One potentiostat in one compartment three-electrode electrochemical cell. A saturated Calomel Electrode (SCE) served as a reference electrode, and a 3 × 3 cm Ni foam (Goodfellow Cambridge Limited, Cambridge, England) as a counter electrode. KOH solution (Sigma Aldrich, St. Louis, MO, USA), 1 mol dm−3, prepared with ultrapure deionized water, was used in all experiments. All the measurements were performed at room temperature. Potentials were recalculated to the RHE scale as ERHE = ESCE + 0.244 V + 0.059 V × pH. Electrolyte resistance was corrected using hardware settings, but only up to 75% of the resistance value determined using single-point impedance measurement at −1 V vs. SCE (approximately 0 V vs. RHE). HER measurements were performed using cyclic voltammetry at a sweep rate of 10 mV s−1. Before the potential sweep, the electrode was held at −1 V vs. SCE for 1 min (approximately 0 V vs. RHE). Then, the electrode potential was swept in a cathodic direction to measure HER activity. The Ti rod was positioned upwards to prevent surface blockage by bubbles. Morphology analysis was carried out using SEM-EDX with Phenom ProX Scanning Electron Microscope (Phenom, Eindhoven, The Netherlands) with an acceleration voltage of 10 kV.

4.4. DFT Calculations

The first-principles Density Functional Theory (DFT) calculations were performed using the Quantum ESPRESSO package [43,44]. The Generalized Gradient Approximation (GGA) in the parametrization by Perdew, Burk, and Ernzerhof was used [45]. Cut-off energy of 40 Ry was employed, while the charge density cut-off was 16 times larger. We investigated the densely packed (111) surface of FFC metals (Ag, Au, Ni, Pd, Pt), the (0001) surface of HCP metals (Co and Zn), and the Fe (110) surface (BCC metal) using the corresponding p (2 × 2) cells of given surfaces, with four-layer slabs. A Monkhorst–Pack Γ-centered 4 × 4 × 1 k-point mesh was used to integrate the first irreducible Brillouin zone [46]. For the studied surface, we have investigated the adsorption of H at 0.25 monolayer (ML) coverage. Hydrogen binding energy, EH, was calculated as follows:
EH = ESURF+HESURF − 1/2 EH2
where ESURF+H, ESURF, and EH2 stand for the total energy of the surface with Hads, the total energy of the clean surface and the total energy of an isolated H2 molecule.

5. Conclusions

The electrocatalytic activity of metallic surfaces is dominated by their interactions with different species and intermediates, but it can be effectively tuned by interfacing metallic catalysts with suitably chosen supports. Here, we focused on the effects of hydrogen spillover on the hydrogen evolution reaction in alkaline media. Using Kinetic Monte Carlo simulations for different catalyst–support configurations, we pointed out that HER can be boosted if the support is active for hydrogen spillover, but only if the metal coverage by Hads is high. In practice, this corresponds to high HER overvoltages for strongly binding metallic surfaces. The effects were experimentally confirmed by synthesizing a series of M@rGO composite catalysts by simultaneous electrochemical deposition and reduction of drop-casted GO films. For weakly binding metals, Ag and Au (and Zn), the effects of the support are negative, while Pt shows very small activity enhancement when deposited on rGO. On the other hand, metals that bind Hads more strongly show a positive shift in HER overpotential when deposited on rGO. The volcano curve constructed using measured HER activities on electrodeposited metals and M@rGO composites and DFT-calculated hydrogen binding energies preserves its shape, but the strong binding branch is shifted to lower HER overpotentials. The support effect was additionally demonstrated for Ni@rGO composite electrode obtained by co-deposition of Ni and rGO. It was emphasized that the dispersion is higher for the rGO-supported catalyst, but the amount of nickel is significantly lower compared to the pure Ni analog. As the cyclic voltammetry indicated similar active surfaces for these two electrodes, it was concluded that activity enhancement is associated with Ni–rGO interfacing. On the other hand, mass-specific activities of rGO-supported electrodes presented here are expected to show a much higher contrast to pure metallic electrodeposits as the amount of metal phase in M@rGO composites is always lower compared to pure metal electrodeposited electrodes.

Author Contributions

Conceptualization, S.J.G. and I.A.P.; methodology, I.A.P.; validation, I.A.P. and S.J.G.; formal analysis, D.M., A.Z.J., G.K.G., A.S.D. and B.N.V.; investigation, D.M., A.Z.J., G.K.G., A.S.D. and B.N.V.; resources, I.A.P. and S.J.G.; writing—original draft preparation, S.J.G. and I.A.P.; writing—review and editing, D.M., A.Z.J., G.K.G., A.S.D., B.N.V. and I.A.P.; supervision, I.A.P.; funding acquisition, S.J.G. and I.A.P.; All authors have read and agreed to the published version of the manuscript.

Funding

This research was funded by the Science Fund of the Republic of Serbia (PROMIS project RatioCAT) and the Ministry of Education, Science, and Technological Development of the Republic of Serbia (Contract No. 451-03-68/2022-14/200146). I.A.P. is indebted to the Research Fund of the Serbian Academy of Sciences and Arts, project F-190, for supporting this study.

Data Availability Statement

Data are available upon request.

Acknowledgments

I.A.P. would like to thank Slavko V. Mentus, University of Belgrade—Faculty of Physical Chemistry, for helpful discussions.

Conflicts of Interest

The authors declare no conflict of interest.

References

  1. Strmcnik, D.; Papa Lopes, P.; Genorio, B.; Stamenkovic, V.R.; Markovic, N.M. Design principles for hydrogen evolution reaction catalyst materials. Nano Energy 2016, 29, 29–36. [Google Scholar] [CrossRef] [Green Version]
  2. Markovic, N.M. Interfacing electrochemistry. Nat. Mater. 2013, 12, 101–102. [Google Scholar] [CrossRef] [PubMed]
  3. Greeley, J.; Markovic, N.M. The road from animal electricity to green energy: Combining experiment and theory in electrocatalysis. Energy Environ. Sci. 2012, 5, 9246–9256. [Google Scholar] [CrossRef]
  4. De Giz, M.J.; Tremiliosi-Filho, G.; Gonzalez, E.R.; Srinivasan, S.; Appleby, A.J. The hydrogen evolution reaction on amorphous nickel and cobalt alloys. Int. J. Hydrog. Energy 1995, 20, 423–427. [Google Scholar] [CrossRef]
  5. Kibsgaard, J.; Tsai, C.; Chan, K.; Benck, J.D.; Nørskov, J.K.; Abild-Pedersen, F.; Jaramillo, T.F. Designing an improved transition metal phosphide catalyst for hydrogen evolution using experimental and theoretical trends. Energy Environ. Sci. 2015, 8, 3022–3029. [Google Scholar] [CrossRef]
  6. Benck, J.D.; Hellstern, T.R.; Kibsgaard, J.; Chakthranont, P.; Jaramillo, T.F. Catalyzing the Hydrogen Evolution Reaction (HER) with Molybdenum Sulfide Nanomaterials. ACS Catal. 2014, 4, 3957–3971. [Google Scholar] [CrossRef]
  7. Benck, J.D.; Chen, Z.; Kuritzky, L.Y.; Forman, A.J.; Jaramillo, T.F. Amorphous Molybdenum Sulfide Catalysts for Electrochemical Hydrogen Production: Insights into the Origin of their Catalytic Activity. ACS Catal. 2012, 2, 1916–1923. [Google Scholar] [CrossRef]
  8. Du, H.; Kong, R.-M.; Guo, X.; Qu, F.; Li, J. Recent progress in transition metal phosphides with enhanced electrocatalysis for hydrogen evolution. Nanoscale 2018, 10, 21617–21624. [Google Scholar] [CrossRef]
  9. Trasatti, S. Work function, electronegativity, and electrochemical behaviour of metals: III. Electrolytic hydrogen evolution in acid solutions. J. Electroanal. Chem. Interfacial Electrochem. 1972, 39, 163–184. [Google Scholar] [CrossRef]
  10. Nørskov, J.K.; Bligaard, T.; Logadottir, A.; Kitchin, J.R.; Chen, J.G.; Pandelov, S.; Stimming, U. Trends in the Exchange Current for Hydrogen Evolution. J. Electrochem. Soc. 2005, 152, J23. [Google Scholar] [CrossRef]
  11. Quaino, P.; Juarez, F.; Santos, E.; Schmickler, W. Volcano plots in hydrogen electrocatalysis-uses and abuses. Beilstein J. Nanotechnol. 2014, 5, 846–854. [Google Scholar] [CrossRef] [PubMed] [Green Version]
  12. Sheng, W.; Myint, M.; Chen, J.G.; Yan, Y. Correlating the hydrogen evolution reaction activity in alkaline electrolytes with the hydrogen binding energy on monometallic surfaces. Energy Environ. Sci. 2013, 6, 1509–1512. [Google Scholar] [CrossRef]
  13. Sabatier, F. La Catalyse en Chimie Organique; Berauge: Paris, France, 1920. [Google Scholar]
  14. Danilovic, N.; Subbaraman, R.; Strmcnik, D.; Chang, K.-C.; Paulikas, A.P.; Stamenkovic, V.R.; Markovic, N.M. Enhancing the Alkaline Hydrogen Evolution Reaction Activity through the Bifunctionality of Ni(OH)2/Metal Catalysts. Angew. Chem. Int. Ed. 2012, 51, 12495–12498. [Google Scholar] [CrossRef] [PubMed]
  15. Subbaraman, R.; Tripkovic, D.; Chang, K.-C.; Strmcnik, D.; Paulikas, A.P.; Hirunsit, P.; Chan, M.; Greeley, J.; Stamenkovic, V.; Markovic, N.M. Trends in activity for the water electrolyser reactions on 3d M(Ni,Co,Fe,Mn) hydr(oxy)oxide catalysts. Nat. Mater. 2012, 11, 550–557. [Google Scholar] [CrossRef] [PubMed]
  16. Khoobiar, S. Particle to Particle Migration of Hydrogen Atoms on Platinum—Alumina Catalysts from Particle to Neighboring Particles. J. Phys. Chem. 1964, 68, 411–412. [Google Scholar] [CrossRef]
  17. Conner, W.C., Jr.; Falconer, J.L. Spillover in Heterogeneous Catalysis. Chem. Rev. 1995, 95, 759–788. [Google Scholar] [CrossRef]
  18. Karim, W.; Spreafico, C.; Kleibert, A.; Gobrecht, J.; Van de Vondele, J.; Ekinci, Y.; van Bokhoven, J.A. Catalyst support effects on hydrogen spillover. Nature 2017, 541, 68–71. [Google Scholar] [CrossRef]
  19. Prins, R. Hydrogen Spillover. Facts and Fiction. Chem. Rev. 2012, 112, 2714–2738. [Google Scholar] [CrossRef]
  20. Psofogiannakis, G.M.; Froudakis, G.E. Fundamental studies and perceptions on the spillover mechanism for hydrogen storage. Chem. Commun. 2011, 47, 7933–7943. [Google Scholar] [CrossRef]
  21. Strmcnik, D.; Uchimura, M.; Wang, C.; Subbaraman, R.; Danilovic, N.; van der Vliet, D.; Paulikas, A.P.; Stamenkovic, V.R.; Markovic, N.M. Improving the hydrogen oxidation reaction rate by promotion of hydroxyl adsorption. Nat. Chem. 2013, 5, 300–306. [Google Scholar] [CrossRef]
  22. Tan, Y.; Zhu, Y.; Cao, X.; Liu, Y.; Li, J.; Chen, Z.; Hu, J. Discovery of Hydrogen Spillover-Based Binary Electrocatalysts for Hydrogen Evolution: From Theory to Experiment. ACS Catal. 2022, 12, 11821–11829. [Google Scholar] [CrossRef]
  23. Chanda, D.; Hnát, J.; Dobrota, A.S.; Pašti, I.A.; Paidar, M.; Bouzek, K. The effect of surface modification by reduced graphene oxide on the electrocatalytic activity of nickel towards the hydrogen evolution reaction. Phys. Chem. Chem. Phys. 2015, 17, 26864–26874. [Google Scholar] [CrossRef] [PubMed] [Green Version]
  24. Gutić, S.J.; Jovanović, A.Z.; Dobrota, A.S.; Metarapi, D.; Rafailović, L.D.; Pašti, I.A.; Mentus, S.V. Simple routes for the improvement of hydrogen evolution activity of Ni-Mo catalysts: From sol-gel derived powder catalysts to graphene supported co-electrodeposits. Int. J. Hydrog. Energy 2018, 43, 16846–16858. [Google Scholar] [CrossRef]
  25. Wolfschmidt, H.; Paschos, O.; Stimming, U. Hydrogen Reactions on Nanostructured Surfaces. In Fuel Cell Science: Theory, Fundamentals, and Biocatalysis; Wieckowski, A., Nørskov, J.K., Eds.; John Wiley & Sons, Inc.: Hoboken, NJ, USA, 2010. [Google Scholar] [CrossRef]
  26. Pašti, I.A.; Leetmaa, M.; Skorodumova, N.V. General principles for designing supported catalysts for hydrogen evolution reaction based on conceptual Kinetic Monte Carlo modeling. Int. J. Hydrog. Energy 2016, 41, 2526–2538. [Google Scholar] [CrossRef]
  27. Tierney, H.L.; Baber, A.E.; Kitchin, J.R.; Sykes, E.C. H Hydrogen Dissociation and Spillover on Individual Isolated Palladium Atoms. Phys. Rev. Lett. 2009, 103, 246102. [Google Scholar] [CrossRef]
  28. Nilekar, A.U.; Greeley, J.; Mavrikakis, M. A Simple Rule of Thumb for Diffusion on Transition-Metal Surfaces. Angew. Chem. Int. Ed. 2006, 45, 7046–7049. [Google Scholar] [CrossRef]
  29. Jakšić, J.M.; Vojnović, M.V.; Krstajić, N.V. Kinetic analysis of hydrogen evolution at Ni–Mo alloy electrodes. Electrochim. Acta 2000, 45, 25–26. [Google Scholar] [CrossRef]
  30. Krstajić, N.; Popović, M.; Grgur, B.; Vojnović, M.; Šepa, D. On the kinetics of the hydrogen evolution reaction on nickel in alkaline solution: Part I. The mechanism. J. Electroanal. Chem. 2001, 512, 16–26. [Google Scholar] [CrossRef]
  31. Greeley, J.; Nørskov, J.K. Large-scale, density functional theory-based screening of alloys for hydrogen evolution. Surf. Sci. 2007, 601, 1590–1598. [Google Scholar] [CrossRef]
  32. Singh, A.K.; Ribas, M.A.; Yakobson, B.I. H-Spillover through the Catalyst Saturation: An Ab Initio Thermodynamics Study. ACS Nano 2009, 3, 1657–1662. [Google Scholar] [CrossRef]
  33. Gutić, S.J.; Dobrota, A.S.; Leetmaa, M.; Skorodumova, N.V.; Mentus, S.V.; Pašti, I.A. Improved catalysts for hydrogen evolution reaction in alkaline solutions through the electrochemical formation of nickel-reduced graphene oxide interface. Phys. Chem. Chem. Phys. 2017, 19, 13281–13293. [Google Scholar] [CrossRef] [PubMed]
  34. Gutić, S.J.; Šabanović, M.; Metarapi, D.; Pašti, I.A.; Korać, F.; Mentus, S.V. Electrochemically Synthesized Ni@reduced Graphene Oxide Composite Catalysts for Hydrogen Evolution in Alkaline Media—The Effects of Graphene Oxide Support. Int. J. Electrochem. Sci. 2019, 14, 8532–8543. [Google Scholar] [CrossRef]
  35. McCrory, C.C.L.; Jung, S.; Ferrer, I.M.; Chatman, S.M.; Peters, J.C.; Jaramillo, T.F. Benchmarking Hydrogen Evolving Reaction and Oxygen Evolving Reaction Electrocatalysts for Solar Water Splitting Devices. J. Am. Chem. Soc. 2015, 137, 4347–4357. [Google Scholar] [CrossRef] [PubMed] [Green Version]
  36. Konda, S.K.; Chen, A. Palladium based nanomaterials for enhanced hydrogen spillover and storage. Mater. Today 2016, 19, 100–108. [Google Scholar] [CrossRef]
  37. Parambhath, V.B.; Nagar, R.; Sethupathi, K.; Ramaprabhu, S. Investigation of Spillover Mechanism in Palladium Decorated Hydrogen Exfoliated Functionalized Graphene. J. Phys. Chem. C 2011, 115, 15679–15685. [Google Scholar] [CrossRef]
  38. Tsao, C.-S.; Liu, Y.; Chuang, H.-Y.; Tseng, H.-H.; Chen, T.-Y.; Chen, C.-H.; Yu, M.-S.; Li, Q.; Lueking, A.; Chen, S.-H. Hydrogen Spillover Effect of Pt-Doped Activated Carbon Studied by Inelastic Neutron Scattering. J. Phys. Chem. Lett. 2011, 2, 2322–2325. [Google Scholar] [CrossRef]
  39. Blanco-Rey, M.; Juaristi, J.I.; Alducin, M.; López, M.J.; Alonso, J.A. Is Spillover Relevant for Hydrogen Adsorption and Storage in Porous Carbons Doped with Palladium Nanoparticles? J. Phys. Chem. C 2016, 120, 17357–17364. [Google Scholar] [CrossRef] [Green Version]
  40. Granja-DelRío, A.; Alducin, M.; Juaristi, J.I.; López, M.J.; Alonso, J.A. Absence of spillover of hydrogen adsorbed on small palladium clusters anchored to graphene vacancies. Appl. Surf. Sci. 2021, 559, 149835. [Google Scholar] [CrossRef]
  41. Dobrota, A.S.; Pašti, I.A.; Mentus, S.V.; Skorodumova, N.V. A general view on the reactivity of the oxygen-functionalized graphene basal plane. Phys. Chem. Chem. Phys. 2016, 18, 6580–6586. [Google Scholar] [CrossRef]
  42. Leetmaa, M.; Skorodumova, N.V. KMCLib 1.1: Extended random number support and technical updates to the KMCLib general framework for kinetic Monte-Carlo simulations. Comput. Phys. Commun. 2015, 196, 611–613. [Google Scholar] [CrossRef]
  43. Giannozzi, P.; Baroni, S.; Bonini, N.; Calandra, M.; Car, R.; Cavazzibum, C.; Ceresoli, D.; Chiarotti, G.L.; Coccoccioni, M.; Dabo, I.; et al. QUANTUM ESPRESSO: A modular and open-source software project for quantum simulations of materials. J. Phys. Condens. Matter 2009, 21, 395502. [Google Scholar] [CrossRef] [PubMed]
  44. Giannozzi, P.; Andreussi, O.; Brumme, T.; Bunau, O.; Buongiorno Nardelli, M.; Calandra, M.; Car, R.; Cavazzoni, C.; Ceresoli, D.; Cococcioni, M.; et al. Advanced capabilities for materials modelling with Quantum ESPRESSO. J. Phys. Condens. Matter 2017, 29, 465901. [Google Scholar] [CrossRef] [PubMed] [Green Version]
  45. Perdew, J.P.; Burke, K.; Ernzerhof, M. Generalized Gradient Approximation Made Simple. Phys. Rev. Lett. 1996, 77, 3865. [Google Scholar] [CrossRef] [PubMed] [Green Version]
  46. Monkhorst, H.J.; Pack, J.D. Special points for Brillouin-zone integrations. Phys. Rev. B 1976, 13, 5188. [Google Scholar] [CrossRef]
Figure 1. Heatmaps for H2 production when the Heyrovsky reaction is slow as a function of catalyst dispersion and the spillover rate: (a) production from the support for the C@S configuration; (b) total production for the C@S configuration; (c) production from the support for the S@C configuration; (d) total production for the S@C configuration.
Catalysts 13 00089 g001
Figure 2. (a) Spatial distribution of H2 production in the system with slow Heyrovsky reaction with different coverage of catalyst phase (brighter color stands for more intense H2 production), the systems were generated on a two-dimensional lattice with 130 points in x and y directions (distance between the points is dimensionless). Heatmaps for H2 production when the Heyrovsky reaction is slow as a catalyst coverage and the spillover rate: (b) production from the support for the C@S configuration; (c) total production for the C@S configuration; (d) production from the support for the S@C configuration; (e) total production for the S@C configuration.
Catalysts 13 00089 g002aCatalysts 13 00089 g002b
Figure 3. Dependence of the H2 production rate as a function of the catalyst coverage for three different sets of rates of Hads diffusion and recombination on the support (spillover rate set to 1): (a) H2 production from the support, (b) total H2 production.
Catalysts 13 00089 g003
Figure 4. Schematic representation of the spillover process and H2 production on the rGO-support metal catalyst with the energy profile for the considered reaction path.
Catalysts 13 00089 g004
Figure 5. (a) HER polarization curves for selected metals with (M@rGO-t) and without rGO support (M-t), t is the deposition time in seconds (for Zn and Zn@rGO catalyst only parts of the polarization curves at deeper negative potentials are shown to prevent Zn dissolution); (b) Tafel plots for entire series of catalysts (the same notation as for (a)); (c) volcano plot constructed using η10 values and calculated hydrogen binding energies, focusing on the strong binding branch, while inset gives the complete HER volcano curve. Error bars give the range of η10 values for different deposition times.
Catalysts 13 00089 g005
Figure 6. The HER overpotential shifts of considered M@rGO catalysts as a function of electrodeposition time.
Catalysts 13 00089 g006
Figure 7. (a) HER polarization curves for simultaneously deposited Ni@rGO compared to pure Ni deposit, inset shows cyclic voltammograms of these two electrodes; (b) SEM image of pure Ni deposits; (c) SEM image of Ni@rGO deposits.
Catalysts 13 00089 g007
Table 1. Experimental conditions for electrodeposition of M and M@rGO electrodes. All the chemicals were of p.a. grade and were not subjected to additional purification.
MetalElectrodeposition BathDeposition ConditionsDeposition Time/s
Ag5 × 10−3 M AgI + 2 M KI in water (AgI is dissolved in excess KI), pH ≈ 7−0.5 A dm−2
30 °C
40, 250
Au0.05 M HAuCl4 + 0.42 M Na2SO3 + 0.42 M Na2S2O3 + 0.3 M Na2HPO4, pH ≈ 6−0.5 A dm−2
60 °C
30, 60, 100, 300
Co59.4 g dm−3 CoSO4 × 7H2O + 12 g dm−3 Na2SO4 + 12 g dm−3 H3BO3−1.2 V vs. Ag/AgCl/KCl,
room temperature
50, 75, 100, 300
Fe300 g dm−3 FeSO4 × 7H2O + 6 g dm−3 FeCl2 × H2O + 2.8 g dm−3 H3BO3; pH adjusted to 2.5 with H2SO4;−5 A dm−2,
room temperature
50, 100, 300
Ni76 g dm−3 NiSO4 × 6H2O + 12 g dm−3 H3BO3−1.2 V vs. Ag/AgCl/KCl,
room temperature
10, 30, 60, 100, 150, 200
Pd100 g dm−3 PdCl2 × 4H2O + NH3 in excess + NH4Cl to pH ≈ 9−0.3 A dm−2
room temperature
60, 100, 200, 300
Pt20 g dm−3 H2 [Pt(OH)6] + 15 g dm−3 KOH−0.75 A dm−2
75 °C
10, 50, 100
Zn300 g dm−3 ZnSO4 + 100 g dm−3 Na2SO4 + 8 g dm−3 H2SO4−15 A dm−2
room temperature
30
Disclaimer/Publisher’s Note: The statements, opinions and data contained in all publications are solely those of the individual author(s) and contributor(s) and not of MDPI and/or the editor(s). MDPI and/or the editor(s) disclaim responsibility for any injury to people or property resulting from any ideas, methods, instructions or products referred to in the content.

