Article

Xanthan Gum-Mediated Silver Nanoparticles for Ultrasensitive Electrochemical Detection of Hg2+ Ions from Water

1
National Center of Excellence in Analytical Chemistry, University of Sindh, Jamshoro 76080, Pakistan
2
International Center for Chemical and Biological Sciences, HEJ Research Institute of Chemistry, University of Karachi, Karachi 75270, Pakistan
3
School of Materials Science and Engineering, Tsinghua University, Shaw Technical Science Building, Haidian District, Beijing 100084, China
4
School of Materials Science and Engineering, Zhejiang University, Hangzhou 310027, China
5
School of Engineering Science, University of Science and Technology of China, Hefei 230027, China
6
School of Life Sciences, University of Science and Technology of China, Hefei 230027, China
7
Department of Physics, Hazara University Mansehra, Mansehra 21300, Pakistan
8
Department of chemistry, Faculty of Science, King Khalid University, Abha 62224, Saudi Arabia
9
Bachelor Program in Industrial Projects, Department of Electronic Engineering, National Yunlin University of Science and Technology, Douliu 640301, Taiwan
10
Institutes of Physical Science and Information Technology, Key Laboratory of Structure and Functional Regulation of Hybrid Materials of Ministry of Education, Anhui University, Hefei 230601, China
11
Hefei National Laboratory for Physical Sciences at the Microscale, CAS Key Laboratory of Soft Matter Chemistry, Department of Polymer Science and Engineering, University of Science and Technology of China, Hefei 230026, China
*
Authors to whom correspondence should be addressed.
Catalysts 2023, 13(1), 208; https://doi.org/10.3390/catal13010208
Submission received: 3 December 2022 / Revised: 1 January 2023 / Accepted: 4 January 2023 / Published: 16 January 2023
(This article belongs to the Special Issue Nanoparticles in the Catalysis)

Abstract

:
An environmentally safe, efficient, and economical microwave-assisted technique was selected for the production of silver nanoparticles (AgNPs). To prepare uniformly disseminated AgNPs, xanthan gum (XG) was utilized as both a reducing and capping agent. UV–Vis spectroscopy was used to characterize the formed XG-AgNPs, with the absorption band regulated at 414 nm under optimized parameters. Atomic force microscopy was used to reveal the size and shape of XG-AgNPs. The interactions between the XG capping agent and AgNPs observed using Fourier transform infrared spectroscopy. The XG-AgNPs were placed in between glassy carbon electrode and Nafion® surfaces and then deployed as sensors for voltammetric evaluation of mercury ions (Hg2+) using square-wave voltammetry as an analytical mode. Required Nafion® quantities, electrode behavior, electrolyte characteristics, pH, initial potentials, accumulation potentials, and accumulation durations were all comprehensively investigated. In addition, an electrochemical mechanism for the oxidation of Hg2+ was postulated. With an exceptional limit of detection of 0.18 ppb and an R2 value of 0.981, the sensors’ measured linear response range was 0.0007–0.002 µM Hg2+. Hg2+ evaluations were ultimately unaffected by the presence of many coexisting metal ions (Cd2+, Pb2+, Cr2O4, Co2+,Cu2+, CuSO4). Spiked water samples were tested using the described approach, with Hg2+ recoveries ranging from 97% to 100%.

1. Introduction

Heavy metals including mercury, considered substantially toxic, are found in the environment due to heavy industrial applications such as the manufacturing of batteries, electrical equipment, paints, and the extraction of metals from mines and rivers [1,2,3,4,5]. Mercury harms human health even at low concentrations because of its volatility and solubility in water as well as in living cells [6,7]. Therefore, it has become mandatory to detect mercury at a trace level. The USA Environmental Protection Agency (EPA) and the World Health Organization (WHO) have established acceptable mercury limits in drinking water of 0.03 ppb and 0.01 ppb, respectively [8]. Various reliable and accurate analytical techniques have been used for the detection of mercury, such as cold-vapor atomic absorption spectroscopy, spectrofluorimetry, mercury analyzer, inductively coupled plasma-mass spectrometry, and inductively coupled plasma-atomic emission spectrometry; however, these techniques possess some limitations such as expensive instrumentation, complex steps of sample preparation, and a professionally trained technician [1,6,7]. Square wave voltammetry among many electrochemical methods is preferred for the determination of mercury because of its simplicity, low cost, rapid analysis time, and high sensitivity [9,10,11,12]. Various studies have revealed that many chemically modified electrodes have been used for the determination of heavy metal ions. For example, carbon paste electrodes (CPEs) modified with N-p chlorophenylcinnamohydroxamic acid (CPCHA) were used to detect Hg2+ ions under ideal square wave voltammetry (SWV) with a limit of detection (LOD) of 12.9 nM [1]. With a glassy carbon electrode (GCE) modified with nitrogen-doped reduced graphene (NRGO), the differential pulse anodic stripping voltammetric (DPASV) method was applied for the measurement of mercury with LOD of 0.58 nM [6]. A GCE was modified using silver nanoparticles (AgNPs) and the tribenzamides; SWV was followed to evaluate how well the modified electrode detected mercuric ions with LOD 1 × 10⁻¹⁵ M [12]. Tannic acid-capped gold nanoparticles (AuNP@TA) were deposited on a glassy carbon electrode for electrochemical detection of Hg2+ ions; the given analytical method displays a “measurable lower limit” of 100.0 fM under SWV conditions [11]. AgNPs and folic acid (FA) were used to modify the surface of the pencil graphite electrode (PGE). Utilizing electrochemical impedance spectroscopy (ECIS) and cyclic voltammetry (CV), each step of the surface modification process was examined and described (EIS). By using the CV approach, the limit of detection (LOD) for Hg2+ was determined and discovered to be 8.43 mM [13]. A glassy carbon electrode modified with carboxymethylcellulose-protected silver nanoparticles (CMC@AgNPs/GCE) was used to examine the electrochemical detection of Hg2+, and the DPASV method was used to find an elevated peak current; it was discovered that the detection limit was 0.19 nM [14]. For the detection of Hg2+, a screen-printed electrode (SPE) was modified with a carbon black-gold nanoparticle (CBNP-AuNP); SWASV was followed for the determination of Hg2+ ions with LOD 14 µA ppb−1 cm−2 and 3 ppb, respectively [15]. The 141 nM LOD of mercury (II) ions was determined utilizing a SWV approach using hydroxyapatite (HA) nanoparticles for the modification of a glassy carbon electrode (GCE) [16]. The modified AuNPs-GC electrode was employed with a SWV with a limit of detection of 80 pM [17]. Gold nanoparticles (AuNPs) constructed on sulfur-doped graphitic carbon nitride (Au@S-g-C3N4) nanocomposite were used to examine the colorimetric recognition of mercury ions Hg2+ with LOD 0.275 nM [18]. The determination of Hg2+ ions by SWV was performed using the modified electrode EDTA-CPE, whose detection limit was 16, 6 ×10⁻⁹ mol L−1 [7]. Each of these approaches has resulted in the successful development of mercury ion electrochemical sensors, although they have the drawbacks of high ligand costs and extended detection periods. As a result, a ligand-free electrochemical sensor for the detection of Hg2+ ions is required [19].
The goal of the current work was to demonstrate the effectiveness of silver nanoparticles using natural gums (produced using green technology) as an electrochemical probe for Hg2+ in water samples. Natural gums are polysaccharides of natural origin that can significantly improve the viscosity of a solution even at low concentrations. Botanical gums are primarily found in the woody parts of plants or in seed coverings. Xanthan gum (XG) is a polysaccharide that exists outside of cells. At a molar ratio of 2.0:2.0:1.0, xanthan gum’s primary structure consists of pentasaccharide repeat units, mannose, and glucuronic acid [20]. Xanthan gum’s morphological, physicochemical, structural, and rheological properties have been extensively researched. Xanthan gum-capped AgNPs have recently been demonstrated to have antibacterial properties against E. coli and Staphylococcus aureus, as well as catalytic efficiency for 4-nitrophenol reduction [21], and XG-PdNPs have been employed as catalysts for 4-nitrophenol reduction [22].
The goal of this research was to synthesize xanthan gum (XG) reduced/stabilized AgNPs in a microwave oven at 700 W for 30 s. In comparison to previously reported green approaches, this method is found to be more efficient and rapid. The XG-AgNPs were then utilized as an electrochemical sensor to detect Hg2+ in aqueous media with high sensitivity. In addition, a search of the literature reveals that no attempt has been made to report the measurement of Hg2+ using xanthan gum-capped silver nanoparticles until this study.

2. Experimental Section

2.1. Chemicals and Reagents

Xanthan gum was purchased from Biological Technology Co., Ltd (Shanghai, China). Silver nitrate (AgNO3) and other chemical reagents such as cadmium chloride (CdCl2), copper chloride (CuCl2·5H2O), lead chloride (PbCl2), copper sulphate (CuSO4·5H2O), chromate (Cr2O4), hydrochloric acid (HCl 37%), ethanol (C2H5OH 97%), nitric acid (HNO3 98%), Nafion and sodium hydroxide pellets (NaOH 98%) of analytical grade reagents were purchased from Sigma-Aldrich Chemical Company (Milwaukee, WI, USA). Boric acid (H3BO3), di-sodium hydrogen phosphate (Na2HPO4), and sodium di-hydrogen phosphate (NaH2PO4) were purchased from Merck, (Germany). Milli-Q water (ultrapure) was used for the preparation of all the solutions.

2.2. Preparation of Xanthan Gum Solution

A 0.5% (weight/volume) xanthan gum solution was prepared at room temperature by dispersing 0.5 g of XG in 100 mL of deionized water and then the solution was kept on a stirrer for 24 h at 120 rpm to obtain a homogenous solution of gum. Furthermore, the solution was centrifuged for 10 min at 10,000 rpm to remove insoluble particles and the remaining supernatant solution was utilized for the synthesis of silver nanoparticles.

2.3. Preparation of Nafion (1%) and Buffer Solutions

One gram of Nafion balls was dissolved in 2-propanol to make a 1% Nafion solution, which was subsequently diluted to 0.2% with deionized water. Britton–Robinson buffer (BRB) solutions (0.04 M) were prepared by combining a solution of glacial acetic acid, ortho phosphoric acid, and boric acid from pH 3 to 9. Solutions of phosphate buffer were prepared by combining Na2HPO4 and NaH2PO4 in the appropriate ratio from pH 5 to 8, while the Tris buffer was prepared from pH 7 to 9. A CHI electrochemical analyzer was used to conduct voltammetric tests (Tennison Hill Drive, Austin, TX, USA).

2.4. Synthesis of AgNPs Using XG

Xanthan gum-capped silver nanoparticles were made by adding 7 mL of 0.5% xanthan gum extract with 700 µL of 1 mM AgNO3 solution to a tube, and this mixture was transferred into a Teflon-lined household microwave oven at 700 W power for 30 s. The solution color turned yellow, which indicated the reduction of Ag+ ions to form colloidal Ag particles. A series of samples were synthesized by changing the volume of AgNO3 (100 µL to 900 µL) while keeping the volume of XG (7 mL) constant. Likewise, the second set of samples was synthesized by changing the volume of XG (1 mL to 9 mL) by keeping the volume of AgNO3 constant (700 µL) at the same power as mentioned earlier.

2.5. Sample Preparation for FTIR and AFM

A previously mentioned procedure [23] was followed to prepare samples for FTIR and AFM. The XG-AgNP solution was prepared in bulk; approximately 500 mL of the prepared solution was evaporated in a pre-heated water bath at 100 °C, then the dried nanoparticles were washed with methanol and water twice to remove water-soluble and insoluble impurities. A glass slide was used to scratch dried XG-AgNPs, and then these nanoparticles were kept in the oven at 105 °C to remove complete moisture. The KBr pellet of XG-AgNPs was integrated for FTIR spectroscopy and the nanoparticle solution was drop casted over clean thin sheet of mica, spread, dried under pure nitrogen and characterized by AFM imaging technique.

2.6. Preparation of XG-AgNPs/Nafion-Modified GCE

Initially, the GCE (glassy carbon electrode) surface was polished with alumina powder (0.05 µm) until it had a shiny surface. Then, through deionized water, the electrode was washed appropriately. Furthermore, the electrode was subjected to sonication in ethanol and deionized water and then dried under N2. To load the sample on the surface of the GCE, a drop-casting method was used which has been reported previously. A hair dryer was used to dry 10 µL of XG-AgNPs solution drop-cast on a clean GCE surface. After that, 20 µL of 0.2% Nafion solution was applied to the modified GCE. GCE/XG-AgNPs/Nafion was used to symbolize the modified GCE for Hg2+ analysis (Figure 1).

2.7. Voltammetric Analysis of Hg2+

Voltammetric analysis was taken through a cell comprised of a Pt (platinum) rod as a counter electrode, silver/silver chloride as a reference electrode, and GCE or modified XG-AgNPs/Nafion GCE as a working electrode. The cell was filled with 5 mL of 0.04 M BRB (pH7), 4.5 mL deionized water, and 0.5 mL standard Hg2+ solution. All measurements were carried out by square wave voltammetry (SWV) under optimized parameters. SW voltammograms were recorded in the range of 0 to 1 V, pulse amplitude 0.025 V, frequency 15 Hz, and deposition time 15 s without nitrogen purging. Similar optimized parameters were also set during the scanning of the blank solution. The 0.1 V observed a peak potential for the Hg2+ working standard. A number of Hg2+ standard solutions were run to obtain a calibration plot.

2.8. Instrumentation

Xanthan gum-capped silver nanoparticles (XG-AgNPs) were characterized by UV-visible double beam spectrophotometer in the range of 200–800 nm (Model P, lambda 35 of Perkin Elmer). FTIR spectroscopy (Model Nicolet 5700 of Thermo) of silver nanoparticles was conducted by making KBr pellets. Furthermore, silver nanoparticle analysis was performed under atomic force microscopy (Model AFM 5500 Agilent, Santa Clara, CA, USA) to determine the homogeneity in shape and size distribution. The CHI electrochemical Analyzer (Tennison Hill Drive, Austin, TX, USA) technique was used to perform all voltammetric measurements for the determination of Hg2+ions. The system with three electrodes, a glassy carbon electrode (GCE) as a working electrode, a platinum wire as an auxiliary electrode, and silver/silver chloride (Ag/AgCl) as a reference electrode was used. The pH measurements were carried out using a pH meter (Thermo Fisher Scientific (Waltham, MA, USA).

3. Results and Discussion

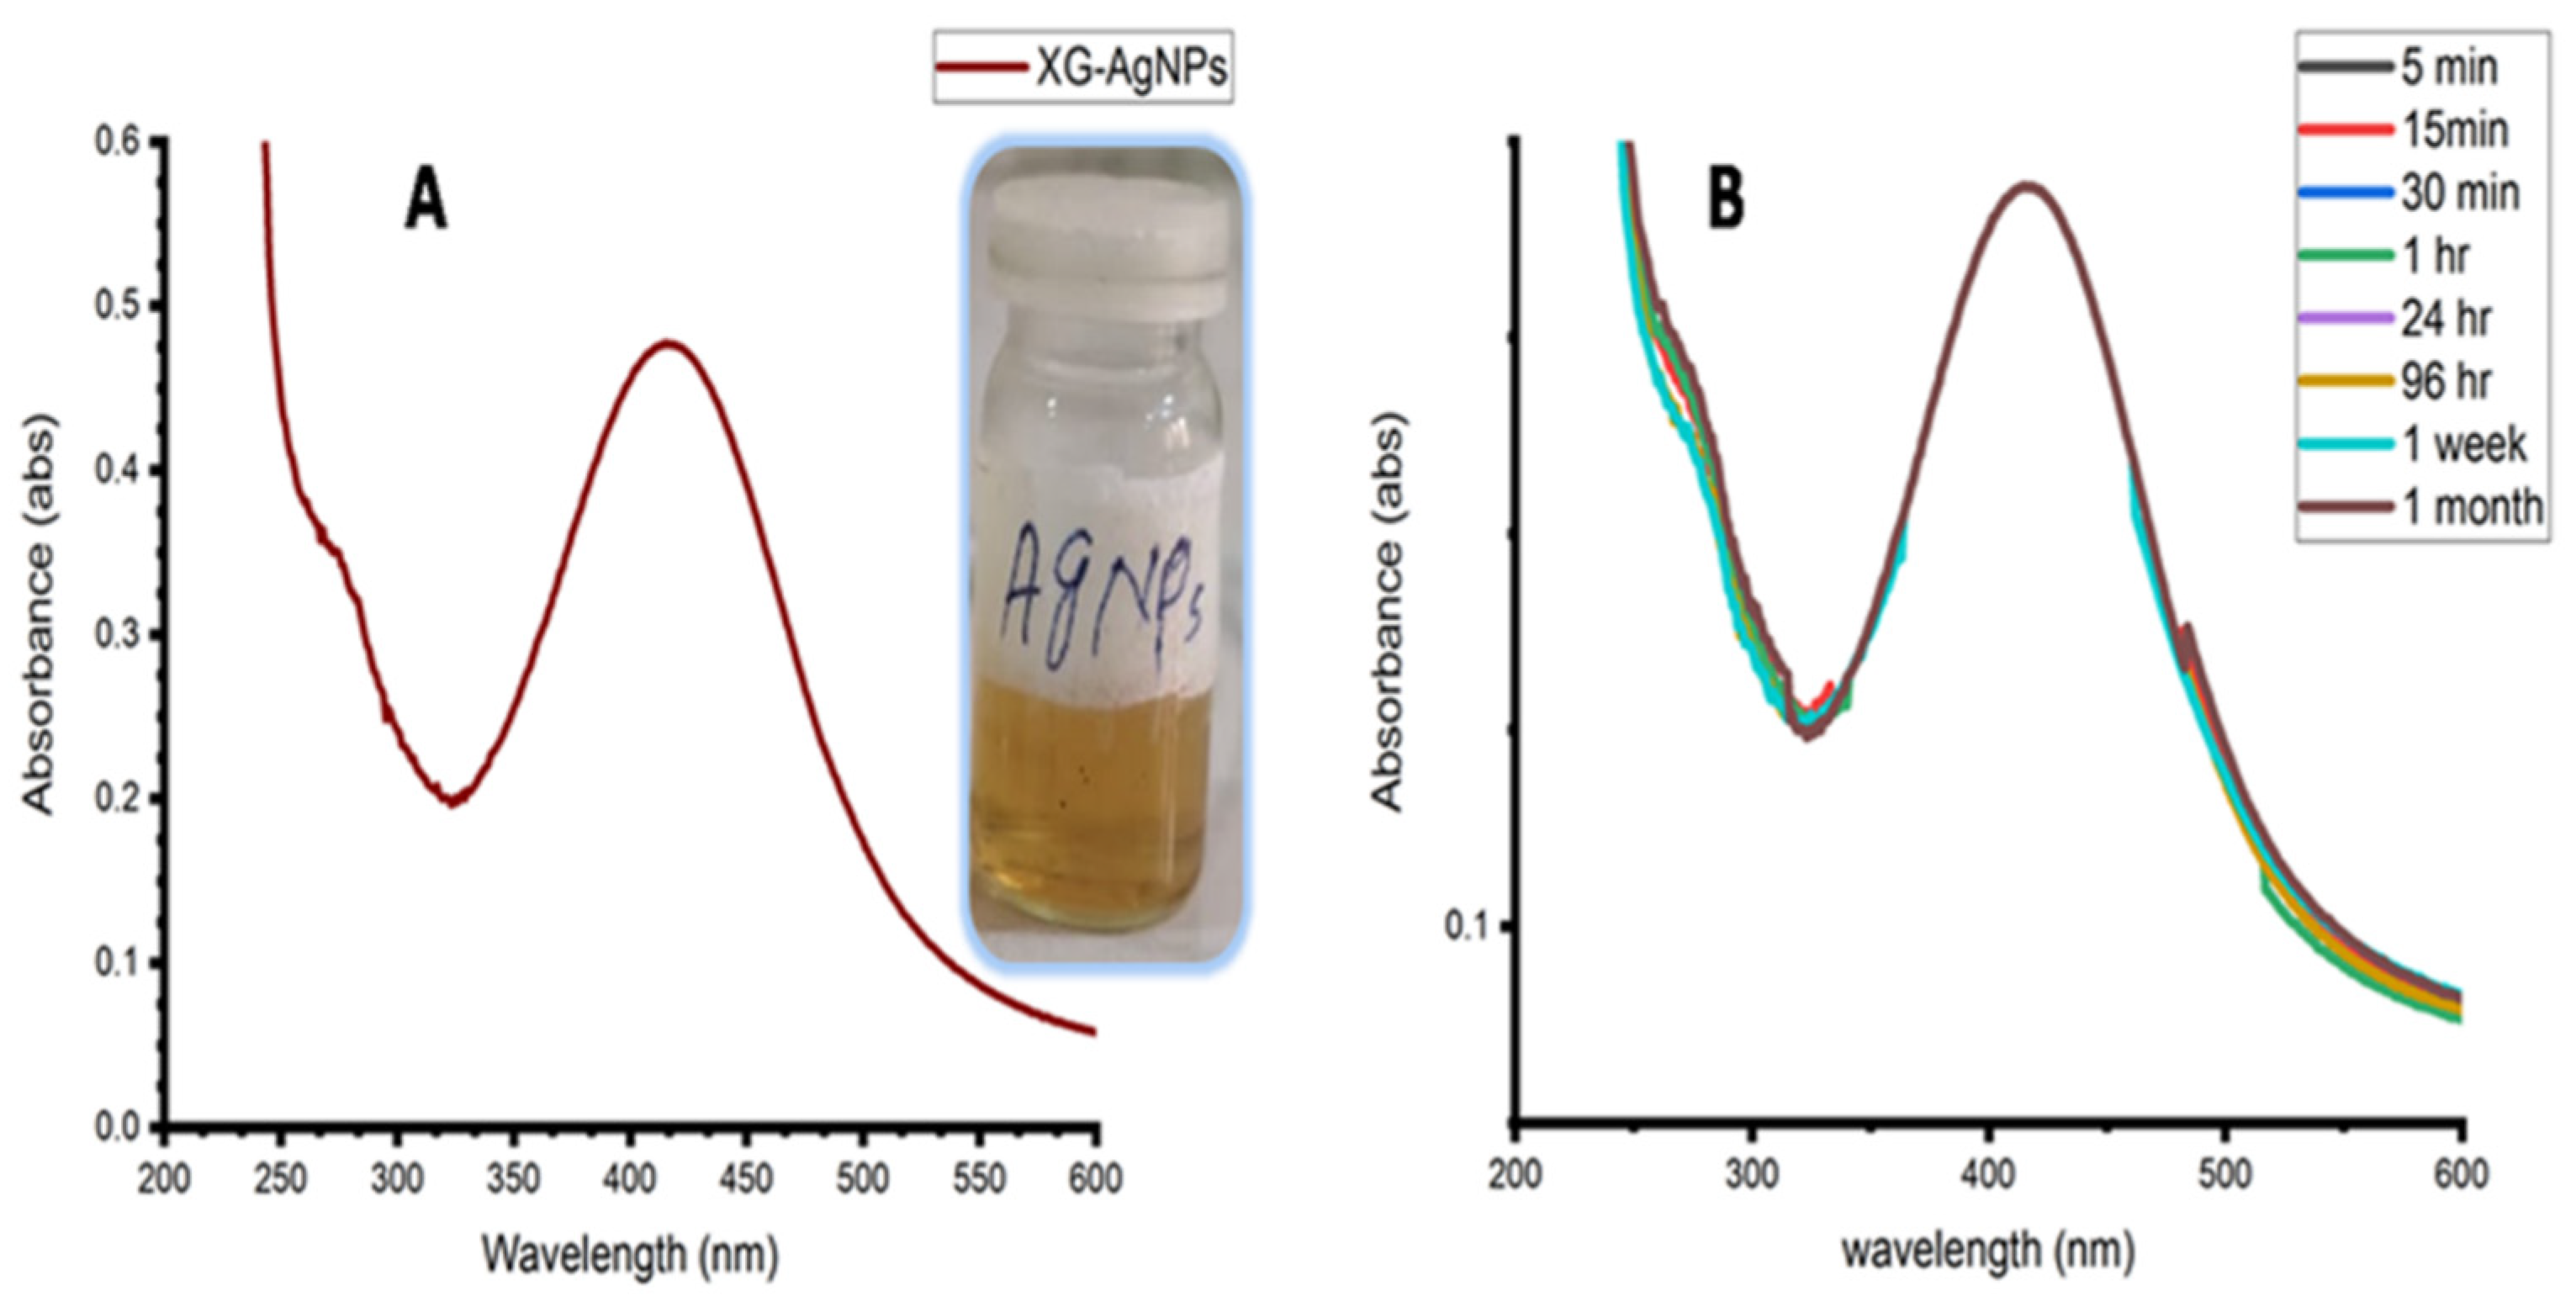
3.1. Characterization of XG-AgNPs

Xanthan gum (7 mL of 0.5%) was used as both a reducing and capping agent and added to a solution of (700 µL of 1 mM) AgNO3 for the synthesis of AgNPs. The prepared colloidal solution of AgNPs contained a bright yellow color which indicated the formation of AgNPs [24]. The surface plasmon resonance band of the prepared AgNPs was detected at approximately 414 nm and recognized as the excitation of a free electron in AgNPs [25]. The shape of the surface plasmon resonance band revealed that particles exhibited a spherical shape and were uniformly distributed in solution [22]. Various parameters such as the concentrations of AgNO3, xanthan gum, pH, microwave power irradiation, and irradiation time were optimized to control the size and shape of AgNPs. The optimization results of the abovementioned parameters showed that a combination of 700 µL of AgNO3 solution and 7 mL of 0.5% xanthan gum solution with pH 6.0 was considered the appropriate solution mixture. The solution mixture was irradiated at 700 watts for 30 s to immediately produced small-sized (blue-shifted) AgNPs with stable surface plasmon absorption peak at 414 nm as shown in Figure 2A.

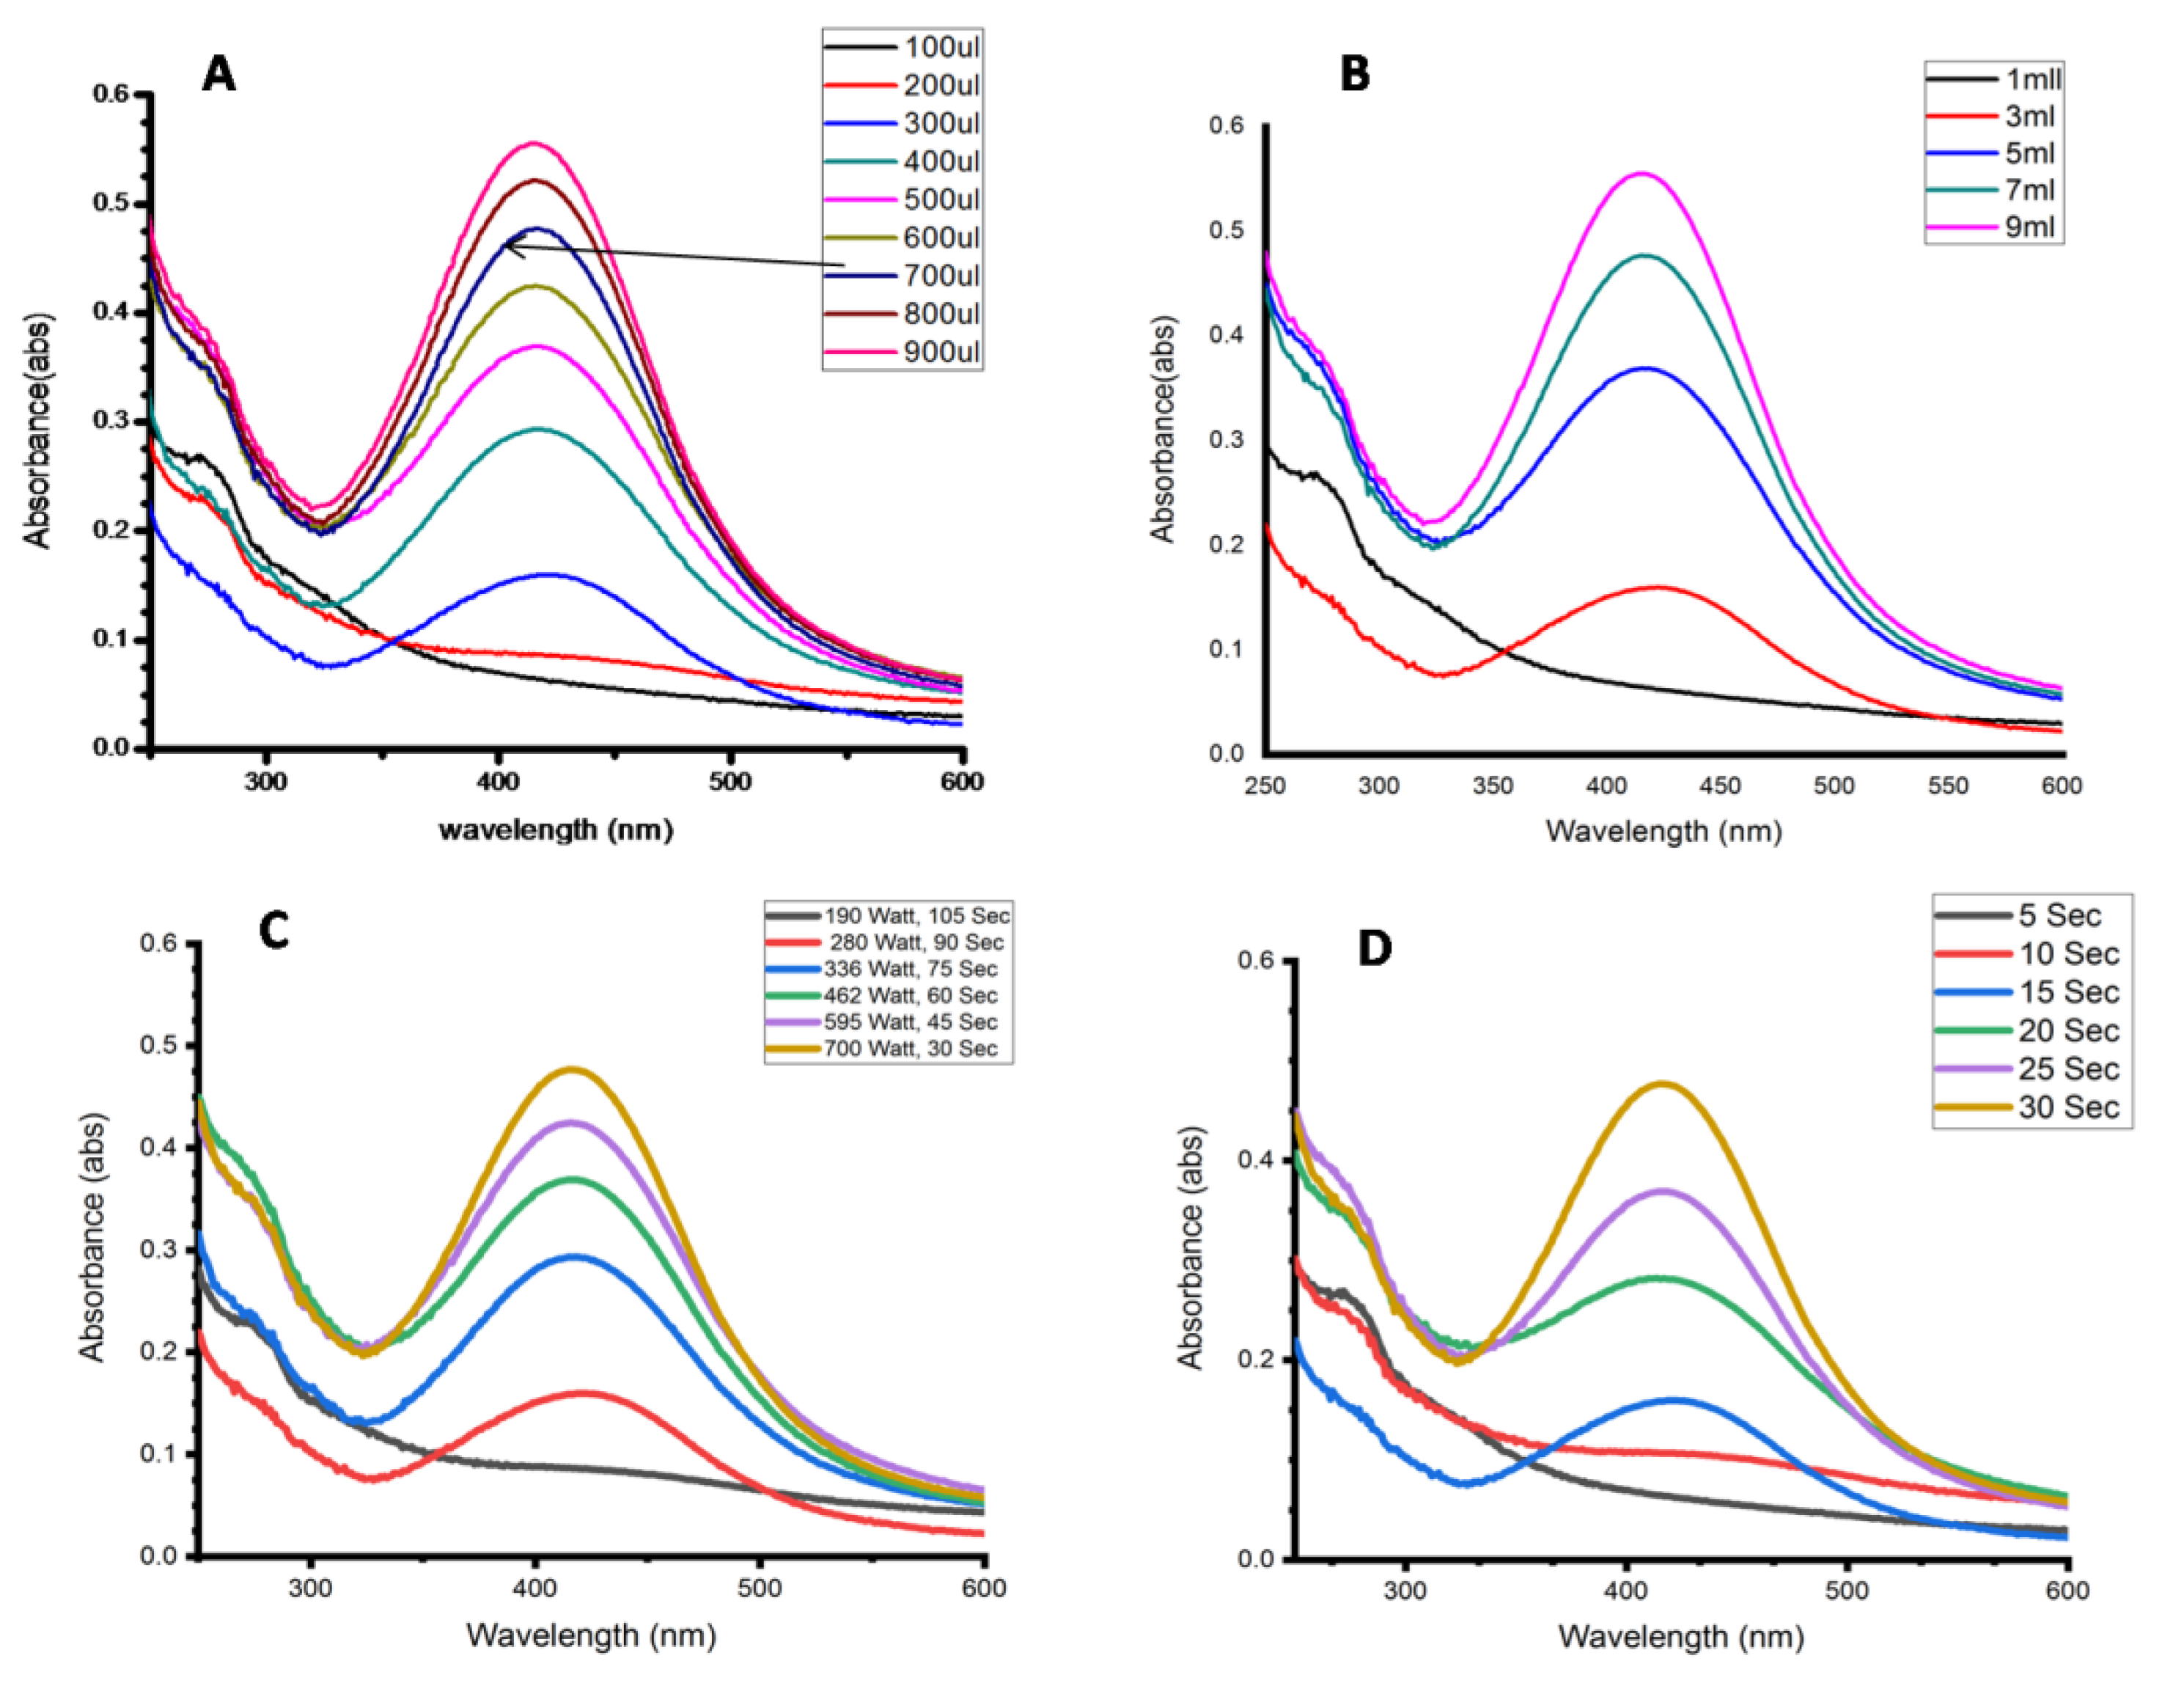
3.2. AgNO3 Volume Effect on AgNPs Synthesis

The influence of the volume of AgNO3 (1 mM) was optimized from 100 to 900 µL with 7 mL of 0.5% XG, and the solution was irradiated at 700 watts for 30 sec. Figure 3A reveals that absorption intensity increased with increasing volume of AgNO3 (1 mM) because of the increased reduction of Ag+ ions to Ag0. It was also observed that, at a higher volume of AgNO3, AgNPs were agglomerated after a few hours at room temperature, due to which the color of the solution turned brown. Therefore, 700 µL of AgNO3 was subjected to further optimization because at this volume the particles remained stable for a month in the refrigerator. Likewise, as Figure 3B shows, the volume of XG (0.5%) was optimized from 1 mL to 9 mL and the absorption intensity was increased at high volumes because increased hydroxyl groups on the XG chain were found to be responsible for greatly reducing Ag+ to Ag0 [26]. In addition, the increased number of carboxyl groups on the gum polymer immensely capped the nanoparticles and prevented aggregation to a great extent [27]. The amount of 7 mL of 0.5% XG was selected because it was found to be the most suitable volume with 700 µL of AgNO3 to produce extremely stable silver nanoparticles.

3.3. Effect of Power and Irradiation Duration on AgNPs

The effect of power (119 W to 700 W) and irradiation time (5 s to 30 s) on the production of AgNPs was observed by keeping the concentrations of AgNO3 and XG constant at 1 mM and 0.5% respectively. The addition of XG (0.5 g/mL) to a solution of 1 mM AgNO3 allowed the formation of silver nanoparticles by converting Ag+ to Ag0. The powerful band discovered at approximately 414 nm was dubbed a “surface plasmon resonance band” and attributed to free-electron excitation in AgNPs. The findings demonstrated that power had a significant impact on the reduction of AgNPs. As shown in Figure 3C,D at high power (700 W), less time (30 s) is required for the synthesis of the maximum number of AgNPs, while at low power (336 W) more time (75 s) is required to synthesize AgNPs. However, the wavelength of the surface plasmon resonance band in both cases was almost the same; meanwhile, the intensity of bands increased with increased power which shows a maximum number of particles produced at high power [28]. Therefore, 700 W was chosen because it only requires 30 sec to produce the bright yellow color of the AgNPs solution which shows that particles are small, blue-shifted, and homogeneous. Below 700 W, the reduction process was slow and more time required naturing XG for the synthesis of nanoparticles. The continual evolution of AgNP generation in XG medium with power is depicted by the deepening yellow color. The results showed that the synthesis of AgNPs by XG reduction at low power was a sluggish process with low reduction capability, but that it was enhanced after XG denaturation [21].

3.4. Stability Profile

Figure 2B also shows a time-dependent stability profile for the produced XG-AgNPs sol with no wavelength change and a time span of up to one month. The increased stability indicates that the capping agent prevents AgNPs from aggregating in solution and on the surface of GCE, and that a single solution can be used to modify GCE in less than a month without losing its capacity to detect Hg2+ions. The increased stability of XG-AgNPs in solution (Figure 2B) and their dispersed nature demonstrate the real capping effect of xanthan gum, which induces electrostatic repulsion among nanoparticles to prevent agglomeration [21]. Further evidence for these phenomena can be found elsewhere [22,27], where the carboxylic group of xanthan gum was utilized as a capping agent to prevent nanoparticle agglomeration by causing electrostatic repulsion and keeping them water-dispersible.

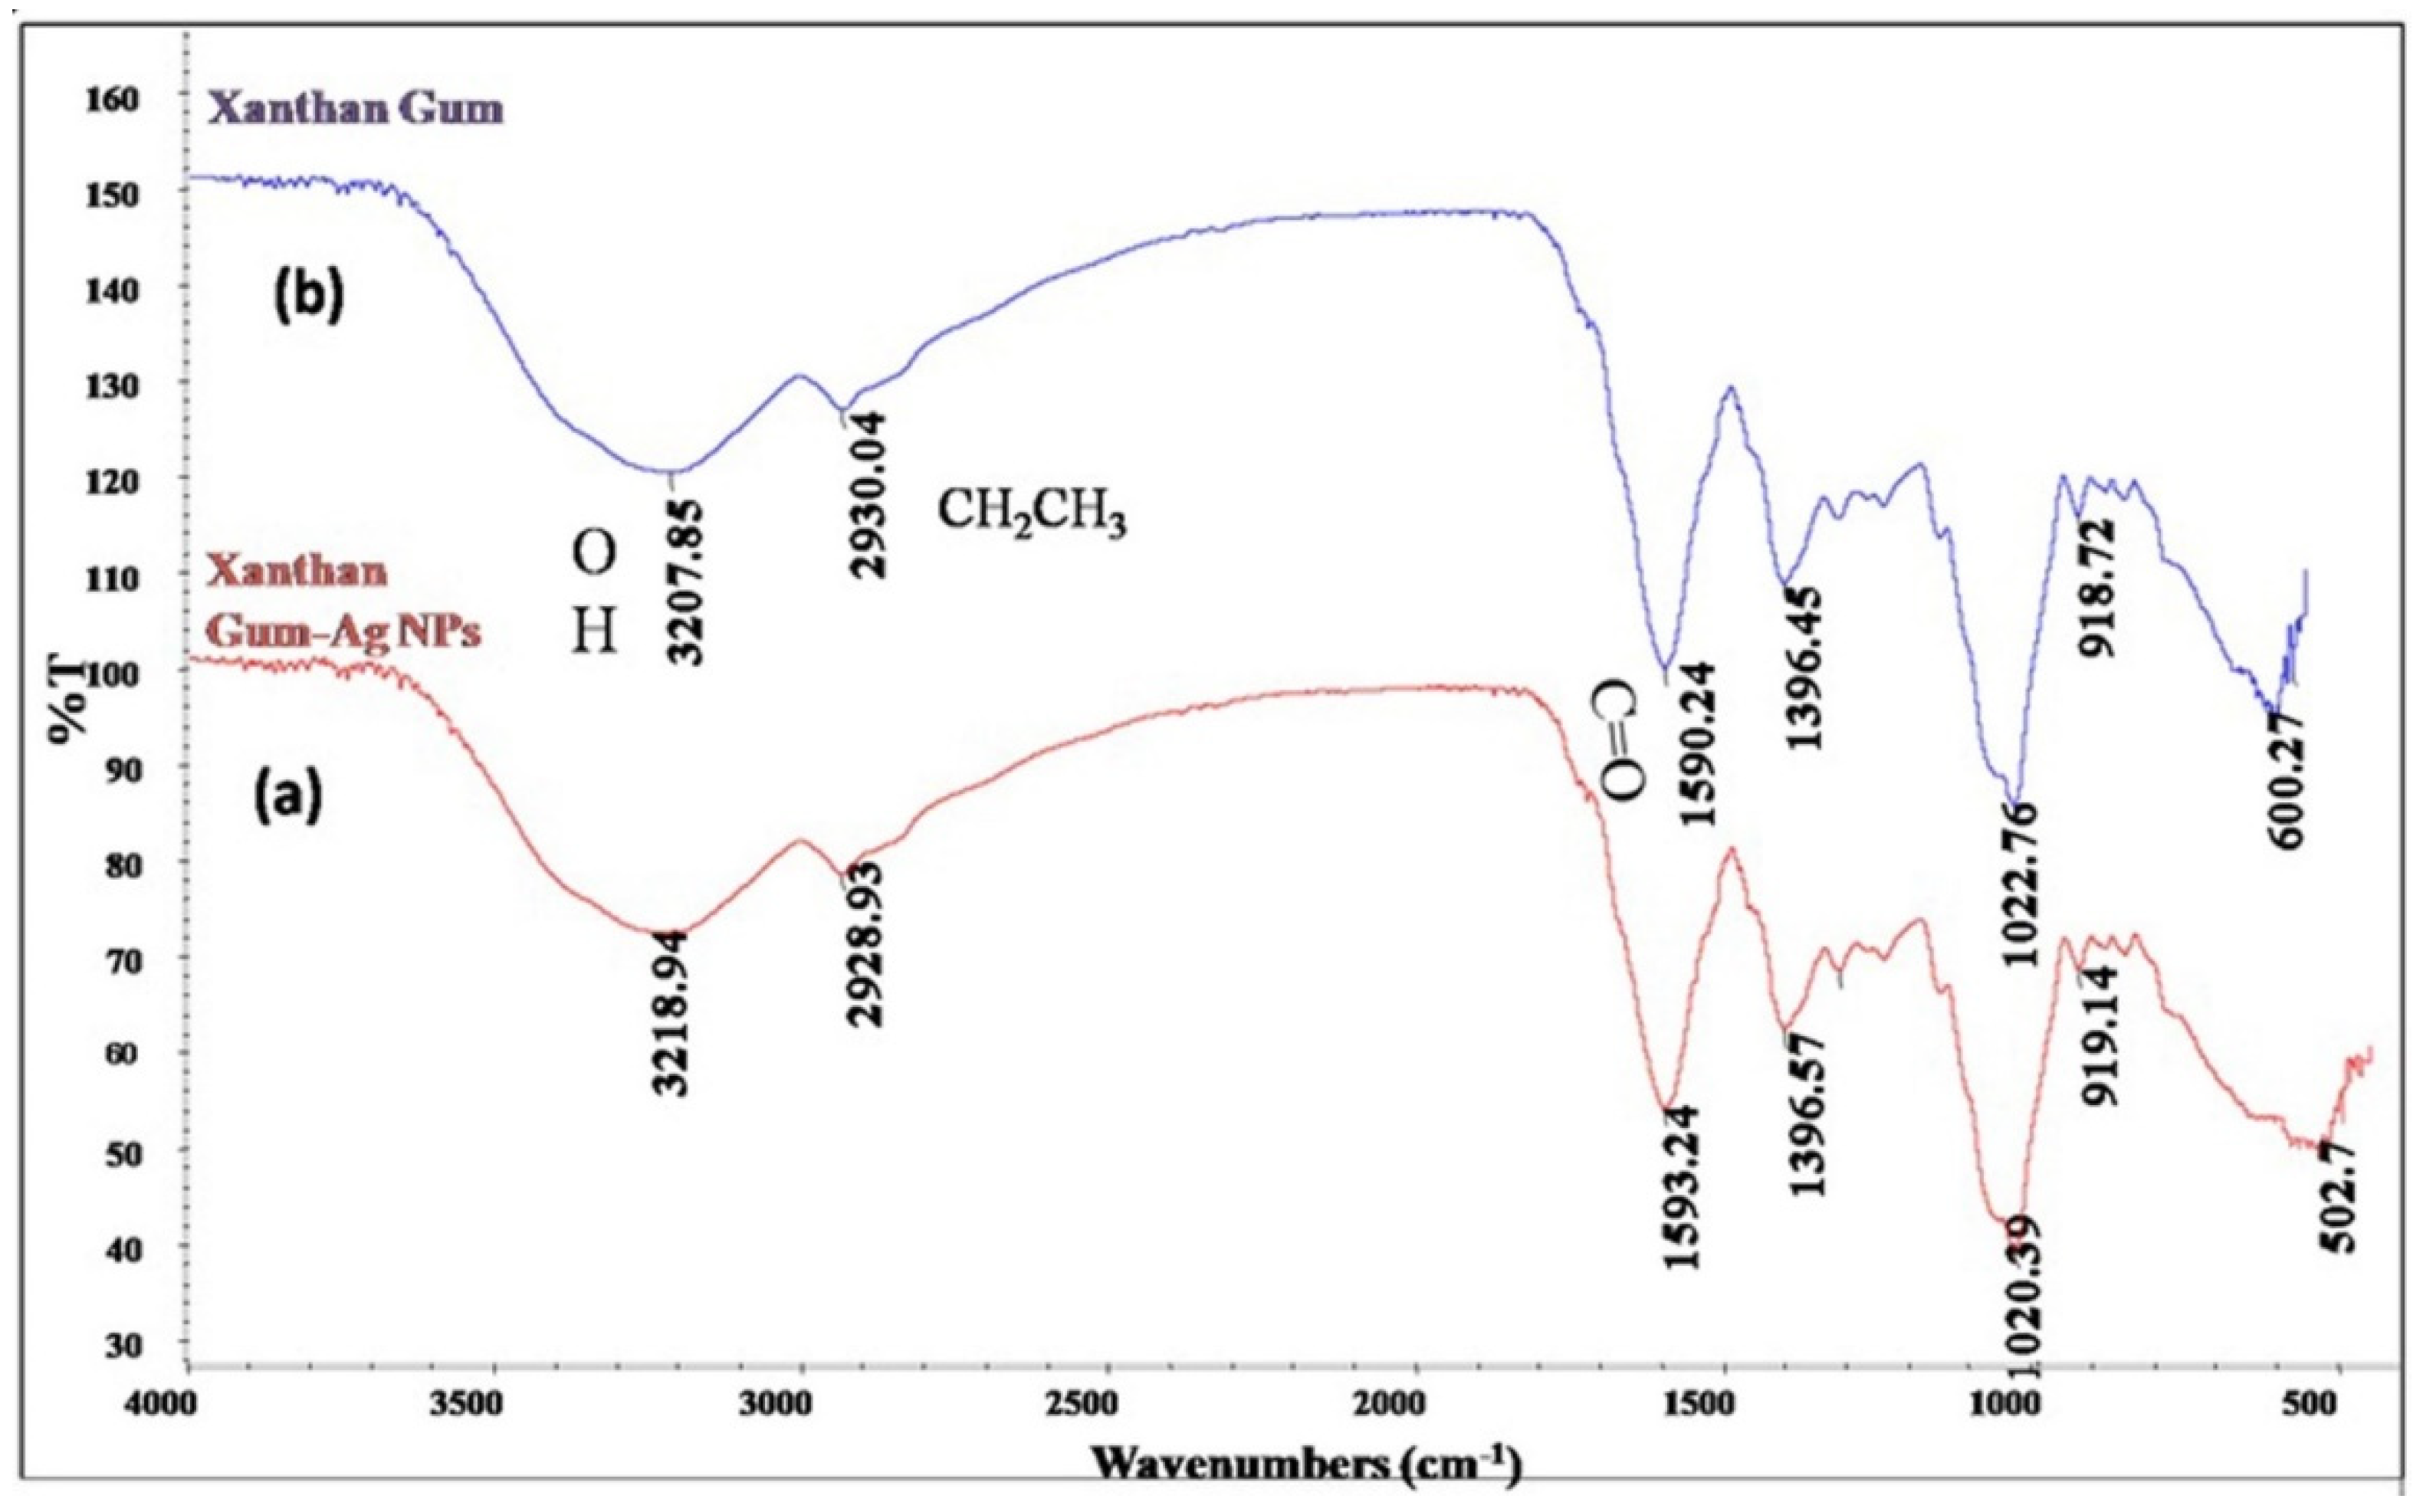
3.5. FTIR Study of AgNPs Bonded-XG

The FTIR spectra of AgNP-bonded XG and pure XG are described in Figure 4. The FTIR study was carried out to determine which group is responsible for the reduction and capping of AgNPs. In the case of XG-AgNPs, the major peaks appeared at 3219, 2929, 1593, 1397, 1020, and 919 cm−1. The broad peak at 3219 cm−1 was due to OH stretching vibrations [22]. The peak at 1593 cm−1 was due to symmetric and asymmetric stretching vibration of C=O groups in the acetyl group of gum [29]. Furthermore, the peaks at 1397 cm−1 and 1020 cm−1 were due to NO3 addition [21]. The peak of mannopyranose was also seen at 919 cm−1 [30]. Then, the spectra were compared with the FTIR spectra of XG. The main peaks appeared at 3208, 2930, 1591, 1396, 1023, and 918 cm−1. Shifting of peaks were seen from pure XG to XG-AgNPs spectra (3208–3219, 2930–2929, 1591–1593, 1396–1397, 1023–1020, 918–919 cm−1). This change in frequency distinctly establishes that both the hydroxyl and carboxyl groups of xanthan gum are responsible for the reduction and stabilization of AgNPs.

3.6. AFM Study

The AFM image of prepared XG-AgNPs is shown in Figure 5A, which allows for the calculation of their average size as well as for views into the surface roughness of the generated XG-AgNPs. The size distribution histogram of the prepared XG-AgNPs against their formation intensity is shown in Figure 5B, with the largest particle excluded by random selection.
The average size of the prepared XG-AgNPs is 5 nm in the range of 1.5–5 nm, in accordance with the data analysis. The greater stability of XG-AgNPs in solution and their scattered nature (Figure 5A) demonstrate the real capping function of xanthan gum, which induces electrostatic repulsion between nanoparticles to prevent aggregation [21].

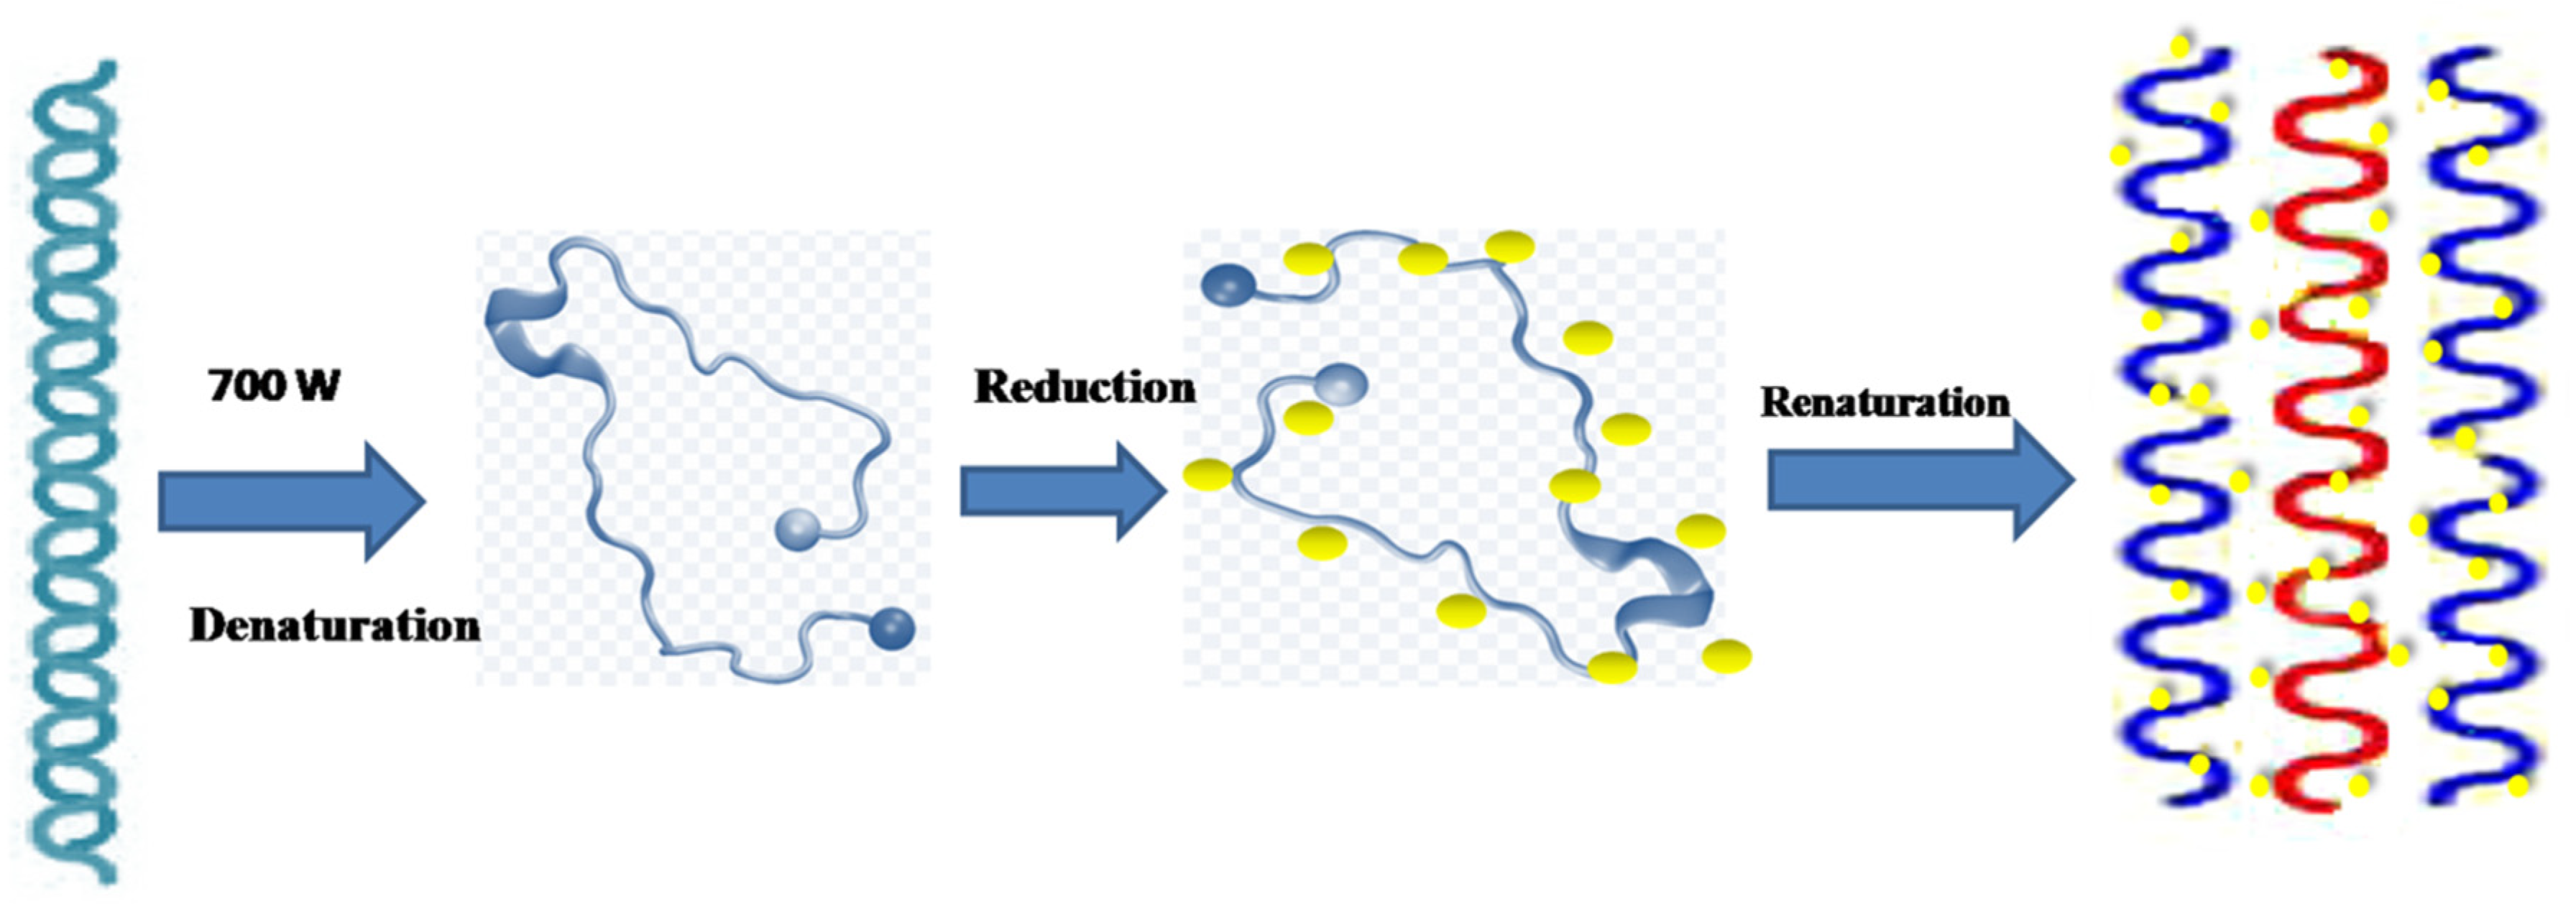
3.7. Mechanism of Xanthan Gum-Capped AgNP Synthesis

Xanthan gum possesses a five-fold helical structure which is highly ordered but at high power (700 w) denaturation (the process to convert XG into a disordered coil state) occurs, due to the hydroxyl group in xanthan gum structure becoming exposed (Figure 6), and offering their reduction capability for synthesis of AgNPs [21,31]. The carboxylic group of xanthan gum is highly electronegative and played a vital role in preventing the AgNPs from aggregation; because of this, AgNPs remained stable for a longer period of time [21,22,32] (Figure 4). After four weeks of storage at 4 C, the denatured single chains re-associated into a loose, several-fold helix, and as the helix lengthened, larger micro-rods formed. It was observed that AgNPs attached to the xanthan gum chain surface and became trapped in the hydrophobic cavity of the xanthan gum, folded helix [21,26]. Xanthan gum is an economic and ecofriendly polymer and it works as both a reducing as well as a capping agent. Therefore, it is preferred for the synthesis of AgNPs.

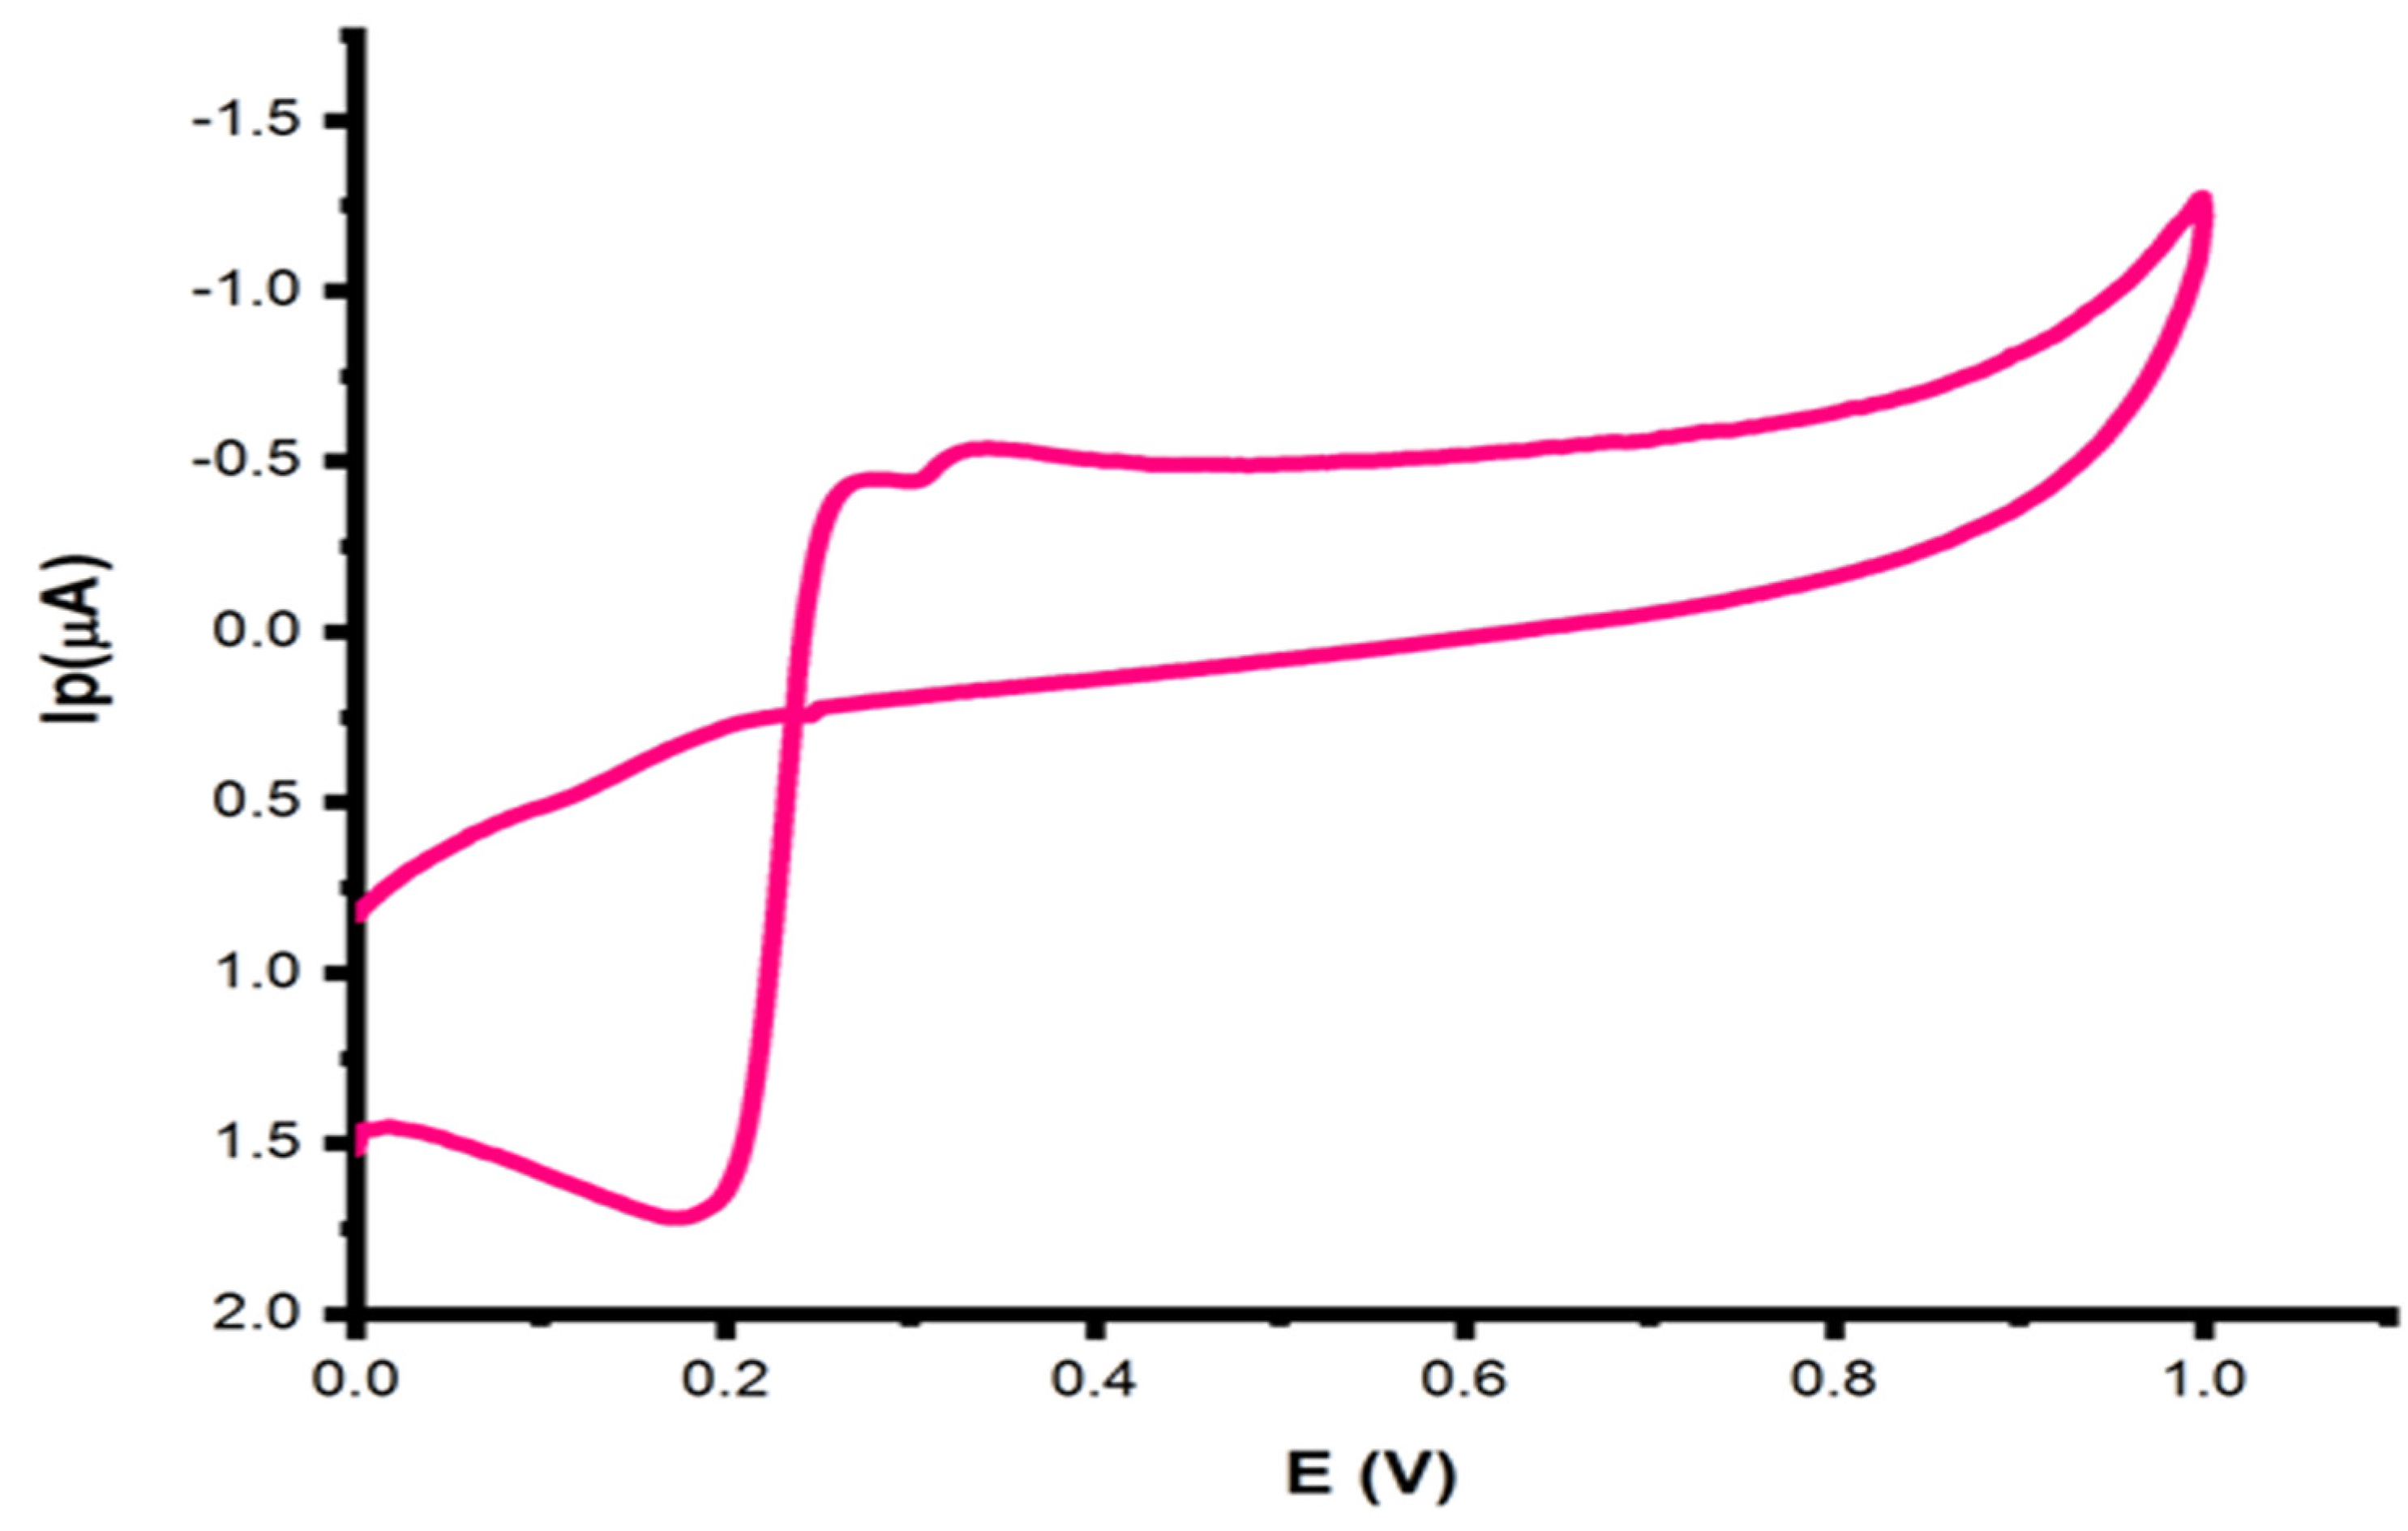
3.8. Electrochemical Behavior of Hg2+ at XG-AgNPs–GCE

A mode study was carried out to choose an appropriate mode that provides the best peak current; therefore, different voltammetric modes were tested, for example, cyclic voltammetry (CV), differential pulse voltammetry (DPV), and square wave voltammetry (SWV). However, better results were obtained in SWV mode for 0.02 µM Hg2+ solutions. Therefore, SWV mode was selected for the advanced optimization study.
First, cyclic voltammetry was performed on bare and modified glassy carbon electrodes without and with Hg2+ on the electrode surface in 0.04 M BRB at pH 7 at a scan rate of 100 mV s−1. The CVs of XG-AgNPs-modified electrodes with Hg2+ are shown in Figure 7.
However, the CV of the XG-AgNPs-modified electrode with Hg2+ shows an absence of an anodic peak at 0.23 V roughly and a broad cathodic peak at 0.17 V. In the case of SWV under the same condition, a better anodic peak in terms of intensity of current was obtained, and after repeating the same experiment, the same results were obtained which shows the stability of the modified electrode. DPV was also tried but a small anodic peak of current was obtained in Figure 8. Therefore, SWV was selected to study the anodic peak of Hg+2 for analytical purpose. The anodic peak is caused by the oxidation of Hg0 to Hg2+ in the BRB solution, which formed a complex with the XG-AgNPs modifier, while the cathodic peak is caused by the reduction of Hg2+ to Hg0.

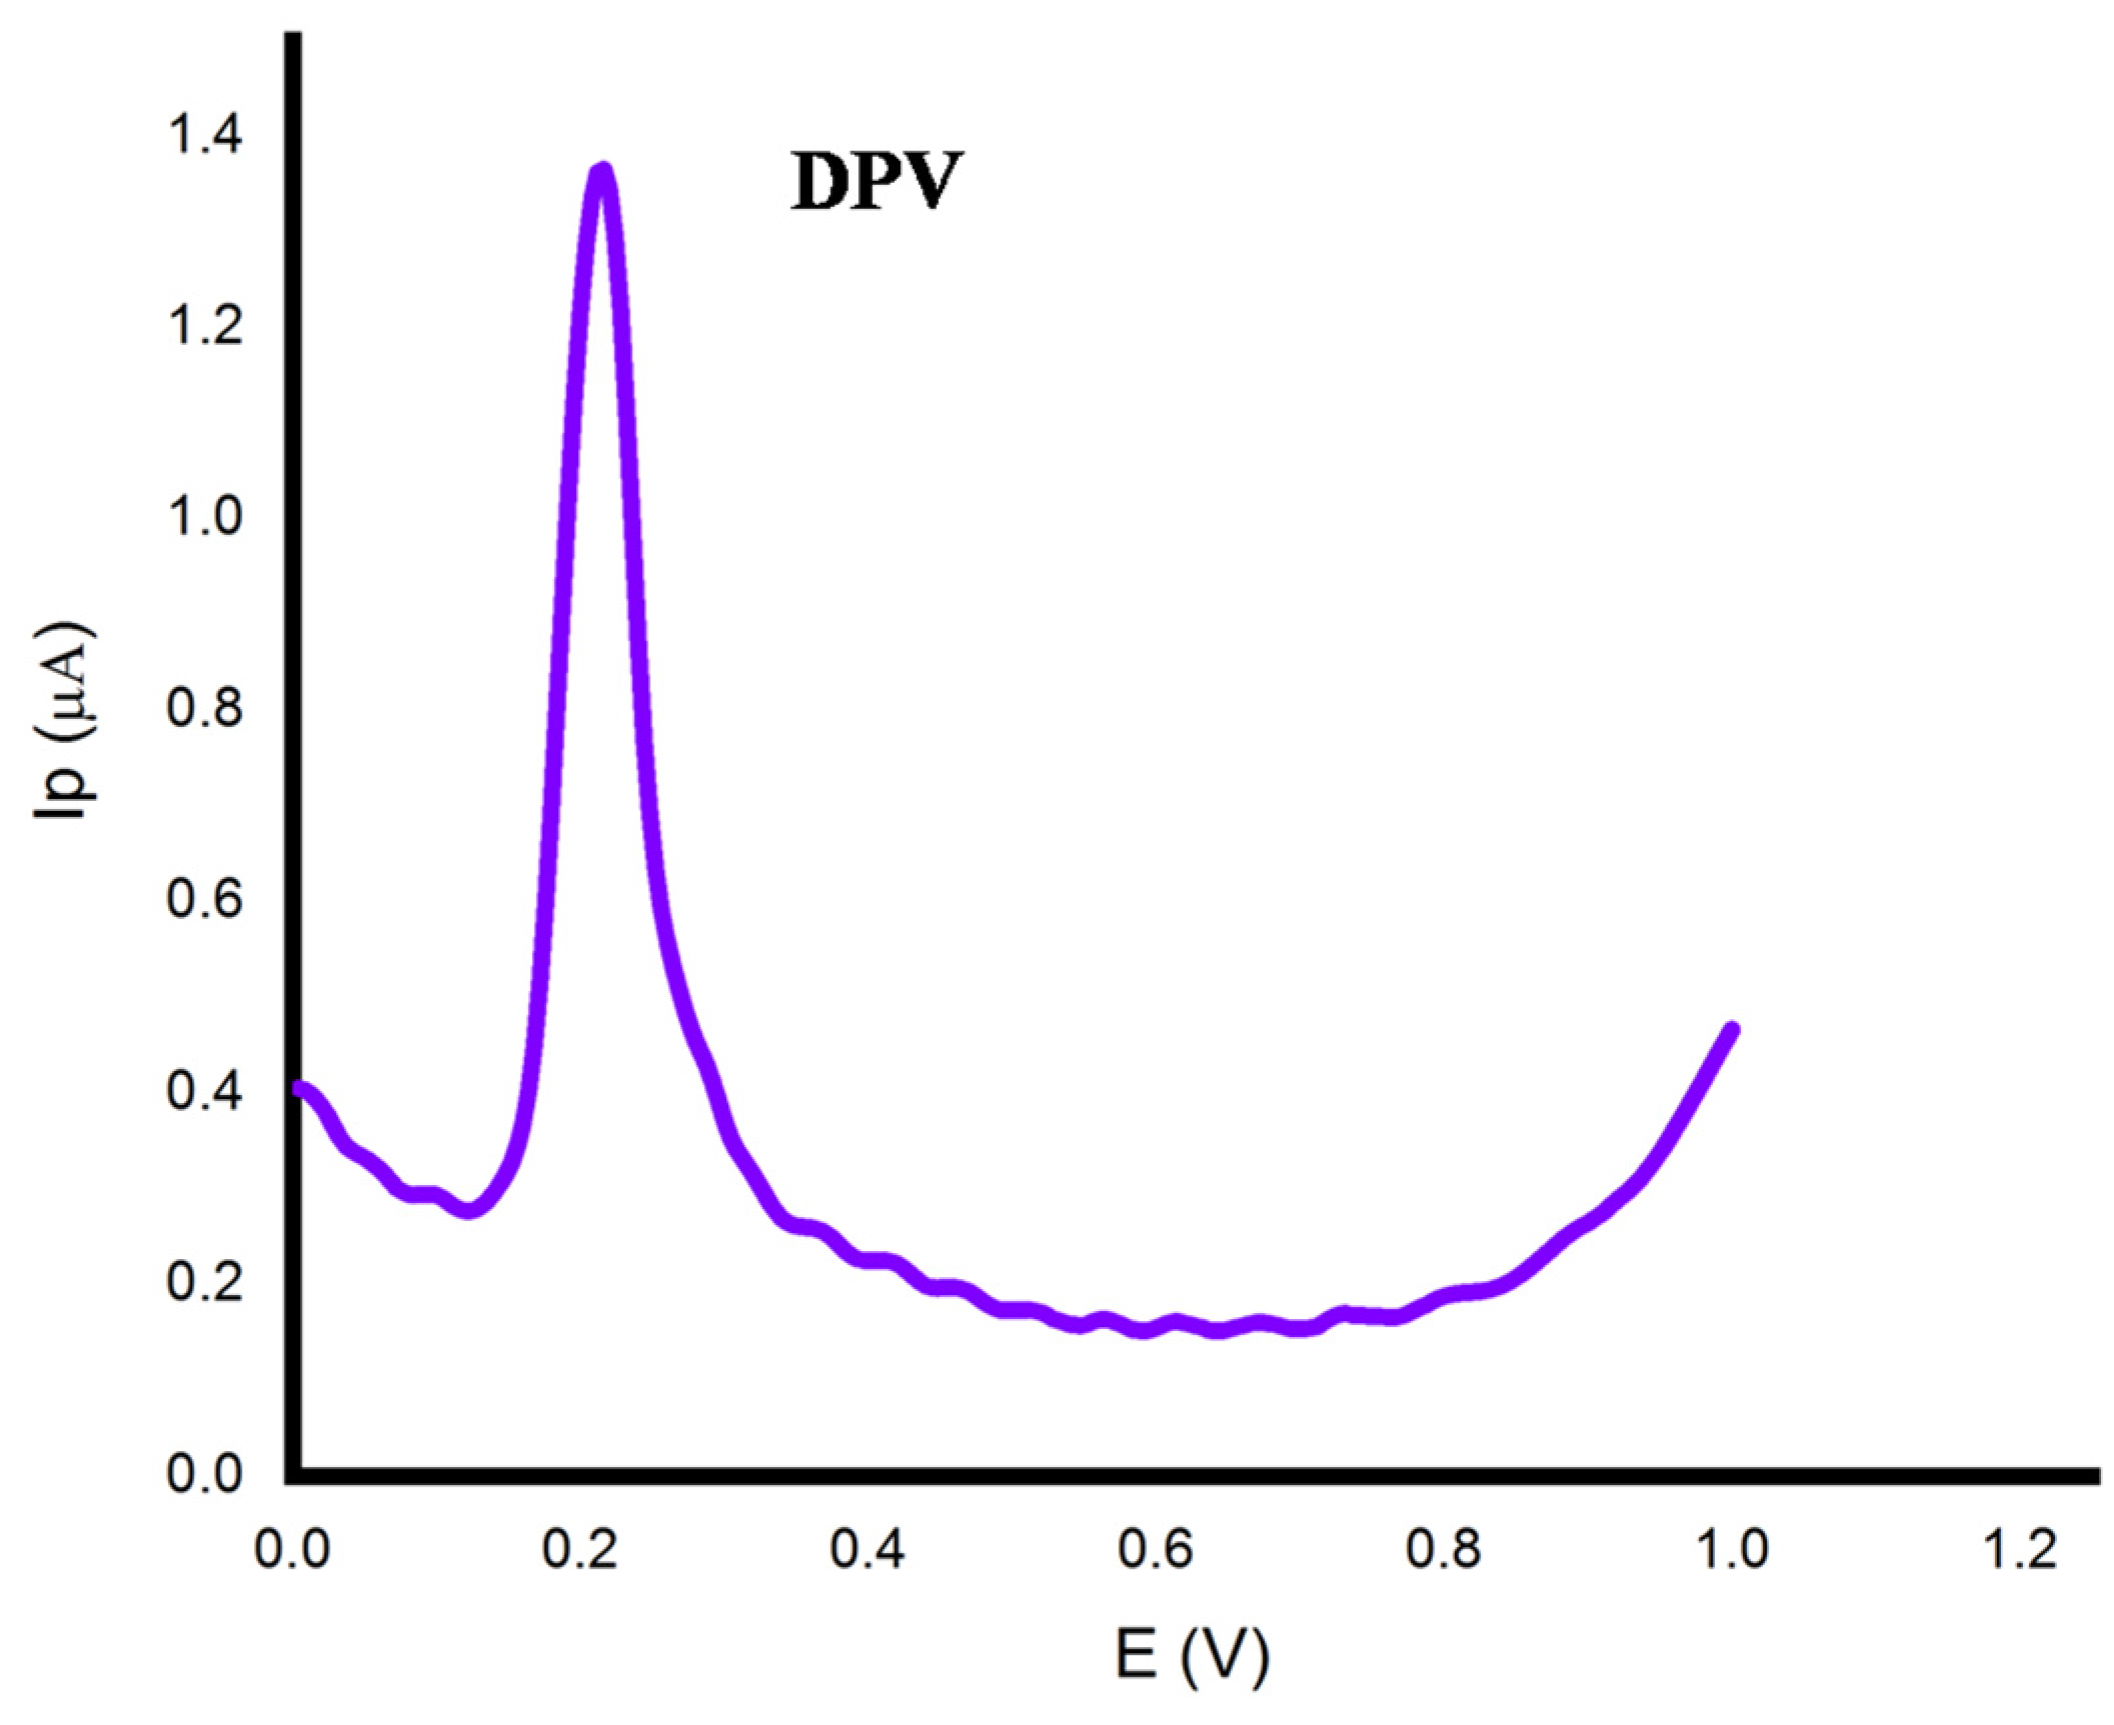
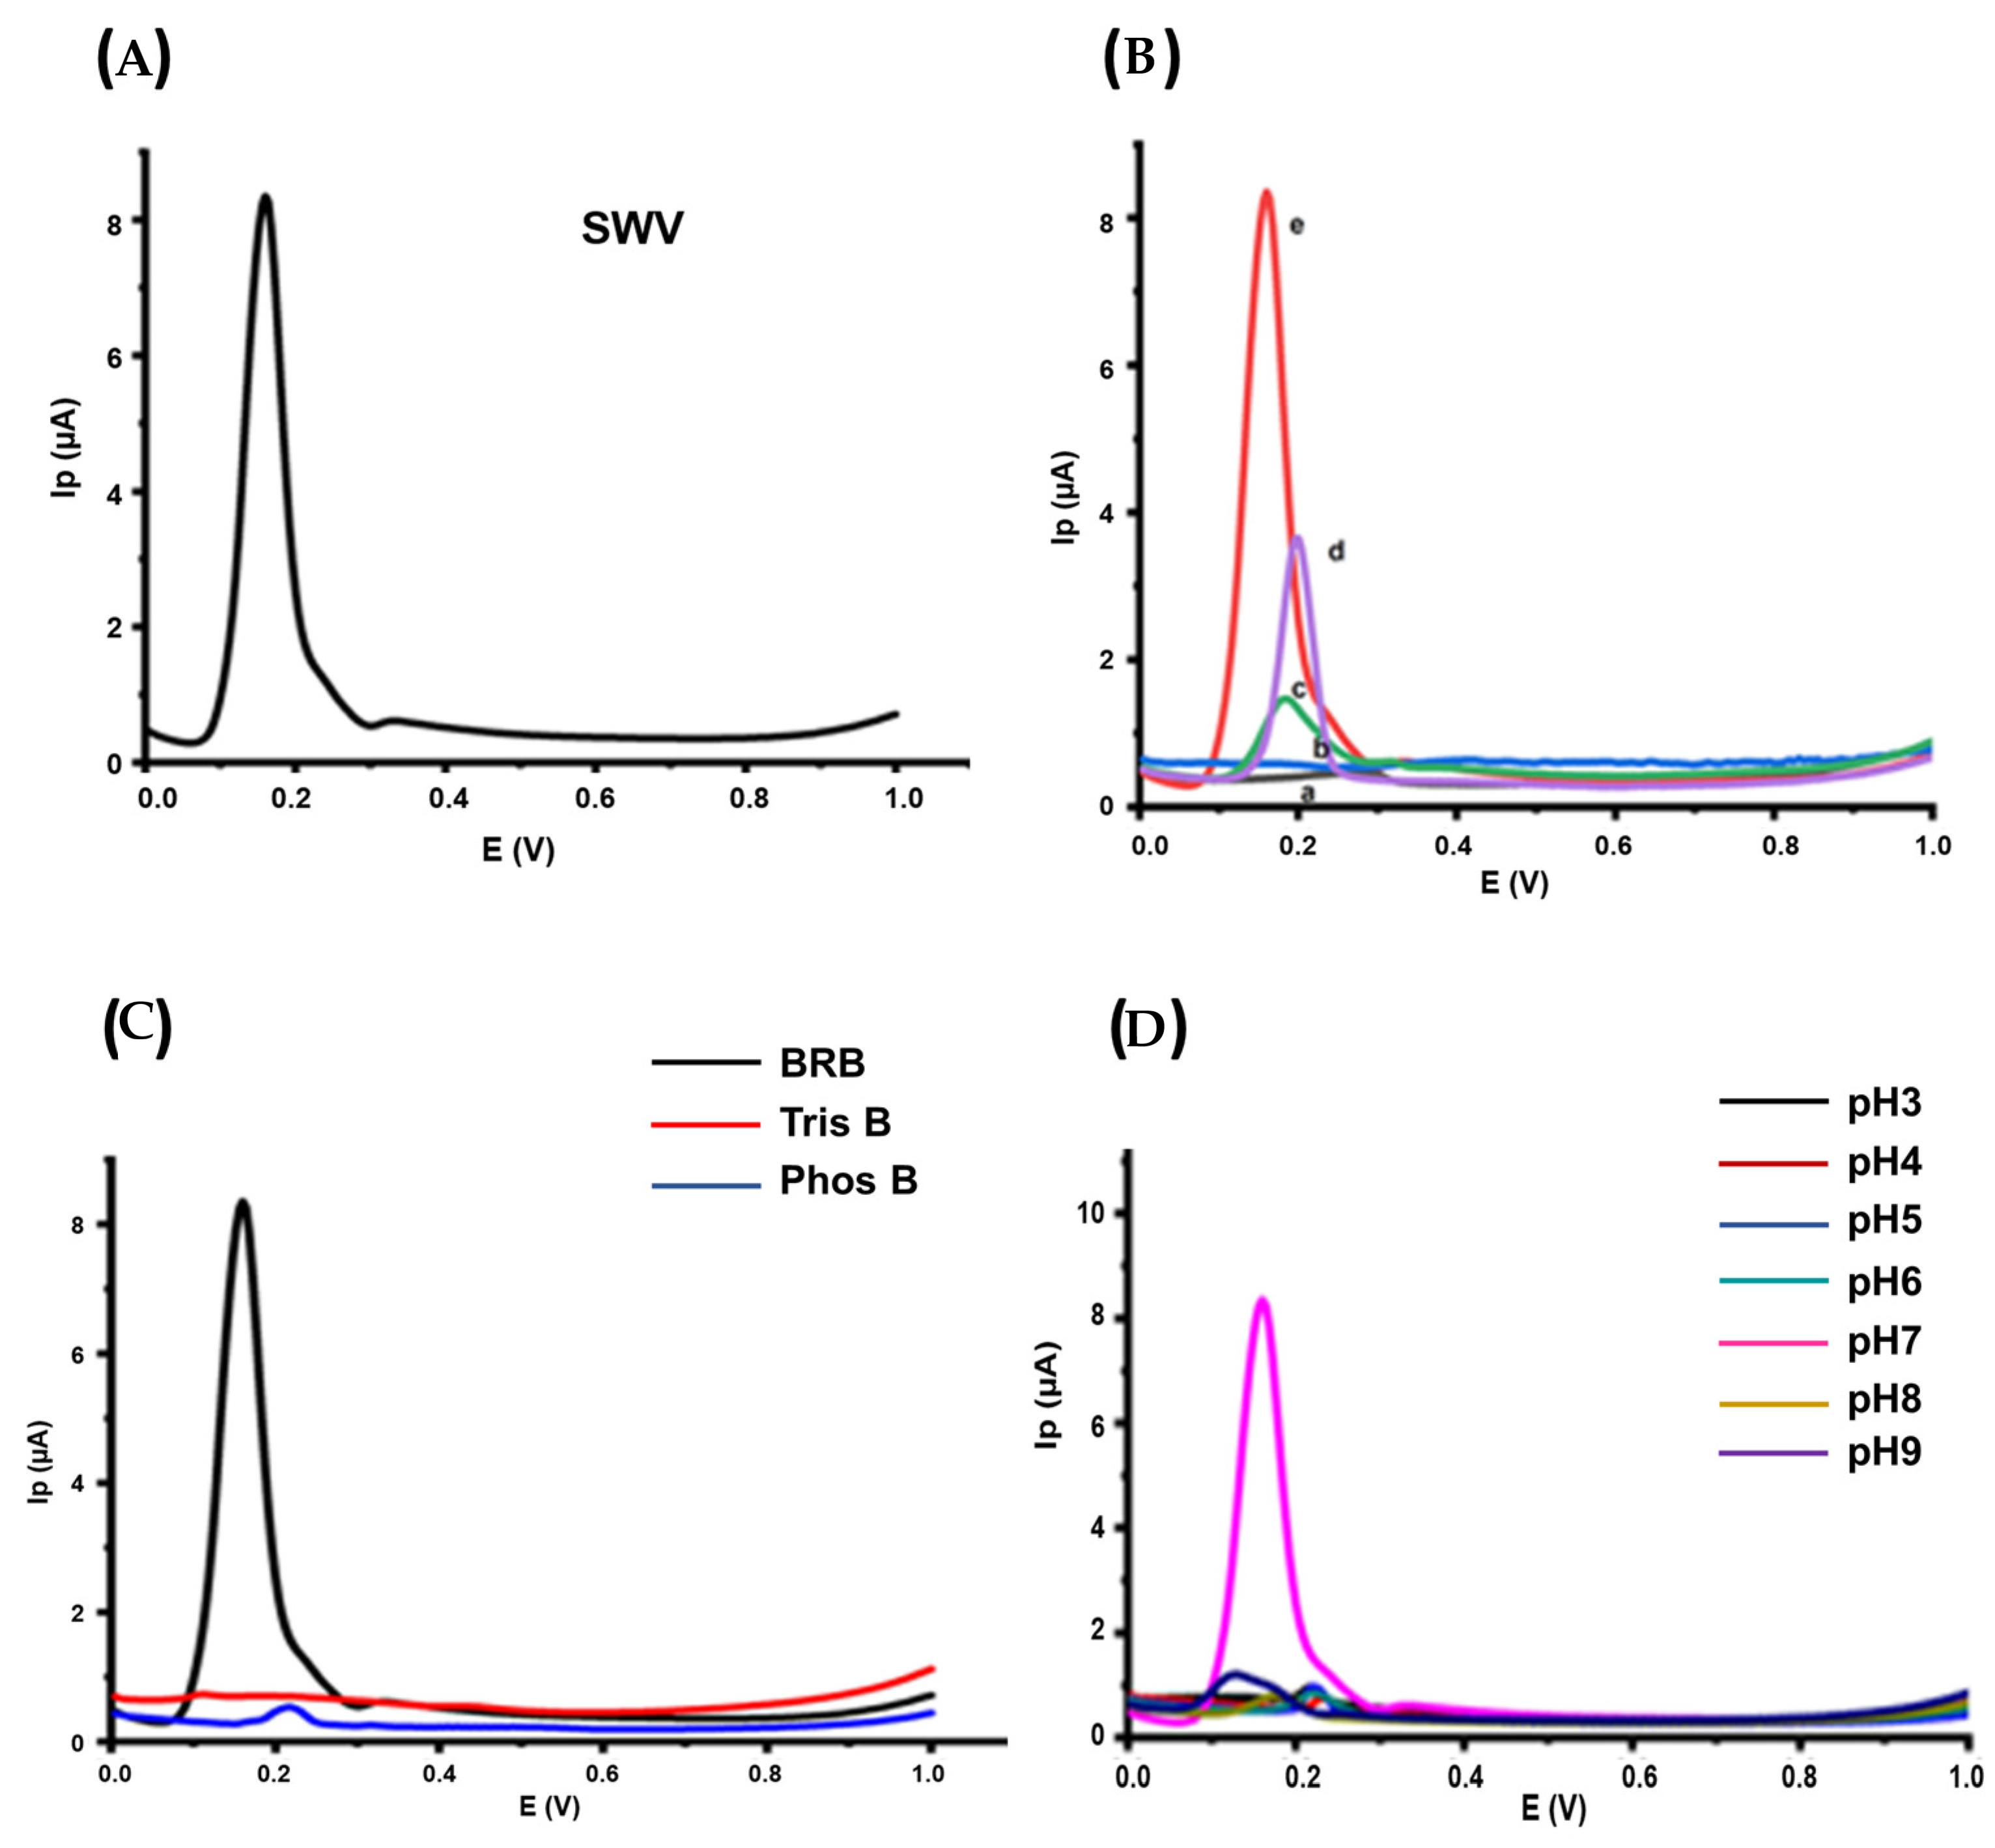
3.9. Square wave voltammetric studies

In the presence of 0.02 µM Hg2+, square wave voltammograms of bare and modified glassy carbon electrodes were obtained. Hg2+ anodic peak current is much higher at the XG-AgNPs-modified electrode than at the bare electrode, as seen in the voltammograms in Figure 9A,B. This indicates that Hg2+ is easily oxidized at the XG-AgNPs-modified electrode. As a result, the inclusion of XG-AgNPs allowed for a considerable improvement in the analytical signal of the electrode.

3.9.1. Effect of Various Electrodes on Ip of Hg2+ Solutions

To monitor the effect of the modified GCE and bare GCE on the current response of Hg2+, 0.04 M BRB solution of pH 7 was used. It is clear in Figure 7B that a small peak current was obtained in the bare GCE in the case of the electrode (peak a) while XG-AgNPs/Nafion-modified GCE provided the intense peak current responses (peak e). This result demonstrated the enhanced catalytic behavior of XG-AgNPs and Nafion towards the oxidation of 0.02 µM Hg2+ solutions with easy electron transfer action. Xanthan gum is a substantial part of XG-AgNPs/Nafion GCE; it is responsible for inducing the selectivity and sensitivity of Hg2+ ions. The current responses of the XG-modified GCE and XG-AgNPs/Nafion-modified GCE were recorded in 0.02 µM Hg2+ solution (Figure 9B, peak c and e).The obtained results proved that xanthan gum played a vital role in the selectivity and sensitivity for Hg2+ ions.

3.9.2. Influence of Supporting Electrolyte

To select a suitable electrolyte, different electrolytes at pH 7 were used to determine the influence on the Ip response of Hg2+ under SW mode, as depicted in Figure 9C. Recorded SW voltammograms for Hg2+ indicated that a sharper peak, the highest peak current, reproducibility, and background stability for Hg2+ were obtained in the case of BRB; in the presence of an appropriate BRB ionic strength, this behavior suggests that accelerated electron transport occurs at the electrode surface. This might also be related to variations in the amount of H+ available for the reduction stage [33,34]. Therefore, BRBs were chosen for further study while in the case of phosphate buffer, small peak current value was obtained and Tris buffer showed no response.

3.9.3. Influence of pH of Supporting Electrolyte

By altering the pH of the supporting electrolyte (0.04 M BRB), the influence of pH on the supporting electrolyte (0.04 M BRB) was also investigated. A graph of pH against Ip (Figure 9D) reveals that as pH increases, the Ep of Hg2+ moves towards a less positive potential value, whereas Ip fluctuates randomly. When the pH was raised to 7, the peak current rose. This is because hydrogen ions are involved in the reduction of Hg2+ at the XG-AgNPs–GCE surface (as explained in the mechanism).
When the pH was raised above 7, the peak current fell. The reduction reaction is slowed when the pH rises because of the possible formation of metal hydroxide [35,36], which would reduce the amount of free metal ions available for electroreduction at the XG-AgNPs/Nafion-modified GCE. As a result, pH 7 was chosen as the ideal pH for the ensuing electroanalytical experiments.

3.9.4. Electrochemical Process

The complexation of Hg2+ with the modifier XG-AgNPs in the closed-circuit cell at pH 7 results in the buildup of Hg2+ on the electrode surface. At a 0.1 V applied voltage in a closed-circuit cell in 0.04 M BRB at pH 7, Hg2+ in the complex (HgL2) is reduced to Hg0. After oxidation to Hg2+ on a positive scan from −0.1 V to 1.0 V in a closed-circuit cell in 0.04 M BRB at pH 7, Hg0 is stripped.
(1) Accumulation step (open-circuit cell, 0.04 M BRB, pH 7):
Hg2+ + 2HL → HgL2 + 2H+
Solution GCE Surface Solution
(2) Reduction step (closed-circuit cell, 0.04 M BRB, pH 7, 0.2 V):
HgL2 + 2H+ + 2e → Hg0 + 2HL
GCE Surface Solution
(3) The stripping step (closed-circuit cell, 0.04 M BRB, pH 7, positive scan: 0 V to 1 V):
Hg0→ Hg2+ + 2e
GCE Surface Solution

3.9.5. Influence of Nafion Volume on GCE

The drop-casting procedure was used to immobilize varying quantities of 0.2% Nafion in the range of 5–15 µL, which was then dried on the face of GCE/XG-AgNPs and investigated for Ip response using a 0.02 µM Hg2+ solution in BRB. The maximum Ip value was found when 20 µL of Nafion was coated on the modified GCE (Figure 10A). The ion exchange feature of Nafion caused cations to preconcentrate at the electrode–solution contact [37], considerably improving Hg2+’s electrochemical responsiveness.
Moreover, increasing the amount of Nafion resulted in a lower Ip value due to surface saturation of the modified GCE caused by probable blocking of particular active sites responsible for increased electron transmission [38].

3.9.6. Influence of Starting Potential and Accumulating Potential Variations on Hg2+Ip

In the region of 0.0 V to 1.0 V, the effect of various starting potential levels on Hg2+Ip was examined, but no noticeable effect was found on Hg2+’s Ip. This finding adds to the evidence that the XG-AgNPs/Nafion-modified GCE surface exhibits adsorptive properties.
In the region of 0.1 to 0.5 V, the impact of added accumulation potential on the Ip value of Hg2+ was also investigated. When the accumulation is changed to a less positive potential with the greatest Ip value at 0.1 V, improved Ip values are observed. Mercury preconcentrates at the electrode surface when a lower positive potential is applied, acting as an amplifier for the modifier’s adsorptive activity at the GCE’s edge.

3.9.7. Effect of Accumulation Time

From 5 to 20 s, the impact of accumulation time on the peak current of Hg2+ was investigated. Figure 10 depicts the influence of time on the XG-AgNPs/Nafion-modified GCE electrode’s anodic peak current. With increasing accumulation time, the peak current value increases, leading to a rise in Hg2+ adsorption at the electrode surface (Figure 10B–D). In general, the response rises until it reaches the highest current, which can be either saturation or equilibrium surface covering. The outcome showed that consistent deposition levels of Hg2+ at the electrode surface were achieved after 15 s of exposure. There seemed to be no increase in peak current after that. Therefore, 15 s was chosen for further study. Based on the evidence presented, it is anticipated that the oxidation of Hg0 occurs at the surface of xanthan gum-based AgNPs via the removal of an electron and a proton in a fashion similar to that described for mercury [1].

3.9.8. Stability of the Sensor

The constructed sensor was tested for stability and reproducibility, runs were taken after each 4 h to measure its stability, and it was found stable for a day (Figure 10E) in the oxidation of 0.02 µM Hg2+solutions in BRB buffer at pH 7.0. For six duplicate runs, the relative standard deviation (RSD) of 2.5% was valid. This means that the constructed sensor has superior stability and reproducibility in regard to Hg2+detection.

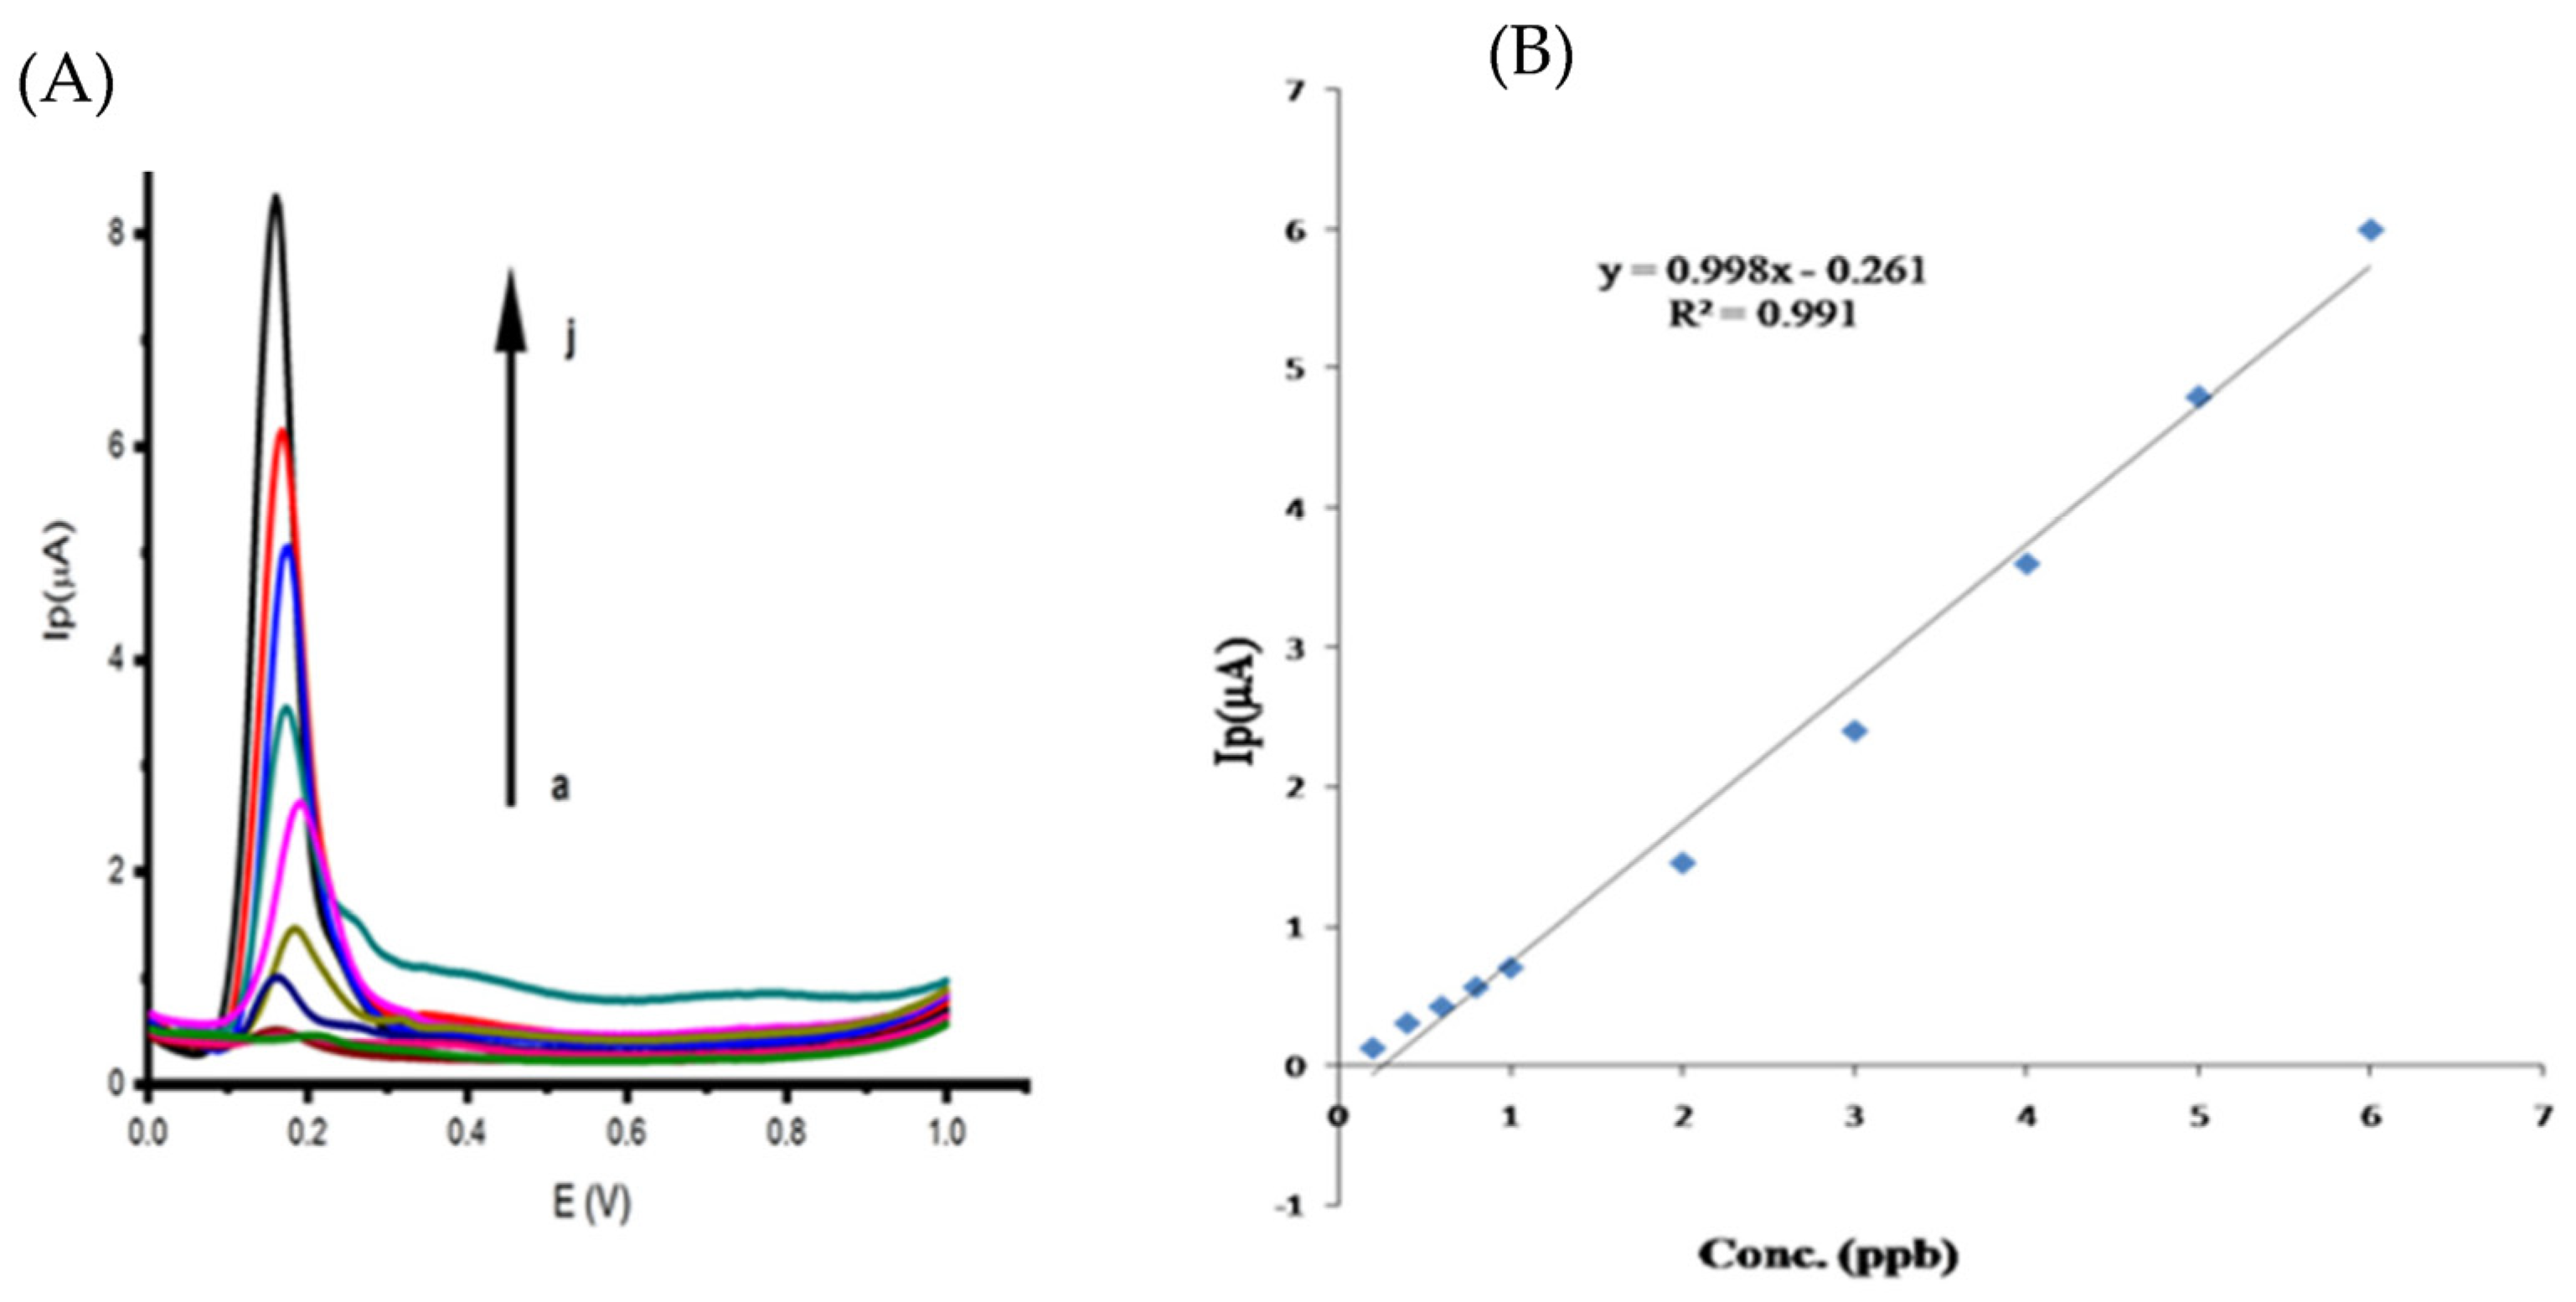
3.9.9. Calibration Curve, Detection Limit, and Reproducibility

This calibration study was carried out under the optimized parameters. Figure 11A shows the calibration voltammograms and Figure 11B depicts a linear calibration plot for Hg2+ concentrations in the range of 0.00074 µM to 0.02 µM. With the calibration equation IP = (µA) = 1.09x − 0.395 and a correlation coefficient of 0.981, a linear calibration plot was generated with the peak current increasing with increasing Hg2+ concentration. The detection limit was estimated at three times the SD of the linear range’s lowest concentration (0.00074 µM Hg2+). Amounts of 0.18 ppb and 0.58 ppb were found to be the detection limit and limit of quantification (LOQ), respectively. This calibration plot method can be used to determine Hg2+ in water samples.
The analytical performance of the constructed sensor was compared to other documented methods in the literature, as shown in Table 1 The findings show that the current study’s LOD is low and that it is similar to most of the approaches reported in the literature. The table clearly shows that some reported methods achieved lower Hg2+ detection limits, but these methods have disadvantages such as sample preparation, the use of organic products, expensive instruments, and complex fabrication, whereas our developed voltammetric sensor has none of these disadvantages.

3.9.10. Ion Interference

To assess the selectivity of the sensor, the impact of many interfering species on the determination of Hg2+ was assessed. The impact of known interfering ions found in water samples (which are commonly present alongside Hg(II) in multiple specimens) such as Cd(II), Pb2+, Ni(II), SO42-, Cd(II), Cr2O4, Co(II), and Cu(II) was investigated (Table 2). These have no discernible impact on the detection of Hg2+. The results reveal that XG-AgNPs/Nafion-modified GCE is very selective for determining Hg2+. All of the ions and chemicals studied showed hindrance within the acceptable range of 5%. In reality, several ions found in water samples do not affect the determination of Hg2+, so the sensor is quite selective and can be used to determine Hg2+.

3.9.11. The Voltammetric Determination of Hg2+ by the Proposed Sensor

The spiking method was followed to perform the recovery test of Hg2+. Table 3 comprises recovery results, according to which percentage recovery exists in the range of 98–105%, which is within the acceptable range.

4. Conclusions

AgNPs were made using the environmentally friendly xanthan gum as a reducing and capping agent. Different approaches were employed to characterize XG-AgNPs, which were then used as an electrochemical sensor for the ultrasensitive measurement of Hg2+. Furthermore, the SWV method used in this report for Hg2+ detection is simpler, faster, more sensitive, cost-effective, good for the environment, and based on a less expensive instrumentation procedure. The most unique and useful part of this paper is that it describes the first natural gum-based modified voltammetric sensor to be published in the literature. For Hg2+ investigations, the suggested sensor demonstrated better selectivity and sensitivity than the bare GCE. The suggested approach has a wider linear range of 0.0007–0.002 µM Hg2+ and a lower detection limit of 0.18 ppb Hg2+ than most previously published methods, and it is unaffected by other ions commonly found in environmental fluids, alloys, and complicated materials. Without any preliminary sample treatment other than filtration, the devised approach has been effectively applied to the measurement of Hg2+ in water samples. A simpler approach for the easy synthesis of AgNPs and their use in making extremely sensitive voltammetric Hg2+ sensors has been developed.

Author Contributions

Conceptualization, F.N.T., S. and S.S.; methodology, S.S., F.N.T. and S.; validation, F.N.T., S., N.A., M.A.I., and A.I.; formal analysis, F.N.T., A.U. and M.S.B.; investigation, S.S., F.N.T. and S.; resources, F.N.T., H.I.A. and S.; data curation, S.S. and F.N.T.; writing—original draft preparation, S.S. and F.N.T.; writing—review and editing, F.N.T., A.U., M.S.B., A.K. and I.A.A.; visualization, F.N.T., S., H.I.A., and S.S.; supervision, F.N.T. and S.; project administration, F.N.T.; funding acquisition, W.-C.L. All authors have read and agreed to the published version of the manuscript.

Funding

The current work was assisted financially by the Dean of Science and Research at King Khalid University via the General Research Project: Grant no. (R.G.P. 1/320/43).

Data Availability Statement

The data presented in this study are available on request from the corresponding author.

Acknowledgments

The authors are grateful to NCEAC, University of Sindh, Jamshoro, the Dean of Science and Research at King Khalid University, Kingdom of Saudi Arabia; Tsinghua university; Zhejiang University, China.

Conflicts of Interest

The authors declare that they have no known competing financial interests or personal relationships that could have appeared to influence the work reported in this paper.

References

  1. Alemayehu, D.; Chandravanshi, B.S.C.; Hailu, T.; Tessema, M. Square wave anodic stripping voltammetric determination of Hg (II) with Np-chlorophenylcinnamohydroxamic acid modified carbon paste electrode. Bull. Chem. Soc. Ethiop. 2020, 34, 25–39. [Google Scholar] [CrossRef]
  2. Agarwal, A.; Verma, A.K.; Yoshida, M.; Naik, R.M.; Prasad, S. A novel catalytic kinetic method for the determination of mercury (ii) in water samples. RSC Adv. 2020, 10, 25100–25106. [Google Scholar] [CrossRef] [PubMed]
  3. Bashir, M.S.; Zhou, C.; Wang, C.; Sillanpää, M.; Wang, F. Facile strategy to fabricate palladium-based nanoarchitectonics as efficient catalytic converters for water treatment. Sep. Purif. Technol. 2023, 304, 122307. [Google Scholar] [CrossRef]
  4. Bashir, M.S.; Ramzan, N.; Najam, T.; Abbas, G.; Gu, X.; Arif, M.; Qasim, M.; Bashir, H.; Shah, S.S.A.; Sillanpää, M. Metallic nanoparticles for catalytic reduction of toxic hexavalent chromium from aqueous medium: A state-of-the-art review. Sci. Total Environ. 2022, 829, 154475. [Google Scholar] [CrossRef] [PubMed]
  5. Bashir, M.S. Benign fabrication process of hierarchal porous polyurea microspheres with tunable pores and porosity: Their Pd immobilization and use for hexavalent chromium reduction. Chem. Eng. Res. Des. 2021, 175, 102–114. [Google Scholar] [CrossRef]
  6. Li, L.; Qiu, Y.; Feng, Y.; Li, Y.; Wu, K.; Zhu, L. Stripping voltammetric analysis of mercury ions at nitrogen-doped reduced graphene oxide modified electrode. J. Electroanal. Chem. 2020, 865, 114121. [Google Scholar] [CrossRef]
  7. Moutcine, A.; Chtaini, A. Electrochemical determination of trace mercury in water sample using EDTA-CPE modified electrode. Sens. Bio-Sens. Res. 2018, 17, 30–35. [Google Scholar] [CrossRef]
  8. Suherman, A.L.; Tanner, E.E.; Compton, R.G. Recent developments in inorganic Hg2+ detection by voltammetry. TrAC—Trends Anal. Chem. 2017, 94, 161–172. [Google Scholar] [CrossRef]
  9. Javanbakht, M.; Khoshsafar, H.; Ganjali, M.R.; Badiei, A.; Norouzi, P.; Hasheminasab, A. Determination of nanomolar mercury (II) concentration by anodic-stripping voltammetry at a carbon paste electrode modified with functionalized nanoporous silica gel. Curr. Anal. Chem. 2009, 5, 35–41. [Google Scholar] [CrossRef]
  10. Anandhakumar, S.; Mathiyarasu, J.; Phani, K. Anodic stripping voltammetric detection of mercury (ii) using Au-PEDOT modified carbon paste electrode. Anal. Methods 2012, 4, 2486–2489. [Google Scholar] [CrossRef]
  11. Suherman, A.L.; Kuss, S.; Tanner, E.E.; Young, N.P.; Compton, R.G. Electrochemical Hg2+ detection at tannic acid-gold nanoparticle modified electrodes by square wave voltammetry. Analyst 2018, 143, 2035–2041. [Google Scholar] [CrossRef] [PubMed] [Green Version]
  12. Manzoor, A.; Kokab, T.; Nawab, A.; Shah, A.; Siddiqi, H.M.; Iqbal, A. Electrochemical detection of mercuric (ii) ions in aqueous media using glassy carbon electrode modified with synthesized tribenzamides and silver nanoparticles. RSC Adv. 2022, 12, 1682–1693. [Google Scholar] [CrossRef] [PubMed]
  13. Eksin, E.; Erdem, A.; Fafal, T.; Kıvçak, B. Eco-friendly Sensors Developed by Herbal Based Silver Nanoparticles for Electrochemical Detection of Mercury (II) Ion. Electroanalysis 2019, 31, 1075–1082. [Google Scholar] [CrossRef]
  14. Meenakshi, S.; Devi, S.; Pandian, K.; Chitra, K.; Tharmaraj, P. Aniline-mediated synthesis of carboxymethyl cellulose protected silver nanoparticles modified electrode for the differential pulse anodic stripping voltammetry detection of mercury at trace level. Ionics 2019, 25, 3431–3441. [Google Scholar] [CrossRef]
  15. Cinti, S.; Santella, F.; Moscone, D.; Arduini, F. Hg2+ detection using a disposable and miniaturized screen-printed electrode modified with nanocomposite carbon black and gold nanoparticles. Environ. Sci. Pollut. Res. 2016, 23, 8192–8199. [Google Scholar] [CrossRef]
  16. Kanchana, P.; Sudhan, N.; Anandhakumar, S.; Mathiyarasu, J.; Manisankar, P.; Sekar, C. Electrochemical detection of mercury using biosynthesized hydroxyapatite nanoparticles modified glassy carbon electrodes without preconcentration. RSC Adv. 2015, 5, 68587–68594. [Google Scholar] [CrossRef]
  17. Laffont, L.; Hezard, T.; Gros, P.; Heimbürger, L.-E.; Sonke, J.E.; Behra, P.; Evrard, D. Mercury (II) trace detection by a gold nanoparticle-modified glassy carbon electrode using square-wave anodic stripping voltammetry including a chloride desorption step. Talanta 2015, 141, 26–32. [Google Scholar] [CrossRef] [Green Version]
  18. Amanulla, B.; Perumal, K.N.; Ramaraj, S.K. Chitosan functionalized gold nanoparticles assembled on sulphur doped graphitic carbon nitride as a new platform for colorimetric detection of trace Hg2+. Sens. Actuators B Chem. 2019, 281, 281–287. [Google Scholar] [CrossRef]
  19. Abbasi, A.; Hanif, S.; Shakir, M. Gum acacia-based silver nanoparticles as a highly selective and sensitive dual nanosensor for Hg (ii) and fluorescence turn-off sensor for S2− and malachite green detection. RSC Adv. 2020, 10, 3137–3144. [Google Scholar] [CrossRef] [Green Version]
  20. Mao, C.-F.; Klinthong, W.; Zeng, Y.-C.; Chen, C.-H. On the interaction between konjac glucomannan and xanthan in mixed gels: An analysis based on the cascade model. Carbohydr. Polym. 2012, 89, 98–103. [Google Scholar] [CrossRef]
  21. Xu, W.; Jin, W.; Lin, L.; Zhang, C.; Li, Z.; Li, Y.; Song, R.; Li, B. Green synthesis of xanthan conformation-based silver nanoparticles: Antibacterial and catalytic application. Carbohydr. Polym. 2014, 101, 961–967. [Google Scholar] [CrossRef] [PubMed]
  22. Venkatesham, M.; Ayodhya, D.; Veerabhadram, G. Green synthesis, characterization and catalytic activity of palladium nanoparticles by xanthan gum. Appl. Nanosci. 2015, 5, 315–320. [Google Scholar]
  23. Rao, K.; Roome, T.; Aziz, S.; Razzak, A.; Abbas, G.; Imran, M.; Jabri, T.; Gul, J.; Hussain, M.; Sikandar, B. Bergenin loaded gum xanthan stabilized silver nanoparticles suppress synovial inflammation through modulation of the immune response and oxidative stress in adjuvant induced arthritic rats. J. Mater. Chem. B 2018, 6, 4486–4501. [Google Scholar] [CrossRef] [PubMed]
  24. Akele, M.L.; Assefa, A.G.; Alle, M. Microwave-assisted green synthesis of silver nanoparticles by using gum acacia: Synthesis, characterization and catalytic activity studies. Int. J. Green Chem. Bioprocess 2015, 5, 21–27. [Google Scholar]
  25. Ortega, M.P.; López-Marín, L.M.; Millán-Chiu, B.; Manzano-Gayosso, P.; Acosta-Torres, L.S.; García-Contreras, R.; Manisekaran, R. Polymer mediated synthesis of cationic silver nanoparticles as an effective anti-fungal and anti-biofilm agent against Candida species. Colloid Interface Sci. Commun. 2021, 43, 100449. [Google Scholar] [CrossRef]
  26. Li, S.; Zhang, Y.; Xu, X.; Zhang, L. Triple helical polysaccharide-induced good dispersion of silver nanoparticles in water. Biomacromolecules 2011, 12, 2864–2871. [Google Scholar] [CrossRef] [PubMed]
  27. Pooja, D.; Panyaram, S.; Kulhari, H.; Rachamalla, S.S.; Sistla, R. Xanthan gum stabilized gold nanoparticles: Characterization, biocompatibility, stability and cytotoxicity. Carbohydr. Polym. 2014, 110, 1–9. [Google Scholar] [CrossRef]
  28. Tsuji, M.; Hashimoto, M.; Nishizawa, Y.; Kubokawa, M.; Tsuji, T. Microwave-assisted synthesis of metallic nanostructures in solution. Chem.-A Eur. J. 2005, 11, 440–452. [Google Scholar] [CrossRef]
  29. Wu, J.; Zhao, N.; Zhang, X.; Xu, J. Cellulose/silver nanoparticles composite microspheres: Eco-friendly synthesis and catalytic application. Cellulose 2012, 19, 1239–1249. [Google Scholar] [CrossRef]
  30. Xin, S.; Li, Y.; Li, W.; Du, J.; Huang, R.; Du, Y.; Deng, H. Carboxymethyl chitin/organic rectorite composites based nanofibrous mats and their cell compatibility. Carbohydr. Polym. 2012, 90, 1069–1074. [Google Scholar] [CrossRef]
  31. Emam, H.E.; Zahran, M.K. Ag0 nanoparticles containing cotton fabric: Synthesis, characterization, color data and antibacterial action. Int. J. Biol. Macromol. 2015, 75, 106–114. [Google Scholar] [CrossRef] [PubMed]
  32. Rao, K.M.; Kumar, A.; Haider, A.; Han, S.S. Polysaccharides based antibacterial polyelectrolyte hydrogels with silver nanoparticles. Mater. Lett. 2016, 184, 189–192. [Google Scholar] [CrossRef]
  33. Tagar, Z.A.; Memon, N.; Agheem, M.H.; Junejo, Y.; Hassan, S.S.; Kalwar, N.H.; Khattak, M.I. Selective, simple and economical lead sensor based on ibuprofen derived silver nanoparticles. Sens. Actuators B Chem. 2011, 157, 430–437. [Google Scholar] [CrossRef]
  34. Tagar, Z.A.; Memon, N.; Kalhoro, M.S.; O’Brien, P.; Malik, M.A.; Abro, M.I.; Hassan, S.S.; Kalwar, N.H.; Junejo, Y. Highly sensitive, selective and stable multi-metal ions sensor based on ibuprofen capped mercury nanoparticles. Sens. Actuators B Chem. 2012, 173, 745–751. [Google Scholar] [CrossRef]
  35. Shah, A.; Nisar, A.; Khan, K.; Nisar, J.; Niaz, A.; Ashiq, M.N.; Akhter, M.S. Amino acid functionalized glassy carbon electrode for the simultaneous detection of thallium and mercuric ions. Electrochim. Acta 2019, 321, 134658. [Google Scholar] [CrossRef]
  36. Shah, A.; Sultan, S.; Zahid, A.; Aftab, S.; Nisar, J.; Nayab, S.; Qureshi, R.; Khan, G.S.; Hussain, H.; Ozkan, S.A. Highly sensitive and selective electrochemical sensor for the trace level detection of mercury and cadmium. Electrochim. Acta 2017, 258, 1397–1403. [Google Scholar] [CrossRef]
  37. Hassan, S.S.; Nafady, A.; Solangi, A.R.; Kalhoro, M.S.; Abro, M.I.; Sherazi, S.T.H. Ultra-trace level electrochemical sensor for methylene blue dye based on nafion stabilized ibuprofen derived gold nanoparticles. Sens. Actuators B Chem. 2015, 208, 320–326. [Google Scholar] [CrossRef]
  38. Ugo, P.; Cavalieri, F.; Rudello, D.; Moretto, L.M.; Argese, E. Nafion coated electrodes as voltammetric sensors for iron analysis in sediments and pore waters: An example from the lagoon of Venice. Sensors 2001, 1, 102–113. [Google Scholar] [CrossRef]
Figure 1. The scheme of construction of the sensor, regarding the stages of modification.
Catalysts 13 00208 g001
Figure 2. (A) UV–Vis spectra; and (B) Stability profile of XG-AgNPs.
Catalysts 13 00208 g002
Figure 3. (A) Effect of salt (AgNO3); (B) Effect of xanthan gum (XG); (C) Effect of power; and (D) Effect of irradiation duration on AgNPs.
Catalysts 13 00208 g003
Figure 4. FTIR spectra of (a) XG-AgNPs and (b) Xanthan gum.
Catalysts 13 00208 g004
Figure 5. (A) AFM image of XG-AgNPs under optimized condition; (B) Particle size distribution histogram.
Catalysts 13 00208 g005
Figure 6. The scheme of synthesis and dispersion of fresh-prepared AgNPs.
Catalysts 13 00208 g006
Figure 7. Cyclic voltammogram of modified xanthan gum nanoparticle electrode for Hg 2+ ions.
Catalysts 13 00208 g007
Figure 8. Differential pulse voltammogram of modified Xanthan gum nanoparticle electrode for Hg2+ ions.
Catalysts 13 00208 g008
Figure 9. (A) SWV of 0.02 µM Hg2+at XG-AgNPs/Nafion-modified GCE; (B) SW voltammograms for 0.02 µM Hg2+ at (a) bare GCE, (b) GCE/Nafion, (c) GCE/Xanthan gum, (d) GCE/XG-AgNPs, (e) GCE/XG-AgNPs/Nafion; (C) Effect of different supporting electrolytes each of pH 7 (a) 0.04 M BRB, (b) 0.1 M Tris buffer and (c) 0.1 M phosphate buffer in the presence of Hg+2; (D) Effect of pH on peak current and shift in peak potential.
Catalysts 13 00208 g009
Figure 10. SW Voltammograms for 0.02 µM Hg2+at (A) Volume of Nafion from 5µL to 25 µL; (B) Accumulation potential 0.1 V to 0.5 V at 5 s; (C) Accumulation potential 0.1 V to 0.5 V at 10 s; (D) Accumulation potential 0.1 V to 0.5 V at 15; (E) Six replicate runs obtained under optimized conditions.
Catalysts 13 00208 g010
Figure 11. (A) Calibration curve for different concentrations of Hg2+ at XG-AgNPs/Nafion-modified GCE (a) 0.00074 µM (b) 0.002 µM (c) 0.0022 µM (d) 0.003 µM (e) 0.0075 µM (f) 0.01 µM (g) (h) 0.015 µM (i) 0.02 µM (j) 0.022 µM; plot; (B) Corresponding linear plot in the range of 0.2–6 ppb Hg2+.
Catalysts 13 00208 g011
Table 1. Comparison of the analytical performance obtained at XG-AgNPs/GCE with different electrodes reported in the literature for the electrochemical determination of Hg2+.
Electrode TypeTechniquesLinear RangeLODSamples AnalyzedRef.
a CMC@AgNPs/GCEDPASV5 and 75 μM0.19 nMVarious water samples[13]
b Av-HA modified GCESWV2.0 × 10−7 to 2.1 ×10⁻⁴ M141 nMDrinking water[23]
c NRGO/GCEDPASV1 nM to 800 nM0.58 nMWater samples[6]
d Ag@Hg nanoalloyUV3 n mol L−1 to 13 m mol L−1 2.1 n mol L−1 Aqueous samples[22]
e EDTA-CPESWV5 to 35 × 10−4 mol/L 16, 6 × 10⁻⁹ mol L−1River water samples[8]
f GK–AgNPsUV0–500 nM50 nM (LOQ) Water samples[4]
g CPHA-CPESWASV1–25 μM12.9 NmVarious water samples[5]
h AgNPs & FA-PGECV25 µM8.43 µMTap water[12]
XG-AgNPs/GCESWV0.2 ppb—6 ppb.0.18 ppbDifferent water samplesPresent work
a Carboxymethylcellulose; b Aloe vera—hydroxyapatite; c Nitrogen-doped reduced graphene; d Silver and mercury nanoalloy; e Ethylene diamine tetraacetic acid; f Gumkondagogu; g N-p chlorophenylcinnamohydroxamic acid; h pencil graphite electrode (PGE) modified with AgNPs and folic acid (FA).
Table 2. Maximum tolerable limits of interfering species for Hg2+.
Interfering SpeciesTolerance LimitInterference (%)
(µgmL−1)
Cd(II)97.50%+2.5
Pb+2103.60%−3.6
Cr2O496.30%+3.7
Co(II)97.60%+2.5
Cu(II)96.30%+3.7
CuSO498.70%+1.3
Table 3. Determination of Hg2+ ions in real water samples (replications = 3) by calibration plot method.
Water SamplesAddedFound
(µgmL−1)
Recovery (%)RSD (%)
(µgmL−1)
River water (Jamshoro)00.9 ± 0.03-------------3.33
22.87 ± 0.1598.975.23
44.86 ± 0.2199.184.32
66.88 ± 0.2899.714.07
Municipal treated water (Latifabad, Hyderabad)00.58 ± 0.02_______
22.52 ± 0.1397.675.16
44.54 ± 0.2499.135.29
66.55 ± 0.3199.544.73
Municipal treated water (Suhrab Goth, Karachi)00.62 ± 0.02-------------
22.59 ± 0.1698.856.18
44.6 ± 0.2299.574.78
66.61 ± 0.3499.854.84
Disclaimer/Publisher’s Note: The statements, opinions and data contained in all publications are solely those of the individual author(s) and contributor(s) and not of MDPI and/or the editor(s). MDPI and/or the editor(s) disclaim responsibility for any injury to people or property resulting from any ideas, methods, instructions or products referred to in the content.

