
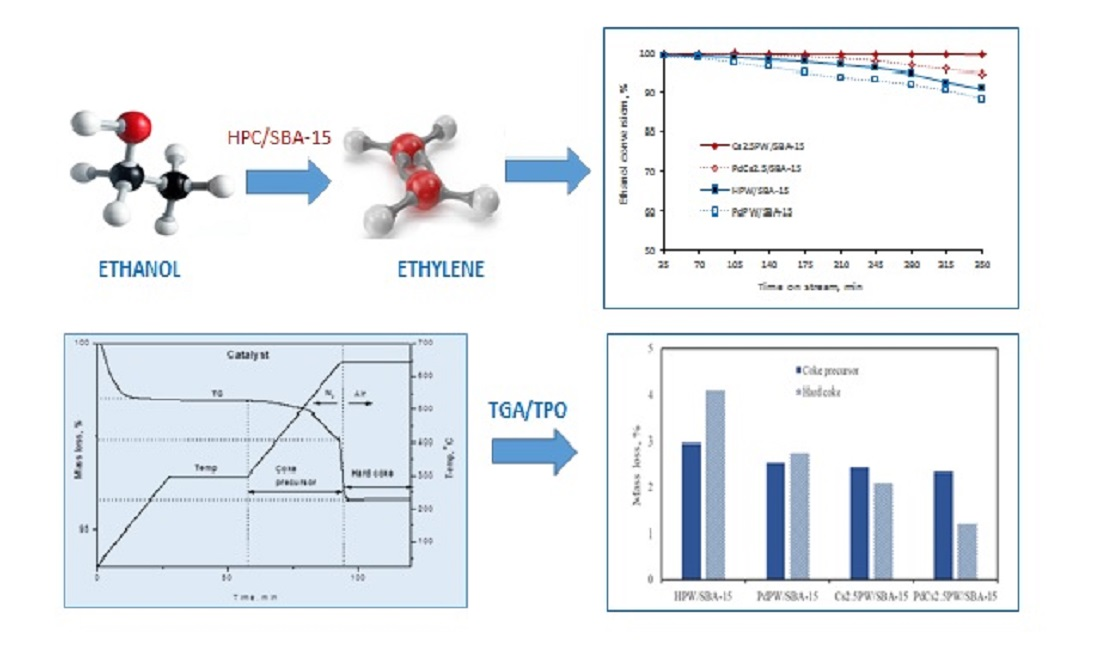
Thermogravimetry Applied for Investigation of Coke Formation in Ethanol Conversion over Heteropoly Tungstate Catalysts

Abstract
:
1. Introduction
2. Results and Discussion
2.1. Characterization of the Catalyst
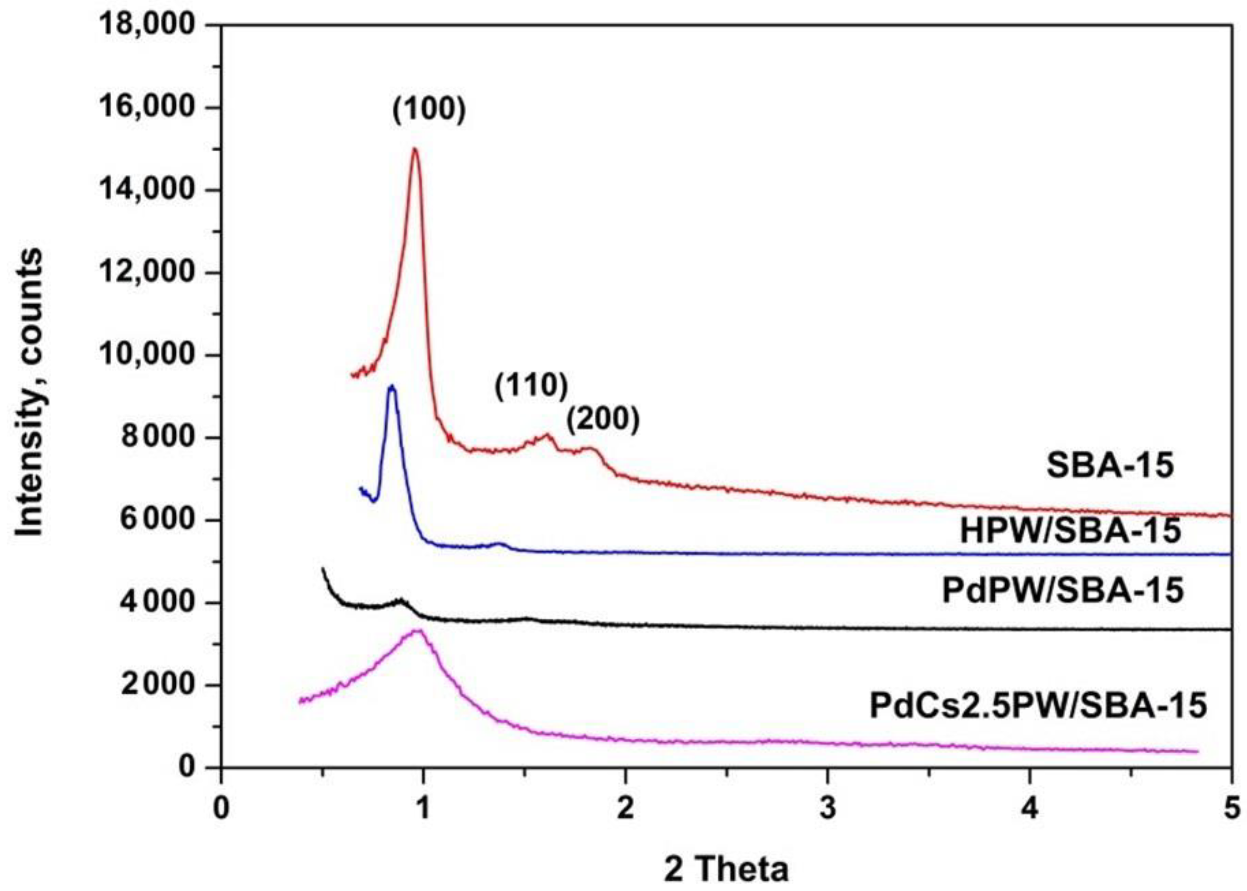
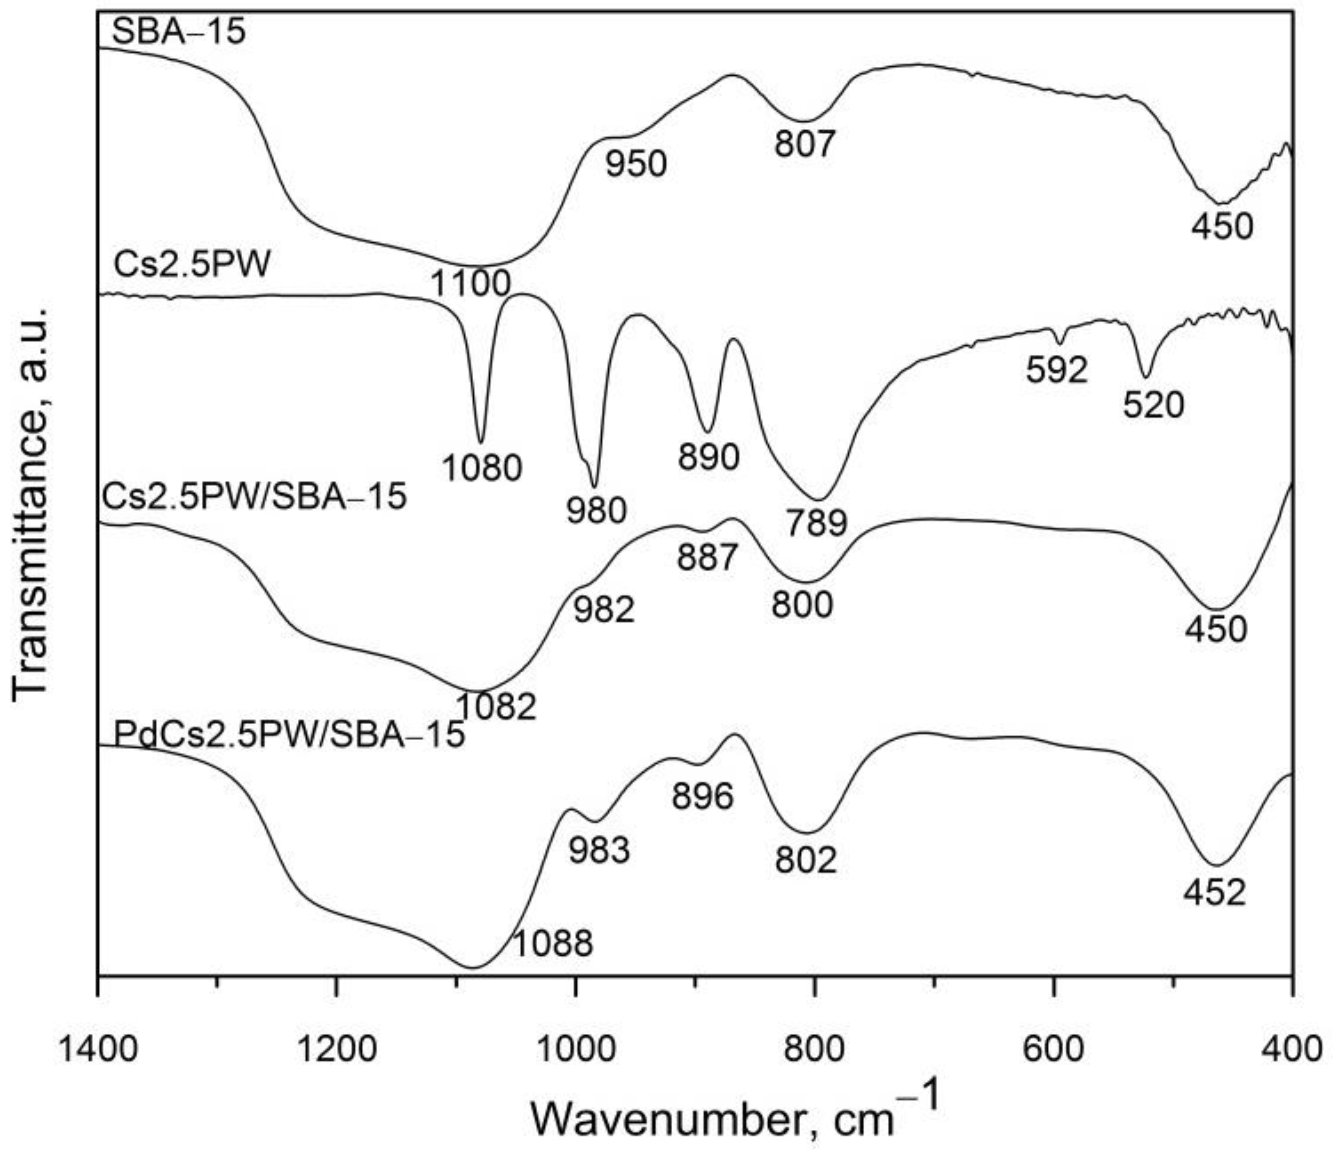
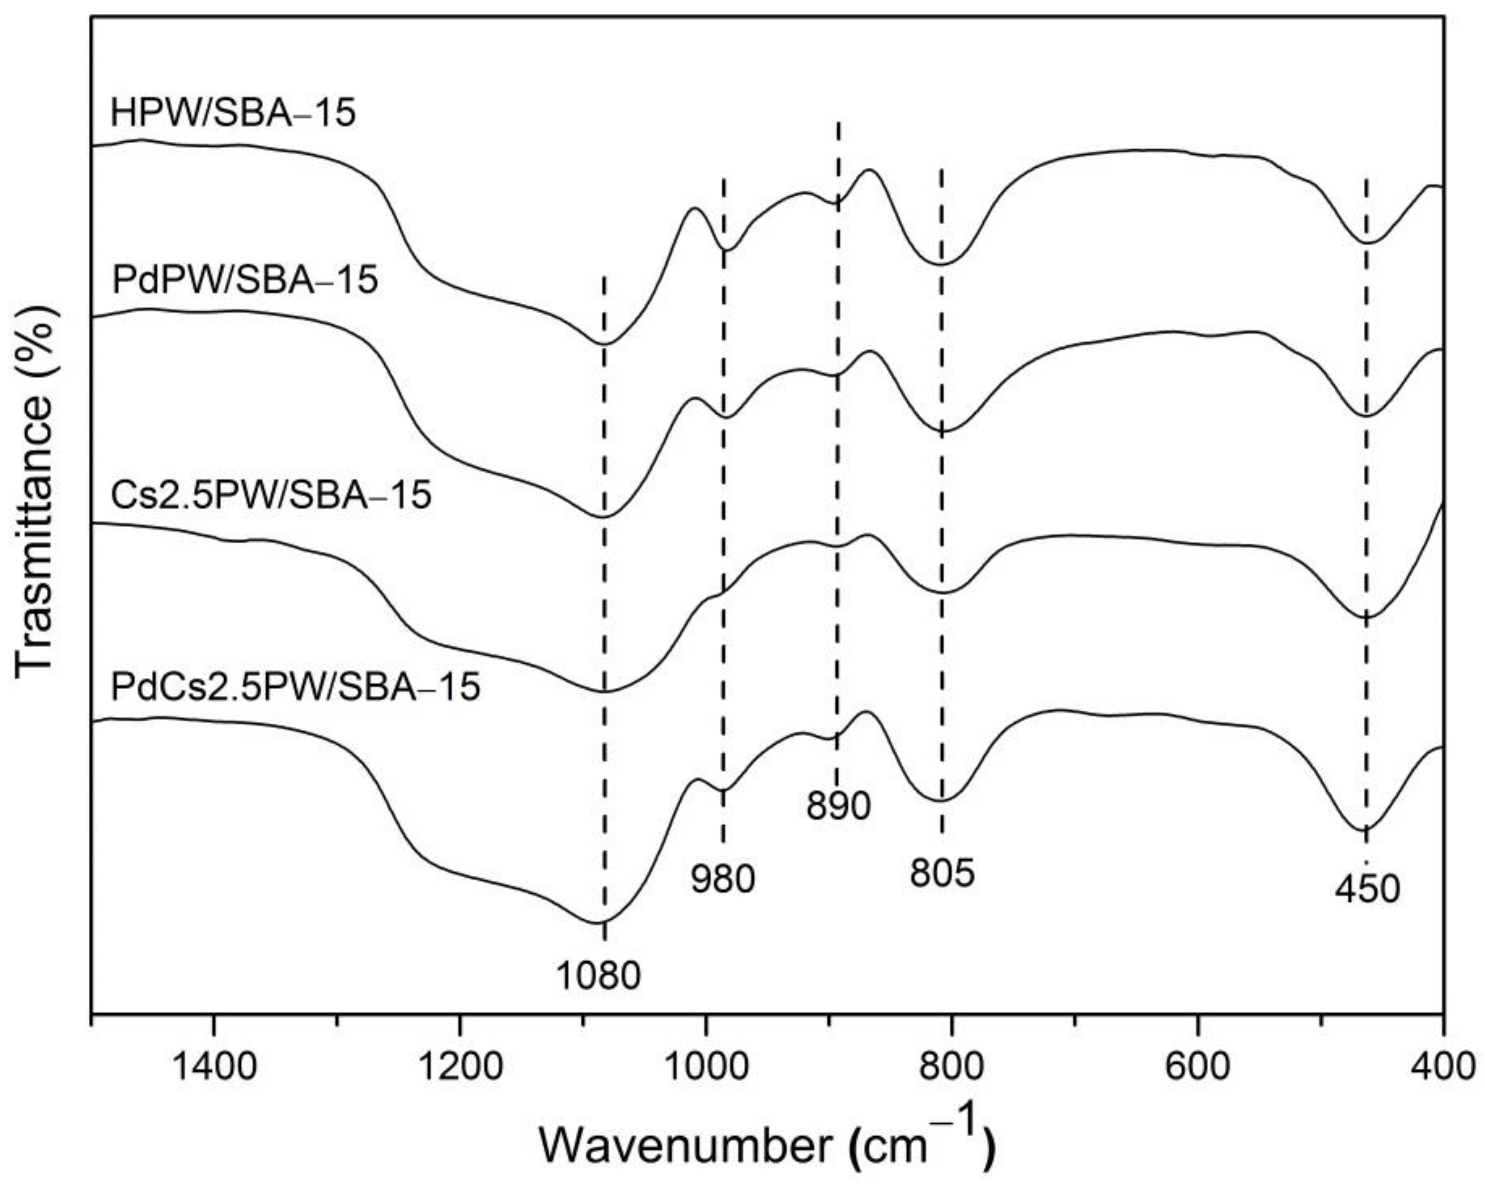
2.1.1. Structure and Thermal Stability of Heteropoly Compounds
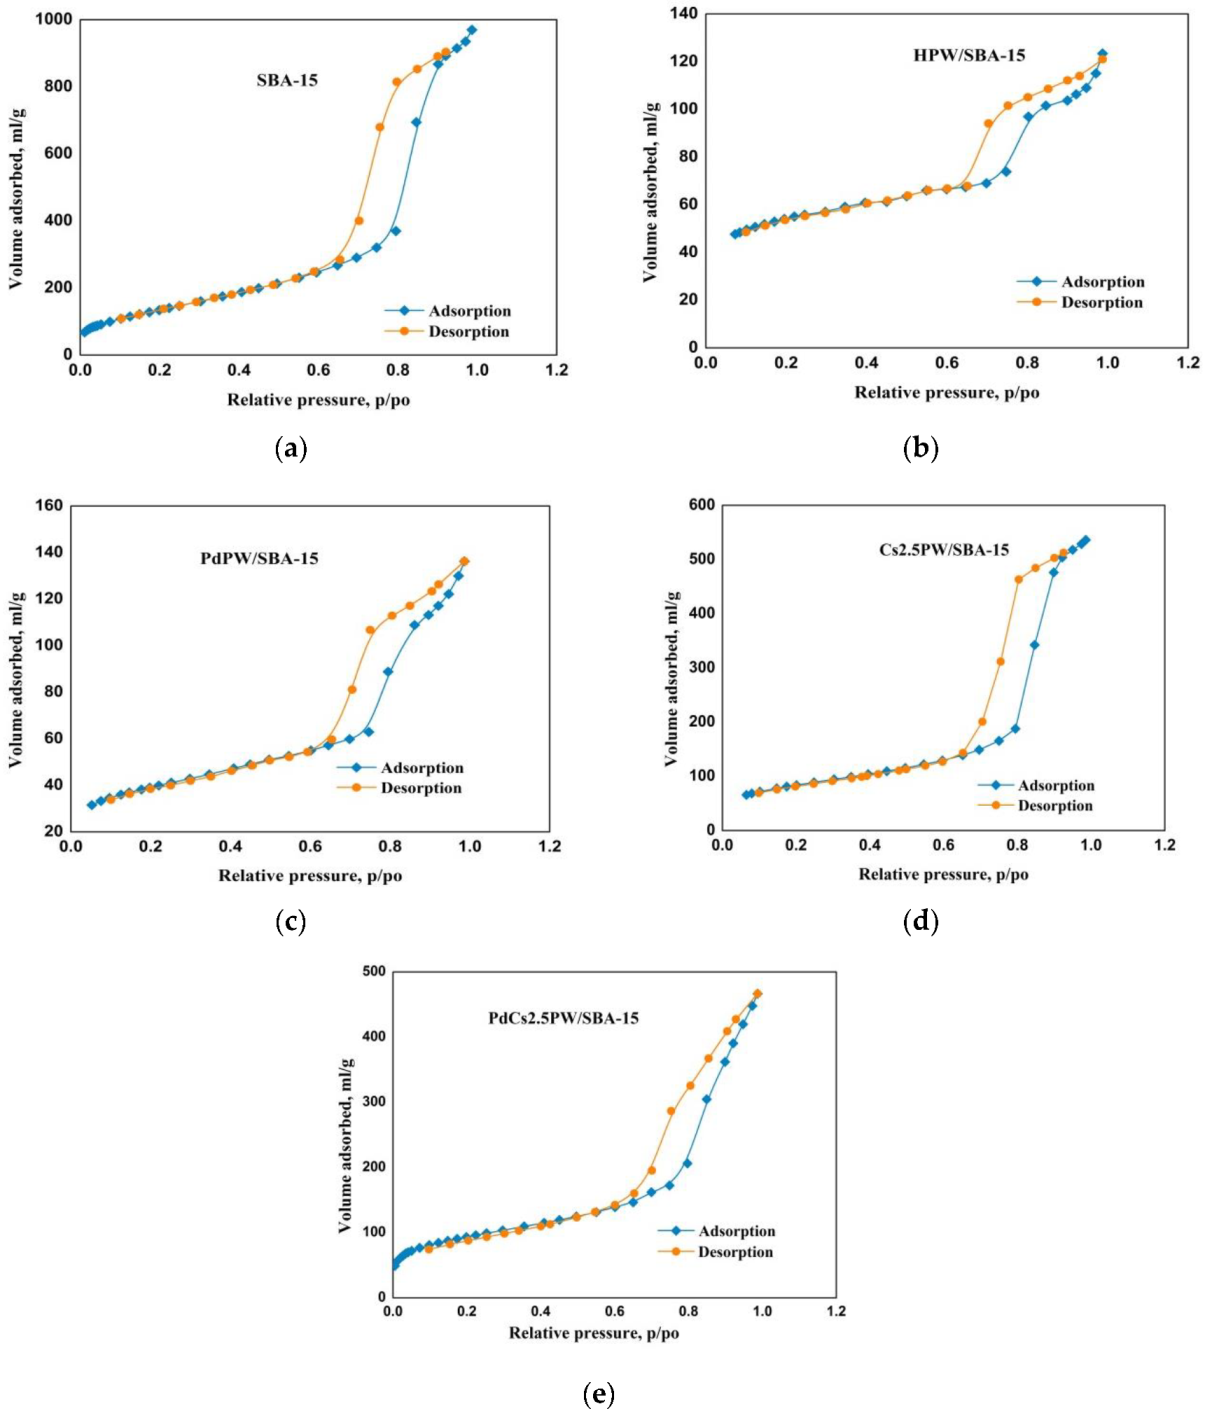
2.1.2. Textural Properties of Heteropoly Compounds
2.2. Catalytic Ethanol Transformation
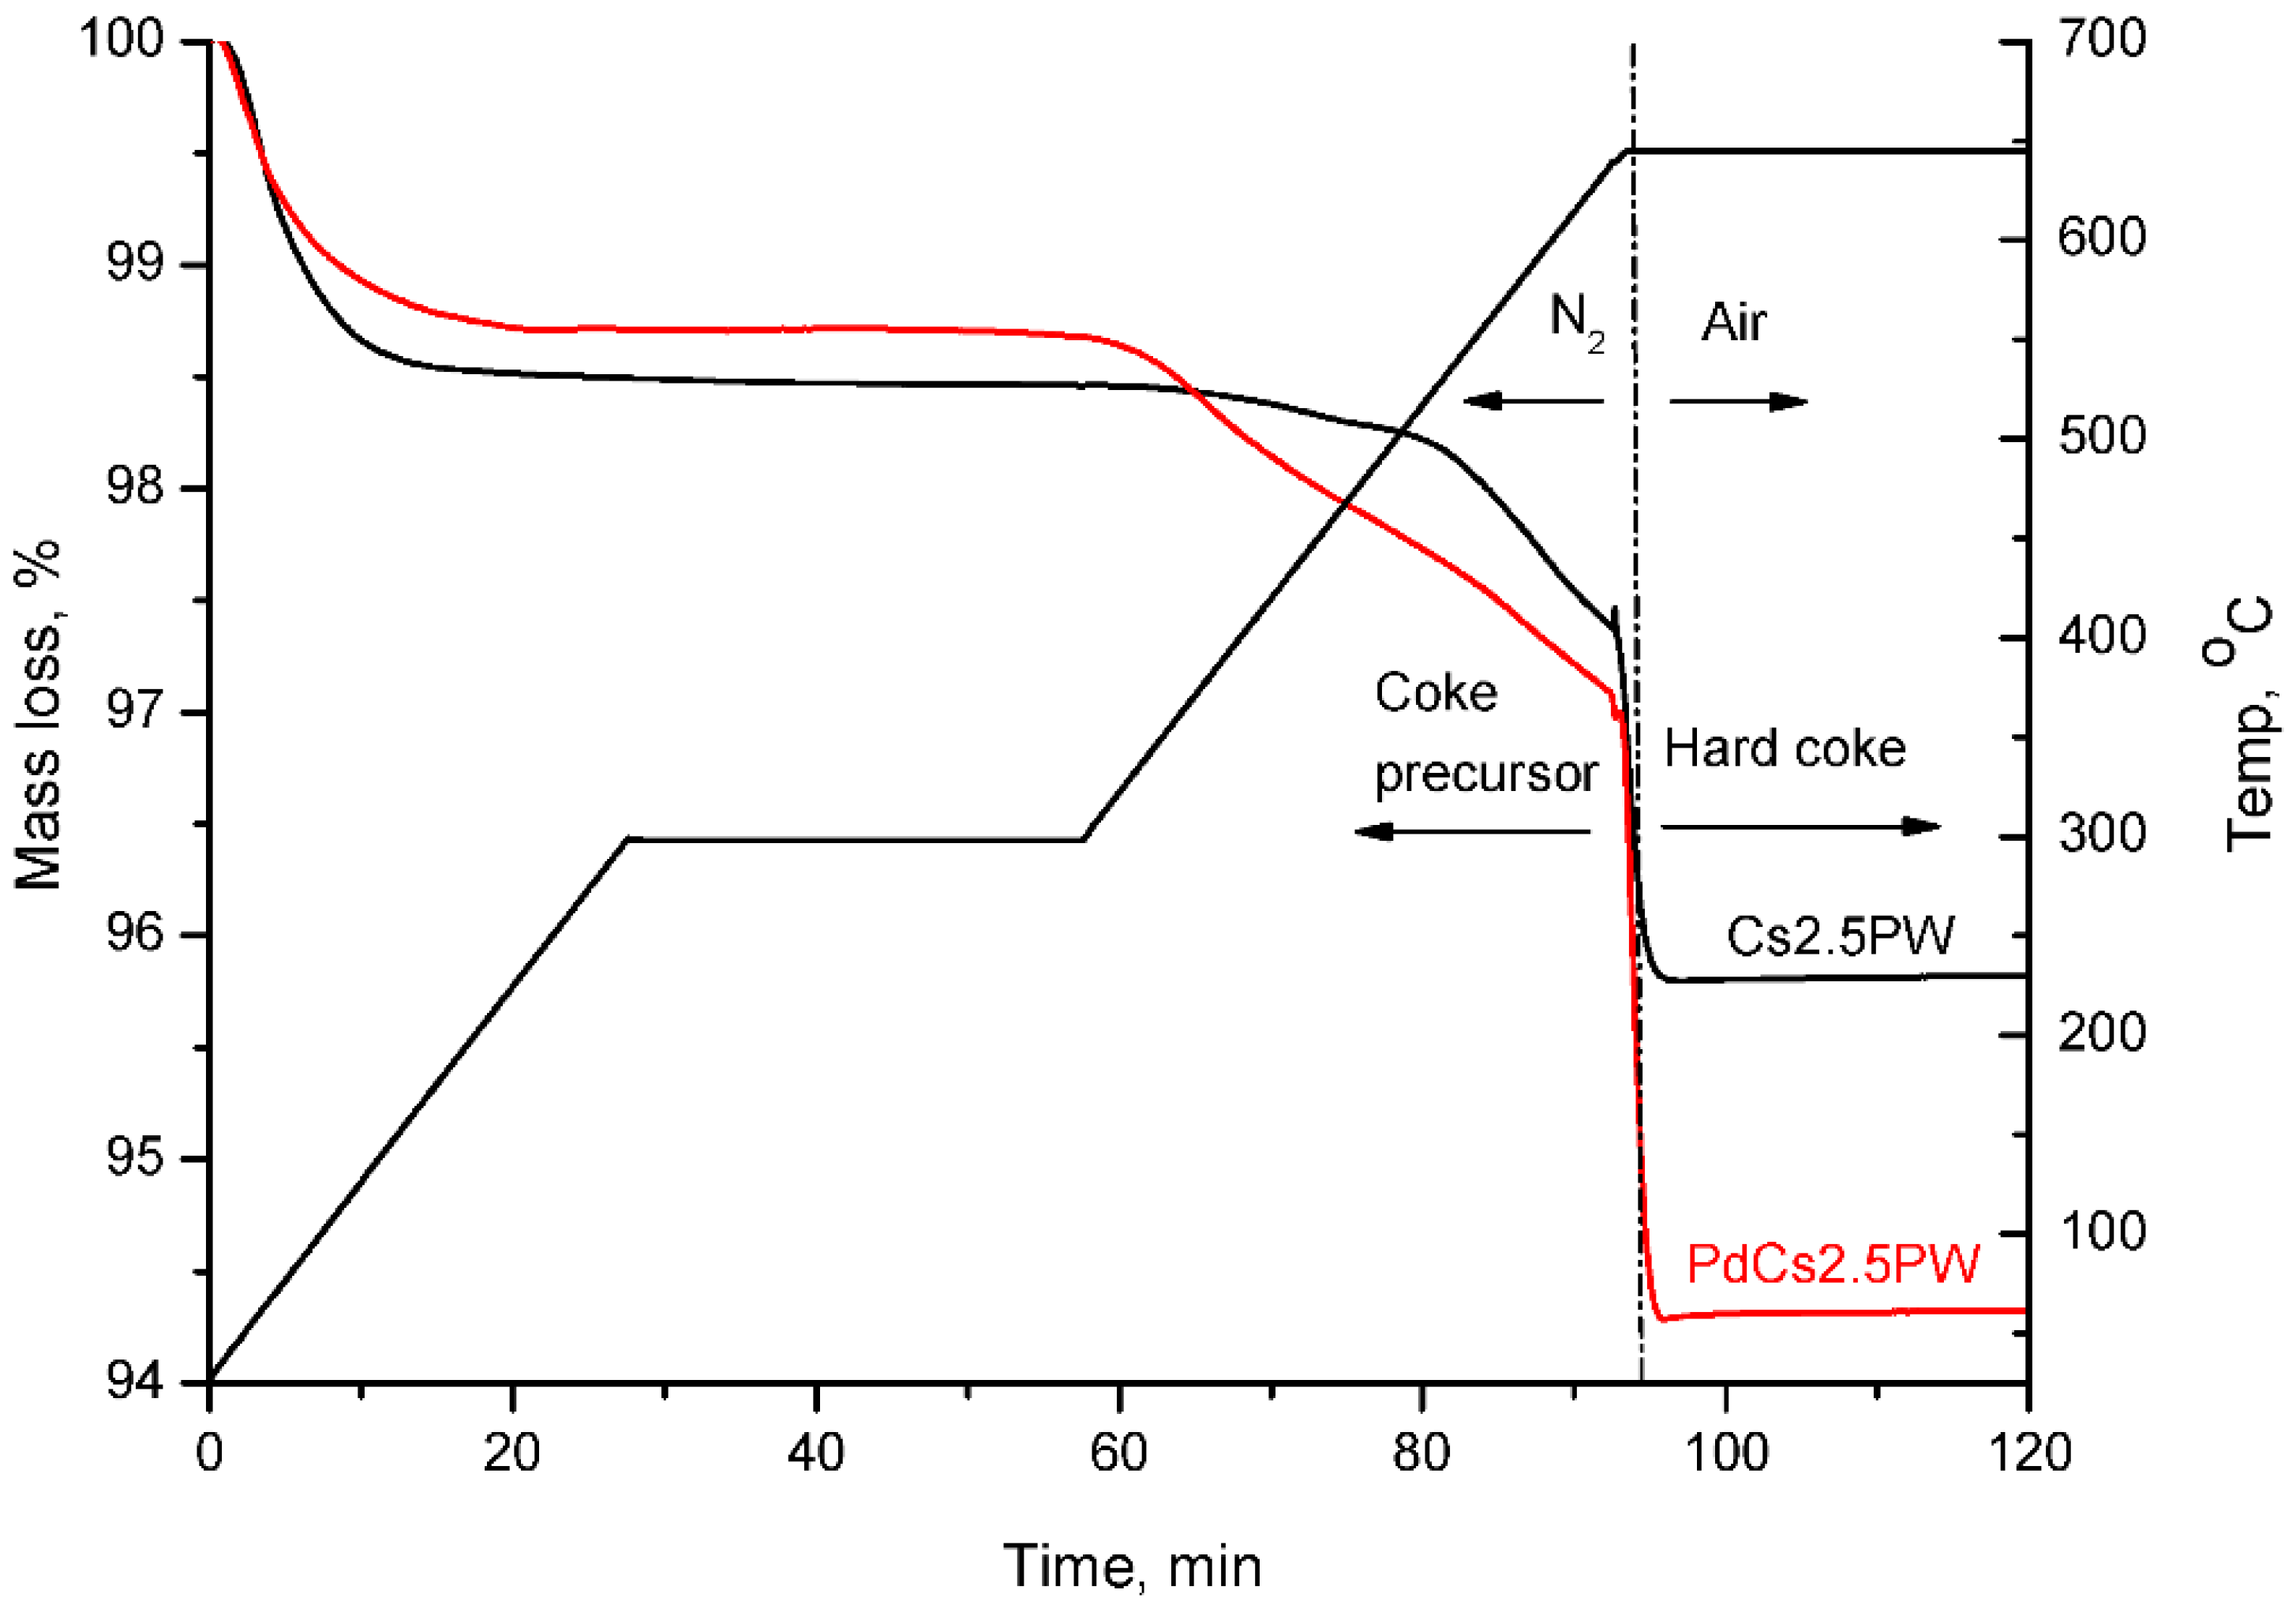
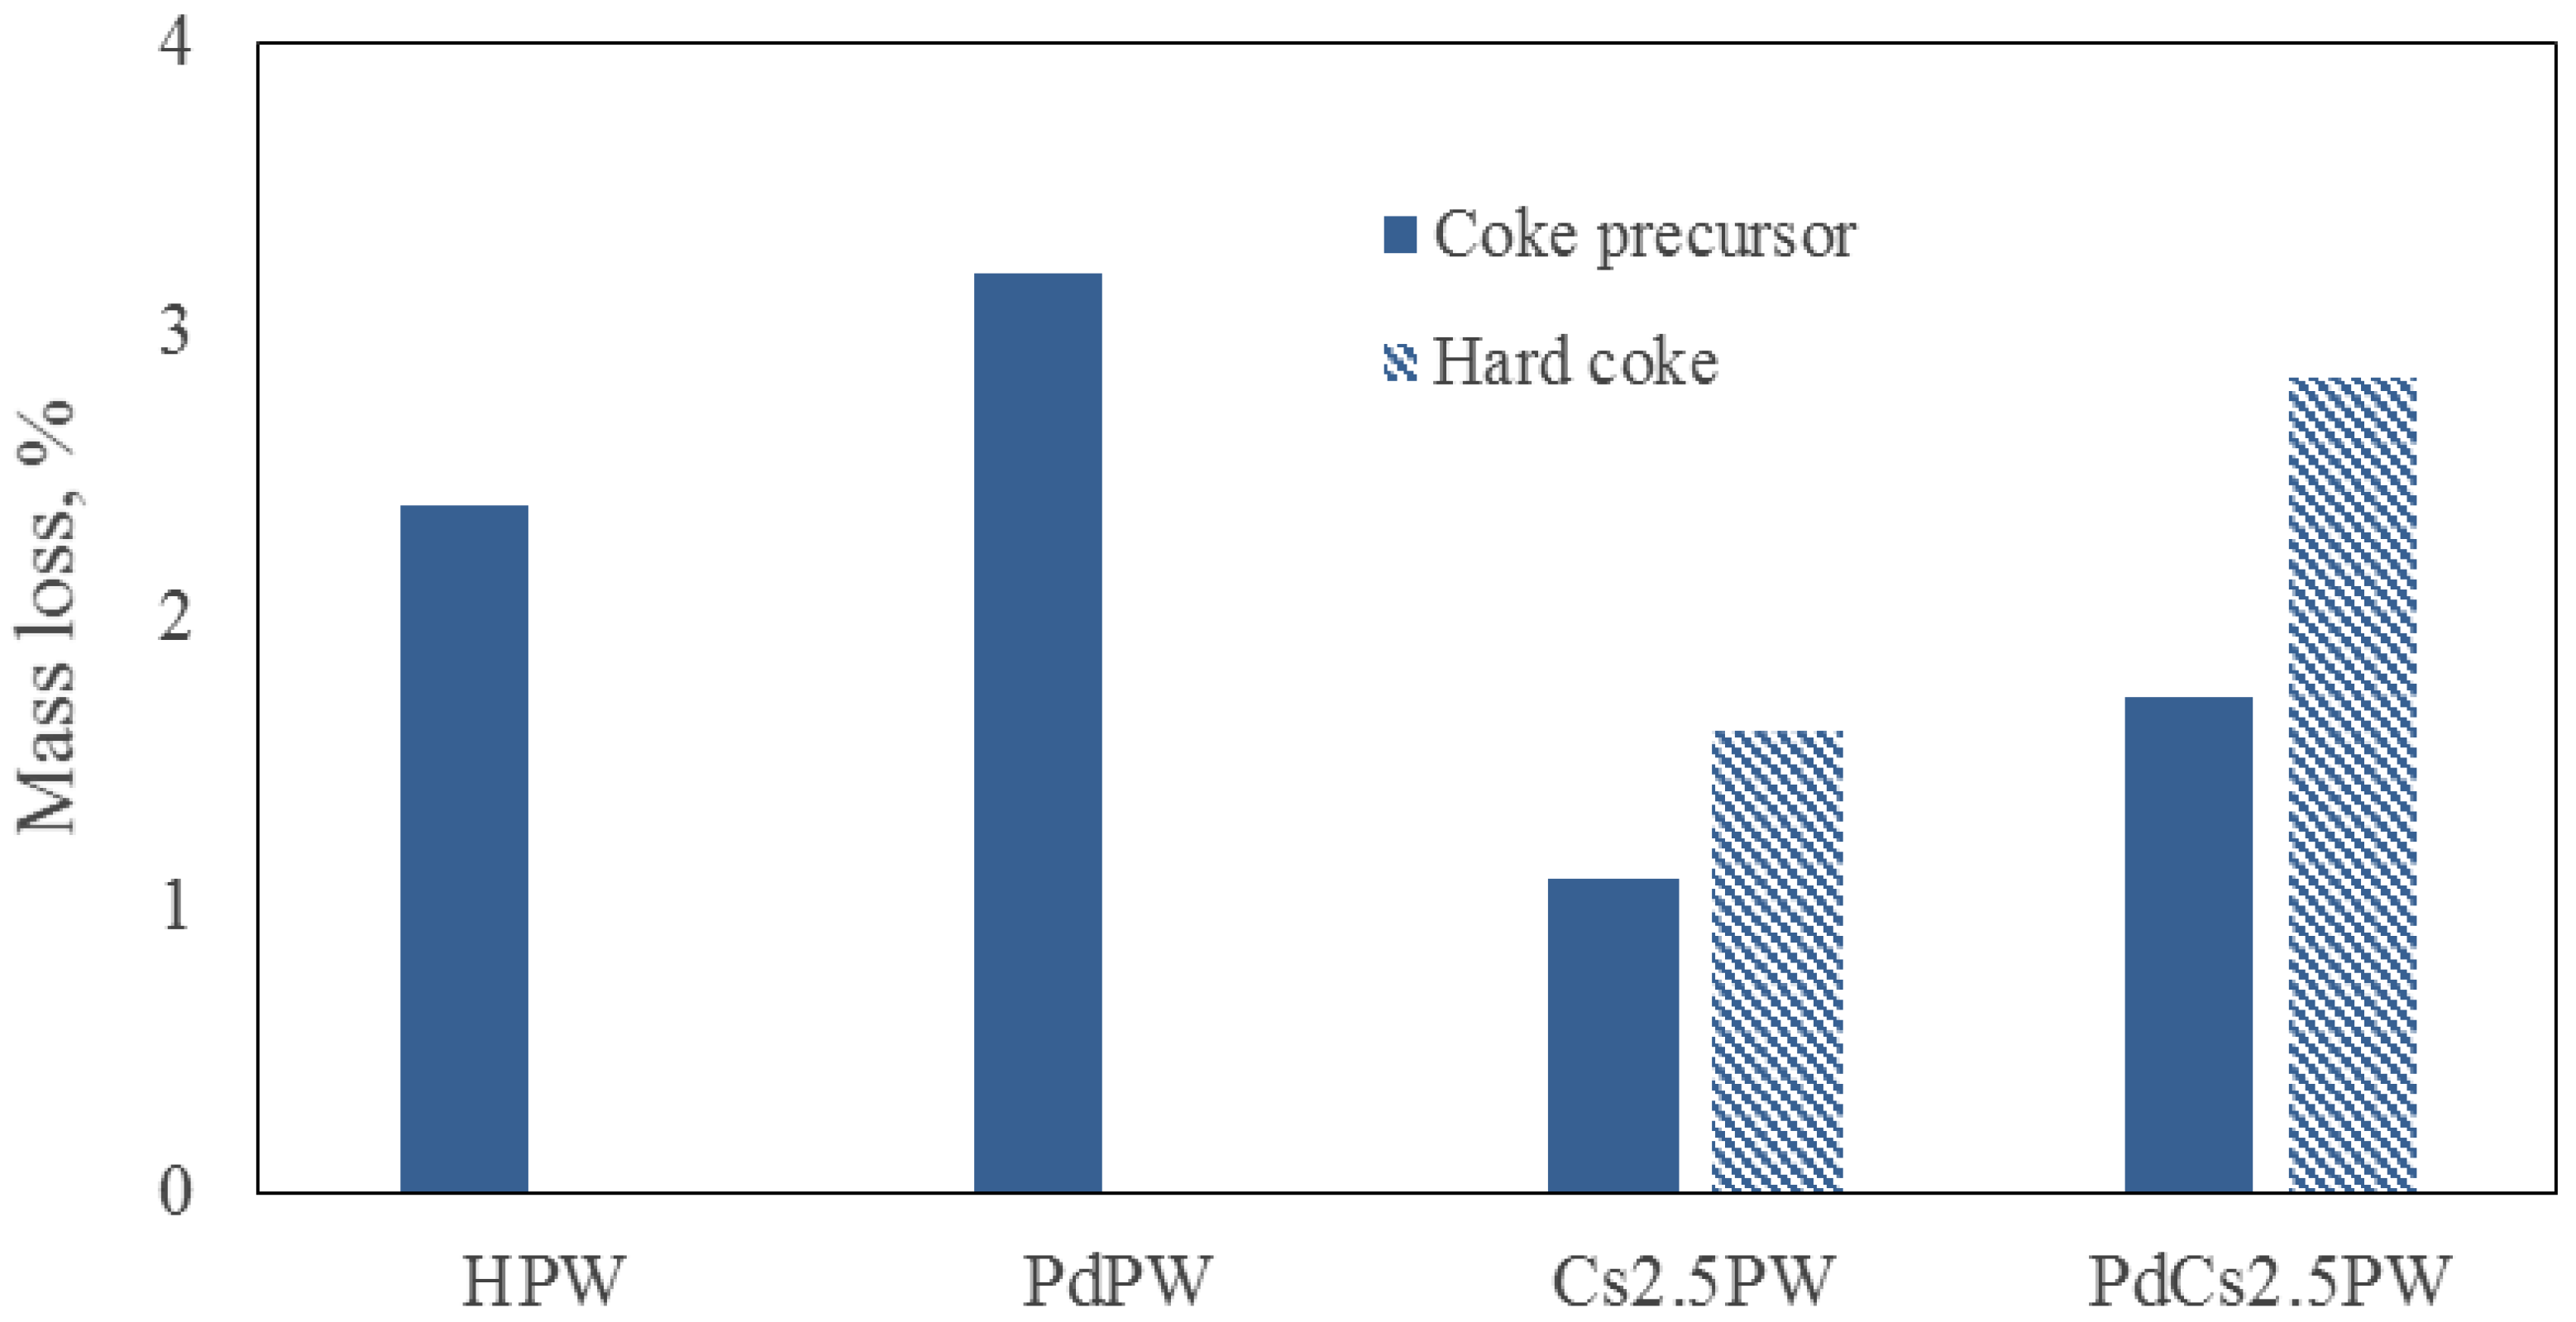
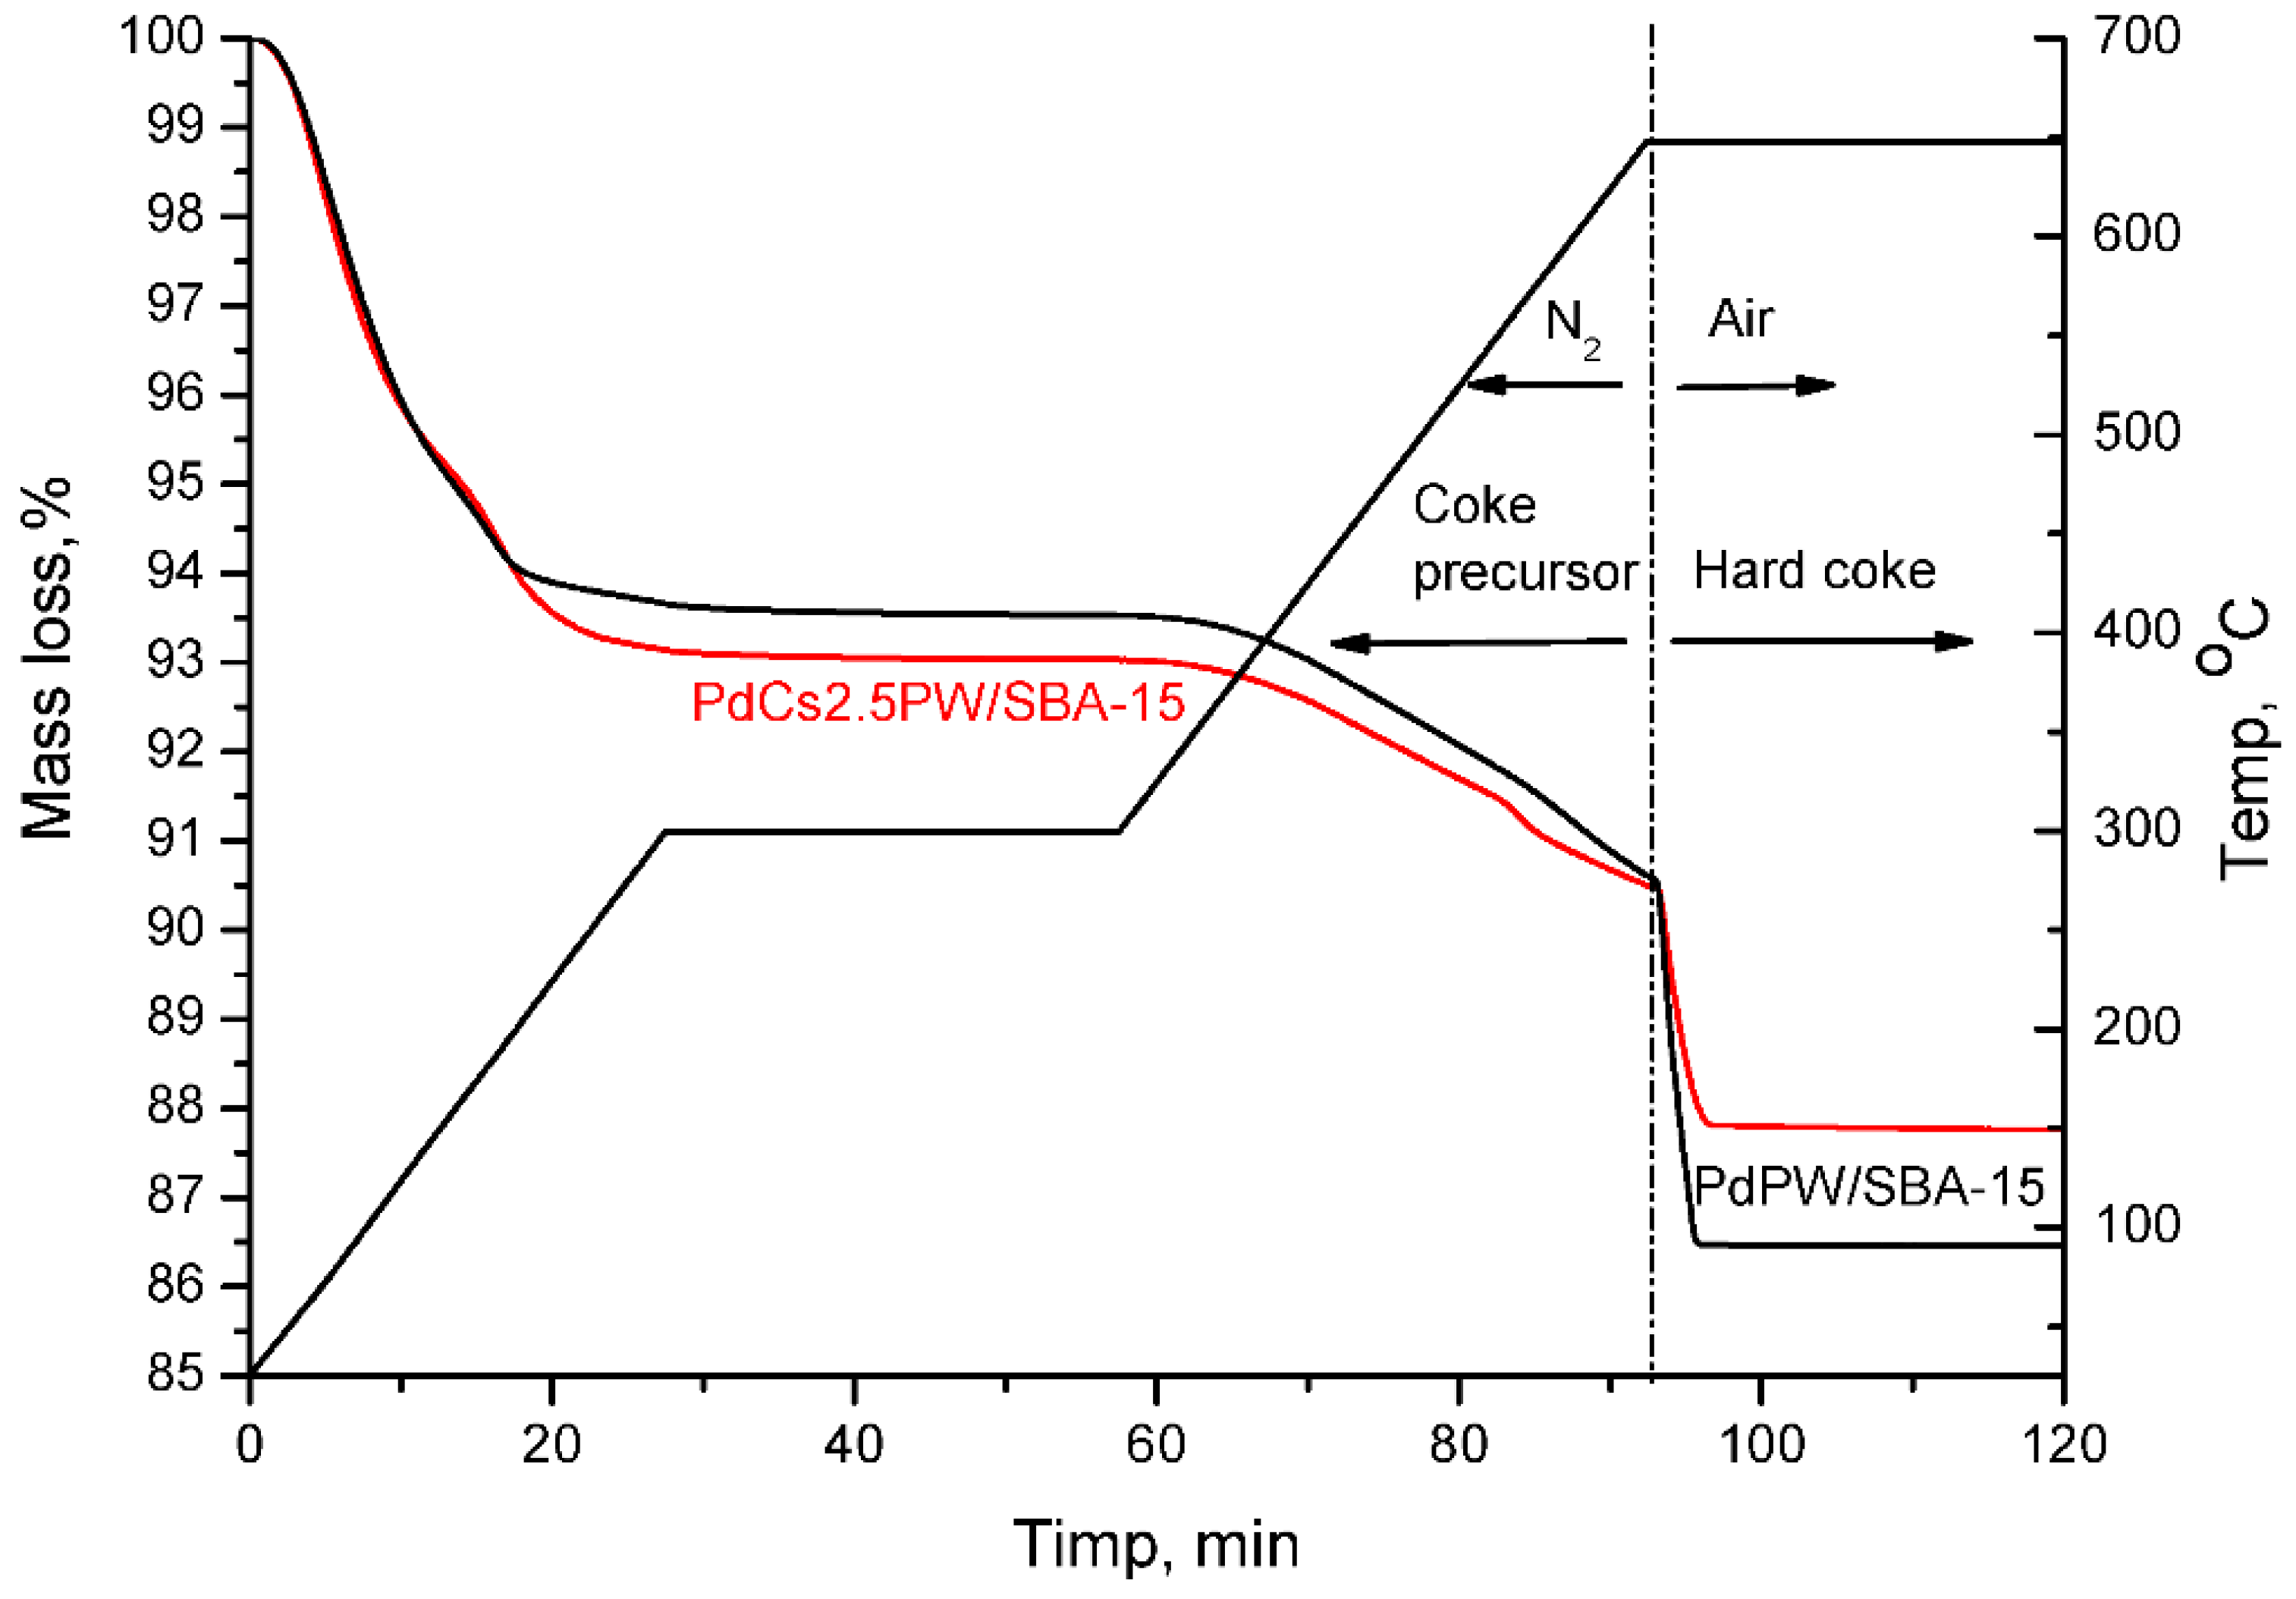
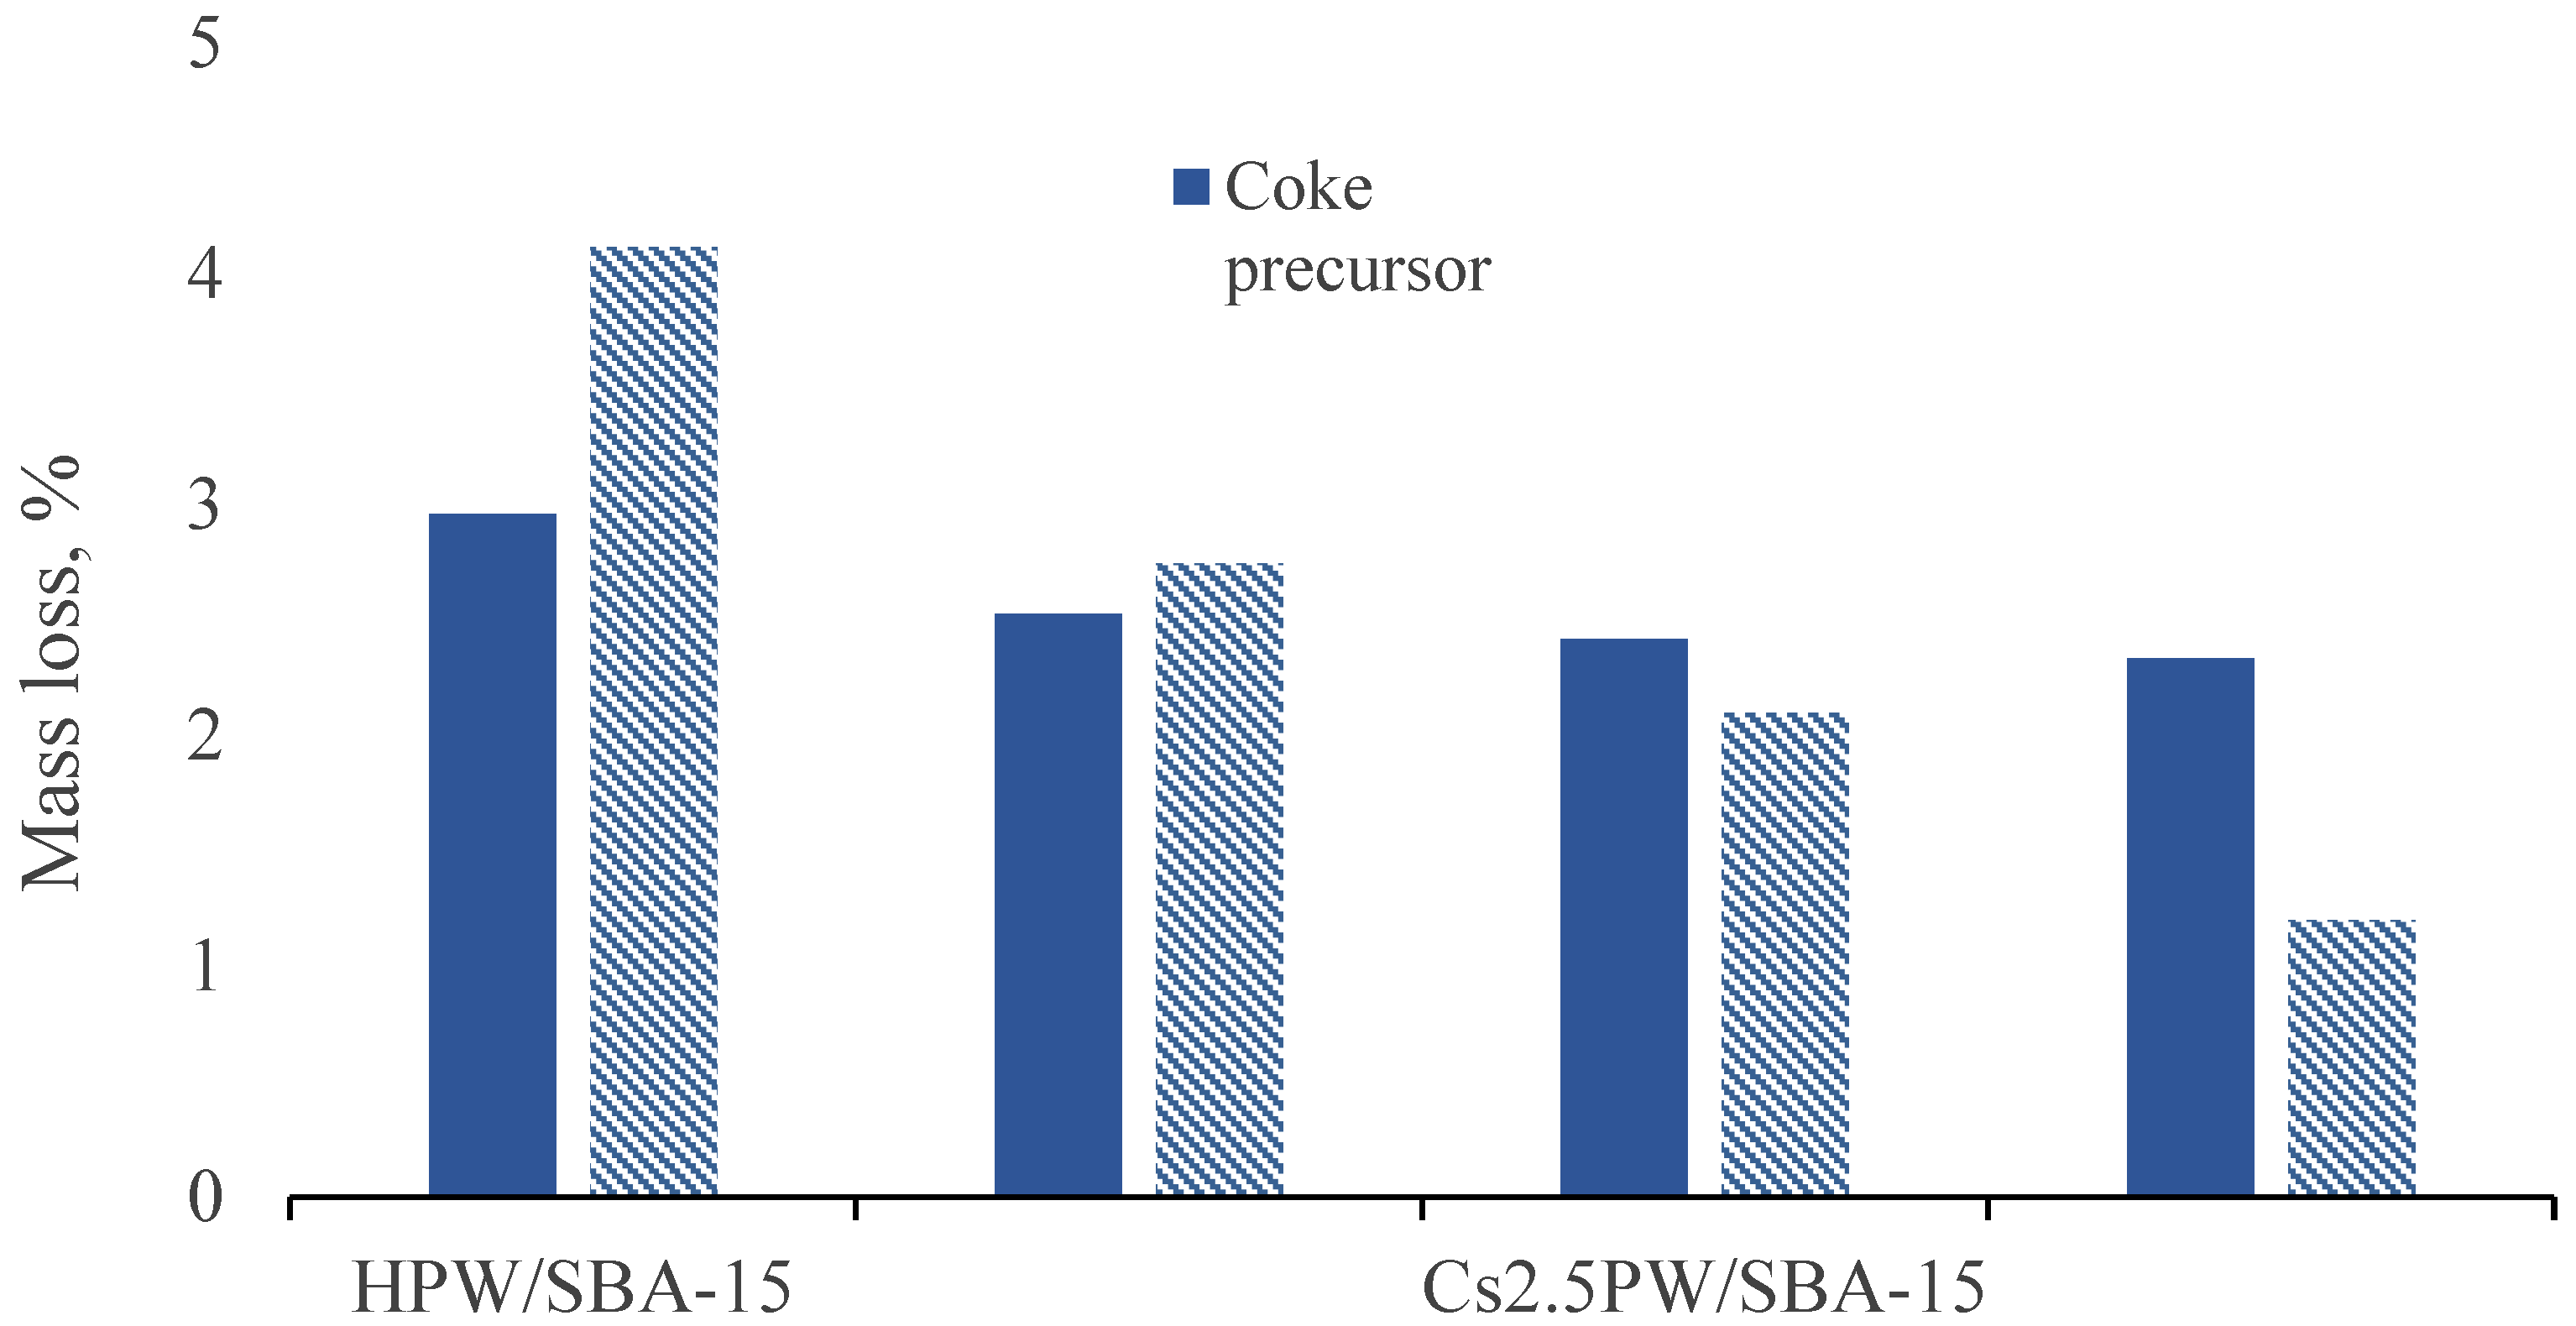
2.3. Temperature Programmed Oxidation (TPO) of Spent Catalysts
3. Experimental
3.1. Chemicals and Materials
3.2. Measurement
3.3. Catalyst Preparation
3.4. Catalytic Activity Measurement
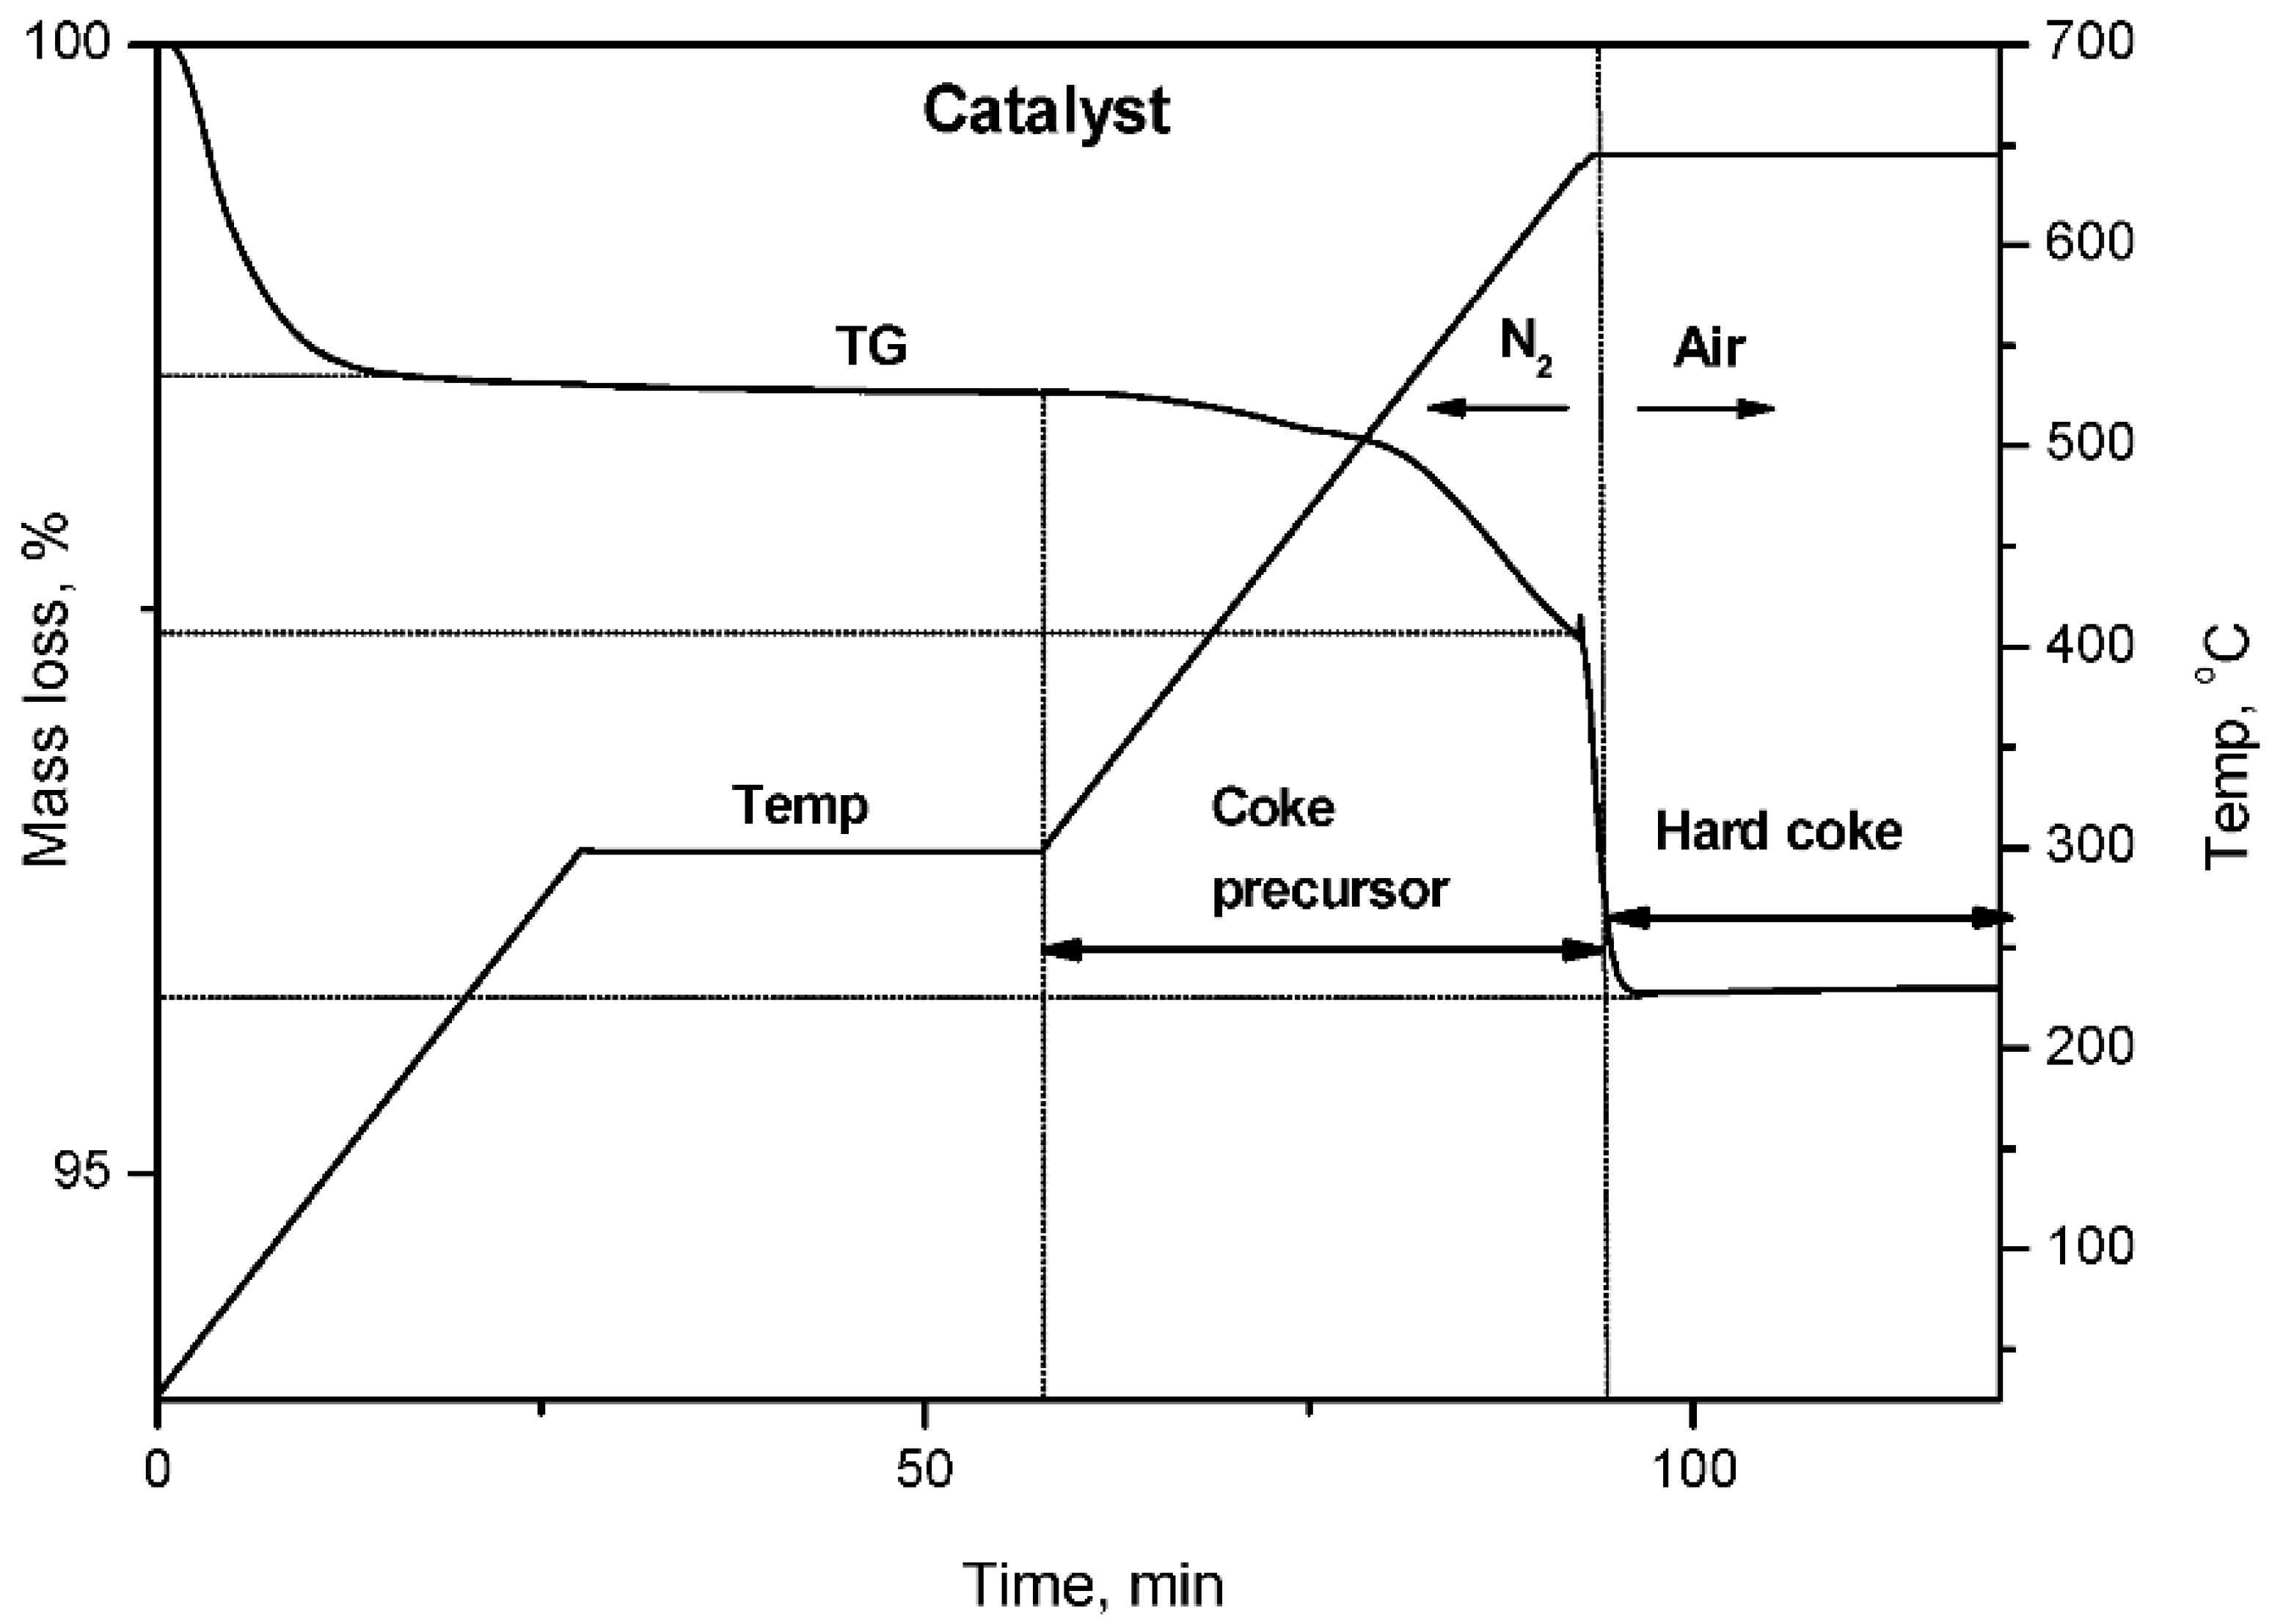
3.5. Thermal Analysis of Coke
4. Conclusions
Author Contributions
Funding
Conflicts of Interest
References
- Mohsenzadeh, A.; Zamani, A.; Taherzadeh, M.J. Bioethanol production from ethanol: A review and techno-economical evaluation. Chem. Bio. Eng. Rev. 2017, 4, 1–18. [Google Scholar]
- Verdeş, O.; Sasca, V.; Popa, A.; Suba, M.; Borcanescu, S. Catalytic activity of heteropoly tungstate catalysts for ethanol dehydration reaction: Deactivation and regeneration. Catal. Today 2021, 366, 123–132. [Google Scholar] [CrossRef]
- Zhang, M.; Yu, Y. Dehydration of Ethanol to Ethylene. Ind. Eng. Chem. Res. 2013, 52, 9505–9514. [Google Scholar] [CrossRef]
- Varisli, D.; Dogu, T.; Dogu, G. Ethylene and diethyl-ether production by dehydration reaction of ethanol over different heteropolyacid catalysts. Chem. Eng. Sci. 2007, 62, 5349–5352. [Google Scholar] [CrossRef]
- Rawan, A.; Kozhevnikova, E.F.; Kozhevnikov, I.V. Diethyl Ether Conversion to Ethene and Ethanol Catalyzed by Heteropoly Acids. ACS Omega 2021, 6, 9310–9318. [Google Scholar]
- Esmi, F.; Masoumi, S.; Dalai, A.K. Comparative Catalytic Performance Study of 12-Tungstophosphoric Heteropoly Acid Supported on Mesoporous Support for Biodiesel Production from Unrefined Green Canola Oil. Catalysts 2022, 12, 658. [Google Scholar] [CrossRef]
- Heravi, M.M.; Fard, M.V.; Faghihi, Z. Heteropoly acids-catalyzed organic reactions in water: Doubly green reactions. Green Chem. Lett. Rev. 2013, 6, 282–300. [Google Scholar] [CrossRef]
- Diamantopoulos, N.; Panagiotaras, D.; Nikolopoulos, D. Comprehensive Review on the Biodiesel Production using Solid Acid Heterogeneous Catalysts. J. Thermodyn. Catal. 2015, 6, 1–8. [Google Scholar] [CrossRef]
- Misono, M. Unique acid catalysis of heteropoly compounds (heteropolyoxometalates) in the solid state. Chem. Commun. 2001, 1141–1152. [Google Scholar] [CrossRef]
- Okuhara, T.; Watanabe, H.; Nishimura, T.; Inumaru, K.; Misono, M. Microstructure of Cesium Hydrogen Salts of 12-Tungstophosphoric Acid Relevant to Novel Acid. Chem. Mater. 2000, 12, 2230–2238. [Google Scholar] [CrossRef]
- Kokunesoskia, M.; Gulicovskia, J.; Matovica, B.; Logarb, M.; Milonjica, S.K.; Babic, B. Synthesis and surface characterization of ordered mesoporous silica SBA-15 Mater. Chem. Phys. 2010, 124, 1248–1252. [Google Scholar]
- Brahmkhatri, V.; Patel, A. 12-Tungstophosphoric acid anchored to SBA-15: An efficient, environmentally benign reusable catalysts for biodiesel production by esterification of free fatty acids. Appl. Catal. A. 2011, 403, 161–172. [Google Scholar] [CrossRef]
- Popa, A.; Sasca, V.; Verdes, O.; Barvinschi, P.; Holclajtner-Antunovica, I. Acidic and neutral caesium salts of 12-molybdophosphoric acid supported on SBA-15 mesoporous silica. The influence of Cs concentration and surface coverage on textural and structural properties. Mater. Res. Bull. 2014, 50, 312–322. [Google Scholar] [CrossRef]
- Wang, B.; Manos, G. A novel thermogravimetric method for coke precursor characterisation. J. Catal. 2007, 250, 121–127. [Google Scholar] [CrossRef]
- Zhou, J.; Zhao, J.; Zhang, J.; Zhang, T.; Ye, M.; Liu, Z. Regeneration of catalysts deactivated by coke deposition: A Review Chinese. J. Catal. 2020, 41, 1048–1406. [Google Scholar] [CrossRef]
- Siddiqui, M.R.H.; Holmes, S.; Smith, W.; He, H.; Coker, E.N.; Atkins, M.P.; Kozhevnikov, I.V. Coking and regeneration of palladium-doped H3PW12O40/SiO2 catalysts. Catal. Lett. 2000, 66, 53–57. [Google Scholar] [CrossRef]
- Kozhevnikov, I.V.; Holmes, S.; Siddiqui, M.R.H. Coking and regeneration of H3PW12O40/SiO2 catalysts. Appl. Catal. A Gen. 2001, 214, 47–58. [Google Scholar] [CrossRef]
- Chen, S.; Manos, G. Study of coke and coke precursors during catalytic cracking of n-hexane and 1-hexene over ultrastable Y zeolite. Catal. Lett. 2004, 96, 195–200. [Google Scholar] [CrossRef]
- Chen, S.; Manos, G. In situ thermogravimetric study of coke formation during catalytic cracking of normal hexane and 1-hexene over ultrastable Y zeolite. J. Catal. 2004, 226, 343–350. [Google Scholar] [CrossRef]
- Jalil, P.A.; Faiz, M.; Tabet, N.; Hamdan, N.M.; Hussain, Z. A study of the stability of tungstophosphoric acid, H3PW12O40, using synchrotron XPS, XANES, hexane cracking, XRD, and IR spectroscopy. J. Catal. 2003, 217, 292–297. [Google Scholar] [CrossRef]
- Essayem, N.; Holmqvist, A.; Gayraud, P.Y.; Vedrine, J.C.; Taarit, Y.B. In Situ FTIR Studies of the Protonic Sites of H3PW12O40 and Its Acidic Cesium Salts MxH3xPW12O40. J. Catal. 2001, 197, 273–280. [Google Scholar] [CrossRef]
- Bielański, A.; Lubańska, A.J. FTIR investigation on Wells–Dawson and Keggin type heteropolyacids: Dehydration and ethanol sorption. Mol. Catal. A Chem. 2004, 224, 179–187. [Google Scholar] [CrossRef]
- Sasca, V.; Verdeş, O.; Avram, L.; Popa, A.; Erdöhelyi, A.; Oszko, A. The CsxH3−xPW12O40 catalysts microstructure model. Appl. Catal. A Gen. 2013, 451, 50–57. [Google Scholar] [CrossRef]
- Thommes, M.; Kaneko, K.; Neimark, A.V.; Olivier, J.P.; Rodriguez-Reinoso, F.; Rouquerol, J.; Sing, K.S.W. Physisorption of gases, with special reference to the evaluation of surface area and pore size distribution (IUPAC Technical Report). Pure Appl. Chem. 2015, 87, 1051–1069. [Google Scholar] [CrossRef]
- Bailar, J.C. Phosphotungstic acid. Inorg. Synth. 1939, 1, 132–133. [Google Scholar]
- Misono, M.; Mizuno, N.; Katamura, K.; Kasai, A.; Konishi, Y.; Sakata, K.; Okuhara, T.; Yoneda, Y. Catalysis by heteropoly compounds III. The structure and properties of 12-heteropolyacids of molybdenum and tungsten (H3PMo12−xWxO40) and their salts pertinent to heterogeneous catalysis. Bull. Chem. Soc. Jpn. 1982, 55, 400–406. [Google Scholar] [CrossRef]
- Zhao, D.; Feng, J.; Huo, Q.; Melosh, N.; Fredrickson, G.H.; Chmelka, B.F.; Stucky, G.D. Triblock Copolymer Syntheses of Mesoporous Silica with Periodic 50 to 300 Angstrom Pores. Science 1998, 279, 548–552. [Google Scholar] [CrossRef] [Green Version]


| Catalyst | Surface Area (m2/g) | Pore Volume BJHDes(cm3/g) | Average Pore Diameter BJHDes (nm) |
|---|---|---|---|
| SBA-15 | 725 | 1.100 | 6.2 |
| HPW/SBA-15 | 194 | 0.191 | 6.0 |
| PdPW/SBA-15 | 137 | 0.211 | 5.8 |
| Cs2.5PW/SBA-15 | 303 | 0.830 | 6.1 |
| PdCs2.5PW/SBA-15 | 298 | 0.790 | 5.9 |
| Sample | Ethanol Conversion (%) | Ethylene Selectivity (%) | Diethyl Ether Selectivity (%) | |||
|---|---|---|---|---|---|---|
| Time on Stream (TOS) | ||||||
| 35 min | 350 min | 35 min | 350 min | 35 min | 350 min | |
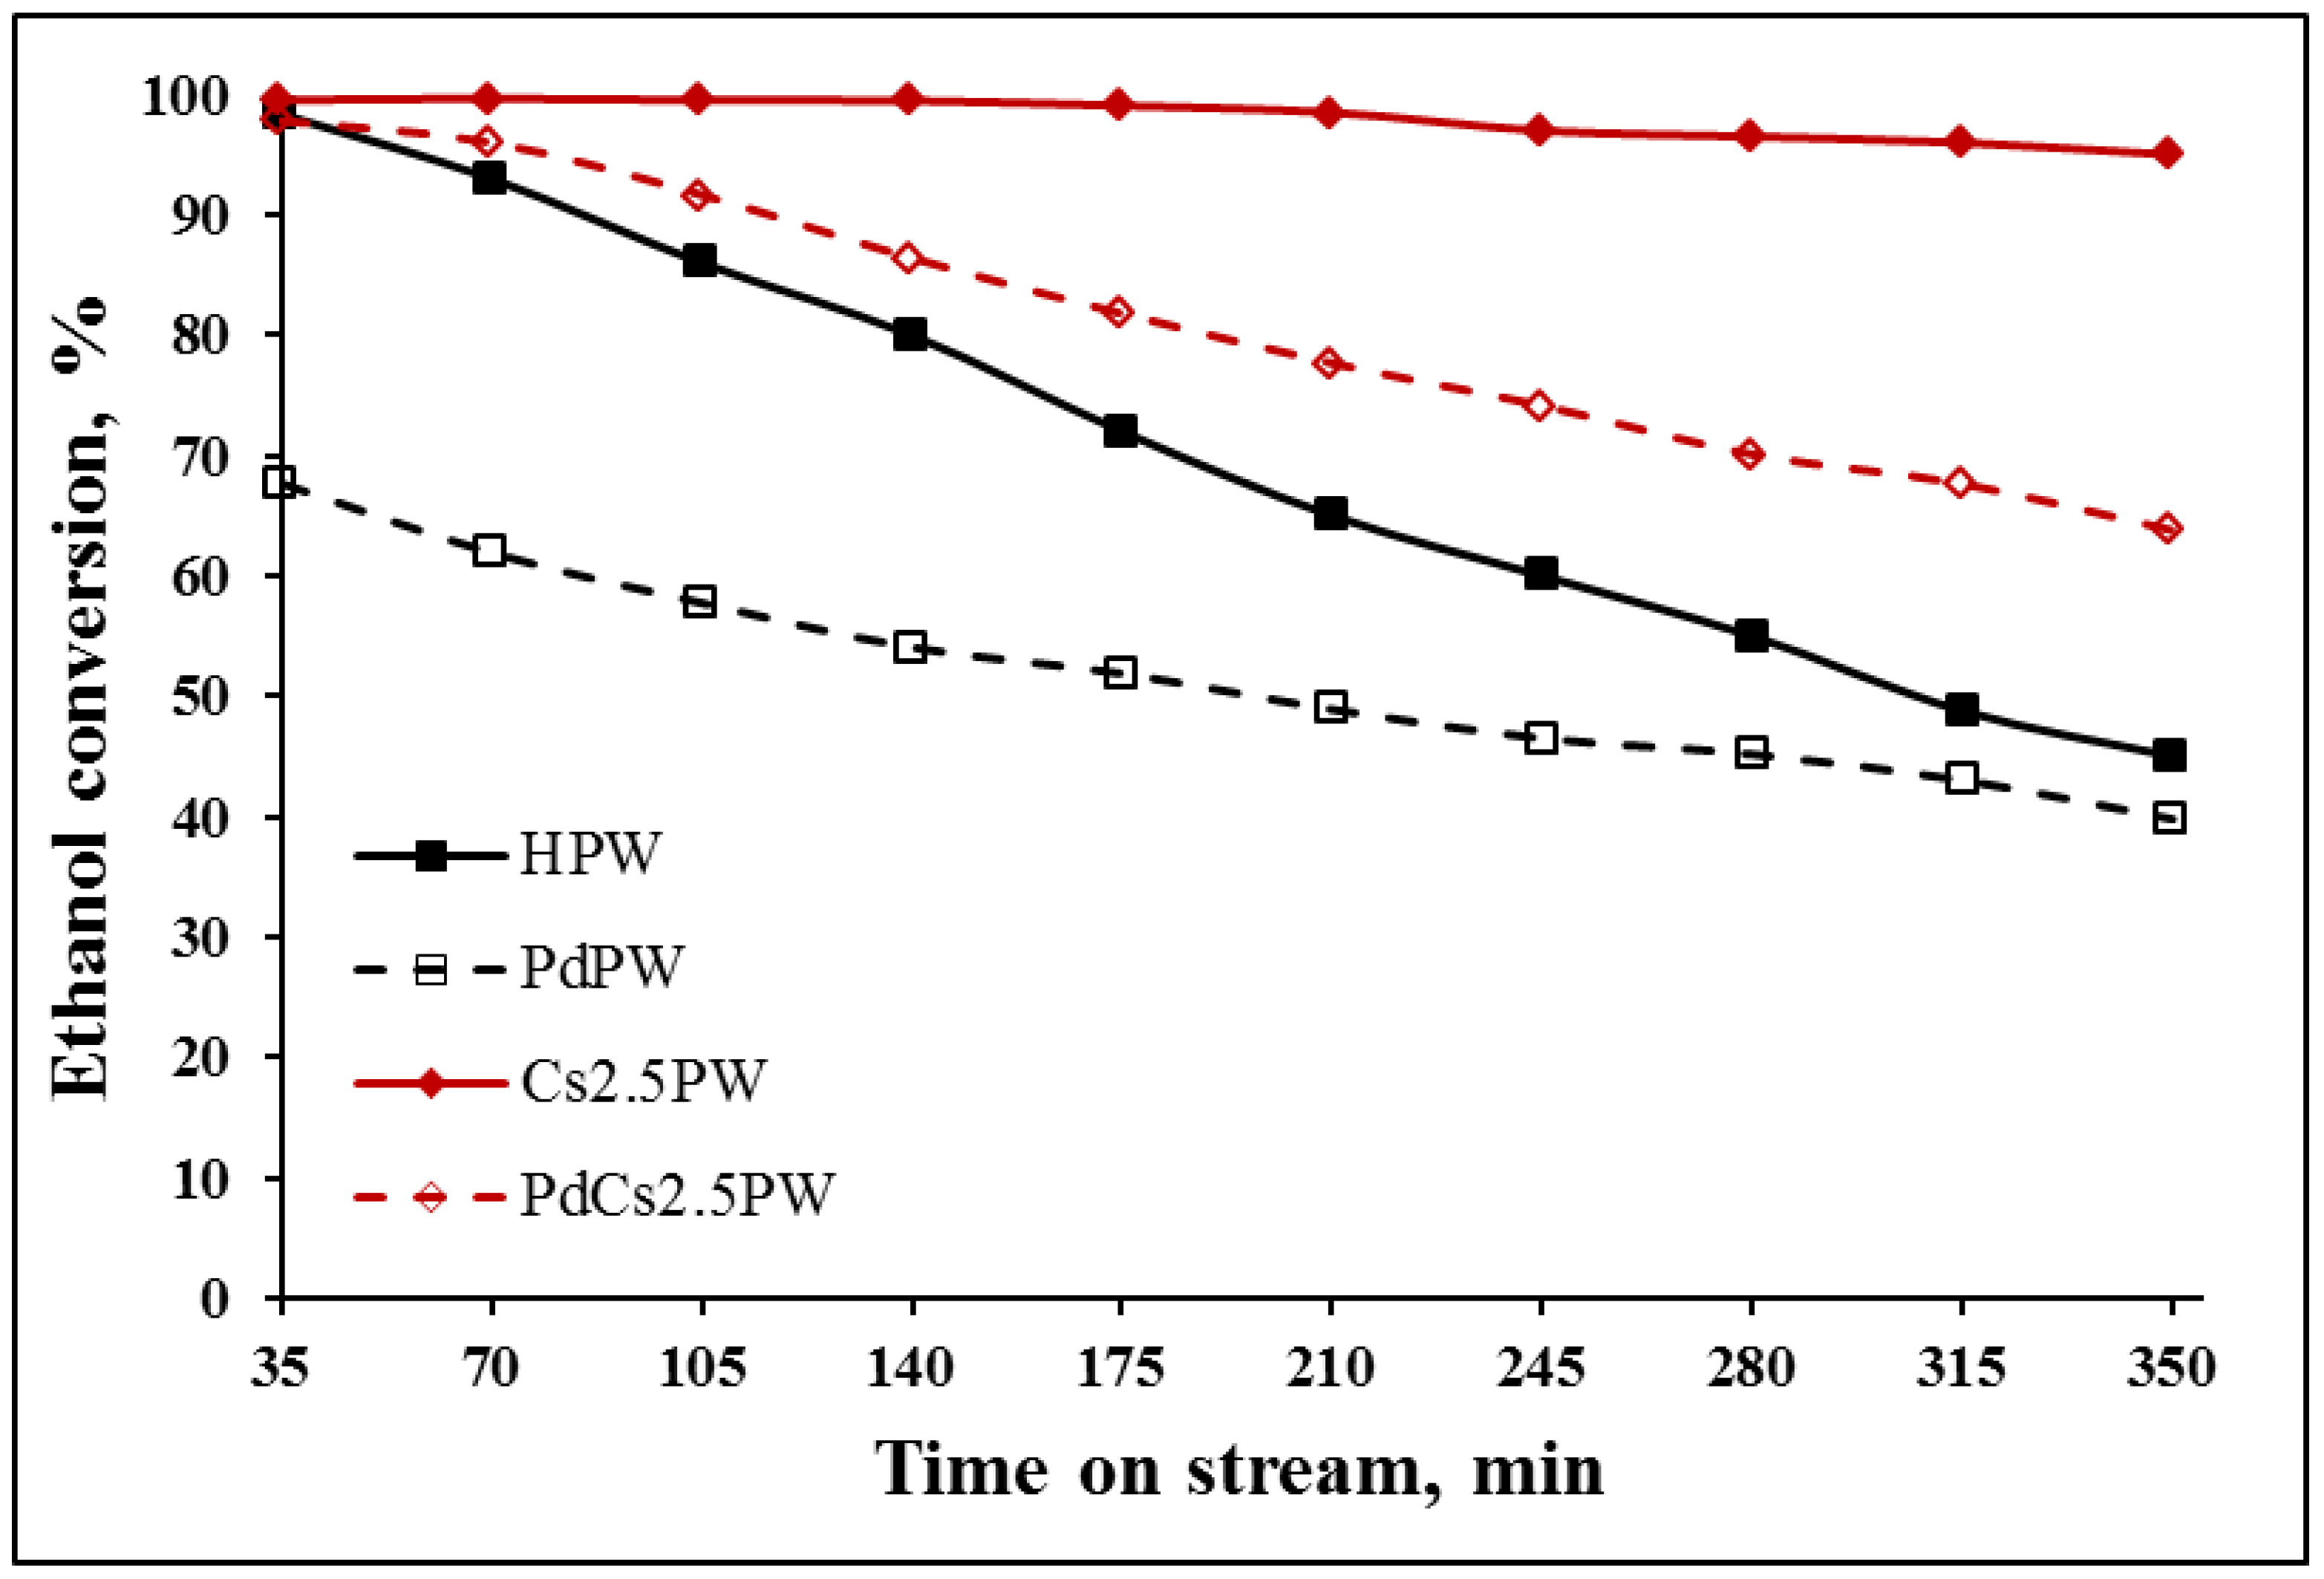
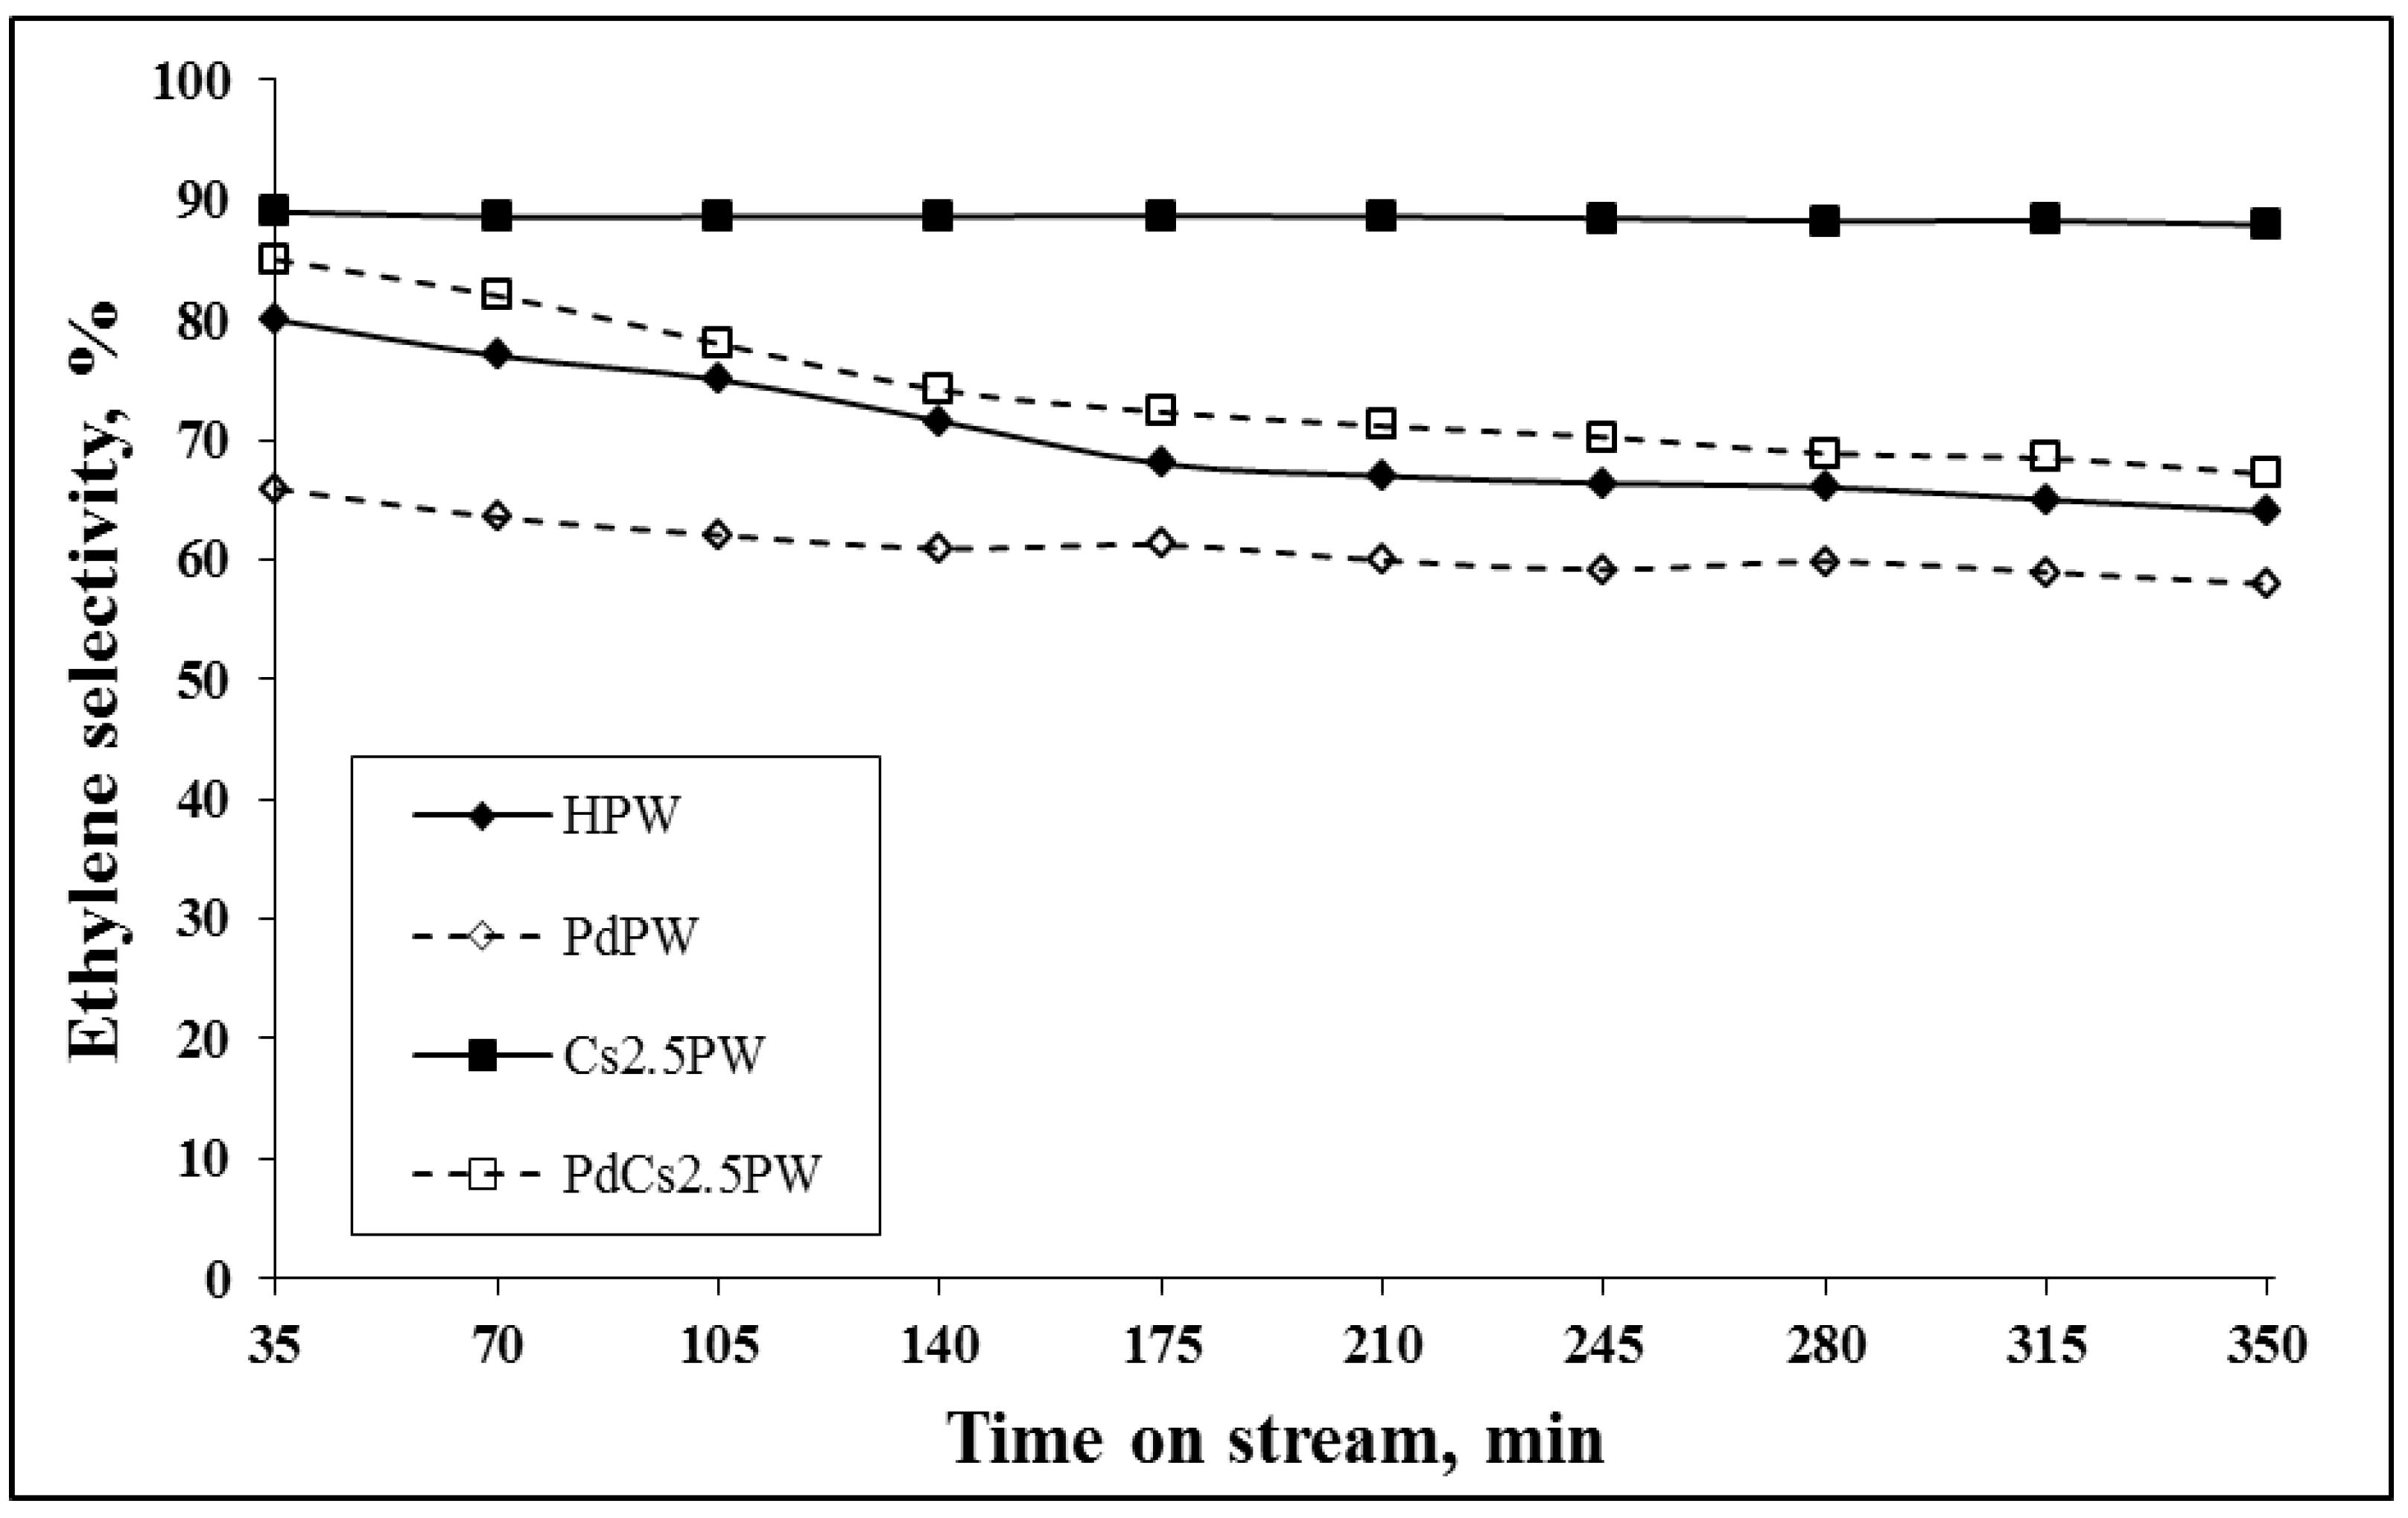
| HPW | 51.2 | 45.5 | 43.2 | 39.0 | 18.1 | 19.2 |
| PdPW | 43.2 | 39.0 | 38.8 | 36.0 | 19.2 | 19.9 |
| Cs2.5PW | 78.6 | 76.1 | 28.4 | 25.2 | 26.3 | 23.2 |
| PdCs2.5PW | 84.2 | 79.2 | 50.9 | 42.6 | 18.3 | 19.7 |
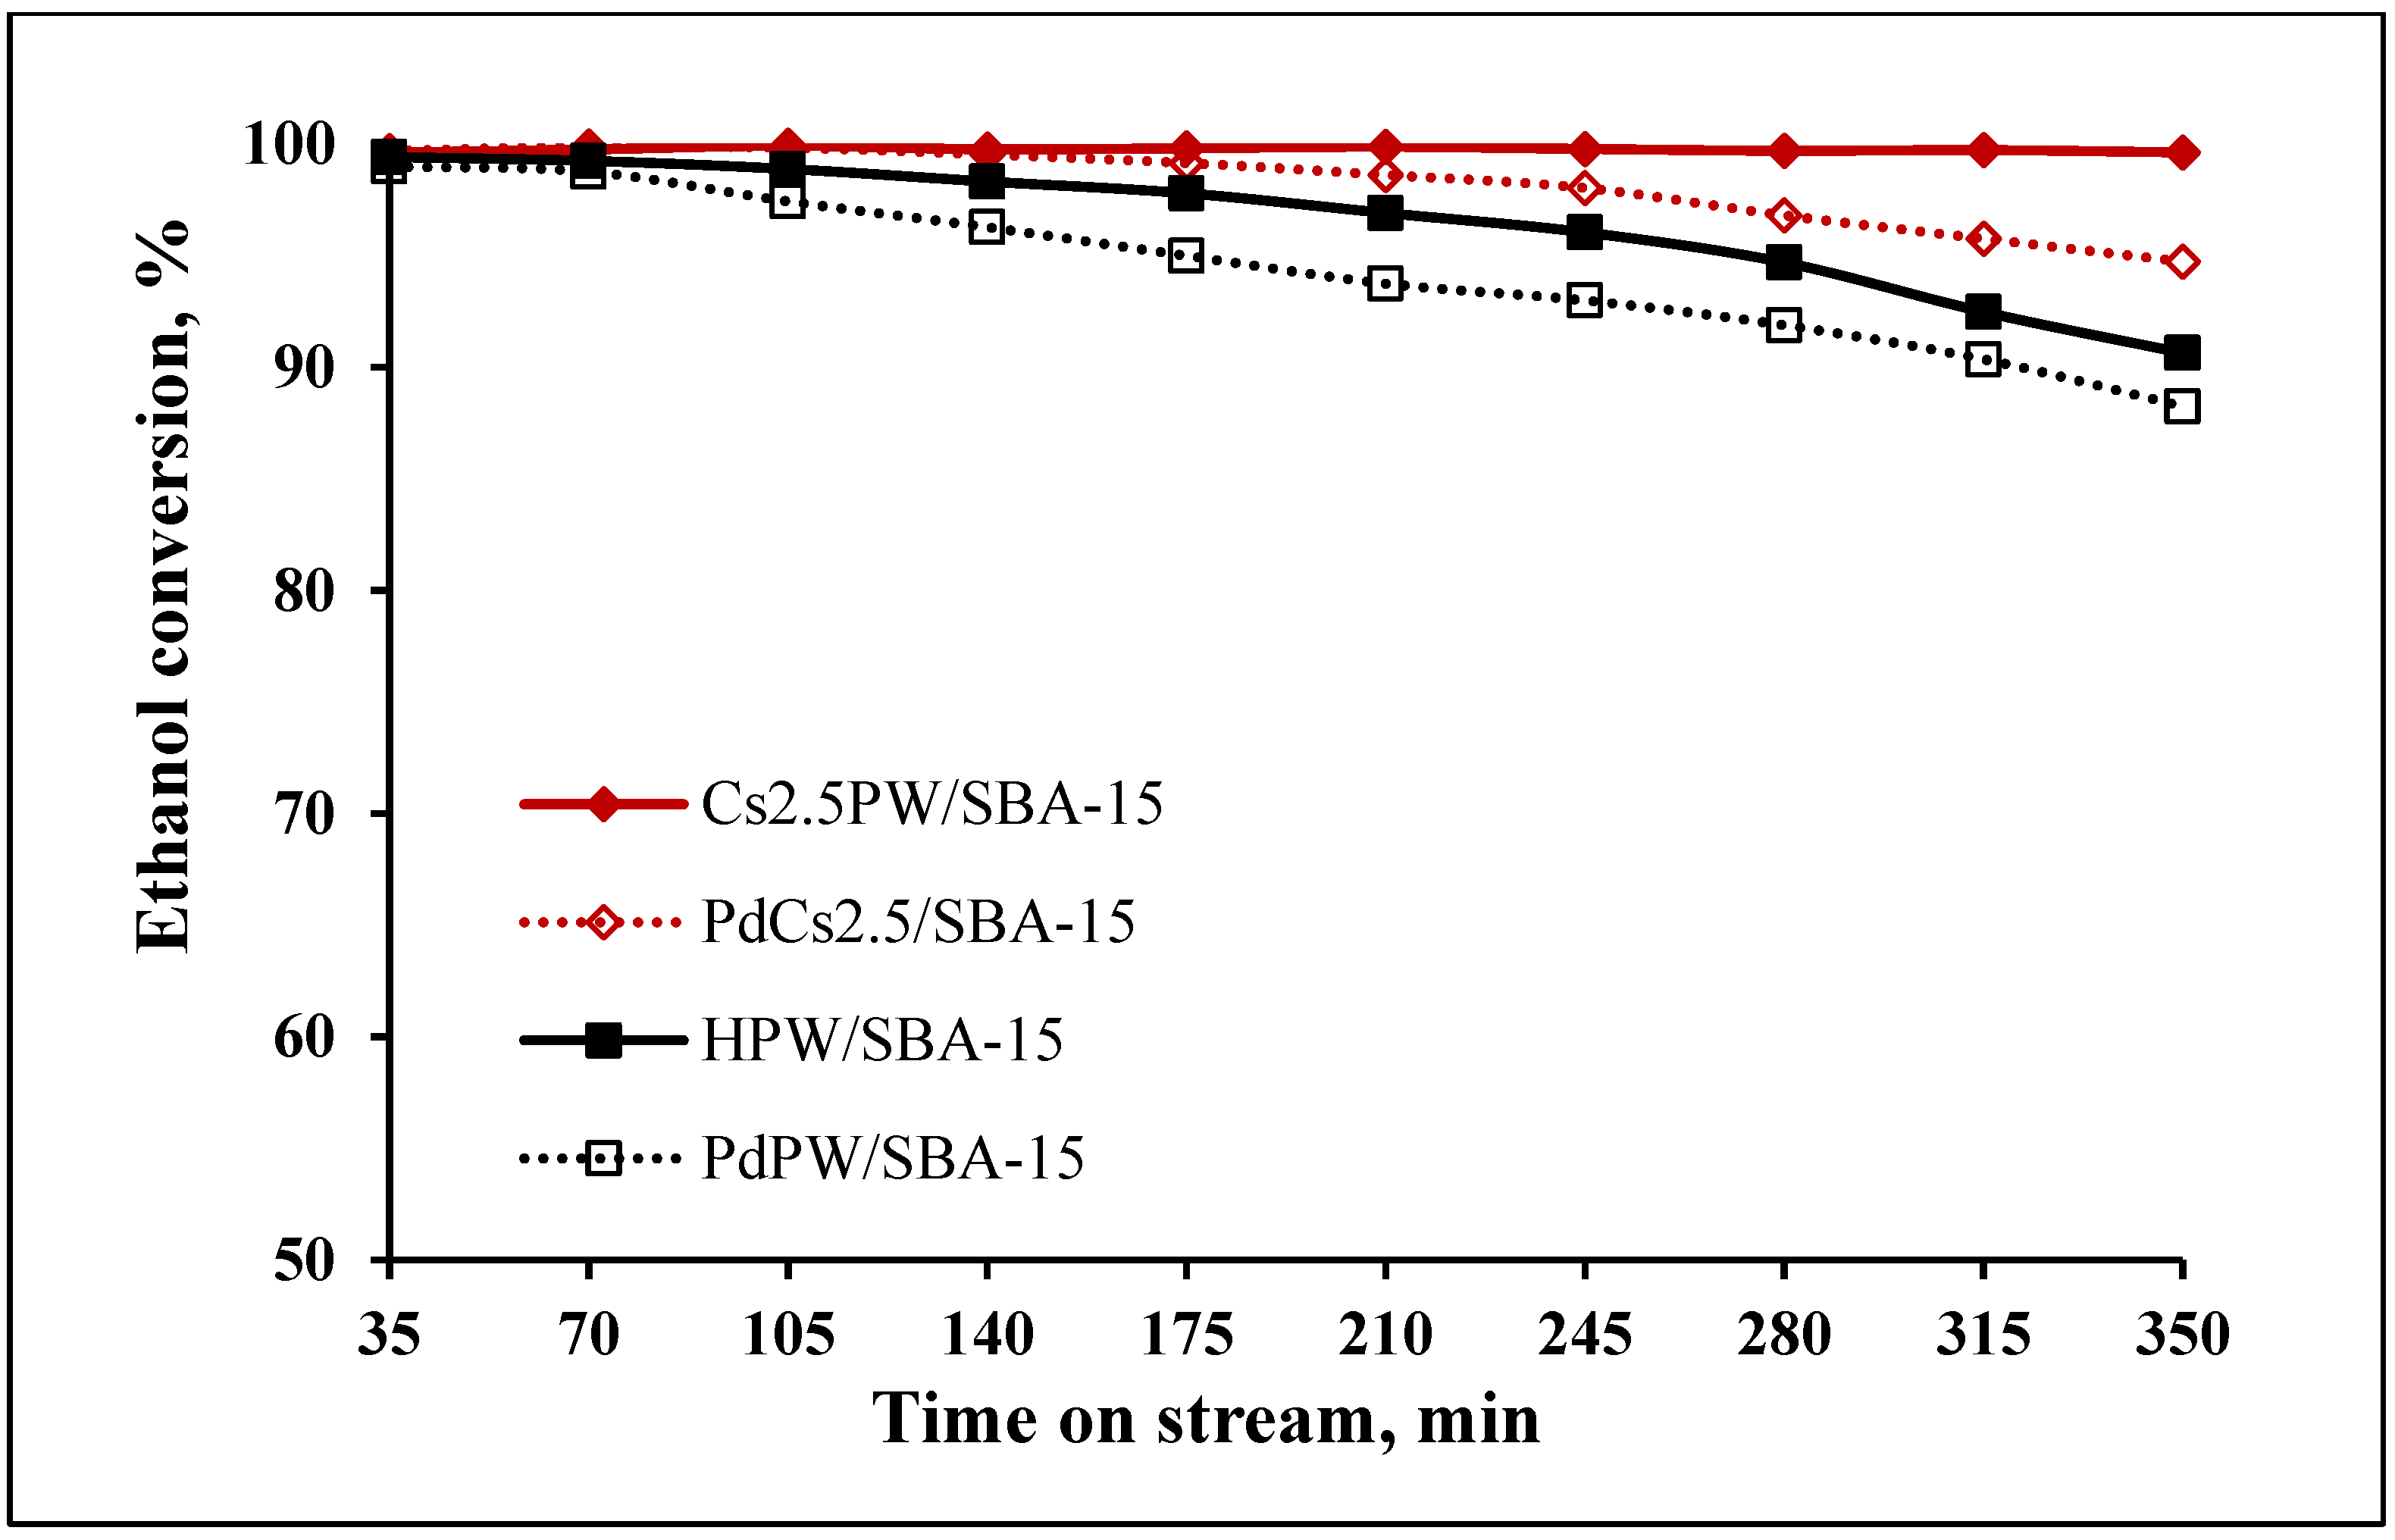
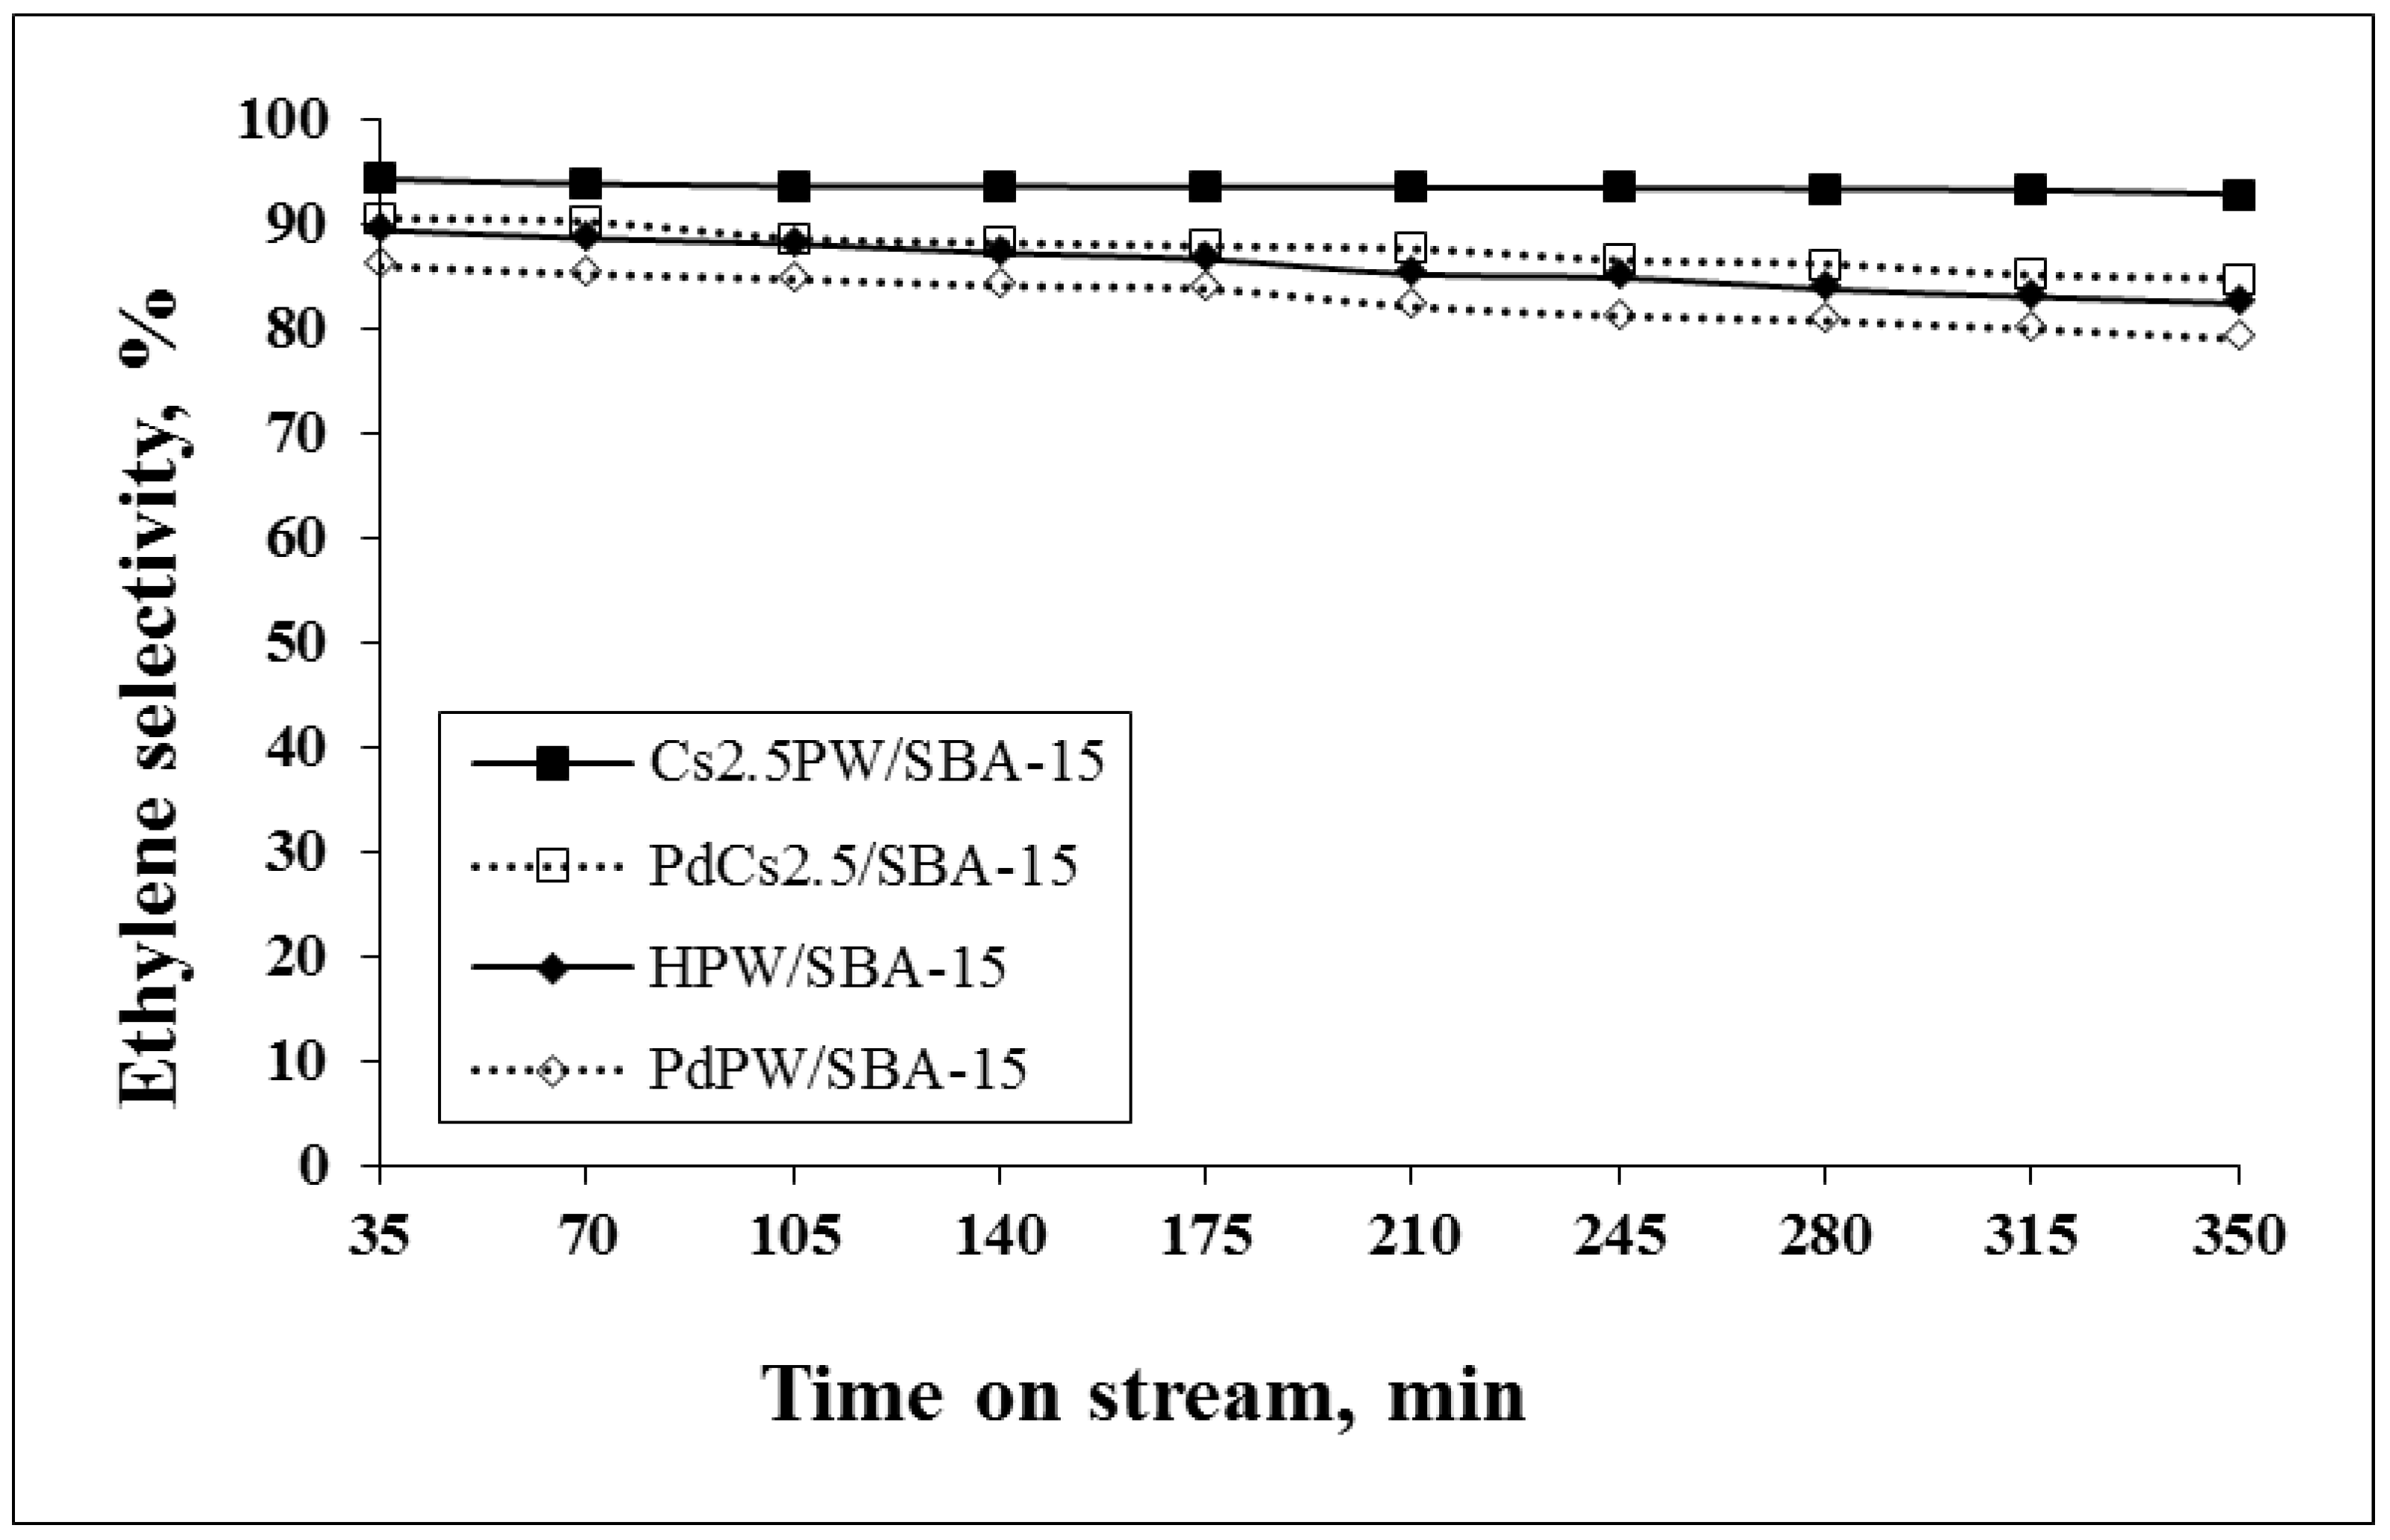
| HPW/SBA-15 | 93.4 | 89.6 | 90.1 | 80.1 | 0.3 | 0.5 |
| PdPW/SBA-15 | 94.7 | 84.7 | 88.4 | 80.6 | 0.2 | 0.1 |
| Cs2.5PW/SBA-15 | 98.9 | 90.1 | 93.2 | 89.4 | 0.3 | 0.4 |
| PdCs2.5PW/SBA-15 | 94.9 | 87.2 | 91.2 | 86.4 | 0.1 | 0.3 |
| Variable | Values |
|---|---|
| Amount catalyst unsupported (mg) | 100 |
| Amount catalysts supported (mg) | 330 |
| Catalyst loading (wt.%) | 30 |
| Operating temperature (°C) | 200, 250, 300, 350 |
| Ethanol flow rate (mL/h) | 1.2 |
| Nitrogen flow rate (mL/min) | 30 |
| TOS (min) | 350 |
Publisher’s Note: MDPI stays neutral with regard to jurisdictional claims in published maps and institutional affiliations. |
© 2022 by the authors. Licensee MDPI, Basel, Switzerland. This article is an open access article distributed under the terms and conditions of the Creative Commons Attribution (CC BY) license (https://creativecommons.org/licenses/by/4.0/).
Share and Cite
Verdeş, O.; Popa, A.; Borcănescu, S.; Suba, M.; Sasca, V. Thermogravimetry Applied for Investigation of Coke Formation in Ethanol Conversion over Heteropoly Tungstate Catalysts. Catalysts 2022, 12, 1059. https://doi.org/10.3390/catal12091059
Verdeş O, Popa A, Borcănescu S, Suba M, Sasca V. Thermogravimetry Applied for Investigation of Coke Formation in Ethanol Conversion over Heteropoly Tungstate Catalysts. Catalysts. 2022; 12(9):1059. https://doi.org/10.3390/catal12091059
Chicago/Turabian StyleVerdeş, Orsina, Alexandru Popa, Silvana Borcănescu, Mariana Suba, and Viorel Sasca. 2022. "Thermogravimetry Applied for Investigation of Coke Formation in Ethanol Conversion over Heteropoly Tungstate Catalysts" Catalysts 12, no. 9: 1059. https://doi.org/10.3390/catal12091059