Article

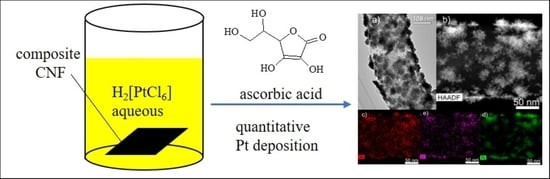
Deposition of Pt Nanoparticles by Ascorbic Acid on Composite Electrospun Polyacrylonitrile-Based Carbon Nanofiber for HT-PEM Fuel Cell Cathodes

by
Igor I. Ponomarev
1,
Kirill M. Skupov
1,*,
Olga M. Zhigalina
2,
Dmitry N. Khmelenin
2,
Ivan I. Ponomarev
1,
Elizaveta S. Vtyurina
1,
Evgeny N. Cherkovskiy
2,
Victoria G. Basu
2 and
Alexander D. Modestov
3
1
A.N. Nesmeyanov Institute of Organoelement Compounds of Russian Academy of Sciences, Vavilova St., 28, bld. 1, 119334 Moscow, Russia
2
A.V. Shubnikov Institute of Crystallography of Federal Scientific Research Centre “Crystallography and Photonics” of Russian Academy of Sciences, Leninsky Av., 59, 119333 Moscow, Russia
3
A.N. Frumkin Institute of Physical Chemistry and Electrochemistry of Russian Academy of Sciences, Leninsky Av., 31, bld. 4., 119071 Moscow, Russia
*
Author to whom correspondence should be addressed.
Catalysts 2022, 12(8), 891; https://doi.org/10.3390/catal12080891
Submission received: 15 July 2022 / Revised: 5 August 2022 / Accepted: 12 August 2022 / Published: 13 August 2022
(This article belongs to the Special Issue Nanoparticles in the Catalysis)

Abstract

:
The efficient use of renewable energy sources requires development of new electrocatalytic materials for electrochemical energy storage systems, particularly fuel cells. To increase durability of high temperature polymer electrolyte fuel cell (HT-PEMFC), Pt/carbon black based catalysts should be replaced by more durable ones, for example Pt/carbon nanofibers (CNF). Here, we report for the first time the quantitative ascorbic acid assisted deposition of Pt onto electrospun polyacrylonitrile-based CNF composite materials. The effect of their subsequent post-treatment at various temperatures (250 and 500 °C) and media (vacuum or argon-hydrogen mixture) on the Pt/C catalyst morphology is investigated. All obtained samples are thoroughly studied by high resolution electron microscopy, and Pt electrochemically active specific surface area was evaluated by cyclic voltammetry.

Graphical Abstract

1. Introduction

One of the very important tasks for the alternative energy development is the development of new electrocatalytic materials for electrochemical power sources. Currently, there are many known electrocatalytic systems, such as Pt-MOx (M = metal) [1,2,3,4,5] and alloyed Pt-M [6,7,8,9,10,11,12,13,14,15], which can be used in the electrochemical power sources. In most cases, the support of the electrocatalyst is carbon black. However, for example, for high temperature polymer electrolyte fuel cell (HT-PEMFC), an application of carbon black impedes its development and distribution due to low durability of carbon black at 150–200 °C in phosphoric acid, i.e., under quite harsh conditions. As a result, Pt nanoparticles may be detached from the surface and lost. Thus, some more durable carbon nanostructured materials, for example carbon nanofibers (CNF) are required for better stability and durability of HT-PEMFC operation and to reduce its cost [16,17,18,19,20,21,22,23,24,25]. The alloyed Pt–M electrocatalytic systems, where M = Ni, are more active in oxygen reduction reaction (ORR), compared with pure Pt [6,12,14].
Earlier [26,27,28,29,30,31,32,33,34,35,36,37,38] we have shown that more durable, compared with carbon black, CNF-based materials, including Pt-Ni-ZrOx/CNF, can be used as cathodes in membrane-electrode assembly (MEA) for HT-PEMFC.
In this work, CNF were obtained by subsequent thermal stabilization and pyrolysis of polymer nanofiber mats [39], which, in turn, were obtained by the electrospinning [40] method (NanospiderTM technology, where numerous jets are generated from the string electrode). On the evaporation of solvents, the jets are converted to filaments, which are subjected to subsequent stabilization (350 °C) and pyrolysis at 900–1200 °C. Ni0 and ZrOx-doped nanofibers were produced by adding nickel and zirconium salts to the electrospinning solutions. The described method provides a uniform distribution of these elements in the nanofiber. In this way, the composite CNF self-supporting mats were produced. One of the methods to produce the oxygen reduction catalysts involves reduction of platinum from H2[PtCl6] aqueous solution by formic acid with simultaneous deposition of platinum nanoparticles onto composite CNF self-supporting mats [27]. The cathodes were obtained by formic acid-assisted reduction of platinum in H2[PtCl6] aqueous solution and the subsequent deposition of platinum nanoparticles onto composite CNF self-supporting mats. It was also shown that the heat treatment of the obtained catalytic systems at different temperatures may affect the morphology and electrochemically active platinum surface area of the obtained catalysts and, in turn, the performance of MEA in HT-PEMFC. [29] However, the optimization of Pt-electrocatalyst deposition on a support and catalyst post-treatment is still required.
Most methods of platinum deposition on a support lead to platinum losses. Although these losses can be recovered by rather complex chemical processes, a decrease in the losses is one of the important problems for electrocatalyst development, which would decrease the total cost of the fuel cells. Ascorbic acid was used as a mild reducer for H2[PtCl6] [41,42]. It is quite acidic due to the resonance stabilization of the ascorbate ion and contains isolated hydroxyl groups. Therefore, one could assume that, in principle, ascorbic acid might coordinate platinum ions and the surface of the composite CNF support leading, finally, to Pt reduction [41,42] and better attachments of the Pt nanoparticles to the CNF surface. A change of formic acid to ascorbic acid may allow the quantitative platinum deposition from H2[PtCl6] solution onto CNF composite materials without any platinum losses and lead to different catalyst morphology, which could be observed by electron microscopy.
In this study, we report for the first time the quantitative ascorbic acid-assisted deposition of Pt onto polyacrylonitrile-based CNF composite materials and the effect on the resulting catalyst morphology of possible additional post-treatment at various temperatures (250 and 500 °C) and media (vacuum and argon-hydrogen mixture).

2. Results

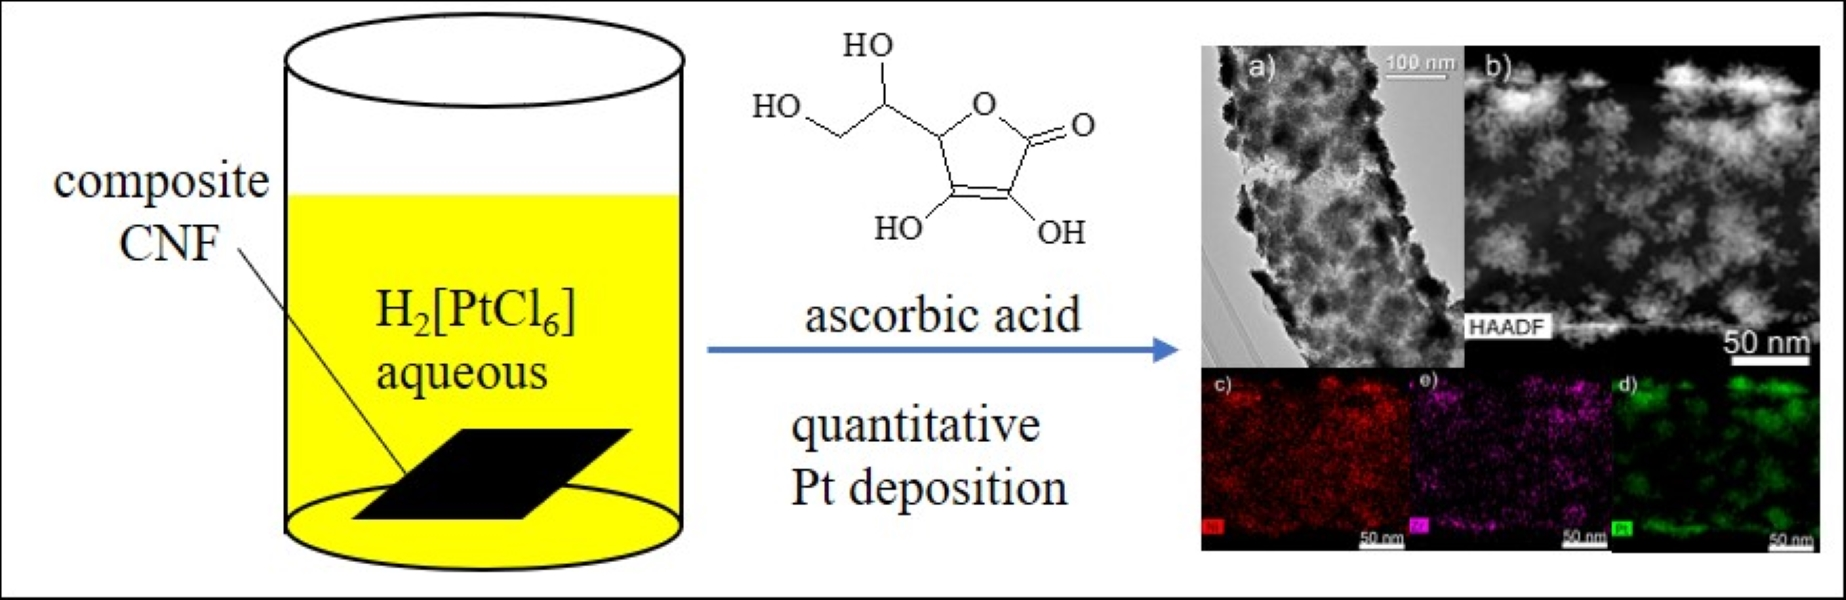
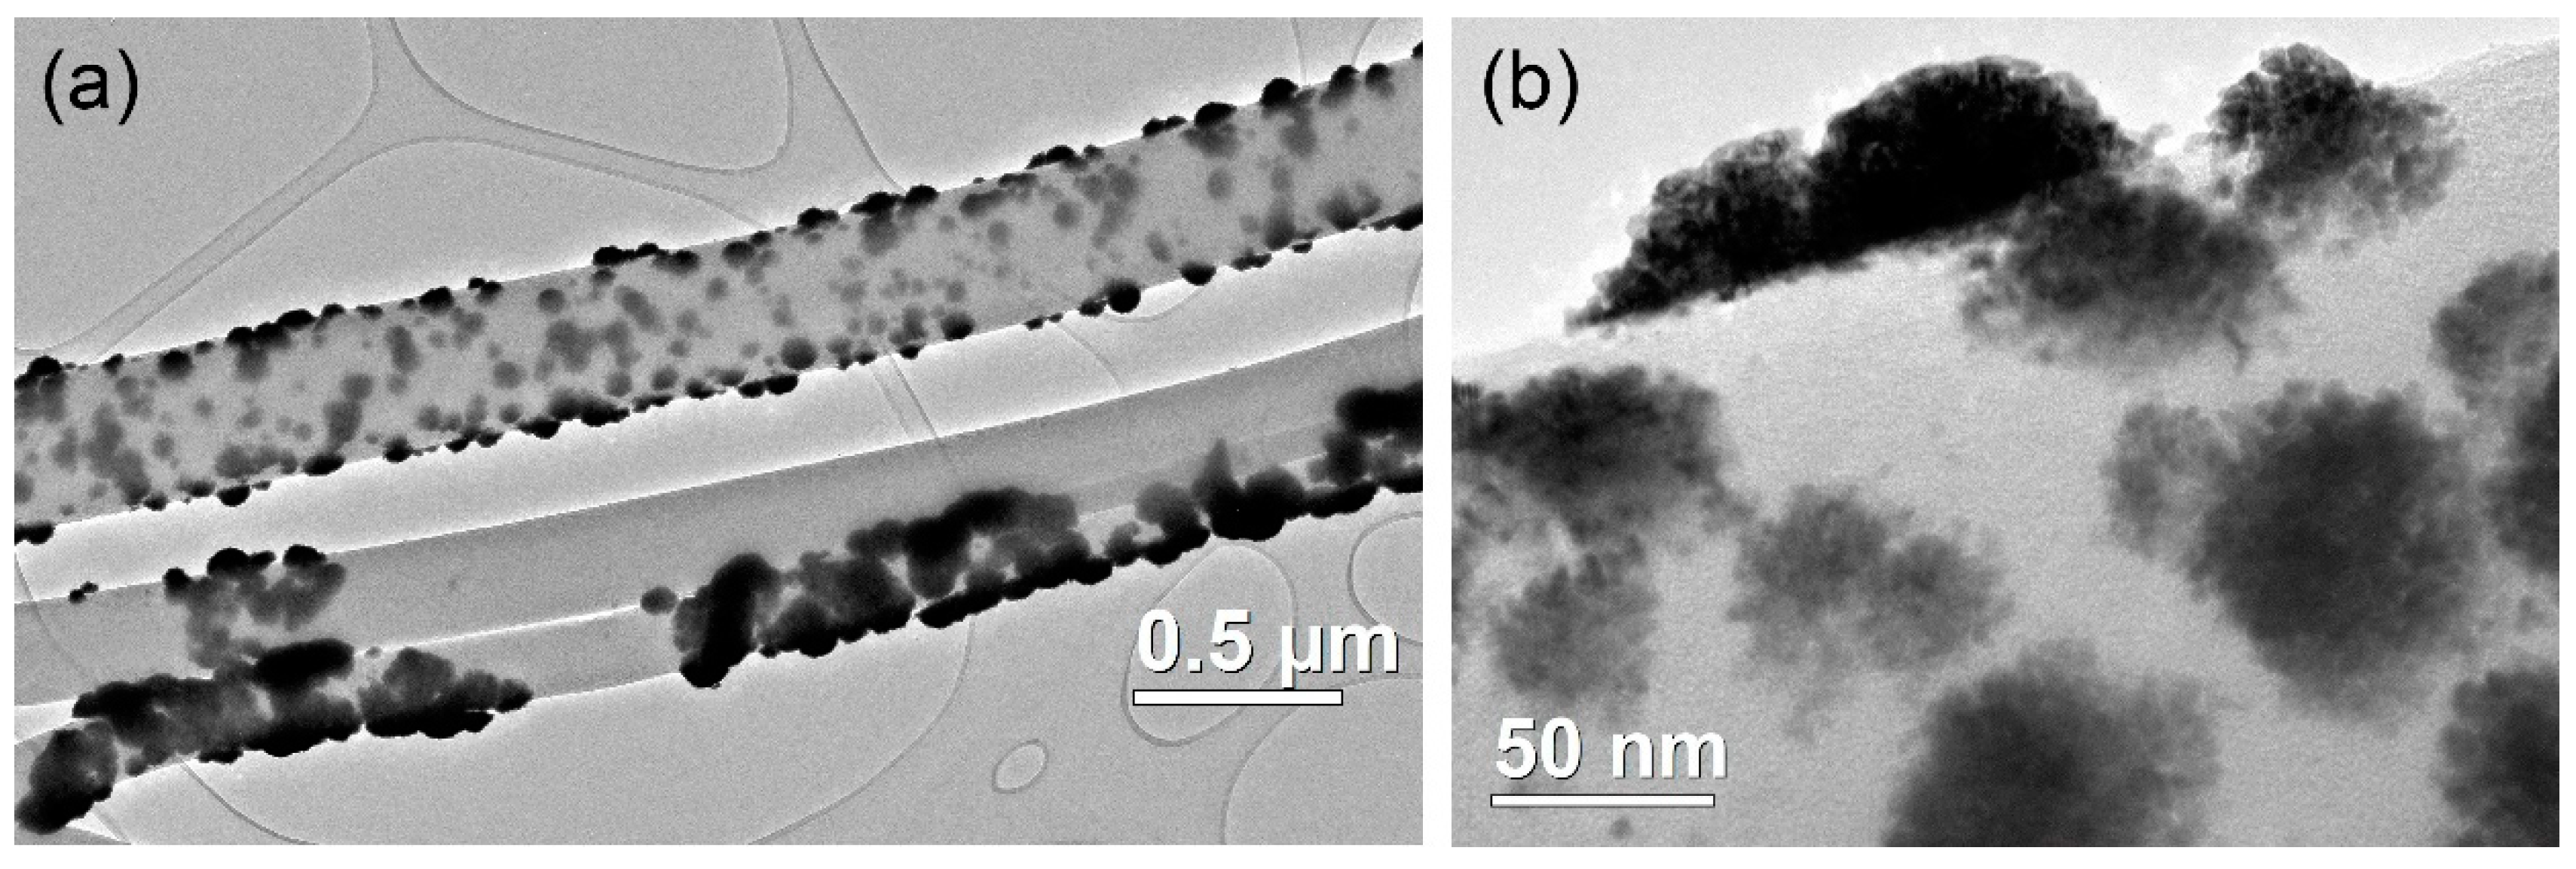
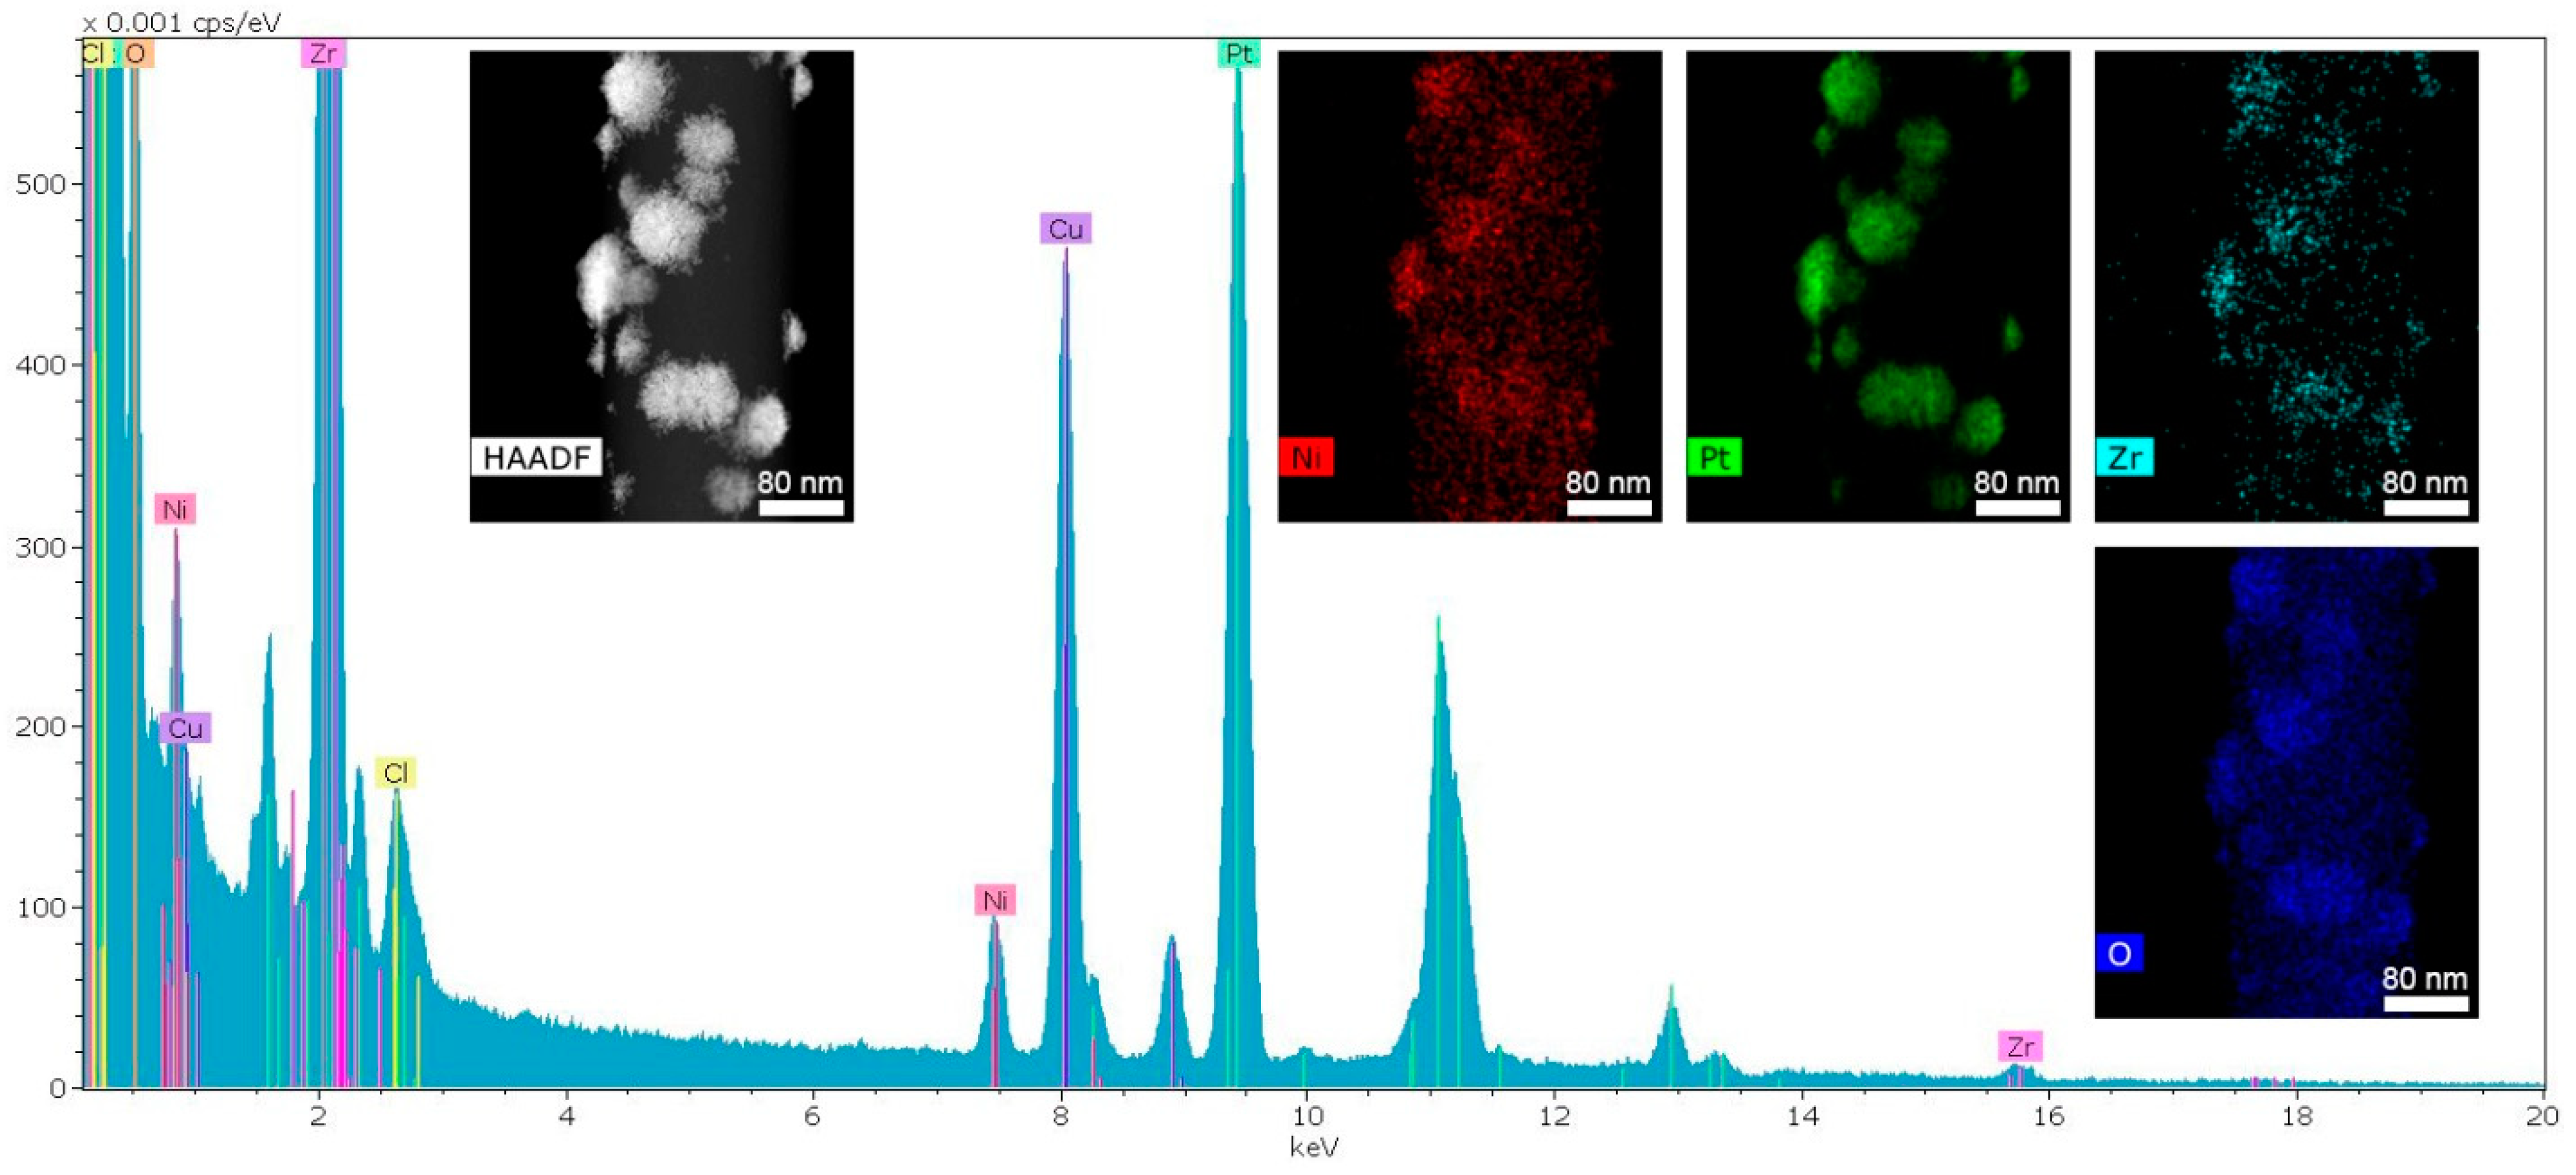
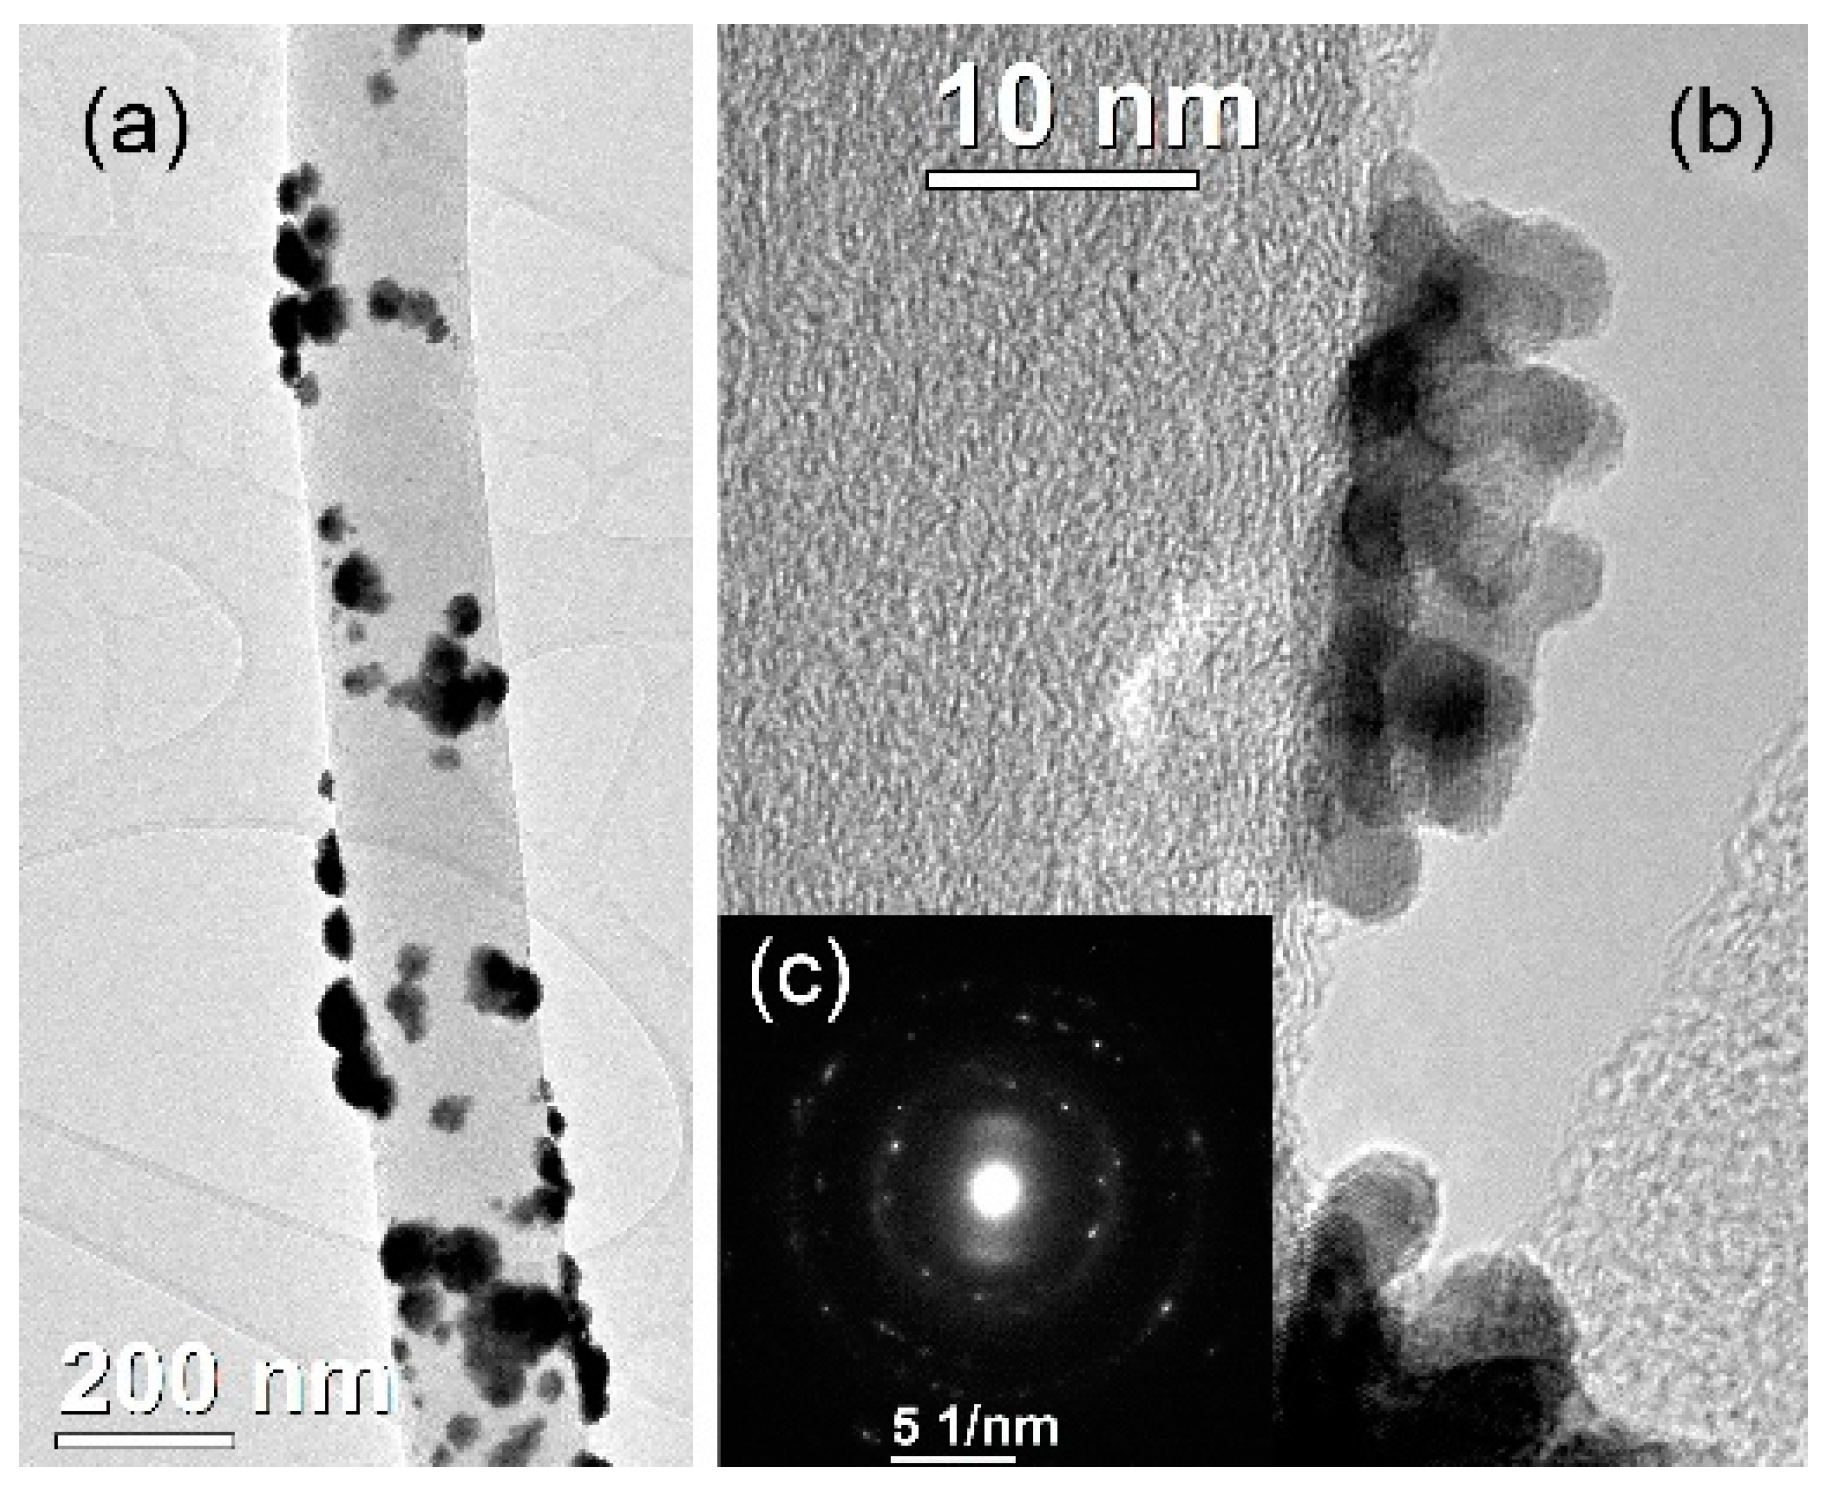
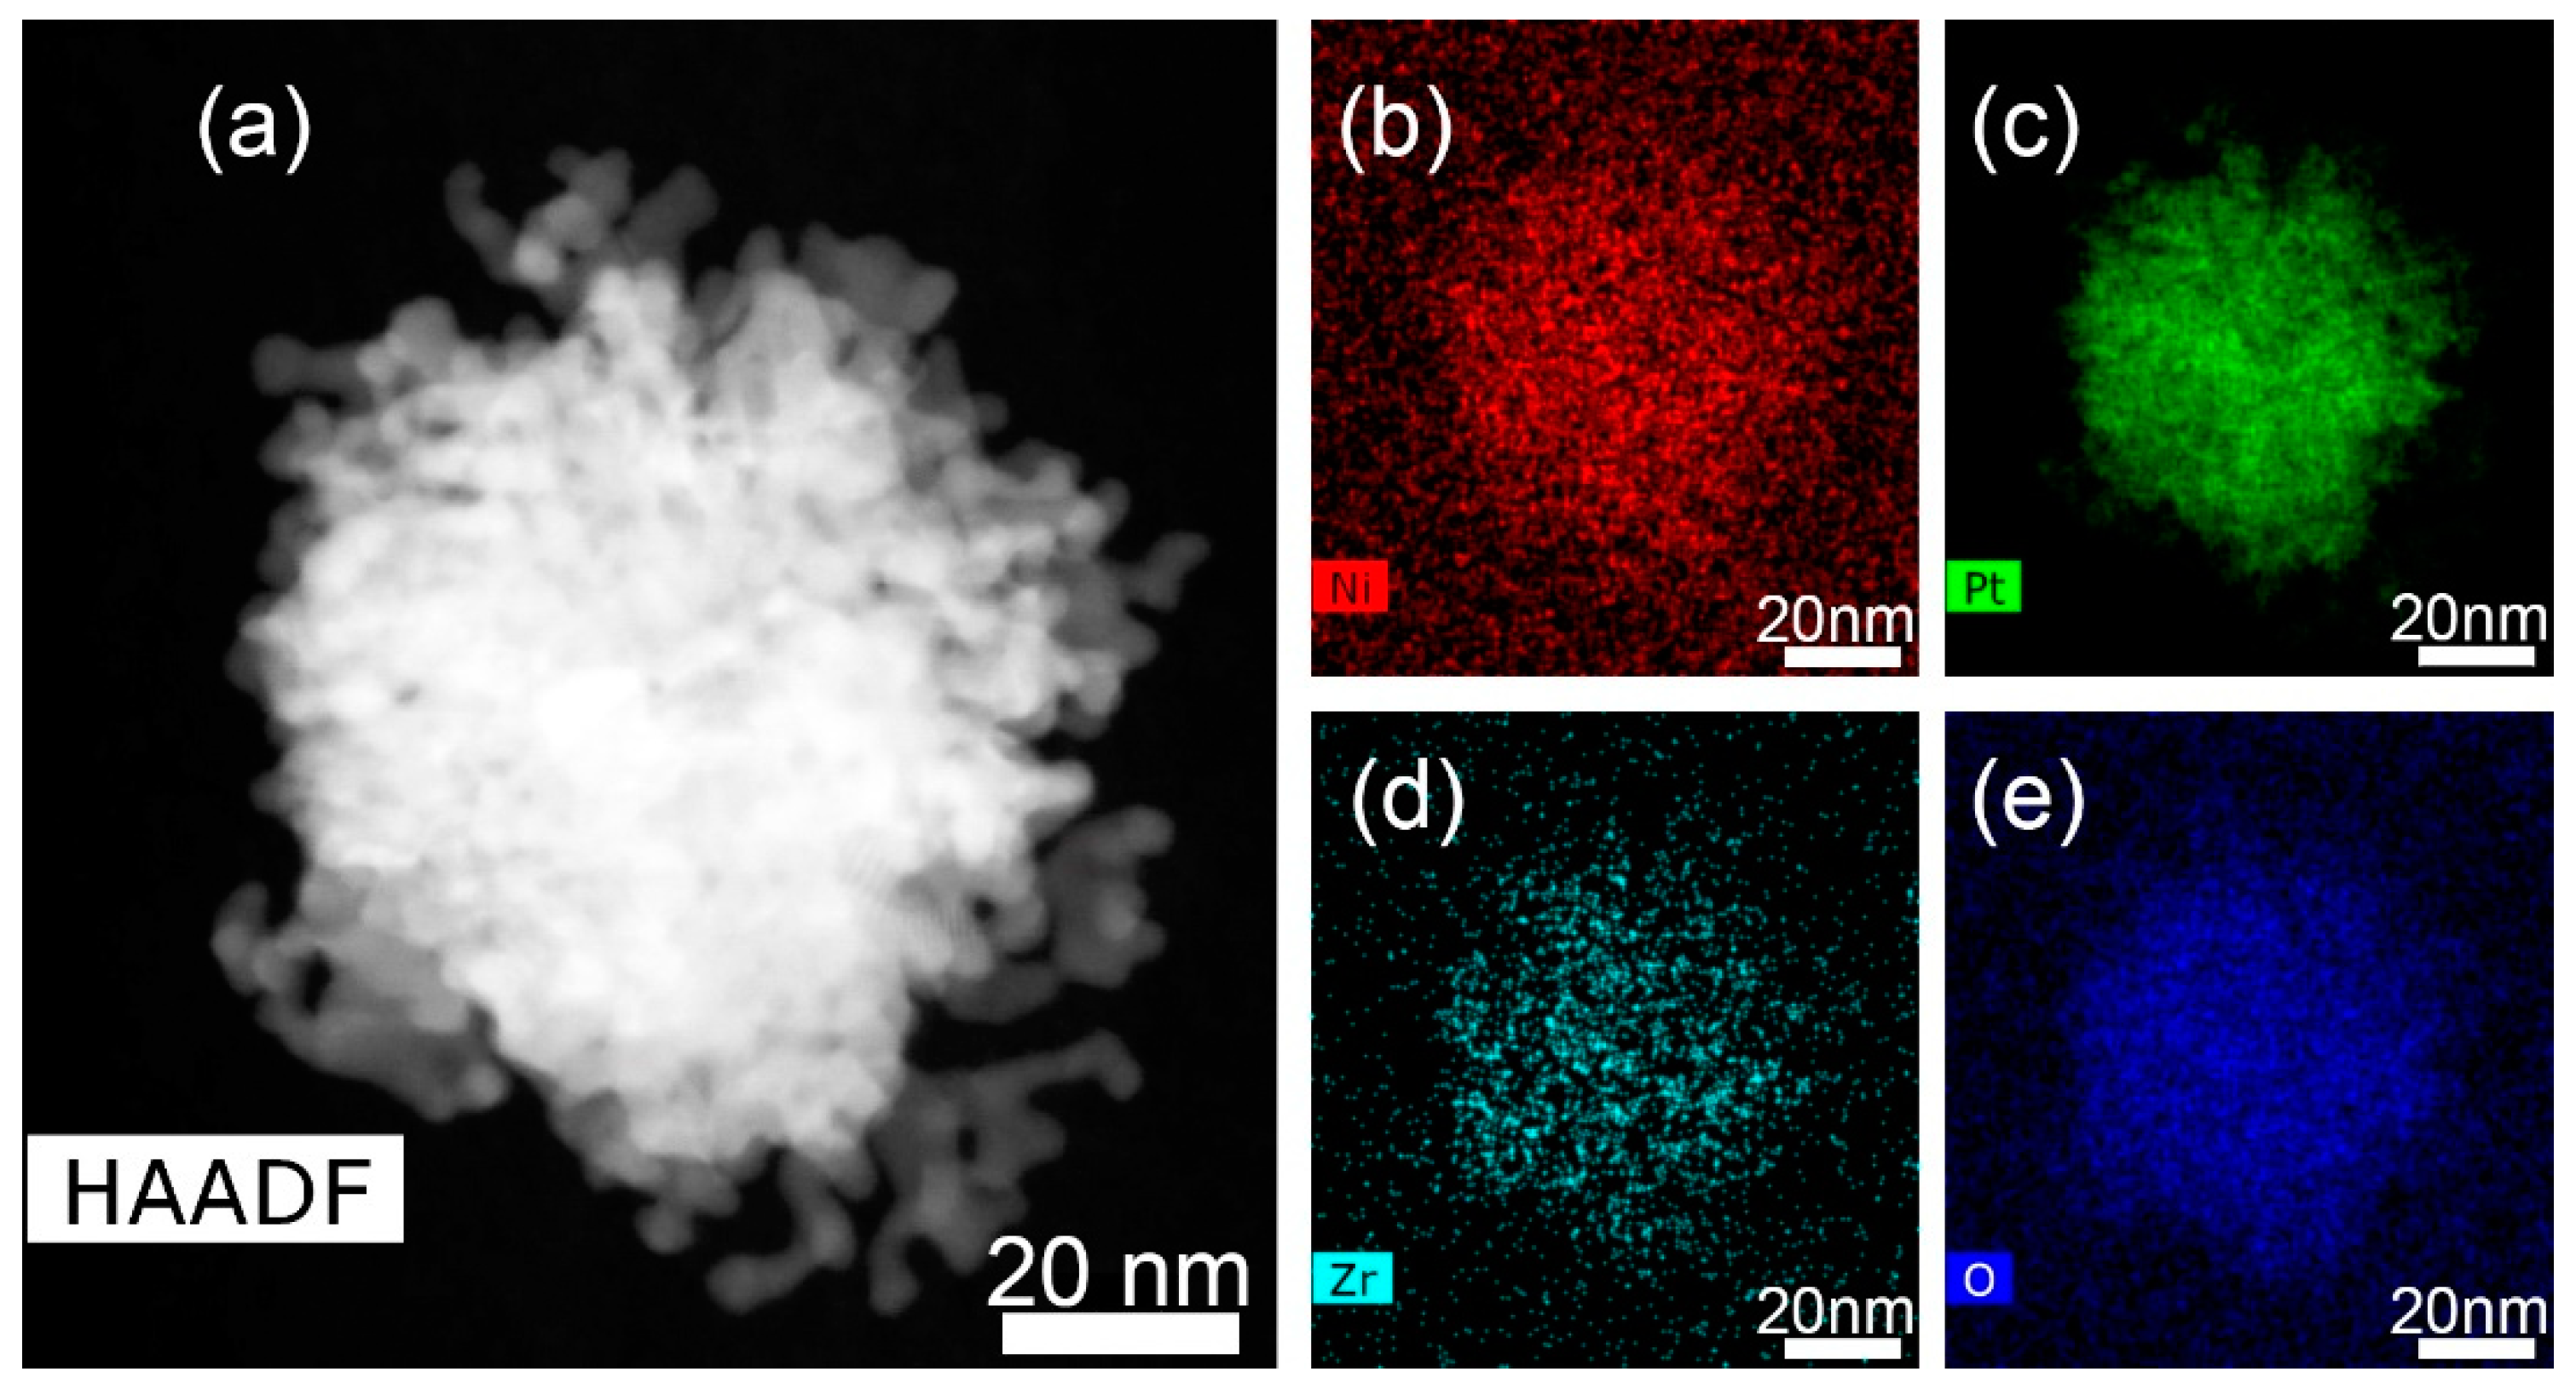
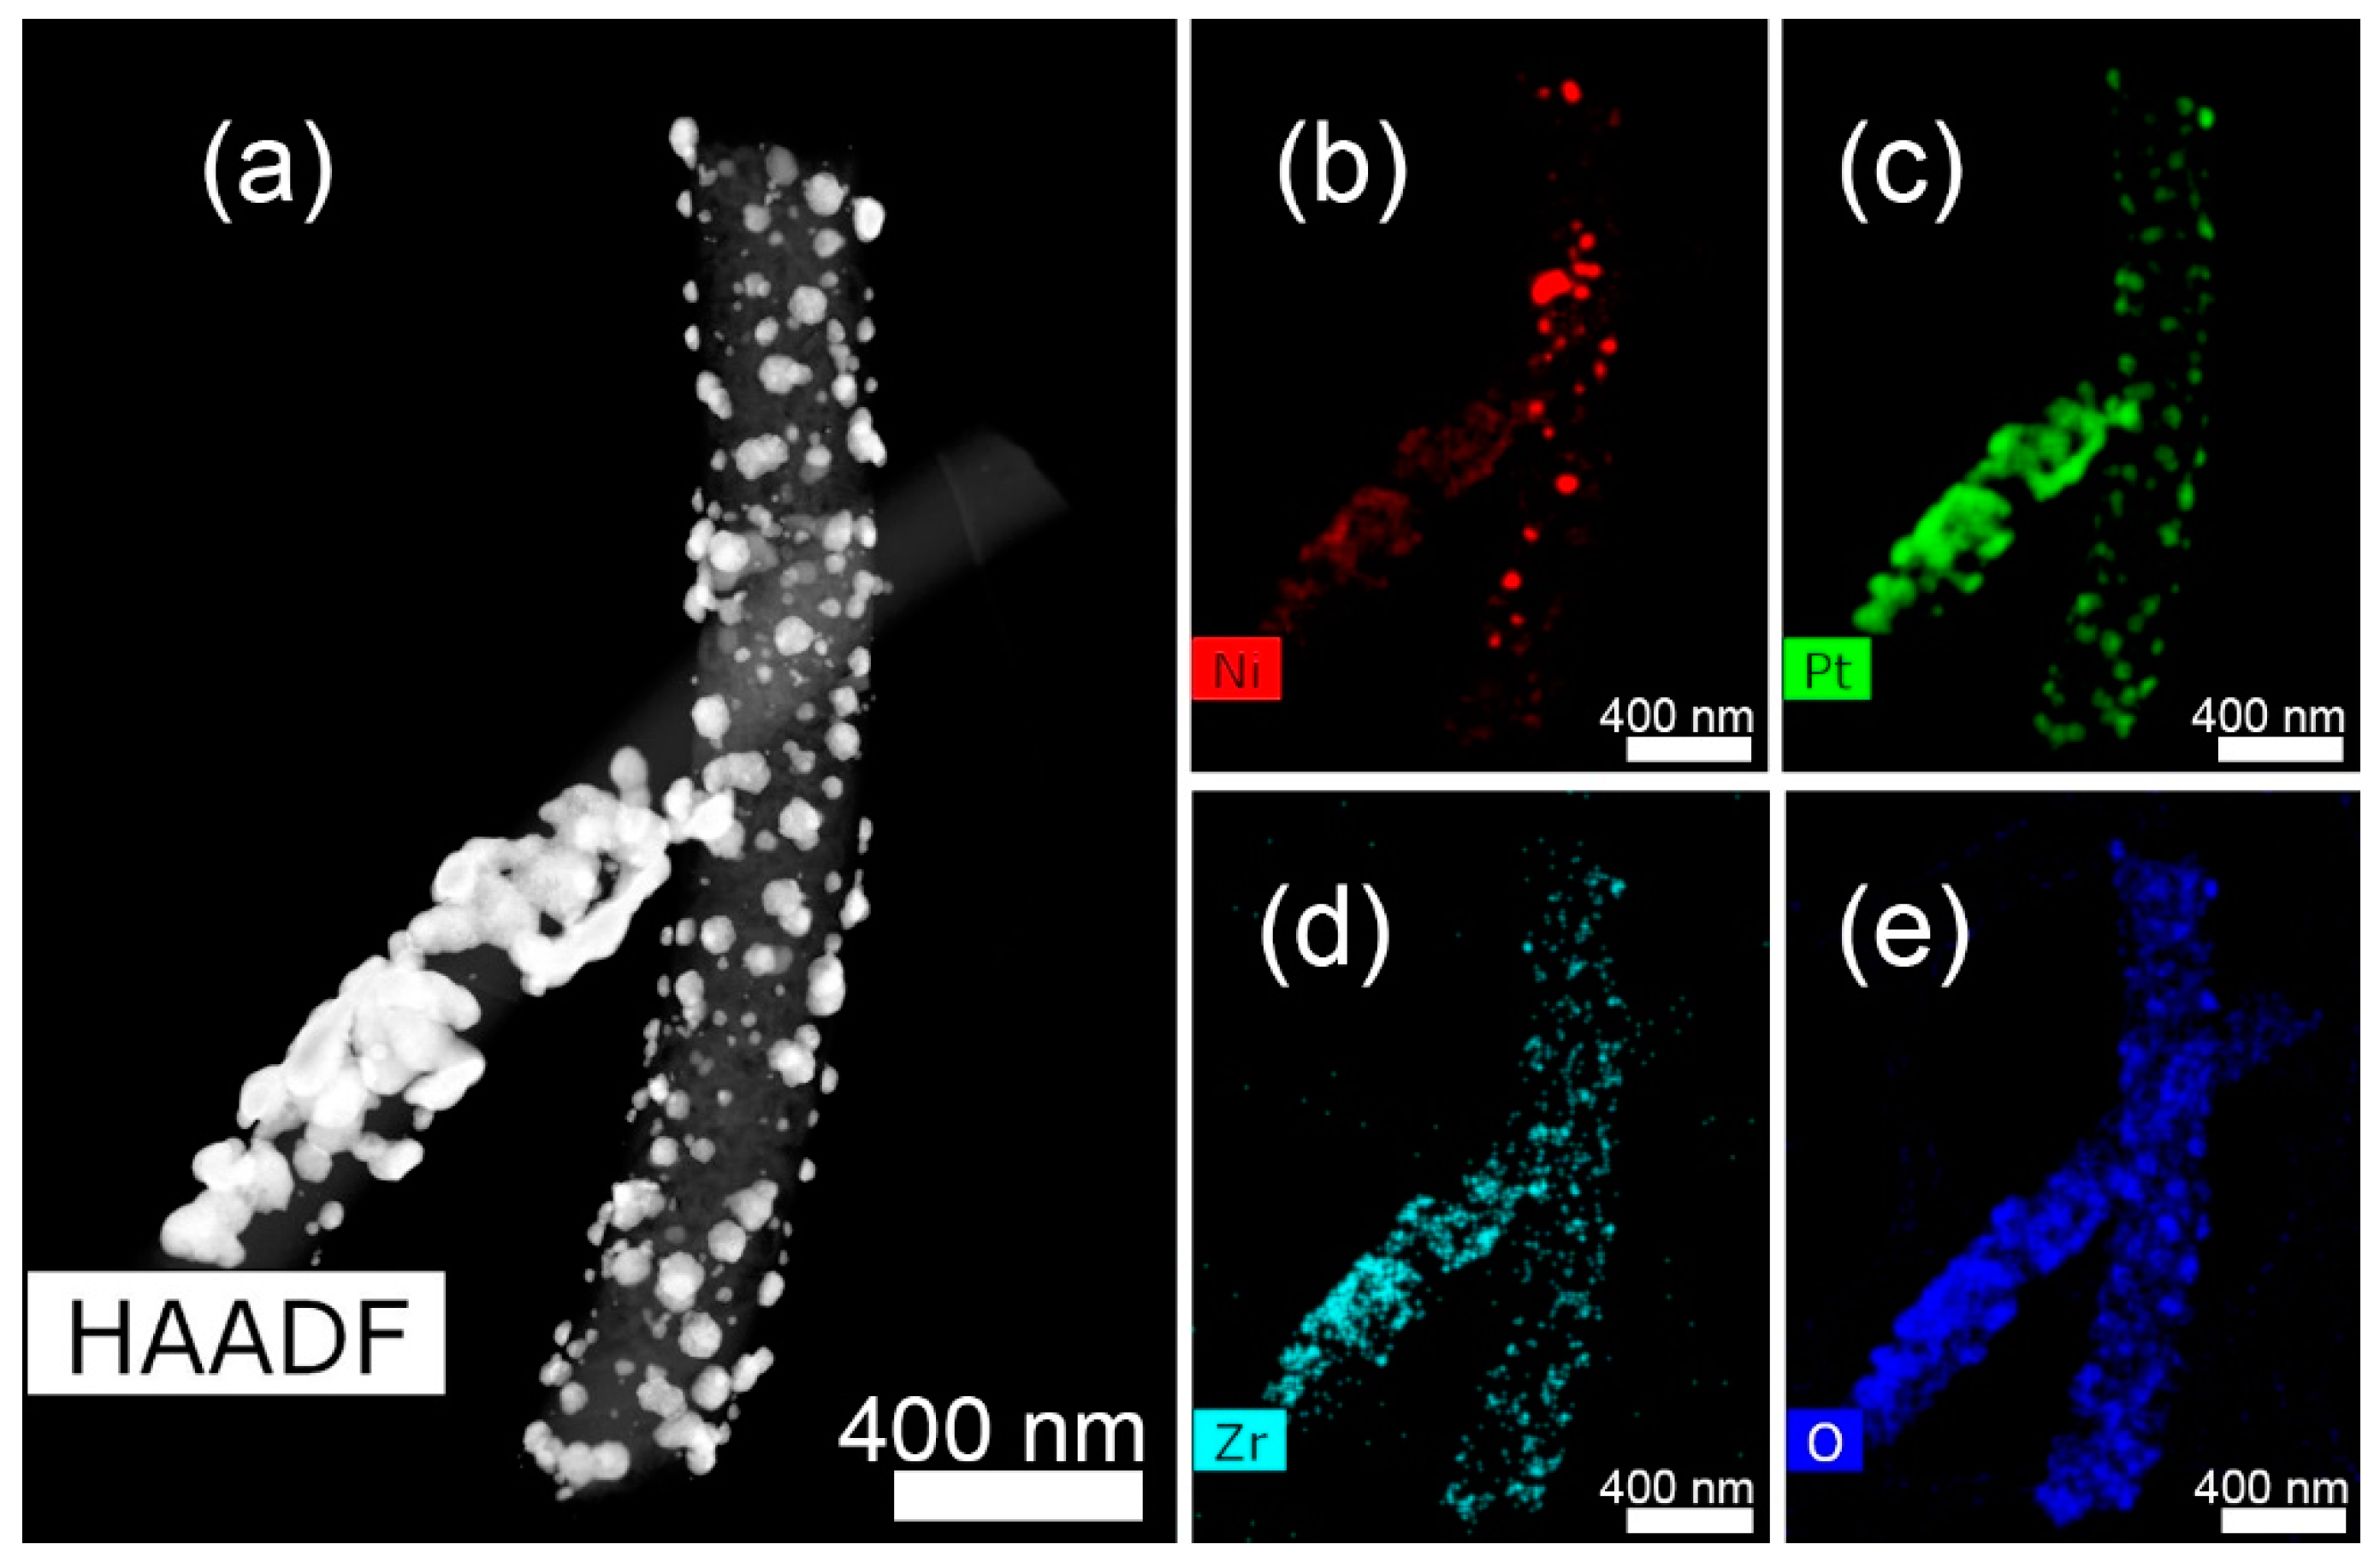
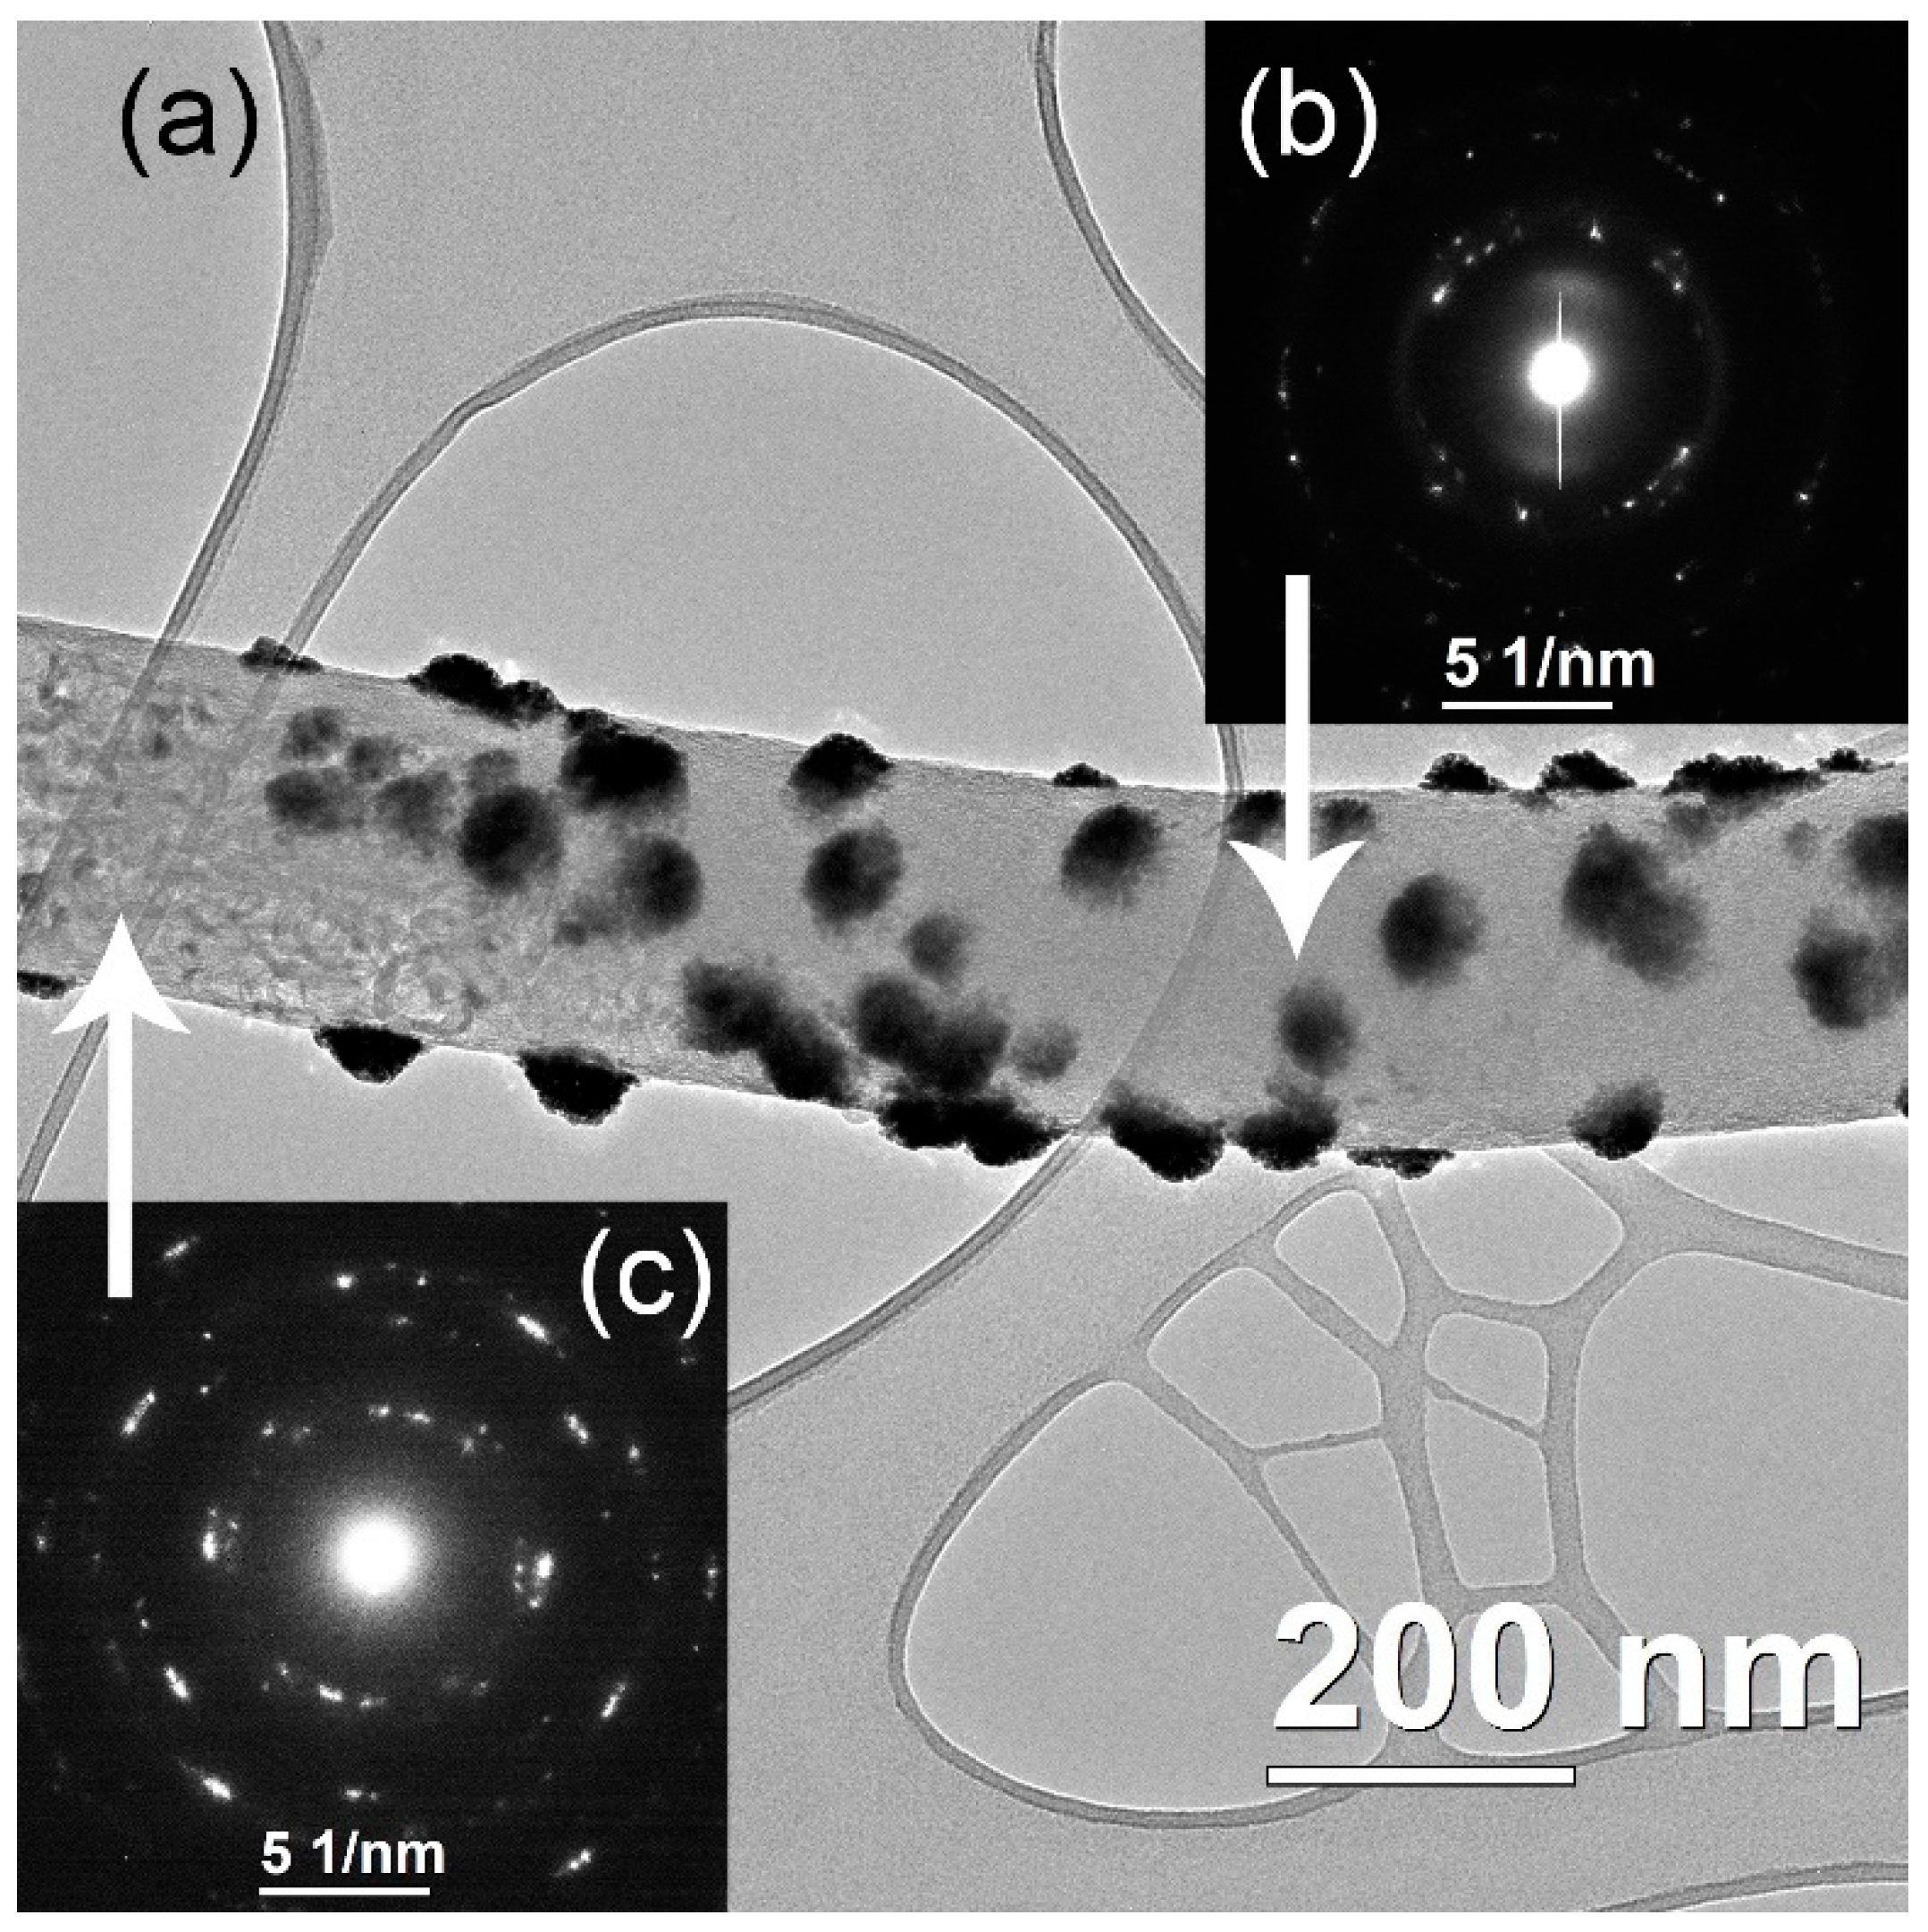
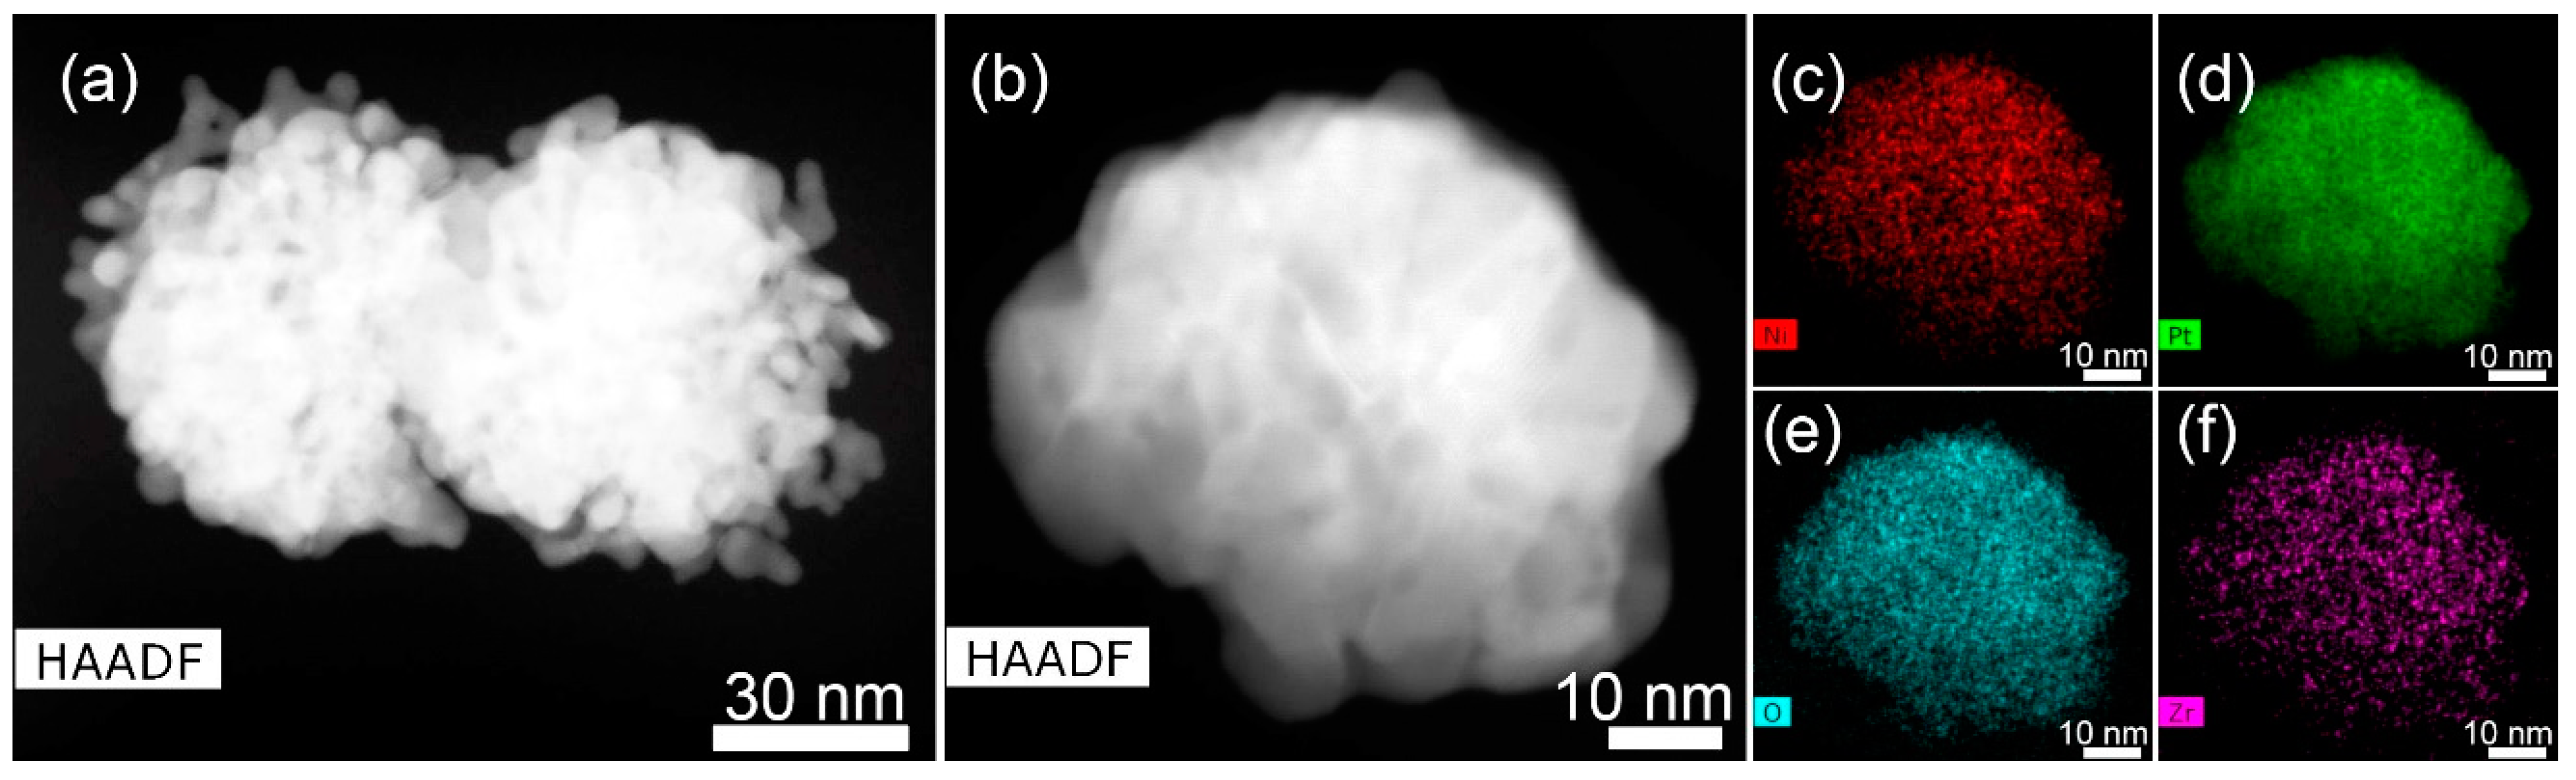
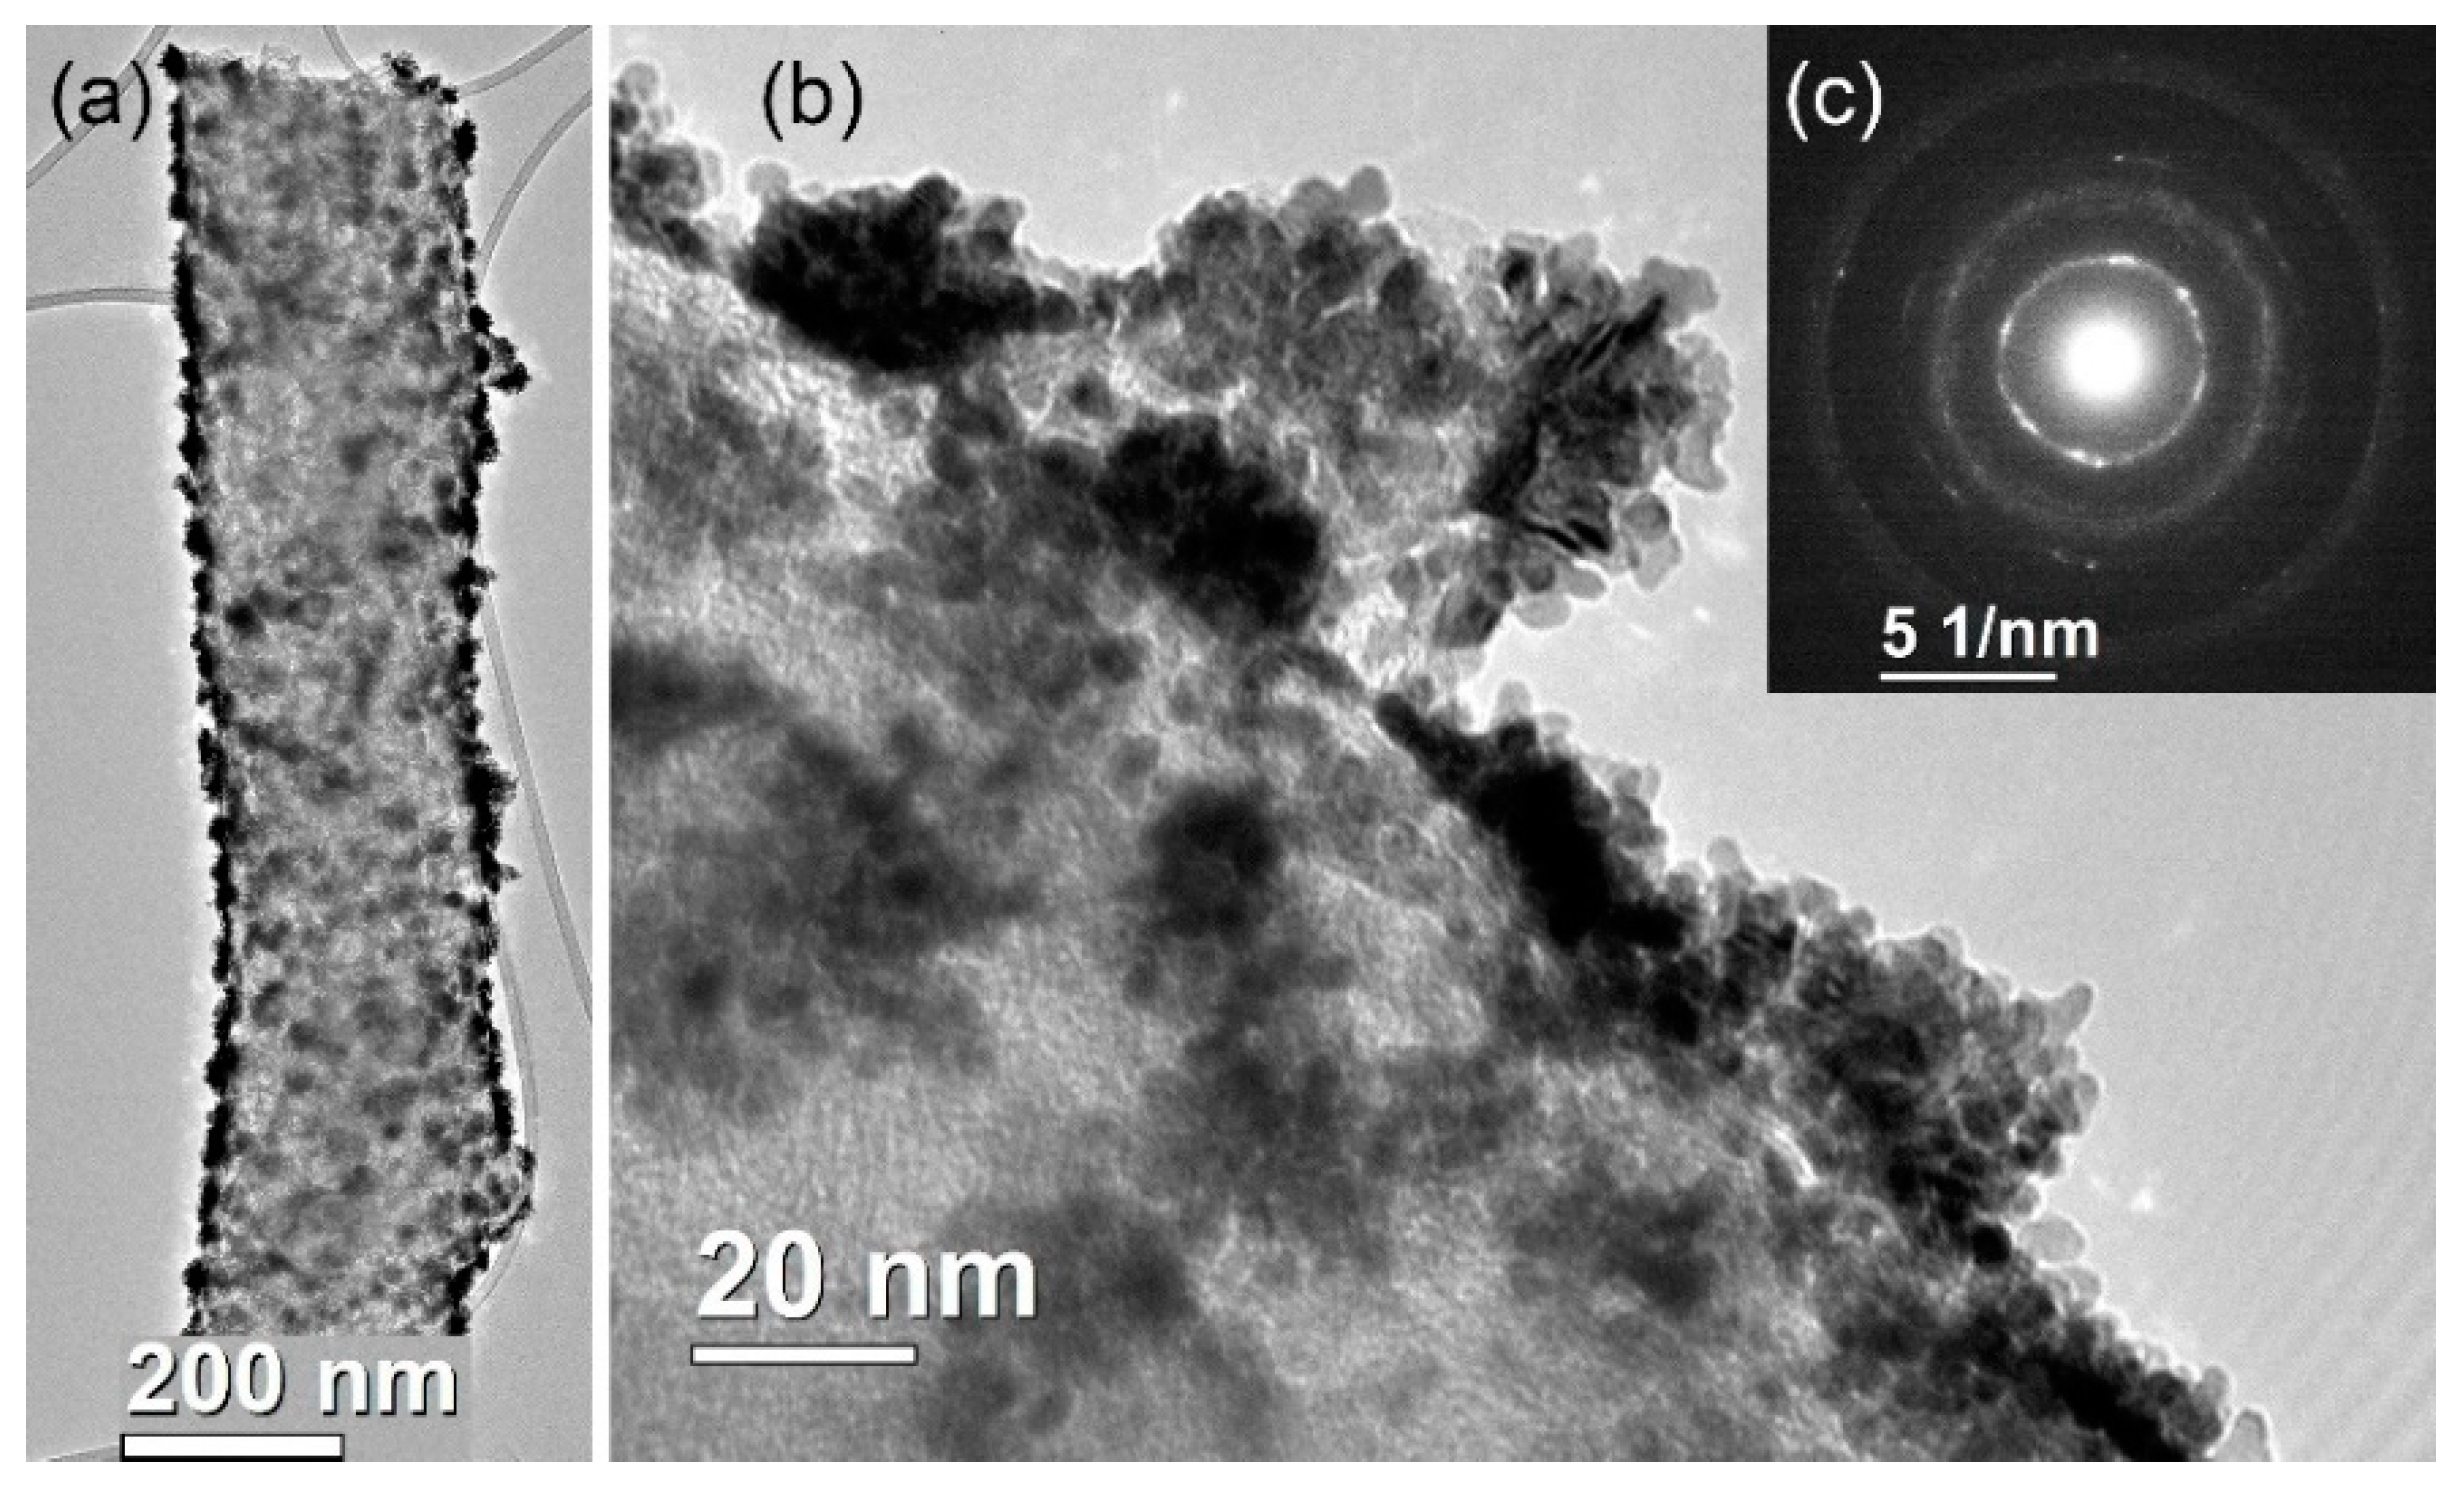
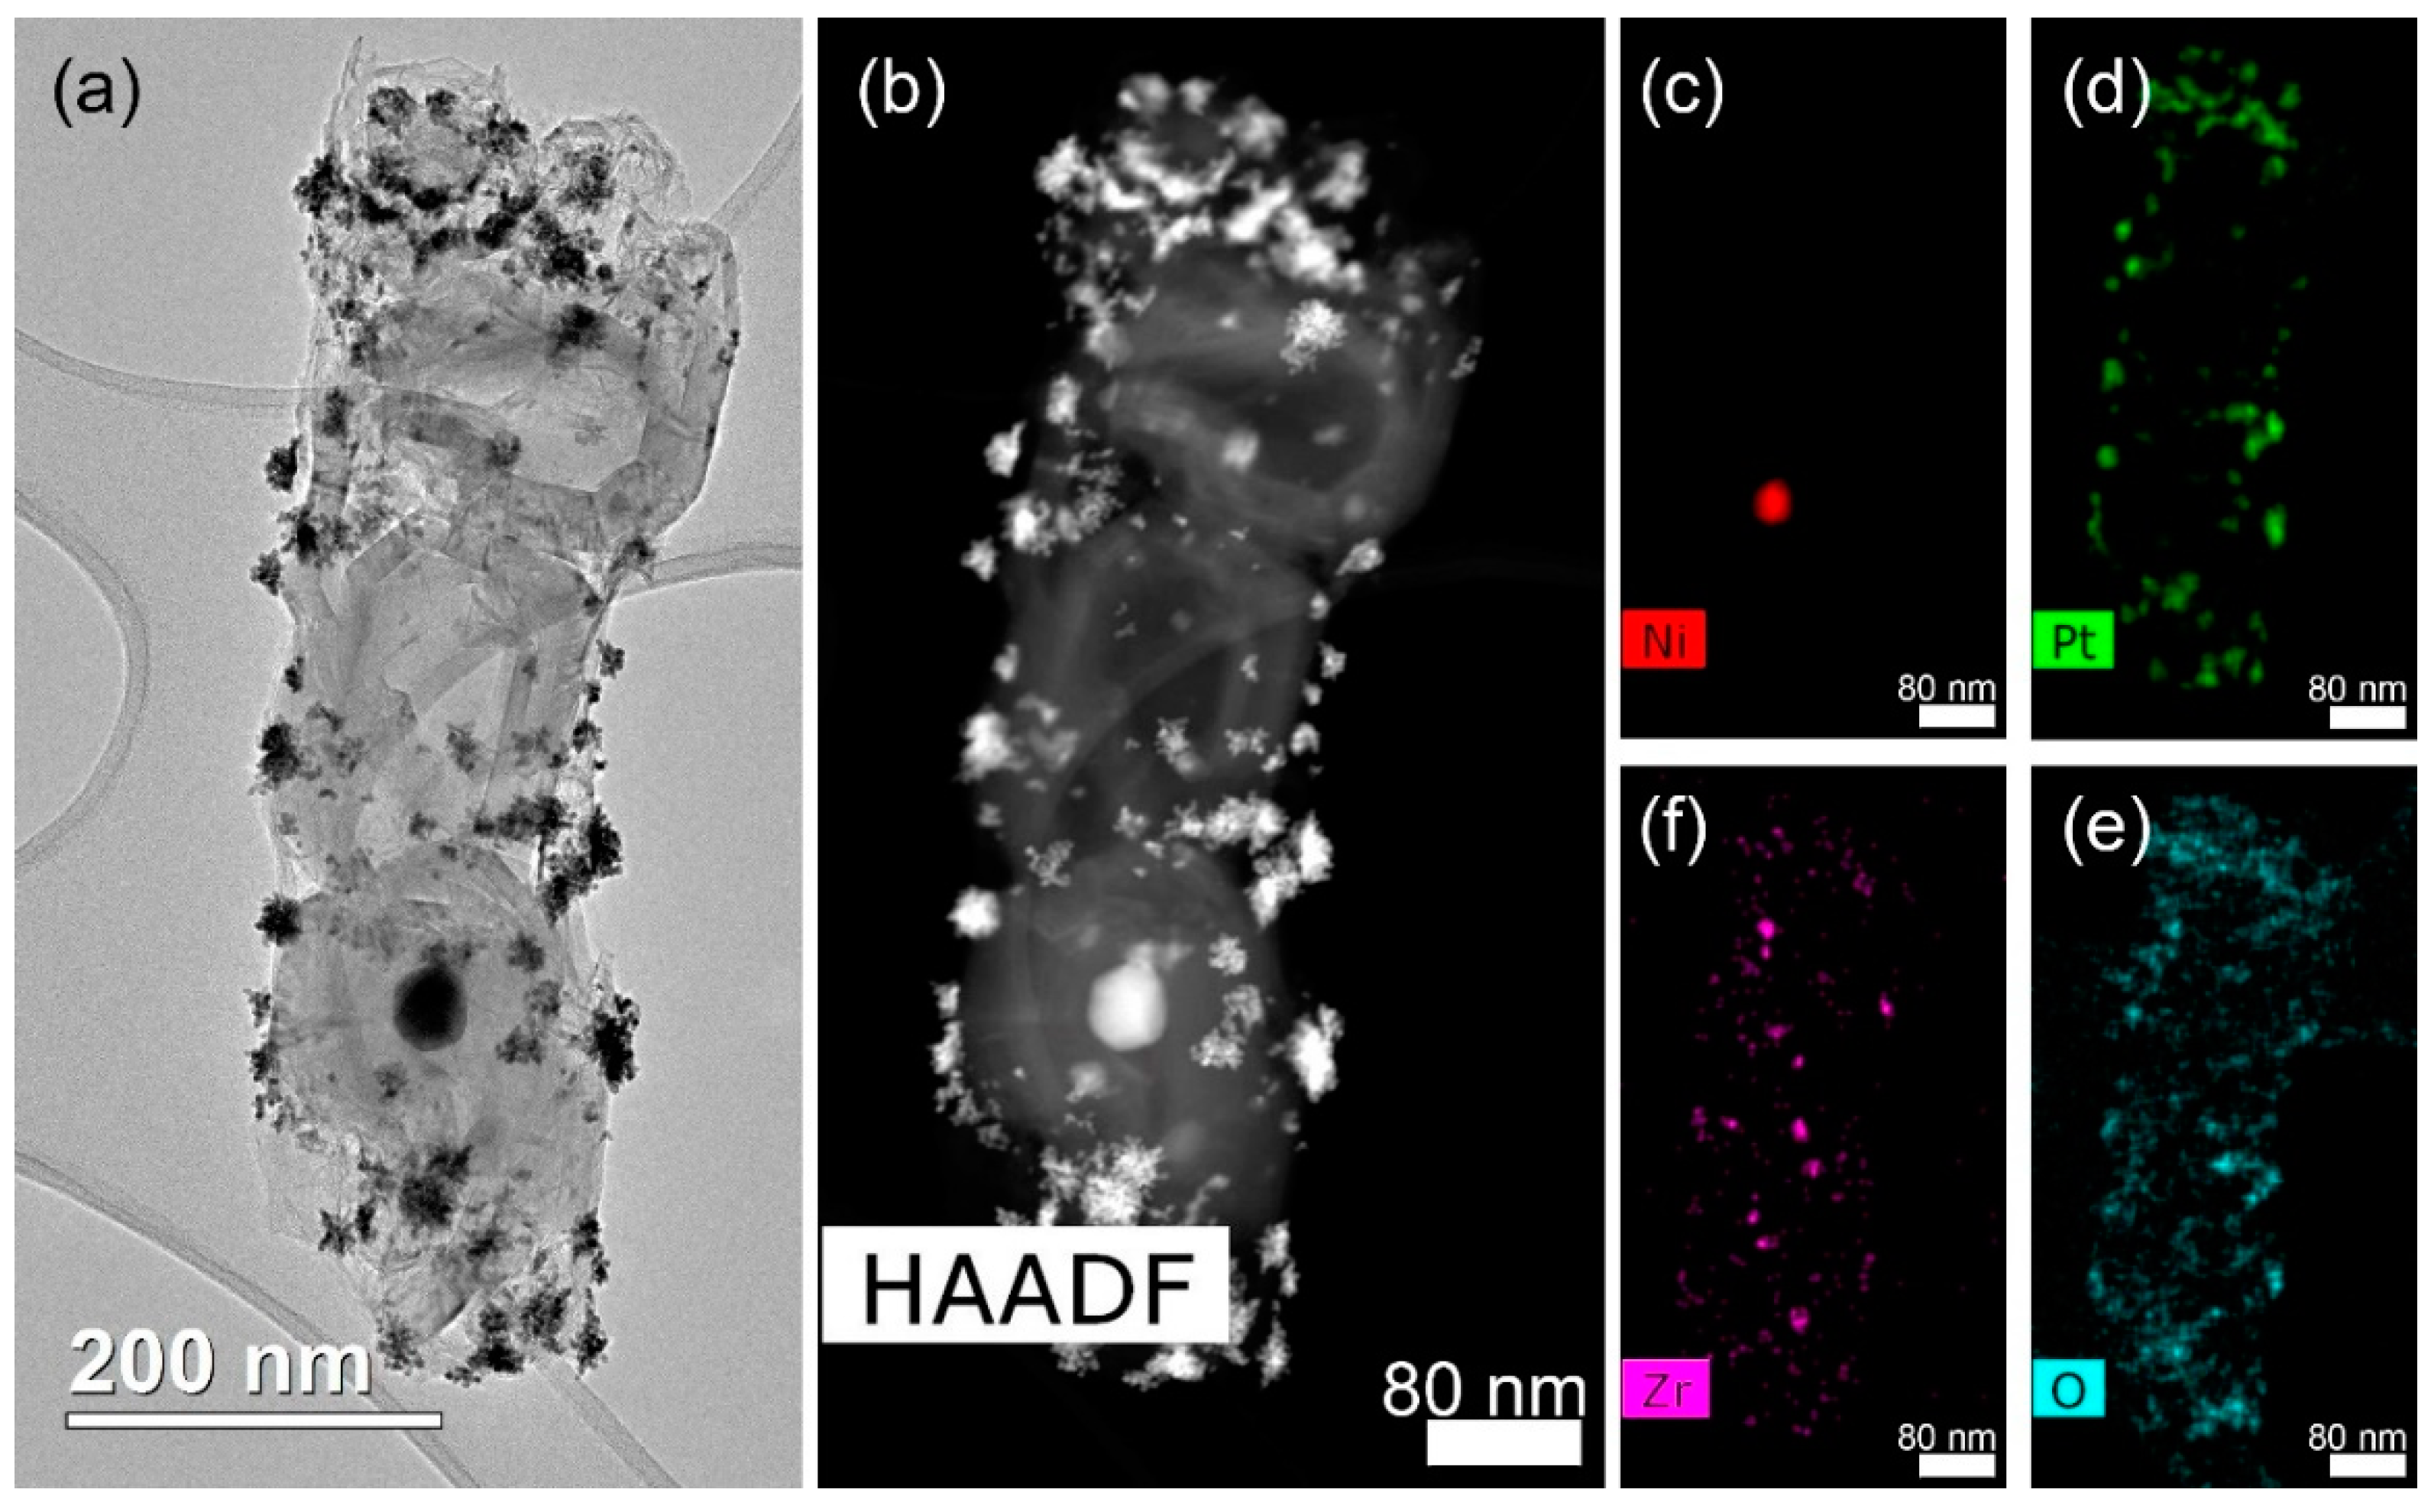
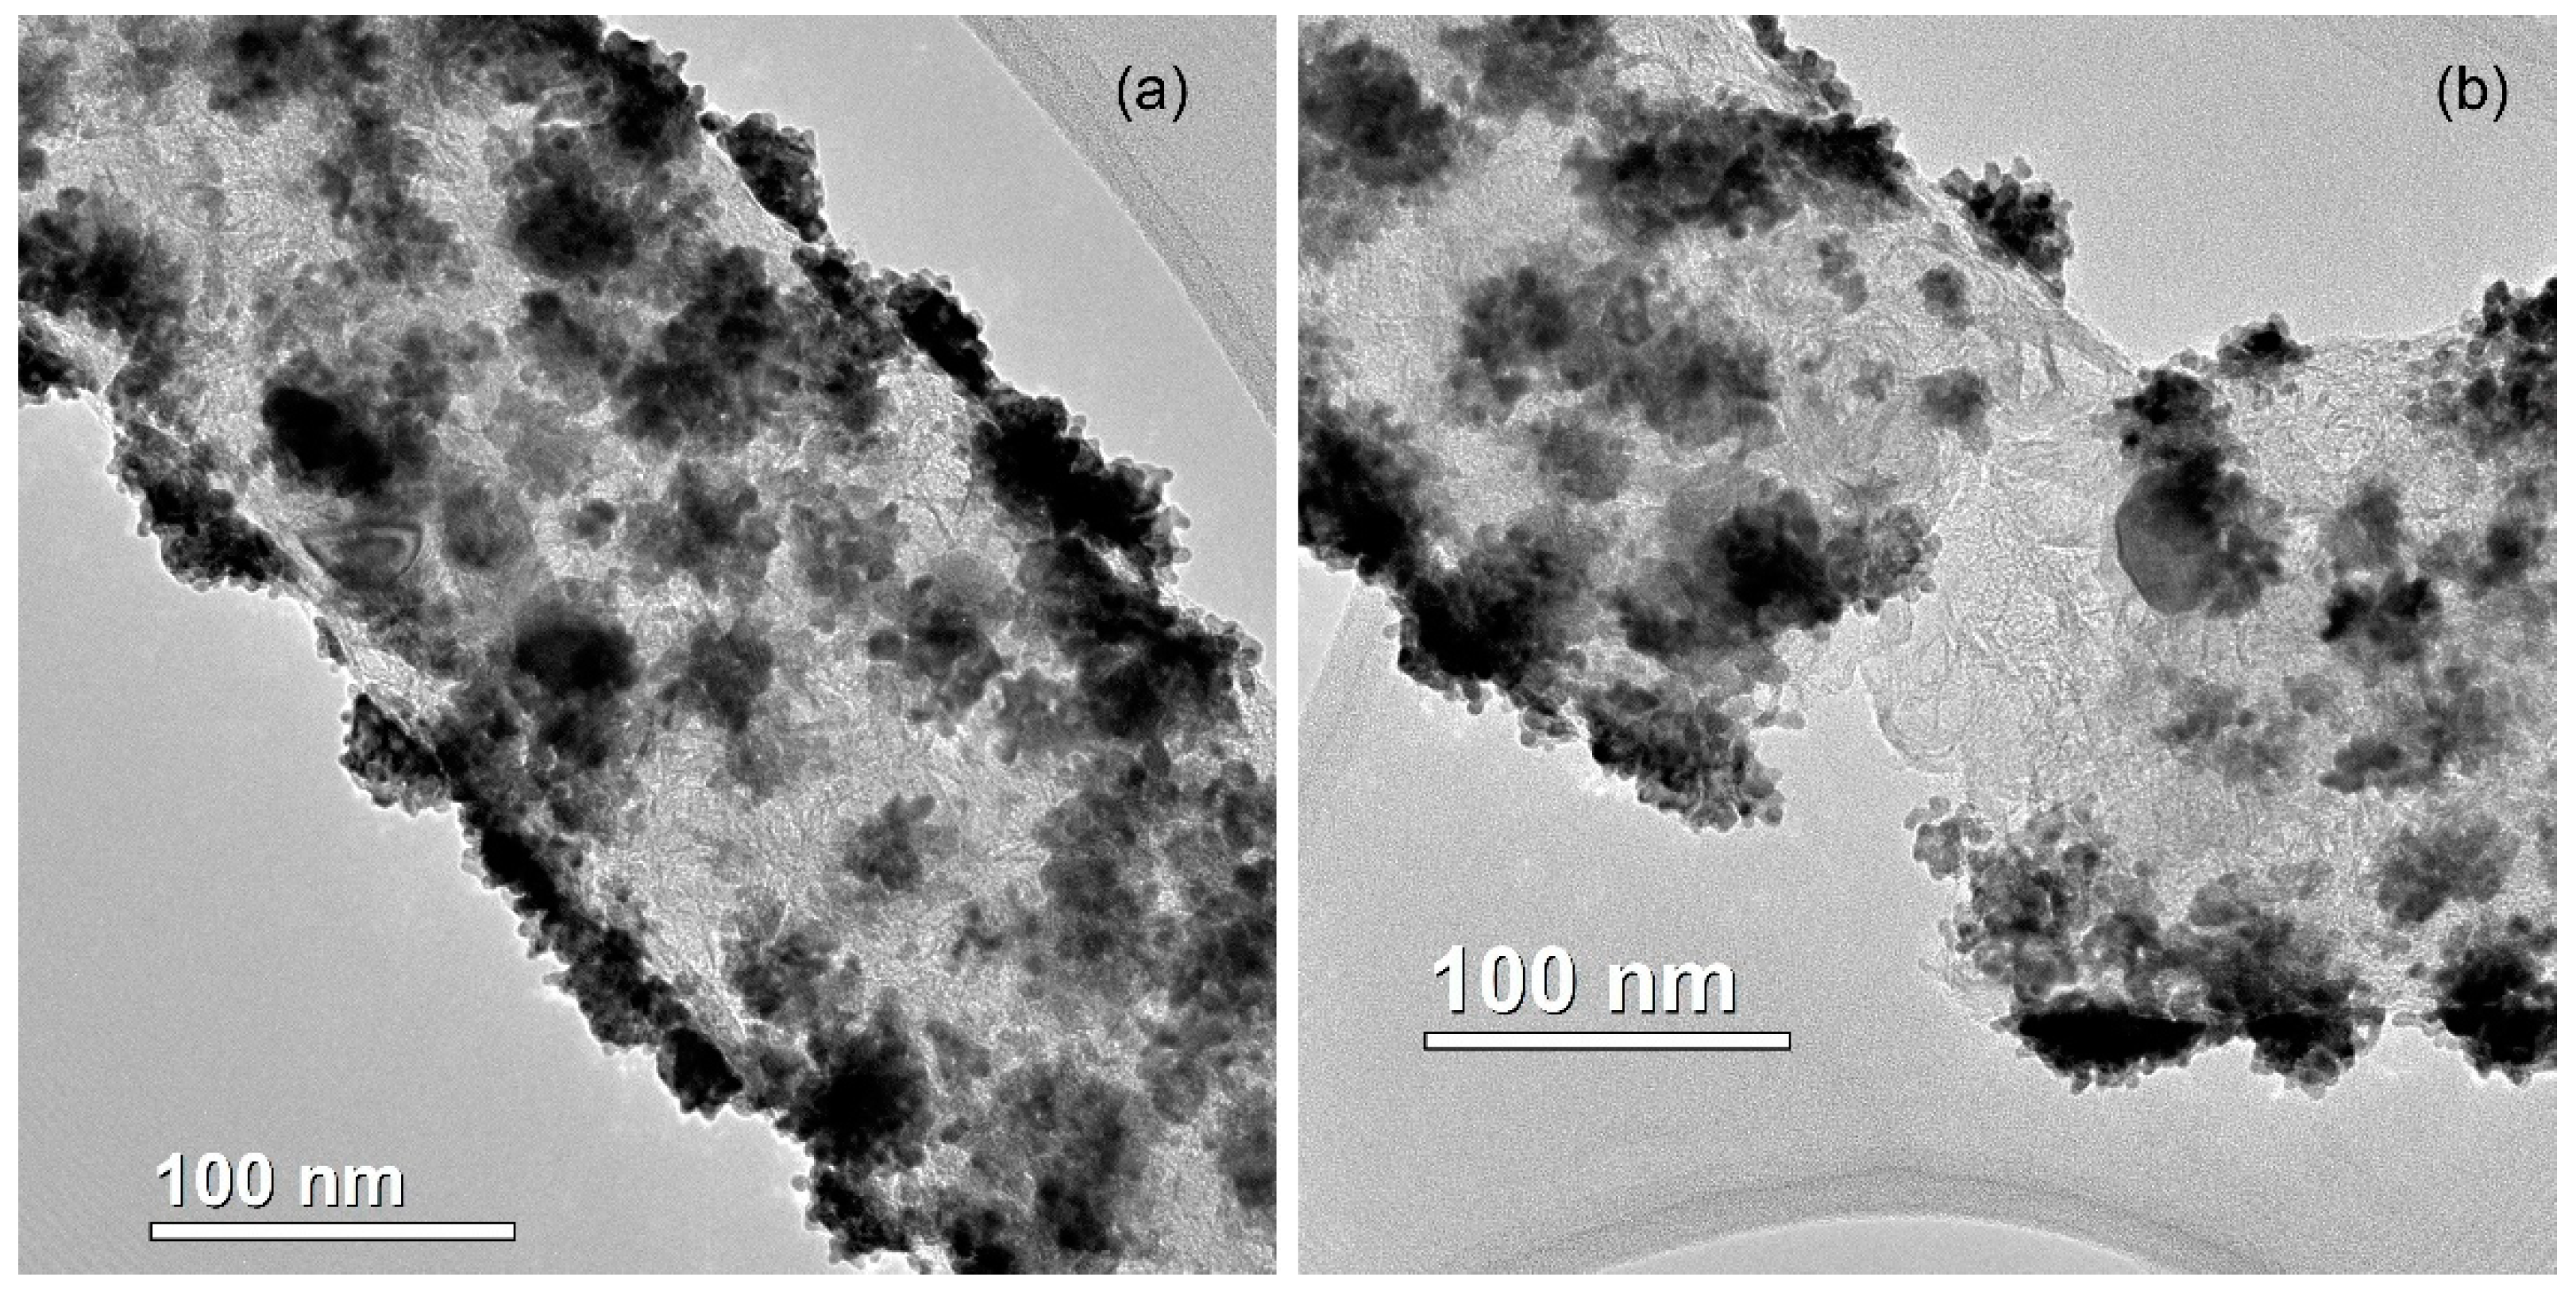
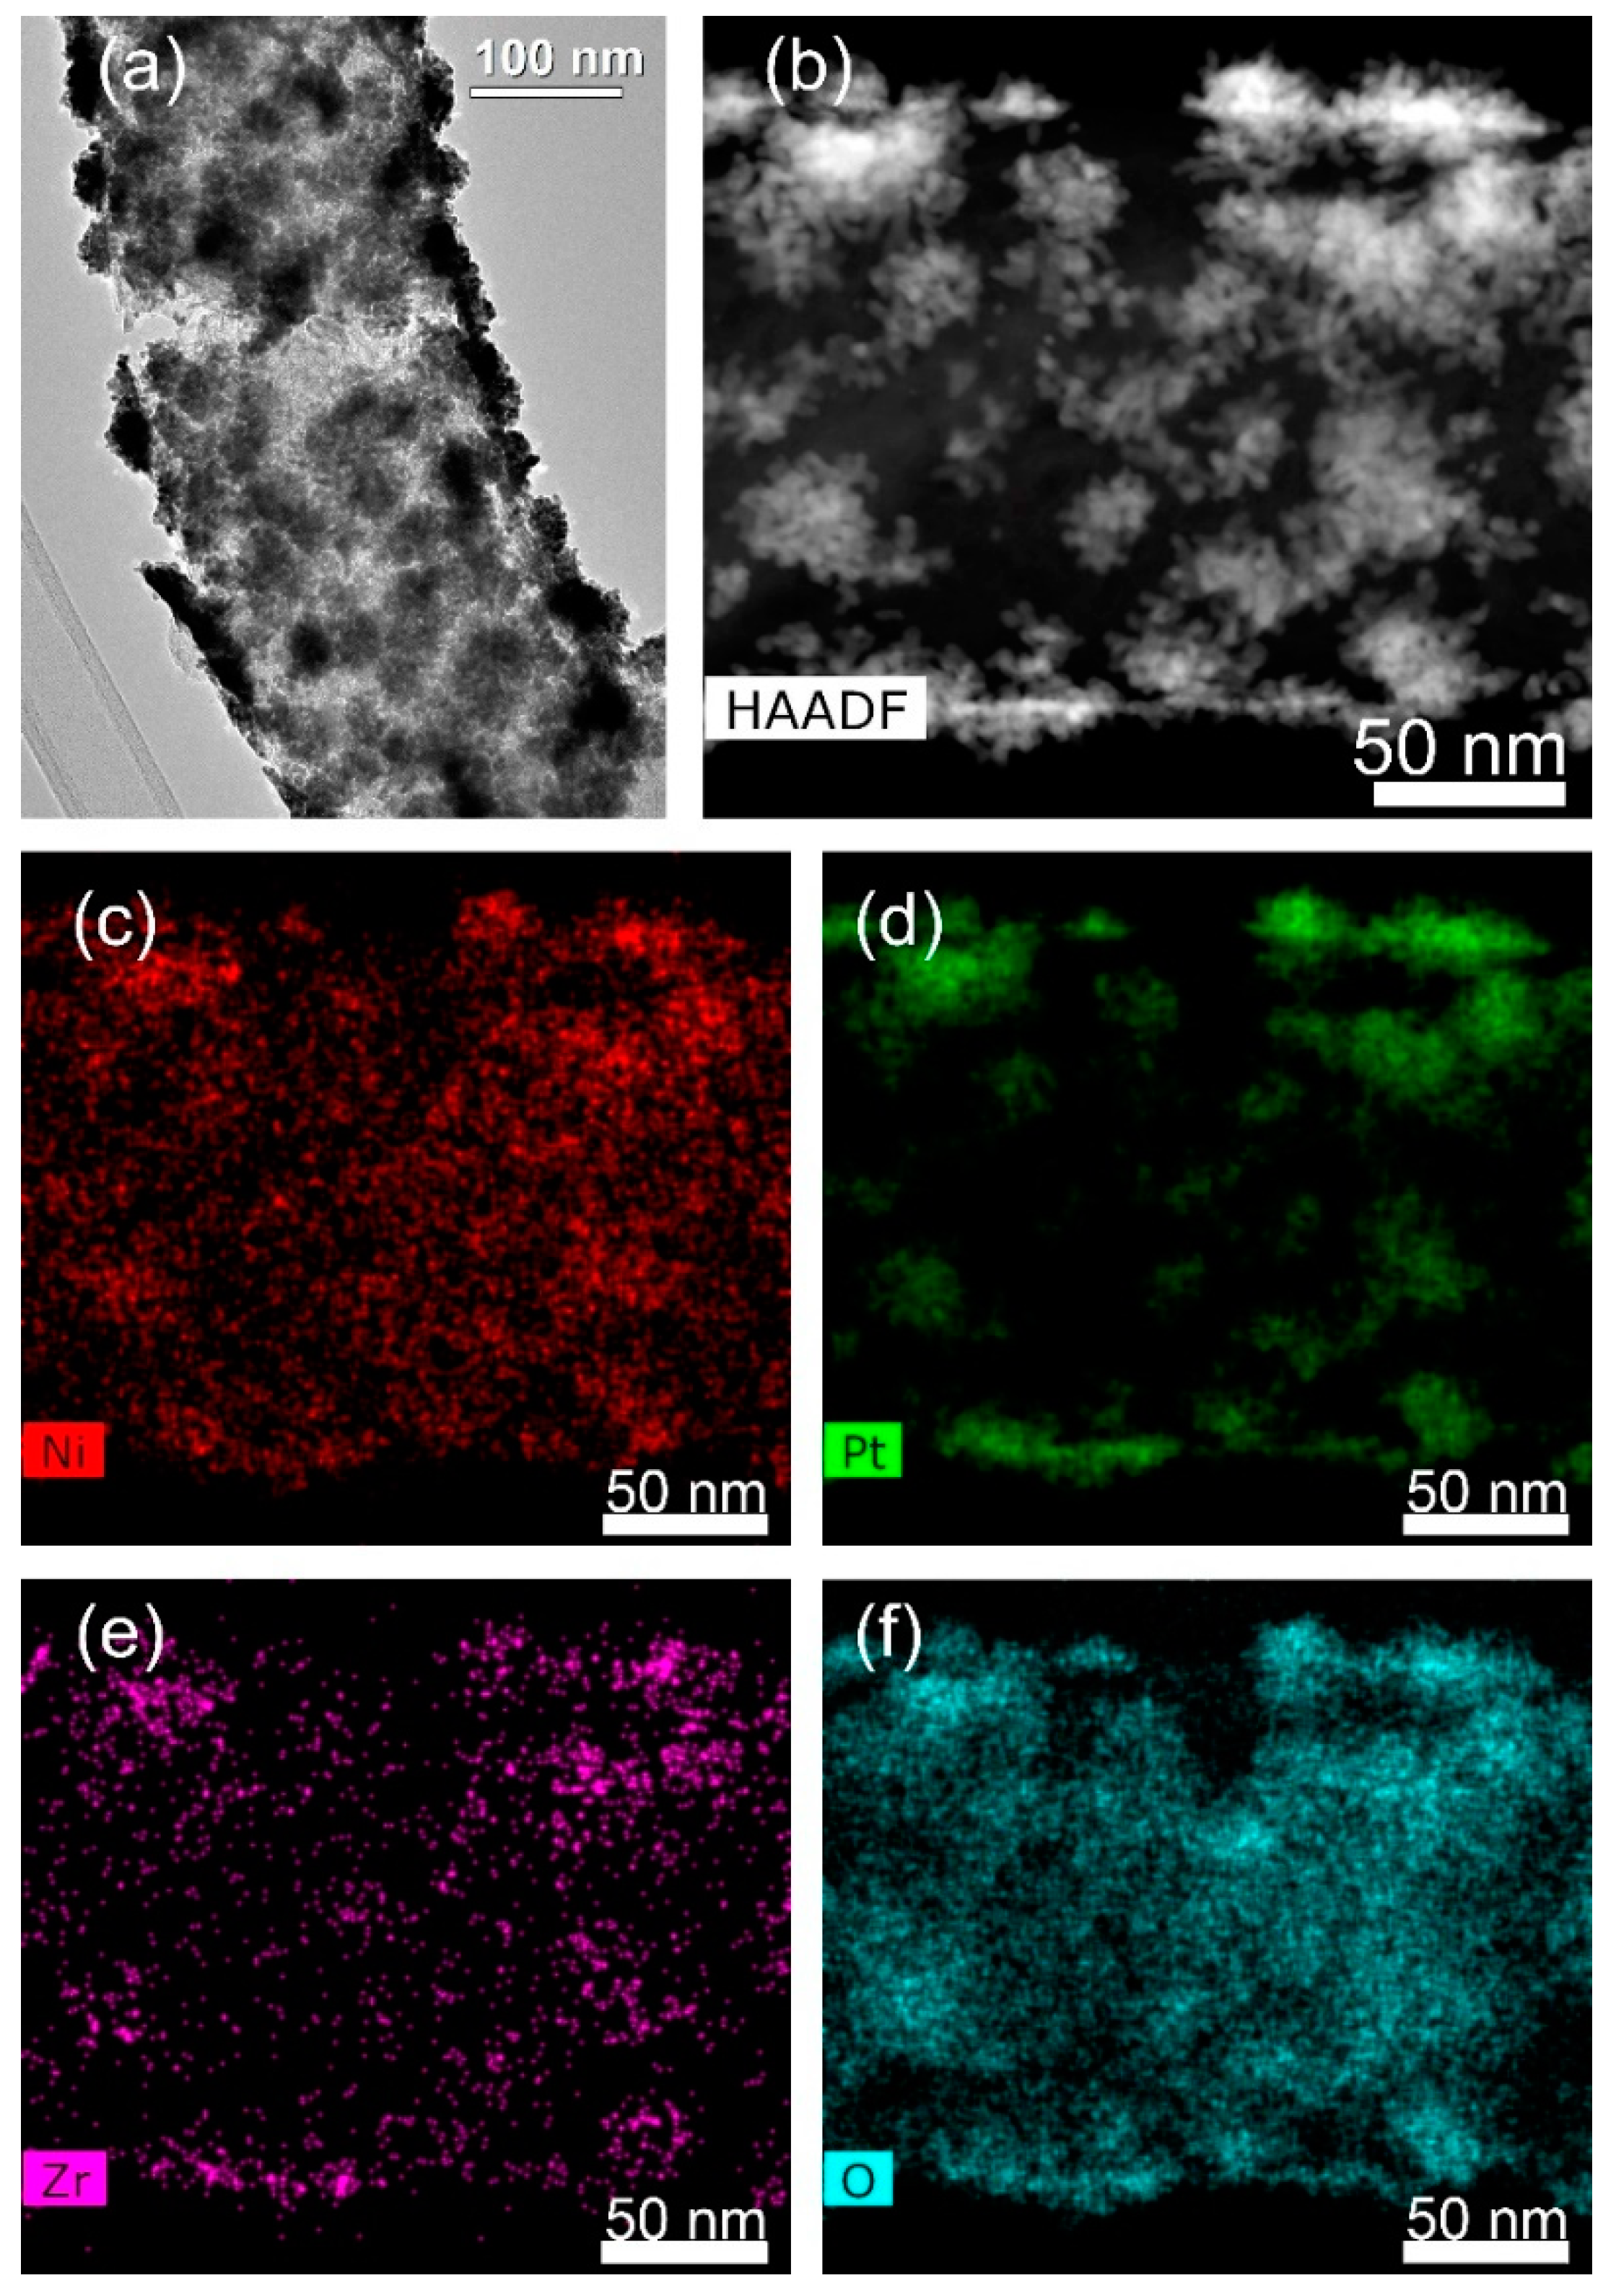
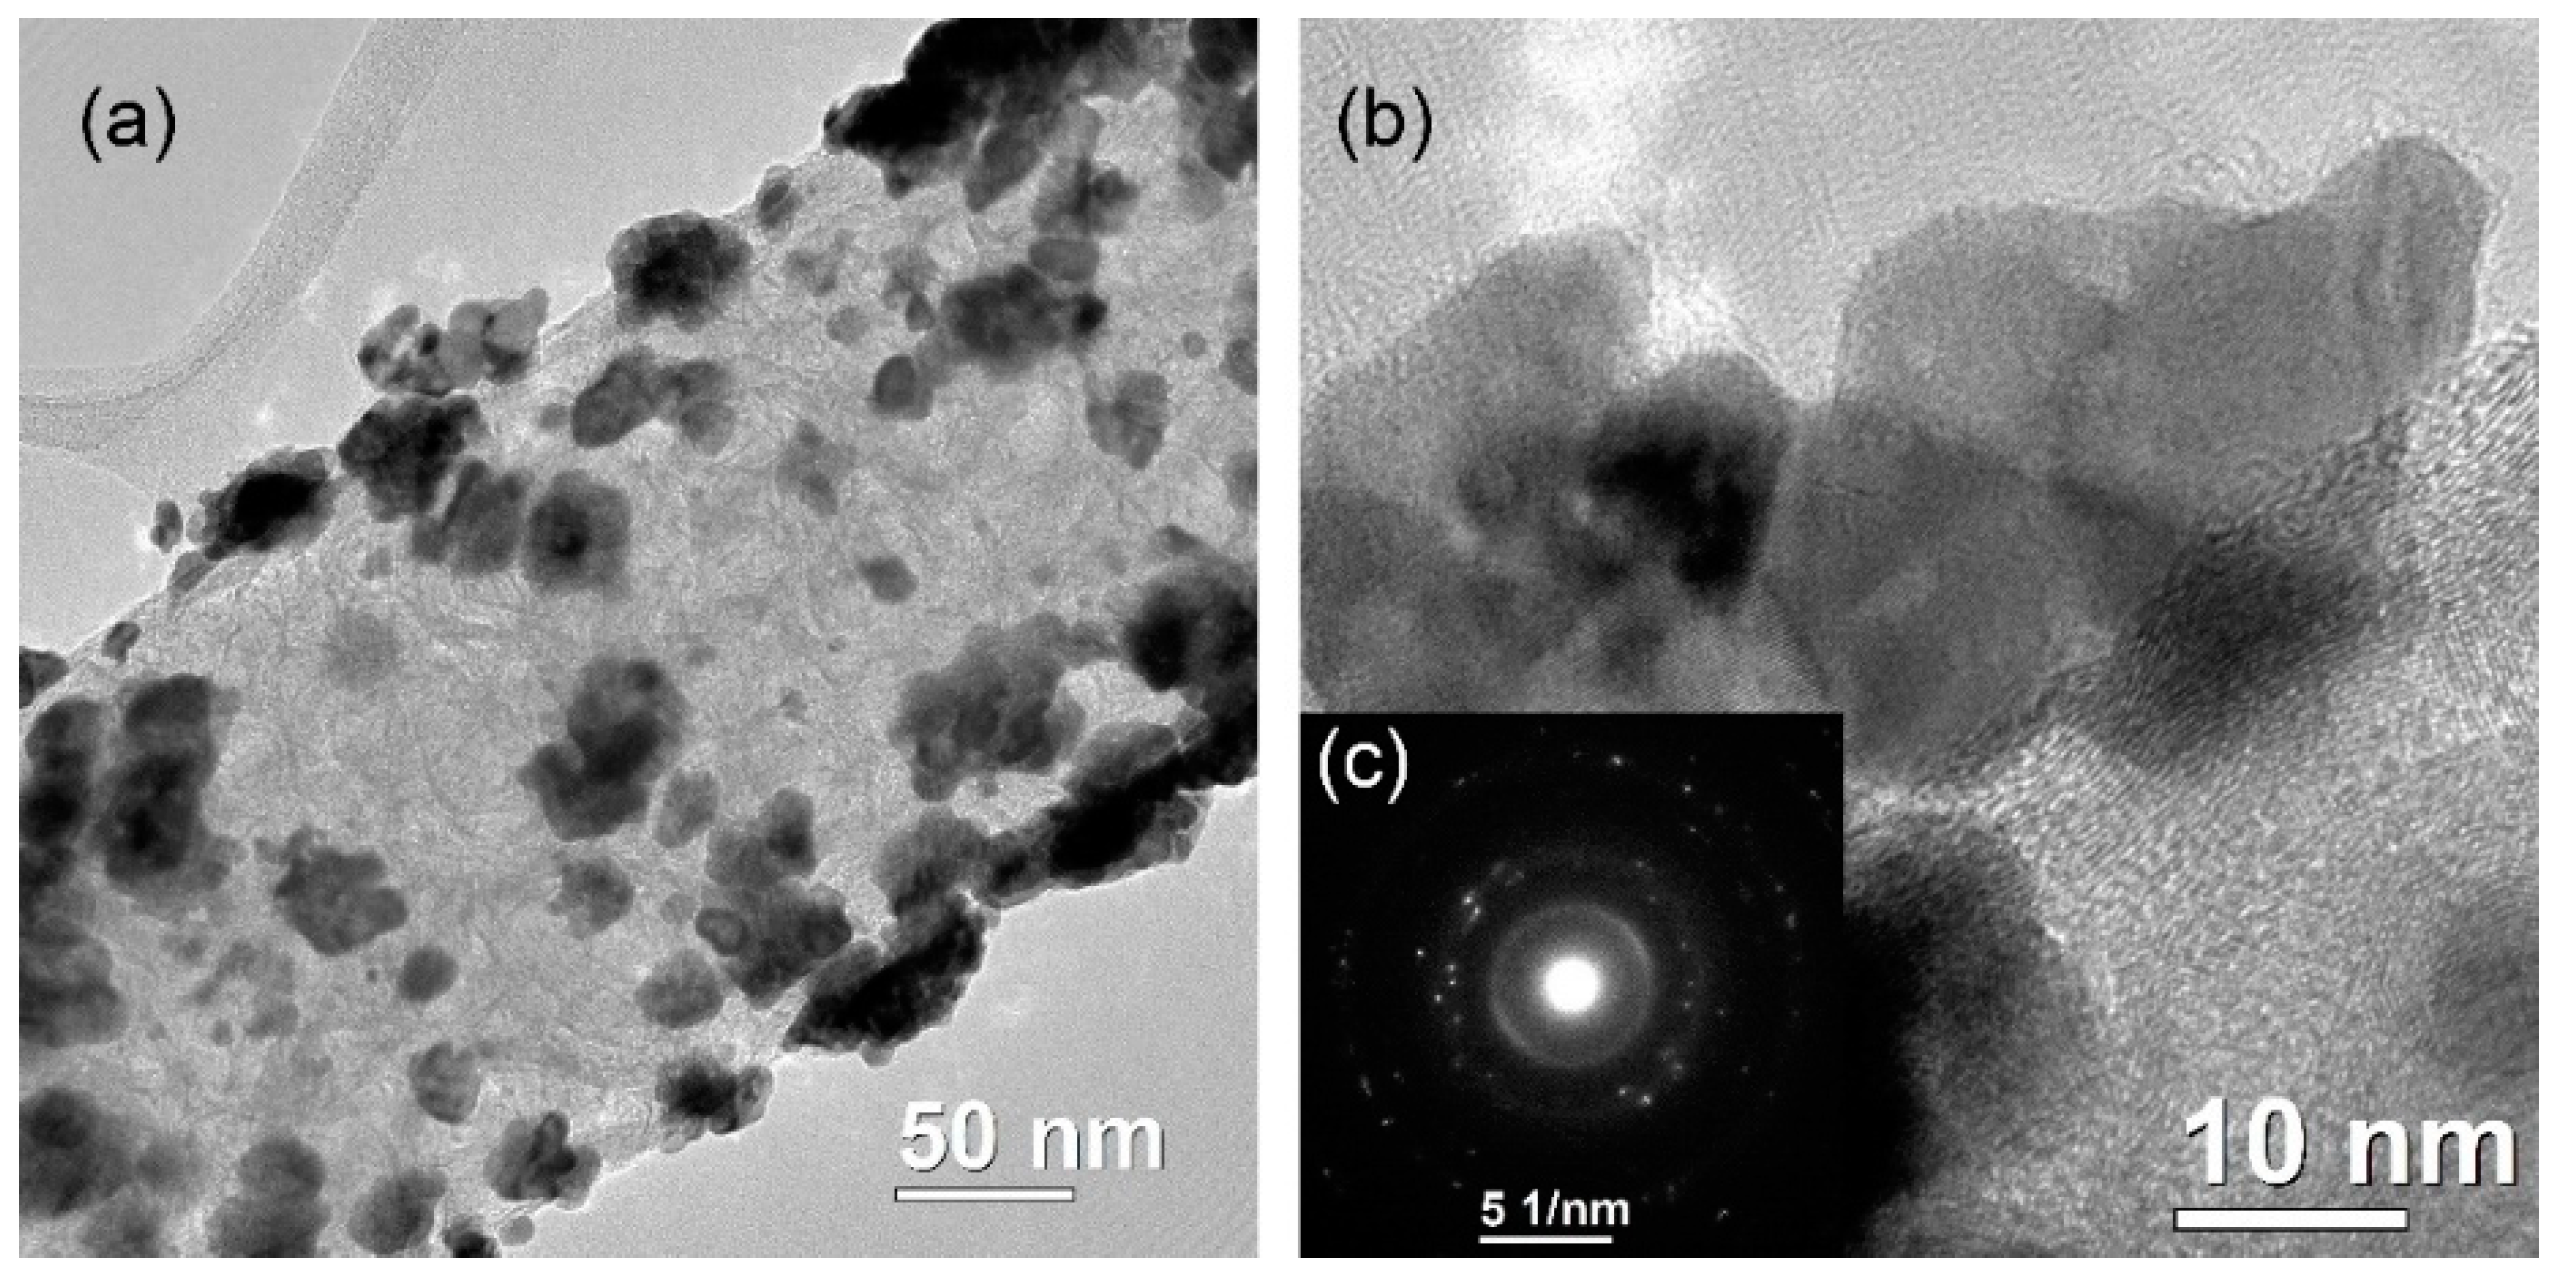
2.1. Electron Microscopy

Composite electrospun polyacrylonitrile (PAN)-based nanofibers mats were pyrolyzed either under vacuum or in an argon-hydrogen mixture. The resulting composite PAN-based CNF samples were investigated by electron microscopy right after pyrolysis or after additional post-treatment. The post-treatment was carried out either under vacuum or in argon-hydrogen mixture both at 250 and 500 °C. The obtained electron microscopy results are provided below.
BF TEM (bright field transmission electron microscopy) images of the Pt-coated CNF, pyrolyzed at 1000 °C for 2 h in an argon-hydrogen mixture, sample 1, is shown in Figure 1.
Sample 1 was formed by deposition of Pt nanoparticles on sample A (sample A was obtained by pyrolysis in an argon-hydrogen mixture of the electrospun nanofiber mat). CNF structure of different nanofibers is different. Some of them possess a smooth surface (Figure 1); the others show well-pronounced crystalline structures. Platinum nanoparticles form crystal agglomerates of random shapes up to 10 nm (Figure 1b) in size on the CNF surface. The elemental distribution maps of platinum, nickel, zirconium and oxygen obtained by scanning transmission electron microscopy (STEM) with a high angle annular dark field (HAADF), and the corresponding energy dispersive X-ray spectroscopy (EDX) spectrum are provided in Figure 2.
After additional heat treatment of sample 1 at 250 °C in argon-hydrogen flow (sample 2), no noticeable changes in the nanofiber structure and platinum morphology were found. In Figure 3, BF TEM images of CNF, Pt agglomerate and selected area electron diffraction (SAED) pattern are shown.
Figure 4 shows element distribution in an agglomerate of nanoparticles.
Considering the elemental distribution maps shown in Figure 4, it can be concluded that nickel, zirconium and oxygen are present not only in the nanofiber body but also in places where Pt agglomerates are located. The quantitative EDX analysis results of the chemical content of the agglomerate from Figure 4 are shown in Table 1.
With an increase in the heat treatment temperature of the pyrolyzed sample 1 to 500 °C (sample 3), significant changes occur in both the nanofiber structure and in the particle morphology and distribution. The fiber degree of crystallinity increases noticeably, which is clearly seen from TEM and high resolution (HR) TEM images and selected area electron diffraction (SAED) patterns: rings from CNF become sharper. As can be seen from Figure 5 and Figure 6, nickel is present as individual particles of dozens of nanometers in size.
At the same time, nickel is still distributed over the nanofiber surface. Platinum conglomerates acquire a more rounded shape (Figure 5a or Figure 6a). In the area of platinum conglomerates, some elemental redistribution occurs. Platinum, zirconium, oxygen and, partially, nickel, are localized in the same places; however, nickel is also localized as individual nanoparticles of dozens of nanometers in size. The morphology of the large Ni-containing nanoparticles can be different: faceted nanoparticles and rounded nanoparticles (Figure 6).
For additional heat treatment of sample 1 under vacuum at 250 °C (sample 4) or 500 °C (sample 5), in contrast to the heat treatment in argon-hydrogen flow, a uniform zirconium and nickel distribution over the CNF body was found. The effect is observed not only for 250 °C heat treatment but also for 500 °C. A significant part of the nanofibers possesses a smooth surface, while there are no large pores. In the obtained SAED patterns, characteristic “arcs” are observed (Figure 7). It signifies that pyrographite layers are oriented along the nanofibers, and graphene layer sets are absent. For 500 °C (sample 5), crystal Pt agglomerates acquire smoother borderlines (Figure 8), compared with sample 4, as in the previous case for sample 3.
Table 2 and Table 3 present the quantitative EDX analysis results of chemical composition of Pt agglomerates from Figure 8a (sample 4) and b (sample 5).
As can be seen from Table 2 and Table 3, the content of nickel and zirconium is lower, compared with sample 2. The nickel and zirconium content values decrease even more with an increase in the heat treatment temperature to 500 °C (sample 5).
A very different nanofiber structure was obtained in the case of vacuum pyrolysis of the composite polyacrylonitrile-based nanofibers. Platinum deposition on sample B (obtained by vacuum pyrolysis of the electrospun nanofiber mat) results in sample 6. TEM and STEM images of a CNF fragment (Figure 9 and Figure 10) show that the nanofiber structure is fully crystalline.
The nanofiber consists of graphene layer sets which form loops and pores in the nanofiber body with a size up to 100 nm. The formation of such a nanofiber structure is described in more detail in our previous studies [27]. A distinctive feature of the structural state of the samples is the most uniform distribution of platinum nanoparticles over the nanofiber surface.
At the same time, nickel forms large individual particles in many places of the nanofiber body (Figure 10b,c). For example, an individual large Ni-containing nanoparticle of ~50 nm in size is shown in the elemental map (Figure 10c). The maximum particle size may reach 150–200 nm. Thus, here, Ni is not uniformly distributed everywhere over the nanofiber surface. Zirconium forms nanoparticles of a much smaller size (up to 15 nm) compared with nickel, but larger than in the samples pyrolyzed in argon-hydrogen flow. Their location partially correlates with platinum location. Some of them are located on the nanofiber surface. As for platinum, its agglomerates are usually distributed more evenly over the surface of the nanofibers and consist of rounded particles or crystal petals of elongated shape growing from the nanofiber surface.
An additional post treatment in argon-hydrogen flow at 250 and 500 °C (samples 7 and 8, respectively) does not result in any significantly different nickel and zirconium distribution (Figure 11 and Figure 12). Pt agglomerates acquire a more rounded shape after heat treatment at 500 °C (Figure 12, sample 8), as it was shown for the previous case.
Additional heat treatment under vacuum at 250 °C (sample 9) does not result in noticeable changes in the composite structure. It should be noted that Pt nanocrystals retain their most uniform distribution over the CNF surface (Figure 13), which has already been achieved for vacuum pyrolysis.
The agglomerates consist of more dispersed particles of rounded and elongated shape. In the case of heat treatment at 250 °C, the particle size is no more than 10 nm. If the heat-treatment temperature is increased up to 500 °C (sample 10), Pt nanoparticles become larger in size and lose shape anisotropy (Figure 14 and Figure 15).
The results of the quantitative EDX analysis of the agglomerate chemical content after vacuum heat treatment at 250 °C (sample 9) are provided in Table 4.
In some areas of the nanofibers, after additional heat treatment at 250 °C (sample 9), nickel still remains uniformly distributed over the nanofiber. Another part forms crystals up to 150 nm in size. After additional heat treatment at 500 °C (sample 10), the areas with uniformly distributed nickel disappear (Figure 15). Zirconium distribution remains uniform, as it was observed in all previous cases, at any heat-treatment temperature (Figure 14 and Figure 15).

2.2. Cyclyc Voltammetry

Electrochemically active specific surface area (ECSA) of platinum was obtained from cyclic voltammetry (CV) experiments for platinized samples (samples 110).
The voltammograms of samples 110 are shown in Figures S1–S10. As it is seen from Table 5, the Pt ECSA values are higher in the case of vacuum pyrolysis. The possibility of HT-PEM fuel cell MEA operation, polarization curve and power density data are shown in Figure S11.

3. Discussion

One of the serious problems of platinum deposition on carbon supports is non-quantitative Pt deposition when some parts of platinum are lost. As a result, the necessity to control final Pt content appears as a part of platinum deposition process. A decrease in the losses is one of the important problems for electrocatalyst development because it may decrease the fuel cell total cost. Ascorbic acid (Figure 16) contains isolated hydroxyl groups.
It was found that the Pt deposition process proceeds quantitatively when composite polyacrylonitrile-based CNF mats are used as support. It may happen because ascorbic acid is quite acidic due to the ascorbate ion resonance stabilization, therefore, ascorbic acid can coordinate platinum ions and the surface of the composite CNF, leading finally to the better attachment of the Pt nanoparticles to the CNF surface. In our previous studies [26,28], it was shown that Zr and Ni are mostly in forms of ZrOx and Ni0 in pyrolyzed polyacrylonitrile-based composite CNF. The coincidence of Zr and Pt in addition to Ni on elemental maps may suggest the mentioned mechanism of Pt attachment. It should be noted that the coincidence of Pt and Ni was already observed in our previous studies when Ni0 played a role of “seeds” for platinum deposition (reduction) with formic acid. However, the coincidence of Pt and Zr was never observed before, since Zr was in a form of ZrOx and was not able to play a role of “seeds” for platinum deposition. In the given study, the coincidence of these three elements on elemental maps and confirmed by the EDX data allows the suggestion that an additional mechanism of platinum deposition when ascorbic acid coordinates both platinum ion and ZrOx nanoparticles. As a result, Pt and Zr become close on elemental maps, however, electrical conductivity between Pt and CNF is not disturbed, as it is seen from the microscopy data where Pt nanoparticles are placed on CNF in contact with carbon material.
A comparison of samples 1 and 6 with different pyrolysis reveals much more crystalline CNF in the case of vacuum pyrolysis. It can be explained that the graphitization process in vacuum proceeds faster compared with argon-hydrogen (7 vol.%) flow, where hydrogen may reduce carbon atoms preventing or impeding the graphitization.
According to cyclic voltammetry, Pt nanoparticles deposited on more crystalline CNF samples (610) possess higher electrochemically active surface areas, which may be related to better accessibility of Pt nanoparticles in more crystalline CNF with higher graphitization degree. These values may be appropriate for HT-PEMFC applications, since the CV measurements are performed at room temperature in a sulfuric acid solution, but HT-PEMFC operates at 150–200 °C in phosphoric acid environment. Heat treatment at 250 °C activates the Pt nanoparticle electrocatalyst in three out of four described cases, resulting in higher Pt ECSA; however, further increases in temperature (heat treatment at 500 °C) results in a decrease in ECSA. The effect can be related to the enlargement of Pt nanoparticles, which is clearly observed in microscopy data. The nanoparticles of small size are more stable to coagulation during heat treatment if they are placed on a more developed crystalline carbon composite surface. The cyclic voltammetry and microscopy data may suggest that better performance in electrochemical power sources might be reached for sample 9 with a more crystalline CNF after vacuum pyrolysis, higher Pt ECSA and smaller Pt nanoparticles distributed on a more accessible surface.

4. Materials and Methods

4.1. Electrocatalyst Preparation

4.1.1. Electrospinning

Zirconium (IV) chloride, nickel (II) acetate and DMF (Merck KGaA, Darmstadt, Germany) were used as received. The composite polyacrylonitrile-based nanofibers were obtained by the needle-free electrospinning method from a free surface, according to NanospiderTM technology in which several jets are generated from the string, from an electrospinning polymer solution, which contained 3.25 g of PAN with Mw 150 × 103 Da, 0.1 g of Vulcan® XC72 (Cabot Corporation, Boston, MA, USA) carbon black (~3 wt.% relative to PAN), 0.03 g of zirconium (IV) chloride and 0.37 g of nickel (II) acetate well dispersed in 50 mL of DMF during 3 h in ultrasonic bath. The electrospinning was carried out on a NS Lab NanospiderTM setup from Elmarco (Liberec, Czech Republic) at relative humidity of 8 % at the voltage of 69 kV and the distance between electrodes of 190 mm. As a result, PAN/Vulcan/Zr/Ni composite nanofibers in a form of a mat were obtained. PAN/Zr/Ni nanofibers were also obtained according to the same procedure but without carbon black addition.

4.1.2. Stabilization and Pyrolysis

PAN/Zr/Ni nanofiber mat was stabilized (oxidized) at 350 °C in air for 2 h a Binder MDL 115 heating chamber (Tuttlingen, Germany) to make the material suitable for further pyrolysis. Then, the sample was pyrolyzed at 1000 °C for 2 h in an argon-hydrogen (7 vol.% of H2) flow at a heating rate of 3 °C·min−1 using a Rusuniversal PT-1200 tubular furnace (Chelyabinsk, Russia). As a result, the shape of CNF mat was saved (sample A).
PAN/Vulcan/Zr/Ni nanofiber mat was stabilized (oxidized) at 350 °C in air for 2 h a Binder MDL 115 heating chamber (Tuttlingen, Germany) to make the material suitable for further pyrolysis. Then, the sample was pyrolyzed at 1000 °C for 2 h under vacuum at a heating rate of 3 °C·min−1 using a Carbolite (CTF 12/80/700) vacuum oven (Hope Valley, United Kingdom) equipped with a Eurotherm 3216 series controller. As a result, the shape of CNF mat was saved (sample B).

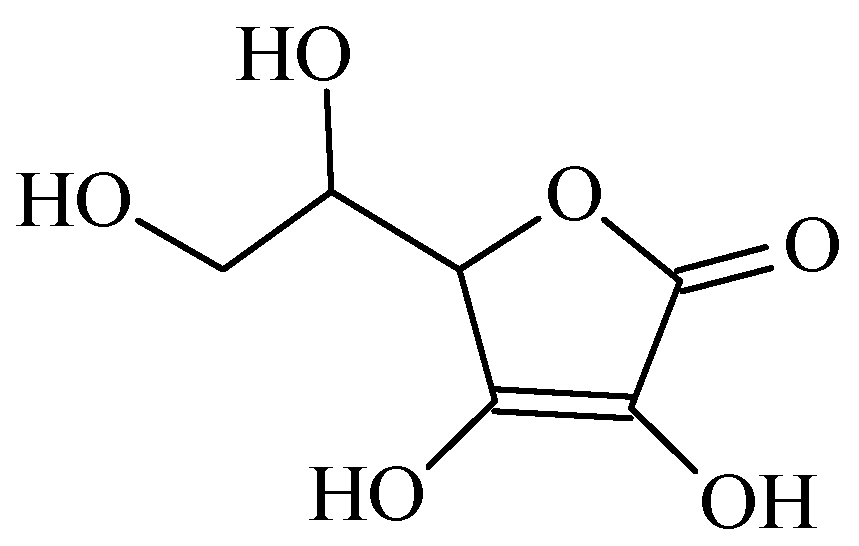
4.1.3. Platinum Deposition

Platinum deposition on the CNF mats with mass of 12.1 mg (samples A and B) and with a surface area of 6.76 cm2 was carried out separately for each mat in 10 mL of water, containing the calculated amount of H2[PtCl6]·6H2O (Merck KGaA, Darmstadt, Germany), 21.5 mg per mat, as a source of platinum in order to obtain Pt/CNF electrocatalysts with Pt concentration of 1.2 mgPt·cm−2 (8.1 mg of Pt per mat) and 1.0 g of ascorbic acid as a reducing agent for 1 day. The resulting electrocatalysts were thoroughly washed with distilled water and dried at 100 °C for 2 h under vacuum.

4.1.4. Additional Heat Treatment

Sample A was platinized resulting sample 1 and additionally heat-treated in argon-hydrogen flow for 2 h at 250 °C (sample 2) or 500 °C (sample 3). Moreover, sample 1 was heat treated under vacuum for 2 h at 250 °C (sample 4) or 500 °C (sample 5). Sample B was platinized resulting sample 6 and additionally heat treated in argon-hydrogen flow for 2 h at 250 °C (sample 7) or 500 °C (sample 8). Moreover, sample 6 was heat treated under vacuum for 2 h at 250 °C (sample 9) or 500 °C (sample 10).

4.1.5. Elemental Analysis and Electrical Conductivity

The elemental analysis was performed using an Elementar vario MICRO cube C,H,N-analyzer (Langenselbold, Germany) equipped with a thermal desorption column.
The in-plane electrical conductivities of the CNF samples A and B were found with a RLC E7-8 setup (Minsk, Belarus) equipped with a four-point probe. The sample thickness, necessary for the electrical conductivity measurements, was determined with an ElektroPhysik eXacto thickness gage (Cologne, Germany). The elemental analysis and electrical conductivity of samples A and B are shown in Table 6.

4.2. Electron Microscopy

The structure of the composite electrospun polyacrylonitrile-based carbon nanofibers was performed by transmission electron microscopy (TEM), scanning transmission electron microscopy (STEM) and EDX elemental mapping in a Thermo Fisher Scientific Osiris (Waltham, MA, USA) equipped with a high angle annular dark field (HAADF) detector and Super-X EDX detection system, based on silicon drift detector (SDD) technology. For electron microscopy investigations, the samples of CNF mats were dispersed in acetone using ultrasonic bath for 20–30 min to separate fibers. The obtained suspension was dropped onto Cu lacey carbon TEM grids.

4.3. Cyclic Voltammetry

Measurements of the ECSA of platinum of the obtained platinated materials were described in detail in our previous study [26]. Briefly, the ECSA values in the synthesized electrocatalysts were evaluated by electrochemical hydrogen adsorption/desorption measurements [43,44]. Hydrogen atoms on Pt surface were produced by electrochemical reduction of H+ from aqueous 0.5 M H2SO4 electrolyte. The number of surface atoms at polycrystalline Pt was evaluated from the charge related to oxidation of adsorbed hydrogen in the potential range 0–0.4 V versus standard hydrogen electrode (SHE), using a stoichiometry of one adsorbed H atom per single surface Pt atom. The measurements were performed at room temperature in a three-electrode cell with separated compartments. Platinum wire and Hg/Hg2SO4 saturated K2SO4 (0.64 V vs. SHE) were used as the counter and reference electrodes, respectively. The working electrode was a polished graphite disk (diameter of 1.6 cm2) in a polytetrafluoroethylene (PTFE) holder. A thin layer of the catalyst was coated the surface of the disk electrode by placing 100 µL aliquot of the catalyst ink. Catalyst inks were prepared by ultrasonically dispersing 2 mg of a catalyst in 1 mL of isopropanol containing 0.01 mL of 10 wt.% Nafion solution. Fifty cycles of voltammetry at 50 mV s−1 were applied and the last cycle was examined. The ECSA values was evaluated by integration of the hydrogen desorption areas of the cyclic voltammograms (CV) assuming 0.21 mC (cmPt)−2. The voltammograms are shown in Supplementary Materials. In Figure S1, the area that was used for ECSA evaluation is dashed.

4.4. Ascorbic Acid Assisted Pt Deposition and Losses

Platinum deposition on the CNF mats (12.1 mg, with area of 6.76 cm2) was carried out in aqueous solution (10 mL) with 21.5 mg of H2[PtCl6]·6H2O and 1.0 g of ascorbic acid. The final loading of platinum was 1.2 mgPt·cm−2 per mat (8.1 mg of Pt). The deposition was repeated 4 times for sample A and 4 times for sample B. Total Pt loading was 8.1 mg for each mat with <1% error.

4.5. HT-PEM Fuel Cell Operation

Standard Arbin Instruments (College Station, TX, USA) were used for Pt/CNF cathode testing at 180 °C. The MEA included the PBI-OPhT membrane cross-linked with zirconium acetylacetonate and doped with phosphoric acid (350–400%, up to 25 molecules of o-phosphoric acid per polymer unit), which was developed earlier in our group [45]; commercial Celtec®-P Series 1000 MEA anode with Pt deposited on carbon black Vulcan® XC-72 with the total platinum loading of 1 mg cm–2 [46], and Pt/CNF (sample 6) cathode. The resulting MEA with the MEA working surface area of 5 cm2 was placed between graphite plates. From the anode side, hydrogen obtained by electrolysis in a GVCh-6 hydrogen generator (Khimelektronika, Moscow, Russia) was supplied; from the cathode side, atmospheric air was supplied; the gases were supplied at atmospheric pressure without additional humidification.

5. Conclusions

CNF mats were obtained by the NanospiderTM technology electrospinning with following pyrolysis. After ascorbic acid-assisted Pt deposition, thermal post-treatment of Pt/CNF was carried out to find ways to tailor Pt/CNF properties. Pt nanoparticles are of <10 nm in size, however, they may agglomerate depending on treatment and post-treatment conditions. The quantitative ascorbic acid-assisted deposition of Pt onto electrospun polyacrylonitrile-based CNF composite materials is shown for the first time. Using the presented approach, it is possible to minimize the loss of platinum through the platinum deposition process, which becomes essentially important in the electrode production for various electrochemical power sources.

Supplementary Materials

The following supporting information can be downloaded at: https://www.mdpi.com/article/10.3390/catal12080891/s1, Figure S1: Cyclic voltammogram of sample 1. Dashed area was used for evaluation of Pt ECSA by electrochemical hydrogen adsorption/desorption method; Figure S2: Cyclic voltammogram of sample 2; Figure S3: Cyclic voltammogram of sample 3; Figure S4: Cyclic voltammogram of sample 4; Figure S5: Cyclic voltammogram of sample 5; Figure S6: Cyclic voltammogram of sample 6; Figure S7: Cyclic voltammogram of sample 7; Figure S8: Cyclic voltammogram of sample 8; Figure S9: Cyclic voltammogram of sample 9; Figure S10: Cyclic voltammogram of sample 10; Figure S11: Polarization curve and power density data for the HT-PEM fuel cell with Pt/CNF cathode obtained by ascorbic acid assisted Pt deposition.

Author Contributions

Conceptualization, I.I.P. (Igor I. Ponomarev); methodology, I.I.P. (Igor I. Ponomarev), K.M.S., O.M.Z., I.I.P. (Ivan I. Ponomarev) and A.D.M.; investigation, I.I.P. (Igor I. Ponomarev), K.M.S., O.M.Z., D.N.K., I.I.P. (Ivan I. Ponomarev), E.S.V., E.N.C., V.G.B. and A.D.M.; writing—original draft preparation, K.M.S. and O.M.Z.; writing—review and editing, I.I.P. (Igor I. Ponomarev), K.M.S., O.M.Z., D.N.K., I.I.P. (Ivan I. Ponomarev), E.S.V., E.N.C., V.G.B. and A.D.M.; visualization, I.I.P. (Igor I. Ponomarev), K.M.S., O.M.Z., D.N.K., I.I.P. (Ivan I. Ponomarev), E.S.V., E.N.C., V.G.B. and A.D.M.; supervision, I.I.P. (Igor I. Ponomarev) and O.M.Z.; project administration, I.I.P. (Igor I. Ponomarev). All authors have read and agreed to the published version of the manuscript.

Funding

This research was funded by Russian Science Foundation, grant number 22-13-00065.

Data Availability Statement

The authors confirm that the data supporting the findings of this study are available within the article and its Supplementary Materials.

Acknowledgments

Elemental analysis was performed with support of Ministry of Science and Higher Education of the Russian Federation using the equipment of Center for Molecular Composition Studies of INEOS RAS.

Conflicts of Interest

The authors declare no conflict of interest. The funders had no role in the design of the study; in the collection, analyses, or interpretation of data; in the writing of the manuscript; or in the decision to publish the results.

References

  1. Liu, G.; Zhang, H.; Zhai, Y.; Zhang, Y.; Xu, D.; Shao, Z. Pt4ZrO2/C cathode catalyst for improved durability in high temperature PEMFC based on H3PO4 doped PBI. Electrochem. Commun. 2007, 9, 135–141. [Google Scholar] [CrossRef]
  2. Luo, Y.; Habrioux, A.; Calvillo, L.; Granozzi, G.; Alonso-Vante, N. Thermally Induced Strains on the Catalytic Activity and Stability of Pt-M2O3/C (M = Y or Gd) Catalysts towards Oxygen Reduction Reaction. ChemCatChem 2015, 7, 1573–1582. [Google Scholar] [CrossRef]
  3. Luo, Y.; Habrioux, A.; Calvillo, L.; Granozzi, G.; Alonso-Vante, N. Yttrium Oxide/Gadolinium Oxide-Modified Platinum Nanoparticles as Cathodes for the Oxygen Reduction Reaction. ChemPhysChem 2014, 15, 2136–2144. [Google Scholar] [CrossRef] [PubMed]
  4. Lim, D.-H.; Lee, W.-D.; Choi, D.-H.; Lee, H.-I. Effect of ceria nanoparticles into the Pt/C catalyst as cathode material on the electrocatalytic activity and durability for low temperature fuel cell. Appl. Catal. B Environ. 2010, 94, 85–96. [Google Scholar] [CrossRef]
  5. Fugane, K.; Mori, T.; Ou, D.R.; Suzuki, A.; Yoshikawa, H.; Masuda, T.; Uosaki, K.; Yamashita, Y.; Ueda, S.; Kobayashi, K.; et al. Activity of oxygen reduction reaction on small amount of amorphous CeOx promoted Pt cathode for fuel cell application. Electrochim. Acta 2011, 56, 3874–3883. [Google Scholar] [CrossRef]
  6. Stamenkovic, V.R.; Fowler, B.; Mun, B.S.; Wang, G.F.; Ross, P.N.; Lucas, C.A.; Markovic, N.M. Improved Oxygen Reduction Activity on Pt3Ni (111) via Increased Surface Site Availability. Science 2007, 315, 493–497. [Google Scholar] [CrossRef]
  7. Escribano, M.A.; Malacrid, P.; Hansen, M.H.; Vej-Hansen, U.G.; Palenzuela, A.P.; Tripkovic, V.; Schiøtz, J.; Rossmeisl, J.; Stephens, I.E.L.; Chorkendorff, I. Tuning the activity of Pt alloy electrocatalysts by means of the lanthanide contraction. Science 2016, 352, 73–76. [Google Scholar] [CrossRef]
  8. Yu, W.; Porosoff, M.D.; Chen, J.G. Review of Pt-Based Bimetallic Catalysis: From Model Surfaces to Supported Catalysts. Chem. Rev. 2012, 112, 5780–5817. [Google Scholar] [CrossRef]
  9. Stamenkovic, V.R.; Mun, B.S.; Arenz, M.; Mayrhofer, K.J.J.; Lucas, C.A.; Wang, G.; Ross, P.N.; Markovic, N.M. Trends in electrocatalysis on extended and nanoscale Pt-bimetallic alloy surfaces. Nat. Mater. 2007, 6, 241–247. [Google Scholar] [CrossRef]
  10. Mukerjee, S.; Srinivasan, S.; Soriaga, M.P.; McBreen, J. Effect of Preparation Conditions of Pt Alloys on Their Electronic, Structural, and Electrocatalytic Activities for Oxygen Reduction—XRD, XAS, and Electrochemical Studies. J. Phys. Chem. 1995, 99, 4577–4589. [Google Scholar] [CrossRef]
  11. Escudero-Escribano, M.; Verdaguer-Casadevall, A.; Malacrida, P.; Gronbjerg, U.; Knudsen, B.P.; Jepsen, A.K.; Rossmeisl, J.; Stephens, I.E.L.; Chorkendorff, I. Pt5Gd as a Highly Active and Stable Catalyst for Oxygen Electroreduction. J. Am. Chem. Soc. 2012, 134, 16476–16479. [Google Scholar] [CrossRef] [PubMed]
  12. Chaudhari, N.K.; Joo, J.; Kim, B.; Ruqia, B.; Choi, S.-I.; Lee, K. Recent advances in electrocatalysts toward the oxygen reduction reaction: The case of PtNi octahedra. Nanoscale 2018, 10, 20073–20088. [Google Scholar] [CrossRef] [PubMed]
  13. Wu, J.; Gross, A.; Yang, H. Shape and Composition-Controlled Platinum Alloy Nanocrystals Using Carbon Monoxide as Reducing Agent. Nano Lett. 2011, 11, 798–802. [Google Scholar] [CrossRef] [PubMed]
  14. Mahata, A.; Nair, A.S.; Pathak, B. Recent advancements in Pt-nanostructure-based electrocatalysts for the oxygen reduction reaction. Catal. Sci. Technol. 2019, 9, 4835–4863. [Google Scholar] [CrossRef]
  15. Chou, S.-W.; Lai, Y.-R.; Yang, Y.Y.; Tang, C.-Y.; Hayashi, M.; Chen, H.-C.; Chen, H.-L.; Chou, P.-T. Uniform size and composition tuning of PtNi octahedra for systematic studies of oxygen reduction reactions. J. Catal. 2014, 309, 343–350. [Google Scholar] [CrossRef]
  16. Zhang, J. PEM Fuel Cell Electrocatalysts and Catalyst Layers, Fundamentals and Applications; Springer: London, UK, 2008. [Google Scholar] [CrossRef]
  17. Li, Q.; Aili, D.; Hjuler, H.A.; Jensen, J.O. High Temperature Polymer Electrolyte Membrane Fuel Cells, Approaches, Status and Perspectives; Springer: London, UK, 2016. [Google Scholar] [CrossRef]
  18. Pingitore, A.T.; Molleo, M.; Schmidt, T.J.; Benicewicz, B.C. Polybenzimidazole Fuel Cell Technology: Theory, Performance, and Applications. In Fuel Cells and Hydrogen Production. Encyclopedia of Sustainability Science and Technology Series; Lipman, T., Weber, A., Eds.; Springer: New York, NY, USA, 2019; pp. 477–515. [Google Scholar] [CrossRef]
  19. Araya, S.S.; Zhou, F.; Liso, V.; Sahlin, S.L.; Vang, J.R.; Thomas, S.; Gao, X.; Jeppesen, C.; Kaer, S.K. A comprehensive review of PBI-based high temperature PEM fuel cells. Int. J. Hydrog. Energy 2016, 41, 21310–21344. [Google Scholar] [CrossRef]
  20. Chandan, A.; Hattenberger, M.; El-kharouf, A.; Du, S.; Dhir, A.; Self, V.; Pollet, B.G.; Ingram, A.; Bujalski, W. High temperature (HT) polymer electrolyte membrane fuel cells (PEMFC)—A review. J. Power Sources 2013, 231, 264–278. [Google Scholar] [CrossRef]
  21. Myles, T.; Bonville, L.; Maric, R. Catalyst, Membrane, Free Electrolyte Challenges, and Pathways to Resolutions in High Temperature Polymer Electrolyte Membrane Fuel Cells. Catalysts 2017, 7, 16. [Google Scholar] [CrossRef]
  22. Rosli, R.E.; Sulong, A.B.; Daud, W.R.W.; Zulkifley, M.A.; Husaini, T.; Rosl, M.I.; Majlan, E.H.; Haque, M.A. A review of high-temperature proton exchange membrane fuel cell (HT-PEMFC) system. Int. J. Hydrog. Energy 2017, 42, 9293–9314. [Google Scholar] [CrossRef]
  23. Authayanum, S.; Im-orb, K.; Arpornwichnop, A. A review of the development of high temperature proton exchange membrane fuel cells. Chin. J. Catal. 2015, 36, 473–483. [Google Scholar] [CrossRef]
  24. Zeis, R. Materials and characterization techniques for high-temperature polymer electrolyte membrane fuel cells. Beilstein. J. Nanotechnol. 2015, 6, 68–83. [Google Scholar] [CrossRef] [PubMed]
  25. Quartarone, E.; Angioni, S.; Mustarelli, P. Polymer and Composite Membranes for Proton-Conducting, High-Temperature Fuel Cells: A Critical Review. Materials 2017, 10, 687. [Google Scholar] [CrossRef] [PubMed]
  26. Ponomarev, I.I.; Skupov, K.M.; Zhigalina, O.M.; Naumkin, A.V.; Modestov, A.D.; Basu, V.G.; Sufiyanova, A.E.; Razorenov, D.Y.; Ponomarev, I.I. New Carbon Nanofiber Composite Materials Containing Lanthanides and Transition Metals Based on Electrospun Polyacrylonitrile for High Temperature Polymer Electrolyte Membrane Fuel Cell Cathodes. Polymers 2020, 12, 1340. [Google Scholar] [CrossRef]
  27. Zhigalina, V.G.; Zhigalina, O.M.; Ponomarev, I.I.; Skupov, K.M.; Razorenov, D.Y.; Ponomarev, I.I.; Kiselev, N.A.; Leitinger, G. Electron microscopy study of new composite materials based on electrospun carbon nanofibers. CrystEngComm 2017, 19, 3792–3800. [Google Scholar] [CrossRef]
  28. Ponomarev, I.I.; Skupov, K.M.; Naumkin, A.N.; Basu, V.G.; Zhigalina, O.M.; Razorenov, D.Y.; Ponomarev, I.I.; Volkova, Y.A. Probing of complex carbon nanofiber paper as gas-diffusion electrode for high temperature polymer electrolyte membrane fuel cell. RSC Adv. 2019, 9, 257–267. [Google Scholar] [CrossRef] [PubMed]
  29. Ponomarev, I.I.; Zhigalina, O.M.; Skupov, K.M.; Modestov, A.D.; Basu, V.G.; Sufiyanova, A.E.; Ponomarev, I.I.; Razorenov, D.Y. Preparation and thermal treatment influence on Pt decorated electrospun carbon nanofiber electrocatalysts. RSC Adv. 2019, 9, 27406–27418. [Google Scholar] [CrossRef]
  30. Ponomarev, I.I.; Ponomarev, I.I.; Filatov, I.Y.; Filatov, Y.N.; Razorenov, D.Y.; Volkova, Y.A.; Zhigalina, O.M.; Zhigalina, V.G.; Grebenev, V.V.; Kiselev, N.A. Design of electrodes based on a carbon nanofiber nonwoven material for the membrane electrode assembly of a polybenzimidazole-membrane fuel cell. Dokl. Phys. Chem. 2013, 448, 23–27. [Google Scholar] [CrossRef]
  31. Vol’fkovich, Y.M.; Ponomarev, I.I.; Sosenkin, V.E.; Ponomarev, I.I.; Skupov, K.M.; Razorenov, D.Y. A Porous Structure of Nanofiber Electrospun Polyacrylonitrile-Based Materials: A Standard Contact Porosimetry Study. Prot. Met. Phys. Chem. Surf. 2019, 55, 195–202. [Google Scholar] [CrossRef]
  32. Ponomarev, I.I.; Skupov, K.M.; Razorenov, D.Y.; Zhigalina, V.G.; Zhigalina, O.M.; Ponomarev, I.I.; Volkova, Y.A.; Kondratenko, M.S.; Bukalov, S.S.; Davydova, E.S. Electrospun nanofiber pyropolymer electrodes for fuel cell on polybenzimidazole membranes. Russ. J. Electrochem. 2016, 52, 735–739. [Google Scholar] [CrossRef]
  33. Ponomarev, I.I.; Filatov, Y.N.; Ponomarev, I.I.; Filatov, I.Y.; Razorenov, D.Y.; Skupov, K.M.; Zhigalina, O.M.; Zhigalina, V.G. Electroforming on nitrogen-containing polymers and derived nonfabric nanofibre carbon materials. Fibre Chem. 2017, 49, 183–187. [Google Scholar] [CrossRef]
  34. Skupov, K.M.; Ponomarev, I.I.; Razorenov, D.Y.; Zhigalina, V.G.; Zhigalina, O.M.; Ponomarev, I.I.; Volkova, Y.A.; Volfkovich, Y.M.; Sosenkin, V.E. Carbon nanofiber paper cathode modification for higher performance of phosphoric acid fuel cells on polybenzimidazole membrane. Russ. J. Electrochem. 2017, 53, 728–733. [Google Scholar] [CrossRef]
  35. Ponomarev, I.I.; Skupov, K.M.; Ponomarev, I.I.; Razorenov, D.Y.; Volkova, Y.A.; Basu, V.G.; Zhigalina, O.M.; Bukalov, S.S.; Volfkovich, Y.M.; Sosenkin, V.E. New Gas-Diffusion Electrode Based on Heterocyclic Microporous Polymer PIM-1 for High-Temperature Polymer Electrolyte Membrane Fuel Cell. Russ. J. Electrochem. 2019, 55, 552–557. [Google Scholar] [CrossRef]
  36. Skupov, K.M.; Ponomarev, I.I.; Vol’fkovich, Y.M.; Modestov, A.D.; Ponomarev, I.I.; Volkova, Y.A.; Razorenov, D.Y.; Sosenkin, V.E. The Effect of the Stabilization and Carbonization Temperatures on the Properties of Microporous Carbon Nanofiber Cathodes for Fuel Cells on Polybenzimidazole Membrane. Polym. Sci. Ser. C 2020, 62, 231–237. [Google Scholar] [CrossRef]
  37. Skupov, K.M.; Ponomarev, I.I.; Razorenov, D.Y.; Zhigalina, V.G.; Zhigalina, O.M.; Ponomarev, I.I.; Volkova, Y.A.; Volfkovich, Y.M.; Sosenkin, V.E. Carbon nanofiber paper electrodes based on heterocyclic polymers for high temperature polymer electrolyte membrane fuel cell. Macromol. Symp. 2017, 375, 1600188. [Google Scholar] [CrossRef]
  38. Skupov, K.M.; Ponomarev, I.I.; Volfkovich, Y.M.; Sosenkin, V.E.; Ponomarev, I.I.; Volkova, Y.A.; Razorenov, D.Y.; Buyanovskaya, A.G.; Talanova, V.N. Porous structure optimization of electrospun carbon materials. Russ. Chem Bull. 2020, 69, 1106–1113. [Google Scholar] [CrossRef]
  39. Yusof, N.; Ismail, A.F. Post spinning and pyrolysis processes of polyacrylonitrile (PAN)-based carbon fiber and activated carbon fiber: A review. J. Anal. Appl. Pyrol. 2012, 93, 1–13. [Google Scholar] [CrossRef]
  40. Tenchurin, T.K.; Krasheninnikov, S.N.; Orekhov, A.S.; Chvalun, S.N.; Shepelev, A.D.; Belousov, S.I.; Gulyaev, A.I. Rheological Features of Fiber Spinning from Polyacrylonitrile Solutions in an Electric Field. Structure and Properties. Fibre Chem. 2014, 46, 151–160. [Google Scholar] [CrossRef]
  41. Nagai, D.; Nonaka, Y.; Akiyama, T.; Takahashi, R.; Yamanobe, T. Mutual separation of platinum group metals via seed-mediated growth on a polymer with metal-coordination unit. Sep. Purif. Technol. 2021, 276, 119265. [Google Scholar] [CrossRef]
  42. Zhou, D.; Jiang, B.; Yang, R.; Hou, X.; Zheng, C. One-step synthesis of monodispersed Pt nanoparticles anchored on 3D graphene foams and its application for electrocatalytic hydrogen evolution. Chinese Chem. Lett. 2020, 31, 1540–1544. [Google Scholar] [CrossRef]
  43. Gasteiger, H.A.; Kocha, S.S.; Sompalli, B.; Wagner, F.T. Activity benchmarks and requirements for Pt, Pt-alloy, and non-Pt oxygen reduction catalysts for PEMFCs. Appl. Catal. B Environ. 2005, 56, 9–35. [Google Scholar] [CrossRef]
  44. Kinoshita, K.; Stonehart, P. Preparation and Characterization of Highly Dispersed Electrocatalytic Materials. In Modern Aspects of Electrochemistry; Bockris, J.O., Conway, B.E., Eds.; Springer: Boston, MA, USA, 1977; pp. 183–266. [Google Scholar] [CrossRef]
  45. Kondratenko, M.S.; Ponomarev, I.I.; Gallyamov, M.O.; Razorenov, D.Y.; Volkova, Y.A.; Kharitonova, E.P.; Khokhlov, A.R. Novel composite Zr/PBI-O-PhT membranes for HT-PEFC applications. Beilstein J. Nanotechnol. 2013, 4, 481–492. [Google Scholar] [CrossRef] [PubMed]
  46. Schmidt, T.J.; Baurmeister, J. Properties of high-temperature PEFC Celtec®-P 1000 MEAs in start/stop operation mode. J. Power Sources 2008, 176, 428–434. [Google Scholar] [CrossRef]
Figure 1. (a) BF TEM images of Pt on a CNF with smooth surface (b) enlarged image of Pt agglomerated nanoparticles for sample 1.
Catalysts 12 00891 g001
Figure 2. EDX spectrum of a CNF fragment surface (sample 1); inserts: STEM HAADF image and corresponding elemental maps.
Catalysts 12 00891 g002
Figure 3. BF TEM images of CNF: (a) Pt on a CNF with smooth surface; (b) Pt agglomerate and (c) SAED pattern for sample 2.
Catalysts 12 00891 g003
Figure 4. Elemental distribution in a platinum agglomerate: (a) STEM HAADF image of the agglomerate; (be) corresponding elemental maps for sample 2.
Catalysts 12 00891 g004
Figure 5. CNF STEM HAADF image for sample 3 (a), and corresponding elemental mapping (be).
Catalysts 12 00891 g005
Figure 6. Elemental distribution on the CNF surface: (a) STEM HAADF image of particles; (be) corresponding elemental maps for sample 3.
Catalysts 12 00891 g006
Figure 7. (a) BF TEM image of CNF (sample 4) with smooth and crystalline fragments; (b) SAED pattern taken from a smooth fragment; and (c) SAED pattern taken from a crystalline fragment.
Catalysts 12 00891 g007
Figure 8. Elemental distribution in Pt agglomerates: STEM HAADF image of the agglomerates for samples 4 (a) and 5 (b); (cf) corresponding elemental maps for sample 5.
Catalysts 12 00891 g008
Figure 9. BF TEM images of CNF: (a) a general view; (b) Pt crystals in the surface layer; and (c) the corresponding SAED pattern for sample 6.
Catalysts 12 00891 g009
Figure 10. CNF with crystalline structure: (a) BF TEM image; (b) STEM HAADF image; and (cf) elemental mapping for sample 6.
Catalysts 12 00891 g010
Figure 11. BF TEM images of different parts of nanofibers (a,b) for sample 7.
Catalysts 12 00891 g011
Figure 12. BF TEM image for sample 8.
Catalysts 12 00891 g012
Figure 13. Elemental distribution on the surface of the CNF fragment (sample 9): (a) STEM HAADF image; (bf) corresponding elemental maps.
Catalysts 12 00891 g013
Figure 14. BF TEM images of CNF: (a) smooth surface; (b) enlarged image of Pt crystals on the surface layer; and (c) corresponding SAED pattern for sample 10.
Catalysts 12 00891 g014
Figure 15. Elemental distribution on the CNF fragment surface (sample 10): (a) STEM HAADF image; (be) corresponding elemental maps.
Catalysts 12 00891 g015
Figure 16. Ascorbic acid chemical structure.
Catalysts 12 00891 g016
Table 1. Chemical composition of the agglomerate from Figure 4.
ElementSeriesNorm. wt.%Norm. at.%
ZirconiumK-series2.602.98
NickelK-series4.157.39
PlatinumL-series86.6246.36
OxygenK-series6.6343.27
Sum 100100
Table 2. Chemical composition of Pt agglomerate from Figure 8a (sample 4).
ElementSeriesNorm. wt.%Norm. at.%
NickelK-series0.651.96
PlatinumL-series97.3188.48
ZirconiumK-series1.432.78
OxygenK-series0.616.77
Sum 100100
Table 3. Chemical composition of Pt agglomerate from Figure 8b (sample 5).
ElementSeriesNorm. wt.%Norm. at.%
NickelK-series0.461.37
PlatinumL-series97.6386.76
ZirconiumK-series0.991.88
OxygenK-series0.929.99
Sum 100100
Table 4. Chemical composition of Pt agglomerate (sample 9).
ElementSeriesNorm. wt.%Norm. at.%
NickelK-series0.611.64
PlatinumL-series96.3978.30
ZirconiumK-series1.192.06
OxygenK-series1.8217.99
Sum 100100
Table 5. ECSA of platinum for samples 110.
SamplePt ECSA, m2·gPt−1
15.5
26.1
30.4
43.1
51.7
618.0
712.4
86.6
926.8
107.7
Table 6. Elemental analysis and electrical conductivity of samples A and B.
Sampleσ, S cm−1%C%N%H%Ni%Zr
A22.274.64.01.37.00.8
B17.087.42.30.67.10.5
Publisher’s Note: MDPI stays neutral with regard to jurisdictional claims in published maps and institutional affiliations.

