
L-asparagine Assisted Synthesis of Pt/CeO2 Nanospheres for Toluene Combustion

Abstract
:1. Introduction
2. Results and Discussion
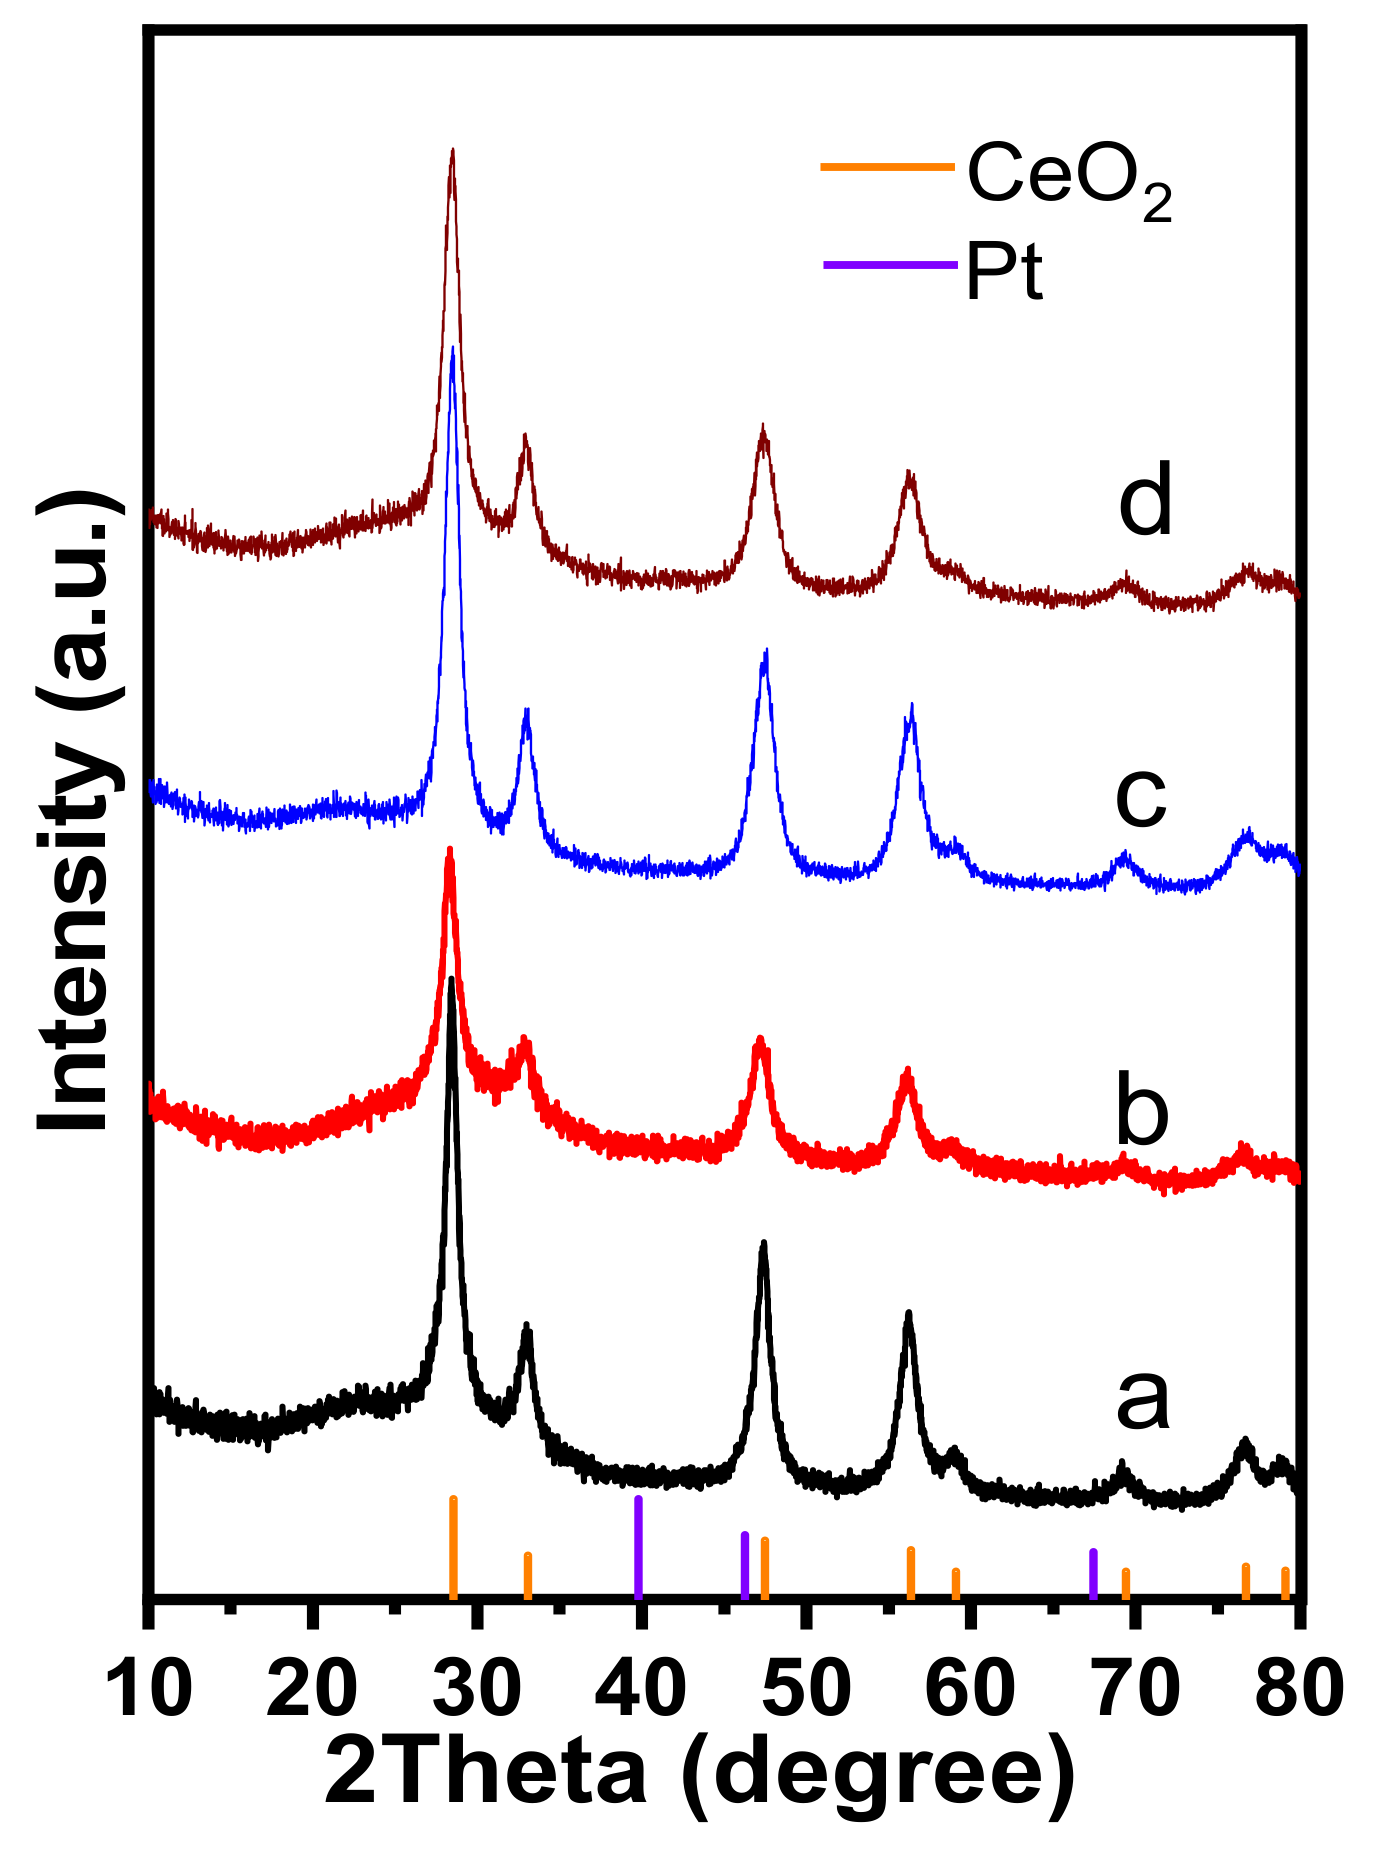
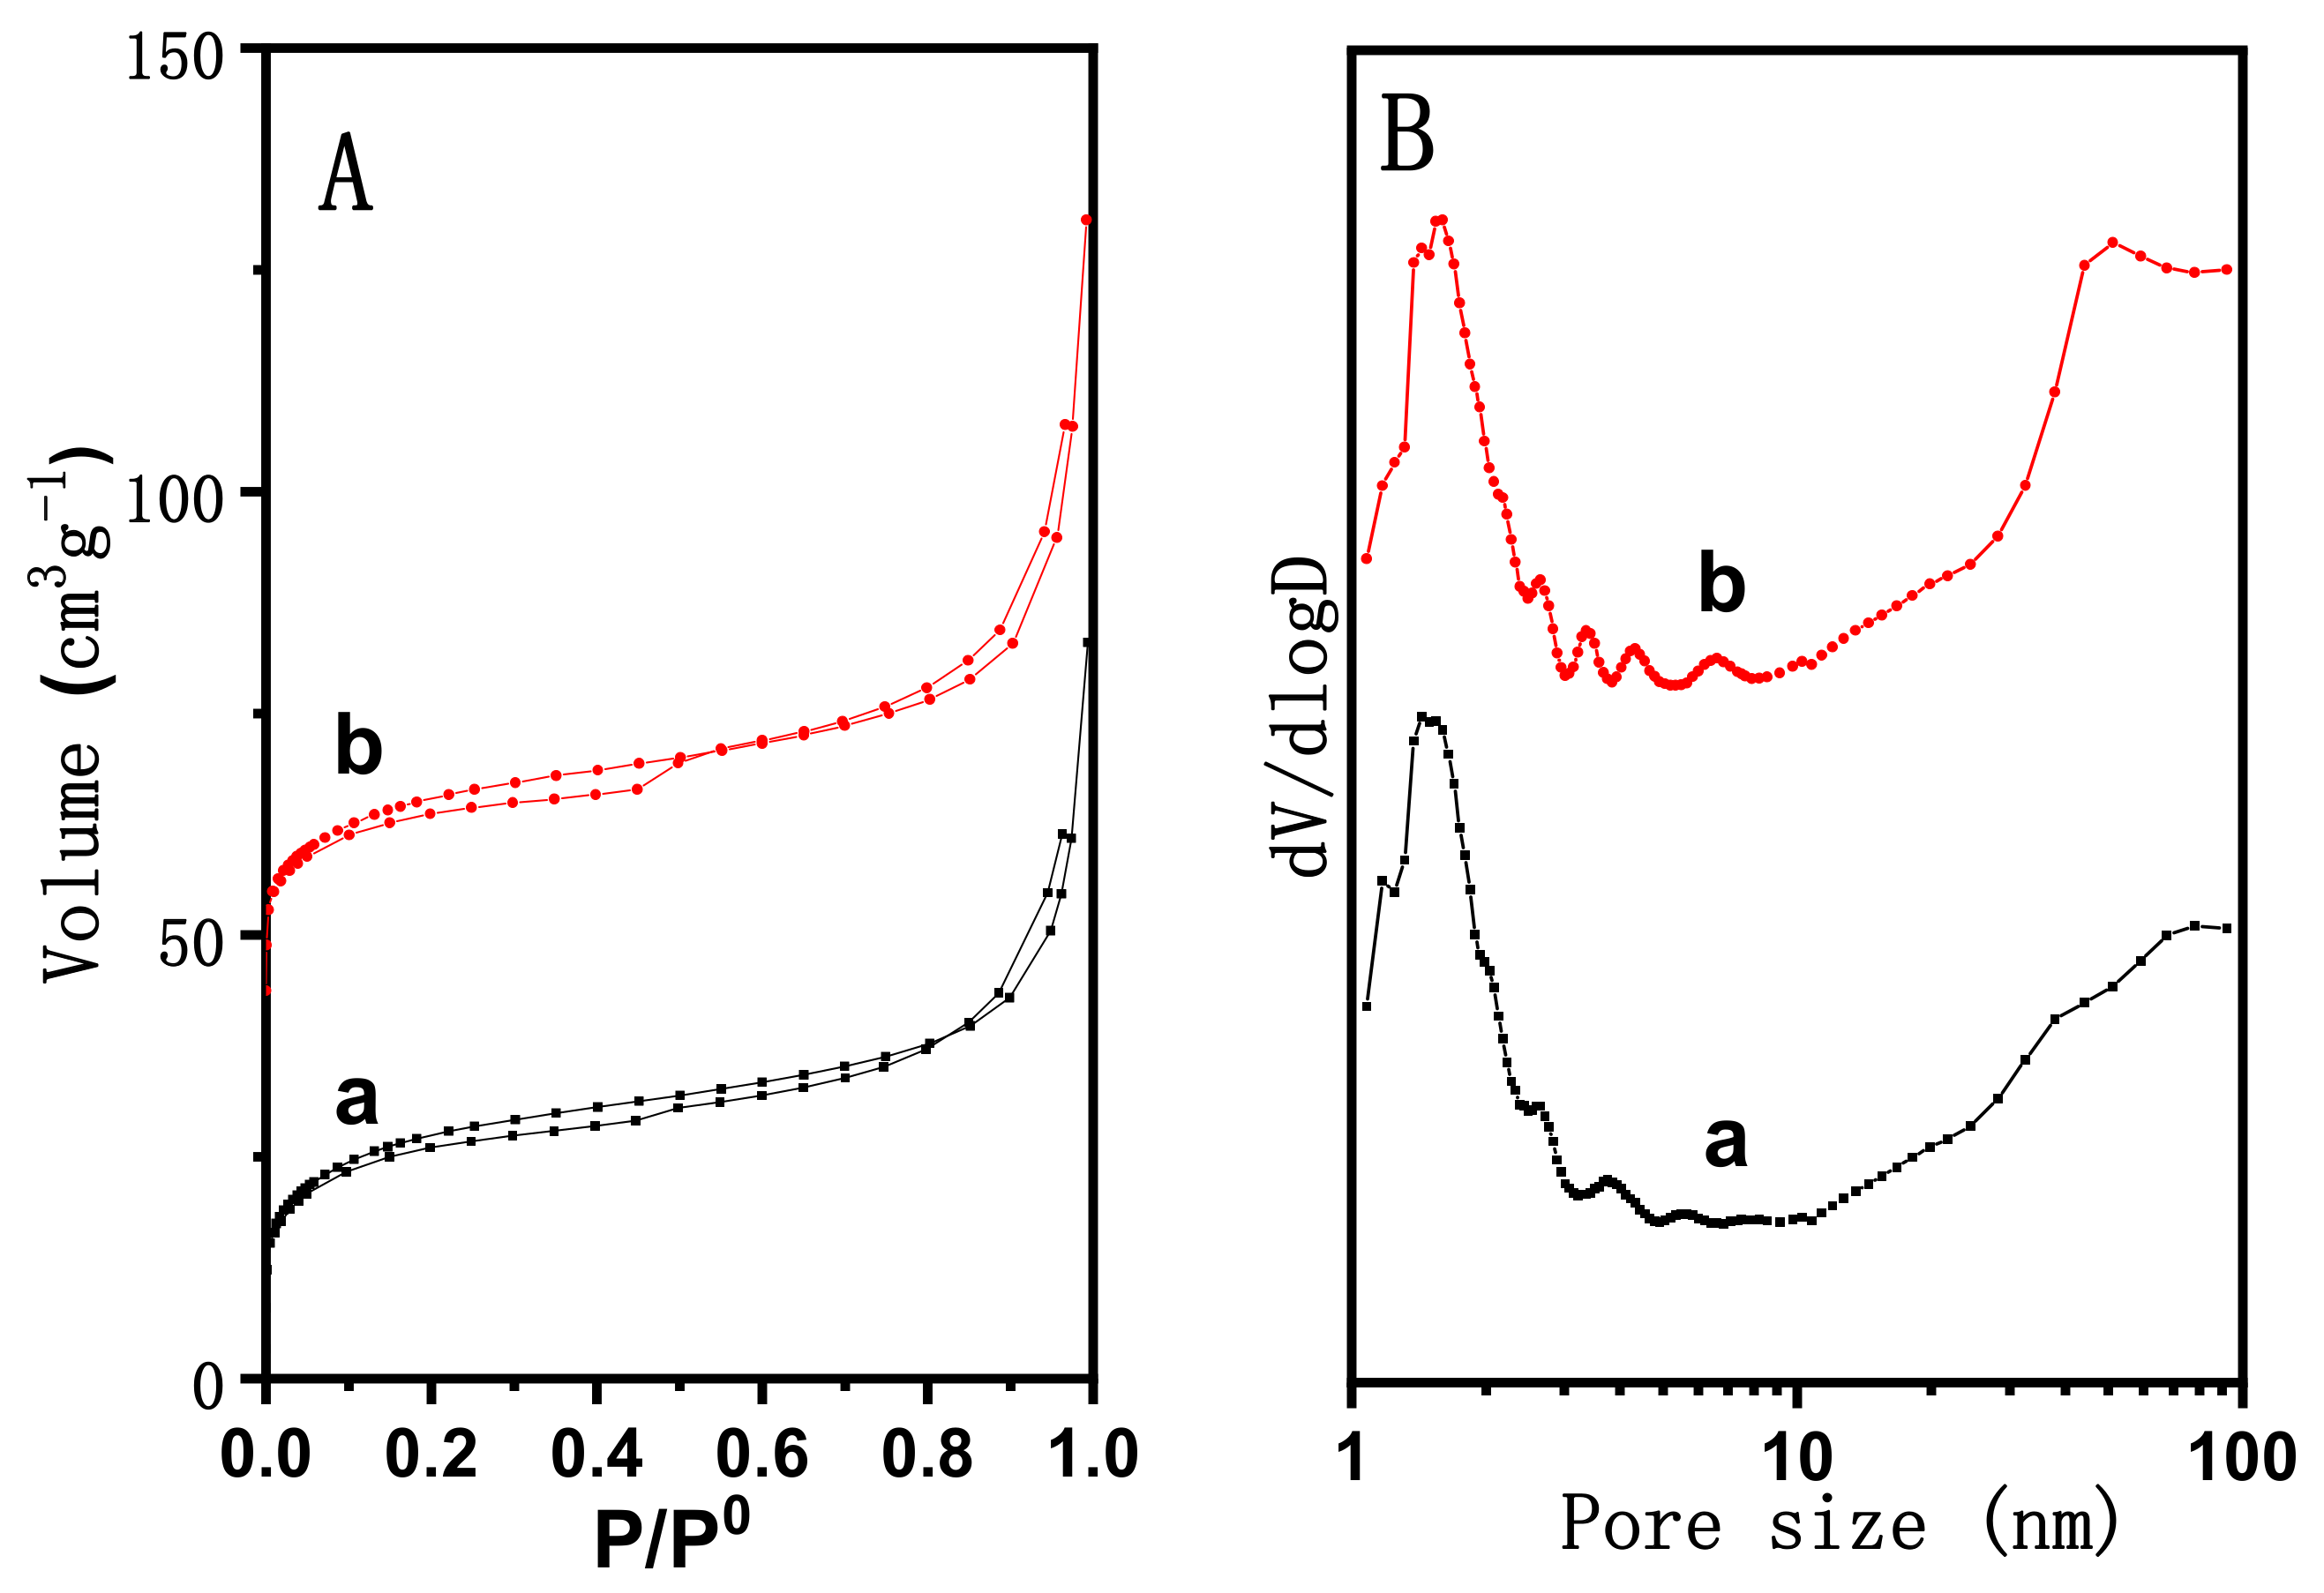
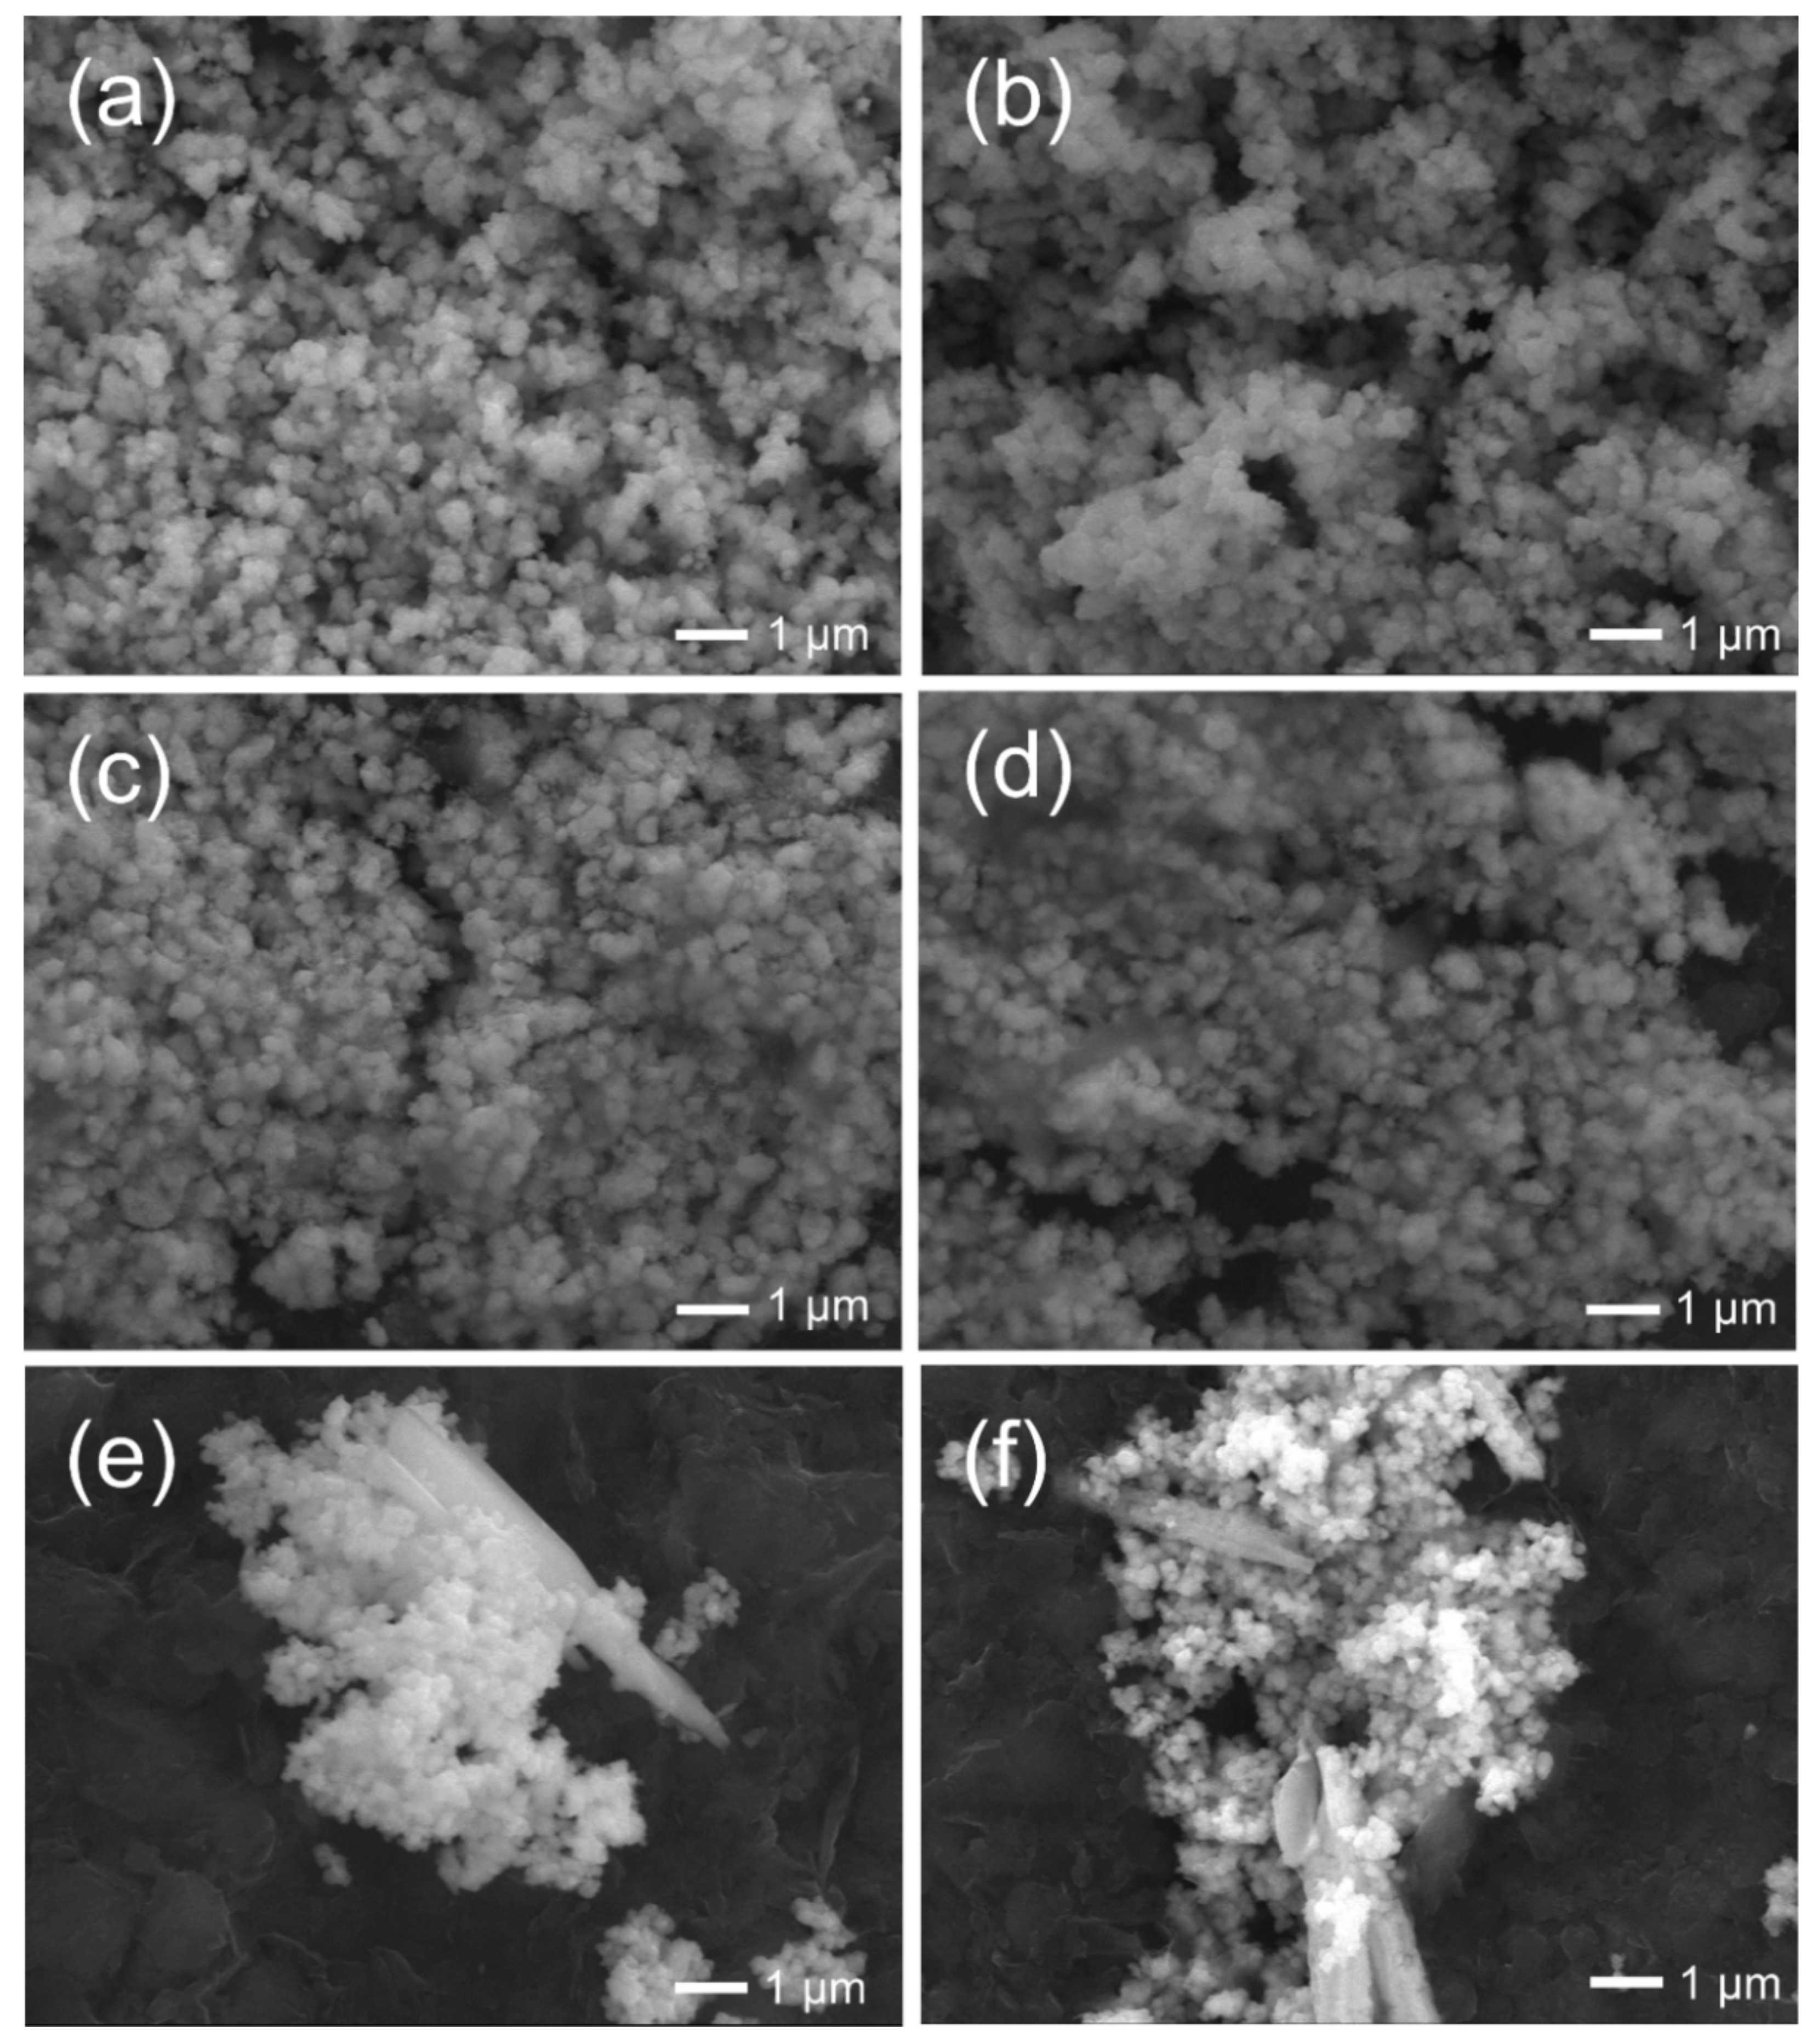
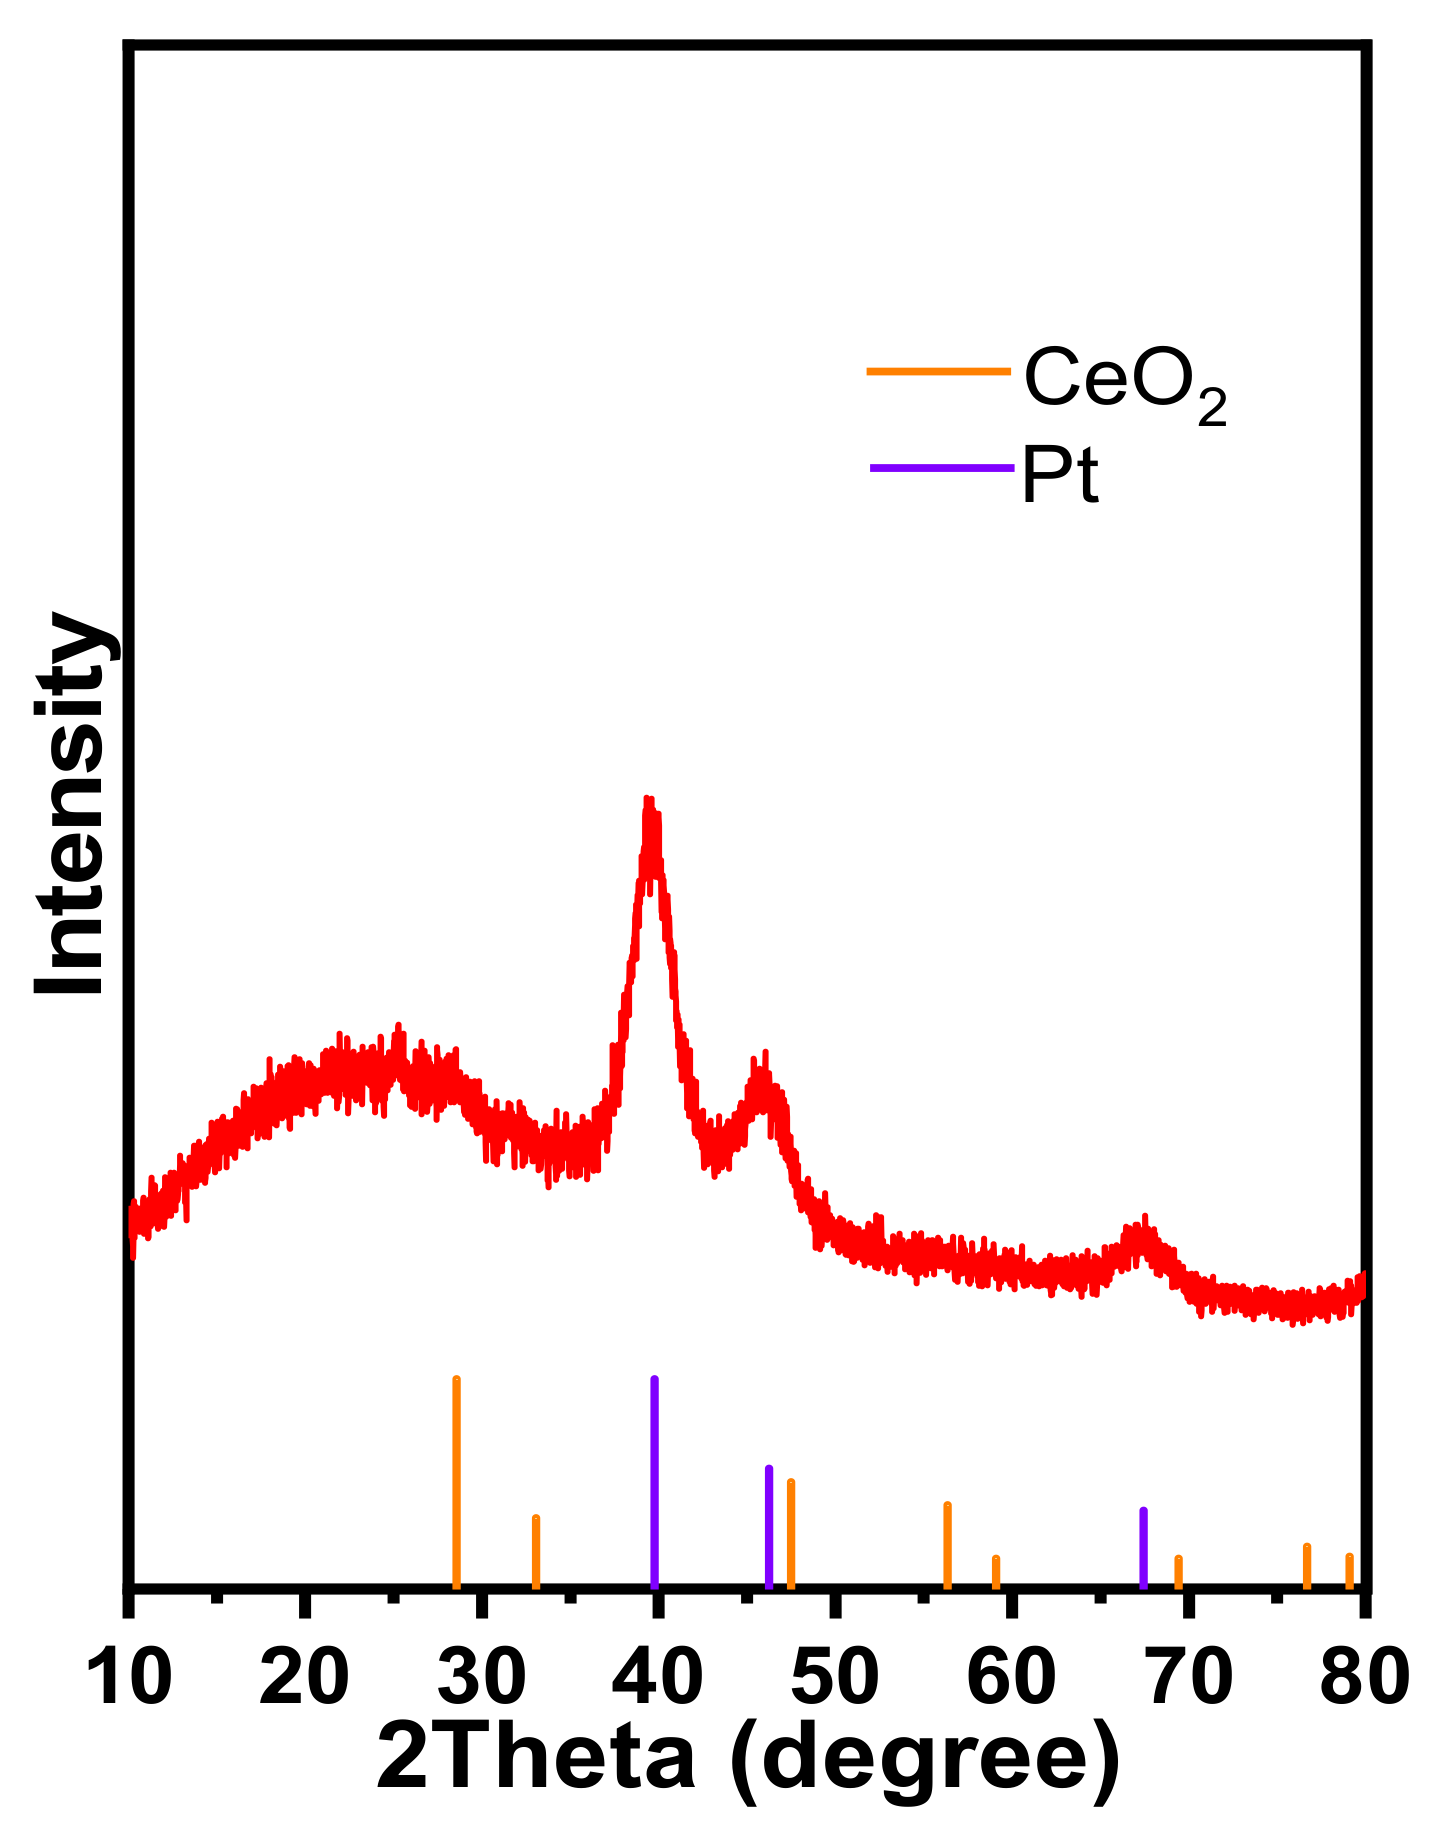
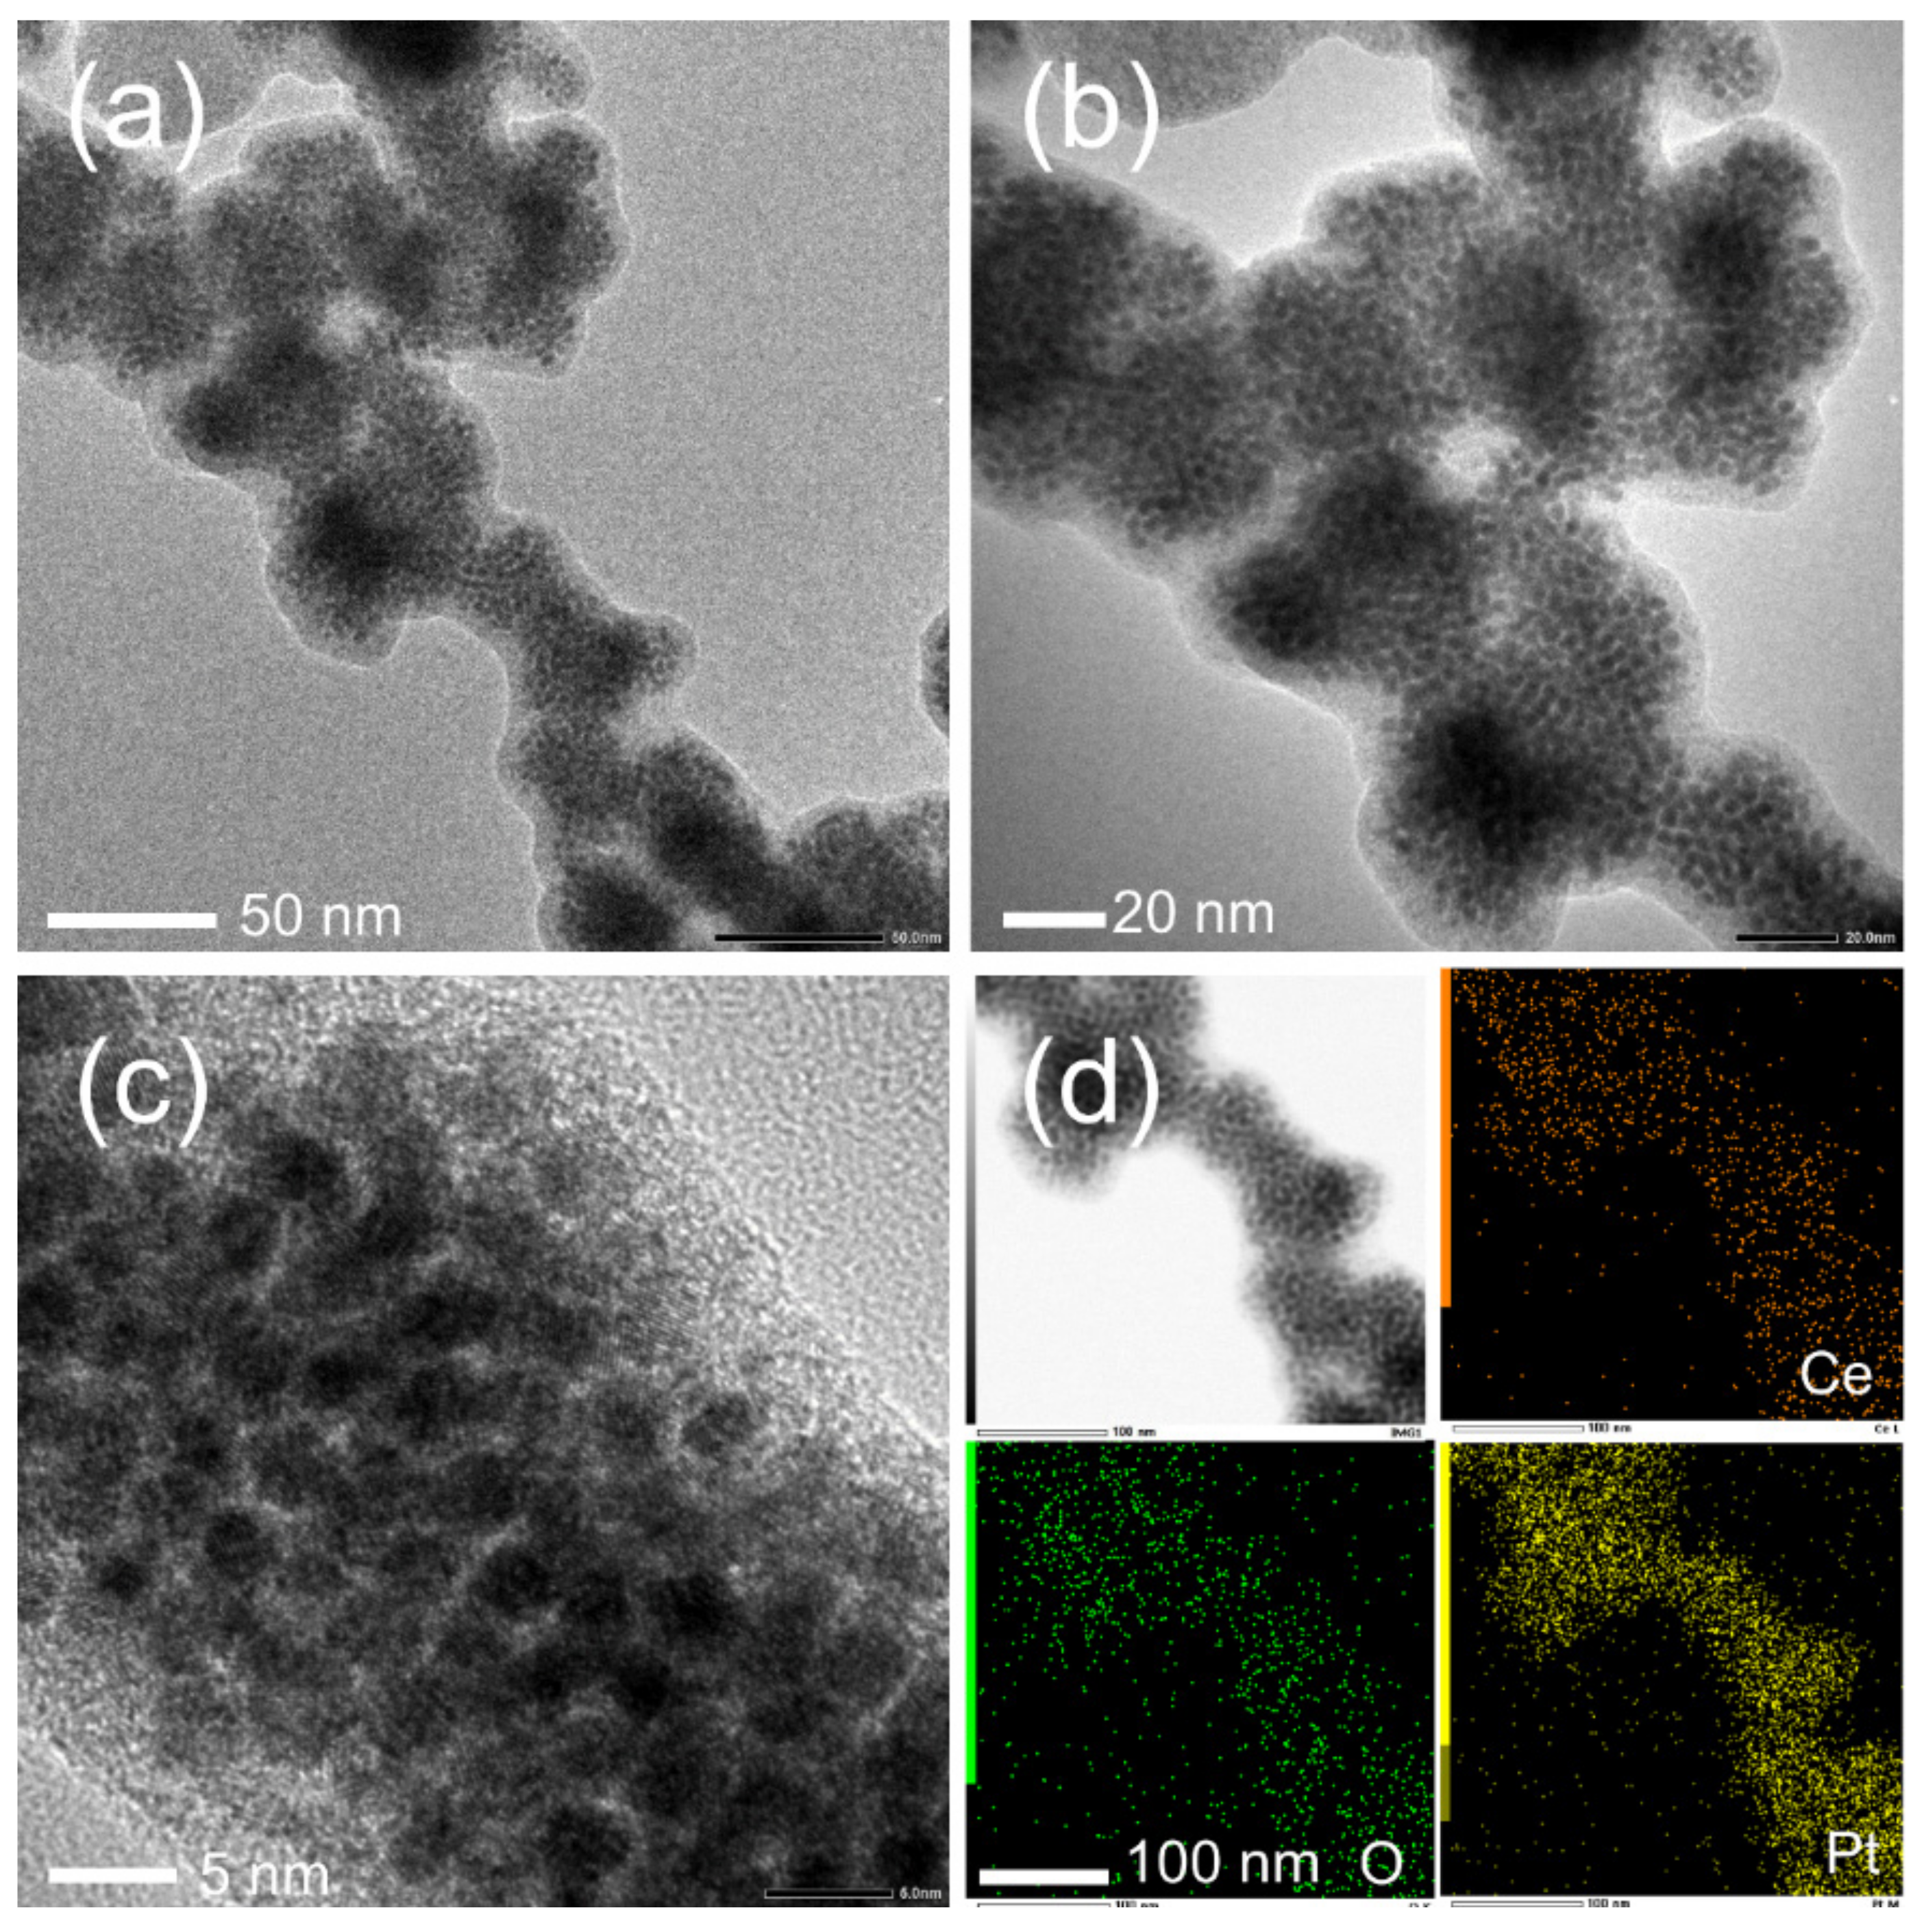
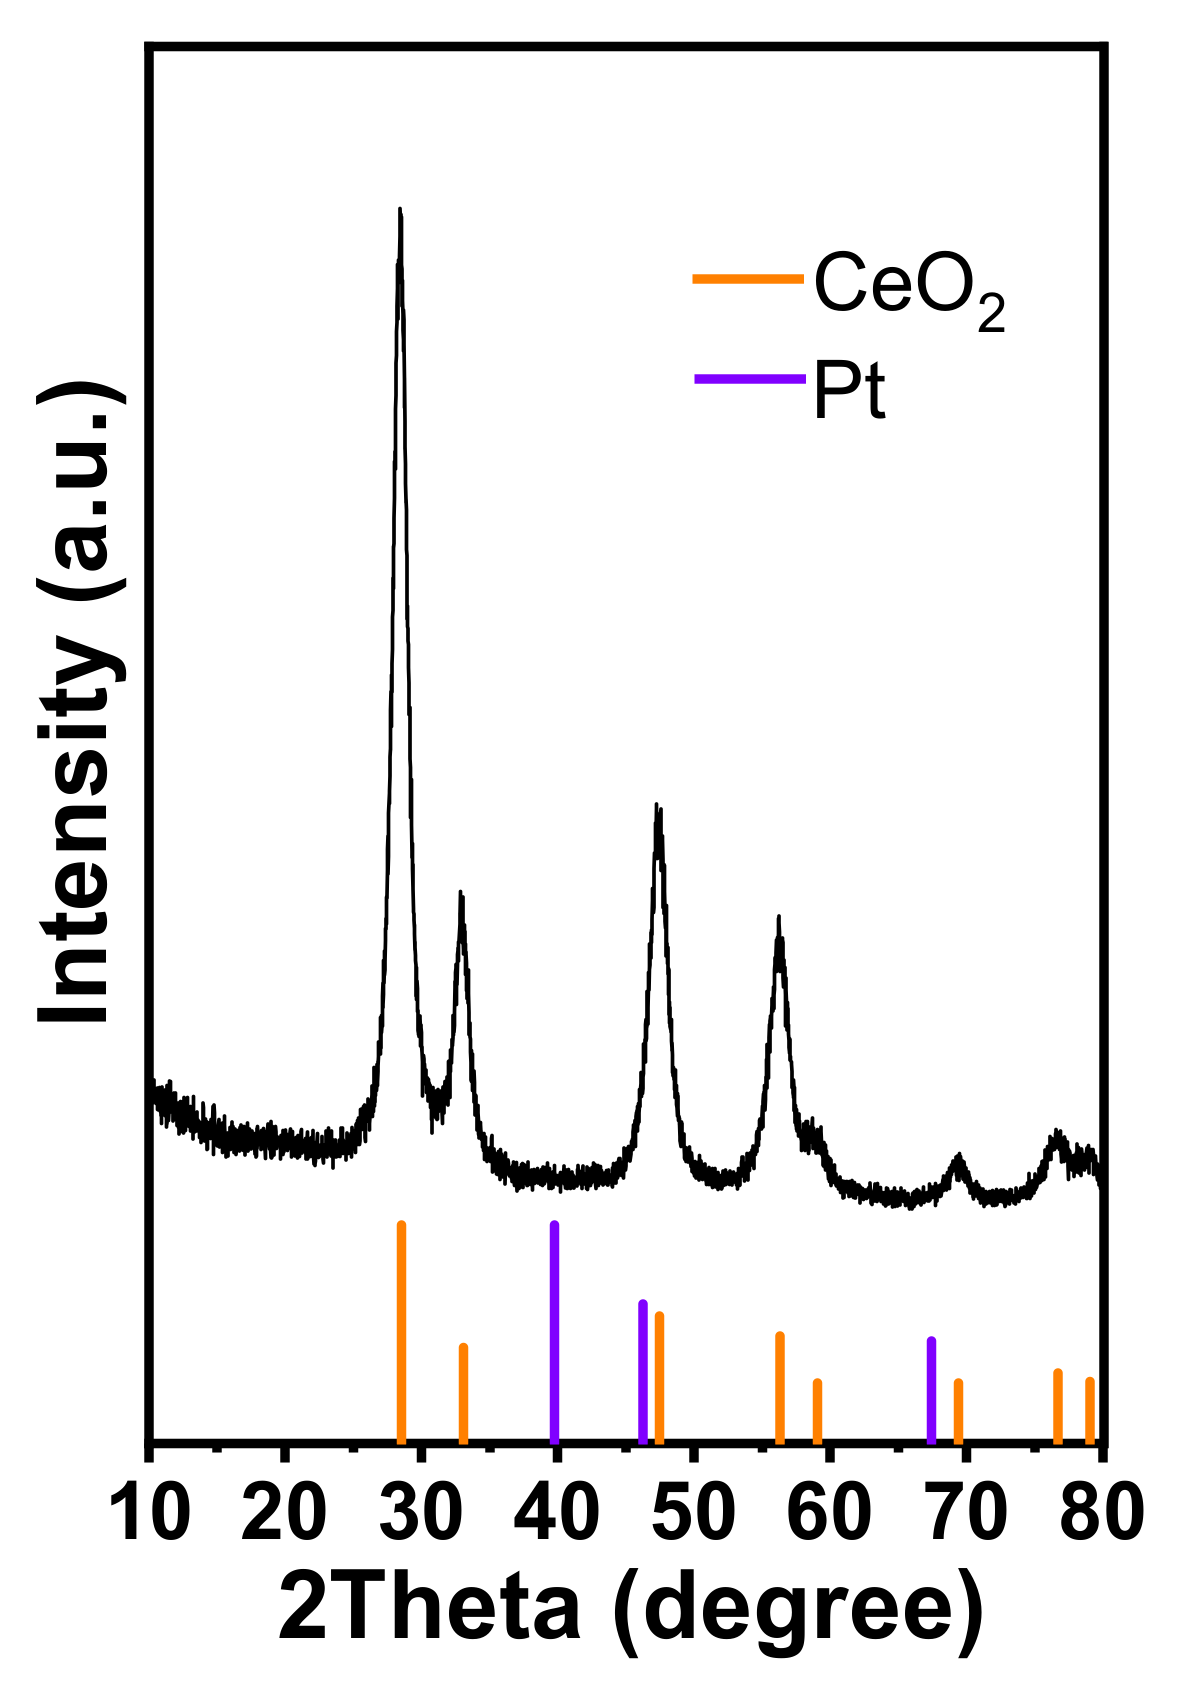
2.1. Characterization of Material Structure
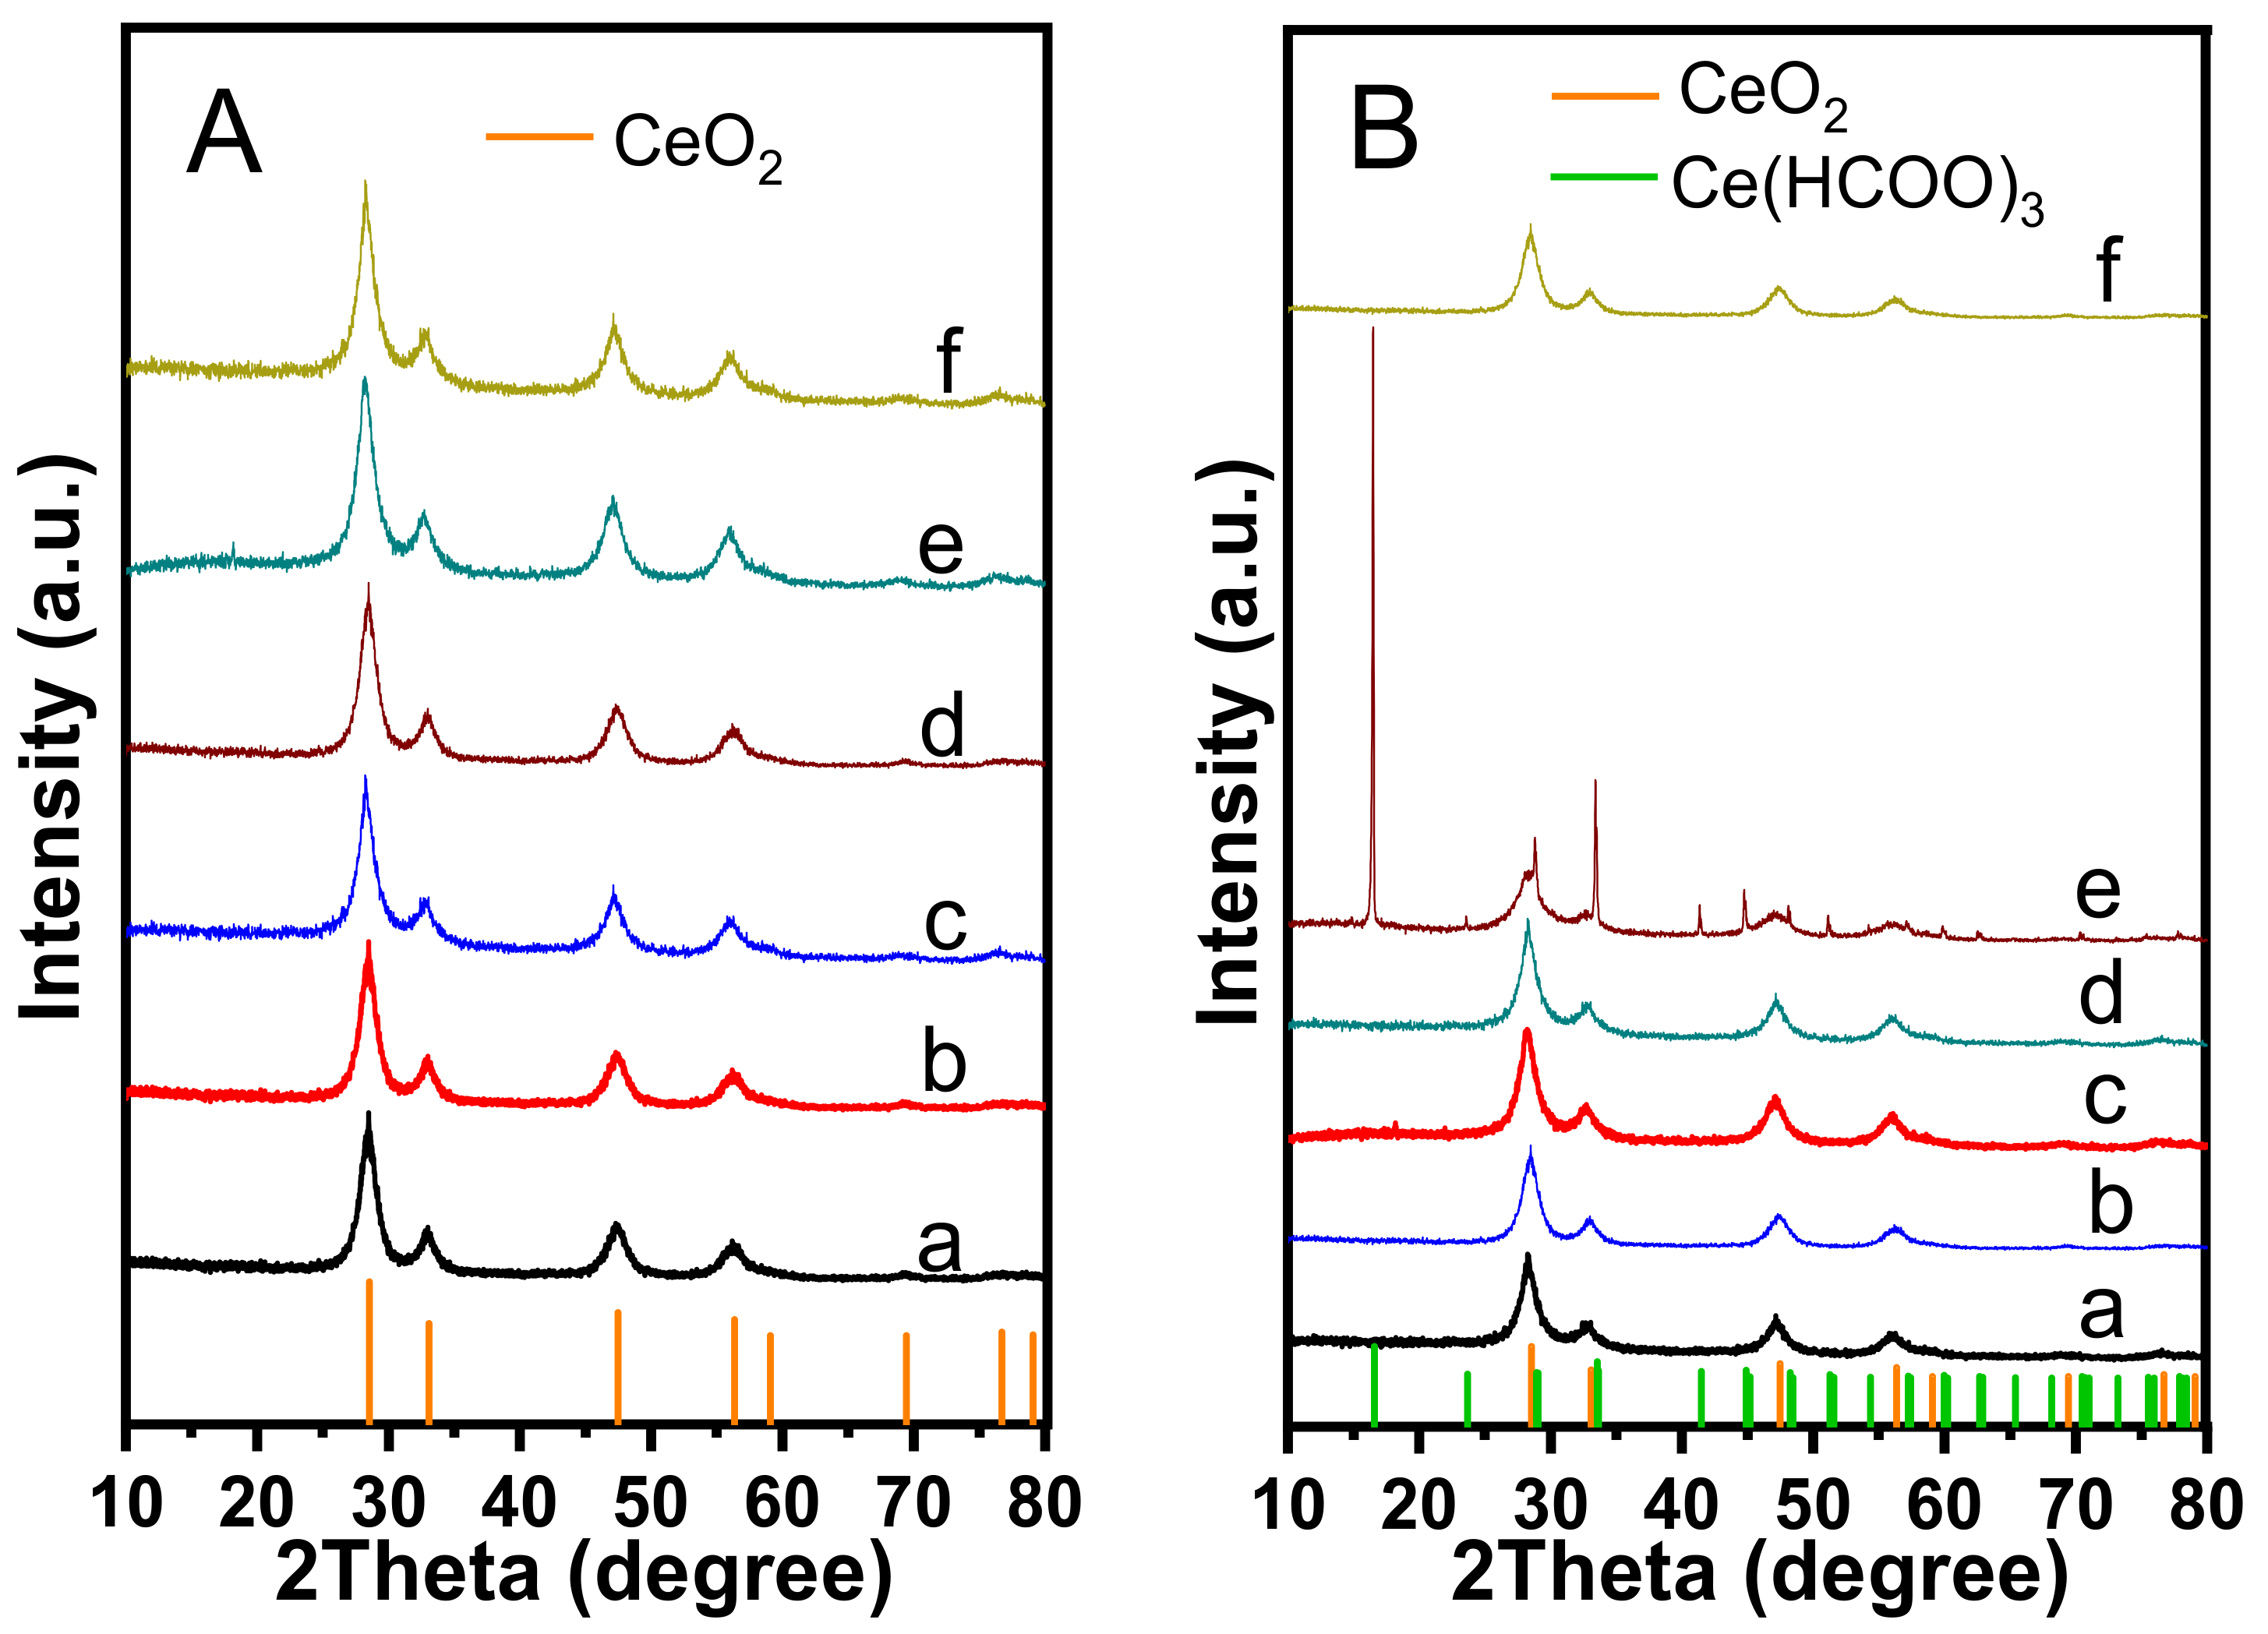
2.2. Research on Synthesis Mechanism
2.3. Toluene Catalytic Combustion Activity
3. Experimental Section
3.1. Materials
3.2. Catalyst Preparation
3.3. Characterization
3.4. Catalytic Combustion of Toluene
4. Conclusions
Author Contributions
Funding
Data Availability Statement
Conflicts of Interest
References
- Bi, F.; Zhang, X.; Chen, J.; Yang, Y.; Wang, Y. Excellent catalytic activity and water resistance of UiO-66-supported highly dispersed Pd nanoparticles for toluene catalytic oxidation. Appl. Catal. B Environ. 2020, 269, 118767. [Google Scholar] [CrossRef]
- Chang, M.; Liu, X.; Ning, P.; Zhang, Q.; Xia, F.; Wang, H.; Wei, G.; Wen, J.; Liu, M.; Hu, J.; et al. Removal of toluene over bi-metallic Pt–Pd-SBA-15 catalysts: Kinetic and mechanistic study. Micropor. Mesopor. Mat. 2020, 302, 110111. [Google Scholar] [CrossRef]
- Li, S.; Wang, D.; Wu, X.; Chen, Y. Recent advance on VOCs oxidation over layered double hydroxides derived mixed metal oxides. Chinese J. Catal. 2020, 41, 550–560. [Google Scholar] [CrossRef]
- Lei, J.; Wang, S.; Li, J. Mesoporous Co3O4 Derived from Facile Calcination of Octahedral Co-MOFs for Toluene Catalytic Oxidation. Ind. Eng. Chem. Res. 2020, 59, 5583–5590. [Google Scholar] [CrossRef]
- Liu, G.; Tian, Y.; Zhang, B.; Wang, L.; Zhang, X. Catalytic combustion of VOC on sandwich-structured Pt@ZSM-5 nanosheets prepared by controllable intercalation. J. Hazard. Mater. 2019, 367, 568–576. [Google Scholar] [CrossRef] [PubMed]
- Li, Q.; Odoom-Wubah, T.; Fu, X.; Mulka, R.; Sun, D.; Zheng, Y.; Jia, L.; Huang, J.; Li, Q. Photoinduced Pt-Decorated Expanded Graphite toward Low-Temperature Benzene Catalytic Combustion. Ind. Eng. Chem. Res. 2020, 59, 11453–11461. [Google Scholar] [CrossRef]
- Wang, Z.; Ma, P.; Zheng, K.; Wang, C.; Liu, Y.; Dai, H.; Wang, C.; Hsi, H.-C.; Deng, J. Size effect, mutual inhibition and oxidation mechanism of the catalytic removal of a toluene and acetone mixture over TiO2 nanosheet-supported Pt nanocatalysts. Appl. Catal. B Environ. 2020, 274, 118963. [Google Scholar] [CrossRef]
- Zhang, L.; Sun, J.; Xiong, Y.; Zeng, X.; Tang, C.; Dong, L. Catalytic performance of highly dispersed WO3 loaded on CeO2 in the selective catalytic reduction of NO by NH3. Chinese J. Catal. 2017, 38, 1749–1758. [Google Scholar] [CrossRef]
- Grabchenko, M.V.; Mamontov, G.V.; Zaikovskii, V.I.; La Parola, V.; Liotta, L.F.; Vodyankina, O.V. The role of metal–support interaction in Ag/CeO2 catalysts for CO and soot oxidation. Appl. Catal. B Environ. 2020, 260, 118148. [Google Scholar] [CrossRef]
- Okal, J.; Zawadzki, M.; Kraszkiewicz, P.; Adamska, K. Ru/CeO2 catalysts for combustion of mixture of light hydrocarbons: Effect of preparation method and metal salt precursors. Appl. Catal. A Gen. 2018, 549, 161–169. [Google Scholar] [CrossRef]
- Guo, Y.; Gao, Y.; Li, X.; Zhuang, G.; Wang, K.; Zheng, Y.; Sun, D.; Huang, J.; Li, Q. Catalytic benzene oxidation by biogenic Pd nanoparticles over 3D-ordered mesoporous CeO2. Chem. Eng. J. 2019, 362, 41–52. [Google Scholar] [CrossRef]
- Wang, Q.; Yeung, K.L.; Bañares, M.A. Ceria and its related materials for VOC catalytic combustion: A review. Catal. Today 2020, 356, 141–154. [Google Scholar] [CrossRef]
- Peng, R.; Li, S.; Sun, X.; Ren, Q.; Chen, L.; Fu, M.; Wu, J.; Ye, D. Size effect of Pt nanoparticles on the catalytic oxidation of toluene over Pt/CeO2 catalysts. Appl. Catal. B Environ. 2018, 220, 462–470. [Google Scholar] [CrossRef]
- Peng, R.; Sun, X.; Li, S.; Chen, L.; Fu, M.; Wu, J.; Ye, D. Shape effect of Pt/CeO2 catalysts on the catalytic oxidation of toluene. Chem. Eng. J. 2016, 306, 1234–1246. [Google Scholar] [CrossRef]
- Lee, S.; Seo, J.; Jung, W. Sintering-resistant Pt@CeO2 nanoparticles for high-temperature oxidation catalysis. Nanoscale 2016, 8, 10219–10228. [Google Scholar] [CrossRef]
- Yan, D.; Chen, J.; Jia, H. Temperature-Induced Structure Reconstruction to Prepare a Thermally Stable Single-Atom Platinum Catalyst. Angew. Chem. Int. Ed. 2020, 59, 13562–13567. [Google Scholar] [CrossRef]
- Lv, H.; Guo, W.; Chen, M.; Zhou, H.; Wu, Y. Rational construction of thermally stable single atom catalysts: From atomic structure to practical applications. Chinese J. Catal. 2022, 43, 71–91. [Google Scholar] [CrossRef]
- Qu, Y.; Chen, B.; Li, Z.; Duan, X.; Wang, L.; Lin, Y.; Yuan, T.; Zhou, F.; Hu, Y.; Yang, Z.; et al. Thermal Emitting Strategy to Synthesize Atomically Dispersed Pt Metal Sites from Bulk Pt Metal. J. Am. Chem. Soc. 2019, 11, 4505–4509. [Google Scholar] [CrossRef]
- Shao, Y.; Jin, Y.; Dong, S. Synthesis of gold nanoplates by aspartate reduction of gold chloride. Chem. Commun. 2004, 1104–1105. [Google Scholar] [CrossRef]
- Wang, J.-G.; Zhou, H.-J.; Sun, P.-C.; Ding, D.-T.; Chen, T.-H. Hollow Carved Single-Crystal Mesoporous Silica Templated by Mesomorphous Polyelectrolyte−Surfactant Complexes. Chem. Mater. 2010, 22, 3829–3831. [Google Scholar] [CrossRef]
- Su, Z.; Yang, W.; Wang, C.; Xiong, S.; Cao, X.; Peng, Y.; Si, W.; Weng, Y.; Xue, M.; Li, J. Roles of Oxygen Vacancies in the Bulk and Surface of CeO2 for Toluene Catalytic Combustion. Environ. Sci. Technol. 2020, 54, 12684–12692. [Google Scholar] [CrossRef] [PubMed]
- Carltonbird, M.; Eaimsumang, S.; Pongstabodee, S.; Boonyuen, S.; Smith, S.M.; Luengnaruemitchai, A. Effect of the exposed ceria morphology on the catalytic activity of gold/ceria catalysts for the preferential oxidation of carbon monoxide. Chem. Eng. J. 2018, 344, 545–555. [Google Scholar] [CrossRef]
- Liang, X.; Wang, X.; Zhuang, Y.; Xu, B.; Kuang, S.; Li, Y. Formation of CeO2-ZrO2 solid solution nanocages with controllable structures via kirkendall effect. J. Am. Chem. Soc. 2008, 130, 2736–2737. [Google Scholar] [CrossRef] [PubMed]
- Li, T.; Xiang, G.; Zhuang, J.; Wang, X. Enhanced catalytic performance of assembled ceria necklace nanowires by Ni doping. Chem. Commun. 2011, 47, 6060–6062. [Google Scholar] [CrossRef] [PubMed]
- Liang, X.; Xiao, J.; Chen, B.; Li, Y. Catalytically stable and active CeO2 mesoporous spheres. Inorg. Chem. 2010, 49, 8188–8190. [Google Scholar] [CrossRef]
- Shen, S.; Wang, X. Controlled growth of inorganic nanocrystals: Size and surface effects of nuclei. Chem. Commun. 2010, 46, 6891–6899. [Google Scholar] [CrossRef]
- Guo, Z.Y.; Zhu, Y.; Meng, F.F.; Du, F.L. Facile Reflux Method Synthesis, Photo-Catalyst and Electrochemical Properties of Micro-Sized Subuliform CeO2. Sci. Adv. Mater. 2014, 6, 2688–2693. [Google Scholar] [CrossRef]
- Jiang, Z.; He, C.; Dummer, N.F.; Shi, J.; Tian, M.; Ma, C.; Hao, Z.; Taylor, S.H.; Ma, M.; Shen, Z. Insight into the efficient oxidation of methyl-ethyl-ketone over hierarchically micro-mesostructured Pt/K-(Al)SiO2 nanorod catalysts: Structure-activity relationships and mechanism. Appl. Catal. B Environ. 2018, 226, 220–233. [Google Scholar] [CrossRef]
- Qiu, Y.; Li, X.; Zhang, Y.; Xie, C.; Zhou, S.; Wang, R.; Luo, S.-Z.; Jing, F.; Chu, W. Various Metals (Ce, In, La, and Fe) Promoted Pt/Sn-SBA-15 as Highly Stable Catalysts for Propane Dehydrogenation. Ind. Eng. Chem. Res. 2019, 58, 10804–10818. [Google Scholar] [CrossRef]
- Kondratowicz, T.; Drozdek, M.; Michalik, M.; Gac, W.; Gajewska, M.; Kuśtrowski, P. Catalytic activity of Pt species variously dispersed on hollow ZrO2 spheres in combustion of volatile organic compounds. Appl. Surf. Sci. 2020, 513, 145788. [Google Scholar] [CrossRef]
- Chen, L.N.; Hou, K.P.; Liu, Y.S.; Qi, Z.Y.; Zheng, Q.; Lu, Y.H.; Chen, J.Y.; Chen, J.L.; Pao, C.W.; Wang, S.B.; et al. Efficient Hydrogen Production from Methanol Using a Single-Site Pt1/CeO2 Catalyst. J. Am. Chem. Soc. 2019, 141, 17995–17999. [Google Scholar] [CrossRef] [PubMed]
- Wang, Z.; Yang, H.; Liu, R.; Xie, S.; Liu, Y.; Dai, H.; Huang, H.; Deng, J. Probing toluene catalytic removal mechanism over supported Pt nano- and single-atom-catalyst. J. Hazard. Mater. 2020, 392, 122258. [Google Scholar] [CrossRef] [PubMed]
- Tang, Y.; Wang, Y.-G.; Li, J. Theoretical Investigations of Pt1@CeO2 Single-Atom Catalyst for CO Oxidation. J. Phys. Chem. C 2017, 121, 11281–11289. [Google Scholar] [CrossRef]
- Ye, X.; Wang, H.; Lin, Y.; Liu, X.; Cao, L.; Gu, J.; Lu, J. Insight of the stability and activity of platinum single atoms on ceria. Nano Res. 2019, 12, 1401–1409. [Google Scholar] [CrossRef]
- Buitrago-Sierra, R.; Serrano-Ruiz, J.C.; Rodríguez-Reinoso, F.; Sepúlveda-Escribano, A.; Dumesic, J.A. Ce promoted Pd-Nb catalysts for γ-valerolactone ring-opening and hydrogenation. Green Chem. 2012, 14, 3318–3324. [Google Scholar] [CrossRef]
- Jiang, Z.; Jing, M.; Feng, X.; Xiong, J.; He, C.; Douthwaite, M.; Zheng, L.; Song, W.; Liu, J.; Qu, Z. Stabilizing platinum atoms on CeO2 oxygen vacancies by metal-support interaction induced interface distortion: Mechanism and application. Appl. Catal. B Environ. 2020, 278, 119304. [Google Scholar] [CrossRef]
- Kunwar, D.; Zhou, S.; DeLaRiva, A.; Peterson, E.J.; Xiong, H.; Pereira-Hernández, X.I.; Purdy, S.C.; Veen, R.T.; Brongersma, H.H.; Miller, J.T.; et al. Stabilizing High Metal Loadings of Thermally Stable Platinum Single Atoms on an Industrial Catalyst Support. ACS Catal. 2019, 9, 3978–3990. [Google Scholar] [CrossRef]


| Sample | BET Surface Area (m2/g) | Micropore Size (nm) | Secondary Pore Size (nm) | Pore Volume (cm3/g) |
|---|---|---|---|---|
| CeO2-NS | 75 | ~1.5 | 10–100 | 0.10 |
| Pt/CeO2-NS | 70 | ~1.5 | 10–100 | 0.11 |
| Catalyst | Pt Loading Amount (wt%) | T50 (°C) | T90 (°C) |
|---|---|---|---|
| Pt/CeO2-NS | 1.14 | 224 | 237 |
| Pt/CeO2 | 1.16 | 283 | 304 |
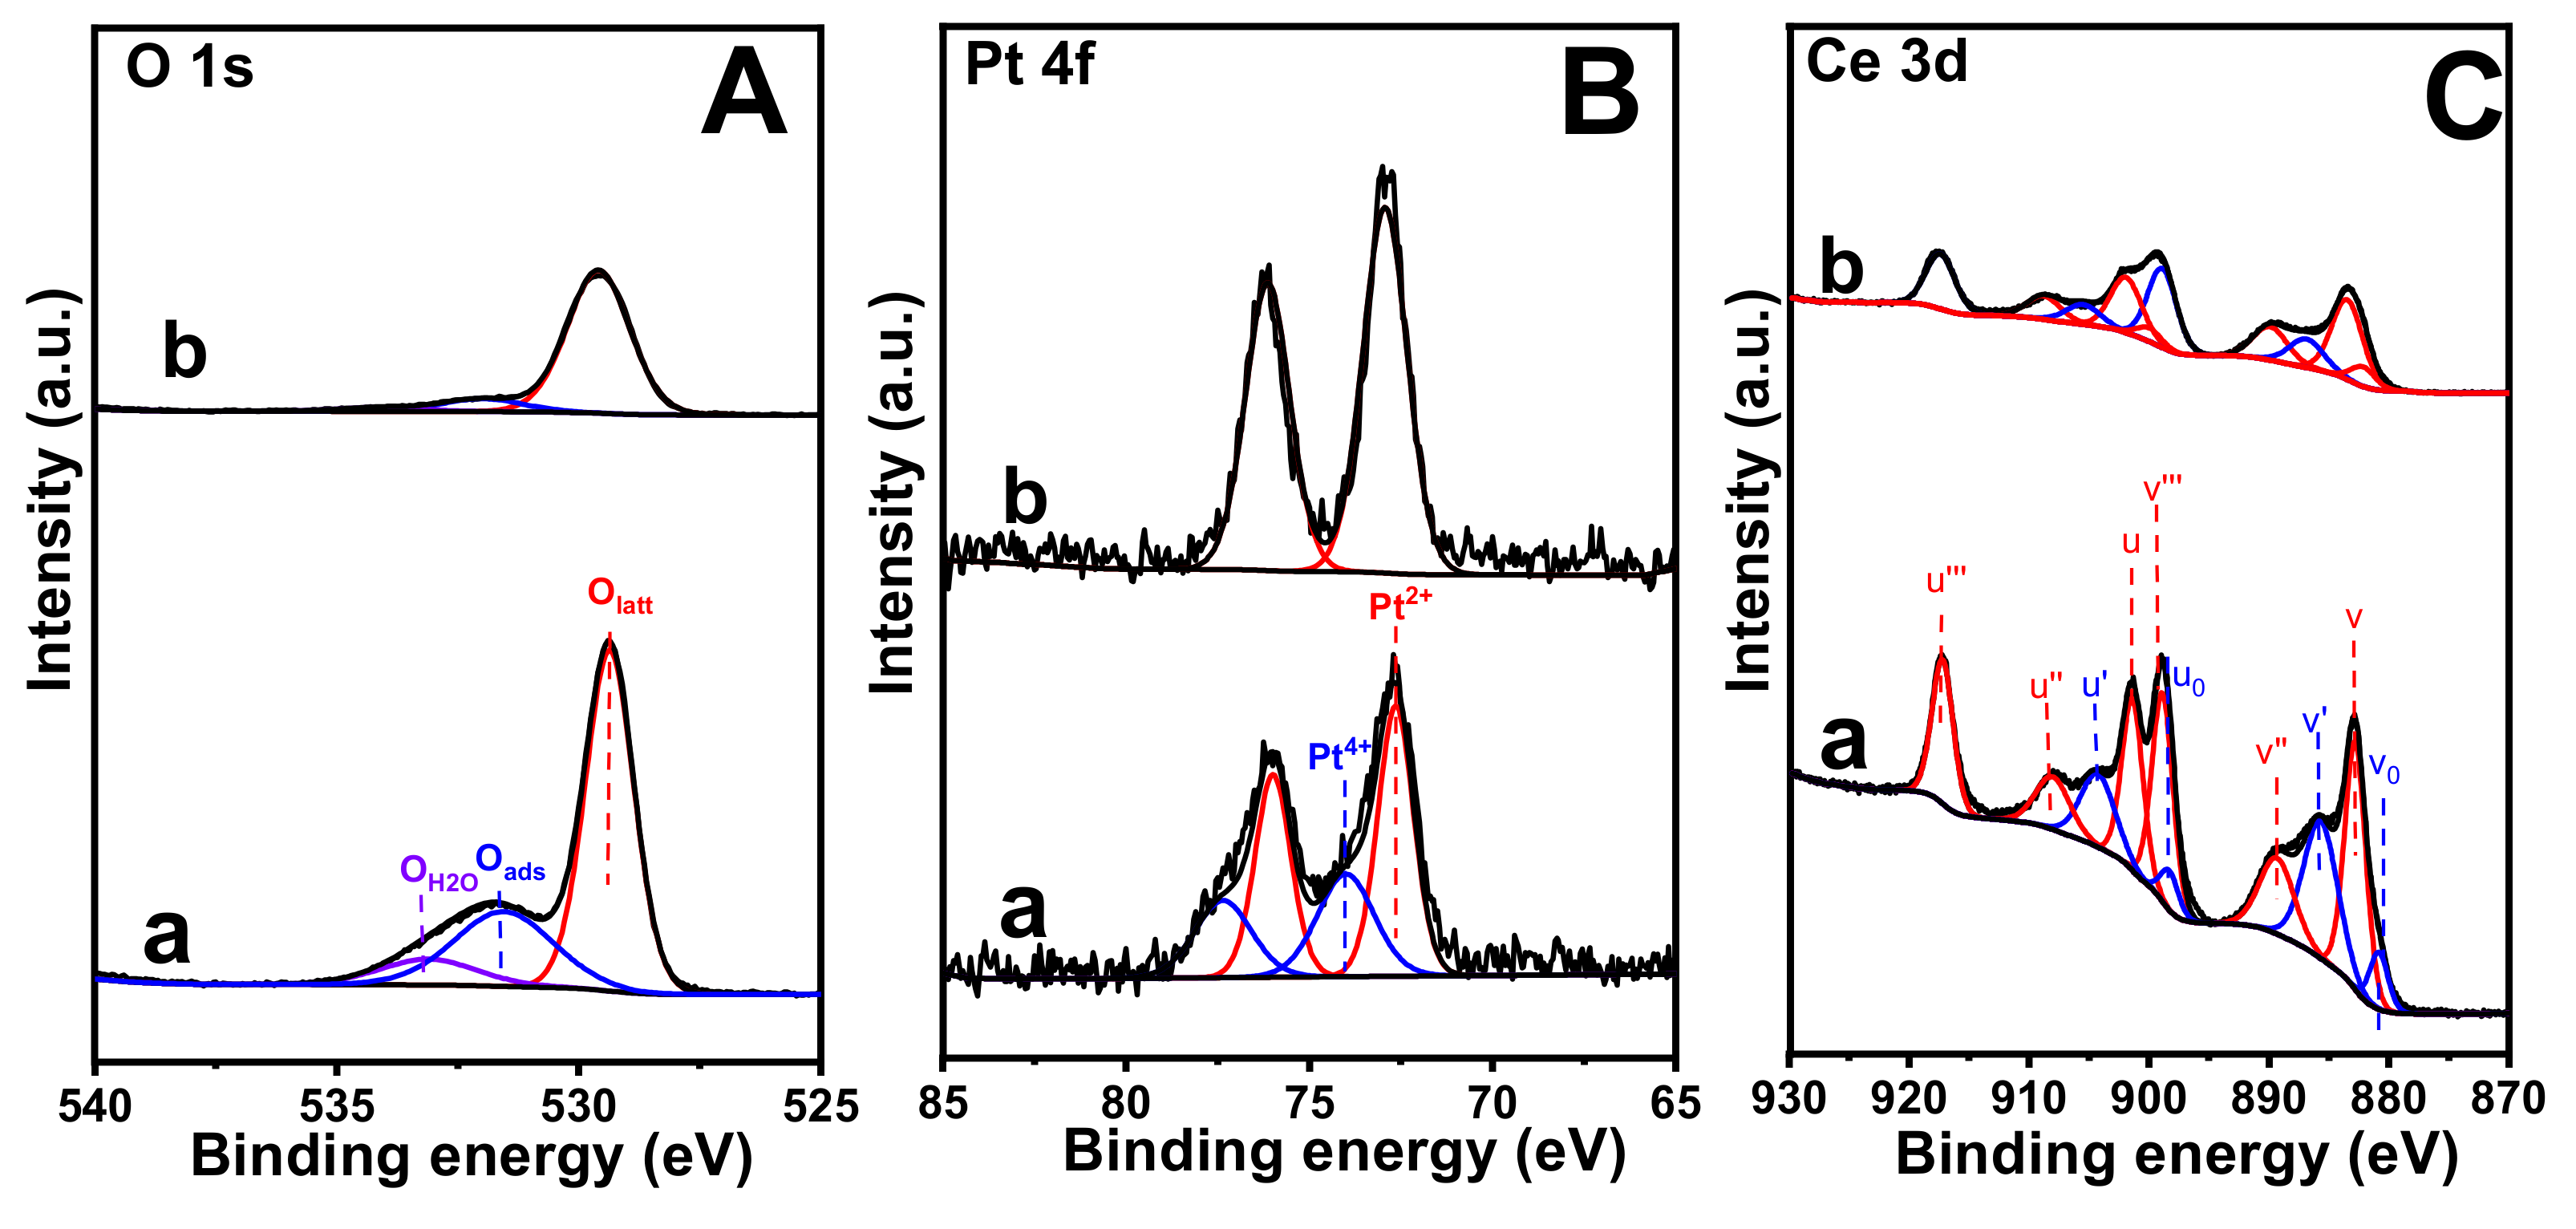
| Catalyst | Oads/Olatt+Oads+OH2O | Pt4+/Pt2++Pt4+ | Ce3+/Ce3++Ce4+ |
|---|---|---|---|
| Pt/CeO2-NS | 0.28 | 0.39 | 0.30 |
| Pt/CeO2 | 0.11 | — | 0.20 |
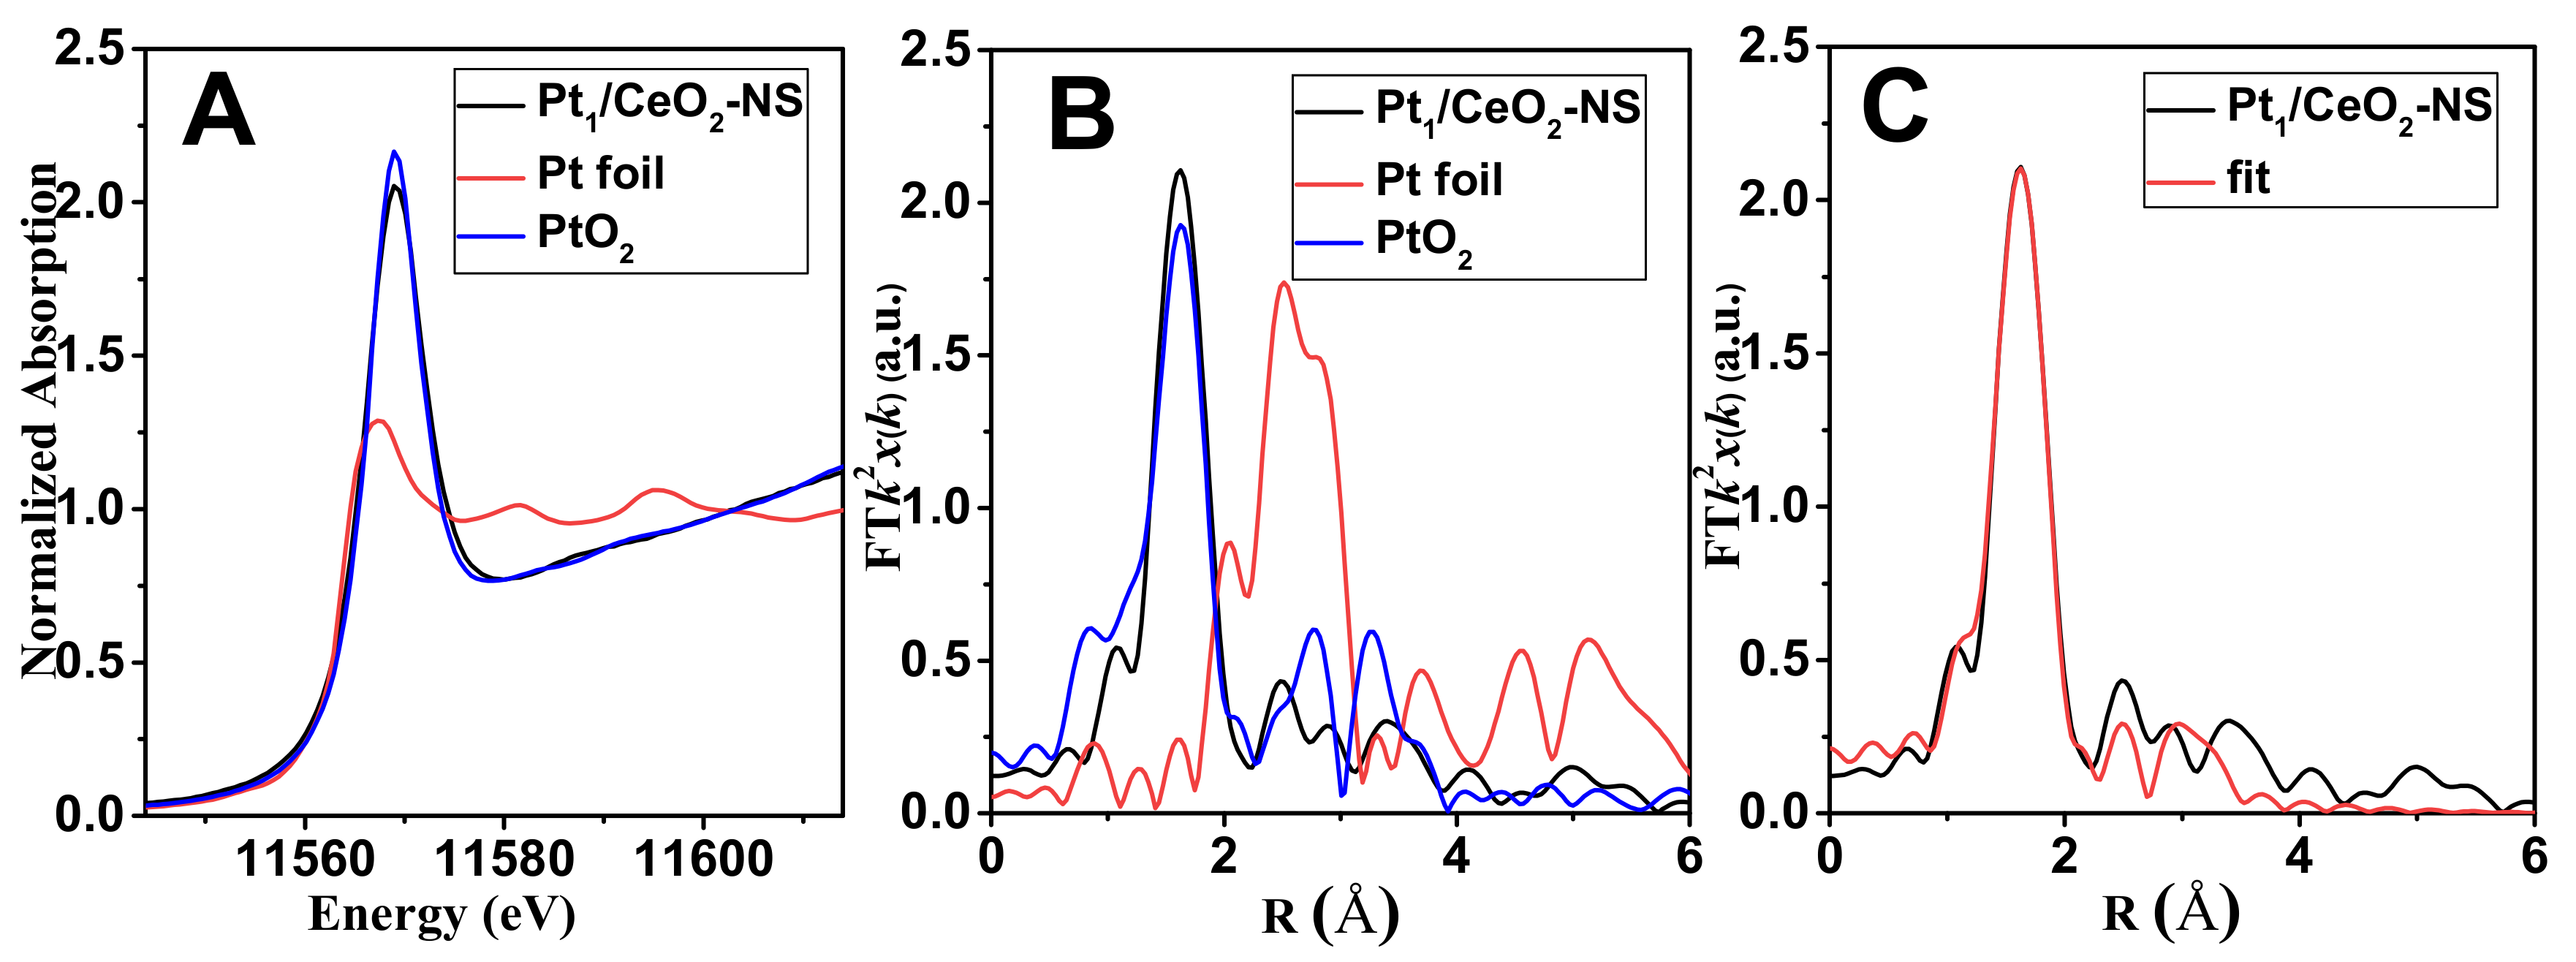
| Sample | Shell | CN a | R (Å) b | σ2 c | ΔE0 d | R Factor |
|---|---|---|---|---|---|---|
| Pt/CeO2-NS | Pt-O | 5.2 ± 0.3 | 2.00 ± 0.01 | 0.0017 | 11.0 ± 1.7 | 0.0132 |
| Pt-O1 | 1.4 ± 0.6 | 2.45 ± 0.03 | 0.0016 | |||
| Pt-O-Ce | 2.0 ± 1.4 | 3.20 ± 0.04 | 0.0071 |
Publisher’s Note: MDPI stays neutral with regard to jurisdictional claims in published maps and institutional affiliations. |
© 2022 by the authors. Licensee MDPI, Basel, Switzerland. This article is an open access article distributed under the terms and conditions of the Creative Commons Attribution (CC BY) license (https://creativecommons.org/licenses/by/4.0/).
Share and Cite
Hao, Y.; Chen, S.; Zhang, X.; Chen, T. L-asparagine Assisted Synthesis of Pt/CeO2 Nanospheres for Toluene Combustion. Catalysts 2022, 12, 887. https://doi.org/10.3390/catal12080887
Hao Y, Chen S, Zhang X, Chen T. L-asparagine Assisted Synthesis of Pt/CeO2 Nanospheres for Toluene Combustion. Catalysts. 2022; 12(8):887. https://doi.org/10.3390/catal12080887
Chicago/Turabian StyleHao, Yu, Shaohua Chen, Xueyin Zhang, and Tiehong Chen. 2022. "L-asparagine Assisted Synthesis of Pt/CeO2 Nanospheres for Toluene Combustion" Catalysts 12, no. 8: 887. https://doi.org/10.3390/catal12080887