Article

An In-Depth Exploration of the Electrochemical Oxygen Reduction Reaction (ORR) Phenomenon on Carbon-Based Catalysts in Alkaline and Acidic Mediums

1
Advanced Energy Systems and Microdevices Laboratory, Department of Mechanical and Industrial Engineering, New Jersey Institute of Technology, Newark, NJ 07102, USA
2
Department of Mechanical Engineering, Weber State University, Ogden, UT 84408, USA
*
Author to whom correspondence should be addressed.
These authors contributed equally to this work.
Catalysts 2022, 12(7), 791; https://doi.org/10.3390/catal12070791
Submission received: 22 June 2022 / Revised: 13 July 2022 / Accepted: 17 July 2022 / Published: 19 July 2022
(This article belongs to the Special Issue Graphene in Photocatalysis/Electrocatalysis)

Abstract

:
Detailed studies of the electrochemical oxygen reduction reaction (ORR) on catalyst materials are crucial to improving the performance of different electrochemical energy conversion and storage systems (e.g., fuel cells and batteries), as well as numerous chemical synthesis processes. In the effort to reduce the loading of expensive platinum group metal (PGM)-based catalysts for ORR in the electrochemical systems, many carbon-based catalysts have already shown promising results and numerous investigations on those catalysts are in progress. Most of these studies show the catalyst materials’ ORR performance as current density data obtained through the rotating disk electrode (RDE), rotating ring-disk electrode (RRDE) experiments taking cyclic voltammograms (CV) or linear sweep voltammograms (LSV) approaches. However, the provided descriptions or interpretations of those data curves are often ambiguous and recondite which can lead to an erroneous understanding of the ORR phenomenon in those specific systems and inaccurate characterization of the catalyst materials. In this paper, we presented a study of ORR on a newly developed carbon-based catalyst, the nitrogen-doped graphene/metal-organic framework (N-G/MOF), through RDE and RRDE experiments in both alkaline and acidic mediums, taking the LSV approach. The functions and crucial considerations for the different parts of the RDE/RRDE experiment such as the working electrode, reference electrode, counter electrode, electrolyte, and overall RDE/RRDE process are delineated which can serve as guidelines for the new researchers in this field. Experimentally obtained LSV curves’ shapes and their correlations with the possible ORR reaction pathways within the applied potential range are discussed in depth. We also demonstrated how the presence of hydrogen peroxide (H2O2), a possible intermediate of ORR, in the alkaline electrolyte and the concentration of acid in the acidic electrolyte can maneuver the ORR current density output in compliance with the possible ORR pathways.

1. Introduction

Oxygen reduction reaction (ORR) is one of the most studied reactions in electrochemistry. The overall performance of different electrochemical energy conversion and storage systems such as fuel cells and batteries, as well as different electrochemical synthesis processes, critically depend on the electrochemical ORR activity on their electrodes [1]. Among the major fuel cell categories, on the cathodes of the electrolyte membrane fuel cell (PEMFC), phosphoric acid fuel cell (PAFC), alkaline fuel cells (AFC) oxygen (O2) is reduced to form water (H2O) or hydroxyl ions (OH) [2,3]. In the solid-oxide fuel cell (SOFC), oxygen is reduced to O2 ions on the cathode which is then transferred to the anode through a compatible solid-oxide electrolyte and reacts with supplied hydrogen to form water. On the cathodes of different energy storage systems, such as lithium-ion batteries, metal (zinc, aluminum, Iron, etc.)-air batteries in the aqueous medium, etc., ORR plays also a crucial role [4]. Electrochemical synthesis of hydrogen peroxide (H2O2) is another major area of research where the electrochemical ORR on the cathode is studied intensively [5,6].
With a slow kinetics, ORR becomes the limiting step for the electrochemical systems; hence, a large number of research groups aim to improve the ORR activity by applying different measures. The use of catalyst materials for electrochemical catalysis of ORR is an area of vast interest among the concerned research groups. Although, the catalysts developed from the platinum (Pt) or platinum-group metals (PGM) were found to possess the superior electrocatalytic property for ORR, these are the precious metals; their high cost contributes significantly to rendering the whole electrochemical system expensive. In this scenario, numerous research groups are evaluating the prospects of carbon-based electrocatalysts for ORR. Being a one-atom-thick layer of sp2 hybridized carbon atoms, arranged in a hexagonal honeycomb form with a unique electronic structure, graphene appeared as a promising candidate for electrocatalyst [7,8]. Although inert in the pristine form, when graphene is doped with different heteroatoms such as nitrogen (N), boron (B), sulfur (S), etc. shows electrocatalytic properties [9,10]. Nitrogen-doped graphene (N-G) draws special research focus as nitrogen atoms can form bonds with the carbon atoms of the graphene lattice in different orientations such as pyridinic-N, graphitic-N, pyrrolic-N, pyridinic-N-oxide, etc.; each of these nitrogen functional groups exhibits unique electronic properties [11,12]. Various studies demonstrated the electrocatalytic activities of N-G materials synthesized through the ORR processes [13,14,15,16,17]. Hybridizing the nitrogen-doped graphene with other compounds to improve the electrocatalytic ORR activities are also reported in numerous studies [18,19,20,21]. In some recent studies, metal-organic framework (MOF) was integrated with N-G to achieve a better electrocatalytic performance than N-G taking the advantage of the high surface area of MOF that can host a higher number of catalytic active sites. Zhuang et al. synthesized nitrogen-doped graphene/metal-organic framework (N-G/MOF) catalyst and demonstrated that its ORR electrocatalytic performance can be comparable to the standard 10% platinum supported by carbon (Pt/C) catalyst in terms of ORR current density and electron transfer number [7,22,23,24,25,26,27,28,29,30,31]. For such promising aspects, in this study, we will use the N-G/MOF electrocatalyst to explore the ORR phenomena in acidic and alkaline mediums/electrolytes.
For the electrochemical characterization of newly developed catalysts for ORR, rotating disk electrode (RDE) or rotating ring disk electrode (RRDE) are the methods of common choice [32]. In the RDE or RRDE setup, an ORR environment is created on the catalyst- coated working electrode surface which mimics the actual ORR environment of the catalyst-coated cathode surface of practical electrochemical systems in acidic or alkaline mediums. The direct 4-electron transfer oxygen reduction reactions (with standard reduction potential vs. Standard Hydrogen Electrode (SHE)) in the alkaline and acidic electrolyte are as follows [2,8,33,34]:
O2 + 2H2O + 4e → 4OH   (0.401 V vs. SHE)
O2 + 4H+ + 4e → 2H2O   (1.229 V vs. SHE)
The oxygen reduction reaction may also follow a two-step 2-electron transfer pathway. In the alkaline electrolyte the generally known 2-electrone transfer ORR steps are:
O2 + 2H2O +2e → HO2 + OH   (−0.065 V vs. SHE)
HO2 + H2O + 2e → 3OH   (0.86 V vs. SHE)
And for the acidic medium the 2-electrone ORR steps:
O2 + 2H+ +2e → H2O2    (0.7 V vs. SHE)
H2O2 + 2H+ + 2e → 2H2O   (1.76 V vs. SHE)
The cathodes of the electrochemical systems or the working electrode of the RDE/RRDE systems, with an applied potential on them, supply the electrons to these electrochemical half-cell reactions (ORR). The current flow generated in the electrochemical system because of this electron flow toward the ORR is known as cathodic current or ORR current. Numerous studies have been conducted to determine the reaction mechanisms of ORR in acidic and alkaline mediums [8,26]. From the studies, it is generally known that the first step of the ORR mechanism is the adsorption of oxygen molecules on the catalyst surface. The ORR pathway on a catalyst surface depends on the intrinsic electronic property of the catalyst (which governs the adsorption energy between catalyst and oxygen) as well as the applied potentials on the electrodes [35].
In the RDE/RRDE setup, linear sweep voltammetry (LSV) and cyclic voltammetry (CV) techniques are generally applied to measure the current generated by ORR on the working electrode for a range of applied potential which is commonly presented as current density (the current obtained for a unit electrode surface area coated with catalyst). Performing such experiments and interpreting the produced LSV or CV data plots often become problematic, especially for the cases of new researchers, as many sensitive factors are involved in this process. In this paper we will explore the ORR current density data plots taken by the LSV approaches in an RDE/RRDE setup in both acidic and alkaline electrolyte conditions.
Reasonable evaluation of the electrocatalytic performance of a catalyst by measuring the ORR current density by RDE/RRDE involves different major considerations such as selecting of proper electrolyte, use of proper reference electrode, preparation of working electrode, the saturation of the electrolyte with oxygen, etc. Overall, it is critical to clearly understand the functions of all the components during the experiment. However, in many literatures, it is not rare to read ambiguous descriptions of the obtained ORR current density data from LSV/CV which may lead to an erroneous conclusion [33,36,37,38,39]. Si et al. documented different studies on electrochemical ORR on various catalyst materials which includes summaries of different studies on ORR on carbon-based material [33]. However, in-depth discussions of the LSV or CV plots that can explain the ORR pathways or steps on carbon-based catalysts at different applied potentials were beyond the scope of their presentation. Wang et al. studied the electrochemical ORR on a glassy carbon electrode (GCE) as well as on single-walled carbon nanotubes (SWNTs)–dihexadecyl hydrogen phosphate (DHP) coated GCE [36]. With the obtained data by RDE experiments in an alkaline medium with GCE, using the Koutecky–Levich plots, they calculated the electron transfer number, n, from 2.0 to 2.8 for a low to high disk potential within the range from −4.6 V to −1.2 V. Such values of electron transfer number created confusion to determine the ORR pathways on GCE surface at different applied potentials, because the electron transfer number 2.8 may suggest a 2-electron transfer ORR pathway where H2O2 is the product, even at the higher applied potential as −1.2 V, which may not be the true case. Further explanation of the ORR phenomenon observed there could have helped to understand the ORR pathways clearly. Jurmann et al. reported the RDE voltammetry curves in their study of ORR on multi-walled carbon nanotubes (MWCNTs)-modified highly oriented pyrolytic graphite (HOPG) [37]. However, they did not see the ORR current plateaus at higher potentials in the curves which would indicate the limiting current densities, although production of hydrogen peroxide (H2O2) was evident at low potentials in their experiments. They also calculated the electron transfer numbers through Koutecky–Levich plots, which were between 2 to 3.3 in the potential range −0.4 to −1.2 V. The electron transfer numbers are directly related to the obtained ORR current from the experiments, they are not solely dependent on the reaction pathways. The property of catalyst materials, number of available catalytic sites on the catalyst, applied potential on the electrode, electrolyte, and its concentration, etc. have direct influents on the obtained ORR current by RDE experiments and hence on the electron transfer numbers. Furthermore, the calculation through Koutecky–Levich equations, has its own error source [38]. Zhang et al. reported LSV curves for both disk current and ring current for ORR on bare GCE and a multilayer film of shortened multiwalled carbon nanotubes (MWNTs) and poly diallyldimethylammonium chloride (PDDA) on GCE through RRDE experiment [39]. At higher potentials, the reduction of the ring-current indicated the reduction of HO2 (an indicator of H2O2 production at lower potentials). Although their data indeed indicated the ORR pathways in the range of applied potentials, however, an elaborate explanation of the shape of the data curves within the potential range would clarify the ORR pathways more effectively.
It is evident from the reviews of the literature on ORR studies on catalyst materials, especially the carbon-based ones by RDE/RRDE experiments, that an in-depth understanding of the obtained LSV or CV curves is still lacking. While performing the RDE/RDE experiments to study the ORR activity on catalysts, it is crucial to notice all the parameters that can affect the obtained data. In this paper, we presented the ORR study on a newly developed carbon-based catalyst N-G/MOF through RDE and RRDE data (LSV) in both acidic and alkaline mediums and elaborately discussed the shape of the LSV curves throughout the potential range with reference to the corresponding possible reaction pathways. Also, this paper has highlighted what to expect from the RDE/RRDE data for ORR on a carbon-based catalyst, what the obtained data suggests, and some important points to lay the ground for the further development of catalyst materials. We have also presented the effects of the presence of H2O2 (a possible intermediate of ORR) in the alkaline electrolyte, and acid concentration for the acidic electrolyte on the RDE and RRDE data. The explanation on how the presence of H2O2 in the alkaline electrolyte and the concentration of acid in the acidic electrolyte could maneuver the obtained ORR current densities from RDE and RRDE experiments is clearly delineated as well.

2. Results and Discussion

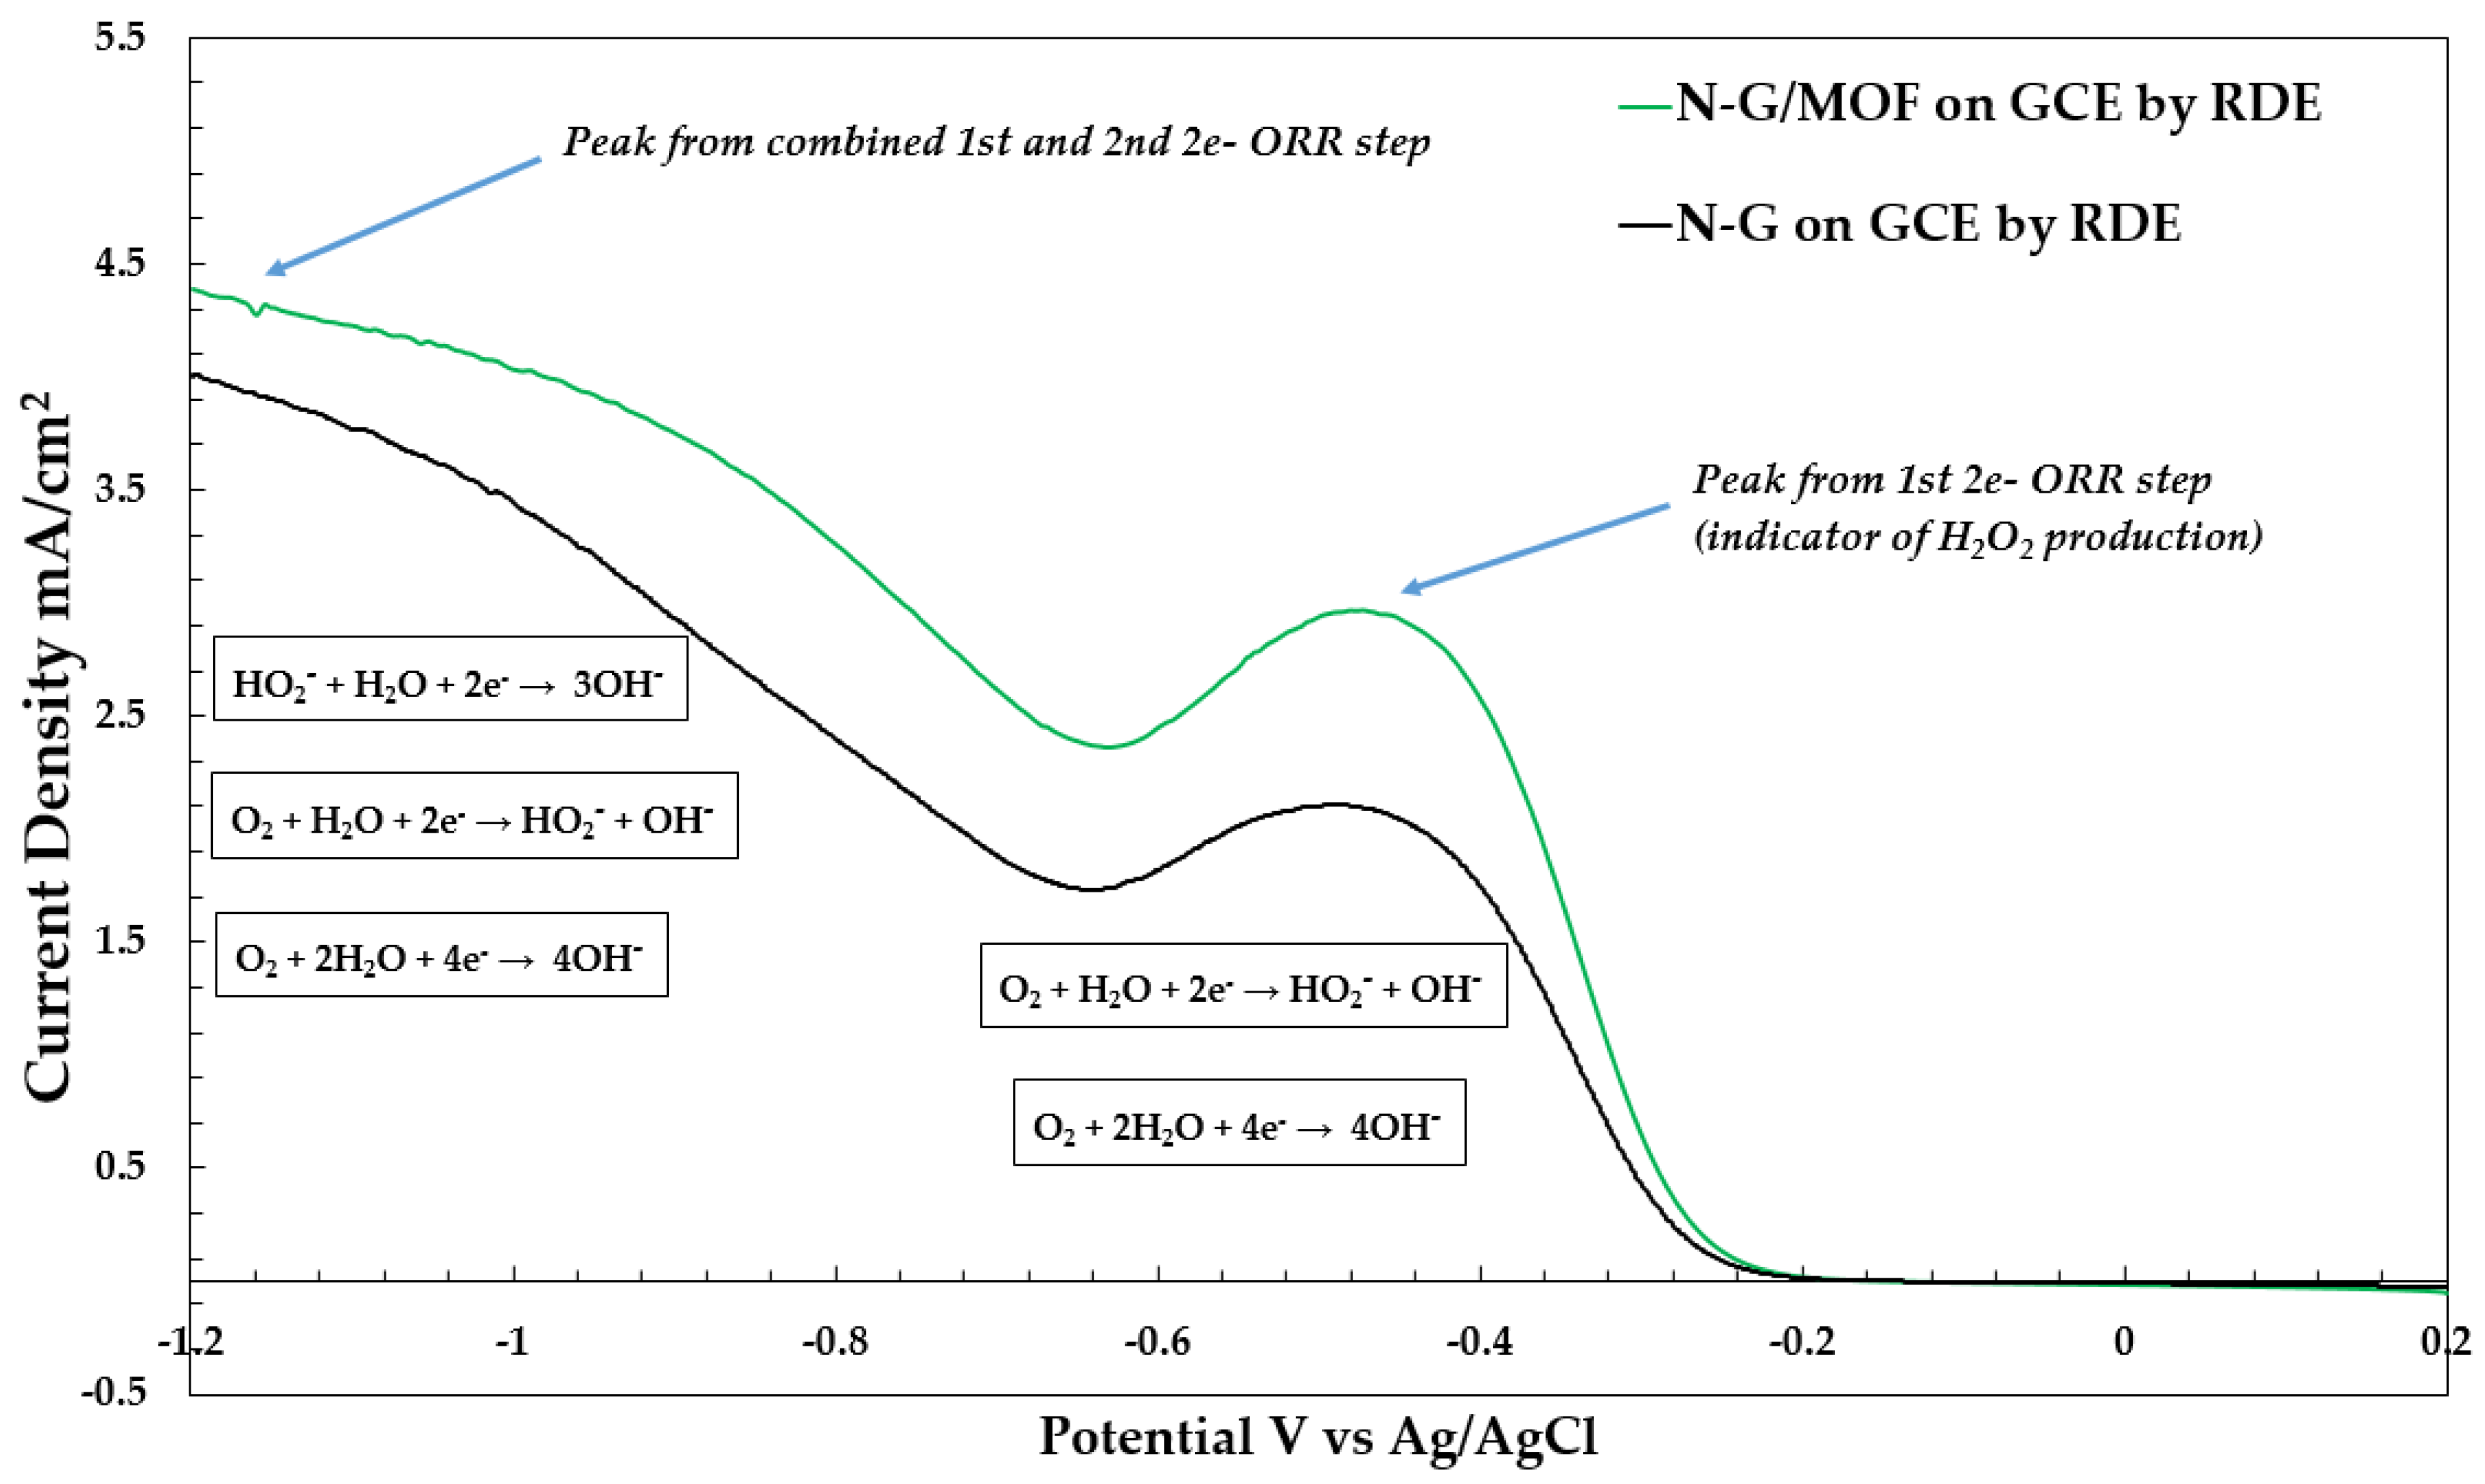
2.1. Exploration of LSV Data of N-G/MOF Catalyst for ORR in Alkaline Medium

The obtained LSV curve for ORR in the 0.1 M KOH alkaline medium on the N-G/MOF catalyst is presented in Figure 1 (the green line). ORR current densities have been measured for applied potential 0.2 V to −1.2 V vs. Ag/AgCl reference electrode. The LSV curve with N-G catalyst before integrating the MOF is also shown in Figure 1 (the black line). From the comparison of these two LSV curves we can see the improvement brought by the MOF integration to the catalyst material in terms of the obtained current densities. At the −1.2 V, the obtained current density for the N-G catalyst was found around 4 mA/cm2 while the N-G/MOF catalyst produced around 4.4 mA/cm2. The comparison of the generated ORR current densities by N-G/MOF catalyst with that of other established electrocatalysts for ORR was presented in our previous studies [23,24,25,28,30]. In this study, we intend to follow the LSV curve from 0.2 V (right) to −1.2 V (left) and discuss the ORR pathways on the N-G/MOF catalyst in this applied potential range.
It is generally seen that most of the newly developed carbon-based electrocatalysts for ORR produce LSV curves of a similar appearance to the one in Figure 1. The obtained value of ORR current density at a specific applied potential depends on many factors, however, the characteristic of the catalyst material, applied potential, and concentration of the reactant species play key roles in the electrochemical reactions. As we used an Ag/AgCl reference electrode, below the ORR steps in the alkaline medium with corresponding standard reduction potentials or thermodynamic electrode potential against the Ag/AgCl reference electrode are presented (converted from standard reduction potentials vs. SHE; based on the potential difference between SHE and Ag/AgCl reference electrodes). Our discussions in the later sections will proceed in the context of applied potentials on WE with respect to the Ag/AgCl reference electrode.
The direct 4-electron transfer ORR:
O2 + 2H2O + 4e → 4OH   (0.206 V vs. Ag/AgCl)
The probable two 2-electron transfer ORR step reactions are:
O2 + H2O + 2e → OH + HO2   (−0.26 V vs. Ag/AgCl)
HO2 + H2O + 2e → 3OH   (0.686 V vs. Ag/AgCl)
Conventionally, the reduction potentials are presented with positive signs with the reactions. For instance, the standard reduction potential vs. Ag/AgCl for the reaction (7) theoretically means that if this reaction is coupled with an Ag/AgCl reference electrode, the reaction (7) will move forward (as shown), and the required electron for this reaction will come from the oxidation reaction inside the Ag/AgCl half cell (Ag + Cl → AgCl + e). And for these two reduction and oxidation reactions, the measured cell voltage will be +0.206 V. For reaction step (9) the red-ox phenomenon is similar to the reaction (7) when coupled with Ag/AgCl reference electrode, as suggested by the measured standard reduction potential. And the higher value of standard reduction potential for reaction (9) than the reaction (7) indicates that the likelihood of reduction reaction (9) is higher than the reduction reaction (7). Conversely, the negative standard reduction potential for the reaction (8) indicates that if coupled with Ag/AgCl RE, the reaction will move backward (OH + HO2 → O2 + H2O + 2e) which will be an oxidation reaction in that case. It is important to note here that the standard reduction potentials mentioned above for the reaction are only for the standard conditions, the value of reduction potentials may appear different when factors such as reaction temperature, the concentration of reactants, characteristics of the catalyst material, etc. vary. However, in the electrochemical cells, an external potential is applied on the WE which is in contact with the electrolyte. This applied potential to WE tends to counter the reduction potentials of the reactions of interest if both potentials are of the same sign (e.g., both positive; both tend to draw electrons). Standard reduction potentials for the reaction can provide an estimation where in the applied potential range the reduction potentials of the reactions may overcome the effect of the applied potential on the WE and the reduction process may start.
To study the ORR in the RDE/RRDE experiments, the WE is made the cathode, which means the potential at the WE is made negative and the negative potential is gradually increased up to a range. The more the applied negative potential, the WE can transfer the electrons toward the reactants more conveniently. As discussed earlier, this is done by making the electrolyte gradually more positive compared to the WE. In other words, the electrolyte’s tendency to draw electrons from the WE is gradually increased. In this scenario, the reaction or reaction step with lower standard reduction potential is most likely to appear first. In the case of our RDE/RRDE experiments, as the properties of our catalyst (N-G/MOF) surface for ORR is not fully discovered yet, the reduction potentials of the ORR steps on N-G/MOF may deviate from the standard reduction potential of the reactions [8,40]. However, for our RDE experiments in specific conditions, as the same catalyst, electrolyte, oxygen saturation, reaction temperature, etc., are applied, the ORR reactions or reaction steps are expected to appear maintaining the order of their corresponding standard reduction potentials from lower to higher. Reduction reaction step (8) is expected to appear at the lowest applied negative potential on WE. Reaction (7) may require a higher negative applied potential to occur than reaction (8). And the reaction step (9) is more likely to take place at a higher applied negative potential on WE than reactions (7) and (8).
In Figure 1, the LSV curve the ORR current densities, throughout the applied potential range, are presented in a positive y-direction. A trace of oxidation current (in the negative y-axis) is seen near 0.2 V. Although no hydrogen (H2) was supplied to the electrolyte prior to the tests which could be oxidized at that positive applied potential (H2 → 2H+ + 2e), considering the practical scenario the presence of trace amount of hydrogen molecules in the electrolyte cannot be ignored. Also, there is a possibility of the reaction (8) moving backward (oxidation: OH + HO2 → O2 + H2O + 2e) at around 0.2 V. The standard reduction potential for this reaction step also indicates that. However, the scarcity of HO2 species in the electrolyte at the beginning of the test did not allow such a probable oxidation reaction to forward significantly to produce a large oxidation current. From 0.2 V to around −0.2 V almost no ORR current appeared which indicates that none of the proposed ORR steps took place in this applied potential range.
Beyond −0.2 V the ORR current started to appear and reached the first pear at around −0.47 V. In reference to the standard reduction potential, this raise of ORR current could possibly be the outcome of reaction (7), the direct 4-electron transfer ORR, or reaction (8), the first step of 2-electron transfer ORR mechanism or a combination of both. From the competing ORR reaction/reaction steps, the one which will get preference in a certain ORR environment greatly depend on the property of the catalyst material, which is referred to as the selectivity of the catalyst. Through numerous studies, it is now known that the ORR mechanism begins with the adsorption of oxygen molecules on the catalyst’s active sites [35]. This adsorption of oxygen can be presented as the ‘catalyst⋯O-O’ bond. The energy of the ‘catalyst⋯O’ adsorption bond is one of the key factors that determine the products of the ORR step. In general, on the platinum (Pt) catalyst, the when a proton and electron (H+ and e) are added to the ‘Pt⋯O-O’ and forms ‘Pt⋯O-O-H’, the adsorption energy of ‘Pt⋯O’ is relatively higher which leads to the dissociation of O-O bond, and O-H can break free from the site. This can lead to a direct 4-electron transfer ORR mechanism. However, for most the carbon-based catalyst, the ‘C⋯O’ adsorption bond breaks before the O-O bond dissociation, thus O-O-H (HO2) species can be produced, which leads to a 2-electron transfer ORR mechanism. On the N-G/MOF catalyst, the obtained current densities at the applied potential range from −0.2 to the first peak/plateau around −0.47 can provide an indication of the ORR path there. It is possible to calculate the electron transfer number at −0.47 V, considering the current density peak/plateau at around −0.47 V as the limiting current density jL = 2.97 mA/cm2 using the Levich equation [34]:
jL = 0.201 n F Do2/3 ν−1/6 Co ω1/2
or
n = jL/(0.201 F Do2/3 ν−1/6 Co ω1/2)
Here, ω is the working electrode’s rotational speed with the unit of rpm, n is the electron transfer number, F is the Faraday constant (96485 C/mol), Do is the diffusion coefficient of O2 in 0.1 M KOH (1.93 × 10⁻⁵ cm2·s−1), ν is the kinematic viscosity of O2 in 0.1 M KOH (1.09 × 10⁻² cm2·s−1), Co is the saturation concentration of O2 in 0.1 M KOH at 1 atm (1.26 × 10⁻⁶ mol·cm−3). The calculated electron transfer number at −0.47 V is 2.57. This value of the electron transfer number at −0.47 V suggests on the N-G/MOF catalyst surface, the first step of 2-electron transfer ORR, reaction (7), most possibly the dominant one in the potential range from −0.2 V to the −0.47 V. The direct 4-electron transfer ORR may also occur in some active sites of the N-G/MOF catalyst.
The current density values in the LSV curves also critically depend on the number of the catalytic active sites that can facilitate the ORR mechanism (especially the initial adsorption of oxygen molecules). Without sufficient active sites on the catalytic/electrode surface, regardless of the selected ORR paths, the obtained current density value will be lower than expected. This phenomenon is often encountered on glassy carbon (GC) electrodes. The calculated electron transfer number from our experiment indicates the presence of sufficient catalytic active sites for ORR on the N-G/MOF catalyst. The formation of the first ORR current density plateau is also correlated with the number of catalytic active sites. At the applied potential around −0.47 V, the rate of ORR through the rection (7) could reach its highest as there are enough reactants (O2 and H2O) in the electrolyte, also, the applied potential is favorable for the reaction step. In this condition, the number of active sites drew the limit for the ORR rate which results in the first ORR current density plateau, as seen in Figure 1.
As further negative potentials then the first ORR peak/plateau are applied, a reduction in the current density is observed in Figure 1, which reached a lowest of about 2.36 mA/cm2 at around −0.63 V. In literature, such a feature is often seen in the LSV or CV curves for ORR. In such higher applied negative potentials around −0.63 V, the reaction (7) rate increases. At this condition, near the catalytic active sites, the concentration of the product HO2 and OH from reaction (7) increases rapidly which may have created a barrier for the incoming oxygen molecules to reach the active sites [35]. The overall ORR process may be hampered due to such phenomena and a drop in the current density was seen at around −0.63 V. Also, the reaction step (9) rate is most likely to be considerably low around −0.63 V on the N-G/MOG catalyst, which is also indicated by the standard reduction potential for this reaction step. The product HO2 from reaction (7) is a reactant for reaction (9). If reaction (9) rate was fast enough before −0.63 V, this would rapidly consume the HO2 produced from reaction (7) and the drop in the current density around −0.63 V most possible would not appear.
At more negative applied potentials than −0.63 V, the current density started to rise again which indicates the activation of both reaction (8), and reaction (9); rapid production, and consumption of ORR intermediates. The direct 4-electron transfer ORR (7) could also simultaneously take place at higher applied potentials. As a result, the ORR current density gradually reached a second plateau around at around −1.2 V. Based on this second ORR plateau, the limiting current density is found a 4.39 mA/cm2. From this limiting current density, the electron transfer is calculated around 3.8 at −1.2 V. This also confirms the complete reduction of oxygen molecule on N-G/MOF catalyst in the alkaline medium through 4 electrons transfer process.

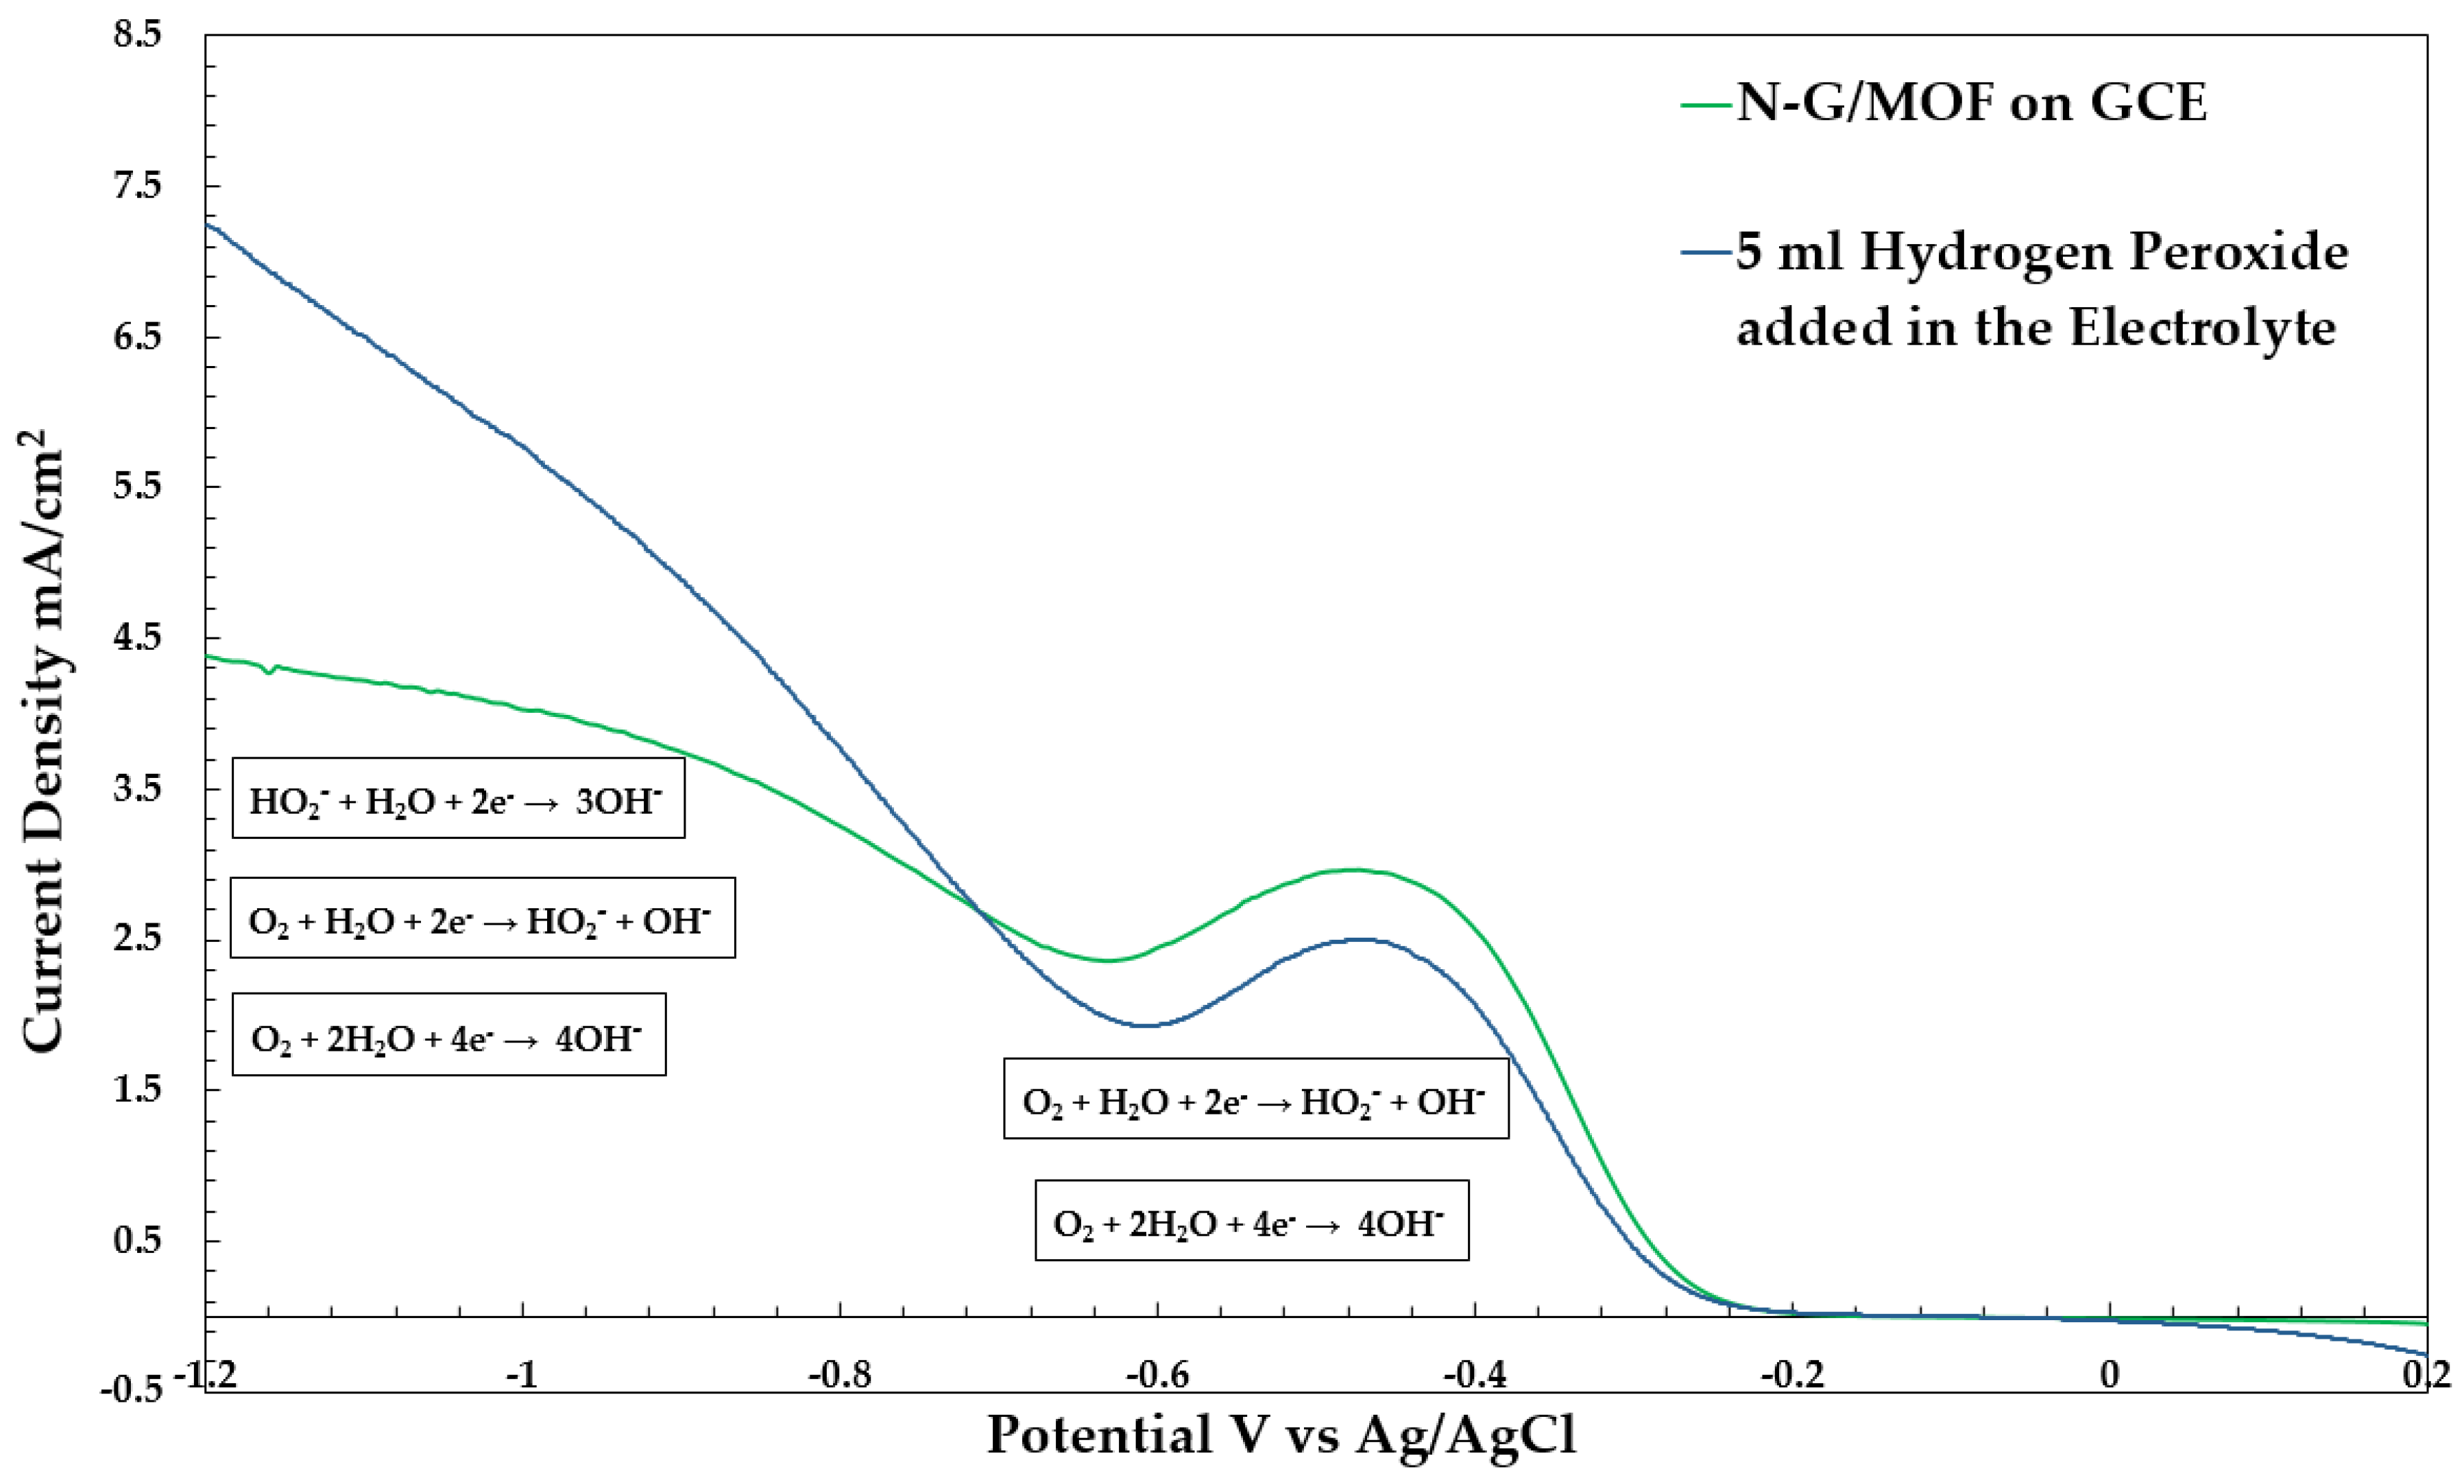
2.2. Effect of Adding Hydrogen Peroxide (H2O2) in the Alkaline Electrolyte during ORR on N-G/MOF

Hydrogen peroxide (H2O2) can be produced from the 2-electron transfer ORR on the catalyst surface. From our RDE experimental data for ORR on the N-G/MOF catalyst, in the alkaline medium, we can estimate that at around −0.47 V mostly the first 2-electron transfer ORR step took place. One of the products from this ORR step is HO2 species. This product is also an indicator of possible H2O2 formation because in the alkaline medium H2O2 can be decomposed through both chemically or electrochemical reactions and form the HO2 species [41,42,43].
H2O2 → HOO + H+
HOO → HOO• − e
or
H2O2 + OH → HOO + H2O
If H2O2 is added to the alkaline electrolyte during the RDE tests, decomposition of the H2O2 is expected and that will increase the concentration of HO2 and its effect should be manifested in the LSV curve.
Following the aim of this study to analyze the voltammogram curves (LSV) for ORR in the alkaline medium, 5 mL H2O2 was added to the electrolyte during the RDE test. The obtained LSV curve right after the addition of H2O2 is shown in Figure 2 in comparison with the LSV curve obtained without H2O2 addition to the electrolyte. All other experimental conditions were kept the same. It is evident from these LSV curves that the addition of H2O2 in the electrolyte changes the obtained ORR current densities throughout the applied potential range. At the positive applied potential near 0.2 V oxidation current is found higher for the electrolyte with added H2O2. As discussed in the earlier section, this oxidation current can form through the OH + HO2 → O2 + H2O + 2e reaction. At the H2O2 added condition, the KOH electrolyte has plenty of HO2 in it, therefore at that favorable applied potential the oxidation reaction could move forward and was seen as oxidation current (negative current in the plot) near 0.2 V. As the voltage moved toward the negative direction this oxidation reaction could no longer sustain and thus this current reached zero.
For the H2O2 added electrolyte, the ORR current also started appearing from around −0.2 V. However, the first ORR peak at around −0.47 V appeared lower than the KOH electrolyte without the H2O2 condition. A reasonable explanation for this lower current for the presence of H2O2 in the electrolyte could be the higher concentration of HO2 species derived from added H2O2 crowding the vicinity of the catalytic active sites which hindered the O2 molecule’s transfer toward the catalytic active site more and a lower ORR current density obtained. After −0.47 V similar to the previous condition the current density dropped to around −0.63 V.
At more negative applied potentials than −0.63 V, two LSV curves in Figure 2 deviated drastically. At those higher negative applied potentials, the 2-electron step reaction (9) occurred at a much higher rate in the H2O2 added electrolyte because of the presence of the reactant species HO2 for this reaction at a much higher concentration. As a result, the obtained ORR current density jumped drastically at the higher negative potentials. However, it is important to notice that the LSV curve for the H2O2 added electrolyte did not reach a plateau at −1.2 V; it kept going upward. Also, the obtained current density at −1.2 V is around 7.23 mA/cm2 which is much higher and cannot solely be attributed to the 4-electron transfer ORR in two steps. The shape of the LSV curve from around −1.0 V to −1.2 V indicates that alongside the 4-electron transfer ORR reaction some other reduction reaction contributed to the measured current density. At these higher negative active applied potentials in the alkaline medium, the direct water (also a possible product of H2O2 dissociation in alkaline medium) splitting reduction reaction (2H2O + 2e → H2 + 2OH) could be the reaction added to the current density in this case.

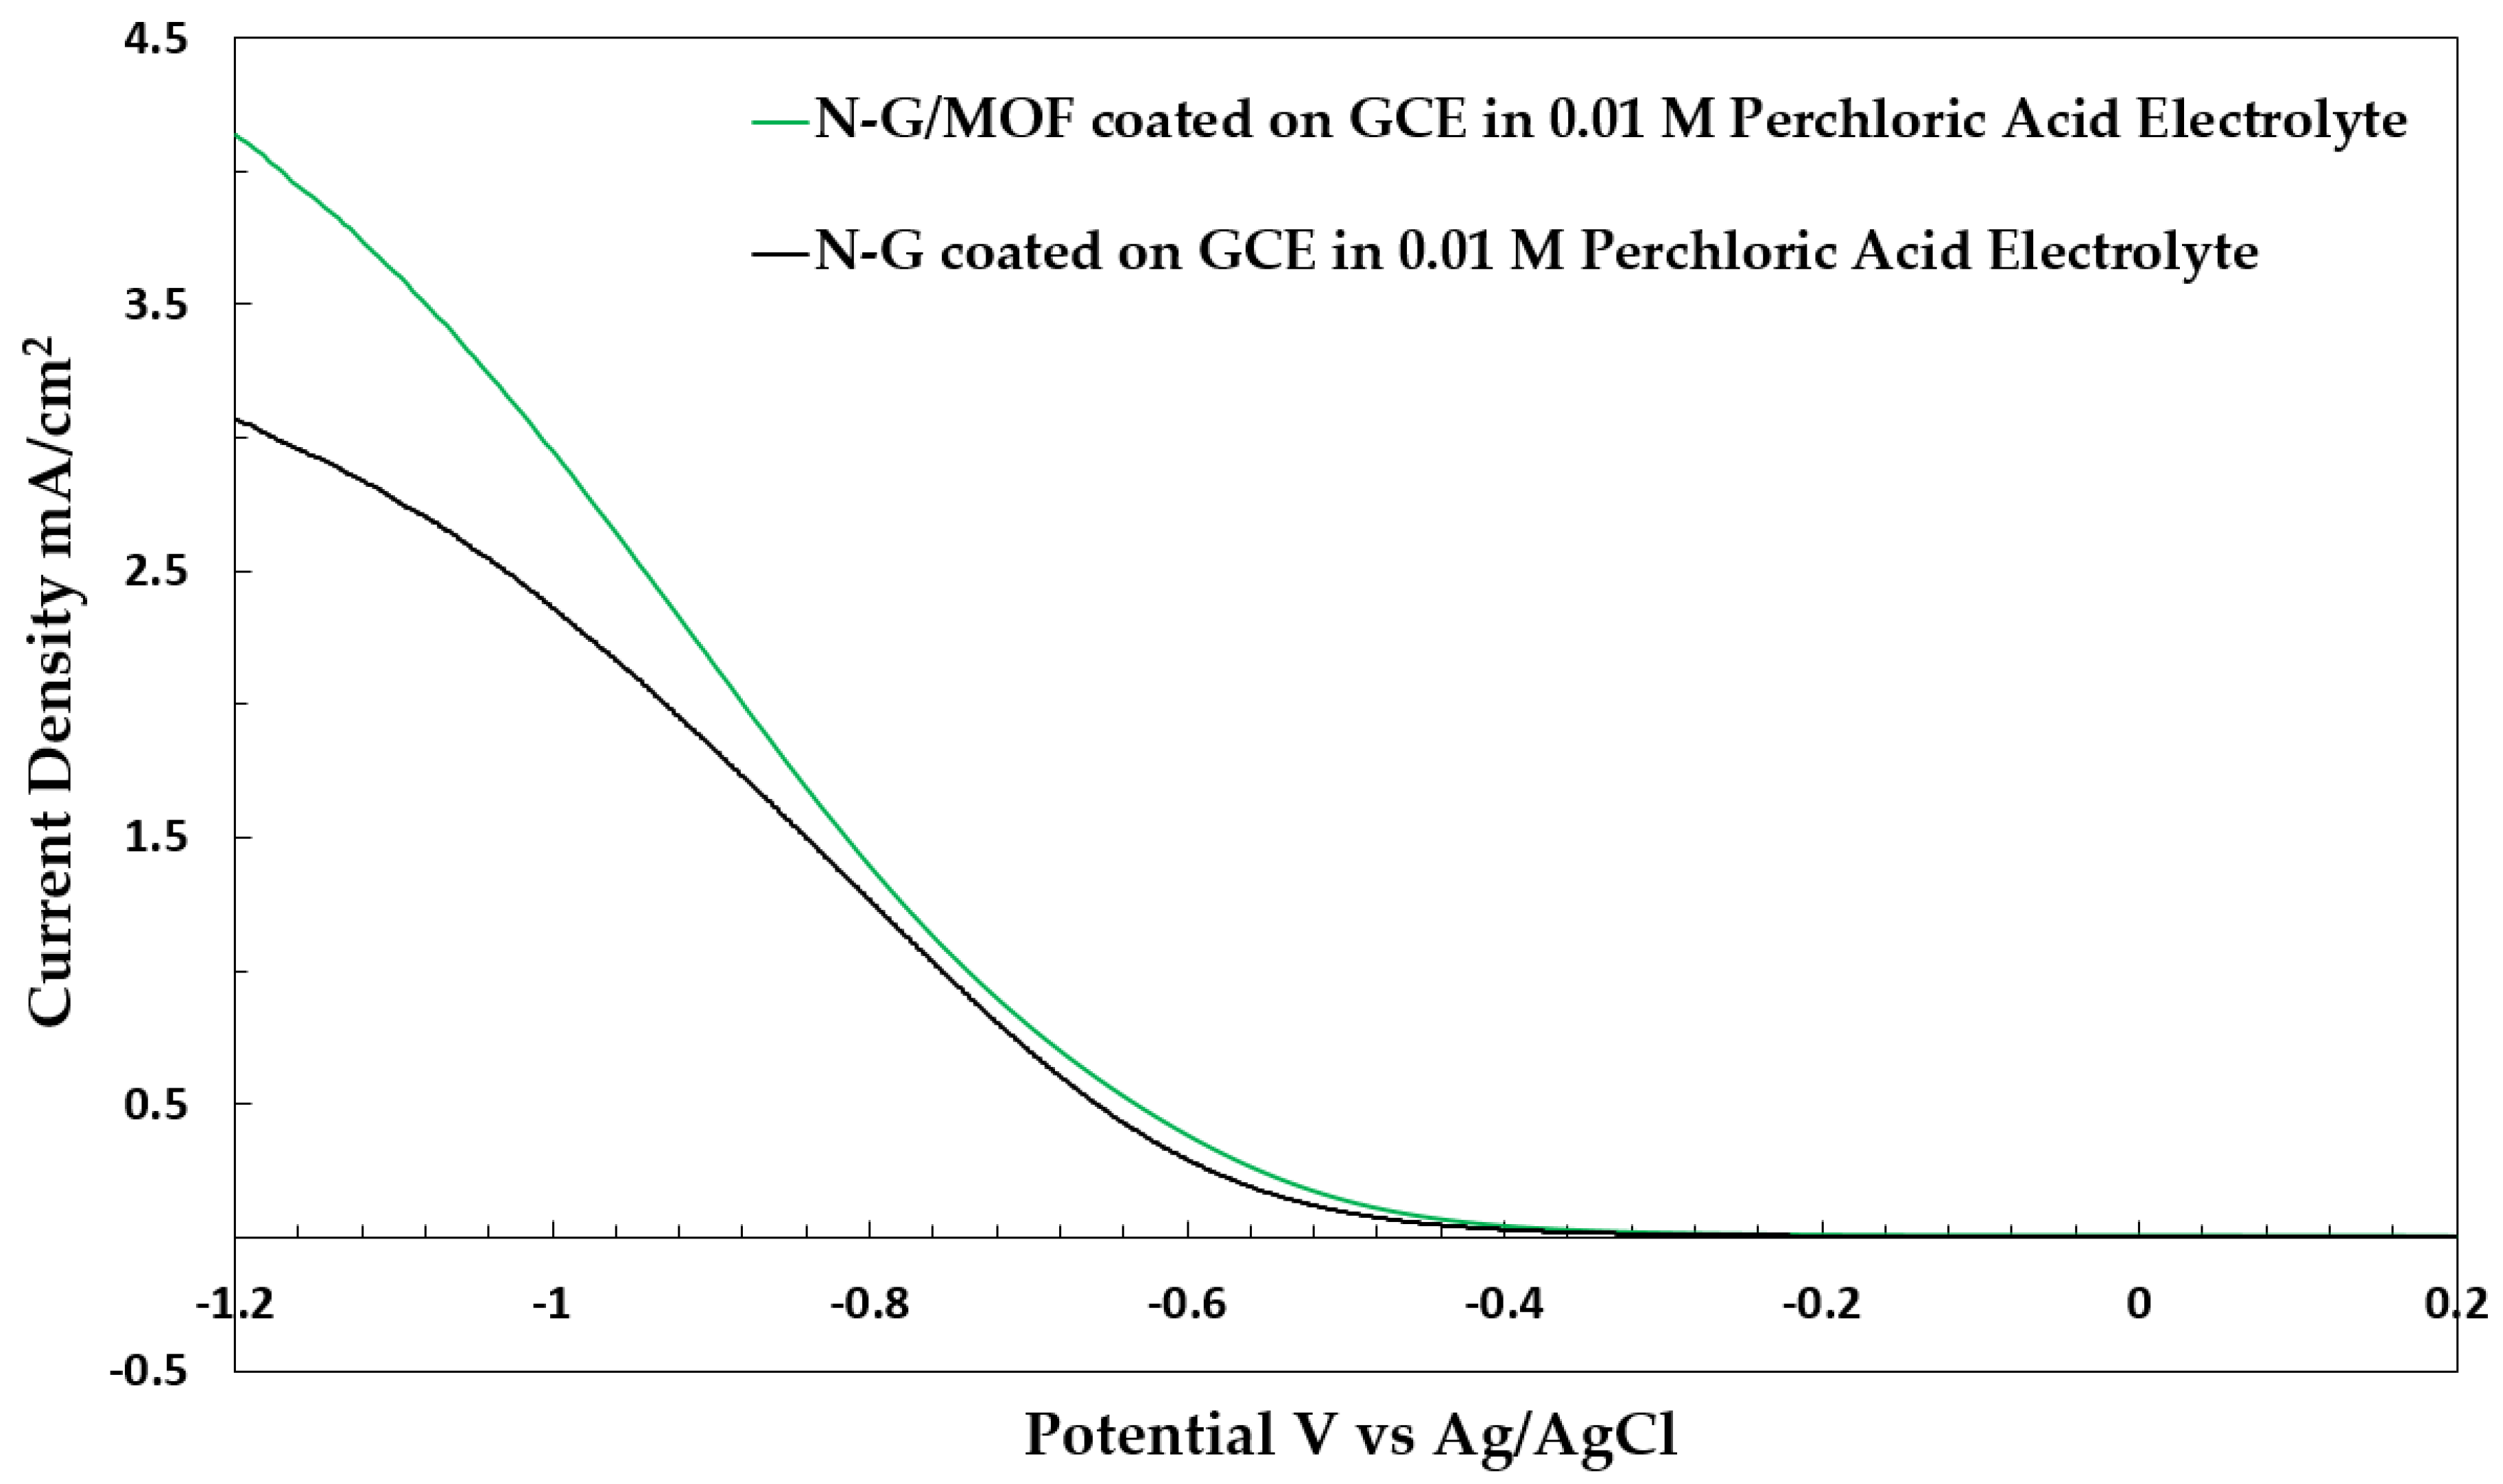
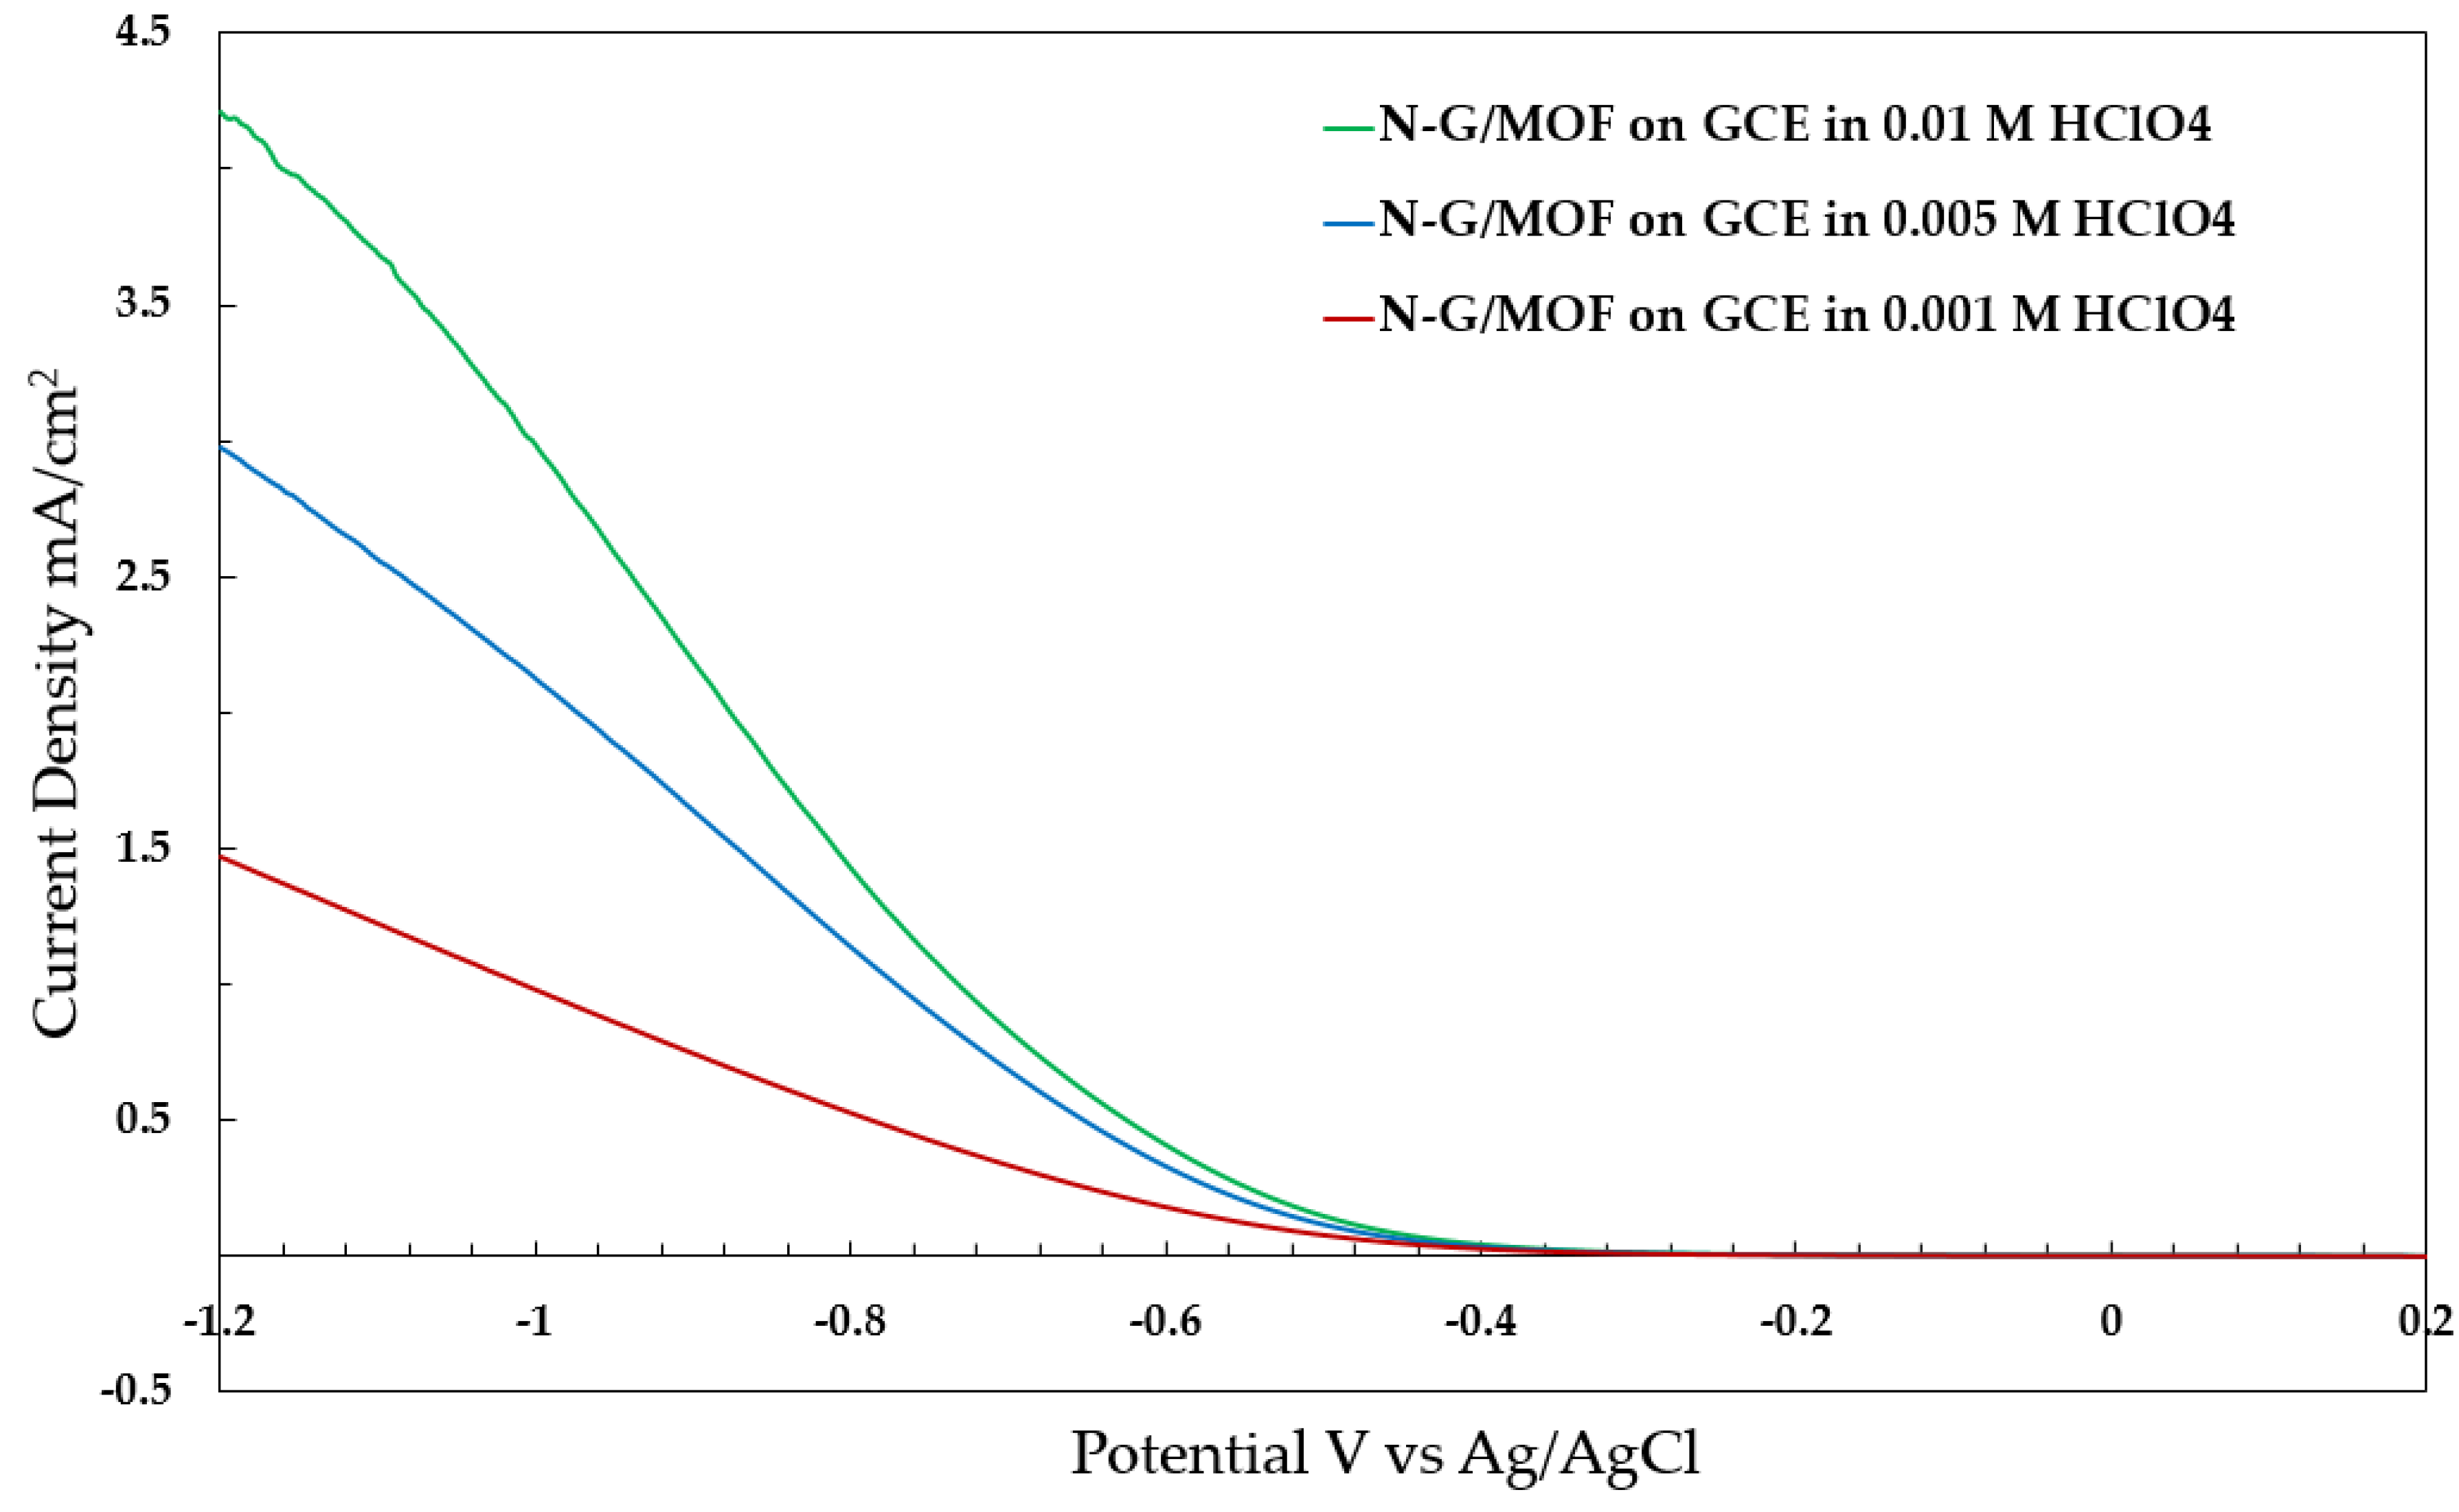
2.3. Exploration of LSV Data of N-G/MOF Catalyst for ORR in Acidic Medium

The ORR in the acidic medium follows a different reaction mechanism than that in the alkaline medium, hence, the voltammogram plots from the RDE/RRDE experiments appear different in shape. To explore the LSV curves of ORR in the acidic medium on the N-G/MOF catalyst, RDE experiments were performed in a 0.01 M perchloric acid (HClO4) electrolyte. The electrolyte was saturated with oxygen before the oxygen. Ag/AgCl reference electrode could be used in this acidic environment as well because the acid concentration was lower. The obtained acidic medium ORR current density is present as an LSV plot in Figure 3 (the green line). The LSV curve in acidic medium at the same other conditions with the N-G catalyst before integrating MOF is also presented in Figure 3 (the black line). From these two LSV curves it is clearly observed that the integration of the MOF with N-G, improved the generated current densities, substantially at the higher applied potentials, from the ORR in the acidic medium.
The oxygen reduction reactions in the acidic medium are presented below with standard reduction potential with respect to the Ag/AgCl reference electrode. The direct 4-electron transfer reaction:
O2 + 4H+ + 4e → 2H2O    (1.034 V vs. Ag/AgCl)
And two 2-electron transfer reaction steps are:
O2 + 2H+ +2e → H2O2    (0.505 V vs. Ag/AgCl)
H2O2 + 2H+ + 2e → 2H2O    (1.545 V vs. Ag/AgCl)
In Figure 3, the ORR current started to appear from around −0.24 V. As the applied negative potential gradually increased, the ORR current gradually increased with a steeper slope at the middle part between −0.7 V to −1.0 V. The shape of this LSV curve at around −1.2 V suggests that the current density is heading toward a peak/plateau which could be reached at further negative potentials. However, performing experiments at farther negative potentials (e.g., −1.4 V vs. Ag/AgCl) associates with the possibility of appearing other reduction reactions than the ORR such as direct water reduction. Considering the current densities obtained of about 4.14 mA/cm2 at −1.2 V as the limiting current density, the electron transfer number can be calculated which is about 3.6. This number provides an estimation that ORR on N-G/MOF may have followed a 4-electron transfer pathway. No other peak/plateau is seen between −0.24 V to −1.2 V in this LSV curve for ORR in the acidic medium on N-G/MOF. Although the standard reduction potentials for ORR suggest that the reaction step (16) is more likely to take place in lower applied negative potentials than the direct 4-electron reaction (15), especially on the carbon-based catalyst surface, the absence of peak/plateau between −0.24 V to −1.2 V in this LSV curve indicates that on N-G/MOF catalyst the acidic medium ORR may have followed the direct 4-electron pathway.
To have a clearer view of the ORR pathway in the acidic medium on the N-G/MOF catalyst, RRDE experiments were performed using a GC-GC ring-disk electrode (disk surface area 0.1256 cm2 and ring surface area 0.1885 cm2) as the working electrode. The GC ring of the ring-disk electrode was kept bare and made cathode as well, so that if any H2O2 produces on the disk electrode by reaction (16), that can be further reduced to H2O on the GC ring surface through reaction (17). And the value of obtained ring current densities in different applied potentials can provide an estimation of the H2O2 that may have been produced on the desk electrode. Keeping all the other conditions the same as the RDE experiments of acidic medium ORR, the ring current densities were obtained through the RRDE experiments with two conditions of the disk electrode surface. First, the GC disk-electrode surface was kept bare and, second, N-G/MOF was coated on GC disk-electrode surface. The obtained ring current densities with these two disk electrode conditions are plotted in Figure 4.
In Figure 4 we see that the GC ring (cathode) produced a ring-current density of about 3.15 mA/cm2 at −1.2 V when the GC disk electrode was kept bare (the red line). This ring-current density corresponds to an electron transfer number of about 2.7, which suggests this current density is mainly generated by the 2-electron transfer ORR, the reaction (16), and at the higher negative applied potentials (than about −0.9 V), the produced H2O2 on the bare GC disk surface, may have further reduced to H2O on the GC ring surface (reaction 17) that raised the electron transfer number above 2. At the RRDE condition when N-G/MOF was coated on the GC disk surface (the green line), we see that the ring-current densities were lower than those from the bare GC disk condition at lower negative applied potentials. After around −0.96 V, the produced ring-current densities raised higher than those from the bare GC disk condition. The difference between these two ring-current LSV curves gives a good estimation of the effect of the N-G/MOF catalyst on the ring current (the black line). Which also provides an estimation of the produced H2O2 on the N-G/MOF catalyst surface over the applied potential range. The lower ring-current densities with N-G/MOF on disk than the bare GC disk conditions at lower than −0.94 V suggests that at the lower applied potentials the ORR products (could be H2O2 or H2O) from the N-G/MOF on the disk surface somewhat hindered the normal reaction (16) process on the GC ring surface. A higher amount of OOR products from the N-G/MOF surface compared to the bare GC disk influxes toward the ring surface which reduced the normal supply (based on bare disk condition) of H+ and O2 to the GC ring is most likely the reason for this reduced ring-current densities at lower potentials. Also, it indicates that the ORR products from the N-G/MOF most likely did not participate in any of the ORR steps on the ring surface below −0.94 V. This suggests that the ORR reaction step (17) most likely did not appear at lower applied negative potentials than −0.94 in this experiment. The standard reduction potentials for the reaction step (17) also indicate so. This leads us to the assumption that the ORR on the N-G/MOF below −0.94 V most likely follows either a direct 4-electron transfer reaction (15) or ORR step (16) or a combination of these two.
The amount of possible H2O2 production of the N-G/MOF over the potential range could be estimated from the amounts of ring-current densities increased at more negative applied potentials than −0.94 V. After −0.94 V the ring-current densities with N-G/MOF on disk condition became higher than the ring current densities with bare GC disk. This indicates an additional supply of H2O2 from N-G/MOF to the ring surface. The increased current density (following the black line) was only about 0.35 mA/cm2 at −1.2 V. Although the rate of ORR reaction step (17) on the bare GC ring surface depends on many different factors, such a low increase in ring-current densities with the N-G/MOF on the disk condition indicate that the concentration of H2O2 supplied from the N-G/MOF surface to the GC ring was mostly like very low at −1.2 V. Which suggests that on the N-G/MOF catalyst the ORR in acidic medium mostly followed the direct 4-electron transfer pathway over the applied potential range.

2.4. Effect of Acid Concentration in the Acidic Electrolyte ORR on N-G/MOF

The effect of acid concentration on the LSV data for ORR in the acidic medium on the N-G/MOF catalyst is shown in Figure 5. In addition to the 0.01 M, two lower concentrations of 0.005 M and 0.001 M solutions of HClO4 acid were used as the electrolyte to see the effect of H+ concentration on the acidic medium ORR on the N-G/MOF catalyst. The obtained ORR current densities in 0.005 M HClO4 were lower than those of 0.01 M HClO4 electrolyte at almost all the applied potentials. The current densities for the 0.001 M HClO4 electrolyte were drastically lower than the two other acid concentrations electrolyte conditions. Although the acidic medium ORR on the N-G/MOF catalyst is expected to follow the pathways discussed in the previous section if we calculate the electron transfer number with the 0.005 M HClO4 electrolyte data it will be near 2. And it will be even less than 2 for the 0.001 M HClO4 electrolyte data. Hence, it is evident that the electron transfer number cannot solely help much to determine the ORR pathways. The observed data from Figure 5 suggest that the obtained current densities from the RDE/RRDE experiments in the acidic medium, critically depend on the concentration of the H+ in the electrolyte solution. Therefore, selecting the acidic electrolyte with a sufficient concentration of H+ is significant for the proper evaluation of the electrochemical properties of catalysts by RDE/RRDE experiments.

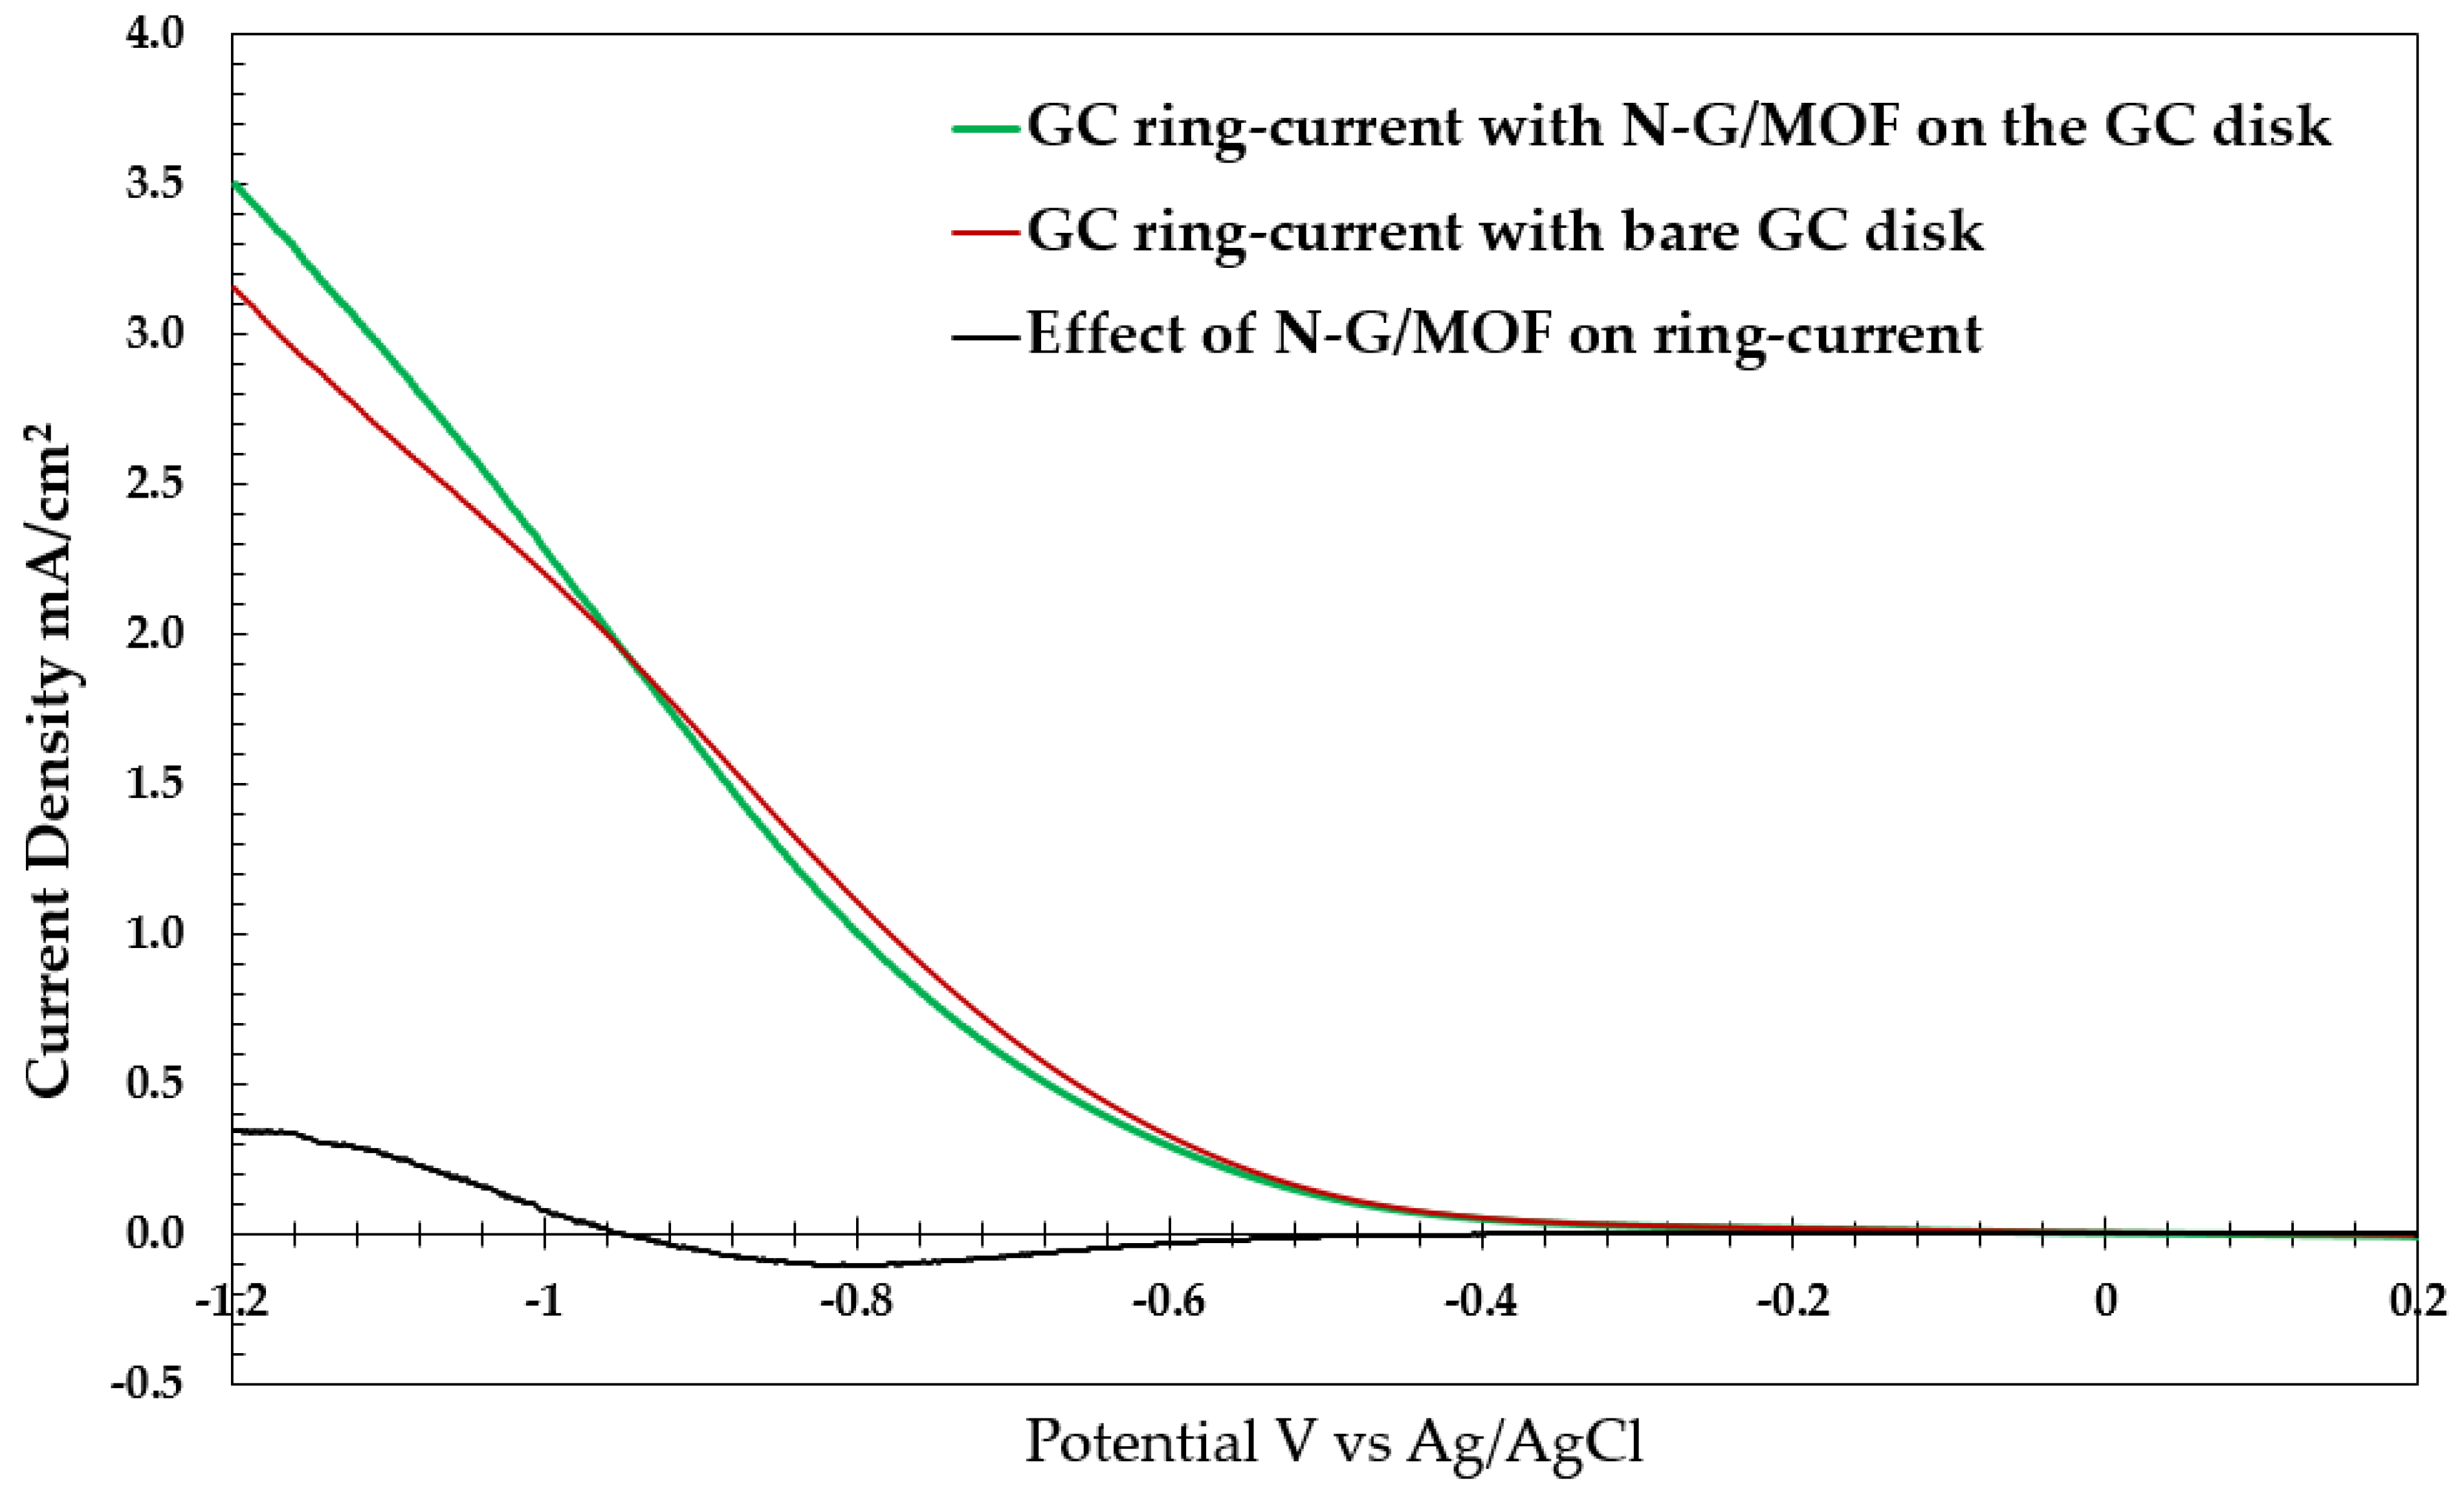
2.5. Data Comparison between RDE and RRDE Experiments

To provide additional insight into the RDE/RRDE experiments below a data comparison for our RDE and RRDE experiments of N-G/MOF catalyst for both alkaline and acidic medium is presented in Table 1. From Table 1 it is interesting to notice that for the same electrolyte (alkaline or acidic) and all the other conditions same, the current density produced from the catalyst-coated disk of the ring-disk electrode of the RRDE setup always appears lower than the catalyst-coated disk of the disk electrode of the RDE setup. The presence of the ring and its electrochemical interactions with the reactant species during the RRDE experiments most possibly reduced the disk current densities compared to the RDE setup where there is no ring. Also, if we compare the current densities from the ring and the disk current densities in the RRDE experiments, for any medium (alkaline or acidic), we see that ring current densities are always lower than the disk current densities. This is obvious from the fact that the GC ring was kept bare, and the disk electrode surfaces were always coated with N-G/MOF catalysts and thus higher current densities were generated.

3. Materials and Experimental Methods

The success of the RDE experiments for evaluating the electrocatalytic performance of catalyst materials significantly depends on the proper preparation of the working electrode, consideration of reference electrode and electrolyte to use, and most importantly having a complete understanding of the working principle of all the components. In this section, first, we will discuss how a three electrode RDE/RRDE system works from a fundamental level and then present the preparation of the working electrode, the selection basis for the reference electrode, and electrolytes for our RDE experiments in both alkaline and acidic conditions. Also, we will discuss how the catalyst-coated working electrode surface in the RDE/RRDE setup creates the ORR environment of the catalyst-coated cathode of actual fuel cells of batteries.

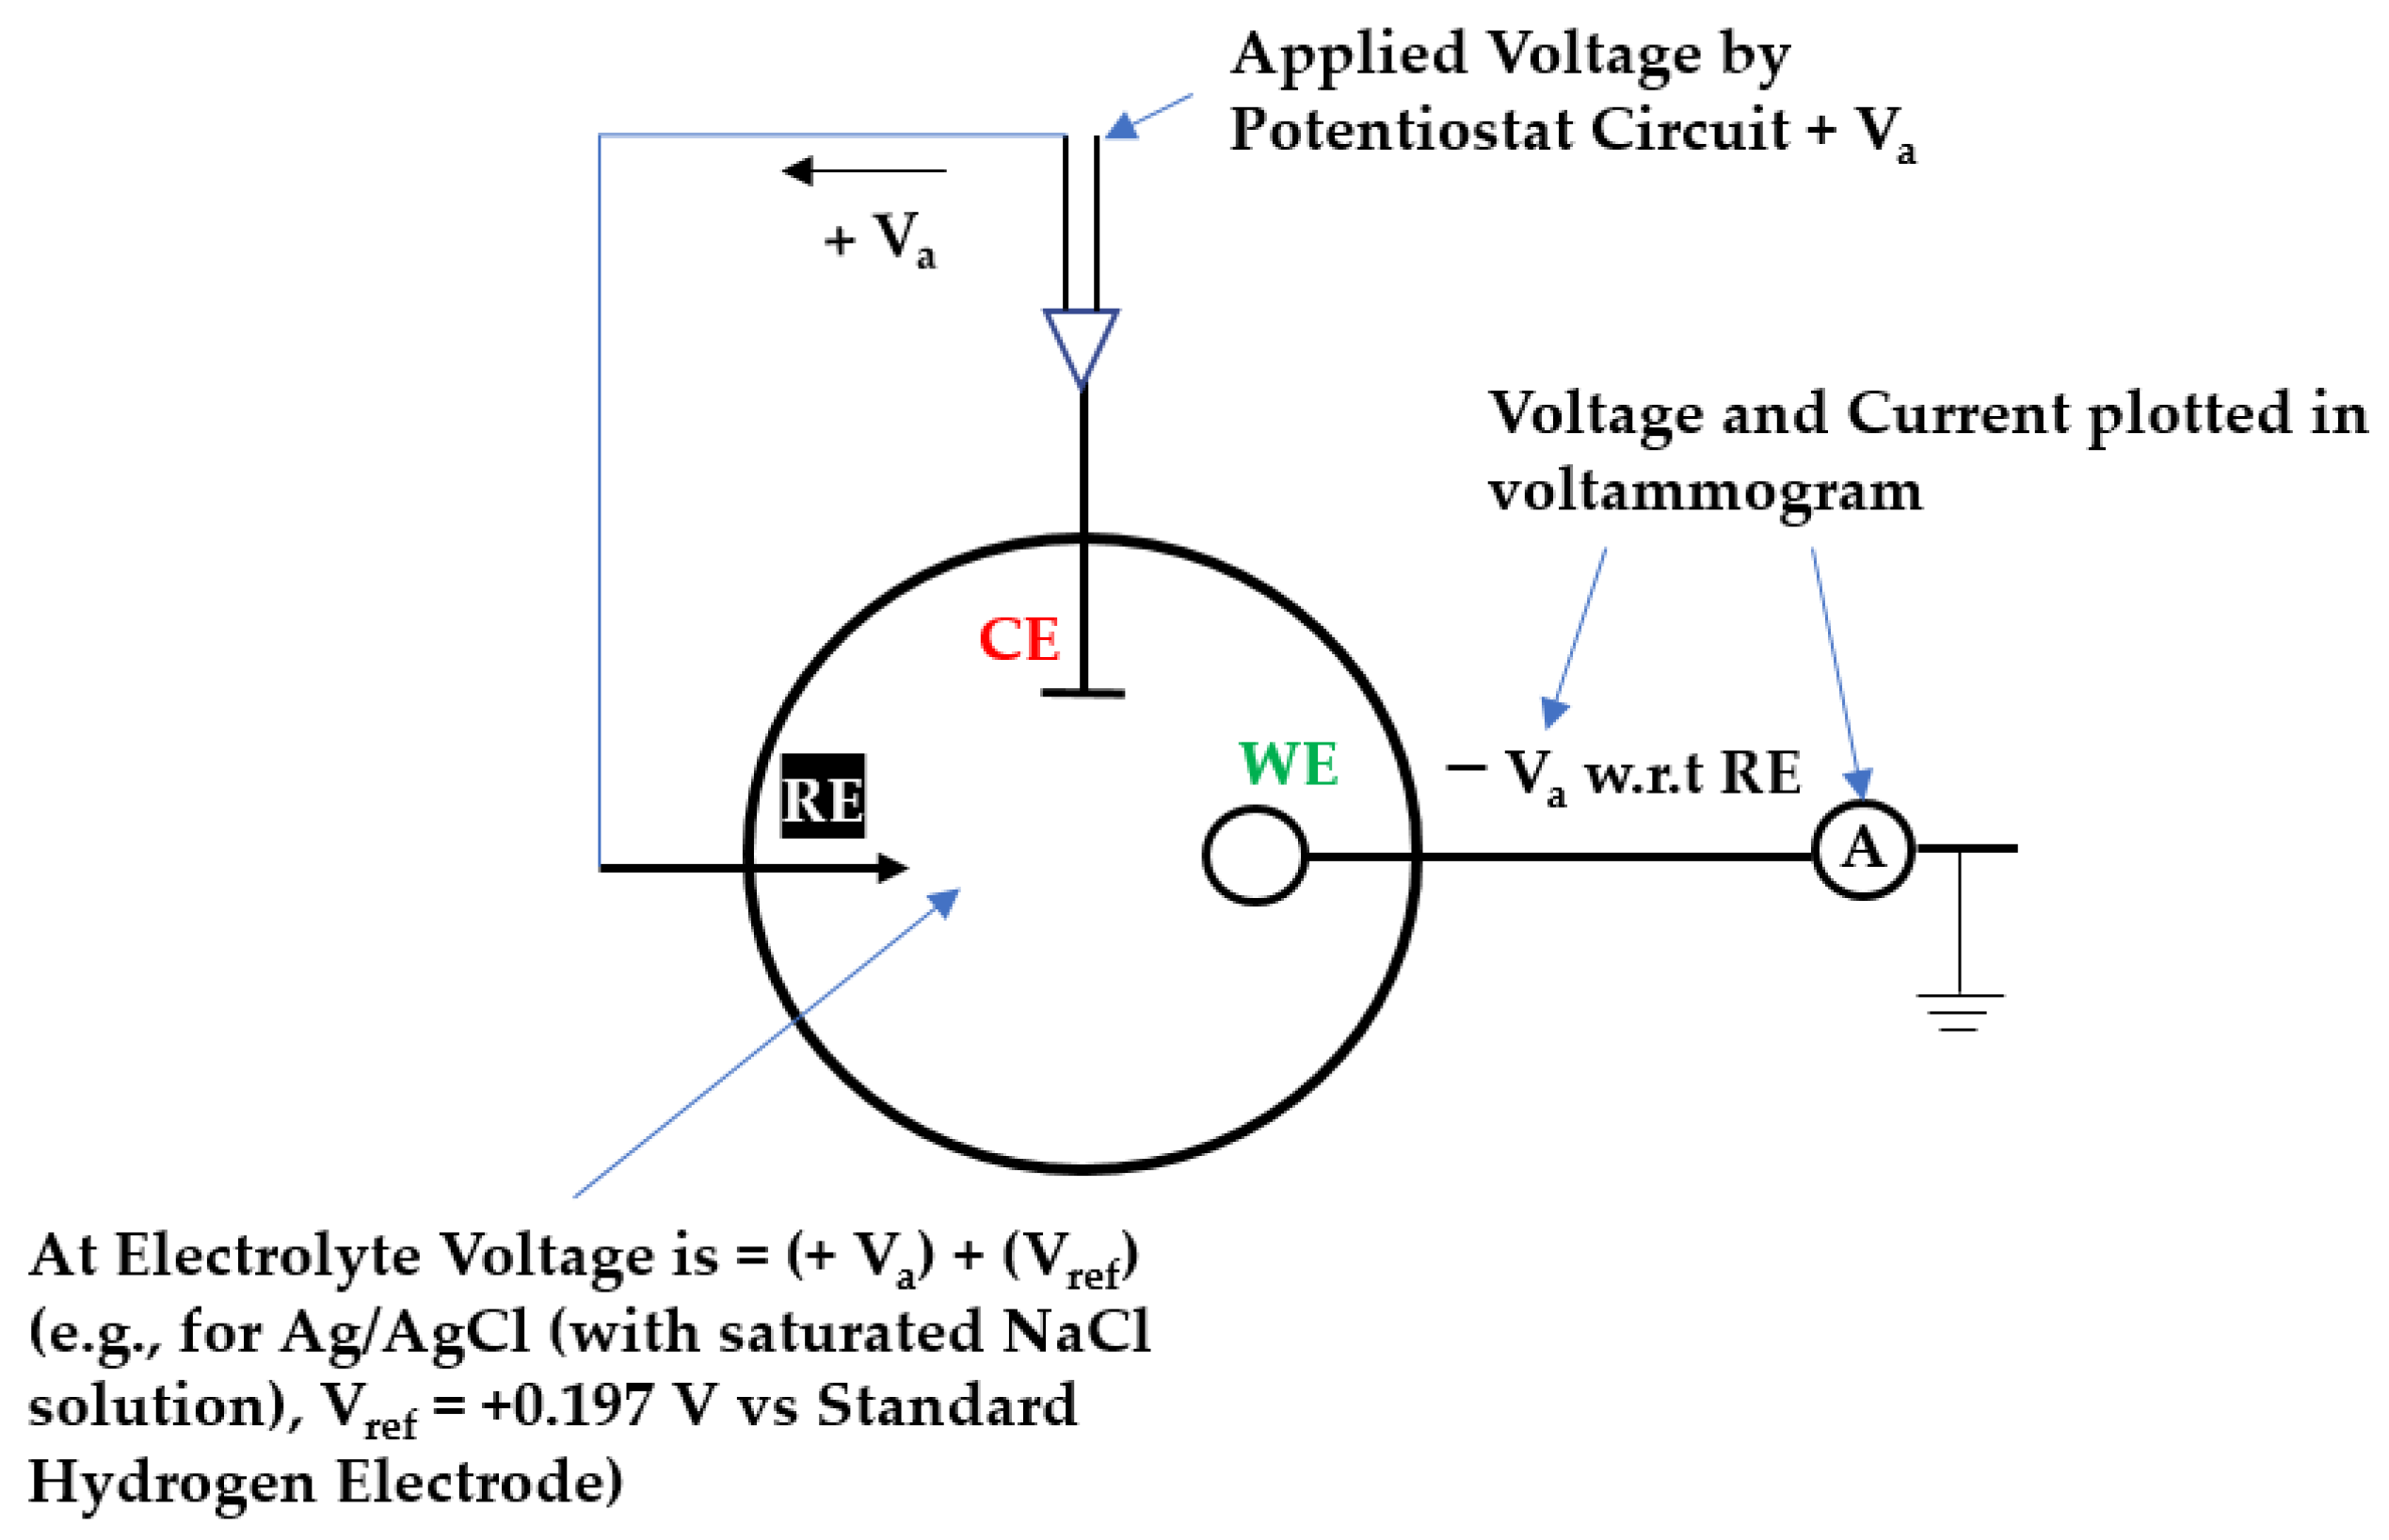
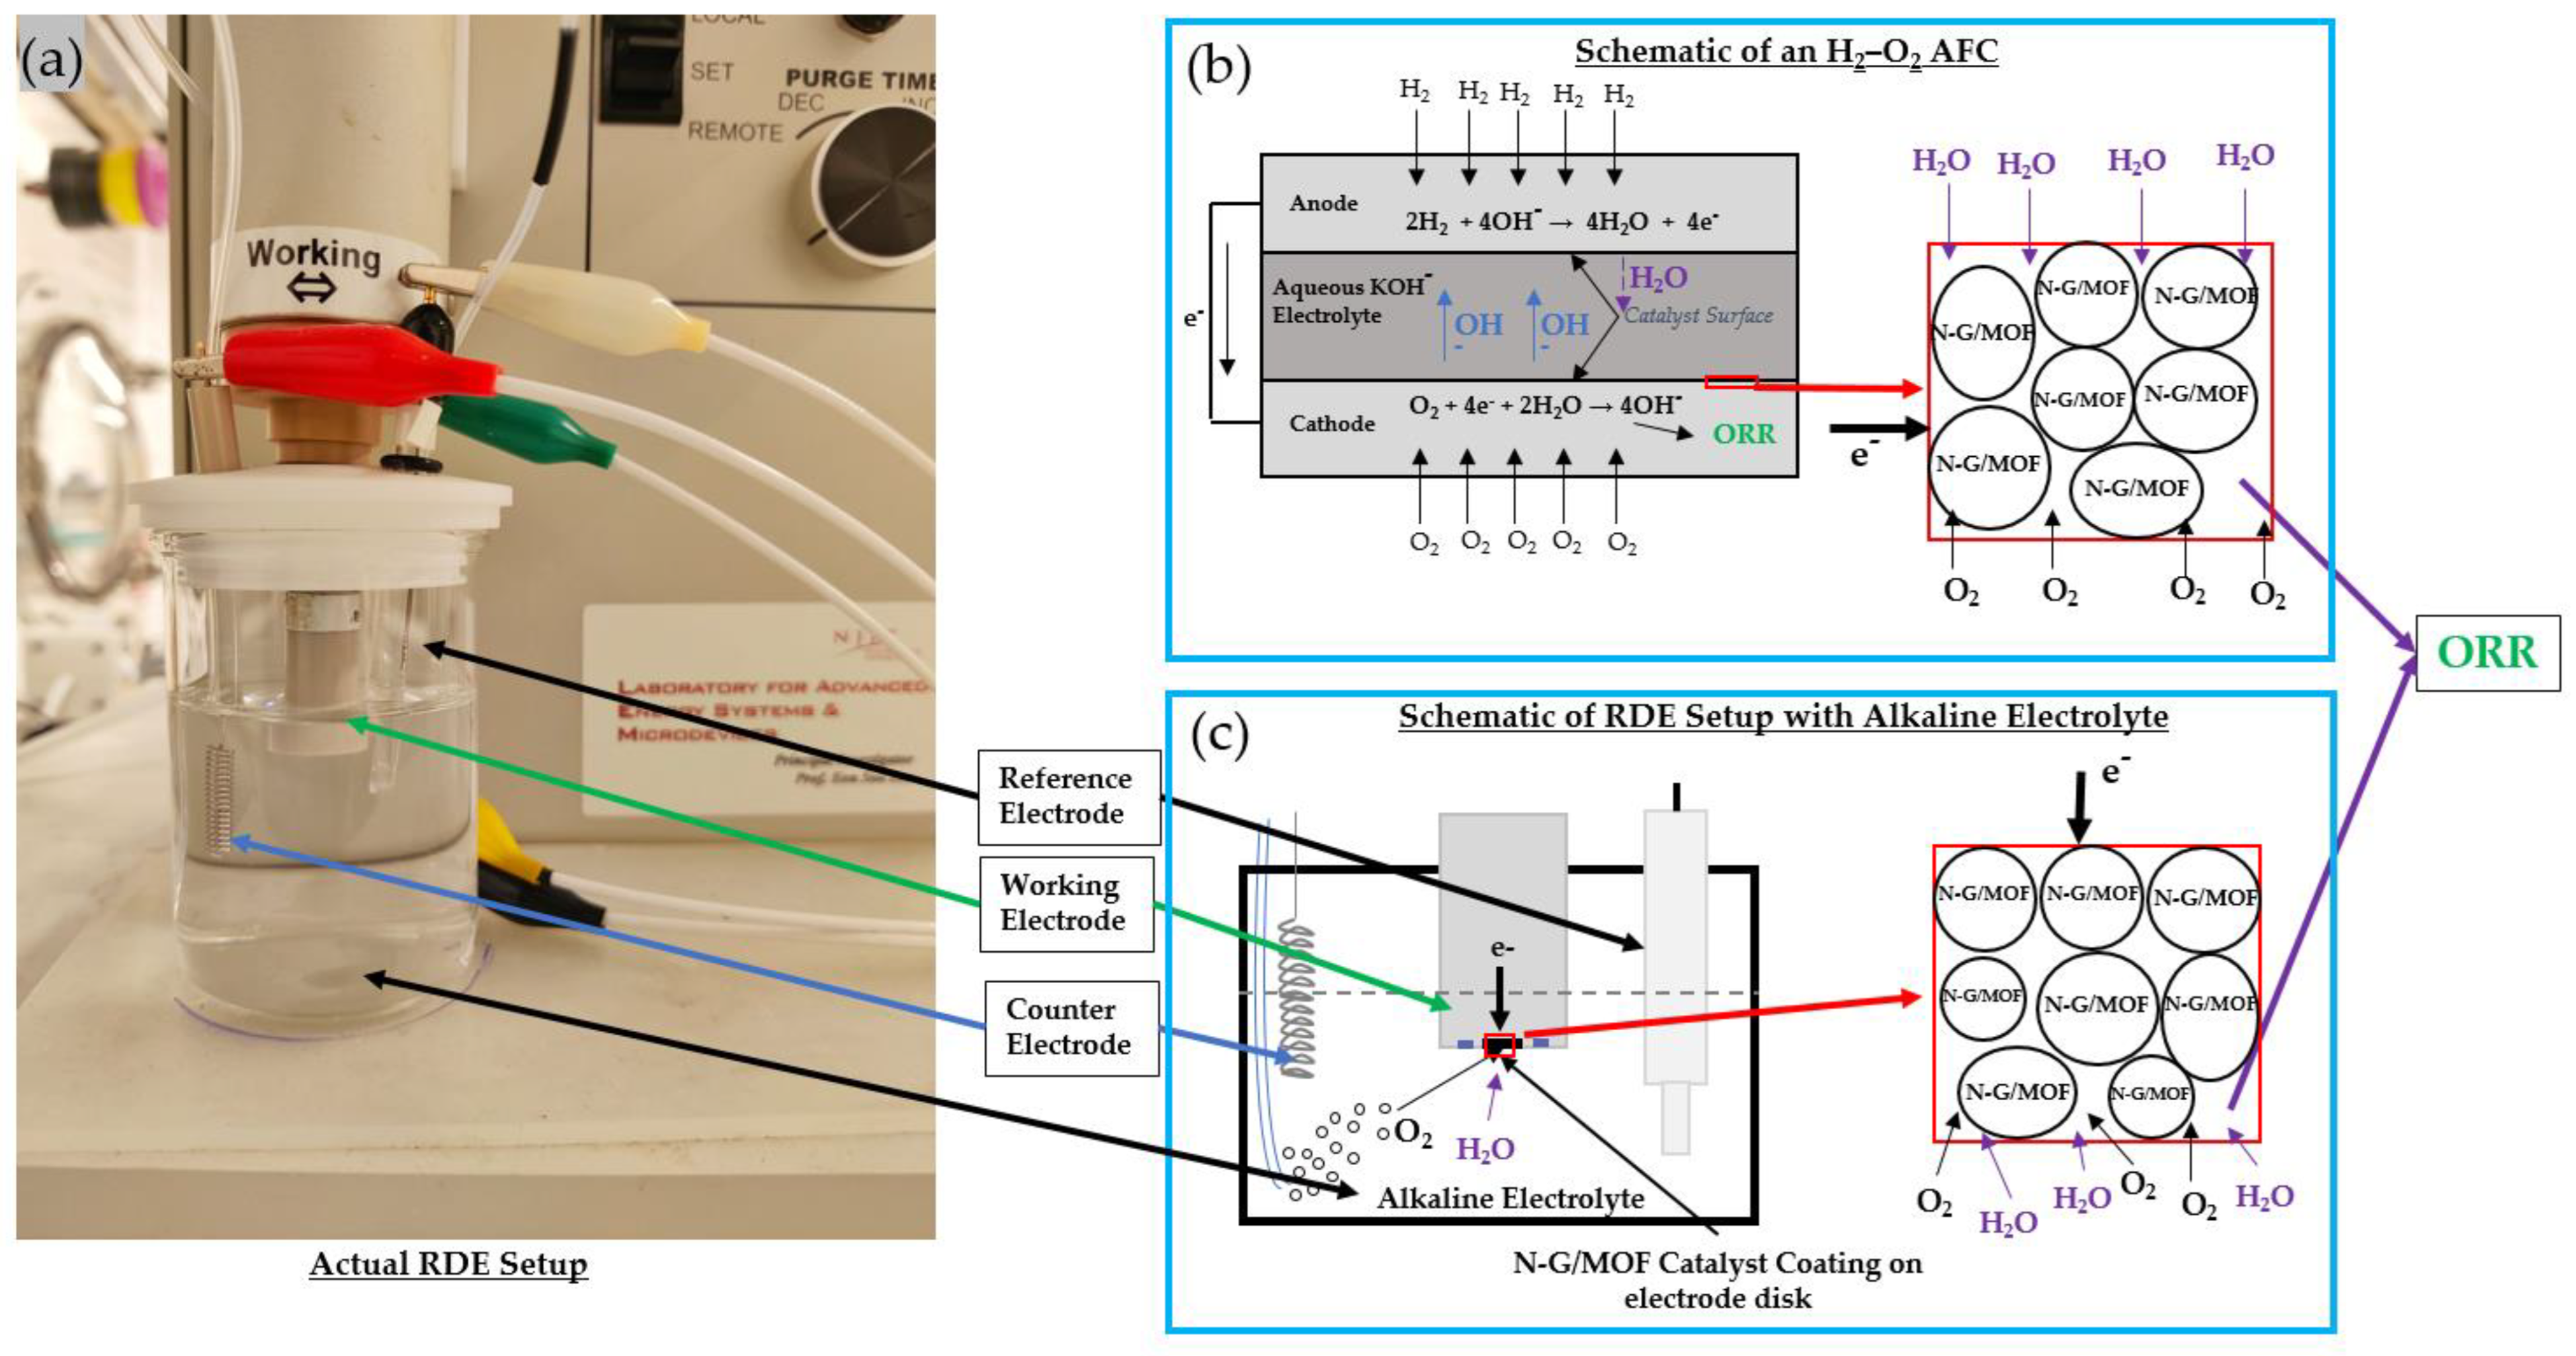
3.1. Function of a Three-Electrode RDE/RRDE System

In most cases, three-electrode RDE/RRDE systems are used for electrochemical performance evaluation of the catalyst materials. The electrodes are known as the working electrode (WE), reference electrode (RE), and counter electrode (CE). Here we will briefly discuss the functions of these electrodes in the RDE/RRDE setup. With an applied potential on WE with respect to the RE, the ORR is expected to take place on this catalyst-coated disk surface of the WE. The reference electrode (RE) is itself an electrochemical half-cell and hence has its own potential when measured against the standard hydrogen electrode (SHE), Vref. This Vref varies according to the type of the RE, more specifically, they are the standard reduction potential of the electrochemical reactions that take place inside the RE cell [44]. When a voltage is applied on the RE through the potentiostat’s circuit, it maintains the constant voltage during the experiment through its internal electrochemical reactions. In reference to the constant voltage applied to RE the applied potential on the WE are counted which are plotted in the voltammograms as applied potentials (typically the x-axis). To maintain a constant voltage in RE a large amount of current should not be allowed to flow through it as this will disrupt the chemical balance inside the RE and damage it permanently. To manage this issue a counter electrode (CE) is used to supply or withdraw the required electrons to/from the electrochemical cell of the RDE/RRDE system as per the demand of electrochemical reaction in a specific applied voltage. In Figure 6, with the help of a simplified diagram, the functions of these three electrodes are presented. The same voltage, for instance, +Va, is applied to both the CE and RE by the potentiostat. Because of this applied voltage +Va the RE produces and maintains a voltage +((Va) + Vref) in the electrolyte. As the WE is kept grounded, the applied potential of WE will be measured as −((Va) + Vref) with respect to the electrolyte, and that is −Va with respect to the RE. In CV or LSV experiments, the direction (sign) and magnitude of Va are controlled by the potentiostat and kept within the potential window of the WE (discussed in the later section). Inside this potential window, only the electrochemical reactions of interest are expected to occur, therefore, the current measured from the WE at any given Va is attributed to those electrochemical reactions; for our case it is the ORR.

3.2. Catalyst Synthesis and Characterization

The N-G/MOF catalyst for electrochemical ORR was synthesized in our laboratory applying a nanoscale high energy wet (NHEW) ball milling process from zeolitic imid-azolate frameworks-8 (ZIF-8, Basolite Z1200, formula C8H10N4Zn, Aldrich, St. Louis, MO, USA) and nitrogen-doped graphene (N-G) [23,24,28,30]. This N-G catalyst was also synthesized in our laboratory by the same method using graphene oxide (GO, 5 mg/mL, H.C, Graphene Supermarket, Ronkonkoma, NY, USA) and melamine ((99%, C3H6N6, Aldrich, St. Louis, MO, USA)) as precursors [22,25,27,45].
Proper and sufficient characterization of any newly developed catalyst materials is crucial to evaluate their potential and applicability. Accordingly, our synthesized N-G/MOF catalyst went under extensive characterization [23,24,28,30]. Physical properties such as particle size, porosity, pore size, surface area, surface structure, etc. were evaluated by Zetasizer potential measurement (Malvern Zetasizer Nano, Malvern, UK), BET surface area analyses (BET, Anton Paar GmbH, Graz, Austria), scanning electron microscope (SEM, JEOL 7600F, Akishima, Tokyo, Japan), and transmission electron microscopy (TEM, JEOL 2100F, Akishima, Tokyo, Japan). Both crystalline and amorphous structures were observed in the N-G/MOF material, the average particle size was found 960.5 nm. The MOF and N-G materials are the sources for the crystalline and amorphous structures in the N-G/MOF respectively. BET surface area of the N-G/MOF catalyst was measured as 1103 m2/g. The average pore size and pore volume were found as 1.6 nm and 0.404 cm3/g. The observed physical properties of the N-G/MOF material are promising characteristics for an effective catalyst.
To determine the elemental composition, X-ray Photoelectron Spectroscopy (XPS, Specs Analyzer, Berlin, Germany & Bruker IR, Billerica, MA, USA) analyses of the N-G/MOF material were conducted. For the catalytic performance of car-bon-based materials quantifying the Nitrogen doping ratio is significant. For N-G/MOF the Nitrogen doping ratio was found 20.2–23%. The electrochemical catalytic performances of the N-G/MOF catalyst were evaluated by the RDE experiments and compared with a standard 10 wt% Pt/C catalyst. For the same other conditions, the onset potential, and electron transfer number measured for N-G/MOF catalyst, 0.062 V and 3.93 respectively, were very close to those of the 10 wt% Pt/C catalyst, 0.065 V and 3.95. Within our RDE setup, the obtained limiting current density generated by N-G/MOF catalyst from the ORR in an alkaline medium (5.02 mA/cm2) was found higher than the limiting current density produced by the 10 wt% Pt/C in the same conditions, 4.30 mA/cm2. Through these extensive characterizations of the N-G/MOF material, in general, the impressive electrocatalytic properties for ORR were understood.

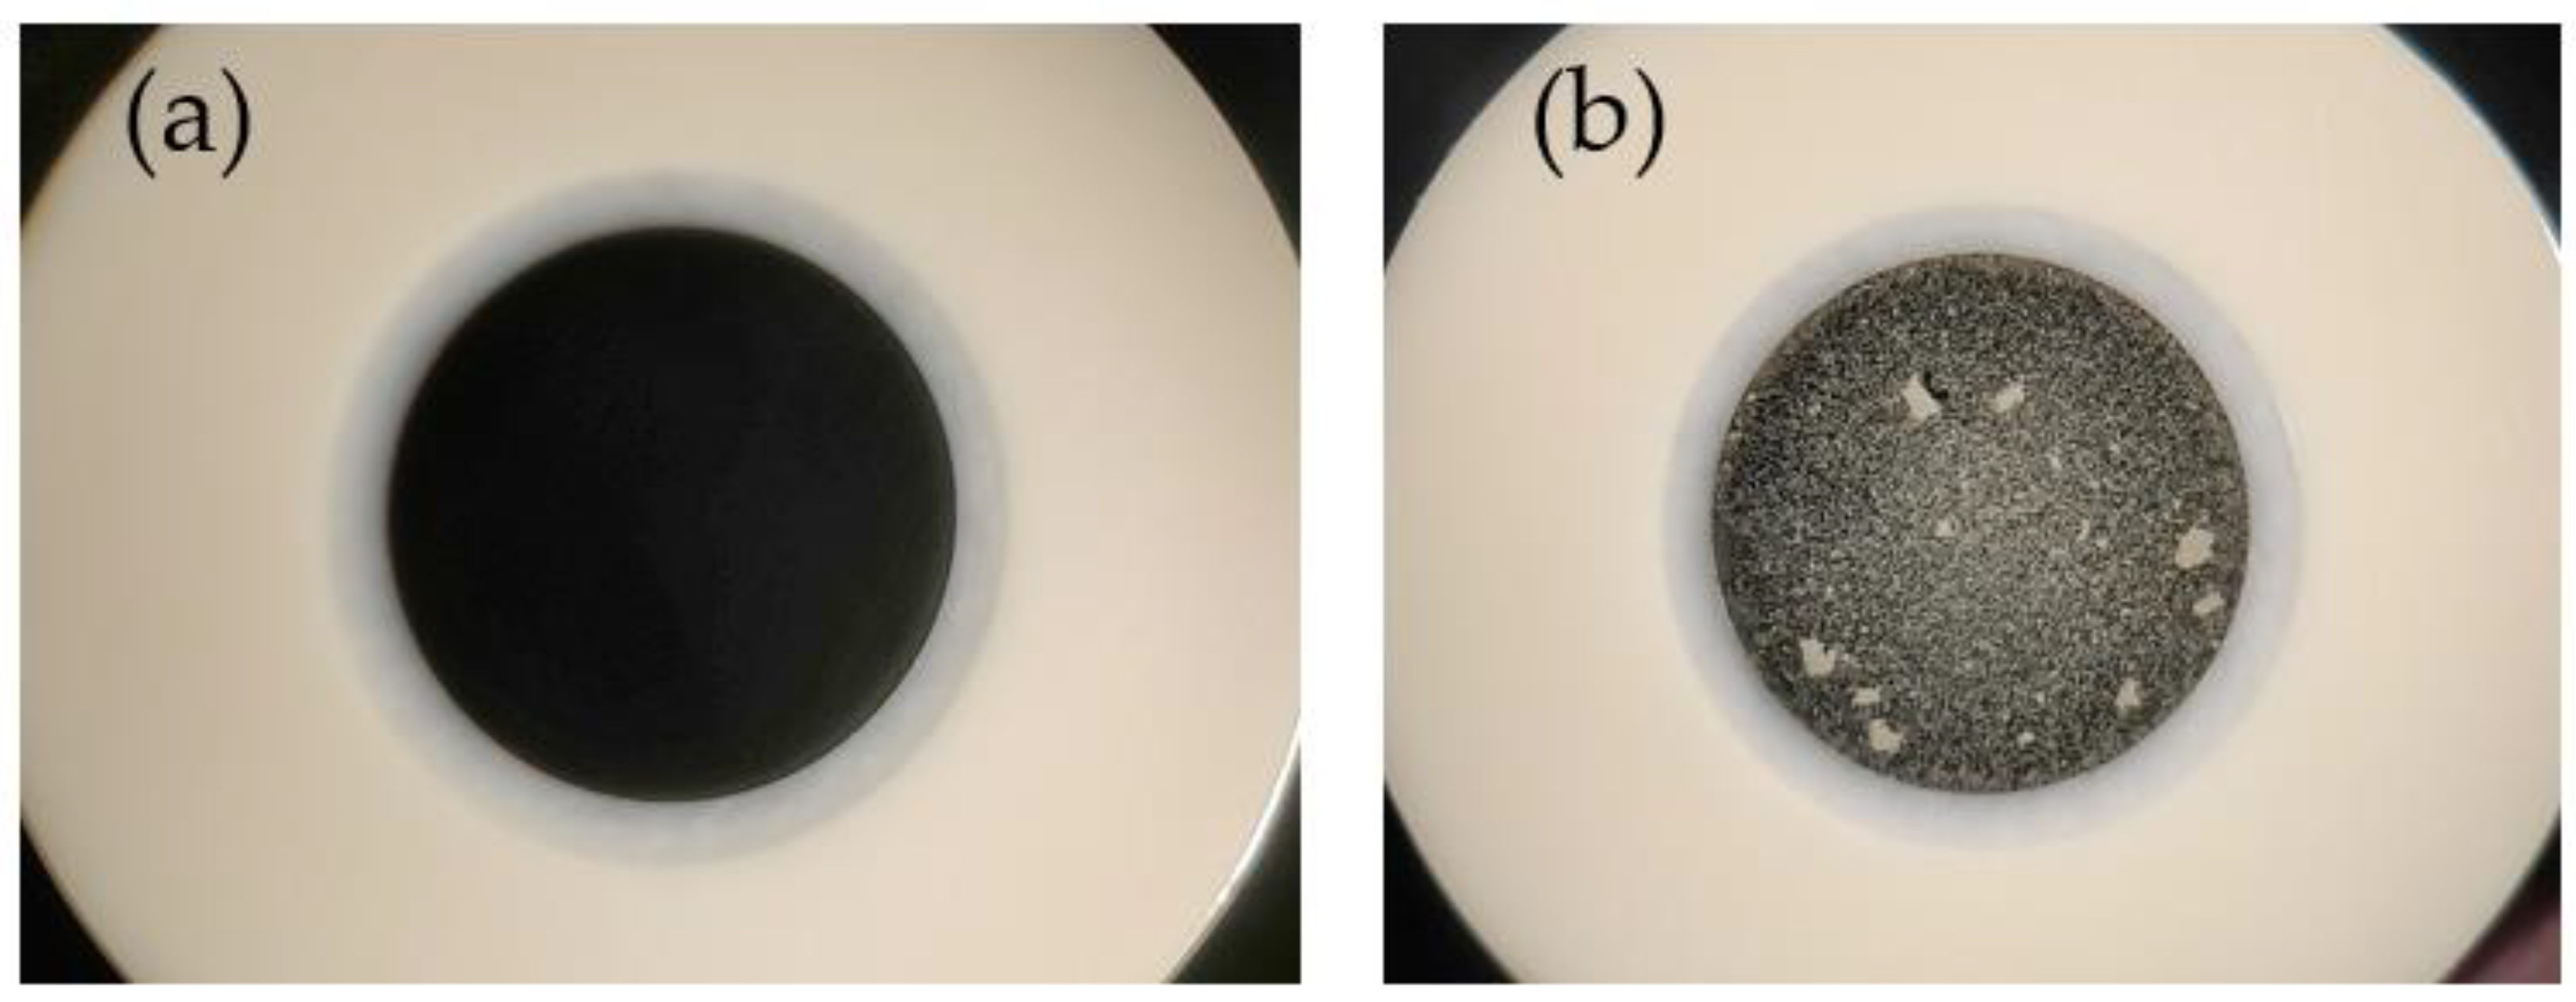
3.3. Considerations and Preparation of Working Electrodes

Commonly used working electrodes in the RDE/RRDE system are platinum (Pt) glassy carbon (GC), Gold (Au), etc. disk electrodes or a combination of Pt, GC, Au, etc. (i.e., Pt-GC, GC-Pt, Pt-Au, etc.) as the ring-disk electrode. However, knowing the potential window for the working electrode in use is important. For any specific working electrode material, if water is used as the electrolyte, at a certain value of the applied positive or negative voltage on the electrode the water will start splitting on the electrode surface and produce oxygen or hydrogen and a current will start flowing through the electrode in the positive or negative direction. The potential window for that specific working electrode is defined as the range of voltage In between those positive and negative applied voltages where no current is produced due to the water electrolysis reactions. Voltammetry experiments are conducted within this potential window set by the property of the working electrode so the current obtained from the experiment can be fairly attributed to the electrochemical reactions of interest [46].
For this study, a glassy carbon (GC) disk electrode (GCt RRDE—WCO22, ALS Co., Ltd., Tokyo, Japan) was used as the working electrode in the RDE setup (RRDE–3A, ALS Co., Ltd., Tokyo, Japan) as GC has a relatively larger potential window of about 1.8 V (from about +1.1 V to −0.7 V). Nitrogen-doped graphene/metal-organic framework (N-G/MOF) catalyst was drop-casted on the GC disk electrode surface to form a thin layer of catalyst. While making this thin layer of catalyst on the WE disk surface is important to make sure that the catalyst layer fully and uniformly covers the geometric area of the disk surface (0.1963 cm2 for our disk-electrode). For this drop casting process, the catalyst was dispersed in deionized (DI) water (5 mg/16 mL of water) and sonicated for 30 min to ensure a homogeneous mixture. The 25 µL of the catalyst-ID water mixture was dropped on the mirror-polished surface of the electrode disk and dried out to form the thin layer. Calculated catalyst loading on the disk surface is 39.7 µg/cm2. If this droplet drying process is conducted at room temperature, a uniform coffee-ring-shaped catalyst layer may form on the electrode surface due to a complex microfluidic process inside the droplet [47]. Drying out the droplet at an elevated temperature improves the uniformity of the catalyst layer on the disk surface of WE. We carried out the drying process in a vacuum oven at 70–80 °C for 15–20 min. Figure 7 shows magnified and externally illuminated images of the electrode-disk surface before (a) and after (b) catalyst drop casting. The actual color of the N-G/MOF catalyst is grayish. Apparently, the drop-casted catalyst layer almost uniformly covers the GC disk surface. The white spots on the disk surface are created by the agglomeration of the catalyst particles and which did not break down during the mixture sonication process.
It is also very important to carefully set the applied potential window for the RDE/RRDE experiments. It is crucial to ensure that no other competing reactions take place within the chosen applied potential window otherwise a viable electrocatalytic performance evaluation of the catalyst for the reaction of interest cannot be achieved. In our RDE/RRDE experiments, we have chosen the applied potential range from +0.2 V to −1.2 V. Although the negative potentials as high as −1.2 V is already within the theoretical/thermodynamic reduction potential range of Hydrogen Evolution Reaction (HER), here we intend to show that in a practical scenario, especially on carbon-based electrocatalysts (also depending on the concentrations of the reactant species), the observed potential ranges for the reactions of interest could appear different than the theoretically suggested ones. If HER started to take place at some higher negative potentials within our chosen potential window, immediately a distinguishably sharp increase in the measured current density would have been visible on the LSV curve, caused by the additional current (or electron flow) produced by electrochemical HER or any other competing reactions. To avoid that scenario, we experimentally verified the potential range, within our RDE/RRDE setup, by running the tests at different higher negative potentials. We observed that, within our experimental setup, the sharp increase in the current density by HER occurs only at a higher negative applied potential than −1.4 V vs. Ag/AgCl. Hence, in our experiments we could apply the negative potential limit to −1.2 V vs. Ag/AgCl.

3.4. Considerations for Reference Electrode, Counter Electrode and Electrolyte

Often the obtained voltammetry data (CV or LSV) from RDE experiments can largely deviate from the theoretically expected values if the reference electrode (RE) is not selected and used properly. As the reaction mechanisms of ORR are dependent on the pH value of the medium/electrolyte (alkaline or acidic), the reference electrode should be carefully chosen that can function properly in the alkaline or acidic medium used for the experiment. Earlier it is mentioned that the applied potentials on the WE are measured and plotted with reference to the applied voltage on the RE. In practice, the electrolyte between these electrodes introduces a solution resistance which may disrupt the applied potential balance. Therefore, the reference electrode is placed close to the working electrode but of course, this should not obstruct the flow of electrolyte toward the WE surface generated by the rotation of WE in the RDE/RRDE cell. In this study, an Ag/AgCl (3 M NaCl internal solution) reference electrode is used which has the reference potential of 0.195 V vs. the reversible hydrogen electrode (RHE). This reference electrode functions properly in the low concentration alkaline and acidic aqueous solution.
To transfer a large number of electrons to or from the RDE/RRDE voltammetry cell during the electrochemical reactions, the surface area of the counter electrode should be sufficiently large. A coiled platinum wire (23 cm) counter electrode is used in this study.
The choice of proper electrolytes is also important. The electrolyte must be capable of transferring the ions or species between the electrodes. At the same time, the solution resistance of the electrolyte should be low. Based on these considerations a 0.1 M potassium hydroxide (KOH) aqueous solution is used as the electrolyte for our RDE experiments in the alkaline medium. KOH produces K+ and OH ions in the aqueous solution and the K+ ions getting involved in electrochemical reactions is unlikely within the potential window of the experiment as the standard reduction potential for K+ is well beyond this potential range. KOH electrolyte also offers a low solution resistance for H2O or OH transfer. For these reasons, in most of the RDE/RRDE studies, the KOH solutions of different concentrations are chosen.
For the RDE and RRDE experiments in the acidic conditions, a 0.01 M perchloric acid (HClO4) aqueous solution is used initially, and the concentration of the acid was also varied. The proton H+ is one of the reactants of ORR in the acidic condition thus the effect of H+ concentration on the obtained current density was evaluated.

3.5. Creating the ORR Phenomenon in Alkaline Medium with RDE Setup

The Rotating Disk Electrode (RDE) setup is one of the common ways to create the ORR environment of actual fuel cells or batteries. Figure 8 shows how the ORR phenomenon of an alkaline fuel cell (AFC), that uses hydrogen as fuel and oxygen/air as the oxidizer (H2-O2 AFC), can be produced within an RDE setup. Figure 8a shows the actual electrolyte vial of our RDE setup. A 0.1 M KOH solution is taken inside the vial and oxygen is supplied to it for 25–30 min to create oxygen saturated alkaline electrolyte. A schematic of the test vial is presented in Figure 8c. The three electrodes are indicated for both figures. In Figure 8b the working principle of AFC is shown schematically. In the actual fuel cells, hydrogen (H2) and air are continuously supplied respectively to the anode and cathode sides of the fuel cell. Water (H2O) is produced on the anode, and it transfers through the alkaline electrolyte to reach the cathode where it can participate in the ORR on the catalyst surface. In the right side of Figure 8b, an expanded view of the catalyst layer of the fuel cell cathode is shown where H2O, electrons (e), and O2 are being supplied and ORR can proceed. The goal of the RDE setup is to simulate this specific ORR environment on the catalyst-coated cathode of the fuel cells to investigate the ORR phenomenon on a catalyst. On the right side of Figure 8c, an elaborated schematic of the catalyst layer over the disk surface of WE submerged in the electrolyte is shown. Inside the vial, the electrolyte flow, created by a constant speed rotation of the working electrode, maintains the continuous supply of H2O and O2 to the catalyst layer on the electrode disk. Required electrons for the electrochemical ORR are provided through the WE. By juxtaposing the right sides views of Figure 8b, c, the fuel cell-like ORR environment created by the RDE system can be realized. The RDE/RRDE system in this study was validated by taking CV and LSV data with well-established Platinum supported by carbon (Pt/C) catalyst.

3.6. Creating the ORR Phenomenon in Acidic Medium with RDE Setup

Similar to Figure 8, in Figure 9 the process of creating the ORR environment of a PEM fuel cell by the RDE/RRDE setup with acidic electrolyte is presented. The schematic of H2-O2 PEMFC in Figure 9b shows, that similar to the AFC, H2, and O2 or air is continuously supplied at high pressure to the anode and cathode side of the fuel cell respectively. H+ is produced on the anode surface and travels through the acidic electrolyte towards the catalyst-coated layer of the cathode where it takes part in the ORR. In the RDE system as in Figure 9a,c, to create the catalyst-coated cathode environment of the PEM fuel cell where ORR occurs in the acidic medium, a catalyst layer is formed in the electrode disk surface, and it is submerged into the acidic electrolyte solution (facilitates spontaneous H+ transfer) which is saturated with oxygen prior to the test. During the test, a constant rotational speed of the working electrode maintains a continuous flow of H+ ions and O2 saturated electrolytes to the catalyst-coated disk electrode surface.

4. Conclusions

An in-depth investigation of the electrochemical ORR on a carbon-based electrocatalyst, N-G/MOF, in both alkaline and acidic mediums was conducted using the data from RDE/RRDE experiments. Crucial considerations for the RDE/RRDE experiments are delineated and demonstrated. In the alkaline medium, the ORR on the carbon-based catalysts is more likely to begin as a 2-electron transfer ORR step at lower applied potentials. And at higher applied potentials, the 4-electron transfer ORR reaction can be generated. The electron transfer numbers calculated at a specific applied potential can provide indications for the ORR reaction pathways. However, while estimating the ORR pathways from the electron transfer values, careful considerations are required as the electron transfer numbers are generally calculated from the obtained current density which is directly dependent on many factors of the experiments. The presence of H2O2 in the electrolyte can also alter the obtained current density data for ORR in an alkaline medium. In the acidic medium, the electrochemical ORR pathways also depend on the applied potentials, the concentration of the acid in the electrolyte, as well the properties of the catalyst materials. In general, the obtained current densities from the RDE/RRDE experiments also depend on the number of active sites on the catalyst surface and the concentration of reactants for a specific reaction step at a specific applied potential. It is also important to consider the effect of any other competing reduction reaction on the obtained current density in a specific applied potential.

Author Contributions

N.T. conducted the experiments, prepared and wrote the manuscript. Y.W. assisted in conducting the experiments and preparing the manuscript, B.B.N. reviewed and provided suggestions for editing the manuscript, and E.S.L. designed the experiments, supervised the research activities, ensured theoretical soundness of the experiments, constructed, edited, and reviewed the manuscript, and provided suggestions for editing. All authors have read and agreed to the published version of the manuscript.

Funding

This research received no external funding.

Data Availability Statement

Not applicable.

Acknowledgments

The authors acknowledge the research support from the Advanced Energy System and Microdevices (AESM) Laboratory at the New Jersey Institute of Technology (NJIT). This research is also carried out in part at the Center for Functional Nanomaterials, Brookhaven National Laboratory, which is supported by the U.S. Department of Energy, Office of Basic Energy Sciences, under Contract No. DE-SC0012704.

Conflicts of Interest

The authors declare no conflict of interest.

References

  1. Shao, M.; Chang, Q.; Dodelet, J.-P.; Chenitz, R. Recent Advances in Electrocatalysts for Oxygen Reduction Reaction. Chem. Rev. 2016, 116, 3594–3657. [Google Scholar] [CrossRef] [PubMed] [Green Version]
  2. Yuan, X.-Z.; Wang, H. PEM Fuel Cell Fundamentals. In PEM Fuel Cell Electrocatalysts and Catalyst Layers: Fundamentals and Applications; Zhang, J., Ed.; Springer: London, UK, 2008; pp. 1–87. ISBN 978-1-84800-936-3. [Google Scholar]
  3. Wang, D.-W.; Su, D. Heterogeneous Nanocarbon Materials for Oxygen Reduction Reaction. Energy Environ. Sci. 2014, 7, 576–591. [Google Scholar] [CrossRef]
  4. Li, Y.; Lu, J. Metal–Air Batteries: Will They Be the Future Electrochemical Energy Storage Device of Choice? ACS Energy Lett. 2017, 2, 1370–1377. [Google Scholar] [CrossRef]
  5. Lu, Z.; Chen, G.; Siahrostami, S.; Chen, Z.; Liu, K.; Xie, J.; Liao, L.; Wu, T.; Lin, D.; Liu, Y.; et al. High-Efficiency Oxygen Reduction to Hydrogen Peroxide Catalysed by Oxidized Carbon Materials. Nat. Catal. 2018, 1, 156–162. [Google Scholar] [CrossRef]
  6. Zhou, Y.; Chen, G.; Zhang, J. A Review of Advanced Metal-Free Carbon Catalysts for Oxygen Reduction Reactions towards the Selective Generation of Hydrogen Peroxide. J. Mater. Chem. A 2020, 8, 20849–20869. [Google Scholar] [CrossRef]
  7. Talukder, N.; Wang, Y.; Nunna, B.B.; Lee, E.S. Nitrogen-Doped Graphene Nanomaterials for Electrochemical Catalysis/Reactions: A Review on Chemical Structures and Stability. Carbon 2021, 185, 198–214. [Google Scholar] [CrossRef]
  8. Ma, R.; Lin, G.; Zhou, Y.; Liu, Q.; Zhang, T.; Shan, G.; Yang, M.; Wang, J. A Review of Oxygen Reduction Mechanisms for Metal-Free Carbon-Based Electrocatalysts. NPJ Comput. Mater. 2019, 5, 78. [Google Scholar] [CrossRef] [Green Version]
  9. Haque, E.; Islam, M.M.; Pourazadi, E.; Hassan, M.; Faisal, S.N.; Roy, A.K.; Konstantinov, K.; Harris, A.T.; Minett, A.I.; Gomes, V.G. Nitrogen Doped Graphene via Thermal Treatment of Composite Solid Precursors as a High Performance Supercapacitor. RSC Adv. 2015, 5, 30679–30686. [Google Scholar] [CrossRef]
  10. Mahmoudi, G.; Babashkina, M.G.; Maniukiewicz, W.; Afkhami, F.A.; Nunna, B.B.; Zubkov, F.I.; Ptaszek, A.L.; Szczepanik, D.W.; Mitoraj, M.P.; Safin, D.A. Solvent-Induced Formation of Novel Ni (II) Complexes Derived from Bis-Thiosemicarbazone Ligand: An Insight from Experimental and Theoretical Investigations. Int. J. Mol. Sci. 2021, 22, 5337. [Google Scholar] [CrossRef]
  11. Alam, K.M.; Kumar, P.; Manuel, A.P.; Vahidzadeh, E.; Goswami, A.; Zeng, S.; Wu, W.; Mahdi, N.; Cui, K.; Kobryn, A.E.; et al. CVD Grown Nitrogen Doped Graphene Is an Exceptional Visible-Light Driven Photocatalyst for Surface Catalytic Reactions. 2D Mater. 2019, 7, 15002. [Google Scholar] [CrossRef]
  12. Wei, D.; Liu, Y.; Wang, Y.; Zhang, H.; Huang, L.; Yu, G. Synthesis of N-Doped Graphene by Chemical Vapor Deposition and Its Electrical Properties. Nano Lett. 2009, 9, 1752–1758. [Google Scholar] [CrossRef] [PubMed]
  13. Wu, J.; Ma, L.; Yadav, R.M.; Yang, Y.; Zhang, X.; Vajtai, R.; Lou, J.; Ajayan, P.M. Nitrogen-Doped Graphene with Pyridinic Dominance as a Highly Active and Stable Electrocatalyst for Oxygen Reduction. ACS Appl. Mater. Interfaces 2015, 7, 14763–14769. [Google Scholar] [CrossRef] [PubMed]
  14. Miao, H.; Li, S.; Wang, Z.; Sun, S.; Kuang, M.; Liu, Z.; Yuan, J. Enhancing the Pyridinic N Content of Nitrogen-Doped Graphene and Improving Its Catalytic Activity for Oxygen Reduction Reaction. Int. J. Hydrogen Energy 2017, 42, 28298–28308. [Google Scholar] [CrossRef]
  15. Kapteijn, F.; Moulijn, J.A.; Matzner, S.; Boehm, H.-P. The Development of Nitrogen Functionality in Model Chars during Gasification in CO2 and O2. Carbon 1999, 37, 1143–1150. [Google Scholar] [CrossRef]
  16. Qu, L.; Liu, Y.; Baek, J.-B.; Dai, L. Nitrogen-Doped Graphene as Efficient Metal-Free Electrocatalyst for Oxygen Reduction in Fuel Cells. ACS Nano 2010, 4, 1321–1326. [Google Scholar] [CrossRef]
  17. Faisal, S.N.; Haque, E.; Noorbehesht, N.; Zhang, W.; Harris, A.T.; Church, T.L.; Minett, A.I. Pyridinic and Graphitic Nitrogen-Rich Graphene for High-Performance Supercapacitors and Metal-Free Bifunctional Electrocatalysts for ORR and OER. RSC Adv. 2017, 7, 17950–17958. [Google Scholar] [CrossRef] [Green Version]
  18. Wang, J.; Zhao, H.; Gao, Y.; Chen, D.; Chen, C.; Saccoccio, M.; Ciucci, F. Ba0.5Sr0.5Co0.8Fe0.2O3−δ on N-Doped Mesoporous Carbon Derived from Organic Waste as a Bi-Functional Oxygen Catalyst. Int. J. Hydrogen Energy 2016, 41, 10744–10754. [Google Scholar] [CrossRef]
  19. Wang, J.; Kong, H.; Zhang, J.; Hao, Y.; Shao, Z.; Ciucci, F. Carbon-Based Electrocatalysts for Sustainable Energy Applications. Prog. Mater. Sci. 2021, 116, 100717. [Google Scholar] [CrossRef]
  20. Ye, J.; Shao, Q.; Wang, X.; Wang, T. Effects of B, N, P and B/N, B/P Pair into Zigzag Single-Walled Carbon Nanotubes: A First-Principle Study. Chem. Phys. Lett. 2016, 646, 95–101. [Google Scholar] [CrossRef]
  21. Wang, J.; Kim, J.; Choi, S.; Wang, H.; Lim, J. A Review of Carbon-Supported Nonprecious Metals as Energy-Related Electrocatalysts. Small Methods 2020, 4, 2000621. [Google Scholar] [CrossRef]
  22. Zhuang, S.; Nunna, B.B.; Lei, E.S. Synthesis of Nitrogen-Doped Graphene Catalyst by Wet Ball Milling for Electrochemical Systems. In Proceedings of the 251st ACS National Meeting & Exposition, San Diego, CA, USA, 13–17 March 2016. [Google Scholar]
  23. Zhuang, S.; Nunna, B.B.; Lee, E.S. Metal Organic Framework-Modified Nitrogen-Doped Graphene Oxygen Reduction Reaction Catalyst Synthesized by Nanoscale High-Energy Wet Ball-Milling Structural and Electrochemical Characterization. MRS Commun. 2018, 8, 40–48. [Google Scholar] [CrossRef]
  24. Zhuang, S.; Lei, L.; Nunna, B.; Lee, E.S. New Nitrogen-Doped Graphene/MOF-Modified Catalyst for Fuel Cell Systems. ECS Trans. 2016, 72, 149. [Google Scholar] [CrossRef]
  25. Zhuang, S.; Nunna, B.B.; Boscoboinik, J.A.; Lee, E.S. Nitrogen-Doped Graphene Catalysts: High Energy Wet Ball Milling Synthesis and Characterizations of Functional Groups and Particle Size Variation with Time and Speed. Int. J. Energy Res. 2017, 41, 2535–2554. [Google Scholar] [CrossRef]
  26. Singh, H.; Zhuang, S.; Ingis, B.; Nunna, B.B.; Lee, E.S. Carbon-Based Catalysts for Oxygen Reduction Reaction: A Review on Degradation Mechanisms. Carbon 2019, 151, 160–174. [Google Scholar] [CrossRef]
  27. Zhuang, S.; Lee, E.S.; Lei, L.; Nunna, B.B.; Kuang, L.; Zhang, W. Synthesis of Nitrogen-Doped Graphene Catalyst by High-Energy Wet Ball Milling for Electrochemical Systems. Int. J. Energy Res. 2016, 40, 2136–2149. [Google Scholar] [CrossRef]
  28. Zhuang, S.; Singh, H.; Nunna, B.B.; Mandal, D.; Boscoboinik, J.A.; Lee, E.S. Nitrogen-Doped Graphene-Based Catalyst with Metal-Reduced Organic Framework: Chemical Analysis and Structure Control. Carbon 2018, 139, 933–944. [Google Scholar] [CrossRef]
  29. Zhuang, S.; Nunna, B.B.; Mandal, D.; Lee, E.S. A Review of Nitrogen-Doped Graphene Catalysts for Proton Exchange Membrane Fuel Cells-Synthesis, Characterization, and Improvement. Nano-Struct. Nano-Objects 2018, 15, 140–152. [Google Scholar] [CrossRef]
  30. Singh, H.; Zhuang, S.; Nunna, B.B.; Lee, E.S. Thermal Stability and Potential Cycling Durability of Nitrogen-Doped Graphene Modified by Metal-Organic Framework for Oxygen Reduction Reactions. Catalysts 2018, 8, 607. [Google Scholar] [CrossRef] [Green Version]
  31. Sui, Z.-Y.; Zhang, P.-Y.; Xu, M.-Y.; Liu, Y.-W.; Wei, Z.-X.; Han, B.-H. Metal–Organic Framework-Derived Metal Oxide Embedded in Nitrogen-Doped Graphene Network for High-Performance Lithium-Ion Batteries. ACS Appl. Mater. Interfaces 2017, 9, 43171–43178. [Google Scholar] [CrossRef]
  32. Elgrishi, N.; Rountree, K.J.; McCarthy, B.D.; Rountree, E.S.; Eisenhart, T.T.; Dempsey, J.L. A Practical Beginner’s Guide to Cyclic Voltammetry. J. Chem. Educ. 2018, 95, 197–206. [Google Scholar] [CrossRef]
  33. Si, F.; Zhang, Y.; Yan, L.; Zhu, J.; Xiao, M.; Liu, C.; Xing, W.; Zhang, J. 4—Electrochemical Oxygen Reduction Reaction. In Rotating Electrode Methods and Oxygen Reduction Electrocatalysts; Xing, W., Yin, G., Zhang, J., Eds.; Elsevier: Amsterdam, The Netherlands, 2014; pp. 133–170. ISBN 978-0-444-63278-4. [Google Scholar]
  34. Bard, A.J.; Faulkner, L.R.; White, H.S. Electrochemical Methods: Fundamentals and Applications; John Wiley & Sons: Hoboken, NJ, USA, 2022. [Google Scholar]
  35. Kulkarni, A.; Siahrostami, S.; Patel, A.; Nørskov, J.K. Understanding Catalytic Activity Trends in the Oxygen Reduction Reaction. Chem. Rev. 2018, 118, 2302–2312. [Google Scholar] [CrossRef] [PubMed]
  36. Wang, F.; Hu, S. Studies of Electrochemical Reduction of Dioxygen with RRDE. Electrochim. Acta 2006, 51, 4228–4235. [Google Scholar] [CrossRef]
  37. Jürmann, G.; Tammeveski, K. Electroreduction of Oxygen on Multi-Walled Carbon Nanotubes Modified Highly Oriented Pyrolytic Graphite Electrodes in Alkaline Solution. J. Electroanal. Chem. 2006, 597, 119–126. [Google Scholar] [CrossRef]
  38. Zhou, R.; Zheng, Y.; Jaroniec, M.; Qiao, S.-Z. Determination of the Electron Transfer Number for the Oxygen Reduction Reaction: From Theory to Experiment. ACS Catal. 2016, 6, 4720–4728. [Google Scholar] [CrossRef]
  39. Zhang, M.; Yan, Y.; Gong, K.; Mao, L.; Guo, Z.; Chen, Y. Electrostatic Layer-by-Layer Assembled Carbon Nanotube Multilayer Film and Its Electrocatalytic Activity for O2 Reduction. Langmuir 2004, 20, 8781–8785. [Google Scholar] [CrossRef] [PubMed]
  40. Keith, J.A.; Jacob, T. Theoretical Studies of Potential-Dependent and Competing Mechanisms of the Electrocatalytic Oxygen Reduction Reaction on Pt(111). Angew. Chem. Int. Ed. 2010, 49, 9521–9525. [Google Scholar] [CrossRef]
  41. Duke, F.R.; Haas, T.W. The Homogeneous Base-Catalyzed Decomposition of Hydrogen Peroxide1. J. Phys. Chem. 1961, 65, 304–306. [Google Scholar] [CrossRef]
  42. Liu, Y.; Wu, H.; Li, M.; Yin, J.-J.; Nie, Z. PH Dependent Catalytic Activities of Platinum Nanoparticles with Respect to the Decomposition of Hydrogen Peroxide and Scavenging of Superoxide and Singlet Oxygen. Nanoscale 2014, 6, 11904–11910. [Google Scholar] [CrossRef]
  43. Serra-Maia, R.; Bellier, M.; Chastka, S.; Tranhuu, K.; Subowo, A.; Rimstidt, J.D.; Usov, P.M.; Morris, A.J.; Michel, F.M. Mechanism and Kinetics of Hydrogen Peroxide Decomposition on Platinum Nanocatalysts. ACS Appl. Mater. Interfaces 2018, 10, 21224–21234. [Google Scholar] [CrossRef]
  44. Smith, T.J.; Stevenson, K.J. 4—Reference Electrodes. In Handbook of Electrochemistry; Zoski, C.G., Ed.; Elsevier: Amsterdam, The Netherlands, 2007; pp. 73–110. ISBN 978-0-444-51958-0. [Google Scholar]
  45. Singh, H.; Zhuang, S.; Nunna, B.B.; Lee, E.S. Morphology and Chemical Structure of Modified Nitrogen-Doped Graphene for Highly Active Oxygen Reduction Reactions. In Proceedings of the 48th Power source conference, Denver, CO, USA, 11–14 June 2018. [Google Scholar]
  46. Arning, M.D.; Minteer, S.D. 18—Electrode Potentials. In Handbook of Electrochemistry; Zoski, C.G., Ed.; Elsevier: Amsterdam, The Netherlands, 2007; pp. 813–827. ISBN 978-0-444-51958-0. [Google Scholar]
  47. Li, Y.; Lv, C.; Li, Z.; Quéré, D.; Zheng, Q. From Coffee Rings to Coffee Eyes. Soft Matter 2015, 11, 4669–4673. [Google Scholar] [CrossRef]
Figure 1. LSV plot for ORR in the oxygen saturated 0.1 KOH electrolyte on the N-G/MOF (green line) and N-G (black line) catalysts coated GCE working electrode.
Catalysts 12 00791 g001
Figure 2. LSV plots for ORR from without (green line) and with (blue line) H2O2 in oxygen saturated 0.1 KOH electrolyte on the N-G/MOF coated GCE working electrode.
Catalysts 12 00791 g002
Figure 3. LSV plot for ORR in the oxygen saturated 0.01 HClO4 electrolyte on the N-G/MOF (green line) and N-G (black line) catalysts coated GC working electrode.
Catalysts 12 00791 g003
Figure 4. LSV curves for ring-currents from the RRDE experiments with two conditions of disk surface (green and red lines) and the effect of N-G/MOF on ring-current (black line).
Catalysts 12 00791 g004
Figure 5. LSV plot for ORR in the 0.01 M HClO4 (green line), 0.005 M HClO4 (blue line), and 0.001 M HClO4 (red lines) electrolyte on the N-G/MOF coated GCE working electrode.
Catalysts 12 00791 g005
Figure 6. A simplified diagram to show the function of three electrode in the RDE/RRDE system. working electrode (WE), reference electrode (RE), counter electrode (CE).
Catalysts 12 00791 g006
Figure 7. Magnified and externally illuminated working electrode disk (GC) surface before (a); and after (b) the drop casting of N-G/MOF catalyst.
Catalysts 12 00791 g007
Figure 8. Creating the alkaline medium ORR environment on the AFC cathode within an RDE setup: (a) actual test vial of our RDE setup; (b) schematic of working process of the H2-O2 AFC; and (c) Schematic of the test vial of RDE setup.
Catalysts 12 00791 g008
Figure 9. Creating the acidic medium ORR environment on the PEMFC cathode within an RDE setup: (a) actual test vial of our RDE setup; (b) schematic of working process of the H2-O2 PEMFC; and (c) schematic of the test vial of RDE setup.
Catalysts 12 00791 g009
Table 1. Data Comparison of RDE and RRDE experiments of N-G/MOF in both acidic and alkaline mediums. All the other experiments conditions are same.
Electrolyte Medium & Experiment
Experiment
Conditions & Data
Alkaline Medium
(0.1 M KOH Solution)
Acidic Medium
(0.01 M HClO4 Solution)
RDERRDERDERRDE
Disk Surface Area (cm2)0.19630.12560.19630.1256
Ring Surface Area (cm2)-0.1885-0.1885
Catalyst Loading on
Disk (µg/cm2)
39.737.3239.737.32
Current Density from N-G/MOF coated Disk (mA/cm2) at −0.47 V2.9672.610.0940.136
at −0.63 V2.3622.230.4890.626
at −1.20 V4.3884.194.1384.018
Current Density from bare GC Ring (mA/cm2)at −0.47 V-1.62-0.096
at −0.63 V-1.31-0.367
at −1.20 V-2.90-3.496
Publisher’s Note: MDPI stays neutral with regard to jurisdictional claims in published maps and institutional affiliations.

