
Mechanistic and Experimental Study of the CuxO@C Nanocomposite Derived from Cu3(BTC)2 for SO2 Removal
by
 ,
,
Rudi Duan
1, 
Weibin Chen
1,
Ziwei Chen
1,
Jialiang Gu
1,
Zhaoqi Dong
1,
Beini He
1,
Lili Liu
1,2 and
Xidong Wang
1,2,* 1
College of Engineering, Peking University, 5 Yiheyuan Road, Beijing 100871, China
2
School of Materials Science and Engineering, Peking University, 5 Yiheyuan Road, Beijing 100871, China
*
Author to whom correspondence should be addressed.
Catalysts 2022, 12(7), 689; https://doi.org/10.3390/catal12070689
Submission received: 26 April 2022
/
Revised: 26 May 2022
/
Accepted: 11 June 2022
/
Published: 24 June 2022
(This article belongs to the Topic Materials and Catalysts for Pollutants and CO2 Capture and Transformation)
Abstract
:A tunable and efficient strategy was adopted to synthesize highly porous nano-structured CuO−carbonized composites (CuxO@C) using Cu3(BTC)2 as a sacrificial template. The as-synthesized CuO nanocomposites exhibited hollow octahedral structures, a large surface area (89.837 m2 g−1) and a high proportion of Cu2O active sites distributed on a carbon frame. Based on DFT calculations, both the Cu atoms on the surface (CuS) and oxygen vacancy (OV) exhibited strong chemical reactivity. On the perfect CuO (111), the CuS transferred charge to O atoms on the surface and SO2 molecules. A strong adsorption energy (−1.41 eV) indicated the existence of the chemisorption process. On the oxygen-deficient CuO (111), the O2 preferably adsorbed on OV and then formed SO3 by bonding with SO2, followed by the cleavage of the O−O bond. Furthermore, the CuO nanocomposites exhibited an excellent ratio of S/Cu in SO2 removal experiments compared with CuO nanoparticles produced by coprecipitation.
1. Introduction
Sulfur dioxide (SO2), as a major pollutant gas, is mainly derived from fossil fuel combustion for electrical energy in large industries, such as coal-fired power plants [1]. The emitted SO2 in flue gas can directly cause acid rain by the reaction with oxygen and water vapor, which is seriously harmful to the ecology and human health [2]. Thereby, the SO2 purification from flue gas has enormous significance for ecological and environmental improvement. Currently, the SO2 separation method using metal oxides as a desulfurizer, which can effectively reduce the content of SO2 in flue gas by catalytic oxidation, has gradually become the chief technology of SO2 removal [3,4].
Among them, the method by the reaction of calcium oxide (CaO) with SO2 and O2 to form CaSO3/ CaSO4 is extensively applied in industrial applications. However, this product after SO2 uptake is almost irreversible due to the high energy consumption for regeneration caused by a high decomposition temperature [5,6]. The commonly used metal oxide desulfurizer for the sulfide removal also include V2O5, CeO2, MnOx, Fe2O3, ZrO2 and CuO [7,8,9,10,11,12,13].
CuO possesses the advantages of high selectivity for SO2 and renewability, resulting in an excellent performance in SO2 removal compared with the other metal oxides [14,15,16]. To reduce the amount of metal and economic cost, CuO is usually supported on porous materials and then on the active sites exposed in the flue gas [17,18,19,20,21,22,23]. Tseng et al. reported that copper-oxide-supported activated carbon has outstanding performance in SO2 adsorption and regeneration [24]. The introduction of CuO contributes to the enhancement of SO2 adsorption and oxidation reaction [19].
Yuan et al. found that SO2 can be catalytically oxidized to SO3 on the copper sites in the existence of O2 and then form sulfates, which causes a gradual deactivation of copper-loaded activated coke [18]. In addition, the effect of the oxidation state of Cu on SO2 adsorption has been reported in the existing literature. In the report of Soldemo et al., the unsaturated copper atoms at the Cu2O (111) surface facilitated the SO2 to SO3 transformation [25].
Galtayries et al. presented two different paths and products for SO2 adsorption on Cu2O as the number of oxygen vacancies increases [26]. Moreover, Baxter et al. also obtained data on the Co−adsorption of O2 and SO2 on Cu2O, which can lead to the formation of CuO and the adsorption of SO3 (ads) [27]. Hammershøi et al. reported DFT calculations results indicating that both SO2 and SO3 can form stable species with Cu2+ and Cu+, while the Cu+ site and Cu2+ site preferably bond to SO2 and SO3, respectively [28].
Metal–organic frameworks (MOFs) are emergent materials with self-assembly metal cluster centers and bridging ligands, which have a wide range of potential applications [29,30,31,32]. Cu3(BTC)2 (BTC = benzo−1,3,5−tricarboxylate) (namely, MOF−199 and HKUST−1), as a representative copper-based MOF (Cu−MOF) material, is widely used in many fields, such as catalysis, sensors, gas separation and storage, due to its structurally characteristic pores and highly active open metal sites [5,30,31,32]. Jin et al. reported that a Cu−MOF−supported composite (CuO@HKUST−1) had enhanced photocatalytic activity and stability over methylene blue dye degradation [33].
Moreover, MOF materials can also be applied as templates to in situ synthesize MOF−based metals/metal oxides/metal-doped carbon composites through pyrolysis under controllable conditions [33,34,35,36,37,38,39]. The principle of this transformation is considered to be the release of small molecules from the precursors, which lead to the formation of porously hollow nanocomposites. The internal relationship between the structure and activity of CuO composites derived from Cu3(BTC)2 was investigated in the existing literature [38].
In the report of Wang et al., Cu2O/CuO polyhedral materials with the shape of octahedral, truncated octahedral and cubic were successfully obtained by controlling the morphology of the Cu3(BTC)2 precursors, in which the octahedral Cu2O/CuO exhibited excellent gas-sensing performance resulting from a large specific surface area and high ratio of adsorbed O on the surface [39]. In addition, this synthesized strategy that uses the Cu3(BTC)2 as a template has been reported in many applications related to the field of adsorption [40,41] and catalysis [34,35]. Peng et al. found that octahedral CuO composites could be synthesized by pyrolysis of Cu3(BTC)2 under the N2 atmosphere, which showed a superior catalytic activity for NOx at a low temperature [34].
Vantran et al. synthesized a CuxO−supported carbon matrix composite (Cu/Cu2O/CuO@C) through the thermolysis of the Cu3(BTC)2 template, which exhibited a high removal efficiency over chloramphenicol antibiotic [35]. These studies towards derivatives effectively extend the potential applications of Cu−MOFs and reconfirm that the texture properties of CuxO@C composites are promising in the fields related to catalysis and gas separation. However, there are few studies on flue gas desulfurization (FGD) by using the pyrolysis product of Cu3(BTC)2 as a desulfurizer. Therefore, the study of MOF−derived composites for SO2 purification is promising to further broaden the application scope of MOF.
Herein, the outcomes of previous studies prompted us to synthesize the hierarchically porous CuO composites supported on carbon by pyrolyzing Cu3(BTC)2 precursors and use these as a novel catalyst for FGD. The pyrolysis products of Cu3(BTC)2 are characterized, and its SO2 removal performance is tested and compared with that of CuO nanoparticles prepared by coprecipitation. The theoretical calculation method was also adopted to further investigate the reaction mechanisms over the perfect and oxygen-deficient CuO (111) surface through the state density, Bader charge transfer and charge density difference; thus, a possible adsorption microscopic mechanism was postulated.
In summary, the main aim of this study is to provide an adjustable synthesis method of CuO nanocomposites using MOFs for highly efficient SO2 removal and to study the microscopic mechanism behind the reaction. Moreover, this work broadens the potential applications of MOF materials.
2. Results and Discussion
2.1. Structure and Chemical Properties of Nano−CuOs
2.1.1. Morphology and Phase Analysis of Nano−CuOs
The Cu3(BTC)2 crystals show the morphologically octahedral structure with a size of about 1 μm (Figure S1), which is consistent with the work described in previous literature [36]. Figure 1a–e shows the TEM images of synthesized CuO composites, which describe the interior structure of the thermal decomposition products. As shown in Figure 1a, the CuO−NC derived from Cu3(BTC)2 almost completely maintains the well-defined octahedral structure of Cu3(BTC)2, while the numbers of loose pores are distributed within each octahedral unit, forming a hollow structure.
We found from the HR−TEM images (Figure 1b) that the microcrystal nanoparticles size ranged from 10 to 15 nm in the composition of this hollow structure. The interspacing of lattice fringes were 0.234, 0.251, 0.245 and 0.302 nm, corresponding to the CuO (111), CuO (002), Cu2O (111) and Cu2O (110) lattice planes, respectively [36,39]. Furthermore, in Figure 1(c1–c3), the Cu, O and C element mapping images matching the STEM image (Figure 1c) of CuO−NC demonstrated a uniform distribution of copper oxides and the existence of the carbon matrix in the hollow octahedral structure.
However, the CuO−NP produced by coprecipitation showed a compact aggregation of many interconnected particles ranging from 50 to 100 nm. There was one group of lattice fringes in the HR−TEM image of CuO−NP (Figure 1e). Figure 1f shows the XRD patterns of the Cu3(BTC)2 precursors and nano−CuOs. All peaks of the synthesized Cu3(BTC)2 matched well with that of simulated Cu3(BTC)2. The diffraction peaks of CuO−NC could be assigned to CuO (JCPDS#04−0836) and Cu2O (JCPDS#05−0667), while those of CuO−NP could be exclusively attributed to CuO.
These results were consistent with HR−TEM analysis, indicating that using the Cu3(BTC)2 as the template led to the formation of multiple oxides of copper in pyrolysis products. The thermal decomposition temperature of 300 °C for Cu3(BTC)2 precursors in the air was determined based on the TG measurements. According to the TGA curves in Figure 1f, the weight loss process of Cu3(BTC)2 was divided into five stages. The first sharp weight loss stage (stage I) was attributed to the removal of water and solvent molecules (CH3OH) from the surface and pores of the Cu3(BTC)2 precursors.
The second theoretical weight loss stage was observed between 288 and 320 °C (stage III and IV) was caused by the pyrolysis of the organic ligands and oxidation in Cu3(BTC)2 [34]. Notably, a decrease in the weight loss rate was observed at temperatures ranging between 292 and 320 °C, which could be related to the oxidation of Cu2O. When the temperature was higher than 320 °C (stage V), the second platform was obtained, indicating that the Cu2O may be oxidized entirely to CuO [34,42]. Therefore, the products at 330 °C were an intermediate presence of Cu2O along with CuO, which is consistent with the literature [38,42,43]. In addition, the existence of carbon also provided a favorable atmosphere of reducing for the formation of Cu2O in this work.
2.1.2. Porous Structures of Nano−CuOs
N2 adsorption–desorption isotherms at 77 K were measured for examining the pore characteristics of the nano−CuOs. As shown in Figure 2a, in the CuO−NC prepared by Cu3(BTC)2, the N2 adsorption capacity was less at the low P/P0 region, while the amount of adsorbed N2 rapidly increased once the value of P/P0 reached 0.7. The curves of CuO−NC exhibited a typical type−IV sorption isotherm with the H3−type hysteresis loop between the relative pressure 0.45 and 1.0, which could be explained by the presence of slit-like pores that resulted from the aggregation of nanocrystalline particles [44], whereas the CuO−NP prepared by coprecipitation exhibited a low amount of N2 adsorption (1.2 cm3 g−1) with the variation of P/P0.
Figure 2b shows the pore size distributions of CuO−NC and CuO−NP, which were obtained by the BJH method. The CuO−NC shows five pore size distributions with a sharp peak at 2.2 nm as well as three broad peaks at 4.8, 11.3 and 18.6 nm. The pores with small aperture could be derived from the octahedral frames and shells, while that with the large aperture may originate from the gap between octahedral units. The detailed data were summarized in Table S1.
The specific surface areas of the two nano−CuOs are 89.837 and 1.502 m2 g−1, corresponding to the CuO−NC and CuO−NP, respectively, where the value of the porous octahedral CuO−NC is higher than that of many nano−Cu2Os or nano−CuOs reported in previous literature [34,36,42,45]. In addition, the CuO−NC showed a larger micropore volume (0.096 cm3 g−1) and mesopore volume (0.160 cm3 g−1) when compared with those of CuO−NP (0.000097 and 0.000998 cm3 g−1). This suggested that using the Cu3(BTC)2 precursors as templates facilitated the formation of the hierarchical pore structure of calcined products.
2.1.3. Chemical Compositions of Nano−CuOs
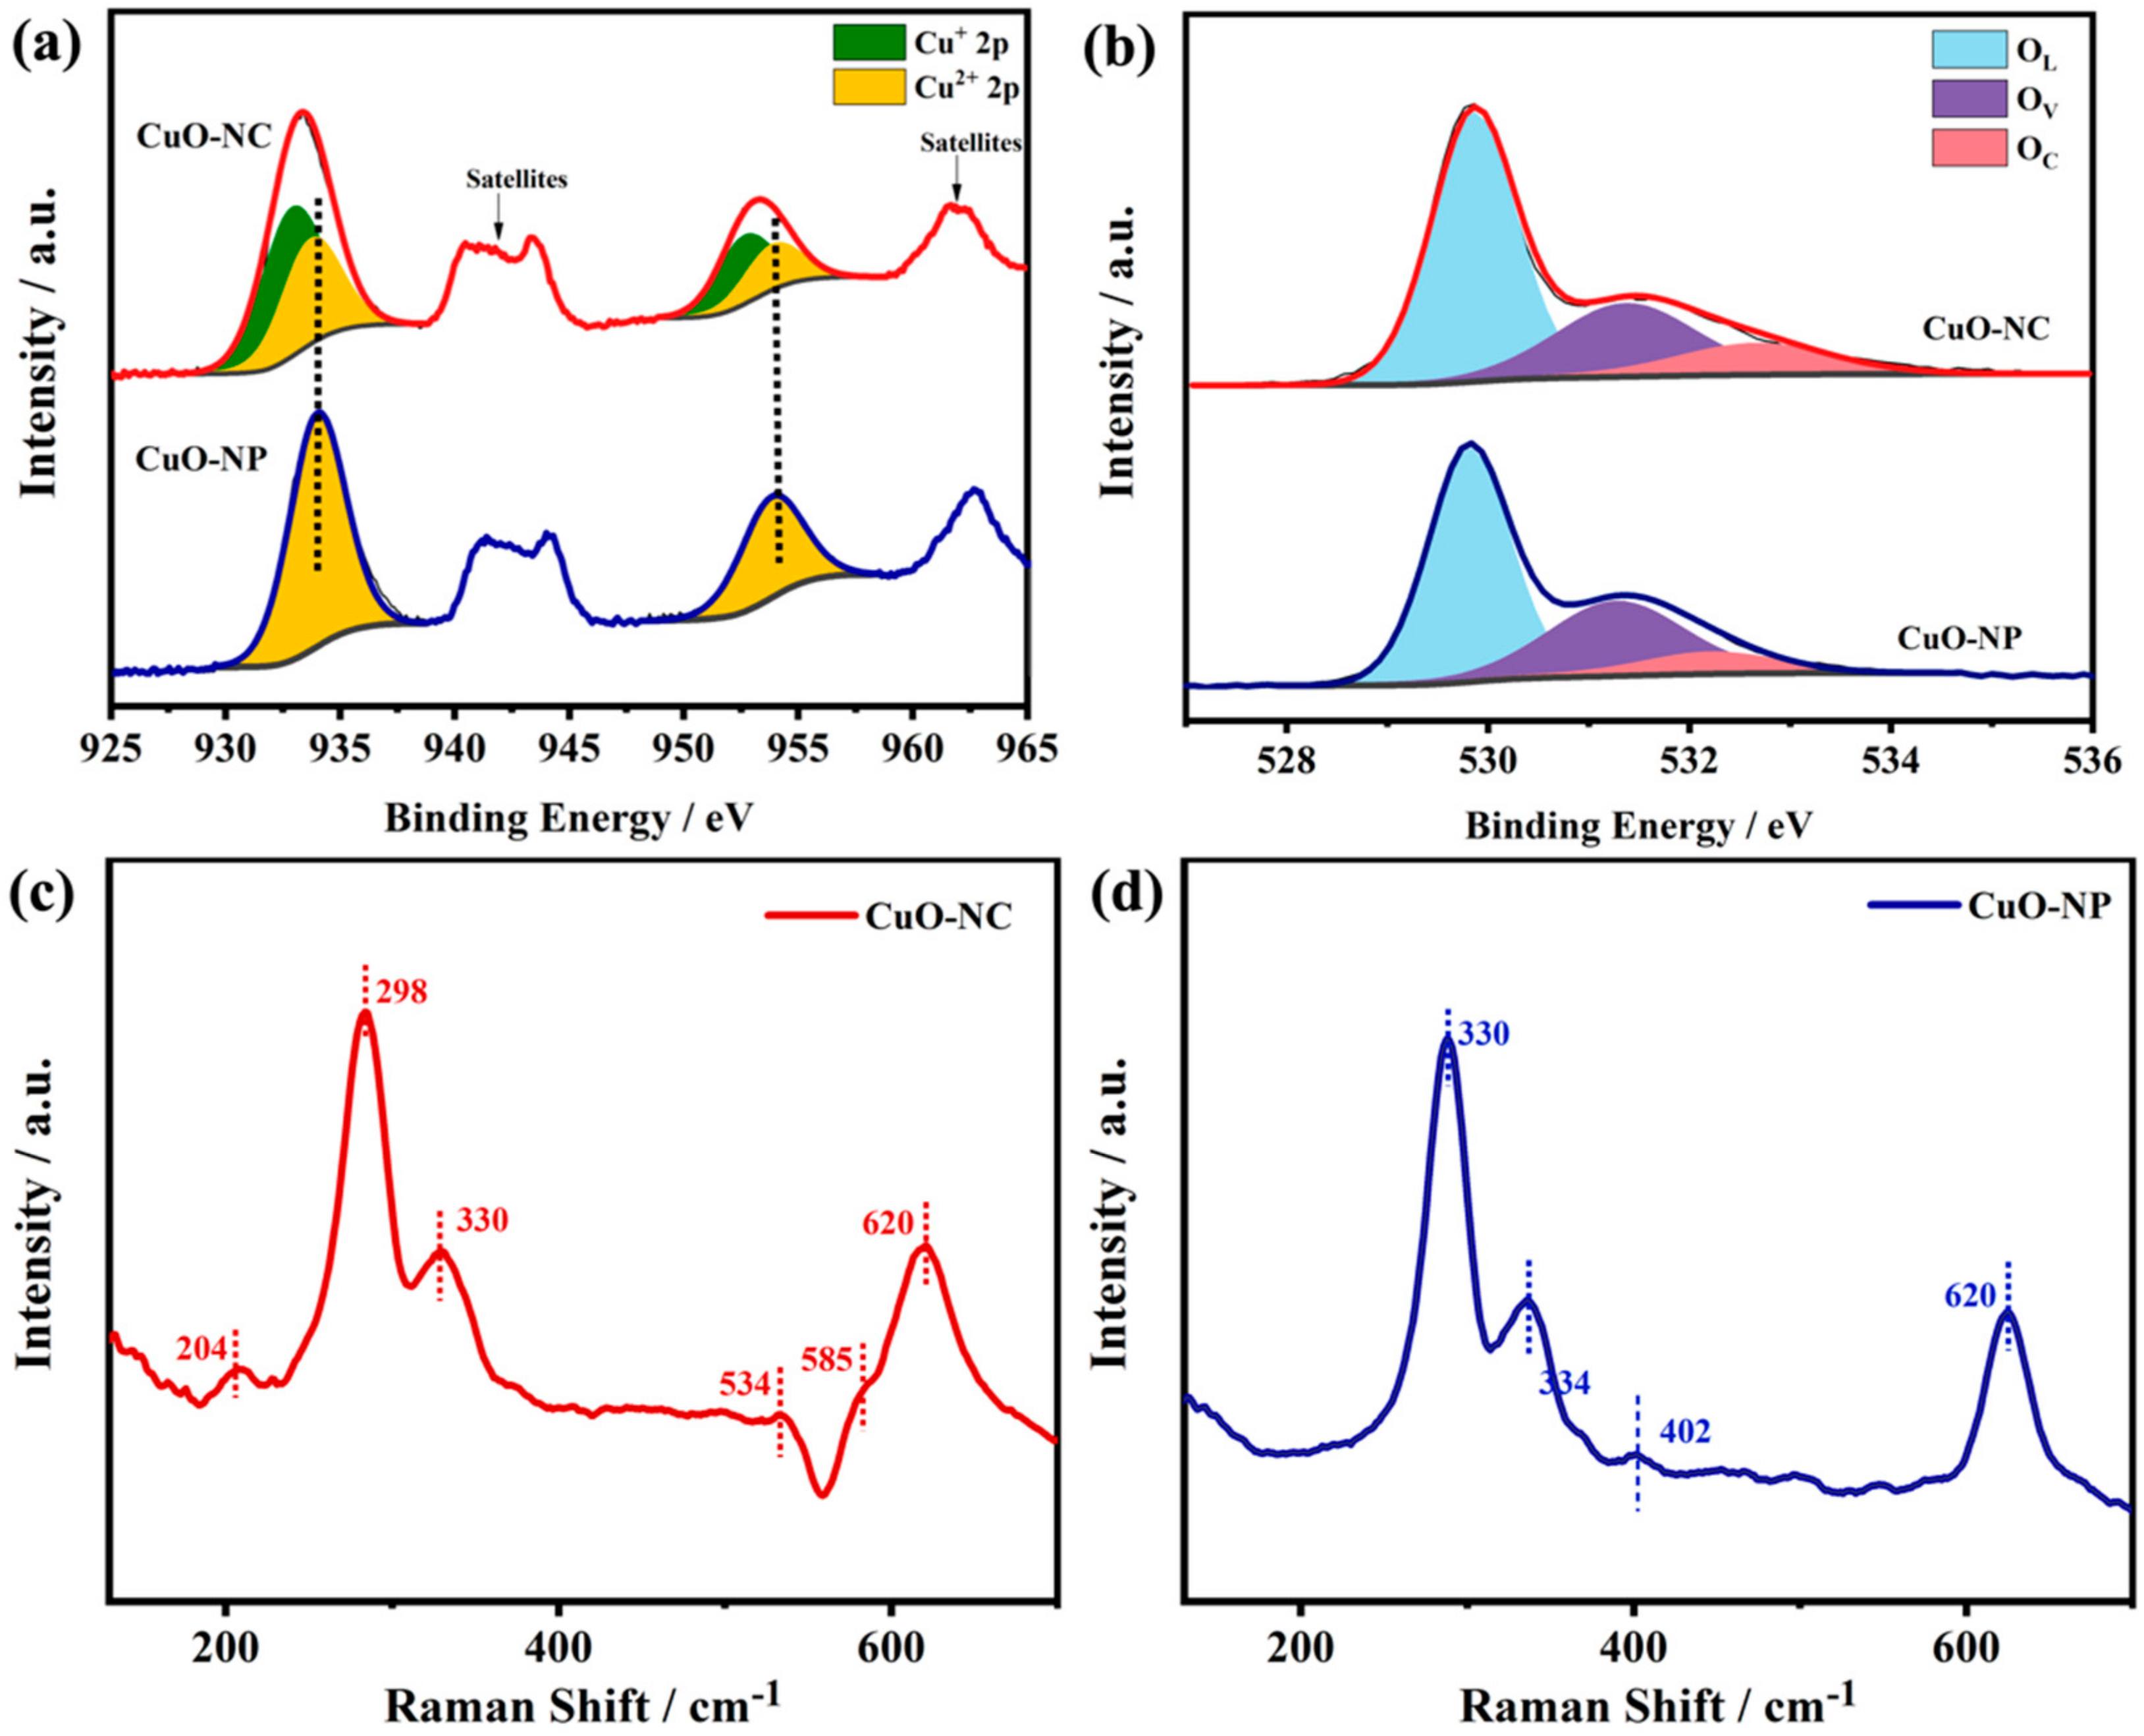
XPS analysis was conducted to examine the chemical compositions on the surface of as-synthesized CuO−NC and CuO−NP. Figure 3a displays the Cu 2p XPS spectra, where four sub-peaks were deconvoluted from the corresponding curve of the CuO−NC. The two main peaks could be observed at the position of 932.6 and 952.6 eV, which corresponded to the 2p3/2 and 2p1/2 peaks of Cu+, respectively [46]. The other two major peaks at the higher binding energy positions (933.7 and 953.6 eV) mainly originated from Cu2+ [47].
Moreover, the typical satellite peaks accompanied by the electronic shake-up were also observed in the Cu2p XPS spectra of the CuO−NC, which reconfirmed the existence of Cu2+ [31,36]. Thereby, these results proved the coexistence of Cu2O and CuO in the CuO−NC, where the relative proportion of Cu+ was about 59.5% (Table 1). In contrast, in Figure 3a, only two main peaks corresponding to Cu2+ appeared in the Cu 2p XPS spectra of the CuO−NP, indicating that the products may belong to a pure phase, which was consistent with the results of the HR−TEM and XRD analysis.
As shown in Figure 3b, the two nano−CuOs exhibited similar O1s XPS spectra that were resolved into three fitting peaks at 530.3 ± 0.1, 531.5 ± 0.1 and 532.3 ± 0.2 eV, respectively, corresponding to the lattice oxygen (OL), oxygen vacancy (OV) and adsorbed oxygen (OC) peaks [38]. The OC and OV components represent the hydroxyl (OH−), chemically adsorbed and dissociated oxygen, such as O2−, O2− and O−, which is usually related to the ability to adsorb oxygen [38,39]. Table 1 summarizes the O element proportion of the surface chemical compositions according to the fitting results of the XPS spectra.
The CuO−NC displayed a larger relative proportion of OC than that of CuO−NP. In Figure 3c, the Raman spectroscopy analysis of CuO−NC and CuO−NP revealed that three similar peaks in both of two nano−CuOs were located at 298, 330 and 620 cm−1, which were assigned to the characteristic peaks of CuO in the Raman active modes of Ag, B1g and B2g, respectively [48].
In particular, three other peaks at 204 cm−1, 534 cm−1 and 585 cm−1 were observed in the CuO−NC, which was believed to be contributed by the Cu2O phase [49]. The EPR analysis of CuO−NC and CuO−NP was conducted to study the oxidation states of the metal and surface chemisorbed oxygen. As shown in the EPR spectra (Figure 3d), a sharp peak of the g-value (g = 2.003) was discovered in the CuO−NC samples, which was the characteristic signal of the paramagnetic materials containing superoxide ions (O2−) [50,51,52]. Based on the relevant literature, it was also related to the existence of oxygen vacancies [50].
2.2. Microscopic Mechanism of SO2 Removal on Simulated Nano−CuOs
2.2.1. Model of the CuO (111) Surface
To date, there have been very few studies regarding the fundamental understanding of the SO2 adsorption mechanism on the CuO surface. It is also difficult to characterize the atomic-scale adsorption configurations through experiments. Owing to the lack of information on this research, we employ atomic simulations to investigate the SO2 adsorption mechanism at the CuO surfaces.
Maimaiti et al. reported that the CuO (111) is the most stable surface by predicting the computed surface energies of different CuO surfaces using DFT simulations (ECuO (111) < ECuO (011) < ECuO (110) < ECuO (010) < ECuO (100)) [53]. Therefore, the relatively stable (111) facet was adopted as the surface termination, which also was reconcilable with the XRD analysis of the experiment section (Figure 1f). Figure 4 shows the optimized surface slab models of CuO surface. The unit cell of simulated CuO−NC is shown in Figure 4a.
The periodic surface was 11.6 Å × 12.6 Å × 24 Å with a vacuum slab of 16 Å in thickness, which can separate the layer from its periodic images. As shown in Figure 4b, the atoms of the bottom six layers (two Cu layers and four O layers) were frozen in their equilibrium positions within the geometry optimizations, whereas all other atoms were allowed to structurally relax. There are four different types of surface atoms on the clean CuO (111) surface, which are separately attributed to unsaturated (Cu3c) and saturated (Cu4c) copper atoms, unsaturated (O3c) and saturated (O4c) oxygen atoms.
Among them, the bond length of bulk Cu−O is 1.941 Å, which is much longer than that of Cu3c−O3c (1.797 Å) and Cu3c−O4c (1.888 Å) and shorter than that of Cu4c−O4c (1.966 Å) and Cu4c−O3c (1.919 Å). Furthermore, the SO2 adsorption was simulated on one side of the exposed surfaces of the slab, where the atoms of the top six layers and adsorbates were fully relaxed. The adsorption energies between all possible adsorption sites as well as the structures with each adsorbate were calculated; however, only the maximum was used for discussion.
2.2.2. Adsorption Configuration of SO2 Molecules over Perfect CuO (111)
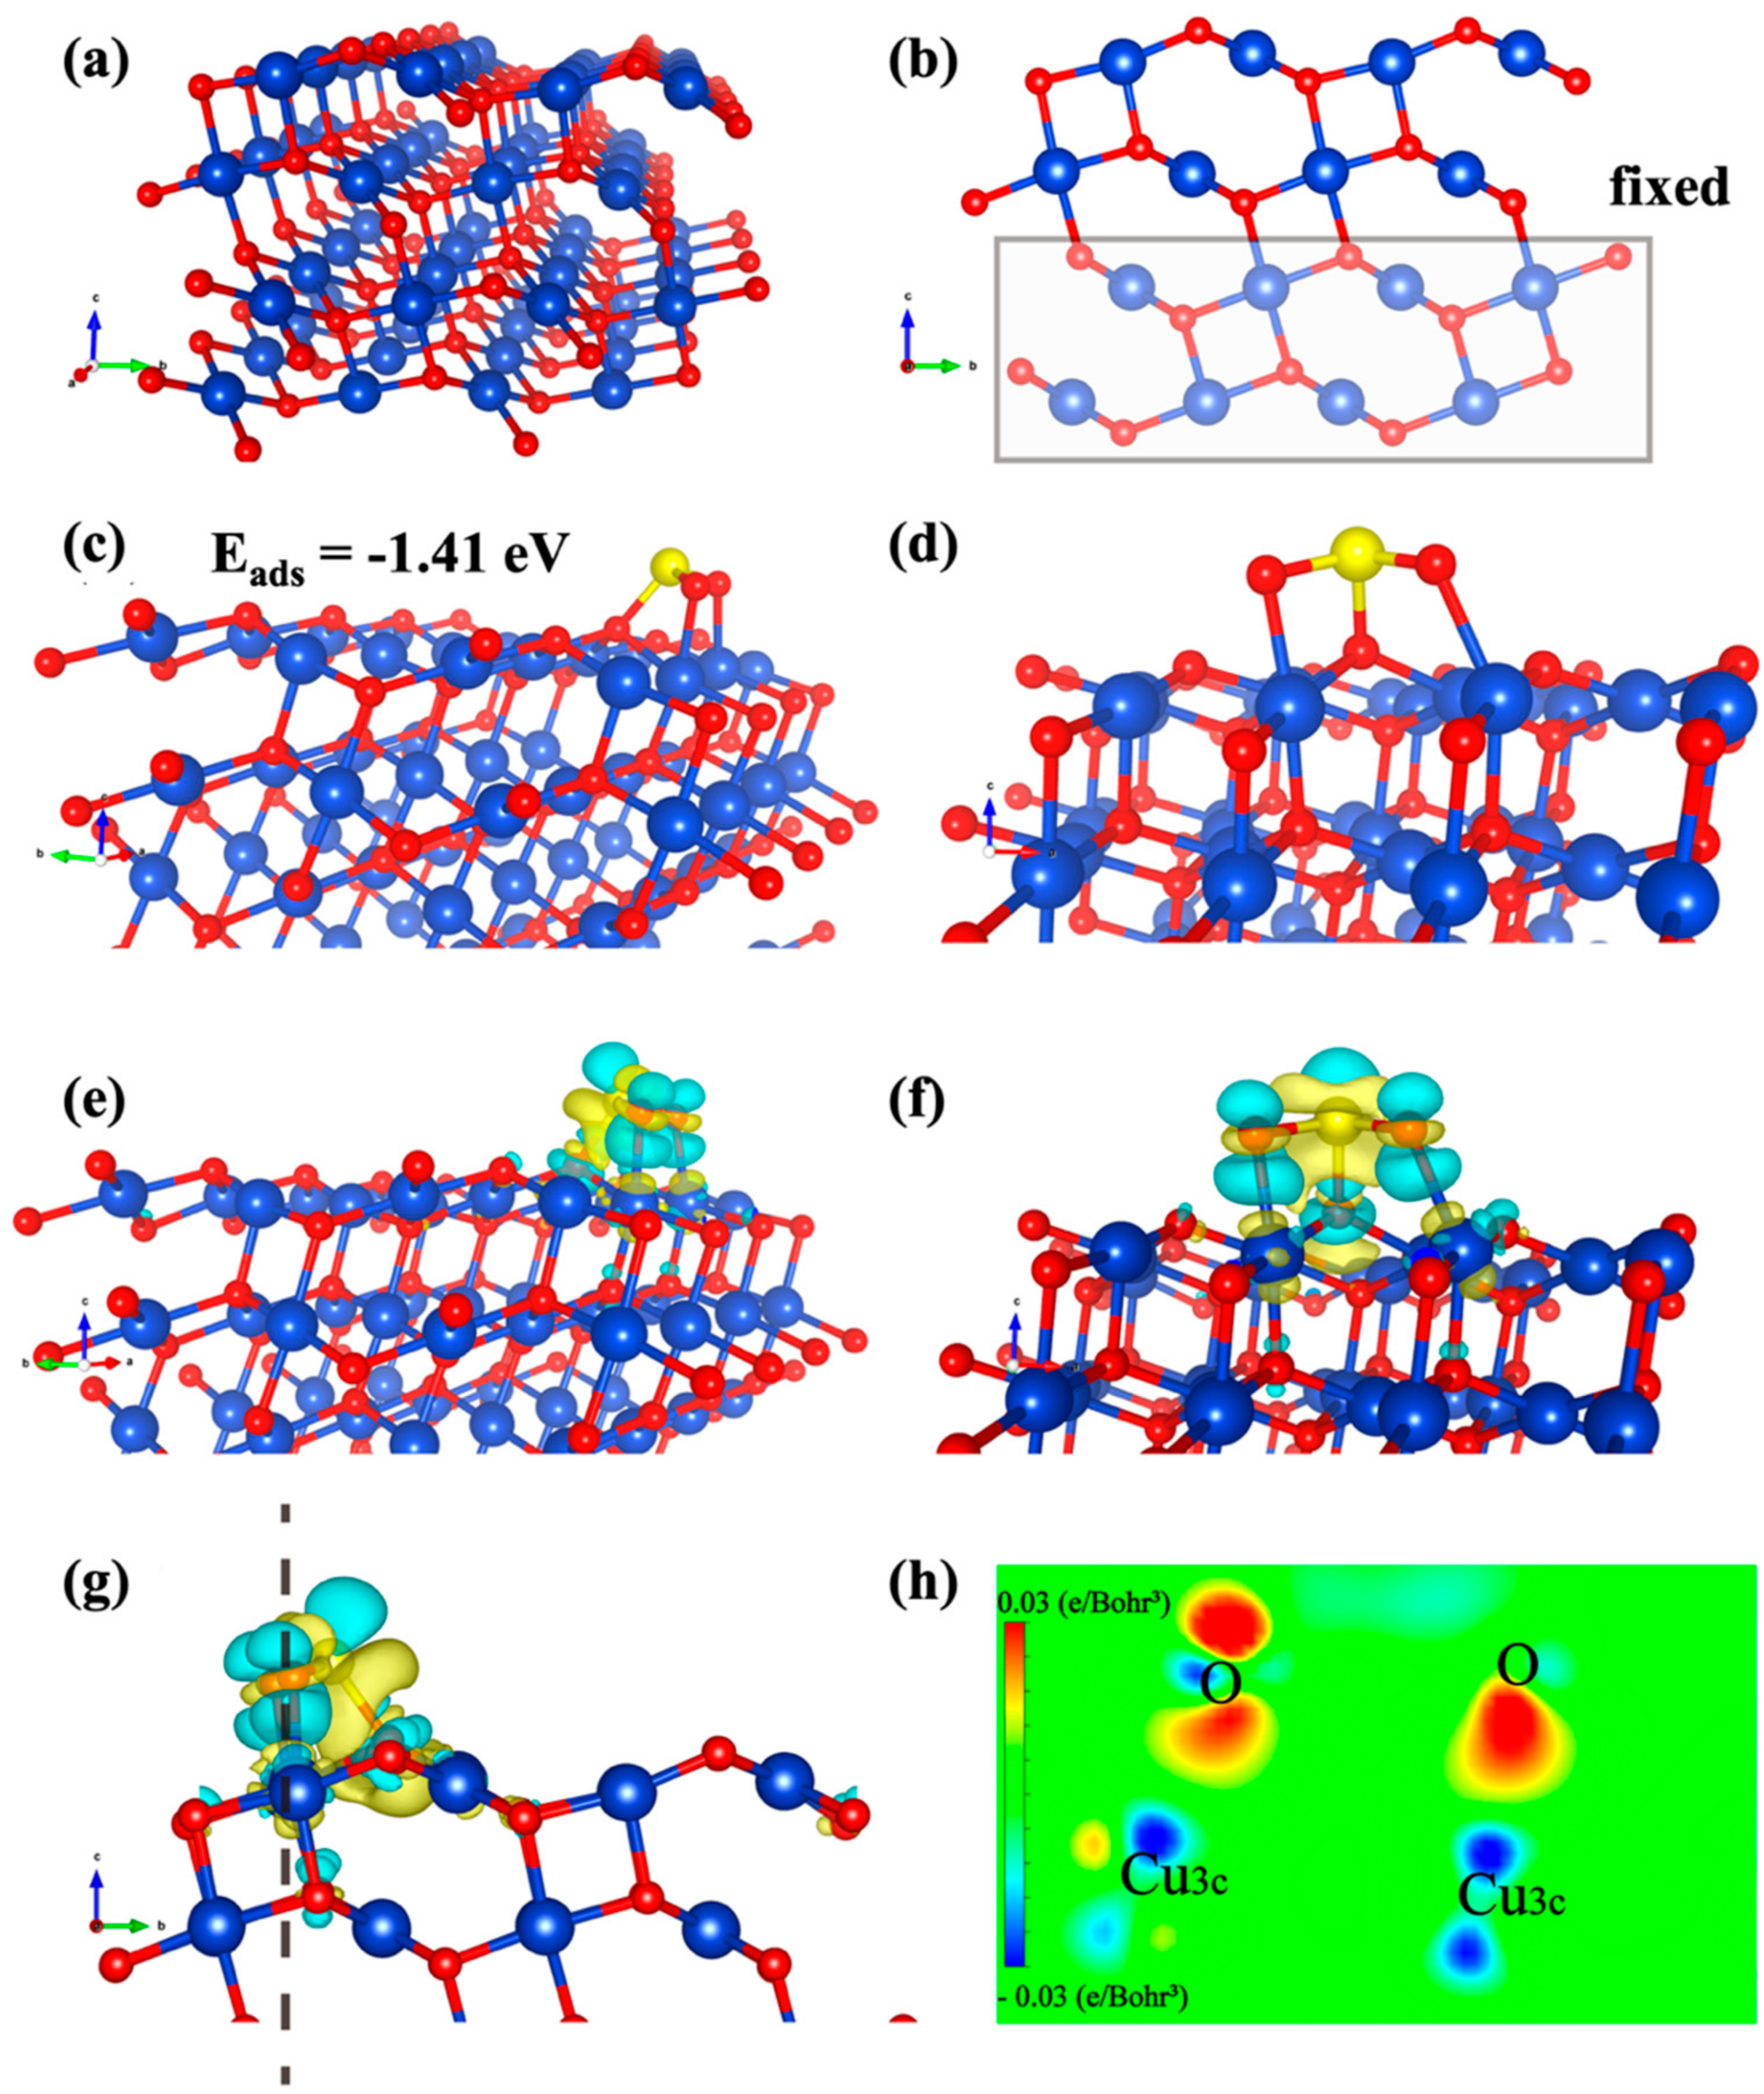
The most stable SO2 adsorption position was identified, and the calculated adsorption energy was −1.41 eV (Figure 4c). In Figure 4d, the S atom of SO2 molecule forms bonds with O3c atom on the surface with the bond length of 1.74 Å, while two O atoms form bonds with Cu3c atoms and the bond lengths are 1.96 and 2.09 Å. After SO2 chemical adsorption on the surface, the bond angle of SO2 molecules changed from 119.308° to 107.571°. The bond length of S−O bonds of SO2 molecule became 1.612 Å and 1.462 Å from two equal 1.448 Å, which increased compared with before adsorption.
The adsorption energy is −1.41 eV, indicating that the chemisorption between SO2 and CuO (111) is very stable [54,55]. Furthermore, the charge density difference (CDD) is beneficial to directly exhibit the charge accumulation and consumption of SO2 molecules after adsorption on the surface of CuO, which can reflect the adsorption strength according to the amount of charge transfer. In this paper, CDD is defined as the charge density of the SO2−CuO system after adsorption minus that of the CuO surfaces and the SO2 molecules (CDD = C (CuO−SO2) − C (CuO) − C (SO2)). Figure 4e–g demonstrates the distribution of the charge density.
As shown in Figure 4f, after the adsorption of SO2 molecules over the surface of CuO (111), there are more yellow zones around S atoms (Sm) of SO2 molecules, while there are more turquoise zones near the O atoms (OS) on the surface, indicating that charge is mainly transferred from SO2 molecules to the surface. More charge consumption zones existed around Cu atoms (CuS) on the surface of CuO, whereas more charge accumulation zones appeared near the O atoms (Om) of SO2 molecules. These results revealed that the CuS has transferred charge to the Om and OS, which were used to form the CuS−Om bond and OS−Sm bond, respectively. In addition, the electrons lost by CuS are used to bond with O atoms, which can also be clearly observed in the 2D sectional view (Figure 4h).
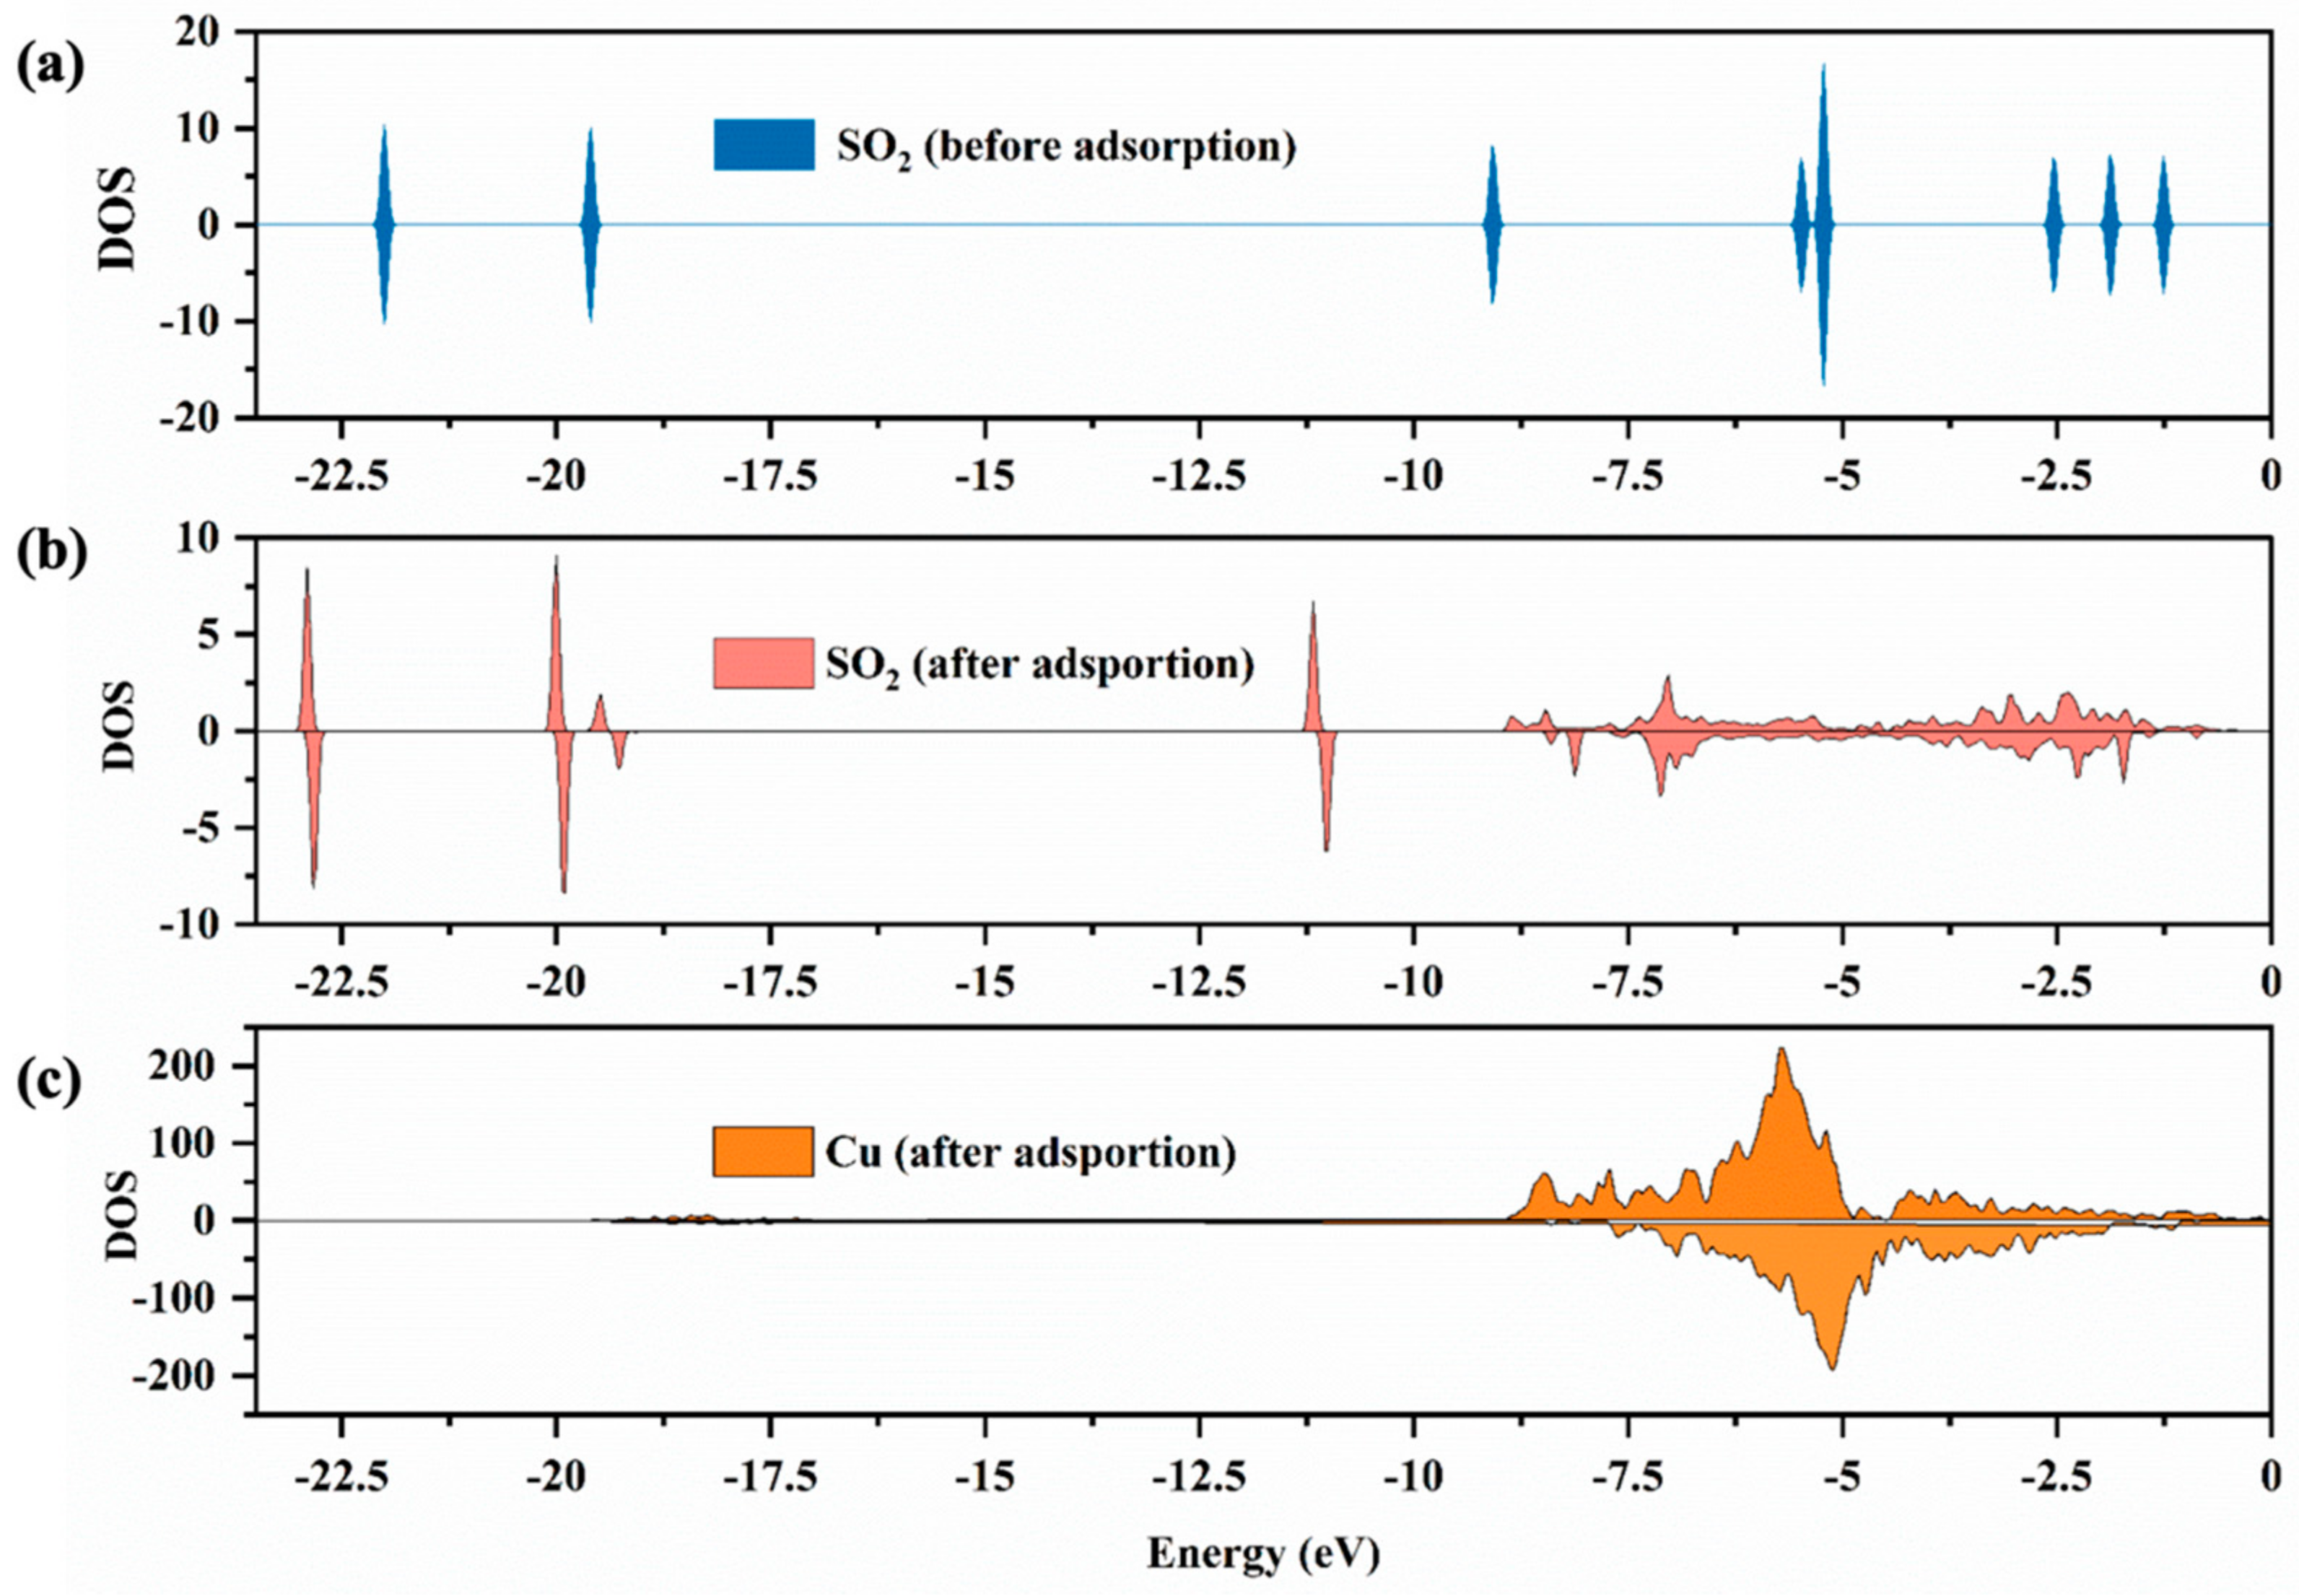
In addition to the change of adsorption structure, studying the properties of electrons by the analysis of the density of states (DOS) is also conducive to understanding the bonding mechanism of adsorption. Figure 5 shows the DOS of SO2 molecules before and after adsorption on the surfaces of CuO. The DOS of SO2 molecules before adsorption possesses the peaks with energy of −22, −19, −9, −6, −5, −2.5, −1.85 and −1.25 eV (Figure 5a), while those of SO2 after adsorption are shifted to the deep energy level.
The value of DOS peaks decreased, which could result from the transfer of charge between the SO2 molecule and surface. Notably, a new continuous density peak of SO2 molecules after adsorption was discovered at −9 to −1 eV (Figure 5b), which corresponded to the contiguous density peak of Cu atoms after adsorption (Figure 5c), indicating the existence of a strong interaction between SO2 molecules and Cu atoms on the surface.
In addition, Table 2 summarizes the results of the charge transfer between SO2 molecules and CuO surfaces in the reaction process, which are favorable to understanding the mechanism of the reaction. These results demonstrated that the CuS atoms lose a total of 0.0182 e, while the OS, Sm and Om atoms gained 0.047 e, 0.025 e and 0.137 e, respectively, indicating that the charges were mainly transferred from the CuS to the OS and SO2 molecules, which is consistent with the CCD analysis in the previous section.
2.2.3. Adsorption Configuration of SO2 Molecules on the Oxygen-Vacancy CuO (111)
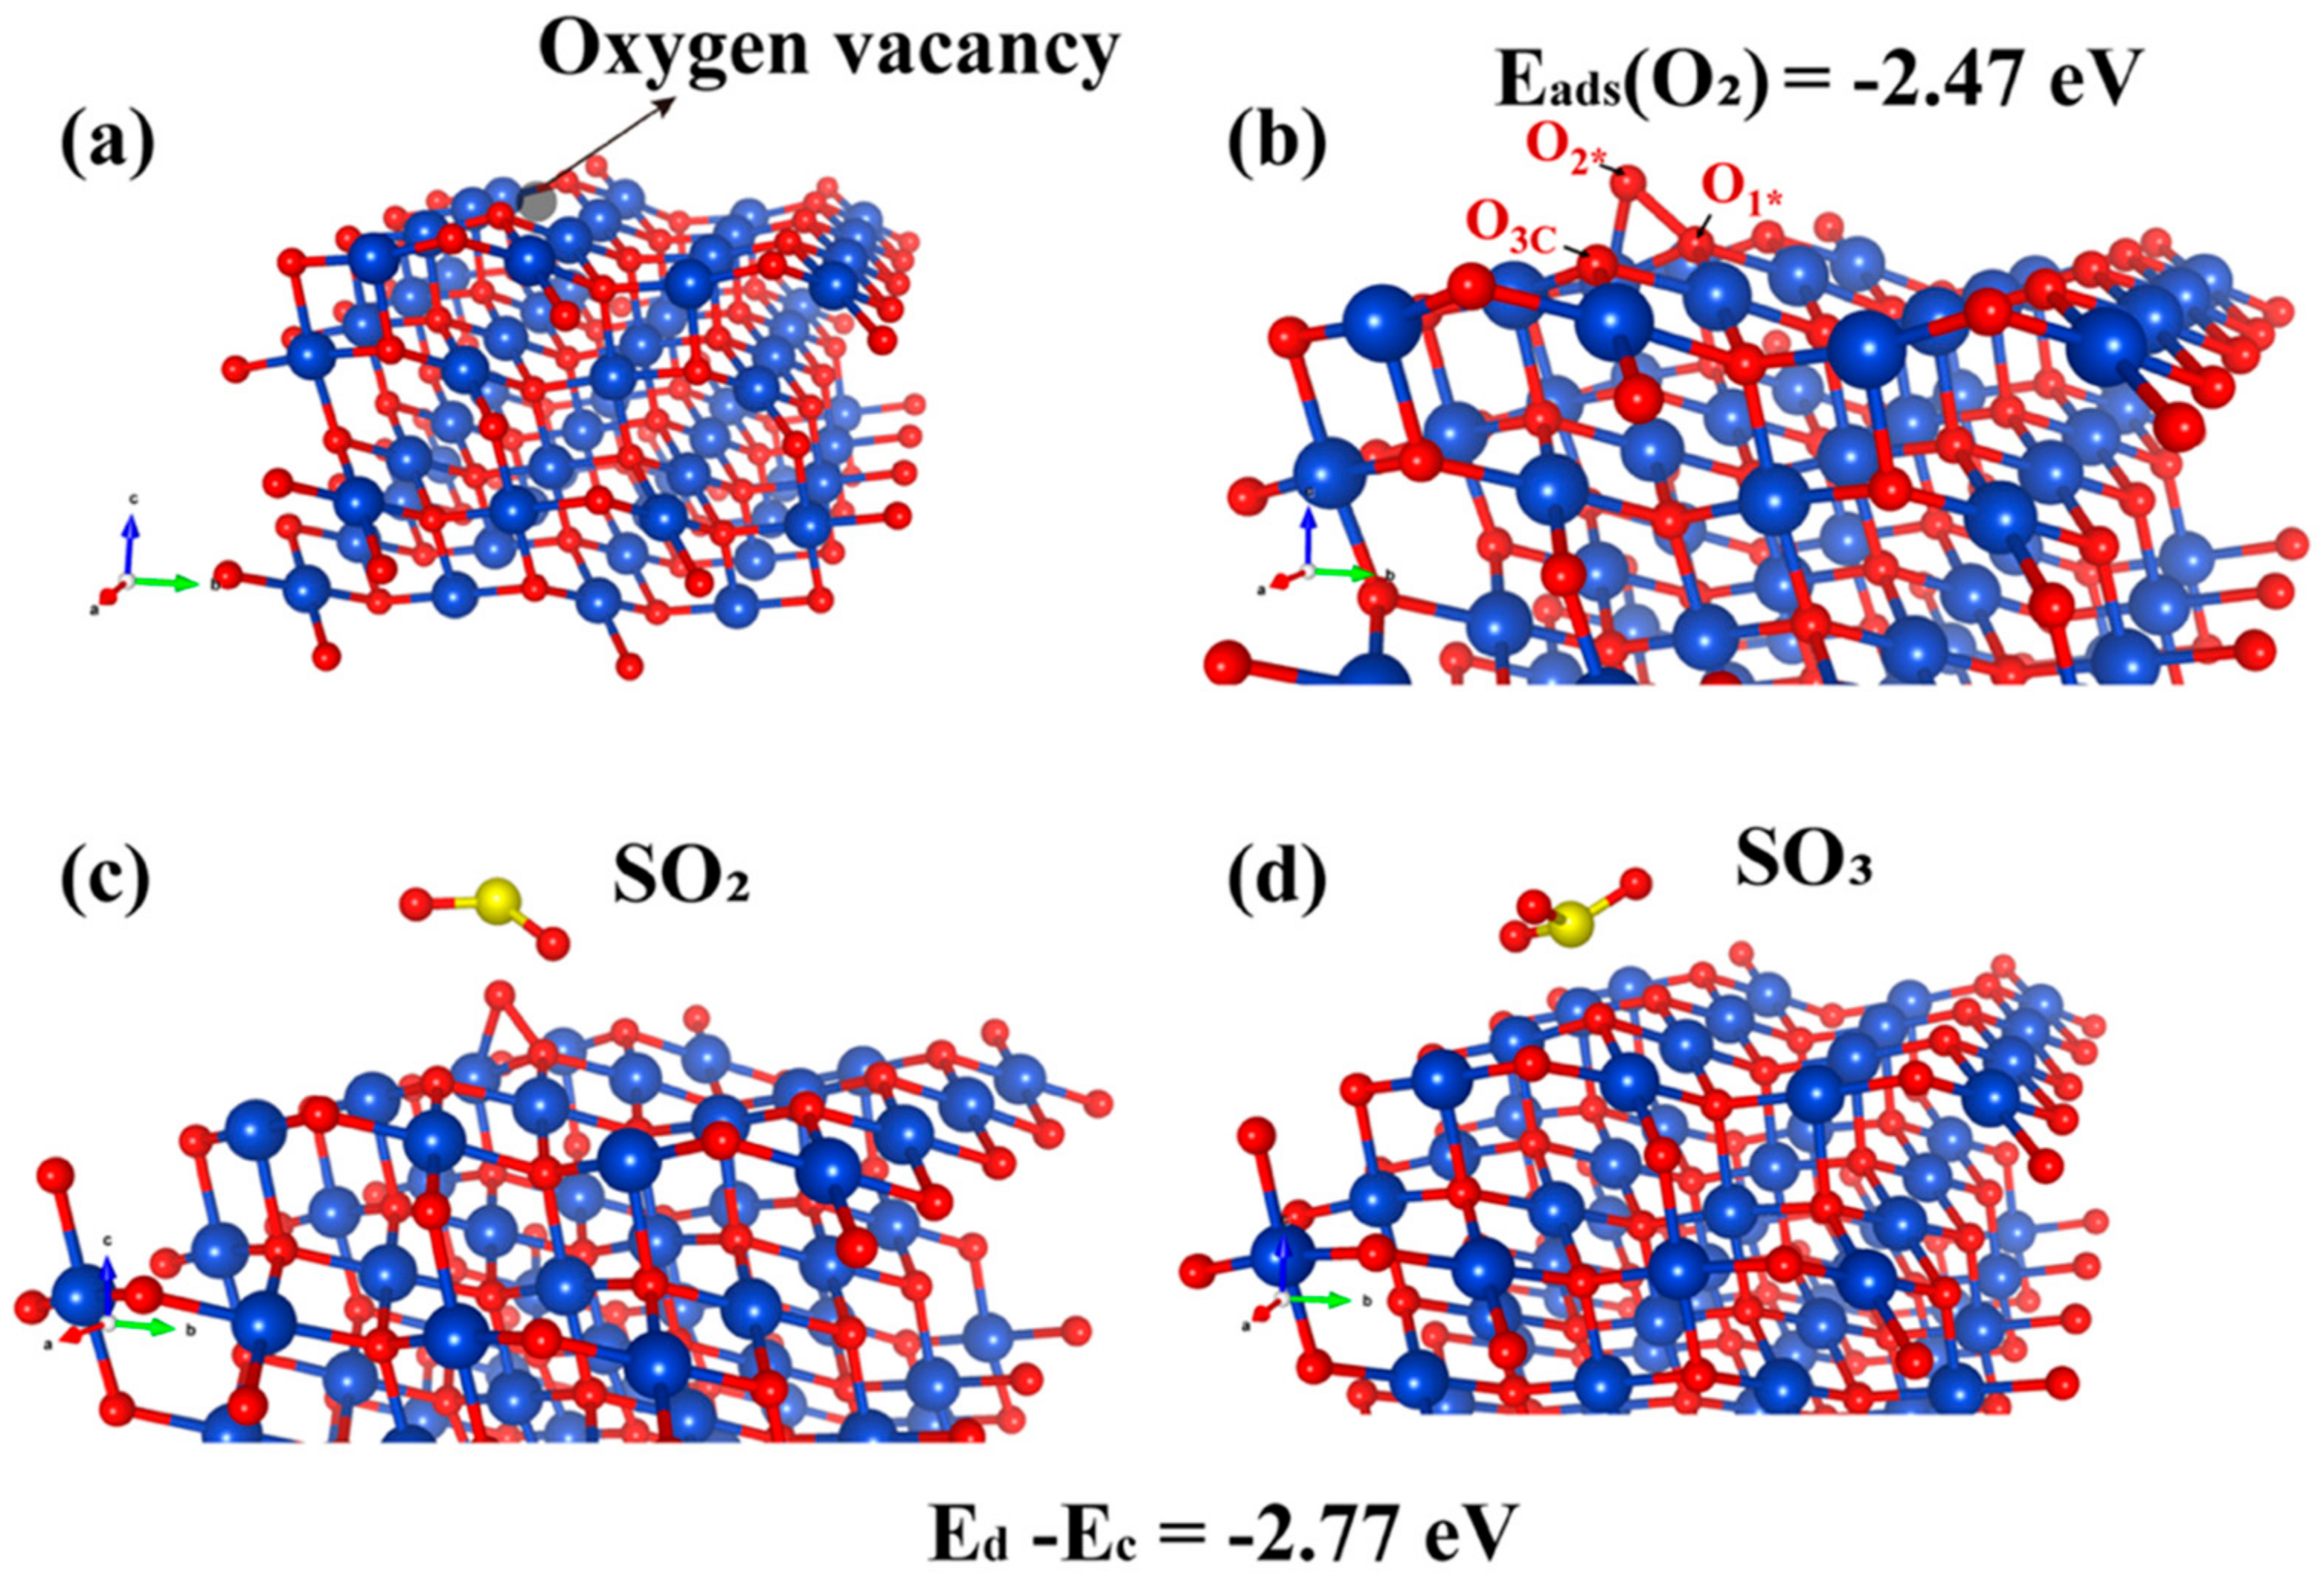
The DFT−calculated results regarding the adsorption configuration and electron-transfer mechanism on the perfect CuO (111) surface indicate that the CuS sites are the favorable active sites for SO2. Following the experimental evidence on the existence of oxygen vacancy, we further investigated the adsorption configurations on oxygen vacancy on the CuO (111) surface and their energetics by the DFT calculations to understand the role of the vacancy of atomic oxygen. Figure 6a shows the oxygen vacancy formed by removing the O3c.
According to the report of Rajendran et al., the O3c vacancy was preferably formed as compared to O4c [56]. Figure 6b illustrates the adsorption configuration of O2 on the CuO (111) surface containing the oxygen vacancy. The O1* atom in the O2 molecules after adsorption bound to one Cu3c and two Cu4c sites, with the distances of 1.976, 1.944 and 1.991 Å, respectively. The O1*−O2* bond elongated to 1.477 from 1.235 Å (free O2 molecules), which is also close to that of the O22− ion (1.490 Å). This result indicates that the O species adsorbed on the oxygen vacancy of CuO (111) surface mainly exist in the form of O22− ion, which is similar to the O2 on the oxygen-deficient Cu2O (111) surface [57].
In addition, the adsorption energy was −2.47 eV, which is higher than that of the O2 on a perfect CuO (111) surface, indicating that the intermediate O2, adsorbed on the oxygen vacancy of CuO (111) surface, is very stable. This intermediate for the adsorption of SO2 was further investigated, and the structures are illustrated in Figure 6c,d after the optimization. For understanding the reaction mechanism of SO2 removal, the adsorption energies of SO2 on the O2−adsorbed oxygen-vacancy CuO (111) surface (Ec) and the SO3 adsorbed on the perfect CuO (111) surface (Ed) were calculated, where the difference of value (Ed − Ec = −2.77 eV) exhibited that the stability of SO3 adsorption on the CuO (111) surface was superior to that of SO2. The O2* in intermediate stages (Figure 6b) is likely to be readily bonded to free SO2 molecules, followed by the cleavage of the O1*−O2* bond. Subsequently, the free SO3 molecules are adsorbed on the perfect CuO (111) surface and further form sulfates.
2.3. SO2 Removal Performance of Nano−CuOs
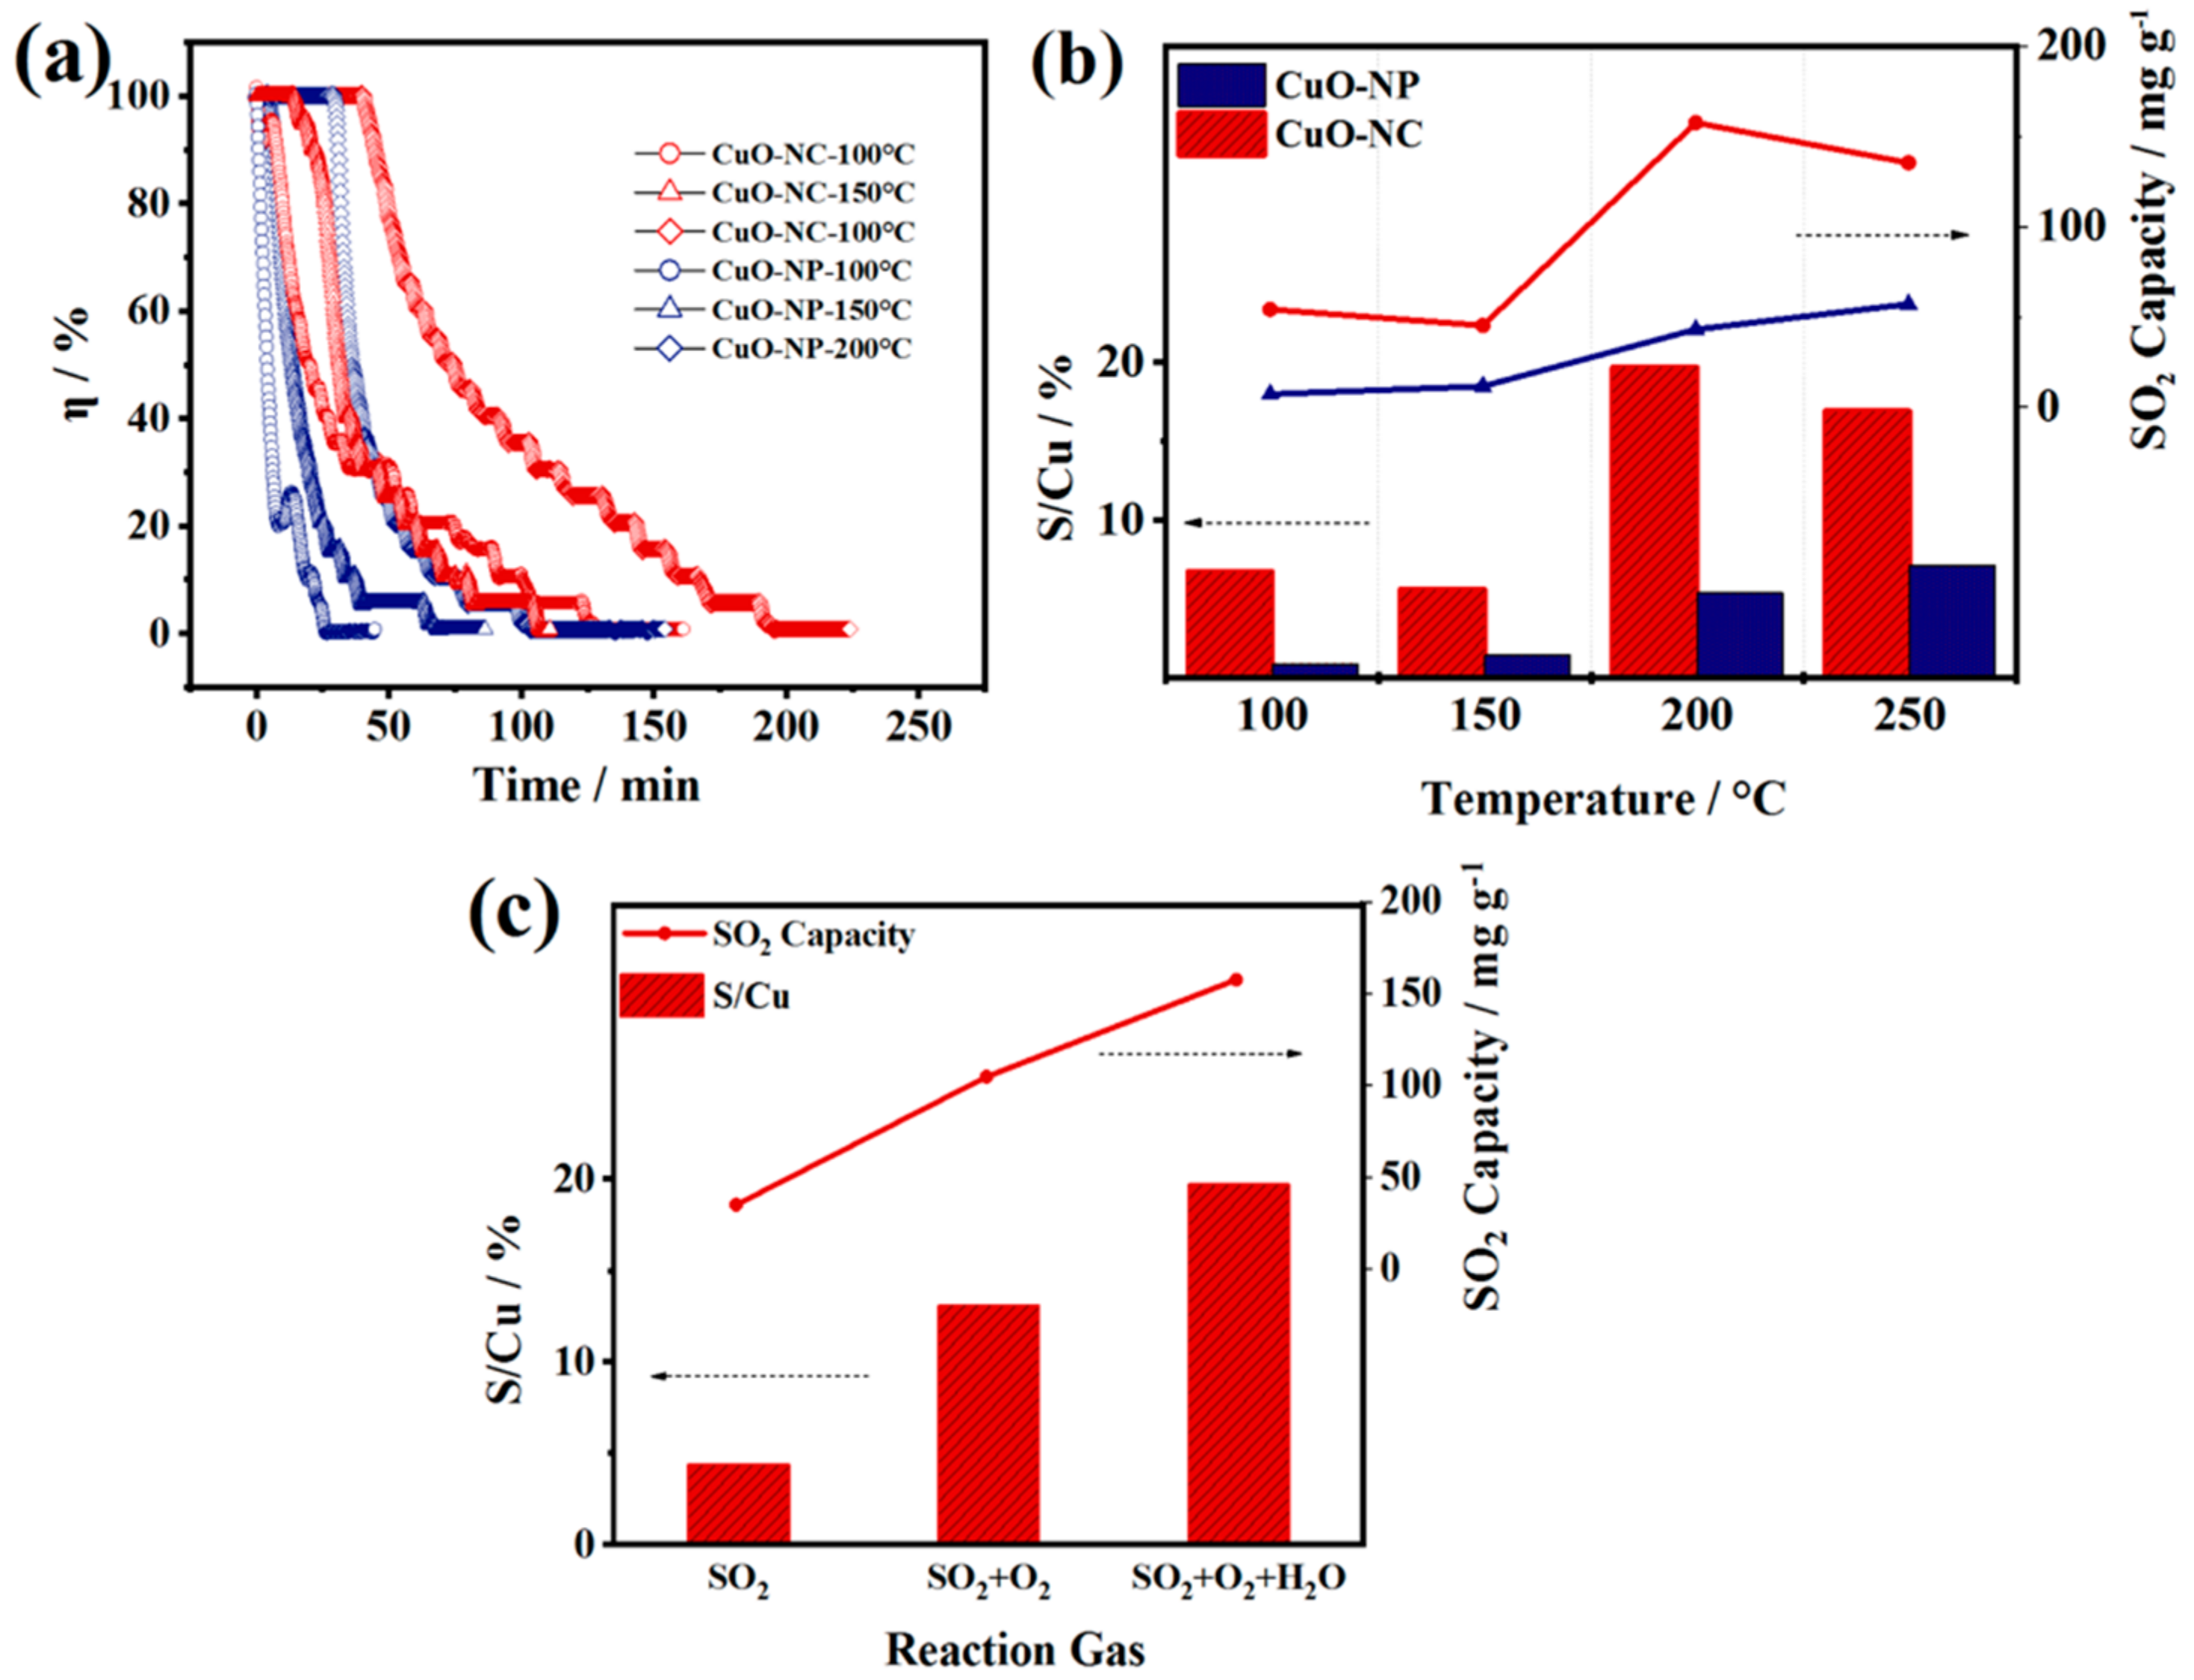
FGD tests were conducted in order to evaluate the SO2 removal performance of the two nano−CuOs and confirm the SO2 removal mechanism obtained by DFT calculations. The influence of operating temperatures on the desulfurization was investigated by exposing the CuO−NC and CuO−NP under a range of temperatures between 100 and 250 °C. As shown in Figure 7a, the SO2 removal efficiency of the two CuOs decreased over time, which was resulted from gradual inactivation of CuO sites by reacting with SO2. The S/Cu ratios and SO2 capacity of the two nano−CuOs shown in Figure 7b were calculated by integration of the measured decrease in SO2 concentrations of outlet (Figure 7a).
The CuO−NC demonstrated an excellent SO2 removal performance at the range of 100 to 250 °C compared to CuO−NP, which could be explained by different desulfurization mechanisms. At the low temperature of 100 °C, there was a wide margin between the S/Cu ratio of CuO−NC and that of CuO−NP, which could be ascribed to the larger specific surface area and pores volume of CuO produced by Cu3(BTC)2 (Figure 2), resulting in an enhanced physisorption at this temperature.
In contrast, with the increasing reaction temperature from 100 to 150 °C, a weakened physisorption appeared, while the chemical action of CuO sites with SO2 was almost absent, which led to a similarly low SO2 uptake capacity in both of two nano−CuOs. The differential of the SO2 uptake between two CuOs at 200 °C became more pronounced due to the prominent role of chemisorption, where the octahedral CuO−NC possessed larger S−uptakes, which may be related to the existence of Cu+. Hammershoi et al. reported that SO2 is bound more strongly to Cu+ than Cu2+ by DFT calculations [28].
The outstanding SO2 capacity could also be attributed to the support of carbon skeleton for Cu active sites in the hollow CuO−NC, which was beneficial in terms of both the SO2 reaction and diffusion. However, the S/Cu ratio of CuO−NC slightly decreased as the temperature further rose to 250 °C, which may be rationalized by the faster chemical reaction rate at higher temperatures. On the one hand, Cu+ was rapidly oxidized to Cu2+, which narrowed the differentials of SO2 removal performance, resulting from the chemical compositions, between the CuO−NC and CuO−NP. On the other hand, the CuO and SO2 converted to CuSO4 faster, which may cause the deactivation of desulfurizer due to the covering by rapidly formed sulfates [58].
Furthermore, a comparison of the desulfurization performance of CuO−NC at 200 °C in the presence and absence of O2 (6 vol.%) and H2O(g) (6 vol.%) is shown in Figure 7c. The results revealed that both of S/Cu and SO2 capacity significantly increased in the presence of O2, which can be explained by the oxidation of SO2 and the formation process of sulfates (SO2 + O2 → SO3; SO3 + CuO → CuSO4) [18,58]. This process reconfirmed the adsorption mechanism of SO2 molecules on the oxygen vacancy CuO (111) surface (Figure 6). In addition, based on the presence of O2, the addition of H2O(g) further facilitated the SO2 uptake, which contributed to the formation of sulfurous acid and reaction with CuO (SO2 + H2O → H2SO3; H2SO3 + CuO + O2 → CuSO4 + H2O).
The SO2 removal performance and test parameters of earlier reported CuO−based composites desulfurizers from literature were summarized in Table 3. In contrast, the best-performed sample CuO−NC of this work showed a smaller surface area but a larger removal capacity (157.63 mg g−1), which can be attributed to the more effective interaction between the exposed Cu sites and SO2.
3. Materials and Methods
3.1. Experimental Section
3.1.1. Materials
Copper nitrate trihydrate (Cu(NO3)2·3H2O), sodium hydroxide (NaOH) and methanol (CH3OH) were purchased from Sinopharm Chemical Reagent Co., Ltd. (Shanghai, China). 1,3,5−benzenetricarboxylic acid (BTC) was purchased from J&K Scientific Co., Ltd. (Beijing, China). All of chemical reagents and solvents in this work were analytical grades without further purification.
3.1.2. Synthesis of Nano−CuOs
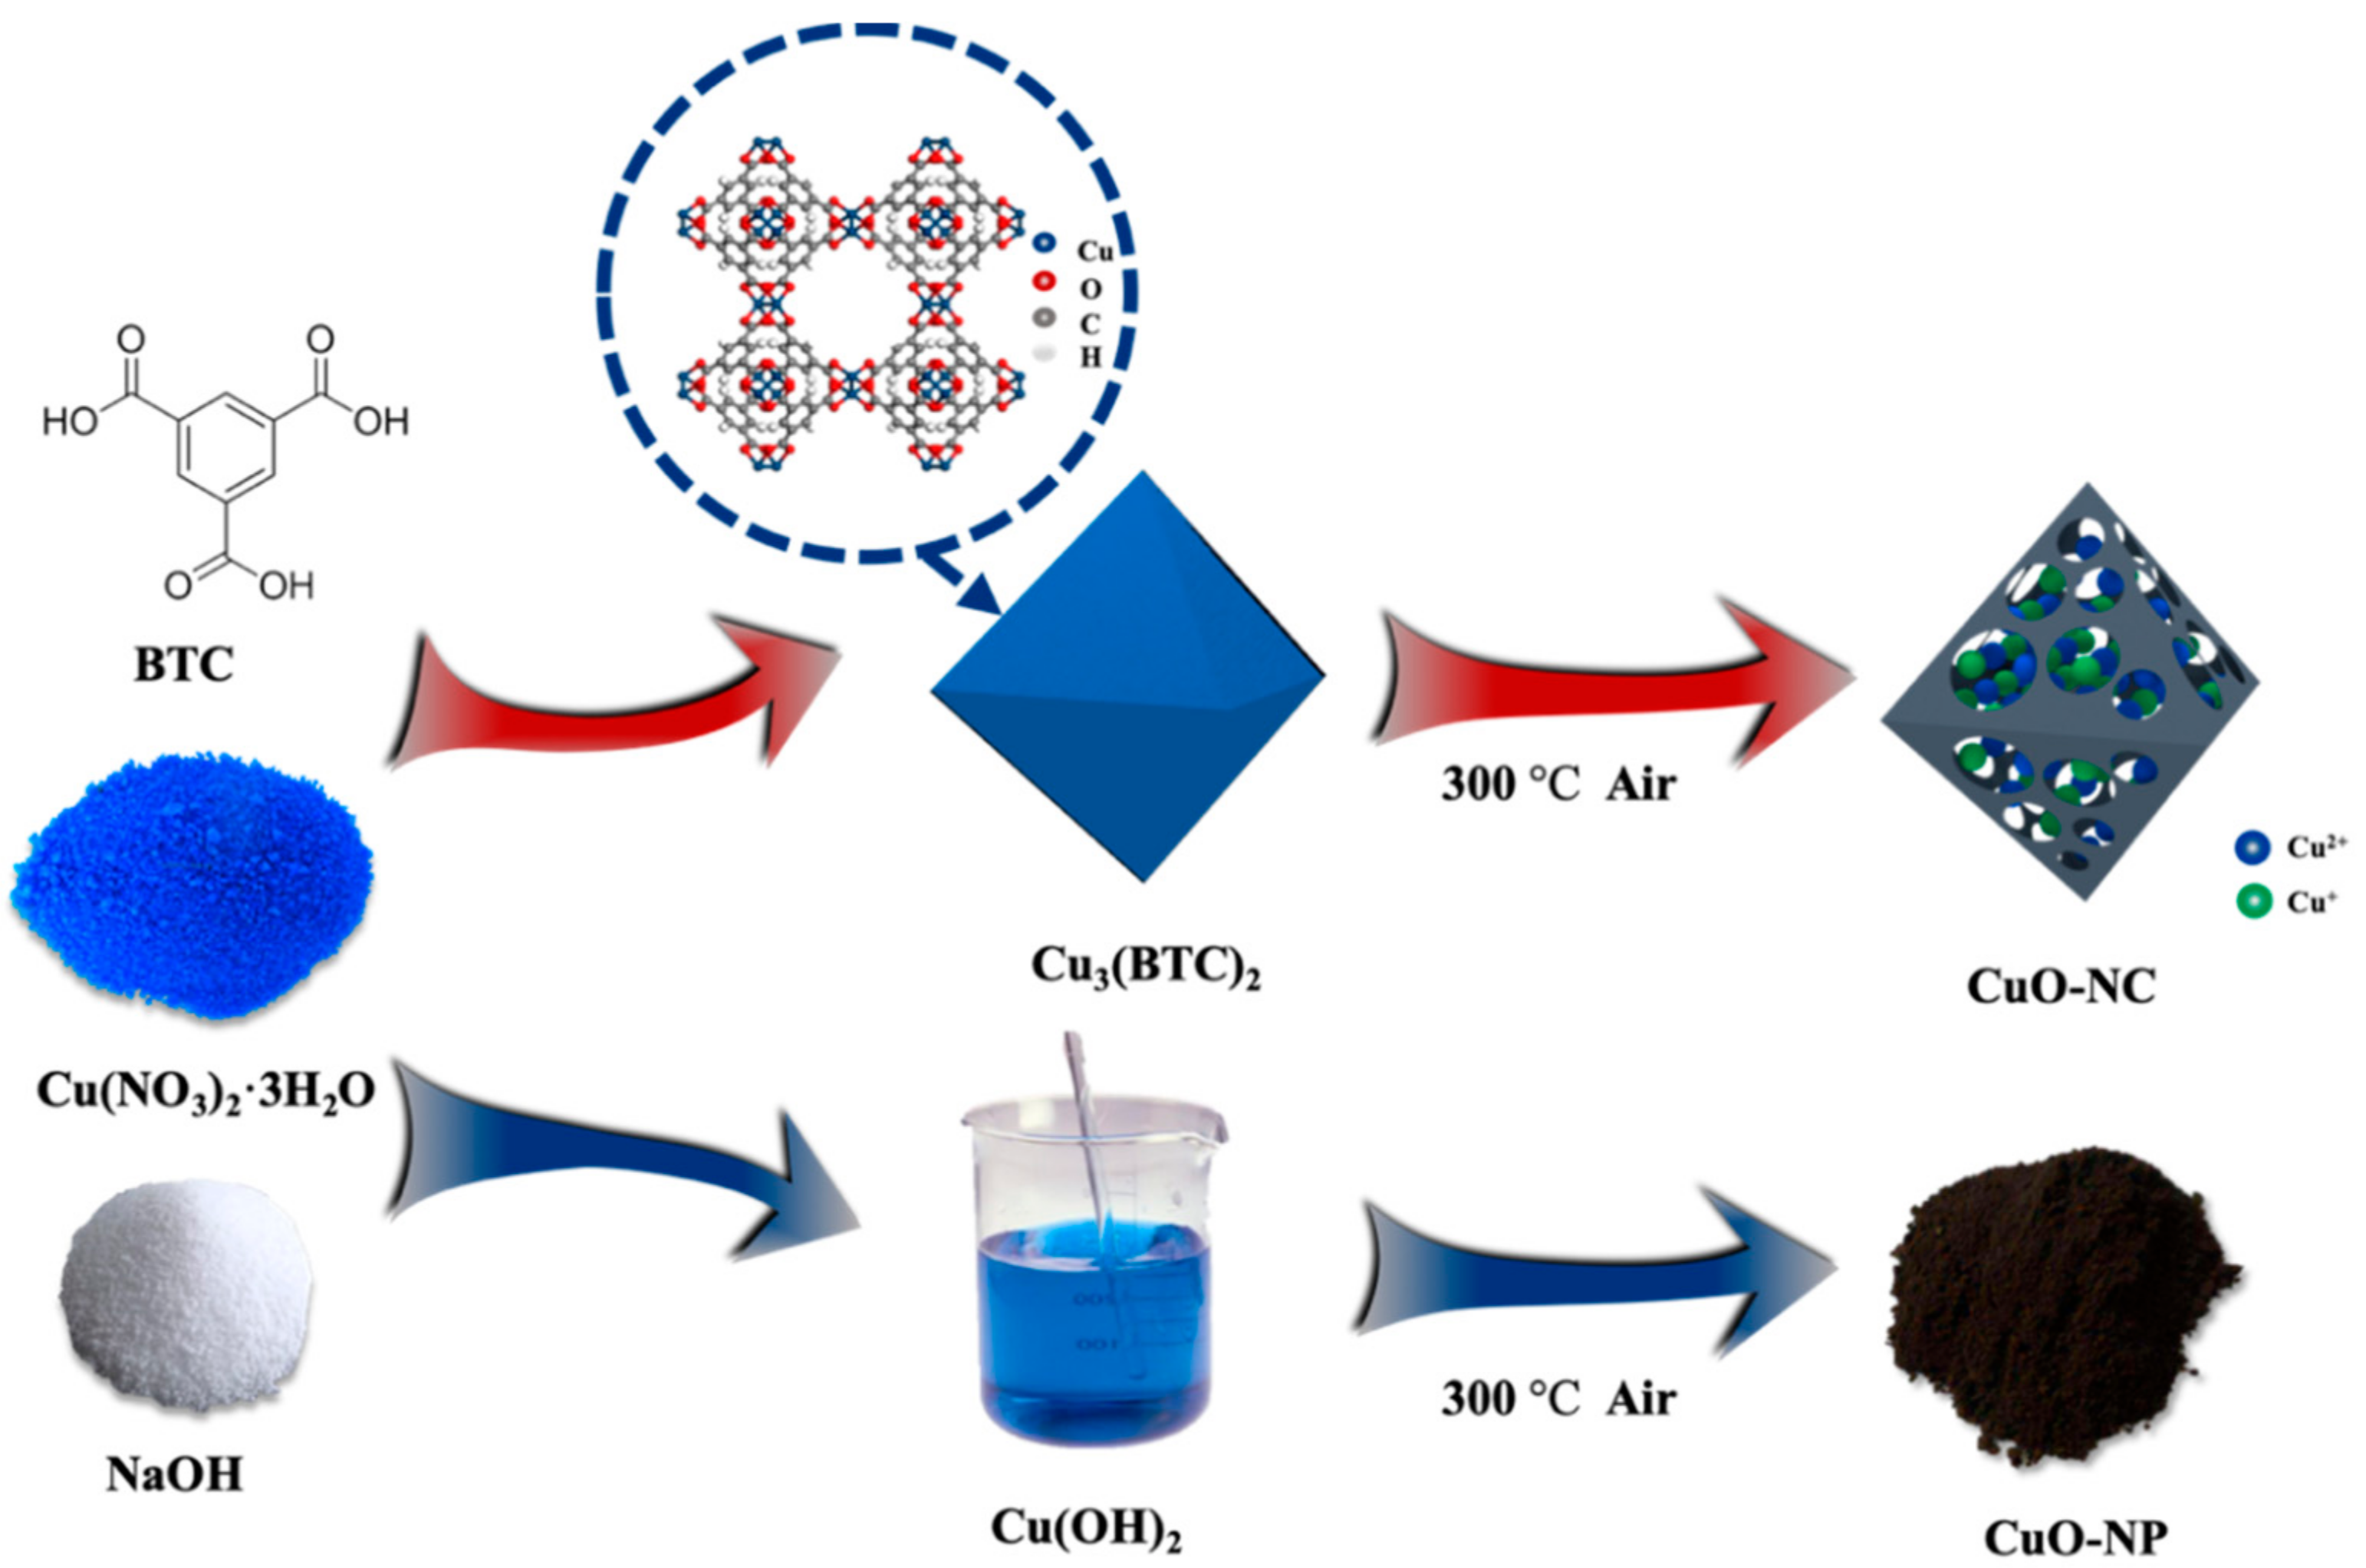
Figure 8 demonstrates the synthesis process of nano−CuOs. A synthetic route with high yield was adopted to fabricate octahedral Cu3(BTC)2 [39]. First, Cu(NO3)2·3H2O and BTC with the mole ratio of 3:2 were separately dissolved in 25 mL methanol and then fully stirred for 10 min. The obtained solution was placed still at room temperature for 150 min after ultrasonication for 20 min. Then, the products were washed repeatedly with methanol and put inside the oven at 80 °C for 12 h, followed by marking as Cu3(BTC)2. Finally, the CuO nanocomposites were obtained by the pyrolysis of as-prepared Cu3(BTC)2 under an air atmosphere at 300 °C for 120 min and then named as “CuO−NC”.
In addition, the prepared CuO nanoparticles, as comparative samples, were synthesized by the coprecipitation method. 2.45 g of Cu(NO3)2∙3H2O and 4.30 g of NaOH were dissolved in 50 mL of methanol. The black products were collected by centrifugation as well as repetitive washing with methanol and then was dried in the oven at 80 °C for 12 h. Then, the resulting sample was calcined at the same thermal treatment conditions with that of CuO−NC, which was labelled as “CuO−NP”.
3.1.3. Characterization
The Cu3(BTC)2 precursors and nano−CuOs were characterized by several analytical methods, such as scanning electron microscope (SEM), transmission electron microscope (TEM), powder X−ray diffractometer (XRD), thermogravimetric analyzer (TG−DTA), X−ray photoelectron spectrometer (XPS), Brunauer−Emmett−Teller (BET), Electron paramagnetic resonance (EPR). The crystal structure and phase were determined by XRD (X−Pert3 Powder, PANalytical, Almelo, The Netherlands). The surface morphology of CuO nanocomposites was observed by SEM (S4800, Hitach, Tokyo, Japan) and TEM (Tecnai F20, FEI, Hillsboro, OR, USA). TG (Q600SDT, TA, New Castle, DE, USA) measurement was conducted in air flow with a heating rate of 10 °C·min−1.
The specific surface area was analyzed by the BET equation, which was measured by an accelerated surface area and porosity system (ASPS 2020 plus, Micromeritics, Norcross, GA, USA). The size distribution and volume of microporous and mesoporous were calculated by the t−plot method and the BJH (Barrett−Joyner−Halenda) method, respectively, and the total pore volume was given by adsorption amount at a relative pressure of P/P0 = 0.99. The surface chemical composition of CuO nanocomposites was analyzed by XPS (ASIX Supra, Kratos Analytical, Manchester, UK). The oxidation states of metal oxide were investigated at room temperature by EPR (A200, Bruker, Billerica, MA, USA) using the X−band.
The chemical bonds of the CuO nanocomposites were examined by a laser confocal Raman spectrometer (JY−T64000, Jobin−Yvon, Longjumeau, France).
3.1.4. FDG Activity Test
Figure S3 shows a flow chart of the FGD simulated instrument. In a typical FGD test, the CuO nanocomposites were loaded into a quartz tube (6 mm i.d.), where all of samples were weighted with the equal amount (0.15 ± 0.01 g). Subsequently, the quartz tube loading with sample was dried in the oven at 80 °C for 12 h, followed by installing into the FGD simulated instrument and purging with N2 (120 mL min−1) for 30 min.
Finally, the reaction gases with a total flow rate of 120 mL min−1 (2000 ppm SO2, 6 vol.% O2 and 6 vol.% H2O (g), N2 as balance gas) were introduced after the temperature was up to setpoint at a ramping rate of 5 °C min−1, where the gas hourly space velocity (GHSV) was set to 16,900 h−1. Moreover, the inlet content of SO2 was measured by the mass flow meters, while the data of outlet SO2 were collected by a flue gas analyser (Pro350, Testo, Titisee-Neustadt, Germany).
The items of SO2 removal capacity (, mg g−1) and the ratio of S to Cu (S/Cu) were used to evaluate desulfurization performance of samples where the of samples was calculated by the data that were correspondence with the duration before the SO2 removal efficiency drops to the threshold of 50%. The expressions of the SO2 removal efficiency (η, %) and capacity were given by the following equations
where Cin and Cout correspond to the inlet and outlet concentrations of SO2 (ppm), respectively; F stands for the total flow of simulated flue gas (mL min−1); Mr represents the relative molecular mass of SO2 (g mol−1); m and Vm are the standard the sample mass (g) and molar volume (L mol−1) at setpoint conditions, respectively.
3.2. Models and Computational Details
3.2.1. Computational Method
All of the spin-polarized density functional theory (DFT) calculations were conducted using the Vienna Ab−Initio Simulation Package1–3 [60,61] (Version 5.4.4). The ion-electron interaction of Cu, O and S in the periodic boundary condition was performed by the standard VASP projector augmented-wave [62] (PAW) potentials. The valence electron configuration of Cu, O and S in the calculation corresponded to 3d104s1, 2s22p4 and 3s23p4, respectively. In this work, the Perdew–Burke–Ernzerhof [63] (PBE) exchange-correlation functional was selected as the generalized gradient approximation for the exchange-correlation functional.
The DFT−D3 method proposed by Grimme [64] was used for van der Waals force corrections, which consisted in adding a pair wise potential to the DFT total energy after each self-consistent cycle. Based on the on-site Coulombic repulsion between the d electrons, the Hubbard U corrections were performed to transition metal d-electrons and the values of U-J parameters for Cu atoms (7 eV). Through benchmark calculations, the plane-wave basis kinetic-energy cut-off adopted was 450 eV, and its corresponding Brillouin zone was sampled by a Monkhorst–Pack [65] k-point grid of 1 × 1 × 1. The self-consistent calculation converged to 10−5 eV and executed structural optimization by minimizing the forces on all the atoms until they were less than 0.01 eV Å−1.
3.2.2. Adsorption Energy
The expression of adsorption energy () can be given as
where , and represent the total energy of adsorbate-substrate system, the total energy of bare surface and the total energy of gas-phase adsorbates, respectively. In particular, a negative value refers to an exothermic binding, which means a more stable state for the adsorbed species on the CuO (111) surface.
4. Conclusions
In conclusion, this work systematically investigated the mechanisms of SO2 removal over as-synthesized CuO nanocomposite surfaces using experimental and theoretical methods. Octahedral CuO nanocomposites with a carbon frame were fabricated by the pyrolysis of Cu3(BTC)2 at 300 °C under an air atmosphere. The as-synthesized composites possessed a hollow structure and high surface area (89.837 m2 g−1) as well as multivalent copper oxides due to the presence of an MOF−derived carbon octahedra frame.
In addition, the effects of the synthetic method, reaction temperature and atmosphere on the SO2 adsorption over CuO nanocomposites were investigated by experiments, where the CuO nanocomposites exhibited a superior SO2 removal performance compared with the CuO nanoparticles produced by coprecipitation. Moreover, the charge transfer and density of state of the CuO (111) surface and SO2 gas molecules before and after adsorption were studied based on the experimental results and DFT calculations.
On the perfect CuO (111) surface, the most stable SO2 adsorption configuration was obtained over the CuO surface by the electron transfer mechanism between Cu atoms on the surface and SO2 molecules. On the oxygen-deficient CuO (111) surface, O2 molecules were adsorbed on the oxygen vacancy sites and bonded with free SO2 molecules to form SO3. Based on the above results, this work provides a novel strategy to produce highly effective CuO nanocomposites as catalysts by MOFs for desulfurization and to further validate the mechanisms of SO2 chemisorption with the DFT calculations.
Supplementary Materials
The following supporting information can be downloaded at: https://www.mdpi.com/article/10.3390/catal12070689/s1, Figure S1: SEM image of Cu3(BTC)2 precursors; Figure S2: SEM image of CuO−NC; Figure S3: A schematic flow chart of dynamic adsorption desulfurization system; Table S1: Porosity characteristics of nano−CuOs.
Author Contributions
Conceptualization, R.D. and X.W.; methodology, W.C. and X.W.; validation, W.C.; investigation, Z.C. and B.H.; data curation, R.D., Z.C. and J.G.; writing—original draft preparation, R.D.; writing—review and editing, R.D.; visualization, R.D. and Z.D.; supervision, L.L.; funding acquisition, X.W. All authors have read and agreed to the published version of the manuscript.
Funding
This research was funded by the National Natural Science Foundation of China (51472006, 51672006), the National Key Research and Development Plan (2018YFC1901505 and 2018YFC1901503) and the Ministry of Land and Resources Public Welfare Industry Research Project (201511062−02).
Data Availability Statement
Not applicable.
Conflicts of Interest
The authors declare no conflict of interest.
References
- Adil, K.; Bhatt, P.M.; Belmabkhout, Y.; Abtab, S.M.T.; Jiang, H.; Assen, A.H.; Mallick, A.; Cadiau, A.; Aqil, J.; Eddaoudi, M. Valuing metal-organic frameworks for postcombustion carbon capture: A benchmark study for evaluating physical adsorbents. Adv. Mater. 2017, 29, 1702953. [Google Scholar] [CrossRef]
- Thriel, C.V.; Schaper, M.; Kleinbeck, S.; Kiesswetter, E.; Blaszkewicz, M.; Golka, K.; Nies, E.; Raulf-Heimsoth, M.; Brüning, T. Sensory and pulmonary effects of acute exposure to sulfur dioxide (SO2). Toxicol. Lett. 2010, 196, 42–50. [Google Scholar] [CrossRef] [PubMed]
- Cordoba, P. Status of flue gas desulphurisation (FGD) systems from coal-fired power plants: Overview of the physic-chemical control processes of wet limestone FGDs. Fuel 2015, 144, 274–286. [Google Scholar] [CrossRef]
- Bueno-Lopez, A.; Garcia-Martinez, J.; Garcia-Garcia, A.; Linares-Solano, A. Regenerable CaO sorbents for SO2 retention: Carbonaceous versus inorganic dispersants. Fuel 2002, 81, 2435–2438. [Google Scholar] [CrossRef]
- Tchalala, M.R.; Bhatt, P.M.; Chappanda, K.N.; Tavares, S.R.; Adil, K.; Belmabkhout, Y.; Shkurenko, A.; Cadiau, A.; Heymans, N.; De Weireld, G.; et al. Fluorinated MOF platform for selective removal and sensing of SO2 from flue gas and air. Nat. Commun. 2019, 10, 1328. [Google Scholar] [CrossRef] [Green Version]
- Srivastava, R.K.; Jozewicz, W. Flue gas desulfurization: The state of the art. J. Air Waste Manag. Assoc. 2001, 51, 1676–1688. [Google Scholar] [CrossRef]
- Ma, J.; Liu, Z.; Liu, Q.; Guo, S.; Huang, Z.; Xiao, Y. SO2 and NO removal from flue gas over V2O5/AC at lower temperatures—Role of V2O5 on SO2 removal. Fuel Processing Technol. 2008, 89, 242–248. [Google Scholar] [CrossRef]
- Xiao, Y.; Liu, Q.Y.; Liu, Z.Y.; Huang, Z.G.; Guo, Y.X.; Yang, J.L. Roles of lattice oxygen in V2O5 and activated coke in SO2 removal over coke-supported V2O5 catalysts. Appl. Catal. B Environ. 2008, 82, 114–119. [Google Scholar] [CrossRef]
- Yi, H.; Yang, K.; Tang, X.; Liu, X.; Zhao, S.; Gao, F.; Huang, Y.; Yang, Z.; Wang, J.; Shi, Y. Effects of preparation conditions on the performance of simultaneous desulfurization and denitrification over SiO2-MnOx composites. J. Clean. Prod. 2018, 189, 627–634. [Google Scholar] [CrossRef]
- Ye, D.; Ren, X.; Qu, R.; Liu, S.; Zheng, C.; Gao, X. Designing SO2-resistant cerium-based catalyst by modifying with Fe2O3 for the selective catalytic reduction of NO with NH3. Mol. Catal. 2019, 462, 10–18. [Google Scholar] [CrossRef]
- Xie, G.Y.; Liu, Z.Y.; Zhu, Z.P.; Liu, Q.Y.; Ge, J.; Huang, Z.G. Simultaneous removal of SO2 and NOx from flue gas using a CuO/Al2O3 catalyst sorbent I. Deactivation of SCR activity by SO2 at low temperatures. J. Catal. 2004, 224, 36–41. [Google Scholar] [CrossRef]
- Kikuyama, S.; Miura, A.; Kikuchi, R.; Takeguchi, T.; Eguchi, K. SOx sorption-desorption characteristics by ZrO2-based mixed oxides. Appl. Catal. A-Gen. 2004, 259, 191–197. [Google Scholar] [CrossRef]
- Shafiq, I.; Hussain, M.; Shafique, S.; Akhter, P.; Ahmed, A.; Ashraf, R.S.; Ali Khan, M.; Jeon, B.-H.; Park, Y.-K. Systematic Assessment of Visible-Light-Driven Microspherical V2O5 Photocatalyst for the Removal of Hazardous Organosulfur Compounds from Diesel. Nanomaterials 2021, 11, 2908. [Google Scholar] [CrossRef] [PubMed]
- Gaur, V.; Sharma, A.; Verma, N. Removal of SO2 by activated carbon fibre impregnated with transition metals. Can. J. Chem. Eng. 2007, 85, 188–198. [Google Scholar] [CrossRef]
- Uysal, B.Z.; Aksahin, I.; Yucel, H. Sorption of sulfur dioxide on metal oxides in a fluidized bed. Ind. Eng. Chem. Res. 2002, 27, 434–439. [Google Scholar] [CrossRef]
- Sun, L.; Ning, P.; Zhao, X.; Song, X.; Li, K.; Wang, C.; Sun, X.; Jia, L. Competitive adsorption and reaction mechanism on simultaneous catalytic removal of SO2, NO and Hg-0 over CuO: Experimental and theoretical studies. Chem. Eng. J. 2021, 412, 128752. [Google Scholar] [CrossRef]
- Carabineiro, S.A.C.; Ramos, A.M.; Vital, J.; Loureiro, J.M.; Orfao, J.J.M.; Fonseca, I.M. Adsorption of SO2 using vanadium and vanadium-copper supported on activated carbon. Catal. Today 2003, 78, 203–210. [Google Scholar] [CrossRef]
- Yuan, J.; Jiang, X.; Zou, M.J.; Yao, L.; Zhang, C.J.; Jiang, W.J. Copper ore-modified activated coke: Highly efficient and regenerable catalysts for the removal of SO2. Ind. Eng. Chem. Res. 2018, 57, 15731–15739. [Google Scholar] [CrossRef]
- Tseng, H.H.; Wey, M.Y.; Fu, C.H. Carbon materials as catalyst supports for SO2 oxidation: Catalytic activity of CuO-AC. Carbon 2003, 41, 139–149. [Google Scholar] [CrossRef]
- Tseng, H.H.; Wey, M.Y. Effects of acid treatments of activated carbon on its physiochemical structure as a support for copper oxide in DeSO2 reaction catalysts. Chemosphere 2006, 62, 756–766. [Google Scholar] [CrossRef]
- Bai, B.C.; Lee, C.W.; Lee, Y.S.; Im, J.S. Modification of textural properties of CuO-supported activated carbon fibers for SO2 adsorption based on electrical investigation. Mater. Chem. Phys. 2017, 200, 361–367. [Google Scholar] [CrossRef]
- Mochida, I.; Korai, Y.; Shirahama, M.; Kawano, S.; Yasutake, A. Removal of SOx and NOx over activated carbon fibers. Carbon 2000, 38, 227–239. [Google Scholar] [CrossRef]
- Zhang, H.; Niu, J.; Guo, Y.; Cheng, F. Recirculating coking by-products and waste for cost-effective activated carbon (AC) production and its application for treatment of SO2 and wastewater in coke-making plant. J. Clean. Prod. 2021, 280, 124375. [Google Scholar] [CrossRef]
- Tseng, H.H.; Wey, M.Y. Study of SO2 adsorption and thermal regeneration over activated carbon-supported copper oxide catalysts. Carbon 2004, 42, 2269–2278. [Google Scholar] [CrossRef]
- Soldemo, M.; Stenlid, J.H.; Besharat, Z.; Johansson, N.; Onsten, A.; Knudsen, J.; Schnadt, J.; Gothelid, M.; Brinck, T.; Weissenrieder, J. Interaction of sulfur dioxide and near-ambient pressures of water vapor with cuprous oxide surfaces. J. Phys. Chem. C 2017, 121, 24011–24024. [Google Scholar] [CrossRef]
- Galtayries, A.; Grimblot, J.; Bonnelle, J.P. Interaction of SO2 with different polycrystalline Cu, Cu2O and CuO surfaces. Surf. Interface Anal. 1996, 24, 345–354. [Google Scholar] [CrossRef]
- Baxter, J.P.; Grunze, M.; Kong, C.W. Interaction of SO2 with copper and copper-oxide surfaces. J. Vac. Sci. Technol. A 1988, 6, 1123–1127. [Google Scholar] [CrossRef]
- Hammershoi, P.S.; Vennestrom, P.N.R.; Falsig, H.; Jensen, A.D.; Janssens, T.V.W. Importance of the Cu oxidation state for the SO2-poisoning of a Cu-SAPO-34 catalyst in the NH3-SCR reaction. Appl. Catal. B Environ. 2018, 236, 377–383. [Google Scholar] [CrossRef]
- Alqadami, A.A.; Khan, M.A.; Siddiqui, M.R.; Alothman, Z.A. Development of citric anhydride anchored mesoporous MOF through post synthesis modification to sequester potentially toxic lead (II) from water. Microporous Mesoporous Mater. 2018, 261, 198–206. [Google Scholar] [CrossRef]
- Haldoupis, E.; Nair, S.; Sholl, D.S. Finding MOFs for highly selective CO2/N2 adsorption using materials screening based on efficient assignment of atomic point Charges. J. Am. Chem. Soc. 2012, 134, 4313–4323. [Google Scholar] [CrossRef]
- Dekrafft, K.E.; Wang, C.; Lin, W. Metal-organic framework templated synthesis of Fe2O3/TiO2 nanocomposite for hydrogen production. Adv. Mater. 2012, 24, 2014–2018. [Google Scholar] [CrossRef] [PubMed]
- Savage, M.; Cheng, Y.G.; Easun, T.L.; Eyley, J.E.; Argent, S.P.; Warren, M.R.; Lewis, W.; Murray, C.; Tang, C.C.; Frogley, M.D.; et al. Selective adsorption of sulfur dioxide in a robust metal-organic framework. Adv. Mater. 2016, 28, 8705–8711. [Google Scholar] [CrossRef] [PubMed]
- Jin, M.; Ban, X.; Gao, J.; Chen, J.; Hensley, D.K.; Ho, H.C.; Percoco, R.J.; Ritzi, C.M.; Yue, Y. Solvent-free synthesis of CuO/HKUST-1 composite and its photocatalytic application. Inorg. Chem. 2019, 58, 8332–8338. [Google Scholar] [CrossRef] [PubMed]
- Peng, B.; Feng, C.; Liu, S.; Zhang, R. Synthesis of CuO catalyst derived from HKUST-1 temple for the low-temperature NH3-SCR process. Catal. Today 2018, 314, 122–128. [Google Scholar] [CrossRef]
- Thuan Van, T.; Duyen Thi Cam, N.; Thuong Thi, N.; Le, H.T.N.; Chi Van, N.; Trinh Duy, N. Metal -organic framework HKUST-1-based Cu/Cu2O/CuO@C porous composite: Rapid synthesis and uptake application in antibiotics remediation. J. Water Process Eng. 2020, 36, 101319. [Google Scholar]
- Hu, L.; Huang, Y.; Zhang, F.; Chen, Q. CuO/Cu2O composite hollow polyhedrons fabricated from metal-organic framework templates for lithium-ion battery anodes with a long cycling life. Nanoscale 2013, 5, 4186–4190. [Google Scholar] [CrossRef] [PubMed]
- Zhang, L.; Wu, H.B.; Lou, X.W. Metal-organic-frameworks-derived general formation of hollow structures with high complexity. J. Am. Chem. Soc. 2013, 135, 10664–10672. [Google Scholar] [CrossRef]
- Fu, Y.M.; Zou, K.; Liu, M.Y.; Zhang, X.H.; Du, C.C.; Chen, J.H. Highly selective and sensitive photoelectrochemical sensing platform for VEGF165 assay based on the switching of photocurrent polarity of cds qds by porous Cu2O-CuO flower. Anal. Chem. 2020, 92, 1189–1196. [Google Scholar] [CrossRef]
- Wang, Y.; Lu, Y.; Zhan, W.; Xie, Z.; Kuang, Q.; Zheng, L. Synthesis of porous Cu2O/CuO cages using Cu-based metal-organic frameworks as templates and their gas-sensing properties. J. Mater. Chem. A 2015, 3, 12796–12803. [Google Scholar] [CrossRef]
- Kim, T.K.; Lee, K.J.; Cheon, J.Y.; Lee, J.H.; Joo, S.H.; Moon, H.R. Nanoporous metal oxides with tunable and nanocrystalline frameworks via conversion of metal-organic frameworks. J. Am. Chem. Soc. 2013, 135, 8940–8946. [Google Scholar] [CrossRef]
- Thuan Van, T.; Duyen Thi Cam, N.; Hanh Thi Ngoc, L.; Huu Loc, H.; Trung Thanh, N.; Van-Dat, D.; Trinh Duy, N.; Long Giang, B. Response surface methodology-optimized removal of chloramphenicol pharmaceutical from wastewater using Cu3(BTC)2-derived porous carbon as an efficient adsorbent. C. R. Chim. 2019, 22, 794–803. [Google Scholar]
- Gupta, N.K.; Bae, J.; Kim, K.S. From MOF-199 microrods to CuO nanoparticles for room-temperature desulfurization: Regeneration and repurposing spent adsorbents as sustainable approaches. ACS Omega 2021, 6, 25631–25641. [Google Scholar] [CrossRef] [PubMed]
- Chen, K.; Ling, J.L.; Wu, C.D. In Situ Generation and Stabilization of Accessible Cu/Cu2O Heterojunctions inside Organic Frameworks for Highly Efficient Catalysis. Angew. Chem. Int. Ed. 2020, 59, 1925–1931. [Google Scholar] [CrossRef] [PubMed]
- Kruk, M.; Jaroniec, M. Gas adsorption characterization of ordered organic-inorganic nanocomposite materials. J. Mater. Chem. 2001, 13, 3169–3183. [Google Scholar] [CrossRef]
- Xu, H.; Zhu, G.; Zheng, D.; Xi, C.; Xu, X.; Shen, X. Porous CuO superstructure: Precursor-mediated fabrication, gas sensing and photocatalytic properties. J. Colloid Interface Sci. 2012, 383, 75–81. [Google Scholar] [CrossRef]
- Jiang, P.; Prendergast, D.; Borondics, F.; Porsgaard, S.; Giovanetti, L.; Pach, E.; Newberg, J.; Bluhm, H.; Besenbacher, F.; Salmeron, M. Experimental and theoretical investigation of the electronic structure of Cu2O and CuO thin films on Cu(110) using x-ray photoelectron and absorption spectroscopy. J. Chem. Phys. 2013, 138, 024704. [Google Scholar] [CrossRef] [Green Version]
- Azimi, H.; Kuhri, S.; Osvet, A.; Matt, G.; Khanzada, L.S.; Lemmer, M.; Luechinger, N.A.; Larsson, M.I.; Zeira, E.; Guldi, D.M.; et al. Effective ligand passivation of Cu2O Nanoparticles through solid-state treatment with mercaptopropionic acid. J. Am. Chem. Soc. 2014, 136, 7233–7236. [Google Scholar] [CrossRef]
- Wang, P.; Ng, Y.H.; Amal, R. Embedment of anodized p-type Cu2O thin films with CuO nanowires for improvement in photoelectrochemical stability. Nanoscale 2013, 5, 2952–2958. [Google Scholar] [CrossRef]
- Gan, Z.H.; Yu, G.Q.; Tay, B.K.; Tan, C.M.; Zhao, Z.W.; Fu, Y.Q. Preparation and characterization of copper oxide thin films deposited by filtered cathodic vacuum arc. J. Phys. D Appl. Phys. 2004, 37, 81–85. [Google Scholar] [CrossRef]
- Xiong, Y.; Yao, X.; Tang, C.; Zhang, L.; Cao, Y.; Deng, Y.; Gao, F.; Dong, L. Effect of CO-pretreatment on the CuO-V2O5/gamma-Al2O3 catalyst for NO reduction by CO. Catal. Sci. Technol. 2014, 4, 4416–4425. [Google Scholar] [CrossRef]
- Giamello, E. Reactive intermediates formed upon electron transfer from the surface of oxide catalysts to adsorbed molecules. Catal. Today 1998, 41, 239–249. [Google Scholar] [CrossRef]
- Li, H.; Zhang, S.; Zhong, Q. Effect of nitrogen doping on oxygen vacancies of titanium dioxide supported vanadium pentoxide for ammonia-SCR reaction at low temperature. J. Colloid Interface Sci. 2013, 402, 190–195. [Google Scholar] [CrossRef] [PubMed]
- Maimaiti, Y.; Nolan, M.; Elliott, S.D. Reduction mechanisms of the CuO(111) surface through surface oxygen vacancy formation and hydrogen adsorption. Phys. Chem. Chem. Phys. 2014, 16, 3036–3046. [Google Scholar] [CrossRef] [PubMed] [Green Version]
- Ma, S.; Yuan, D.; Jiao, Z.; Wang, T.; Dai, X. Monolayer Sc2CO2: A promising candidate as a SO2 gas sensor or capturer. J. Phys. Chem. C 2017, 121, 24077–24084. [Google Scholar] [CrossRef]
- Ye, X.; Jiang, X.; Chen, L.; Jiang, W.; Wang, H.; Cen, W.; Ma, S. Effect of manganese dioxide crystal structure on adsorption of SO2 by DFT and experimental study. Appl. Surf. Sci. 2020, 521, 146477. [Google Scholar] [CrossRef]
- Rajendran, K.; Pandurangan, N.; Vinod, C.P.; Khan, T.S.; Gupta, S.; Haider, M.A.; Jagadeesan, D. CuO as a reactive and reusable reagent for the hydrogenation of nitroarenes. Appl. Catal. B Environ. 2021, 297, 120417. [Google Scholar]
- Zhang, R.; Liu, H.; Zheng, H.; Ling, L.; Li, Z.; Wang, B. Adsorption and dissociation of O2 on the Cu2O(111) surface: Thermochemistry, reaction barrier. Appl. Surf. Sci. 2011, 257, 4787–4794. [Google Scholar] [CrossRef]
- Yao, L.; Yang, L.; Jiang, W.; Jiang, X. Removal of SO2 from flue gas on a copper-modified activated coke prepared by a novel one-step carbonization activation blending method. Ind. Eng. Chem. Res. 2019, 58, 15693–15700. [Google Scholar] [CrossRef]
- Duan, R.; Feng, Y.; Gu, J.; Wang, M.H.; He, B.; Liu, L.; Zhu, B.; Wang, X. Ultralow loading of Cu2O/CuO nanoparticles on metal-organic framework-derived carbon octahedra and activated semi-coke for highly efficient SO2 removal. J. Clean. Prod. 2022, 341, 130823. [Google Scholar] [CrossRef]
- Kresse, G.; Furthmuller, J. Efficiency of ab-initio total energy calculations for metals and semiconductors using a plane-wave basis set. Comput. Mater. Sci. 1996, 6, 15–50. [Google Scholar] [CrossRef]
- Kresse, G.; Furthmuller, J. Efficient iterative schemes for ab initio total-energy calculations using a plane-wave basis set. Phys. Rev. B 1996, 54, 11169–11186. [Google Scholar] [CrossRef] [PubMed]
- Blochl, P.E. Projector augmented-wave method. Phys. Rev. B 1994, 50, 17953–17979. [Google Scholar] [CrossRef] [Green Version]
- Perdew, J.P.; Burke, K.; Ernzerhof, M. Generalized gradient approximation made simple. Phys. Rev. Lett. 1997, 78, 1396. [Google Scholar] [CrossRef] [Green Version]
- Grimme, S. Semiempirical GGA-type density functional constructed with a long-range dispersion correction. J. Comput. Chem. 2006, 27, 1787–1799. [Google Scholar] [CrossRef] [PubMed]
- Monkhorst, H.J.; Pack, J.D. Special points for Brillouin-zone integrations. Phys. Rev. B 1976, 13, 5188–5192. [Google Scholar] [CrossRef]
Figure 1.
The morphology and phase of nano−CuOs. TEM images of (a,b) CuO−NC and (d,e) CuO−NP. The inset of (a) is the corresponding magnified image; STEM image (c) and elemental mapping images (c1–c3) of CuO−NC; XRD patterns of (f) Nano−CuOs and (inset) Cu3(BTC)2; and (g) TGA and DTA curves of Cu2(BTC)3.

Figure 2.
Porosity analysis of nano−CuOs. (a) N2 isotherms of adsorption-desorption curves at 77 K and their corresponding and (b) pore size distributions. The inset of (a,b) is the correspondingly enlarged view of CuO−NP.
Figure 2.
Porosity analysis of nano−CuOs. (a) N2 isotherms of adsorption-desorption curves at 77 K and their corresponding and (b) pore size distributions. The inset of (a,b) is the correspondingly enlarged view of CuO−NP.

Figure 3.
Chemical compositions of nano−CuOs. (a) Cu 2p XPS spectra, (b) O 1s XPS spectra, (c) Raman spectra and (d) EPR spectra of CuO−NC and CuO−NP. The inset of (d) is the correspondingly enlarged view of CuO−NP.
Figure 3.
Chemical compositions of nano−CuOs. (a) Cu 2p XPS spectra, (b) O 1s XPS spectra, (c) Raman spectra and (d) EPR spectra of CuO−NC and CuO−NP. The inset of (d) is the correspondingly enlarged view of CuO−NP.

Figure 4.
Adsorption configurations of SO2 molecules over simulated CuO−NC (111). (Cu, O and S atoms are depicted in blue, red and yellow, respectively). (a) The unit cell of CuO (111). (b) The front view. (c) The adsorption configurations of the SO2−adorbed intermediate. (d) The side view. (e) The CDD diagrams of the SO2 adsorption over CuO surface. (f,g) The corresponding side and front views, respectively. (The yellow and the turquoise region refer to the charge consumption and accumulation, respectively). (h) The 2D sectional view of CDD diagrams.

Figure 5.
The DOS for SO2 molecules (a,b) and Cu atom (c) before and after adsorption, where the Cu atom is Cu on the surface of CuO. The Fermi energy corresponds to zero.
Figure 5.
The DOS for SO2 molecules (a,b) and Cu atom (c) before and after adsorption, where the Cu atom is Cu on the surface of CuO. The Fermi energy corresponds to zero.

Figure 6.
Adsorption configuration of SO2 molecules on the oxygen-vacancy CuO (111) (Cu, O and S atoms are depicted in blue, red and yellow, respectively). (a)The oxygen vacancy on CuO (111). (b) O2 adsorption on CuO (111) surface. (c) Optimized configurations of SO2 adsorption on O2−adsorbed CuO (111). (d) SO2 adsorption on CuO (111).

Figure 7.
FGD test results of nano−CuOs. (a) Adsorption isotherms of SO2 in CuO−NC and CuO−NP at different temperatures. (b) The influence of reaction temperature on the SO2 removal performance of CuO−NC and CuO−NP. (The Efficiency threshold was defined as 50%) (c) The influence of reaction atmosphere on the SO2 removal performance of CuO−NC. (GHSV = 8900 h−1, CSO2 = 2000 ppm).

Figure 8.
Schematic of the synthesis process of nano−CuOs.


Table 1.
The results of curve fitting of Cu 2p 3/2 and O1s XPS spectra of nano−CuOs.
| Samples ID | Cu 2p 3/2 | O 1s | ||||||||
|---|---|---|---|---|---|---|---|---|---|---|
| Cu+ 2p 3/2 | Cu2+ 2p 3/2 | OL | OV | OC | ||||||
| Binding Energy/eV | Percentage/% | Binding Energy/eV | Percentage/% | Binding Energy/eV | Percentage/% | Binding Energy/eV | Percentage/% | Binding Energy/eV | Percentage/% | |
| CuO−NC | 932.6 | 59.5 | 933.7 | 40.5 | 530.4 | 58.9 | 531.5 | 26.7 | 532.5 | 14.4 |
| CuO−NP | − | − | 933.7 | 100 | 530.2 | 70.3 | 531.4 | 19.4 | 532.2 | 10.3 |
Table 2.
Bader charge of the SO2 adsorption over the CuO surface (111).
| Sites | Before Adsorption/e | After Adsorption/e | Δ |
|---|---|---|---|
| aCus1 | 10.043 | 9.973 | −0.070 |
| Cus2 | 10.043 | 9.931 | −0.112 |
| bOs | 6.996 | 7.043 | 0.047 |
| cSm | 3.734 | 3.759 | 0.025 |
| dOm1 | 7.133 | 7.217 | 0.085 |
| Om2 | 7.134 | 7.186 | 0.052 |
aCus = Cu atoms on the surface of CuO (111); bOs = O atoms on the surface of CuO (111); cSm = S atoms of SO2 molecules; dOm = O atoms of SO2 molecules
Table 3.
Performance comparison between CuO−based composites and earlier reported desulfurizers in the literature.
Table 3.
Performance comparison between CuO−based composites and earlier reported desulfurizers in the literature.
| Sample ID | aSBET/m2 g−1 | bQads/mg g−1 | cCSO2/ppm | dη/% | eTads/°C | Ref |
|---|---|---|---|---|---|---|
| CaO | 31–134 | 590–900 | 3000 | − | 800 | [4] |
| 0.95%−CuxO@ASC−3 | 506.62 | 233.1 | 2000 | 100 | 95 | [59] |
| 1%−AC−cop1 | 408 | 174.8 | 3000 | 5 | 80 | [18] |
| 3%−Cu/AC−HCl | 3 | 25 | 400 | − | 250 | [20] |
| 4%−Cu/AC | 829 | 57.6 | 13.3 | − | 20 | [17] |
| 5%−Cu−C−II−5 | 938 | 30 | 200 | 0 | 250 | [19] |
| 10%−Cu/AC | 844 | 59 | 200 | 0 | 250 | [24] |
| CuO−NC | 89.84 | 157.63 | 2000 | 50 | 200 | this work |
aSBET/m2 g−1 = BET surface area. bQads = SO2 adsorption capacity. cCSO2 = Initial concentration of SO2. dη = Efficiency threshold. eTads = Adsorption temperature.
Publisher’s Note: MDPI stays neutral with regard to jurisdictional claims in published maps and institutional affiliations. |
© 2022 by the authors. Licensee MDPI, Basel, Switzerland. This article is an open access article distributed under the terms and conditions of the Creative Commons Attribution (CC BY) license (https://creativecommons.org/licenses/by/4.0/).
Share and Cite
MDPI and ACS Style
Duan, R.; Chen, W.; Chen, Z.; Gu, J.; Dong, Z.; He, B.; Liu, L.; Wang, X. Mechanistic and Experimental Study of the CuxO@C Nanocomposite Derived from Cu3(BTC)2 for SO2 Removal. Catalysts 2022, 12, 689. https://doi.org/10.3390/catal12070689
AMA Style
Duan R, Chen W, Chen Z, Gu J, Dong Z, He B, Liu L, Wang X. Mechanistic and Experimental Study of the CuxO@C Nanocomposite Derived from Cu3(BTC)2 for SO2 Removal. Catalysts. 2022; 12(7):689. https://doi.org/10.3390/catal12070689
Chicago/Turabian StyleDuan, Rudi, Weibin Chen, Ziwei Chen, Jialiang Gu, Zhaoqi Dong, Beini He, Lili Liu, and Xidong Wang. 2022. "Mechanistic and Experimental Study of the CuxO@C Nanocomposite Derived from Cu3(BTC)2 for SO2 Removal" Catalysts 12, no. 7: 689. https://doi.org/10.3390/catal12070689
Note that from the first issue of 2016, this journal uses article numbers instead of page numbers. See further details here.