
Emissions of Euro 6 Mono- and Bi-Fuel Gas Vehicles
by
 , , , and
Barouch Giechaskiel
*, 
Tero Lähde
,
Michaël Clairotte
,
Ricardo Suarez-Bertoa
,
Victor Valverde
,
Anastasios D. Melas
,
Tommaso Selleri
and
Pierre Bonnel
European Commission, Joint Research Centre (JRC), 21027 Ispra, Italy
*
Author to whom correspondence should be addressed.
Catalysts 2022, 12(6), 651; https://doi.org/10.3390/catal12060651
Submission received: 26 May 2022
/
Revised: 8 June 2022
/
Accepted: 13 June 2022
/
Published: 14 June 2022
(This article belongs to the Special Issue Frontiers in Catalytic Emission Control)
Abstract
:Compressed natural gas (CNG) and liquefied petroleum gas (LPG) are included in the group of promoted transport fuel alternatives in Europe. Most studies on emissions factors are based on old technology CNG and LPG fueled vehicles. Furthermore, there are not many data at low ambient temperatures, on-road driving, or unregulated pollutants, such as ammonia (NH3). In this study we measured the emissions of one Euro 6b CNG light commercial vehicle, one Euro 6b and one Euro 6d-Temp bi-fuel LPG passenger car, one Euro 6d-Temp bi-fuel CNG passenger car, and four Euro 6d-Temp CNG passenger cars. Tests included on-road testing and worldwide harmonized light vehicles test cycles (WLTC) in the laboratory with cold and hot engine, at 23 °C and −7 °C. The results showed 10–23% CO2 savings in gas modality compared to gasoline, lower CO and particle number emissions, and relatively similar total and non-methane hydrocarbons and NOx emissions. The ammonia emissions were high for all vehicles and fuels; higher than gasoline and diesel vehicles. The results also showed that, following the introduction of the real-driving emissions regulation, even though not applicable to the examined vehicles, Euro 6d-Temp vehicles had lower emissions compared to the Euro 6b vehicles.
Keywords:
gas engines; NH3; particle number; CO2; bi-fuel vehicles; CNG; LPG; gasoline; greenhouse gas (GHG); CH41. Introduction
In July 2021, the European Commission adopted a series of legislative proposals aiming climate neutrality in the European Union (EU) by 2050, including the intermediate target of an at least 55% net reduction in greenhouse gas (GHG) emissions by 2030. Transport (including road transport, international aviation, and international shipping) contributed 25% to GHG emissions in 2017, just below the energy sector that contributed 26% [1]. Road transport accounted for 72% of transport GHG emissions. Of these emissions, 61% were from passenger cars, 12% from light commercial vehicles, and 26% came from heavy-duty vehicles. Regulation (EU) 2019/631 set EU fleet-wide CO2 emission reduction targets from 2021 of 15% in 2025 and 37% in 2030 for passenger cars (31% for light commercial vehicles).
The European Union (EU) began implementing biofuel (i.e., biodiesel, bioethanol, and biogas) related targets in 2003 with (Directive 2003/30/EC), aiming in reducing GHG emissions. In 2009, the amended Fuel Quality Directive (FQD) required that, by 2020, the road transport fuel mix in the EU should be 6% less carbon intensive than the fossil diesel and gasoline baseline. The Renewable Energy Directive (RED) mandated that 20% of all energy usage in the EU, including at least 10% of all energy in road transport fuels, should be produced from renewable sources by 2020. The revised Directive (EU) 2018/2001 on the promotion of the use of energy from renewable sources (REDII) set the targets for the renewable energy and advanced biofuels share in transportation by 2030 of 14% and 3.5%, respectively. The GHG reduction potential of biofuels depends on many parameters, such as land use, production, transportation, storage, and process [2,3]. Nevertheless, biofuels provide an important CO2 well-to-wheels reduction compared to fossil ethanol. For bio-methane the potential is the highest compared to all fuels [3,4,5].
Compressed Natural Gas (CNG) and Liquefied Petroleum Gas (LPG) are included in the group of promoted transport fuel alternatives for traditional fossil fuels in Europe (Directive 2009/28/EC). LPG is typically a product or a by-product of petroleum refining or natural gas processing and CNG is obtained increasingly from shale gas reserves [6]. Vehicles operating on gas are popular in several EU countries due to the attractive fuel price. In Europe, in 2019, 1.6% of the passenger cars and 1.3% of the light commercial vehicles were gas fuel vehicles. In Italy the percentages were 9.0% and 5.7%, respectively [7]. CNG buses have also been widely adopted in Europe as they were understood to be more environmentally friendly than their diesel counterparts [8,9].
Natural gas is one of the most preferred alternative fuels used to power internal combustion engines due to the good compatibility with the existing distribution infrastructure, and abundance due to extraction from shale gas [6]. Natural gas is (very) knock resistant and, thus, an ideal fuel for boosting and downsizing the combustion engines [10]. Natural gas has a further future sustainability potential as a transportation fuel as it can be blended with all types of renewable methane up to 100% blend rate. The gaseous fuels have high octane number, low carbon number and enhanced mixing characteristics when compared to gasoline resulting in relatively low exhaust CO2 emissions in combustion engine use (on a tank to wheel basis) [11]. Methane (CH4), the prime constituent of natural gas, provides a theoretical CO2 advantage of as much as 26% when compared to gasoline as a result of the higher H/C ratio and specific energy content [10]. The percentage drops to around 20% because the fuel typically contains 85–95% CH4, but also heavier hydrocarbon species and some other impurities. Much higher end-user cost savings can be achieved because the price of the gas fuel is typically lower than of the gasoline fuel [12]. Compared to conventional fuels, the use of natural gas has a 15–27% GHG emissions reduction effect per km [11]. However, life cycle analysis indicates that the benefits can be marginal, if any, due to fuel supply leakages, high tailpipe CH4 emissions (slip), and not-optimized combustion efficiency [11,13]. In general, other gaseous pollutants are lower (CO, HC, particles), but NOx emissions usually higher [14,15,16]. Some studies have raised concerns regarding ammonia (NH3) emissions from the CNG-fueled vehicles [17]. Ammonia is produced in large quantities after the three-way catalyst reaches the light-off temperature [17,18] and some studies found higher NH3 emissions from CNG vehicles than gasoline ones [19]. LPG vehicles are also shown to produce ammonia [20]. Even though ambient ammonia originates mainly from agriculture, many studies have shown that transport is the main source in urban areas [21]. Research is on-going on optimization of three-way catalysts (TWC) for CNG and LPG applications [22,23,24]. Particular attention in the last years have gained the particle number (PN) emissions of CNG-fueled engines [25,26,27,28]. Although, the PN emissions are low, at least in the size range of the current legislated methodology (>23 nm), many studies found extremely high number of nanoparticles below the lower limit of 23 nm [29,30,31]. These particles have often been attributed to lubricant oil [32].
Many of these findings and the emissions factors are based on older studies with older technology vehicles, such as Euro 2 [33], Euro 3 [33,34,35], Euro 4 [35,36,37,38,39], or Euro 5 [19,39,40,41,42]. The Euro 6 studies are not numerous, and they studied the first step Euro 6b vehicles [43,44] or only the PN emissions [25,26,45,46,47,48]. There are few studies with Euro 6d-Temp or later [49]. Such studies are important because the latest vehicles (Euro 6d-Temp or later) in comparison to Euro 6b (or older), have to fulfil the emission limits also on the road and, thus, the results are more representative of real-world driving conditions. Furthermore, there are limited data on NH3 from gas engines and practically no data at low ambient temperatures. Our study aims at covering these gaps.
2. Results and Discussion
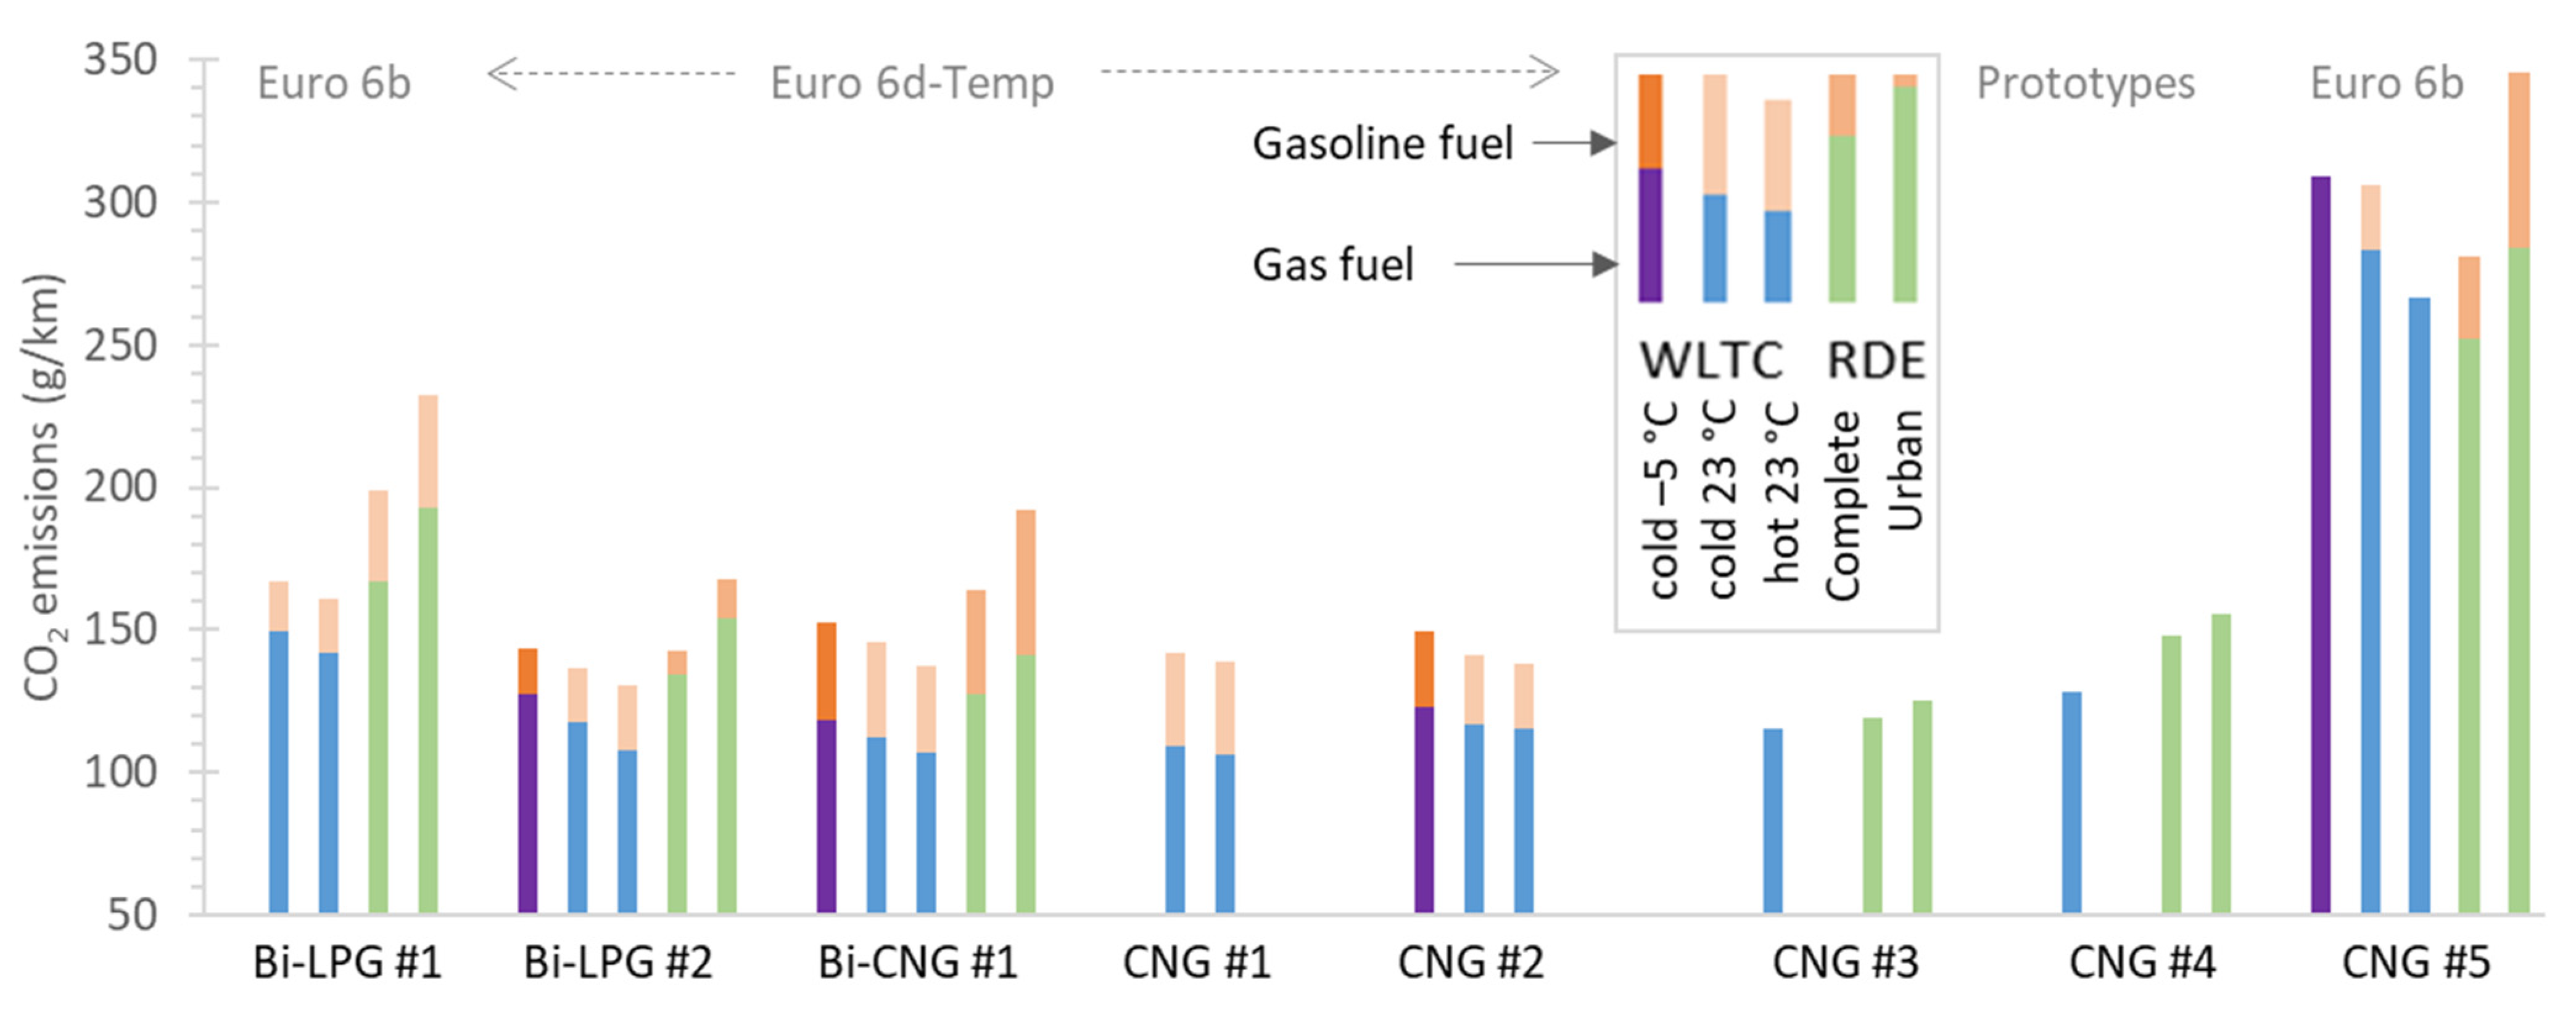
This section presents first the emissions of the greenhouse gas CO2, then the gaseous regulated pollutants, and particles, and finishes with the unregulated pollutant NH3. N2O was measured but it was very low (at background levels), so it will not be discussed. The format of the figures is the same for all species presented. On the x-axis, the eight vehicles are plotted. The first two are the bi-fuel LPG/gasoline passenger cars (category M1), the third one is the bi-fuel CNG/gasoline passenger car. Then, the mono-fuel CNG passenger cars follow, with the last one being the light commercial vehicle (category N1-III). The first and last vehicles are Euro 6b, while the rest are Euro 6d-Temp or prototypes aiming at Euro 6d. For each vehicle, depending on the available tests, up to five bars are given. The first one, when available, is the low ambient temperature (approximately −5 °C) cold engine start worldwide harmonized light vehicles test cycle (WLTC) (violet), the second is the cold engine start WLTC at 23 °C, and the third is the hot engine start WLTC at 23 °C (both blue color). Then, the emissions of the complete and the urban part real-driving emissions (RDE) tests are given (green color). These colors refer to the gas fuel (LPG or CNG). When results with the gasoline (E5 for Euro 6b or E10 for the rest) fuels are available, they are plotted on top of the previous bars with orange shades. When the gasoline emissions are lower than the LPG or CNG emissions, then an orange horizontal solid line is plotted.
Note that the driver has the possibility to select the gasoline fuel modality only for the bi-fuel cars. The mono CNG fuel vehicles use the gasoline fuel only when the gas tank is empty and no emission limits are applicable to the gasoline modality. It should be noted that the Euro 6b vehicles were type approved with the new European driving cycle (NEDC), and consequently the respective limits are not applicable to the WLTC and RDE tests, which are more challenging than the NEDC.
2.1. CO2
Figure 1 presents the measured CO2 emissions of the tested vehicles. In gas (LPG or CNG) modality, they ranged from 105 to 155 g/km, with the exception of the Bi-LPG #1 which emitted 192 g/km at the urban RDE trip and the light commercial CNG #5 which emitted 250 to 310 g/km in all tests. In the gasoline modality, the CO2 emissions of the passenger cars increased 8 to 52 g/km (6 to 36%) while for the light commercial CNG #5 23 to 61 g/km (8 to 22%).
Table 1 summarizes the measured “baseline” CO2 emissions for cold start WLTC at 23 °C with gas or gasoline modality, and the differences of the other test conditions from the baseline. The declared CO2 emissions were up to 18% lower, with one exception (Bi-LPG #2) that CO2 was 15% higher. In gasoline modality the differences to declared CO2 were comparable with the gas modality (i.e., from −12% up to 8%).
For the Euro 6d-Temp and prototype vehicles the ±15% differences between declared and measured for the same cycle are not unusual. A study found 7% between the tests in the laboratory and the type approval values for a Euro 5 CNG vehicle [42]. In our study, we did not apply any correction (e.g., for the 12 V battery charging/discharging during the test, speed and distance or temperature), which could have a few percentage impacts on the CO2 results [50]. The road-loads at our tests were based on the certificate of conformity for the Euro 6d-Temp vehicles and representative values for the Euro 6b vehicles [51]. Differences at the road-loads used [52], or even the fuel quality, can have an effect on CO2 emissions [53,54]. The 10–17% differences between type approval values and independent testing values for the Euro 6b vehicles (Bi-LPG #1 and CNG #5) were expected because the declared values refer to NEDC and not the tested WLTC. Differences of 14-17% between NEDC and WLTC have been reported for gas vehicles [55].
The cold start WLTC emissions were, on average, 5% higher than the hot start emissions. The cold start low temperature tests had 5% to 9% higher CO2 emissions that the cold start tests at 23 °C. There are no studies with gas vehicles investigating the low temperature impact on CO2. Nevertheless, our results are in agreement with studies with gasoline vehicles [56].
The RDE complete tests had 4% to 20% higher emissions than the baseline. Such differences are typical. For example, the 2019 JRC annual report found, on average, 9% higher RDE compared to laboratory CO2 for gasoline vehicles [57]. One exception was the N1 vehicle which had around 10% lower RDE CO2 emissions. A possible reason is that the on-road tests were done with low payload (on-board equipment and crew were equivalent to 35% of the payload). Only with 90% payload the CO2 emissions would be comparable to the laboratory WLTC, but 20% higher than the declared value of 234 g/km (results not shown in the figure). It should be also added that the declared value of this vehicle was based on the older cycle NEDC.
The gas modality vs. the gasoline modality resulted in 8–23% CO2 reductions for the cold start WLTC at 23 °C. At the RDE on-road tests the reductions were 6–22% (average 14%). In general, the highest differences were measured for the mono-fuel vehicles which were calibrated only for the CNG fuel. The relatively small difference for CNG #5 is due to the very high CO emissions in gasoline modality for the specific vehicle that will be presented in the next sections. The lower values for LPG can be explained by the lower H/C ratio compared to CNG (typically around 2.5 for LPG vs. 3.9 for CNG and 1.9 for gasoline). The results are, in general, in good agreement with the literature or closer to the lower range of the reported differences: studies reported 10–30% lower CO2 in CNG than in gasoline modality [58], while for LPG, CO2 was up to 18% lower [38,41,59]. Studies with Euro 5 and Euro 6b bi-fuel vehicles found 24–36% lower CO2 using CNG in the laboratory [40] and on the road [42,43].
2.2. NOx
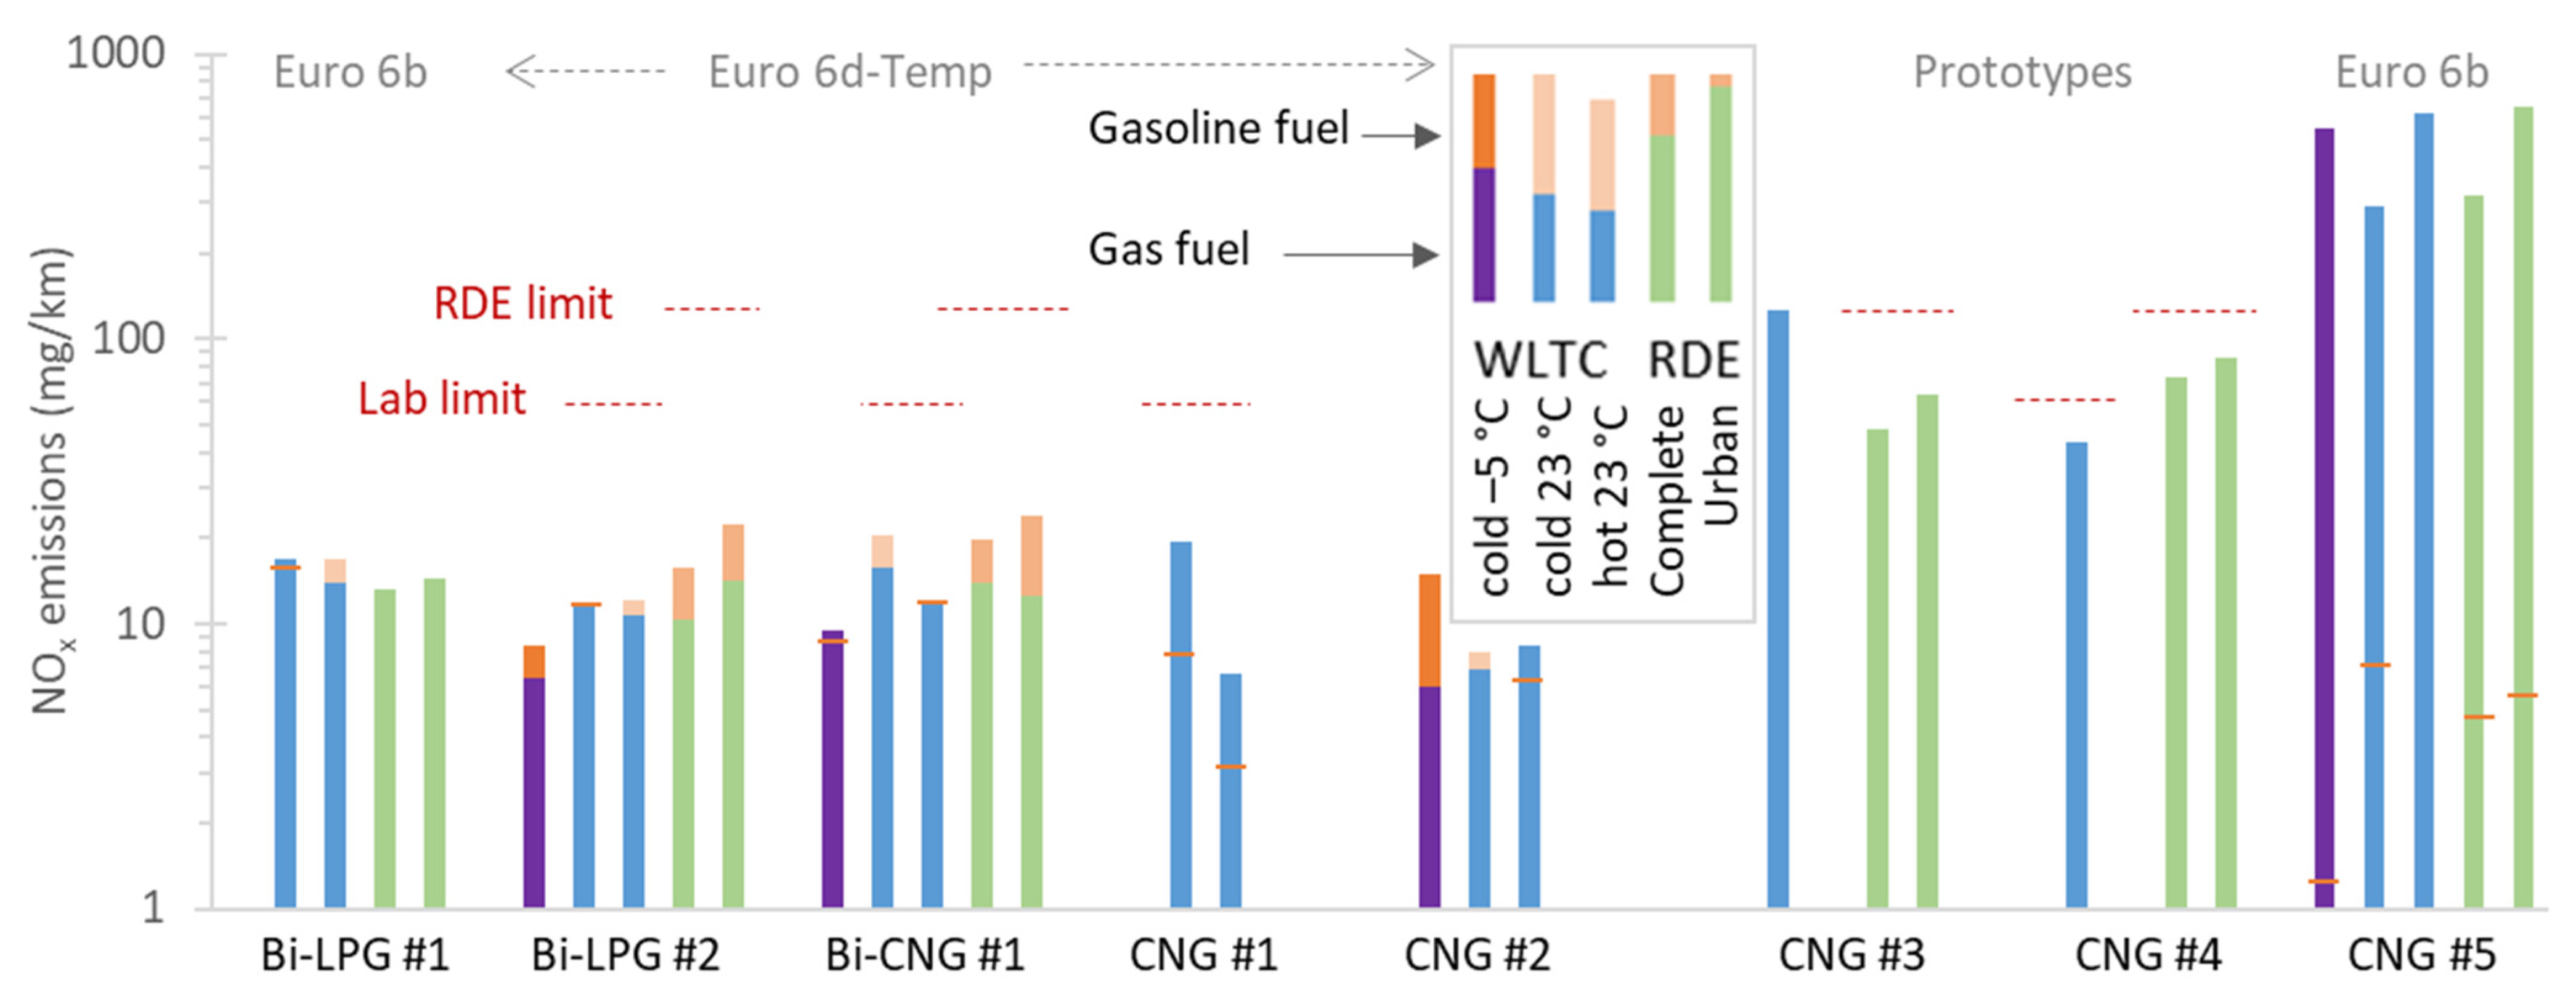
Figure 2 presents the measured NOx emissions of the tested vehicles. In gas modality, the passenger cars emitted 7 to 24 mg/km, except for the prototype direct injection (DI) CNG vehicles #3 and #4 which emitted 43 to 127 mg/km. The NOx emissions of CNG #3 were decreased to one third (around 40 mg/km) after fine tuning by the manufacturer. The light commercial CNG #5 emitted 295 to 650 mg/km. However, in gasoline modality, the NOx emissions were <7 mg/km. The passenger cars emitted 3 to 24 mg/km in gasoline modality, which were practically at the same levels as in LPG/CNG modality. The emissions were also similar at low ambient temperatures and between laboratory and on-road testing. The cold start emissions were not particularly higher than the hot start emissions, with significant differences only for CNG #1. The results confirm the findings in the literature that in general the NOx emissions are low for modern vehicles, with the exception of CNG #5 [14,42,43]. The relatively similar NOx emissions of 23 °C and −7 °C have also been reported by one study with a Euro 6b vehicle [60]. Although for the passenger cars, the differences were small, this was not the case for the CNG #5 light commercial vehicle. The high differences of NOx with CNG #5 (>300 mg/km in gas modality vs. <10 mg/km in gasoline modality) indicate high engine out emissions, deviations of lambda from unity or not good control of the lambda during transients [19,61]. The NOx emissions at the type approval cycle (NEDC) in CNG modality were around 50 mg/km.
2.3. CO
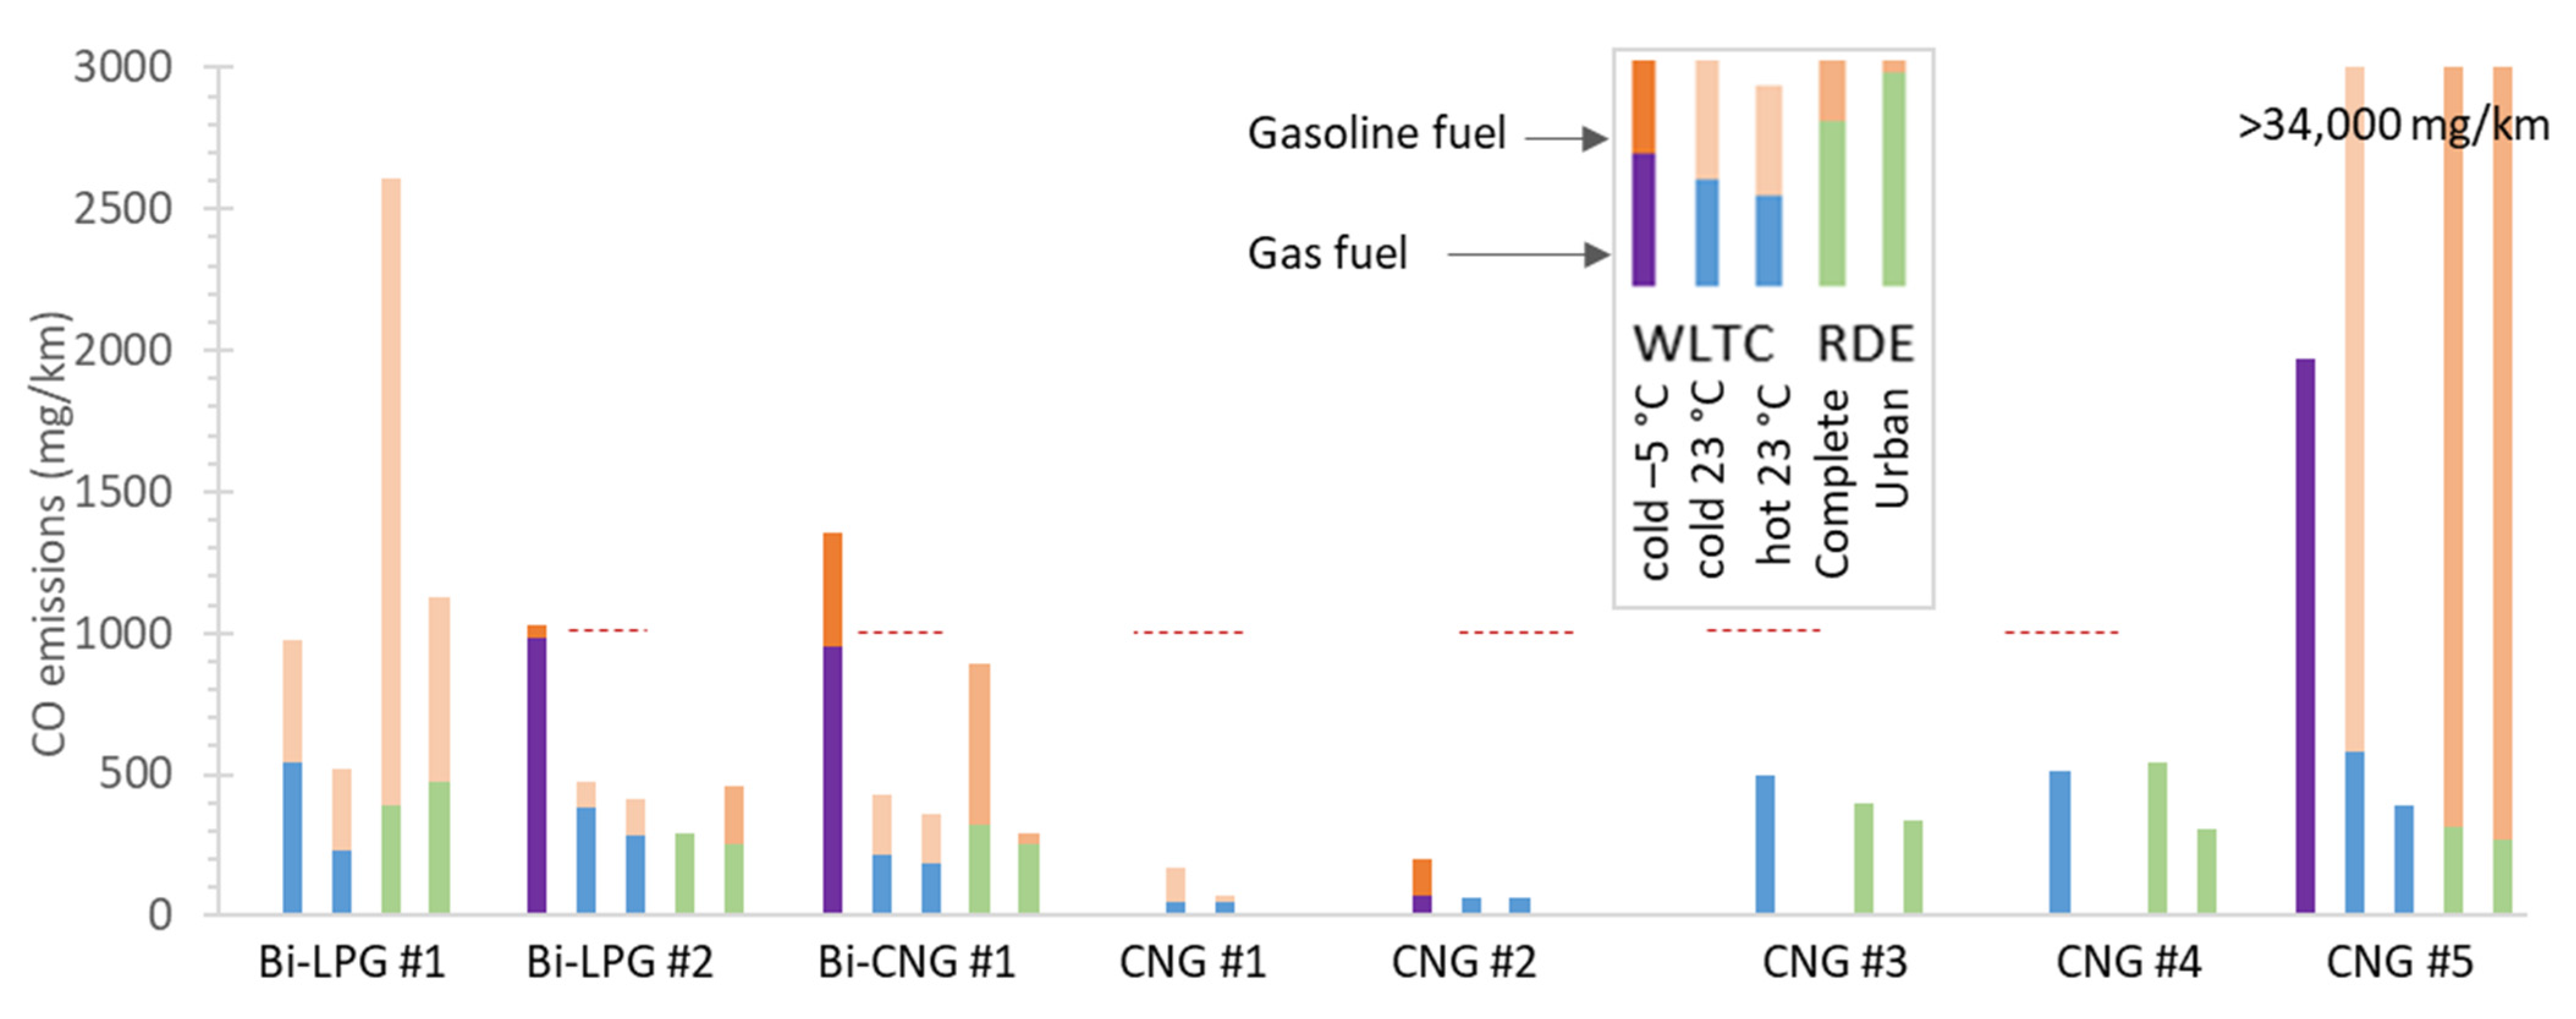
Figure 3 plots the CO emissions of the tested vehicles. For most vehicles in LPG/CNG modality, the levels were 300 to 500 mg/km at around 23 °C, double at sub-zero ambient temperatures for the LPG and CNG bi-fuel passenger cars and four times higher for the light commercial vehicle. The reason is the higher cold start emissions at lower ambient temperature. It should be remembered that Bi-LPG #2, Bi-CNG #1 and CNG #5 ignite with gasoline fuel, even in gas modality. CNG #1 and CNG #2 had extremely low emissions, even at sub-zero temperatures (<70 mg/km). The use of gasoline fuel resulted in higher CO emissions, but still <200 mg/km. For the Euro 6d-Temp bi-fuel vehicles, the increase with gasoline was rather small, exceeding 1000 mg/km only at the low temperature tests. For the Bi-LPG #1 Euro 6b vehicle the emissions were close to 1000 mg/km and higher at the complete RDE. The light commercial vehicle had extremely high emissions (34–41 g/km). These emissions are equivalent to 1.8–2.2 g/km of ozone considering 0.054 as maximum incremental reactivity (MIR) [62], or 65–78 g/km of CO2 using 1.9 as global warming potential (GWP) of CO [63]. On the other hand, a complete combustion would increase the CO2 emissions 53–64 g/km considering the molar weights of the two compounds.
The higher emissions of CO in gasoline modality are in agreement with the literature [19,38,40,42,58,61]. The gaseous phase of CNG as well as low boiling point and high vapor pressure of LPG suggest efficient air-fuel mixture formation and could explain the lower CO emissions in comparison to gasoline [6,14]. The highest differences were seen at the Euro 6b vehicles.
The engine of bi-fuel and mono-fuel CNG vehicles has a higher compression ratio than a conventional spark ignition gasoline engine, which means that the gasoline mode does not completely mimic the behavior of a typical gasoline engine. In order to avoid knocking, the manufacturer has to optimize the engine control unit (ECU) maps when the vehicle enters the gasoline mode. For the Euro 6b vehicles of this study it seems that the calibration was not optimized for conditions outside the homologation cycle (NEDC) or not at all for the mono-fuel CNG #5.
2.4. THC and NMHC
The results of the total hydrocarbons (THC) are summarized in Table 2. For the passenger cars the emission levels were 13 to 53 mg/km for the cold start WLTC at 23 °C and <10 mg/km for the hot start cycles in gas modality (except Bi-CNG #1). At low ambient temperature, the emission levels reached 269 mg/km (Bi-CNG #1), but stayed at only 27 mg/km for the CNG #2. In gasoline modality the emission levels were at similar levels with the gas modality at all temperatures and cycles. The light commercial vehicle CNG #5 had higher emissions (around 125 mg/km), which further increased at low temperature (230 mg/km) or in gasoline modality (994 mg/km). To put the results into perspective, the laboratory Euro 6 limit is 100 mg/km (160 mg/km for N1-III), applicable for the cycle NEDC until Euro 6b. There is no on-road limit for Euro 6b light-duty vehicles.
The passenger car non-methane hydrocarbons (NMHC) emissions were <38 mg/km in gas modality and <51 mg/km in gasoline modality. The light commercial vehicle had 43 mg/km NMHC emissions (Table 3). The emissions of all vehicles were elevated at low ambient temperatures reaching 185 mg/km for Bi-CNG #2. The NMHC limit is 68 mg/km (108 mg/km for N1-III), which was also fulfilled by all vehicles at 23 °C.
The results are consistent with other studies with Euro 6 vehicles, which found small THC emission differences between the two modalities [37,41]. However, CH4 might increase [19,64]. In our study, CH4 emissions can be calculated by subtracting NMHC from the THC (Table 2 and Table 3 respectively). For Bi-CNG #1, CNG #1, and CNG #2 in gaseous modality, most THC were CH4. The high challenge of converting CH4 at gas engines is well known [65,66]. Methane is not easy to be completely oxidized due to the high stability of the C–H bond, so its light-off temperature and conversion efficiency are important parameters. For the same removal efficiency of methane between gasoline and gas engines, under the same working conditions, more than three-fold loadings of noble metals are needed in comparison to conventional TWCs [66].
It should be mentioned that the CO2 equivalent of the CH4 emissions considering GWP of 30 were typically <0.5%, reaching 1.2% for CNG #3 and CNG #5, and 2.7% only for Bi-CNG #1 at low ambient temperatures. Therefore, the GHG savings are still beneficial compared to gasoline operation even when considering the CH4 contribution to the CO2.
2.5. Particle Number (PN)
Figure 4 summarizes the solid PN emissions of the tested vehicles. Current regulations define a lower size of 23 nm, but future regulations might implement a 10 nm lower size [67]. The color coding of Figure 4 is the same with the previous figures for the >23 nm PN emissions. Additionally, the light blue and grey colors show the >10 nm PN emissions for gas or gasoline fuel modalities respectively. To put the results into context, the current >23 nm limit is 6 × 10¹¹ #/km in the laboratory and 9 × 10¹¹ #/km on the road (CF = 1.5) [68] applicable to engines applying DI (CNG #2, #3, #4).
The >23 nm PN emissions varied significantly between the vehicles. In gas modality, CNG #1 had emissions <0.1 × 10¹¹ #/km, while CNG #5 and Bi-CNG #1 higher than 1 × 10¹¹ #/km, approaching the 6 × 10¹¹ #/km limit of diesel and gasoline direct injection vehicles. The contribution of sub-23 nm particles was also different for each vehicle. It was negligible for Bi-LPG #2 and CNG #3; added around 0.5 × 10¹¹ #/km for CNG #1, CNG #2, and CNG #4; and it was significant for Bi-CNG #1 and CNG #5, adding 2–13 × 1011 #/km, which had extremely high emissions in gasoline modality reaching 175 × 1011 #/km. The gasoline modality resulted in relatively high emissions with emissions levels 4 to 36 × 1011 #/km. The low ambient temperature resulted in higher emissions for the tested vehicles: in gas modality the PN emissions were 6–27 × 1011 #/km (except CNG #2 that remained at 0.4 × 10¹¹ #/km). In gasoline modality CNG #2 reached 7 × 10¹¹ #/km, Bi-LPG #2 reached 12 × 1011 #/km and Bi-CNG #1 reached 190 × 1011 #/km. More details in [46]. It is interesting to note that the gas DI vehicles (CNG #2, #3, #4) had lower emissions than the PFI ones (Bi-CNG #1 or Bi-LPG #1 and Bi-LPG #2). However, it should be kept in mind that the PFI ones were igniting the engine with gasoline fuel which contributed significantly to the higher emissions.
The results are in good agreement with other Euro 6b CNG vehicles [25,26,45,61] where the emissions were <1011 #/km, but reached 2 × 10¹¹ #/km at dynamic driving [25,26]. A study with a Euro 6b LPG vehicle reported PN emissions 1.8 × 10¹¹ #/km for a cold start RDE test, only 8 × 10⁹ #/km for a hot start RDE, but 6 × 10¹¹ #/km for a dynamic RDE [25]. A study with a Euro 6b vehicle that measured also <23 nm found that the emissions from around 3 × 10¹⁰ #/km (>23 nm) reached 5 × 10¹¹ #/km when 10–23 nm particles were included. The Euro 6d vehicle of that study reached 2 × 10¹¹ #/km, but the Euro 6d-Temp only 3 × 10¹⁰ #/km [26].
Low PN (and other gaseous pollutants) emissions of DI CNG engines, in particular compared to gasoline DI engines, have also been reported by others [32,69]. This is due to the higher H/C ratio, simpler molecular structure which reduce the probability of benzene ring and soot formation [69,70]. However, cold start and low temperatures can result in high concentrations of sub-23 nm particles due to unburnt hydrocarbons and lubricant additives [69]. Particles mostly <20 nm have been attributed to lubricant leaks through the valves [32].
2.6. Ammonia (NH3)
Table 4 summarizes the NH3 emissions for the vehicles where the data was available. The results are given as average concentration (in ppm) over the cycle and as mass emissions (in mg/km). The European regulation does not have any limits for NH3 except for heavy-duty vehicles (concentration limit 10 ppm averaged over the cycle). All vehicles exceeded the heavy-duty concentration limit of 10 ppm and only one vehicle (Bi-CNG #1) was close to it. In terms of distance specific mass emissions, the values ranged from 13 to 52 mg/km for the gas modality. The exception was one prototype vehicle, which was later tuned to decrease these levels. In gasoline modality, the emissions ranged from 7 to 16 mg/km. For the bi-fuel vehicles (Bi-LPG #2, Bi-CNG #1), the gasoline modality had slightly lower NH3 emissions than the gas modality. In all cases, lower ambient temperatures resulted in higher emissions.
The results are in good agreement with the literature for (older) CNG [71,72], LPG [73] and gasoline vehicles [74,75,76,77]. A study with Euro 6b CNG vehicles measured up to 45 mg/km, with one of the vehicles however emitting <10 mg/km. The slightly lower NH3 emissions in gasoline modality are also in agreement with older studies [19]. NH3 is mainly attributed to the reaction of nitrogen oxides (NOx) with hydrogenous components, including hydrogen, hydroxyl, water, and hydrocarbons, over a TWC. NH3 is mainly formed in the exhaust temperature range of 250−550 °C, and rich operating conditions [78]. Many studies discussed the role of exhaust gas temperature, NO, CO, lambda values, and catalyst age [70,79,80]. Regarding low ambient temperature tests, most studies found increased NH3 for gasoline vehicles [81,82,83], but there are no studies with CNG vehicles. One study reported <10 mg/km at −7°C for a Euro 6b vehicle over the NEDC [60]. However, there was no value for the 23 °C. Here we confirmed that the tendency is the same as with gasoline vehicles (i.e., more NH3 at lower ambient temperatures).
It should be mentioned that the NH3 emissions of the CNG vehicles were much higher than Euro 6d-Temp gasoline (10 mg/km) and Diesel (0 mg/km) vehicles [84]. NH3 is a relevant precursor of secondary aerosols in urban areas. Therefore, it is important to keep in mind this contribution when assessing the overall benefit of gas vehicles as compared to conventional gasoline/diesel cars.
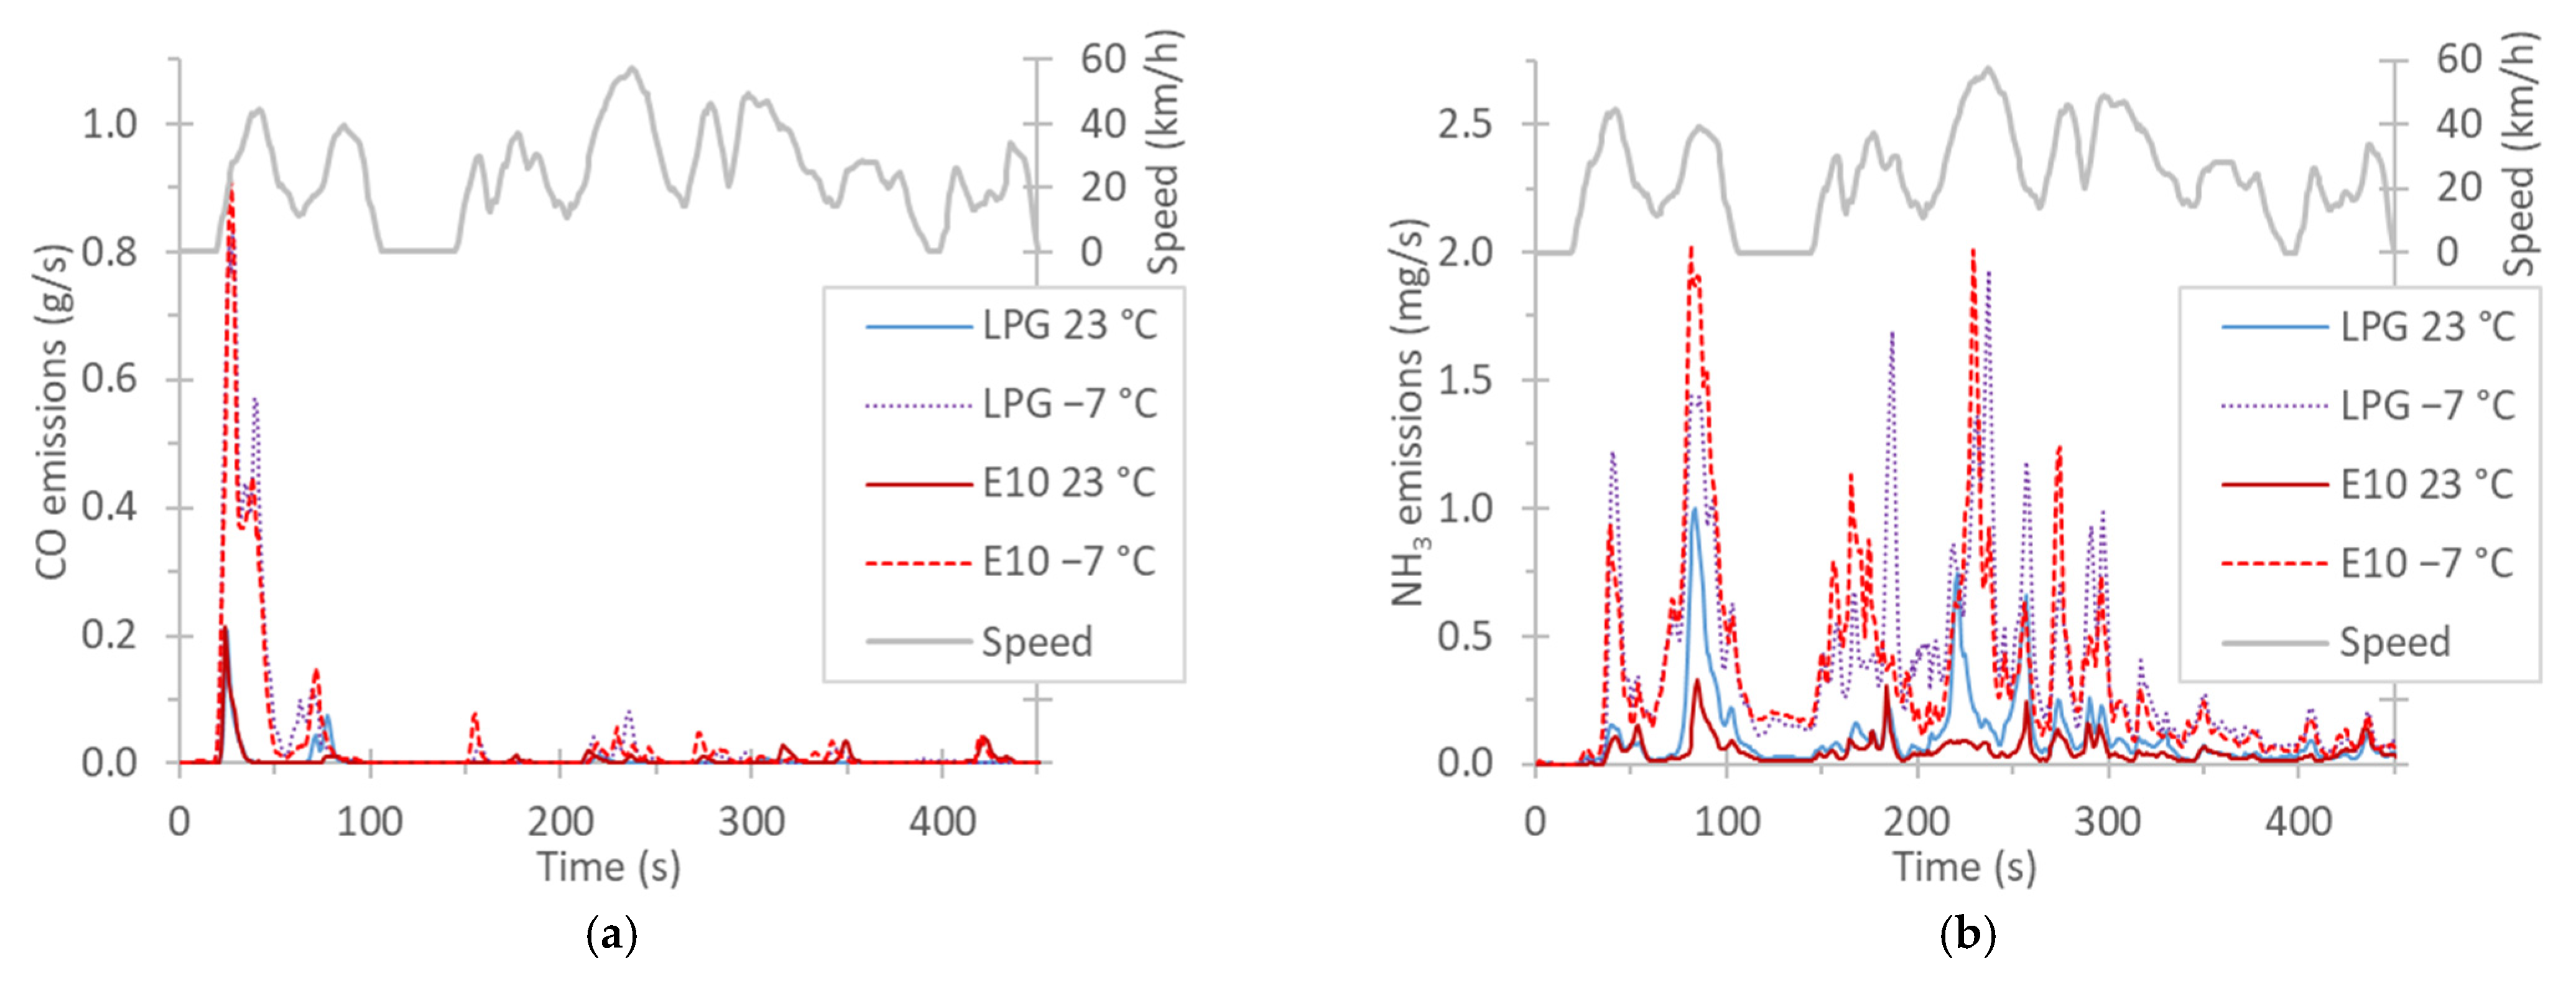
To better understand the impact of cold start and low ambient temperature on the emissions, Figure 5 plots the cold start emissions CO and NH3 at 23 °C and −7 °C of Bi-LPG #2. For CO the effect of the low temperature is clear. The similarity of LPG and E10 lines at the beginning is due to the fact that the ignition is done with gasoline even in the LPG modality. For NH3, the impact of low temperature is also evident, while the modality (gas or gasoline) is of lower importance.
3. Materials and Methods
In the regulations, “mono-fuel vehicles” are vehicles running primarily on one type of fuel. “Mono-fuel gas vehicles” are mono-fuel vehicles primarily running on LPG, natural gas, biomethane, or hydrogen. They may also have a gasoline (petrol) system for starting only or for emergency purposes. The gasoline fuel tank can contain up to 15 L of gasoline. “Bi-fuel vehicles” are vehicles with two separate fuel storage systems, but running primarily on only one fuel at a time. “Bi-fuel gas vehicles” are bi-fuel vehicles where the two fuels are gasoline (gasoline mode) and either LPG, natural gas, biomethane, or hydrogen. The key difference between the mono-fuel gas and bi-fuel vehicles operation is that in bi-fuel vehicles the driver is allowed to select the used fuel (gasoline or gaseous) while in mono-fuel gas vehicles engine is operated with gasoline only when the gaseous fuel is out of use. Bi-fuel engines should not be confused with dual-fuel engines, which can operate using a mixture of two different fuels (frequently, Diesel and natural gas).
3.1. Vehicles
Table 5 summarizes the technical characteristics of the tested vehicles. The vehicles were selected based on their availability and not on their market share. In 2019, Fiat had the highest market gas vehicles share, followed by the VW group [7]; thus, seven from the eight tested vehicles were from the two highest selling gas engine vehicles. All were passenger cars (M1), except the last one (CNG #5), which was a light commercial vehicle (N1, class III). The first three were bi-fuel gas vehicles, and the other five mono-fuel gas (CNG) vehicles. Three of the CNG mono-fuel vehicles (CNG #2, #3, #4) applied direct injection (DI) and the rest port fuel injection (PFI). All vehicles had three-way catalysts (TWC) as exhaust aftertreatment system and none of them had a gasoline particulate filter. One LPG bi-fuel and the light-commercial vehicle were Euro 6b, and the rest Euro 6d-Temp or prototypes aiming at Euro 6d. The prototype vehicles were developed in the GasOn project [85]. A major difference between Euro 6d-Temp and Euro 6b, is that the former standard requires compliance with NOx and PN emission limits also on the road. Thus, is it highly likely that the engine calibration and the sizing of the TWCs of the Euro 6b vehicles were designed to fulfill only the limits for their type approval cycle (NEDC). The Euro 6d-Temp vehicles were type approved with the WLTC (worldwide harmonized light vehicles test cycle) and on-road tests fulfilling the RDE regulation.
It should be emphasized that emission limits refer to primary fuels only. Bi-fuel vehicles must comply with the emissions limits with both fuels. Bi-fuel vehicles must have a prevalent modality, which is typically optimized in terms of emissions and fuel consumption. For the cases studied here, it was the gaseous (CNG or LPG). The mono-fuel vehicles have to comply to the emission limits only with their primary fuel, which was the CNG for the mono-fuel gas vehicles of our study. Any results with the gasoline reserve fuel of the mono-fuel vehicles are presented for completeness and research purposes, since this modality is not user selectable and is available only when the primary fuel is over for emergency reasons. Furthermore, the tank is small (<15 L) and the trip duration and/or distance in this modality should be short. Nevertheless, the emissions of such vehicles in gasoline mode should not be neglected, due to the rarity of CNG fueling stations and abundance of gasoline pumps [86], sometimes forcing such vehicles to run on gasoline. The use of gasoline during cranking and cold start is covered by the current regulations. However, the longer use of gasoline at lower ambient temperatures is adequately covered only with the introduction of RDE, which does not include the Euro 6b (or older) vehicles.
When the vehicles run with gasoline fuel, the term “gasoline modality” is used, while “gas modality” is used for CNG or LPG, as these fuels enter into the cylinder in the gaseous state. The terms CNG and LPG refer the status of the fuel in the tank.
3.2. Fuels
Market fuels were used in the tests. Main components of LPG are propane, propylene, butane, and ethane, in proportions varying regionally and seasonally [91]. Regulation (EU) 2017/1151 prescribes propane 30% (±2%) (Fuel A) or 85% (±2%) (Fuel B).
CNG, on the other hand, comprises mostly methane and lower proportions of heavier hydrocarbons and some sulfur compounds, in regionally and seasonally varying proportions [53]. A typical composition of commercial natural gas includes 85–96% methane. It also contains heavier hydrocarbons, such as ethane, propane, and butane, and inert diluents, such as N2 and CO2. Regulation (EU) 2017/1151 prescribes CH4 84–88%.
The gasoline fuel was market fuel E5 (i.e., <5% vol. ethanol) for the Euro 6b vehicles and E10 for the Euro 6d-Temp.
3.3. Instrumentation
The tests took place in two different vehicle emission laboratories (Vela 1 and Vela 2) of the Joint Research Centre (JRC) of the European Commission in Ispra, Italy. The chassis dynamometer of Vela 1 was the RPL 1220 from AVL Zöllner GmbH (Bensheim, Germany), and of Vela 2 the ECDM-48L 4 × 4 from AIP/Maha (Haldenwang, Germany). The gaseous and particulate emission measurements were conducted by sampling from the dilution tunnel with constant volume sampling (CVS). The CVS model of Vela 1 was CVS i60 LD from AVL (Graz, Austria), and of Vela 2 CVS 7400 from Horiba Ltd. (Kyoto, Japan). The gaseous compounds (CO2, CO, THC, NOx) were measured directly from CVS in real time and from bags with gas analyzer benches (AMAi60 D1 form AVL in Vela 1, and MEXA-7400 from Horiba in Vela 2). The particle counters were the APC 489 from AVL [92] in both labs, equipped with both 23 nm and 10 nm condensation particle counters (CPCs). They were equipped with a catalytic stripper [93].
Ammonia (NH3) was measured during laboratory tests with a Fourier transform infrared (FTIR) spectrometer from AVL (Sesam with a Nicolet Antaris IGS Analyzer—Thermo Electron Scientific Instruments LLC) [94]. The instrument was connected to the tailpipe with a 4 m heated polytetrafluoroethylene (PTFE) sampling line (191 °C).
3.4. Test Cycles
Some of the vehicles have been tested at various test cycles and modifications under the market surveillance project [57,96,97,98] or the boundaries impact project [99]. The prototypes were tested under the GasOn project [85]. One vehicle was tested to assess the impact of lubricants on particle emissions and others to assess the particle emissions below 23 nm [46,100]. Here, the results of the cycles conducted with all vehicles will be presented. Table 6 gives an overview of the test parameters and the tests that were conducted for each vehicle.
The laboratory test cycle was the worldwide light vehicles test cycle (WLTC) with cold engine (i.e., coolant temperature within 2 °C from the ambient temperature) or hot engine (i.e., coolant temperature >70°C). The ambient temperature was 23 °C (±2 °C) or −5 °C (±1.5 °C). The low ambient temperature tests are abbreviated as “Cold −5 °C” in the graphs. The cycle reaches the top speed of 131 km/h but CNG #5 when tested at reserve gasoline fuel could only reach speed up to 90 km/h. The cycle was not modified, but practically it meant constant speed driving for the last two parts of the cycle.
The on-road tests were conducted at the premises of JRC and fulfilled the real-driving emissions (RDE) regulation. The on-board instrument was the MOVE from AVL (Graz, Austria) measuring PN, NOx, CO, and CO2 from the tailpipe of the vehicles. Two routes were driven (RDE1 and RDE2), both compliant to the regulation and treated equivalently in the analysis of the data. The urban and complete trip distances were 32–26 km and 79–94 km, respectively. Details of the routes can be found elsewhere [57,96,97,98].
4. Conclusions
The emissions of mono-fuel CNG and bi-fuel CNG and LPG vehicles fulfilling Euro 6b and Euro 6d-Temp emission standards were presented. The tests included on-road routes fulfilling the real-driving emissions regulation and laboratory worldwide harmonized light vehicles test cycles with cold or hot engine at 23 °C or −7 °C. The measured CO2 emissions were typically within ±15% of the declared values. The gas modality had 8–23% lower CO2 emissions than the gasoline modality, with the highest differences for the mono-fuel vehicles which was probably optimized. The low ambient temperature tests increased 5–9% the CO2 emissions.
The NOx emissions ranged from 3 to 24 mg/km with minor differences between gas and gasoline modalities and negligible effect of the ambient temperature or the on-road driving. The exception was the Euro 6b light commercial vehicle that emitted >300 mg/km NOx at all tested conditions. Similarly, for THC, gas and gasoline modalities gave similar emissions. Significant increases were noted with the low ambient temperature tests. The CO2 equivalent of CH4 was typically <0.5% reaching 1.2% in a few cases. The NH3 emissions were typically <45 mg/km without significant differences between gasoline and gas modalities; slightly lower in gasoline modality for the two vehicles that data were available for both modalities. They were though on average higher than gasoline and diesel vehicles.
The CO emissions were below 500 mg/km (i.e., half of the limit) in gas modality, but double at the low ambient temperature tests. The emissions more than doubled in gasoline modality for the Euro 6b vehicles, and increased around 50% for the Euro 6d-Temp vehicles which remained well below 1000 mg/km. Similarly, for PN the gasoline modality had higher emissions than the gas modality, in some cases exceeded by far the current limit for direct injection engines (6 × 10¹¹ #/km), although not applicable to the port fuel injection engines of this study.
In general, and particularly focusing on the bi-fuel passenger cars, where the driver can select the fuel, the gasoline modality increased the emissions of CO2, CO, and PN, without any decreases at NOx, THC, or NH3. The increases were higher for the Euro 6b passenger car. Particularly for the Euro 6b mono-fuel CNG light commercial vehicle, running in reserve gasoline fuel resulted in extremely high emissions (CO, THC, PN, and NH3). The increases for the Euro 6d-Temp passenger cars were relatively small, and all emissions were within the applicable emission limits.
The results of this study highlighted the need of better control of the NH3 emissions of future gas vehicles. CH4 and sub-23 nm particles seem to be less of an issue but monitoring of these pollutants should continue. What was not investigated here and should be assessed in future studies are the thermal stability and resistance against chemical aging of the catalyst.
Author Contributions
Formal analysis, B.G., T.L., M.C. and R.S.-B.; writing—original draft preparation, B.G.; writing—review and editing, T.L., M.C., R.S.-B., V.V., A.D.M., T.S. and P.B. All authors have read and agreed to the published version of the manuscript.
Funding
This research received no external funding.
Data Availability Statement
Data are available upon request from the corresponding author.
Acknowledgments
The authors would like to acknowledge the laboratories staff. Special acknowledgments to Biagio Ciuffo for his contribution to the vehicle procurement.
Conflicts of Interest
The authors declare no conflict of interest.
References
- European Environment Agency. The First and Last Mile: The Key to Sustainable Urban Transport: Transport and Environment Report 2019; Publications Office of the European Union: Luxembourg, 2020. [Google Scholar]
- Millinger, M.; Meisel, K.; Budzinski, M.; Thrän, D. Relative greenhouse gas abatement cost competitiveness of biofuels in Germany. Energies 2018, 11, 615. [Google Scholar] [CrossRef] [Green Version]
- Orecchini, F.; Santiangeli, A.; Zuccari, F. Biomethane use for automobiles towards a CO2-neutral energy system. Clean Energy 2021, 5, 124–140. [Google Scholar] [CrossRef]
- Cucchiella, F.; D’Adamo, I.; Gastaldi, M. Sustainable Italian cities: The added value of biomethane from organic waste. Appl. Sci. 2019, 9, 2221. [Google Scholar] [CrossRef] [Green Version]
- Cignini, F.; Genovese, A.; Ortenzi, F.; Valentini, S.; Caprioli, A. Performance and emissions comparison between biomethane and natural gas fuel in passenger vehicles. E3S Web Conf. 2020, 197, 08019. [Google Scholar] [CrossRef]
- Bae, C.; Kim, J. Alternative fuels for internal combustion engines. Proc. Combust. Inst. 2017, 36, 3389–3413. [Google Scholar] [CrossRef]
- ICCT European Vehicle Market Statistics. Pocketbook 2020/2021. International Council on Clean Transportation Europe, Berlin, Germany, 2021. Available online: http://eupocketbook.theicct.org (accessed on 6 June 2022).
- Acosta, S. City Buses Going Nowhere: Scientists Warn That Investing in Gas Today Is a Mistake. Available online: https://www.eldiario.es/ballenablanca/crisis_climatica/city-buses-going-nowhere-scientists-warn-that-investing-in-gas-today-is-mistake_130_8941988.html (accessed on 6 June 2022).
- Milojević, S.; Pesic, R. Benefit and Restrictions Related to the Application of Natural Gas as Engine Fuel for City Buses. In Proceedings of the 13th International Conference on Clean Energy, Istanbul, Turkey, 8–12 June 2014. [Google Scholar]
- Hall, J.; Bassett, M.; Hibberd, B.; Streng, S. Heavily downsized demonstrator engine optimised for CNG operation. SAE Int. J. Engines 2016, 9, 2250–2261. [Google Scholar] [CrossRef]
- Hagos, D.A.; Ahlgren, E.O. Well-to-wheel assessment of natural gas vehicles and their fuel supply infrastructures—Perspectives on gas in transport in Denmark. Transp. Res. Part D Transp. Environ. 2018, 65, 14–35. [Google Scholar] [CrossRef]
- Yang, C.; Li, W.; Yin, J.; Shen, Y. Port Fuel Injection of CNG for Downsized 1-Liter 3-Cylinder Turbocharged Engine with High Efficiency; Technical Paper no. 2017-01–2275; SAE International: Warrendale, PA, USA, 2017. [Google Scholar] [CrossRef]
- Bieker, G. A Global Comparison of the Life-Cycle Greenhouse Gas Emissions of Combustion Engine and Electric Passenger Cars; International Council on Clean Transportation Europe: Berlin, Germany, 2021. [Google Scholar]
- Chen, H.; He, J.; Zhong, X. Engine combustion and emission fuelled with natural gas: A review. J. Energy Inst. 2019, 92, 1123–1136. [Google Scholar] [CrossRef]
- Huang, X.; Wang, Y.; Xing, Z.; Du, K. Emission factors of air pollutants from CNG-gasoline bi-fuel vehicles: Part II. CO, HC and NOx. Sci. Total Environ. 2016, 565, 698–705. [Google Scholar] [CrossRef]
- Biernat, K.; Samson-Bręk, I.; Chłopek, Z.; Owczuk, M.; Matuszewska, A. Assessment of the environmental impact of using methane fuels to supply internal combustion engines. Energies 2021, 14, 3356. [Google Scholar] [CrossRef]
- Zhu, H.; Mc Caffery, C.; Yang, J.; Li, C.; Karavalakis, G.; Johnson, K.C.; Durbin, T.D. Characterizing emission rates of regulated and unregulated pollutants from two ultra-low NOx CNG heavy-duty vehicles. Fuel 2020, 277, 118192. [Google Scholar] [CrossRef]
- Karavalakis, G.; Hajbabaei, M.; Durbin, T.D.; Johnson, K.C.; Zheng, Z.; Miller, W.J. The effect of natural gas composition on the regulated emissions, gaseous toxic pollutants, and ultrafine particle number emissions from a refuse hauler vehicle. Energy 2013, 50, 280–291. [Google Scholar] [CrossRef]
- Bielaczyc, P.; Szczotka, A.; Woodburn, J. Regulated and unregulated exhaust emissions from CNG fueled vehicles in light of euro 6 regulations and the new WLTP/GTR 15 test procedure. SAE Int. J. Engines 2015, 8, 1300–1312. [Google Scholar] [CrossRef]
- Żółtowski, A.; Gis, W. Ammonia emissions in SI engines fueled with LPG. Energies 2021, 14, 691. [Google Scholar] [CrossRef]
- Elser, M.; El-Haddad, I.; Maasikmets, M.; Bozzetti, C.; Wolf, R.; Ciarelli, G.; Slowik, J.G.; Richter, R.; Teinemaa, E.; Hüglin, C.; et al. High contributions of vehicular emissions to ammonia in three european cities derived from mobile measurements. Atmos. Environ. 2018, 175, 210–220. [Google Scholar] [CrossRef]
- Xie, C.; Toops, T.; Lance, M.; Qu, J.; Viola, M.; Lewis, S.; Leonard, D.; Hagaman, E. Impact of lubricant additives on the physicochemical properties and activity of three-way catalysts. Catalysts 2016, 6, 54. [Google Scholar] [CrossRef] [Green Version]
- Wang, M.; Dimopoulos Eggenschwiler, P.; Franken, T.; Agote-Arán, M.; Ferri, D.; Kröcher, O. Investigation on the role of Pd, Pt, Rh in methane abatement for heavy duty applications. Catalysts 2022, 12, 373. [Google Scholar] [CrossRef]
- Kokka, A.; Ramantani, T.; Panagiotopoulou, P. Effect of operating conditions on the performance of Rh/TiO2 catalyst for the reaction of LPG steam reforming. Catalysts 2021, 11, 374. [Google Scholar] [CrossRef]
- Kontses, A.; Triantafyllopoulos, G.; Ntziachristos, L.; Samaras, Z. Particle number (PN) emissions from gasoline, diesel, LPG, CNG and hybrid-electric light-duty vehicles under real-world driving conditions. Atmos. Environ. 2020, 222, 117126. [Google Scholar] [CrossRef]
- Toumasatos, Z.; Kontses, A.; Doulgeris, S.; Samaras, Z.; Ntziachristos, L. Particle emissions measurements on CNG vehicles focusing on Sub-23nm. Aerosol Sci. Technol. 2021, 55, 182–193. [Google Scholar] [CrossRef]
- Samaras, Z.C.; Andersson, J.; Bergmann, A.; Hausberger, S.; Toumasatos, Z.; Keskinen, J.; Haisch, C.; Kontses, A.; Ntziachristos, L.D.; Landl, L.; et al. Measuring Automotive Exhaust Particles Down to 10 nm; Technical Paper no 2020-01–2209; SAE International: Warrendale, PA, USA, 2020. [Google Scholar] [CrossRef]
- Giechaskiel, B. Solid particle number emission factors of euro VI heavy-duty vehicles on the road and in the laboratory. Int. J. Environ. Res. Public Health 2018, 15, 304. [Google Scholar] [CrossRef] [PubMed] [Green Version]
- Alanen, J.; Saukko, E.; Lehtoranta, K.; Murtonen, T.; Timonen, H.; Hillamo, R.; Karjalainen, P.; Kuuluvainen, H.; Harra, J.; Keskinen, J.; et al. The formation and physical properties of the particle emissions from a natural gas engine. Fuel 2015, 162, 155–161. [Google Scholar] [CrossRef]
- Alanen, J.; Simonen, P.; Saarikoski, S.; Timonen, H.; Kangasniemi, O.; Saukko, E.; Hillamo, R.; Lehtoranta, K.; Murtonen, T.; Vesala, H.; et al. Comparison of primary and secondary particle formation from natural gas engine exhaust and of their volatility characteristics. Atmos. Chem. Phys. 2017, 17, 8739–8755. [Google Scholar] [CrossRef] [Green Version]
- Lehtoranta, K.; Murtonen, T.; Vesala, H.; Koponen, P.; Alanen, J.; Simonen, P.; Rönkkö, T.; Timonen, H.; Saarikoski, S.; Maunula, T.; et al. Natural gas engine emission reduction by catalysts. Emiss. Control Sci. Technol. 2017, 3, 142–152. [Google Scholar] [CrossRef]
- Catapano, F.; di Iorio, S.; Sementa, P.; Vaglieco, B.M. Particle Formation and Emissions in An Optical Small Displacement SI Engine Dual Fueled with CNG DI and Gasoline PFI; Technical Paper no. 2017-24–0092; SAE International: Warrendale, PA, USA, 2017. [Google Scholar] [CrossRef]
- Yao, Z.; Cao, X.; Shen, X.; Zhang, Y.; Wang, X.; He, K. On-road emission characteristics of CNG-fueled bi-fuel taxis. Atmos. Environ. 2014, 94, 198–204. [Google Scholar] [CrossRef]
- Lejda, K.; Jaworski, A.; Mądziel, M.; Balawender, K.; Ustrzycki, A.; Savostin-Kosiak, D. Assessment of petrol and natural gas vehicle carbon oxides emissions in the laboratory and on-road tests. Energies 2021, 14, 1631. [Google Scholar] [CrossRef]
- Ghaffarpasand, O.; Talaie, M.R.; Ahmadikia, H.; TalaieKhozani, A.; Shalamzari, M.D.; Majidi, S. On-road performance and emission characteristics of CNG-gasoline bi-fuel taxis/private cars at the roadside environment. Atmos. Pollut. Res. 2020, 11, 1743–1753. [Google Scholar] [CrossRef]
- Meccariello, G.; della Ragione, L.; Prati, M.V.; Costagliola, M.A.; Saccoccia, V. Real time emissive behaviour of a bi-fuel euro 4 SI Car in Naples urban area. SAE Int. J. Fuels Lubr. 2013, 6, 959–967. [Google Scholar] [CrossRef]
- Šarkan, B.; Jaśkiewicz, M.; Kubiak, P.; Tarnapowicz, D.; Loman, M. Exhaust emissions measurement of a vehicle with retrofitted LPG system. Energies 2022, 15, 1184. [Google Scholar] [CrossRef]
- Adam, T.W.; Astorga, C.; Clairotte, M.; Duane, M.; Elsasser, M.; Krasenbrink, A.; Larsen, B.R.; Manfredi, U.; Martini, G.; Montero, L.; et al. Chemical analysis and ozone formation potential of exhaust from dual-fuel (liquefied petroleum gas/gasoline) light duty vehicles. Atmos. Environ. 2011, 45, 2842–2848. [Google Scholar] [CrossRef]
- Pielecha, J.; Merkisz, J.; Jasiński, R.; Gis, W. Real Driving Emissions Testing of Vehicles Powered by Compressed Natural Gas; Technical Paper no. 2015-01–2022; SAE International: Warrendale, PA, USA, 2015. [Google Scholar] [CrossRef]
- Bielaczyc, P.; Woodburn, J.; Szczotka, A. An assessment of regulated emissions and CO2 emissions from a european light-duty CNG-fueled vehicle in the context of euro 6 emissions regulations. Appl. Energy 2014, 117, 134–141. [Google Scholar] [CrossRef]
- Bielaczyc, P.; Szczotka, A.; Woodburn, J. A Comparison of exhaust emissions from vehicles fuelled with petrol, LPG and CNG. IOP Conf. Ser. Mater. Sci. Eng. 2016, 148, 012060. [Google Scholar] [CrossRef] [Green Version]
- Rašić, D.; Rodman Oprešnik, S.; Seljak, T.; Vihar, R.; Baškovič, U.Ž.; Wechtersbach, T.; Katrašnik, T. RDE-based assessment of a factory bi-fuel CNG/gasoline light-duty vehicle. Atmos. Environ. 2017, 167, 523–541. [Google Scholar] [CrossRef]
- Dimaratos, A.; Toumasatos, Z.; Doulgeris, S.; Triantafyllopoulos, G.; Kontses, A.; Samaras, Z. Assessment of CO2 and NOx emissions of one diesel and one bi-fuel gasoline/CNG euro 6 vehicles during real-world driving and laboratory testing. Front. Mech. Eng. 2019, 5, 62. [Google Scholar] [CrossRef] [Green Version]
- Jaworski, A.; Lejda, K.; Lubas, J.; Mądziel, M. Comparison of exhaust emission from euro 3 and euro 6 motor vehicles fueled with petrol and LPG based on real driving conditions. Combust. Engines 2019, 178, 106–111. [Google Scholar] [CrossRef]
- Dimopoulos Eggenschwiler, P.; Schreiber, D.; Schröter, K. Characterization of the emission of particles larger than 10 nm in the exhaust of modern gasoline and CNG light duty vehicles. Fuel 2021, 291, 120074. [Google Scholar] [CrossRef]
- Lähde, T.; Giechaskiel, B. Particle number emissions of gasoline, compressed natural gas (CNG) and liquefied petroleum gas (LPG) fueled vehicles at different ambient temperatures. Atmosphere 2021, 12, 893. [Google Scholar] [CrossRef]
- Giechaskiel, B.; Lähde, T.; Gandi, S.; Keller, S.; Kreutziger, P.; Mamakos, A. Assessment of 10-nm particle number (PN) portable emissions measurement systems (PEMS) for future regulations. Int. J. Environ. Res. Public Health 2020, 17, 3878. [Google Scholar] [CrossRef]
- Giechaskiel, B.; Mamakos, A.; Woodburn, J.; Szczotka, A.; Bielaczyc, P. Evaluation of a 10 nm particle number portable emissions measurement system (PEMS). Sensors 2019, 19, 5531. [Google Scholar] [CrossRef] [Green Version]
- Vojtíšek-Lom, M.; Beránek, V.; Klír, V.; Jindra, P.; Pechout, M.; Voříšek, T. On-road and laboratory emissions of NO, NO2, NH3, N2O and CH4 from late-model EU light utility vehicles: Comparison of diesel and CNG. Sci. Total Environ. 2018, 616–617, 774–784. [Google Scholar] [CrossRef]
- Pavlovic, J.; Marotta, A.; Ciuffo, B.; Serra, S.; Fontaras, G.; Anagnostopoulos, K.; Tsiakmakis, S.; Arcidiacono, V.; Hausberger, S.; Silberholz, G. Correction of test cycle tolerances: Evaluating the impact on CO2 results. Transp. Res. Procedia 2016, 14, 3099–3108. [Google Scholar] [CrossRef]
- Tsiakmakis, S.; Fontaras, G.; Ciuffo, B.; Samaras, Z. A simulation-based methodology for quantifying european passenger car fleet CO2 emissions. Appl. Energy 2017, 199, 447–465. [Google Scholar] [CrossRef]
- Pavlovic, J.; Ciuffo, B.; Fontaras, G.; Valverde, V.; Marotta, A. How much difference in type-approval CO2 emissions from passenger cars in europe can be expected from changing to the new test procedure (NEDC vs. WLTP)? Transp. Res. Part A Policy Pract. 2018, 111, 136–147. [Google Scholar] [CrossRef]
- Kakaee, A.-H.; Paykani, A.; Ghajar, M. The influence of fuel composition on the combustion and emission characteristics of natural gas fueled engines. Renew. Sustain. Energy Rev. 2014, 38, 64–78. [Google Scholar] [CrossRef]
- Karavalakis, G.; Durbin, T.D.; Villela, M.; Miller, J.W. Air pollutant emissions of light-duty vehicles operating on various natural gas compositions. J. Nat. Gas Sci. Eng. 2012, 4, 8–16. [Google Scholar] [CrossRef]
- Chatzipanagi, A.; Pavlovic, J.; Ktistakis, M.A.; Komnos, D.; Fontaras, G. Evolution of European light-duty vehicle CO2 Emissions based on recent certification datasets. Transp. Res. Part D Transp. Environ. 2022, 107, 103287. [Google Scholar] [CrossRef]
- Suarez-Bertoa, R.; Astorga, C. Impact of cold temperature on euro 6 passenger car emissions. Environ. Pollut. 2018, 234, 318–329. [Google Scholar] [CrossRef]
- Clairotte, M.; Valverde, V.; Bonnel, P.; Giechaskiel, P.; Carriero, M.; Otura, M.; Fontaras, G.; Suarez Bertoa, R.; Martini, G.; Krasenbrink, A.; et al. Joint Research Centre 2019 Light-Duty Vehicles Emissions Testing: Contribution to the EU Market Surveillance: Testing Protocols and Vehicle Emissions Performance; Publications Office of the European Union: Luxembourg, 2020; ISBN 978-92-76-26951-9. [Google Scholar]
- Jahirul, M.I.; Masjuki, H.H.; Saidur, R.; Kalam, M.A.; Jayed, M.H.; Wazed, M.A. Comparative engine performance and emission analysis of CNG and gasoline in a retrofitted car engine. Appl. Therm. Eng. 2010, 30, 2219–2226. [Google Scholar] [CrossRef]
- Ristovski, Z.D.; Jayaratne, E.R.; Morawska, L.; Ayoko, G.A.; Lim, M. Particle and carbon dioxide emissions from passenger vehicles operating on unleaded petrol and LPG fuel. Sci. Total Environ. 2005, 345, 93–98. [Google Scholar] [CrossRef] [Green Version]
- Aakko-Saksa, P.; Koponen, P.; Roslund, P.; Laurikko, J.; Nylund, N.-O.; Karjalainen, P.; Rönkkö, T.; Timonen, H. Comprehensive emission characterisation of exhaust from alternative fuelled cars. Atmos. Environ. 2020, 236, 117643. [Google Scholar] [CrossRef]
- Dimaratos, A.; Toumasatos, Z.; Triantafyllopoulos, G.; Kontses, A.; Samaras, Z. Real-world gaseous and particle emissions of a bi-fuel gasoline/CNG euro 6 passenger car. Transp. Res. Part D Transp. Environ. 2020, 82, 102307. [Google Scholar] [CrossRef]
- Carter, W.P.L. Development of ozone reactivity scales for volatile organic compounds. Air Waste 1994, 44, 881–899. [Google Scholar] [CrossRef] [Green Version]
- Intergovernmental Panel on Climate Change. Climate Change 2007: The Physical Science Basis: Contribution of Working Group I to the Fourth Assessment Report of the Intergovernmental Panel on Climate Change; Solomon, S., Ed.; Cambridge University Press: Cambridge, NY, USA, 2007; ISBN 978-0-521-88009-1. [Google Scholar]
- Clairotte, M.; Suarez-Bertoa, R.; Zardini, A.A.; Giechaskiel, B.; Pavlovic, J.; Valverde, V.; Ciuffo, B.; Astorga, C. Exhaust emission factors of greenhouse gases (GHGs) from European road vehicles. Environ. Sci. Eur. 2020, 32, 125. [Google Scholar] [CrossRef]
- Raj, B.A. Methane emission control. Johns. Matthey Technol. Rev. 2016, 60, 228–235. [Google Scholar] [CrossRef]
- Huang, C.; Shan, W.; Lian, Z.; Zhang, Y.; He, H. Recent advances in three-way catalysts of natural gas vehicles. Catal. Sci. Technol. 2020, 10, 6407–6419. [Google Scholar] [CrossRef]
- Giechaskiel, B.; Melas, A.; Martini, G.; Dilara, P. Overview of vehicle exhaust particle number regulations. Processes 2021, 9, 2216. [Google Scholar] [CrossRef]
- Giechaskiel, B.; Bonnel, P.; Perujo, A.; Dilara, P. Solid particle number (SPN) portable emissions measurement systems (PEMS) in the European legislation: A review. Int. J. Environ. Res. Public Health 2019, 16, 4819. [Google Scholar] [CrossRef] [Green Version]
- Melaika, M.; Etikyala, S.; Dahlander, P. Particulates from a CNG DI SI Engine during Warm-Up; Technical Paper no. 2021-01–0630; SAE International: Warrendale, PA, USA, 2021. [Google Scholar]
- Karavalakis, G.; Hajbabaei, M.; Jiang, Y.; Yang, J.; Johnson, K.C.; Cocker, D.R.; Durbin, T.D. Regulated, greenhouse gas, and particulate emissions from lean-burn and stoichiometric natural gas heavy-duty vehicles on different fuel compositions. Fuel 2016, 175, 146–156. [Google Scholar] [CrossRef] [Green Version]
- Suarez-Bertoa, R.; Pechout, M.; Vojtíšek, M.; Astorga, C. Regulated and non-regulated emissions from euro 6 diesel, gasoline and CNG vehicles under real-world driving conditions. Atmosphere 2020, 11, 204. [Google Scholar] [CrossRef] [Green Version]
- Borsari, V.; de Assunção, J.V. Ammonia Emissions from a light-duty vehicle. Transp. Res. Part D Transp. Environ. 2017, 51, 53–61. [Google Scholar] [CrossRef]
- Bielaczyc, P.; Szczotka, A.; Swiatek, A.; Woodburn, J. A comparison of ammonia emission factors from light-duty vehicles operating on gasoline, liquefied petroleum gas (LPG) and compressed natural gas (CNG). SAE Int. J. Fuels Lubr. 2012, 5, 751–759. [Google Scholar] [CrossRef]
- Farren, N.J.; Davison, J.; Rose, R.A.; Wagner, R.L.; Carslaw, D.C. Underestimated ammonia emissions from road vehicles. Environ. Sci. Technol. 2020, 54, 15689–15697. [Google Scholar] [CrossRef] [PubMed]
- Suarez-Bertoa, R.; Astorga, C. Isocyanic acid and ammonia in vehicle emissions. Transp. Res. Part D Transp. Environ. 2016, 49, 259–270. [Google Scholar] [CrossRef]
- Suarez-Bertoa, R.; Mendoza-Villafuerte, P.; Riccobono, F.; Vojtisek, M.; Pechout, M.; Perujo, A.; Astorga, C. On-road measurement of NH3 emissions from gasoline and diesel passenger cars during real world driving conditions. Atmos. Environ. 2017, 166, 488–497. [Google Scholar] [CrossRef]
- Abualqumboz, M.S.; Martin, R.S.; Thomas, J. On-road tailpipe characterization of exhaust ammonia emissions from in-use light-duty gasoline motor vehicles. Atmos. Pollut. Res. 2022, 13, 101449. [Google Scholar] [CrossRef]
- Wang, C.; Tan, J.; Harle, G.; Gong, H.; Xia, W.; Zheng, T.; Yang, D.; Ge, Y.; Zhao, Y. Ammonia formation over Pd/Rh three-way catalysts during lean-to-rich fluctuations: The effect of the catalyst aging, exhaust temperature, lambda, and duration in rich conditions. Environ. Sci. Technol. 2019, 53, 12621–12628. [Google Scholar] [CrossRef]
- Czerwinski, J.; Heeb, N.; Zimmerli, Y.; Forss, A.-M.; Hilfiker, T.; Bach, C. Unregulated emissions with TWC, gasoline & CNG. SAE Int. J. Engines 2010, 3, 1099–1112. [Google Scholar] [CrossRef] [Green Version]
- Zhang, Q.; Li, M.; Shao, S.; Li, G. Ammonia emissions of a natural gas engine at the stoichiometric operation with TWC. Appl. Therm. Eng. 2018, 130, 1363–1372. [Google Scholar] [CrossRef]
- Selleri, T.; Melas, A.; Bonnel, P.; Suarez-Bertoa, R. NH3 and CO emissions from fifteen euro 6d and euro 6d-TEMP gasoline-fuelled vehicles. Catalysts 2022, 12, 245. [Google Scholar] [CrossRef]
- Liu, Y.; Ge, Y.; Tan, J.; Wang, H.; Ding, Y. Research on ammonia emissions characteristics from light-duty gasoline vehicles. J. Environ. Sci. 2021, 106, 182–193. [Google Scholar] [CrossRef]
- Clairotte, M.; Adam, T.W.; Zardini, A.A.; Manfredi, U.; Martini, G.; Krasenbrink, A.; Vicet, A.; Tournié, E.; Astorga, C. Effects of low temperature on the cold start gaseous emissions from light duty vehicles fuelled by ethanol-blended gasoline. Appl. Energy 2013, 102, 44–54. [Google Scholar] [CrossRef]
- De Meij, A.; Astorga, C.; Thunis, P.; Crippa, M.; Guizzardi, D.; Pisoni, E.; Valverde, V.; Suarez-Bertoa, R.; Oreggioni, G.D.; Mahiques, O.; et al. Modelling the impact of the introduction of the EURO 6d-TEMP/6d regulation for light-duty vehicles on EU air quality. Appl. Sci. 2022, 12, 4257. [Google Scholar] [CrossRef]
- GasOn Horizon 2020 EU Research and Innovation Programme, under Grant Agreement No. 65281. 2019. Available online: http://www.gason.eu (accessed on 6 June 2022).
- Chala, G.; Abd Aziz, A.; Hagos, F. Natural gas engine technologies: Challenges and energy sustainability issue. Energies 2018, 11, 2934. [Google Scholar] [CrossRef] [Green Version]
- Giuliano, M.; Valsania, M.C.; Ticali, P.; Sartoretti, E.; Morandi, S.; Bensaid, S.; Ricchiardi, G.; Sgroi, M. Characterization of the evolution of noble metal particles in a commercial three-way catalyst: Correlation between real and simulated ageing. Catalysts 2021, 11, 247. [Google Scholar] [CrossRef]
- Kanerva, T.; Honkanen, M.; Kolli, T.; Heikkinen, O.; Kallinen, K.; Saarinen, T.; Lahtinen, J.; Olsson, E.; Keiski, R.L.; Vippola, M. Microstructural characteristics of vehicle-aged heavy-duty diesel oxidation catalyst and natural gas three-way catalyst. Catalysts 2019, 9, 137. [Google Scholar] [CrossRef] [Green Version]
- Nakayama, H.; Nagata, M.; Abe, H.; Shimizu, Y. In situ TEM study of Rh particle sintering for three-way catalysts in high temperatures. Catalysts 2020, 11, 19. [Google Scholar] [CrossRef]
- Zheng, Q.; Farrauto, R.; Deeba, M. Part II: Oxidative thermal aging of Pd/Al2O3 and Pd/CexOy-ZrO2 in automotive three way catalysts: The effects of fuel shutoff and attempted fuel rich regeneration. Catalysts 2015, 5, 1797–1814. [Google Scholar] [CrossRef] [Green Version]
- Morganti, K.J.; Foong, T.M.; Brear, M.J.; da Silva, G.; Yang, Y.; Dryer, F.L. The research and motor octane numbers of liquefied petroleum gas (LPG). Fuel 2013, 108, 797–811. [Google Scholar] [CrossRef]
- Giechaskiel, B.; Cresnoverh, M.; Jörgl, H.; Bergmann, A. Calibration and accuracy of a particle number measurement system. Meas. Sci. Technol. 2010, 21, 045102. [Google Scholar] [CrossRef]
- Amanatidis, S.; Ntziachristos, L.; Giechaskiel, B.; Katsaounis, D.; Samaras, Z.; Bergmann, A. Evaluation of an oxidation catalyst (“catalytic stripper”) in eliminating volatile material from combustion aerosol. J. Aerosol Sci. 2013, 57, 144–155. [Google Scholar] [CrossRef]
- Giechaskiel, B.; Clairotte, M. Fourier Transform Infrared (FTIR) spectroscopy for measurements of vehicle exhaust emissions: A review. Appl. Sci. 2021, 11, 7416. [Google Scholar] [CrossRef]
- Varella, R.; Giechaskiel, B.; Sousa, L.; Duarte, G. Comparison of portable emissions measurement systems (PEMS) with laboratory grade equipment. Appl. Sci. 2018, 8, 1633. [Google Scholar] [CrossRef] [Green Version]
- Clairotte, M.; Valverde, V.; Bonnel, P.; Giechaskiel, P.; Carriero, M.; Otura, M.; Fontaras, G.; Pavlovic, J.; Martini, G.; Krasenbrink, A. Joint Research Centre 2017 Light-Duty Vehicles Emissions Testing Contribution to the EU Market Surveillance: Testing Protocols and Vehicle Emissions Performance; Publications Office of the European Union: Luxembourg, 2018; ISBN 978-92-79-90600-8. [Google Scholar]
- Valverde, V.; Clairotte, M.; Bonnel, P.; Giechaskiel, P.; Carriero, M.; Otura, M.; Gruening, C.; Fontaras, G.; Pavlovic, J.; Martini, G.; et al. Joint Research Centre 2018 Light-Duty Vehicles Emissions Testing: Contribution to the EU Market Surveillance: Testing Protocols and Vehicle Emissions Performance; Publications Office of the European Union: Luxembourg, 2019; ISBN 978-92-76-12333-0. [Google Scholar]
- Bonnel, P.; Clairotte, M.; Cotogno, G.; Gruening, R.; Loos, R.; Manara, D.; Melas, A.; Selleri, T.; Tutuianu, M.; Valverde, V.; et al. European Market Surveillance of Motor Vehicles: Results of the 2020 2021 European Commission Vehicle Emissions Testing Programme; Publications Office of the European Union: Luxembourg, 2022. [Google Scholar]
- Suarez-Bertoa, R.; Valverde-Morales, V.; Clairotte, M.; Pavlovic, J.; Giechaskiel, B.; Franco, V.; Kregar, Z.; Astorga-LLorens, C. On-road emissions of passenger cars beyond the boundary conditions of the real-driving emissions test. Environ. Res. 2019, 176, 108572. [Google Scholar] [CrossRef] [PubMed]
- Giechaskiel, B.; Lähde, T.; Drossinos, Y. Regulating particle number measurements from the tailpipe of light-duty vehicles: The next step? Environ. Res. 2019, 172, 1–9. [Google Scholar] [CrossRef] [PubMed]
Figure 1.
CO2 emissions.

Figure 2.
NOx emissions. Dotted lines give the applicable Euro 6 emission limits in the laboratory (Lab) or on the road (RDE). The short orange lines give the gasoline modality emissions when it is lower than the gaseous modality. The limit of Bi-LPG #1 is 60 mg/km for the NEDC, and of CNG #5 is 82 mg/km for the NEDC.

Figure 3.
CO emissions. Dotted lines give the applicable Euro 6 emission limits in the laboratory. The limit of Bi-LPG #1 is 1000 mg/km for the NEDC, and of CNG #5 is 2270 mg/km for the NEDC.
Figure 3.
CO emissions. Dotted lines give the applicable Euro 6 emission limits in the laboratory. The limit of Bi-LPG #1 is 1000 mg/km for the NEDC, and of CNG #5 is 2270 mg/km for the NEDC.

Figure 4.
PN emissions. Dotted lines give the applicable Euro 6 emission limits in the laboratory (Lab) or on the road (RDE).
Figure 4.
PN emissions. Dotted lines give the applicable Euro 6 emission limits in the laboratory (Lab) or on the road (RDE).

Figure 5.
Real-time emissions of vehicle Bi-LPG #2 over the first 450 s of a cold start WLTC at 23 °C and −7 °C: (a) CO; (b) NH3. The speed profile is given as a thin grey line.
Figure 5.
Real-time emissions of vehicle Bi-LPG #2 over the first 450 s of a cold start WLTC at 23 °C and −7 °C: (a) CO; (b) NH3. The speed profile is given as a thin grey line.


Table 1.
Cold start at 23 °C WLTC CO2 measured emissions (in g/km) and differences of declared, low temperature WLTC, and RDE complete tests from the measured WLTC at 23 °C.
Table 1.
Cold start at 23 °C WLTC CO2 measured emissions (in g/km) and differences of declared, low temperature WLTC, and RDE complete tests from the measured WLTC at 23 °C.
| Test | Bi-LPG #1 | Bi-LPG #2 | Bi-CNG #1 | CNG #1 | CNG #2 | CNG #3 | CNG #4 | CNG #5 |
|---|---|---|---|---|---|---|---|---|
| Gas | 150 | 118 | 112 | 110 | 117 | 115 | 128 | 283 |
| Declared | −9.9% 1 | 14.9% | −1.8% | −4.2% | −18% | - | - | −17.4% 1 |
| Low temp. | - | 8.6% | 6.0% | - | 5.2% | - | - | 9.1% |
| RDE complete | 11.3% | 14.1% | 13.7% | - | - | 3.5% | 15.6% | −11.0% |
| Gasoline | 167 | 137 | 146 | 142 | 142 | - | - | 306 |
| Declared | −12.4% | 7.7% | 2.3% | - | - | - | - | - |
| Low temp. | - | 5.3% | 4.9% | - | 5.7% | - | - | - |
| RDE complete | 19.2% | 4.4% | 12.5% | - | - | - | - | −8.3% |
| Gas vs. Gasoline | −10.1% | −14.0% | −23.1% | −22.7% | −17.7% | - | - | −7.5% |
1 declared values based on NEDC.
Table 2.
Total hydrocarbons (THC) emissions (in mg/km) in the laboratory (no data for on-road tests). Dashed lines mean that no measurements are available.
Table 2.
Total hydrocarbons (THC) emissions (in mg/km) in the laboratory (no data for on-road tests). Dashed lines mean that no measurements are available.
| Test | Bi-LPG #1 | Bi-LPG #2 | Bi-CNG #1 | CNG #1 | CNG #2 | CNG #3 | CNG #4 | CNG #5 |
|---|---|---|---|---|---|---|---|---|
| Gas fuel | ||||||||
| WLTC cold | 42 | 13 | 44 | 17 | 18 | 53 | 35 | 122 |
| WLTC hot | 2 | 2 | 23 | 6 | 9 | - | - | 129 |
| Low temp. | - | 83 | 269 | - | 27 | - | - | 231 |
| Gasoline | ||||||||
| WLTC cold | 42 | 14 | 56 | 11 | 11 | - | - | 994 |
| WLTC hot | 3 | 2 | 30 | 0 | 0 | - | - | - |
| Low temp. | - | 77 | 248 | - | 30 | - | - | - |
Table 3.
Non methane hydrocarbons (NMHC) emissions (in mg/km) in the laboratory. Dashed lines mean that no measurements are available.
Table 3.
Non methane hydrocarbons (NMHC) emissions (in mg/km) in the laboratory. Dashed lines mean that no measurements are available.
| Test | Bi-LPG #1 | Bi-LPG #2 | Bi-CNG #1 | CNG #1 | CNG #2 | CNG #3 | CNG #4 | CNG #5 |
|---|---|---|---|---|---|---|---|---|
| Gas fuel | ||||||||
| WLTC cold | 38 | 12 | 21 | 0 | 0 | 11 | 5 | 43 |
| WLTC hot | 1 | 1 | 1 | 0 | 0 | - | - | 26 |
| Low temp. | - | 78 | 160 | - | 0 | - | - | 131 |
| Gasoline | ||||||||
| WLTC cold | 38 | 13 | 51 | 10 | 10 | - | - | - |
| WLTC hot | 2 | 1 | 26 | 0 | 0 | - | - | - |
| Low temp. | - | 72 | 185 | - | 27 | - | - | - |
Table 4.
Ammonia (NH3) emissions in the laboratory.
| Test | Bi-LPG #1 | Bi-LPG #2 | Bi-CNG #1 | CNG #1 | CNG #2 | CNG #3 | CNG #4 | CNG #5 |
|---|---|---|---|---|---|---|---|---|
| Gas fuel | ||||||||
| WLTC cold | - | 13 mg/km (21 ppm) | 20 mg/km (10 ppm) | - | - | 25 mg/km (44 ppm) | 137 mg/km (119 ppm) | 41 mg/km (31 ppm) |
| Low temp. | - | 13 mg/km (29 ppm) | 43 mg/km (18 ppm) | - | - | - | - | 52 mg/km (46 ppm) |
| E5 fuel | ||||||||
| WLTC cold | - | 7 mg/km (12 ppm) | 16 mg/km (10 ppm) | - | - | - | - | - |
| Low temp. | - | 11 mg/km (26 ppm) | - | - | - | - | - | - |
Table 5.
Vehicles characteristics.
| Specif. | Bi-LPG #1 | Bi-LPG #2 | Bi-CNG #1 | CNG #1 | CNG #2 | CNG #3 | CNG #4 | CNG #5 |
|---|---|---|---|---|---|---|---|---|
| OEM | Fiat | Fiat | Fiat | Seat | Skoda | Fiat | Ford | Fiat |
| Model | Tipo | Panda | Panda | Arona | Octavia | 500L | C max | Ducato |
| Class | M1 | M1 | M1 | M1 | M1 | M1 | M1 | N1-III |
| JRC Code | FT060 | FT070 | FT071 | ST008 | SA004 | FT062 | FD011 | FT061 |
| Fuel type | LPG/E5 | LPG/E10 | CNG/E10 | CNG | CNG | CNG | CNG | CNG |
| Injection | PFI/PFI | PFI/PFI | PFI/PFI | PFI | DI | DI | DI | PFI |
| ATS | TWC | TWC | TWC | TWC | TWC | TWC | TWC | TWC |
| Model year | 2017 | 2018 | 2018 | 2020 | 2019 | 2019 | 2019 | 2018 |
| Euro | 6b | 6d-Temp | 6d-Temp | 6d-Temp | 6d-Temp | Proto | Proto | 6b |
| Odometer | 15493 | 3003 | 4253 | 2800 | 1223 | n/a | n/a | 707 |
| Engine (cm3) | 1368 | 124 | 875 | 999 | 1498 | 999 | 999 | 2999 |
| Power (kW) | 88 | 51 | 62.5 | 66 | 96 | 88 | 110 | 100 |
| CO2 (decl.) | 135/146 | 135/147 | 110/149 | 105 | 96 | - | - | 234 |
ATS = aftertreatment system; CNG = compressed natural gas; DI = direct injection; LPG = liquefied petroleum gas; OEM = original equipment manufacturer; PFI = port fuel injection; Proto = prototype; TWC = three-way catalyst. Vehicles using gasoline during cranking in gas mode: Bi-LPG #1, Bi-LPG #2, Bi-CNG #1, CNG #5. The lower the ambient temperature, the longer the duration of gasoline usage [46]. The mono-fuel gas passenger cars (M1) used gasoline at cranking only at very low ambient temperatures (<−10 °C).
Table 6.
Test protocol and parameters. TM is the test mass and f0-f2 are road-load coefficients that were used at the laboratory. The actual temperature at the beginning of the “Low Temp.” tests are given. RDE1 and RDE2 refer to two different routes, but both RDE regulation compliant.
Table 6.
Test protocol and parameters. TM is the test mass and f0-f2 are road-load coefficients that were used at the laboratory. The actual temperature at the beginning of the “Low Temp.” tests are given. RDE1 and RDE2 refer to two different routes, but both RDE regulation compliant.
| Specif. | Bi-LPG #1 | Bi-LPG #2 | Bi-CNG #1 | CNG #1 | CNG #2 | CNG #3 | CNG #4 | CNG #5 |
|---|---|---|---|---|---|---|---|---|
| TM (kg) | 1530 | 1136 | 1249 | 1429 | 1535 | 1579 | 1828 | 2726 |
| f0 (N) | 136.8 | 71.1 | 78.3 | 95.0 | 131.1 | 147.4 | 179.2 | 230.8 |
| f1 (N/(km/h)) | 0.26 | 0.55 | 0.55 | 0.51 | 0.13 | 0.21 | 0.70 | 0.22 |
| f2 (N/(km/h)2) | 0.034 | 0.033 | 0.037 | 0.038 | 0.037 | 0.037 | 0.040 | 0.093 |
| Low Temp. | No | −6.5 °C | −5.6 °C | No | −3.6 °C | No | No | −6.1 °C |
| Cold 23 °C | Yes | Yes | Yes | Yes | Yes | Yes | Yes | Yes |
| Hot 23 °C | Yes | Yes | Yes | Yes | Yes | No | No | Yes |
| RDE | Yes | Yes | Yes | No | No | Yes | Yes | Yes |
| 10 nm | No | Yes | Yes | Yes | Yes | Yes | Yes | Yes |
| NH3 | No | Yes | Yes | No | No | Yes | Yes | Yes |
| RDE temp. | 23–28 °C | 14–19 °C | 7–12 °C | No | No | 25–33 °C | 1–12 °C | 21–25 °C |
| RDE route | RDE1, RDE2 | RDE1 | RDE1 | No | No | RDE2 | RDE2 | RDE1 |
Publisher’s Note: MDPI stays neutral with regard to jurisdictional claims in published maps and institutional affiliations. |
© 2022 by the authors. Licensee MDPI, Basel, Switzerland. This article is an open access article distributed under the terms and conditions of the Creative Commons Attribution (CC BY) license (https://creativecommons.org/licenses/by/4.0/).
Share and Cite
MDPI and ACS Style
Giechaskiel, B.; Lähde, T.; Clairotte, M.; Suarez-Bertoa, R.; Valverde, V.; Melas, A.D.; Selleri, T.; Bonnel, P. Emissions of Euro 6 Mono- and Bi-Fuel Gas Vehicles. Catalysts 2022, 12, 651. https://doi.org/10.3390/catal12060651
AMA Style
Giechaskiel B, Lähde T, Clairotte M, Suarez-Bertoa R, Valverde V, Melas AD, Selleri T, Bonnel P. Emissions of Euro 6 Mono- and Bi-Fuel Gas Vehicles. Catalysts. 2022; 12(6):651. https://doi.org/10.3390/catal12060651
Chicago/Turabian StyleGiechaskiel, Barouch, Tero Lähde, Michaël Clairotte, Ricardo Suarez-Bertoa, Victor Valverde, Anastasios D. Melas, Tommaso Selleri, and Pierre Bonnel. 2022. "Emissions of Euro 6 Mono- and Bi-Fuel Gas Vehicles" Catalysts 12, no. 6: 651. https://doi.org/10.3390/catal12060651
Note that from the first issue of 2016, this journal uses article numbers instead of page numbers. See further details here.