
Silica-Supported Copper (II) Oxide Cluster via Ball Milling Method for Catalytic Combustion of Ethyl Acetate


1
National Engineering Research Center for Marine Aquaculture, Zhejiang Ocean University, Zhoushan 316022, China
2
School of Petroleum Chemical Engineering & Environment, Zhejiang Ocean University, Zhoushan 316022, China
*
Author to whom correspondence should be addressed.
Catalysts 2022, 12(5), 497; https://doi.org/10.3390/catal12050497
Submission received: 31 March 2022
/
Revised: 25 April 2022
/
Accepted: 26 April 2022
/
Published: 29 April 2022
(This article belongs to the Topic Materials and Catalysts for Pollutants and CO2 Capture and Transformation)
Abstract
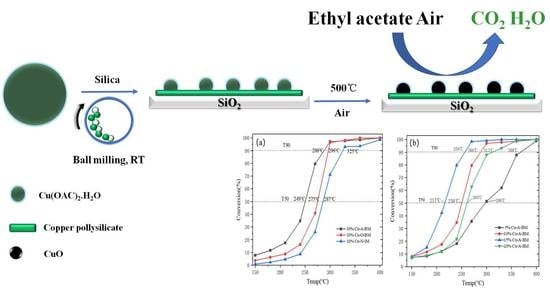
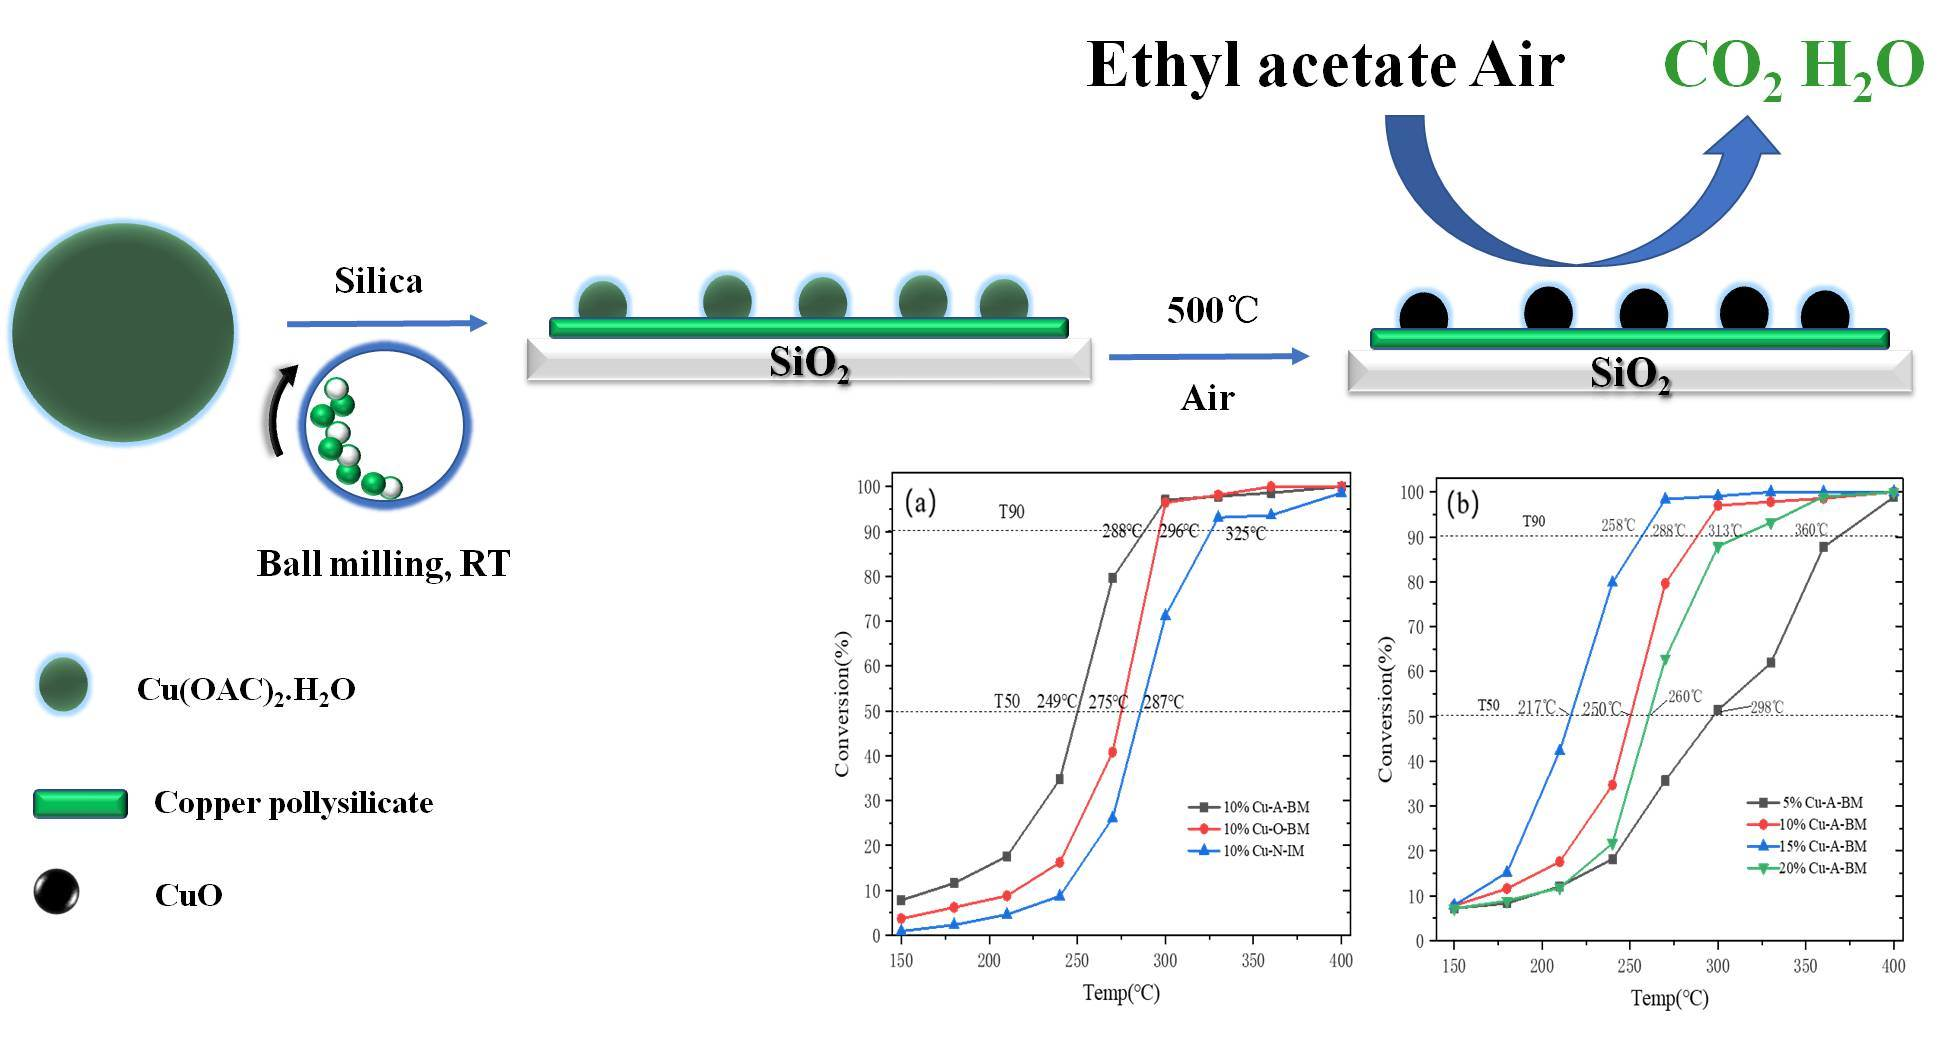
:Highly dispersed CuO/SiO2 catalysts were successfully synthesized by a green process of ball milling (BM) under solvent-free and room temperature conditions. The structural evolution of CuO/SiO2 catalysts prepared by BM was elucidated by TG-DSC, XRD, FT-IR, and XPS characterizations. We found that the copper acetate precursor was dispersed over the layer of copper phyllosilicate which was formed by reacting between the copper acetate precursor and the silica support during the BM process. The copper phyllosilicate layer over the support might play an important role in the stabilization of the CuO cluster (<2 nm) during thermal pretreatment. The 15% CuO/SiO2 catalyst exhibited the best catalytic activity for the catalytic combustion of ethyl acetate as it owned a highest active surface area of CuO among the CuO/SiO2 catalysts with different copper loadings.
1. Introduction
It is widely accepted that use of volatile organic compounds (VOCs) leads to serious deterioration in air quality due to their toxic properties and precursors of O3 and photochemical smog [1]. Catalytic combustion is an effective method to abate VOCs due to its low operational cost and wide application range. Supported noble metal catalysts represented by supported platinum and/or palladium catalysts are very active in catalytic combustion of VOCs. However, their high manufacturing costs and low thermal stabilities hinder their large-scale application in industry [2,3]. Therefore, relatively inexpensive transition metal catalysts become a promising substitute for precious metals because they have the advantages of excellent stability, poison tolerance, and a long lifetime and low cost. However, they often present low activities compared with noble metal catalysts [4]. Copper, a very versatile transition metal, has been widely used in the catalytic combustion of VOCs [5,6]. It is well known that the activities of copper-based catalysts can be enhanced significantly by improving the copper dispersion [3]. Unfortunately, the catalysts prepared by the traditional impregnation method always exhibit poor dispersion and inhomogeneous distribution of copper oxide particles due to agglomeration during the drying and calcination step [7]. In the past decades, great achievements have been made in improving the dispersion of copper on supports. Many effective preparation methodologies of supported copper catalysts have been developed including the deposition precipitation or the precipitation-gel method [8,9,10], the sol-gel method [11], the ammonia evaporation method [12,13], the atomic layer epitaxy technique [14], Cu ion-chelated or coordinated with the functional organic group functionalized on the surface of SiO2-based materials [15], ion exchange [16], the microemulsion processing [17] and the in situ, self-assembled core-shell precursor route [18,19]. Nevertheless, the aforementioned methods still have a lot of drawbacks, such as the high cost of raw materials and the involvement of tedious multiple steps, which are difficult to scale up and apply in industry. Even worse, copper nitrate, routinely chosen as a precursor to prepare supported copper catalysts as its inherent advantages (low-cost, high water solubility and easy removal of anion) [19], will produce a large amount of highly toxic gases of NOx or metal nitrate containing wastewater (solvents) during thermal pretreatment or wet chemistry processes. Therefore, it is still a big challenge to develop an environmentally benign, facile methodology for supported copper catalyst preparation.
Although mechanochemical treatment by ball milling and related techniques is not new, in recent years it is reemerging and gaining increasing attention as a technique for new nanomaterials and catalyst preparation because of the possibilities it provides for developing unique functional nanomaterials and more environmentally sustainable methods [20]. Recently, significant progress have been achieved in highly dispersed catalysts prepared via the ball milling method. Kamolphop et al. reported that a 2 wt% Ag/Al2O3 catalyst prepared by the ball milling method exhibited high activity of hydrocarbon-selective catalytic reduction of NOx at low temperature (<200 °C) [21]. Yang et al. used the ball milling method to prepare Pd/SiO2 catalysts with different Pd precursors [22]. They found that the Pd(acac)2 precursor owed the best catalytic activities for methane oxidation ascribing to the highest dispersion of Pd and a proper ratio of PdO/(Pd+PdO) [22]. Interestingly, supported metal single-atom catalysts prepared by the ball-milling method based on the “precursor-dilution” strategy have been reported by the Ji group [23,24]. From the above literature review, the ball milling method should be a powerful technique to prepare highly dispersed supported catalysts.
Highly dispersed CuO/SiO2 catalysts have shown high catalytic activities in many useful reactions [7,8,11,19]. However, few studies on the preparation of highly dispersed CuO/SiO2 by green processes have been reported. Furthermore, despite the great achievements that have been made in catalyst preparations via the ball milling method, it is understood that structural evolutions in the ball milling processes still lag behind in terms of practical applications [25]. Herein, we report highly dispersed CuO/SiO2 catalysts prepared via the ball milling route by using copper acetate as the precursor without addition of solvent. The structural evolution of the CuO/SiO2 catalysts during the ball milling process and the thermal pretreatment is elucidated. Furthermore, the prepared CuO/SiO2 catalysts are applied to the catalytic combustion of ethyl acetate, which is a typical compound of VOCS.
2. Results
2.1. Appearances of the Prepared Catalysts
The appearance of a catalyst, such as the color, may reflect its physicochemical properties indirectly. The images from a to d were the as-synthesized catalysts of W%Cu-A-BM in the Supplementary Materials Figure S1A. The color of Cu(OAC)2·H2O was teal (not shown in the Figure S1A). However, the colors of the as-synthesized W%Cu-A-BM catalysts changed from light green to turquoise as the W increased from 5 to 15. But the color was almost unchanged as the W further increased from 15 to 20. The as-synthesized sample of 10%Cu-O-BM catalyst displayed a grey color (Figure S1(Ae)). And the as-synthesized sample of 10%Cu-N-IM was light turquoise. Accordingly, the colors of the catalysts after calcination at 500 °C were displayed in the Figure S1B. The colors of the W%Cu-A-BM catalysts turned from dark sea green to dark yellowish green as the W from 5 to 15. Nevertheless, the color of the 20%Cu-A-BM was as grey as that of the 10%Cu-O-BM, which was totally different from the color of 15%Cu-A-BM catalyst. And the 10%Cu-N-IM catalyst showed a dark black color. The catalysts of CuO/SiO2 prepared with different methods had different colors, suggesting different structures of copper species.
2.2. TG-DSC Results
TG-DSC was used to investigate the thermal decomposition of the as-synthesis samples. TG-DSC curves of Cu(OAC)2·H2O (a) and 20%Cu-A-BM (b) were depicted in Figure 1. It could be seen from (a) that TG curves of Cu(OAC)2·H2O exhibited two-step mass losses in the temperature range of 50–550 °C. The first weight loss of 9.0% was observed between 103 and 181 °C (TG curve) accompanying an endothermic peak at 148 °C (DSC curve), which was well matched with the theoretical dehydration value (9.0%), indicating the dehydration of crystal water over Cu(OAC)2·H2O had occurred [26]. The second weight loss stage of copper acetate was 52.3% between 244 and 326 °C assigning to complete decomposition of Cu(OAC)2, which was very close to the result of the theoretical calculated value (51.3%). There was an obvious exothermic peak on the DSC curve at 287 °C representing a very large amount of heat release owing to the combustion of Cu(OAC)2 to form CuOx. After that, the TG curve of the copper acetate sample has a slight increase of 0.9% between 350 and 550 °C together with a small exothermic peak at 326 °C, suggesting that a small amount of metal copper or cuprous oxide formed during the decomposition of Cu(OAC)2 was oxidized to produce CuO [27].
The 20% Cu-A-BM was also characterized by TG-DSC as shown in Figure 1b. The 20% Cu-A-BM also exhibited two peaks on the DSC curves as well. The peaks on the DSC curve located at 99 °C and 263 °C corresponded to the endothermic peak and the exothermic peak, which derived from the dehydration of the sample and the oxidation of acetate. Accordingly, weight losses of 1.9% and 13.7% were observed, which was lower significantly than those of 3.7% and 21.1% calculated based on the amount of copper acetate supported on the support. Additionally, a weight loss of 3.8% appeared between 122 °C and 189 °C without any thermal effect, which might be due to the slow dehydration of silica support. In order to further clarify the thermal behaviors of the 20% Cu-A-BM catalyst, the control sample of 20% Cu-A-MM prepared via physical mixing was adopted to characterize using TG-DSC (Figure S2). The decomposed temperature of copper acetate species shifted to lower temperature (285 °C) compared to the copper acetate sample along with a weight loss of 26.8% which was higher slightly than the theoretical value mentioned above (21.1%). The TG-DSC results of the 20% Cu-A-MM suggested that the copper acetate was dispersed simply on the silica support without strong interaction between them. Therefore, we could come to a conclusion that the two peaks on the DSC of the 20% Cu-A-BM shifted to a lower temperature compared to the standard sample of copper acetate was caused by the well-dispersed copper acetate species on the silica support. The two weight losses centered at 99 °C and 263 °C over the 20% Cu-A-BM sample was much lower than the calculated values, revealing that the copper acetate must be dehydrated and decomposed or decomposed partially during BM.
2.3. ICP and N2 Physisorption Results
Catalyst textural properties and metal content of the catalysts were shown in Table 1. The Cu loading on all catalysts was close to the nominal loadings in the experimental section. With an increase of the Cu loading from 0 to 20%, the surface area of Cu-A-BM catalysts decreased from 390.1 to 132.6 m2/g. The surface area of 10% Cu-N-IM (139.4 m2/g) was prominently smaller than that of 10% Cu-A-BM (251.6 m2/g). Accordingly, for the pore volume and pore size of the prepared catalysts, the variation trends were the same as that of the surface area as shown in the Table 1. The N2 adsorption isotherm curves and pore size distribution were shown in Figure S3. The above textural results indicate that the pores of the samples prepared by the impregnation method and with high copper loading were severely blocked by CuO particles resulting in a significant reduction in surface area, pore volume, and pore size.
2.4. XRD Results
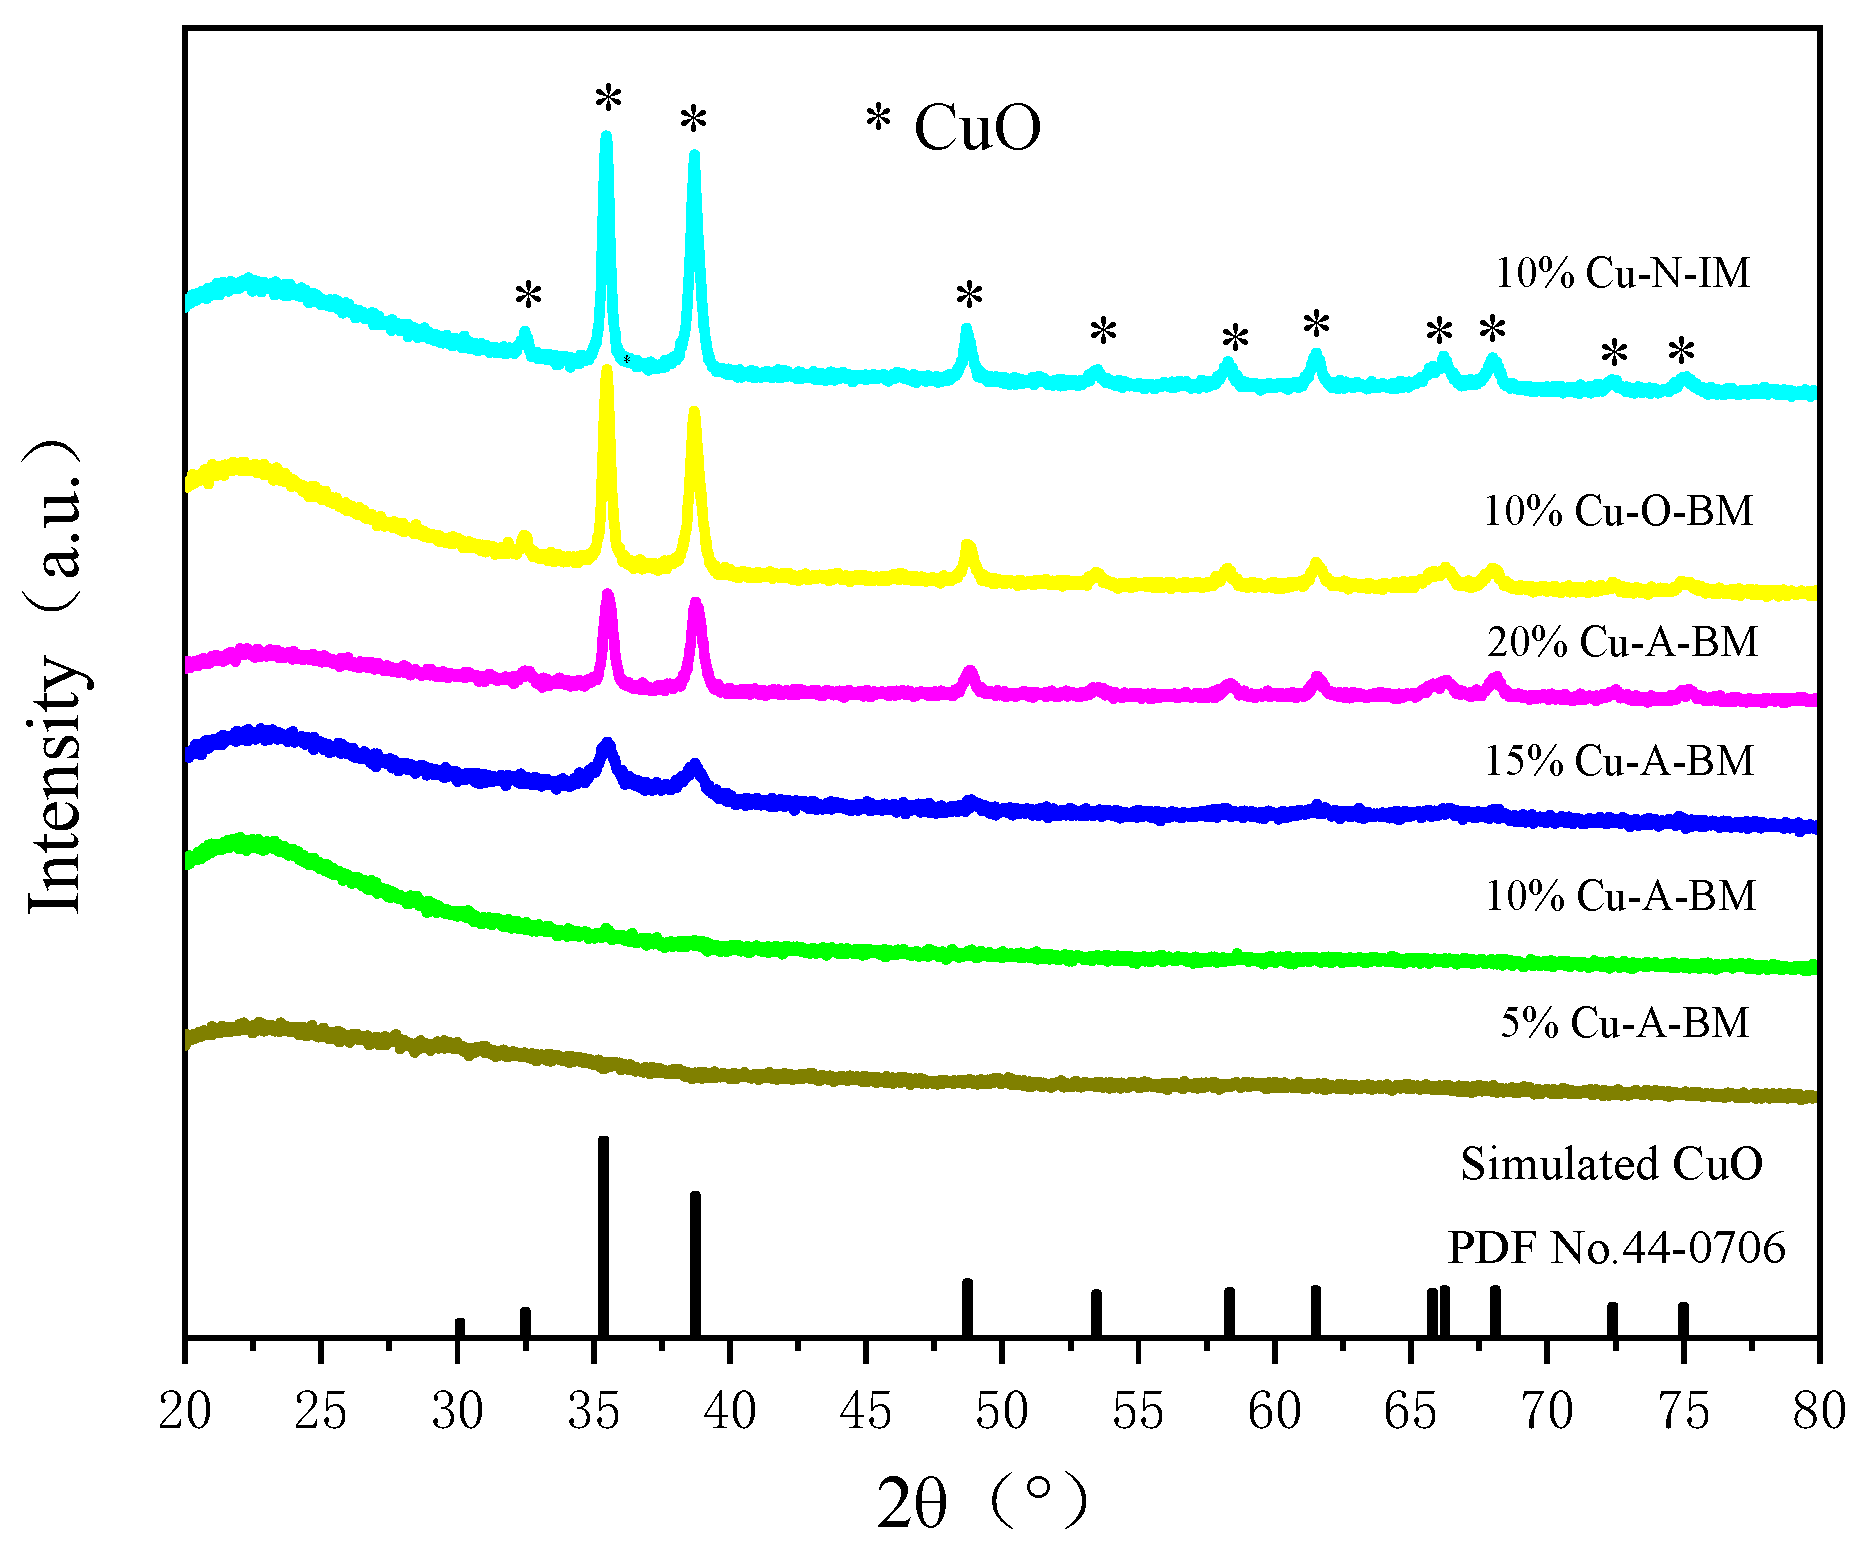
XRD was employed to analyze the crystal results of the catalysts prepared with different methods and different Cu loadings. The XRD patterns of W% Cu-A-BM, 10% Cu-O-BM, and 10% Cu-N-IM catalysts calcined at 500 °C were displayed in Figure 2. Moreover, the crystalline size of CuO estimated by the Scherrer equation are shown in Table 1. Regarding W% Cu-A-BM catalysts, it could be observed that there were no diffraction peaks except for the broad signal centered at 22° belonging to amorphous silica as W < 15. However, increasing the copper loading >10%, the main peaks at 32.3°, 35.2°, 38.5°, 48.6°, 53.3°, 58.1°, 61.3°, 65.9°, 68.1° and 74.9° appeared to correspond to the characteristic peaks of copper oxide [28]. The crystalline sizes of CuO over the 15% Cu-A-BM and the 20% Cu A-BM were 7.3 and 14.1 nm.
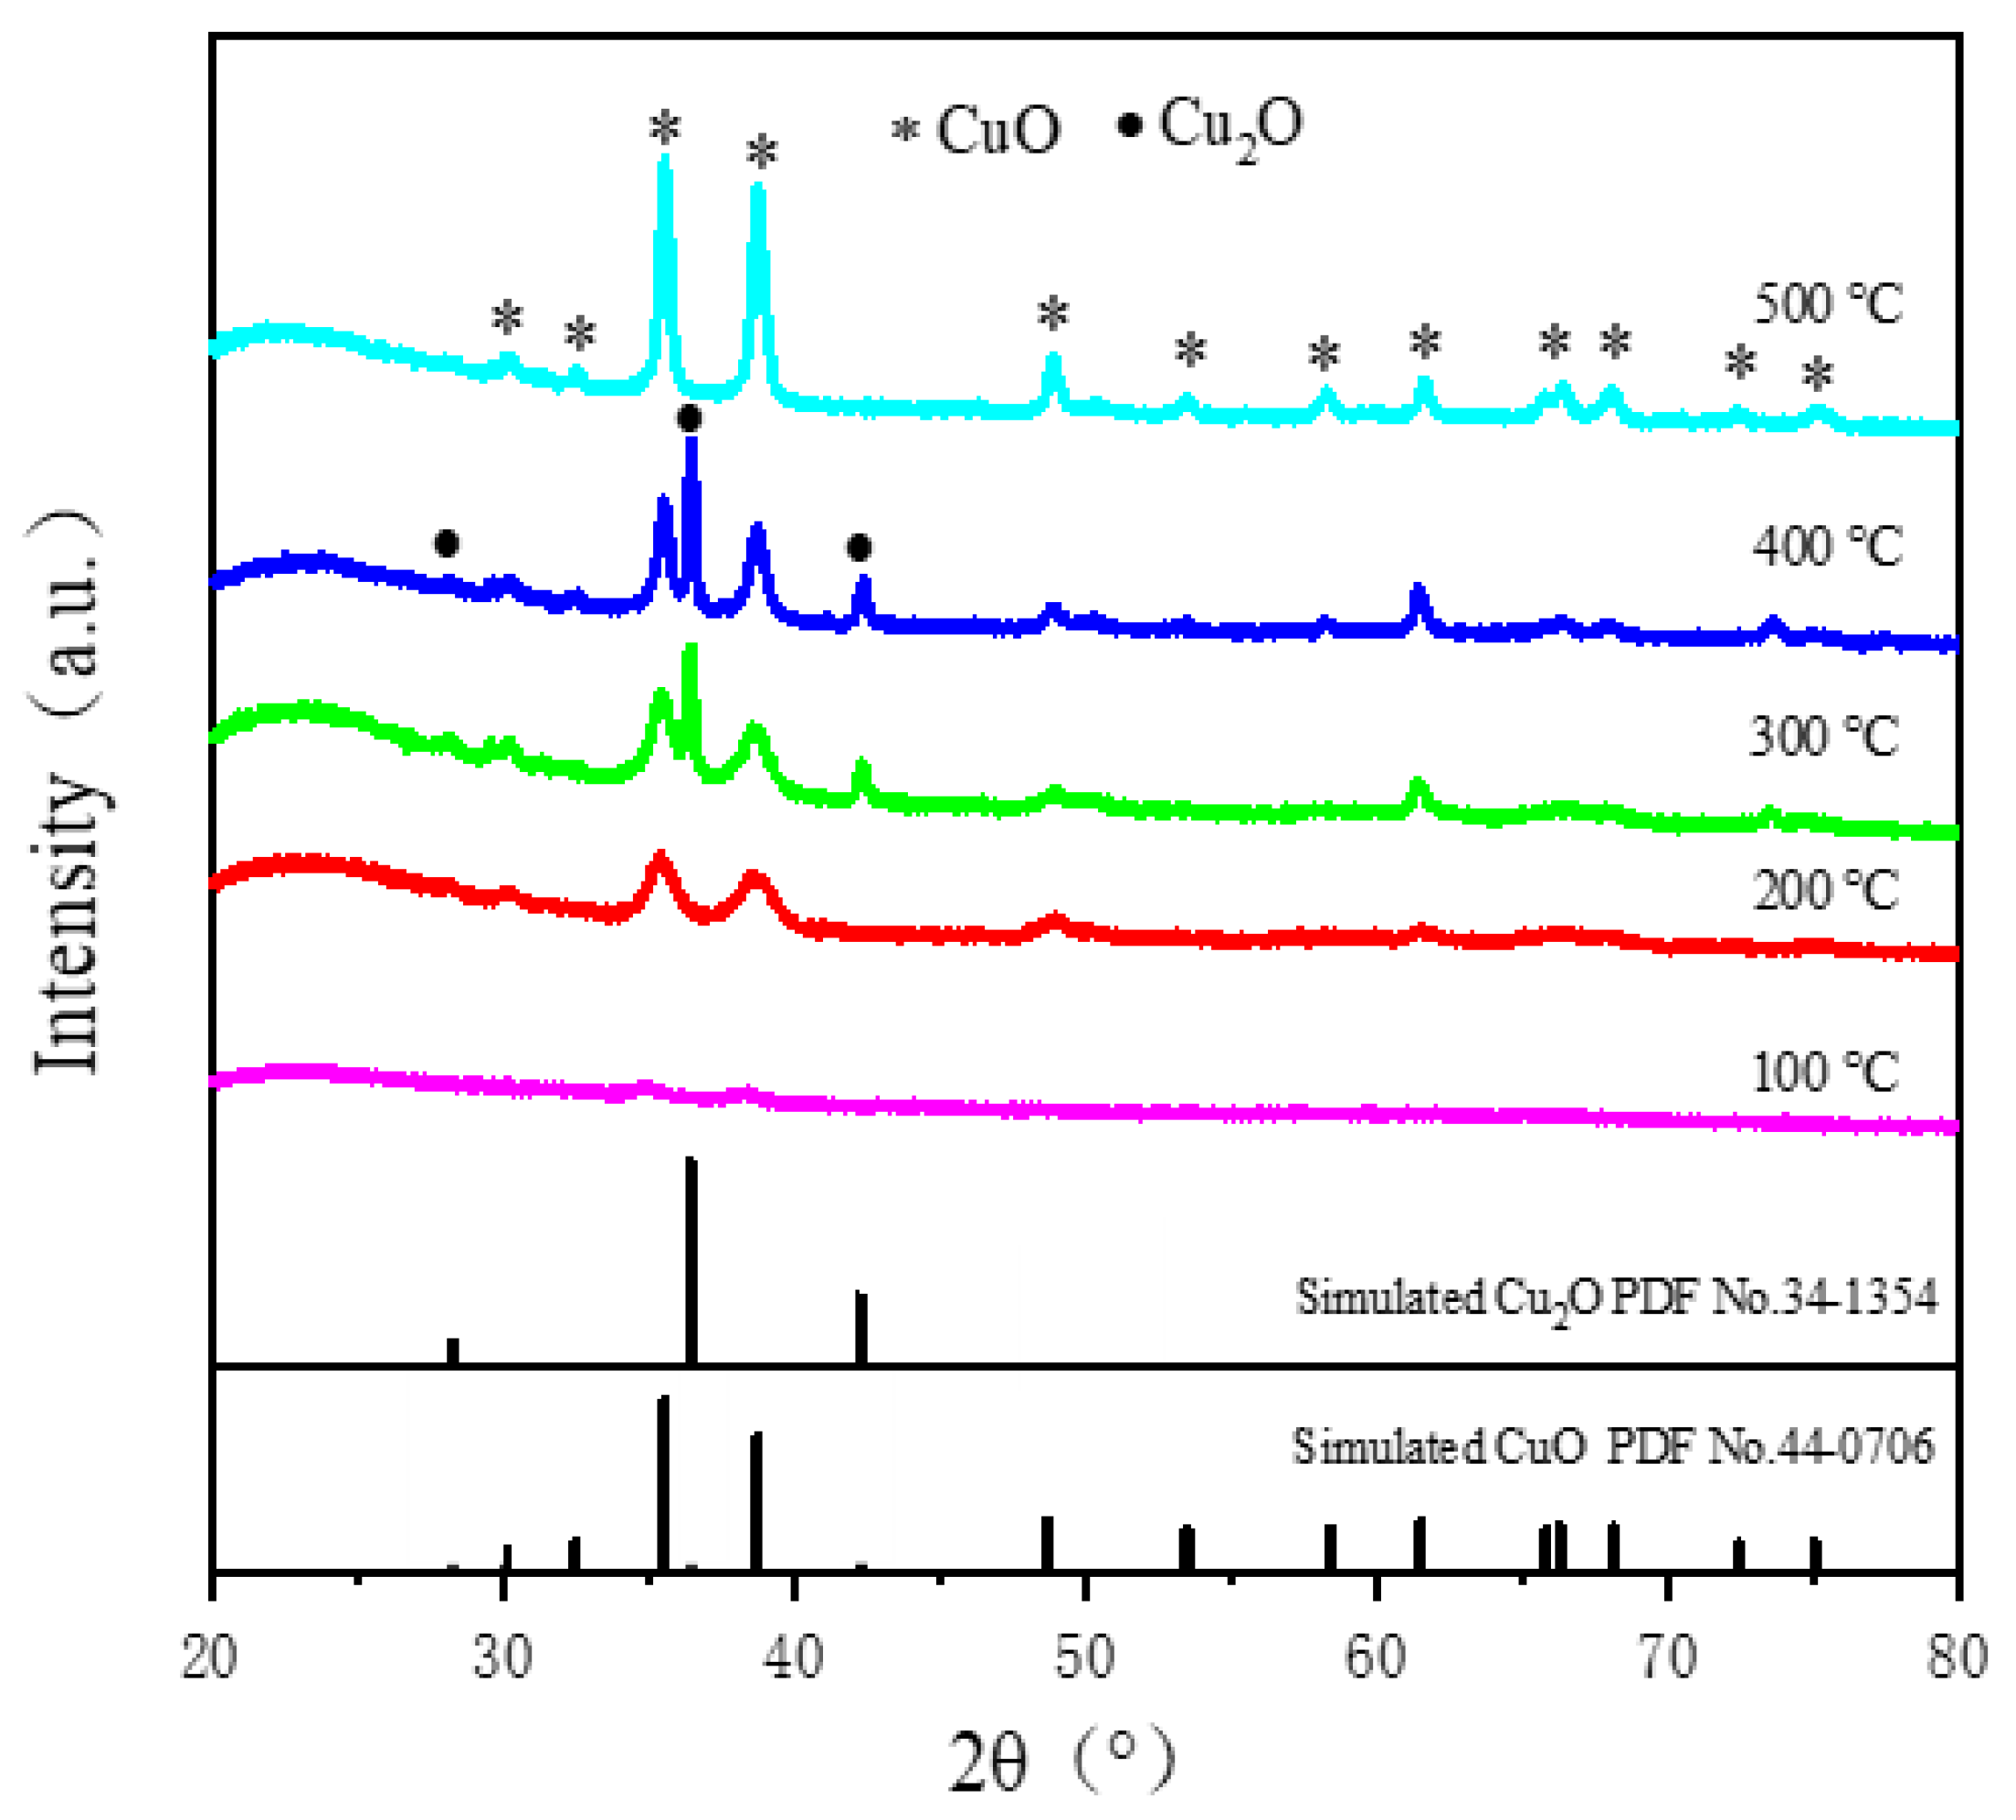
Strong CuO diffraction peaks were detected over the 10% Cu-O-BM and the 10% Cu-N-IM, which owned CuO crystalline sizes of 16.3 nm and 22.7 nm. From the above XRD results, we could conclude that the CuO particles were well dispersed on the W% Cu-A-BM catalysts as the W was lower than 15. On the contrary, dispersion of CuO was really poor on the catalyst prepared by the impregnation method. Moreover, the precursor of CuO was also crucial to the dispersion of CuO as the BM method was adopted. Furthermore, the copper acetate precursor was an ideal precursor regarding the preparation of high dispersion-supported CuO catalysts. More importantly, no toxic gases would be released during thermal pretreated processes. In order to investigate the crystal phase evolution of the W% Cu-A-BM during thermal process by XRD, the 20% Cu-A-BM samples were pretreated at 100, 200, 300, 400, and 500 °C in static air. The XRD patterns and the crystalline sizes of CuOx were shown in Figure 3 and Table 2. The reason why the 20% Cu-A-BM sample was chosen to calcine at different temperatures was because it was difficult to detect the CuO phase by using XRD on the W% Cu-A-BM samples as W < 20 (Figure 2). The CuO diffraction peaks at were detected as the pretreated temperature was as low as 100 °C [8]. When the pretreated temperature increased to 200 °C, CuO diffraction peaks appeared clearly. Nevertheless, as the pretreated temperature was between 200 and 500 °C, Cu2O phases at 28.5°, 36.4° and 42.3° [11] were detected along with CuO phases. Nevertheless, when the temperature rose to 500 °C, the peak of Cu2O disappeared completely. Evidently, the intensities of diffraction peaks of CuO increased with the increase of the pretreated temperature. And the crystalline size of CuO calculated by the Scherrer equation increased from 6.3 nm to 25.5 nm as the pretreated temperature increased from 100 °C to 500 °C (Table 2). Compared with the XRD pattern of copper acetate standard, the intensities of diffraction peaks of copper acetate after BM were weakened, which showed that of the crystalline size of copper acetate were decreased (Figure S4).
2.5. FT-IR Results
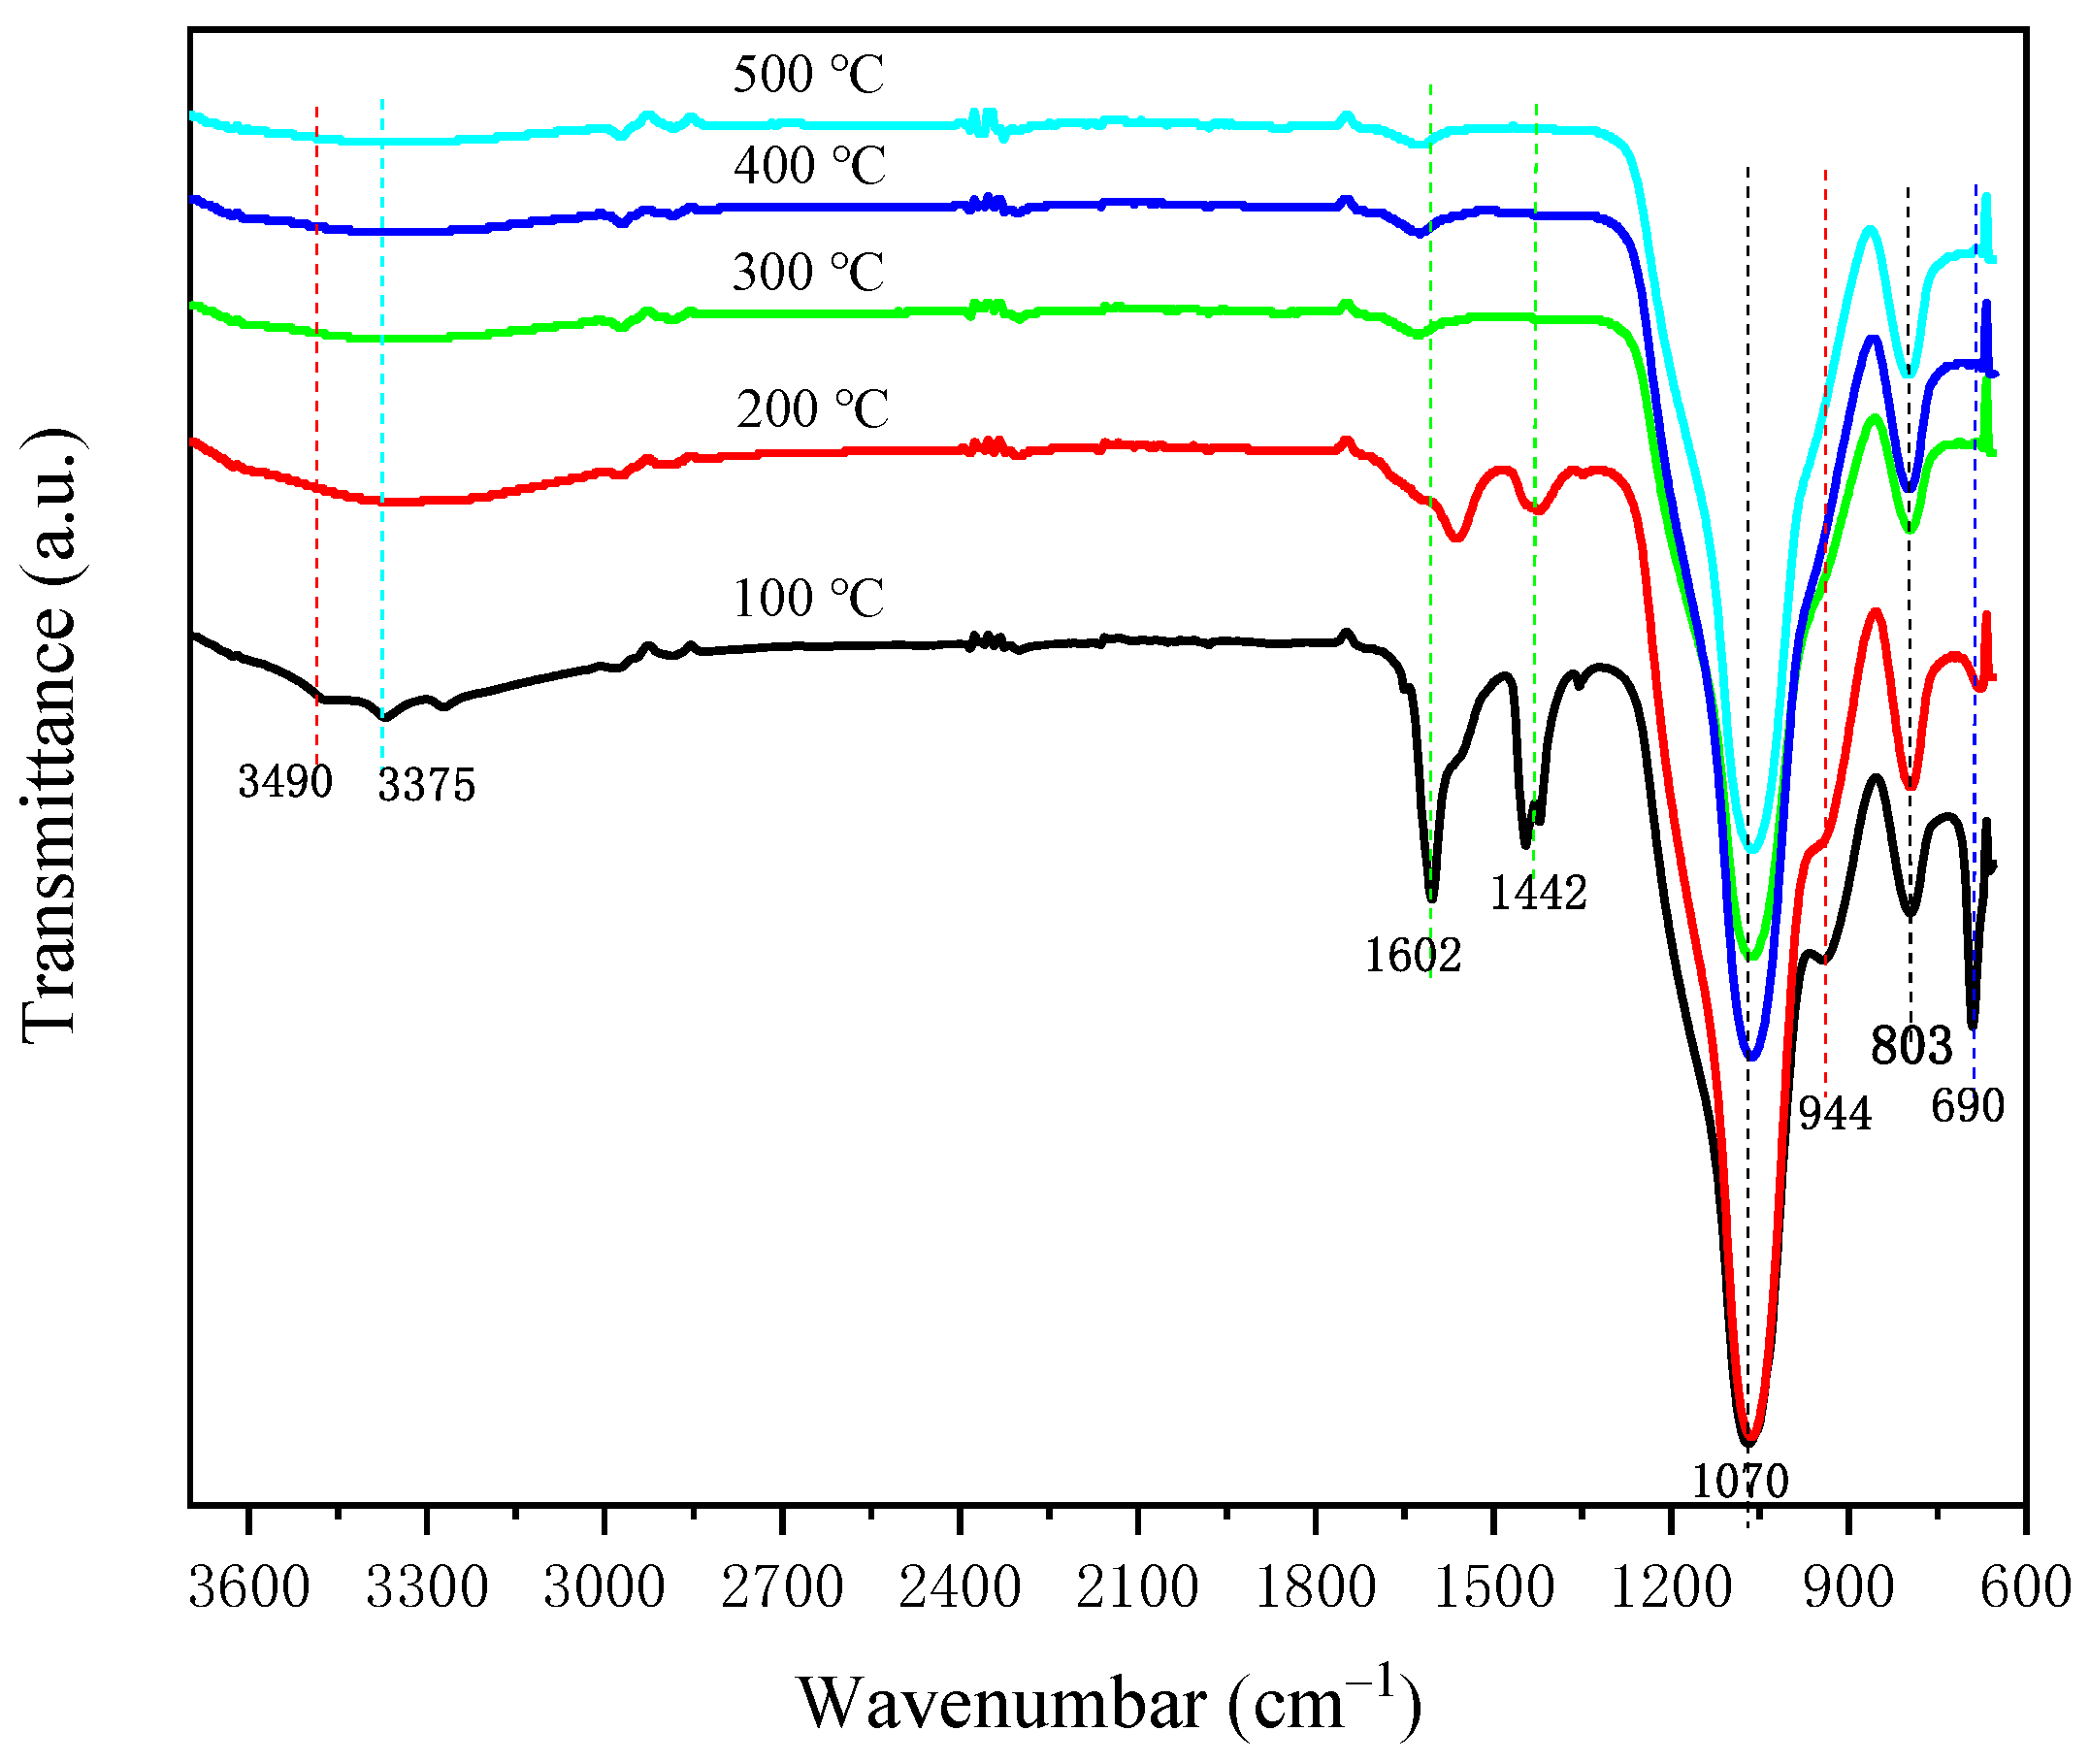
The FT-IR spectra of the 20% Cu-A-B samples calcined at different temperatures (100–500 °C) are depicted in Figure 4. The absorption peak around 3375 cm−1 disappeared as the calcined temperature >100 °C, which indicated the dehydration of Cu(OAC)2·H2O [27]. Moreover, the absorption peaks at 1602 cm−1 and 1442 cm−1 corresponded to methyl and carbonyl group of asymmetric stretching and symmetric stretching which were significantly weakened at 200 °C completely and disappeared at 300 °C [29]. The above results indicated that Cu(OAC)2 was decomposed completely between 200 and 300 °C. The peaks of 1070 cm−1 and 803 cm−1 was ascribed to the symmetric stretching vibrations and asymmetric stretching vibrations of Si-O-Si band in amorphous SiO2, which were intact independently of the calcined temperature [30]. Meanwhile, the peak at 3490 cm−1 and shoulder peaks at 944 cm−1 attributed to the –OH antisymmetric stretching vibration and Si–OH bending vibration on the surface of the catalyst were significantly weaken as the pretreated temperature >100. The band of 1040 cm−1 (Figure S5) appeared, revealing the formation of copper phyllosilicate during BM on the samples of W% Cu-A-BM (W > 15) [31].
2.6. XPS Results
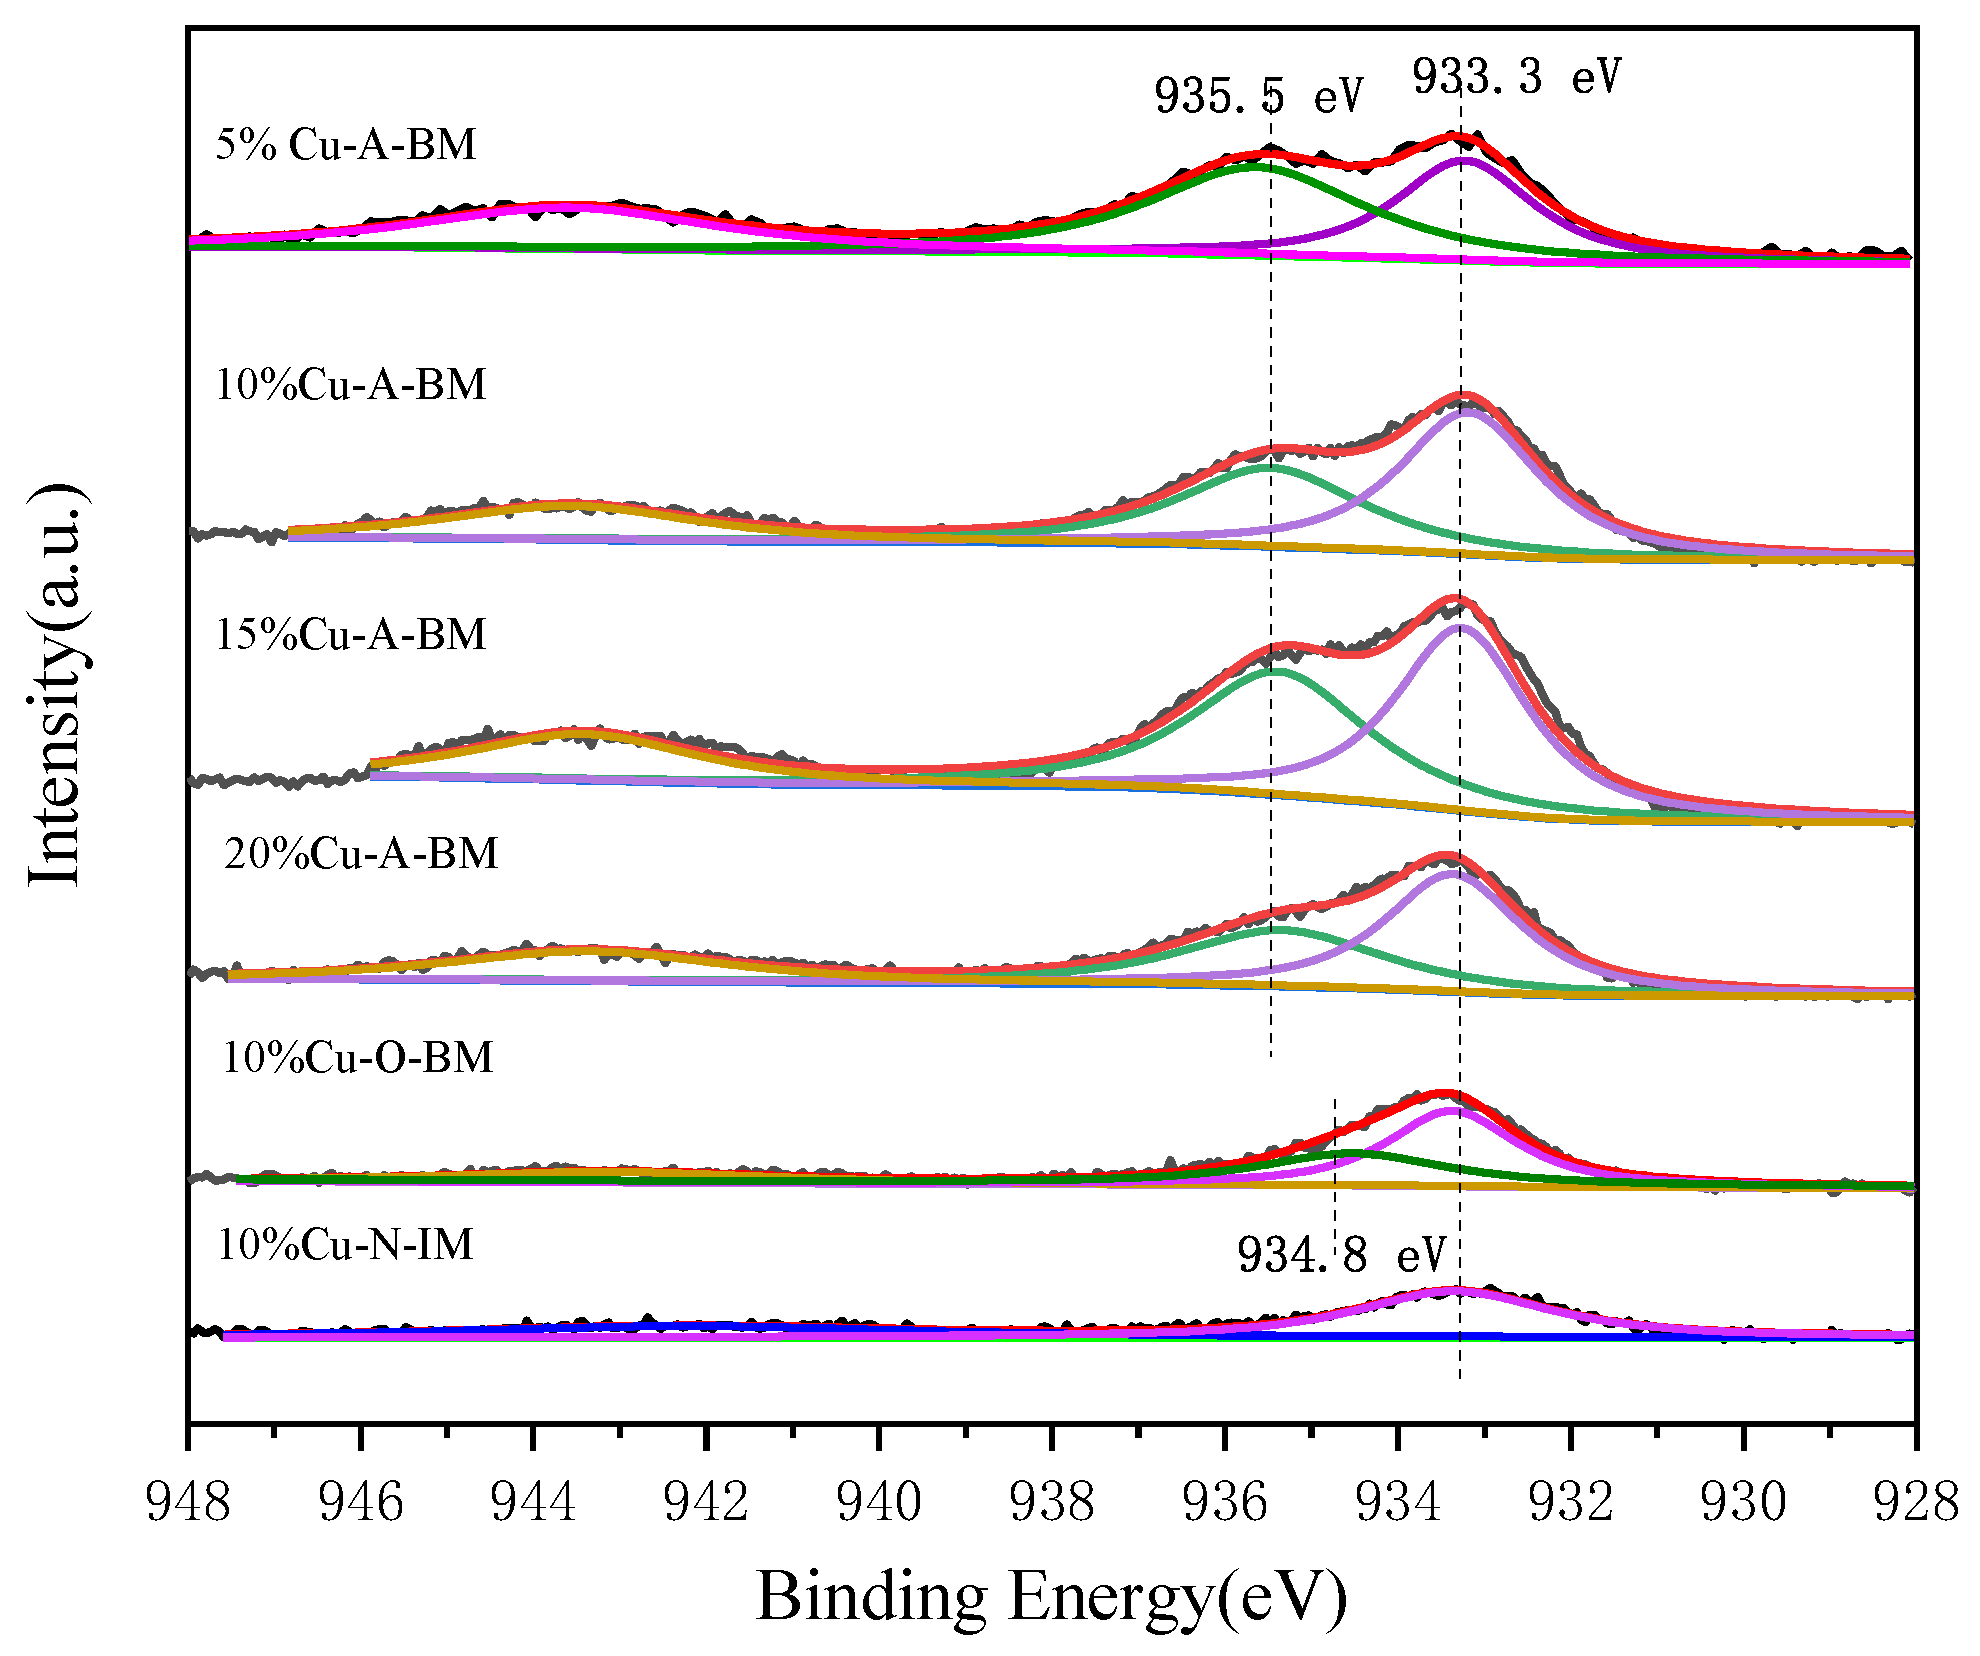
The surface chemical environment and composition of a catalyst are important factors for its catalytic performance. Therefore, the catalysts of W% Cu-A-BM, 10% Cu-O-BM and 10% Cu-N-IM were characterized by XPS. The survey spectra (Figure S6) showed that all catalysts contained Si, O, and Cu elements. Obviously, no other unexpected impurities were introduced into the samples during catalyst preparation. The Cu2p spectra of all catalysts are shown in Figure 5. All catalysts presented peaks at 933.3 eV, which confirmed the existence of CuO on all the catalysts [32]. The catalysts of W% Cu-A-BM exhibited peaks at around 935.5 eV increasing from 935.3 eV to 935.7 eV as the W from 5 to 20, revealing that the copper phyllosilicate species were formed [30,32]. However, the sample of 10% Cu-O-BM showed a small peak shifting to low binding energy at 934.8 eV. The formation of copper phyllosilicate on the W% Cu-A-BM samples was also implied by their green colors (Figure S1B). For the purpose of characterization of copper species over the uncalcined 20% Cu-BM sample, the Cu2p spectrum was collected and presented in the Figure S7. As expected, a peak was observed owing to the copper acetate species [19]. However, it was out of our expectation that a peak at 933.5 eV was observed suggesting that copper phyllosilicate species was formed over the as-synthesized sample [33].The molar ratio of the copper acetate species and the copper phyllosilicate species was 4.92.
Table 3 lists the atomic ratios (AR) of Cu, CO (copper oxide), and CS (copper phyllosilicate) measured by XPS. As for W% Cu-A-BM catalysts, AR of Cu presented a volcanic-like trend with the increase of W. As the W from 5 to 15, the AR of Cu rose from 1.33 to 2.68, but it decreased to 1.26 as the W further increased to 20. In line with our expectations, the Cu AR of 10% Cu-O-BM and 10% Cu-N-IM were as low as 0.71 and 0.49. Manifestly, the catalyst of 15% Cu-A-BM had the largest number of surface Cu atoms over a per unit amount of catalyst. The copper phyllosilicate/copper oxide (CO/CP) molar ratios calculated from the peak area of copper phyllosilicate and the peak of copper oxide at ~935.5 eV and ~933.3 eV are also presented in the Table 3. Regarding the W% Cu-A-BM catalysts, the CO/CP molar ratios had a similar volcano-type trend as the AR of Cu, but the highest value of CO/CP molar ratio was 1.38 over the 10% Cu-A-BM instead of the 15% Cu-A-BM which was 1.35.
2.7. H2-TPR Results
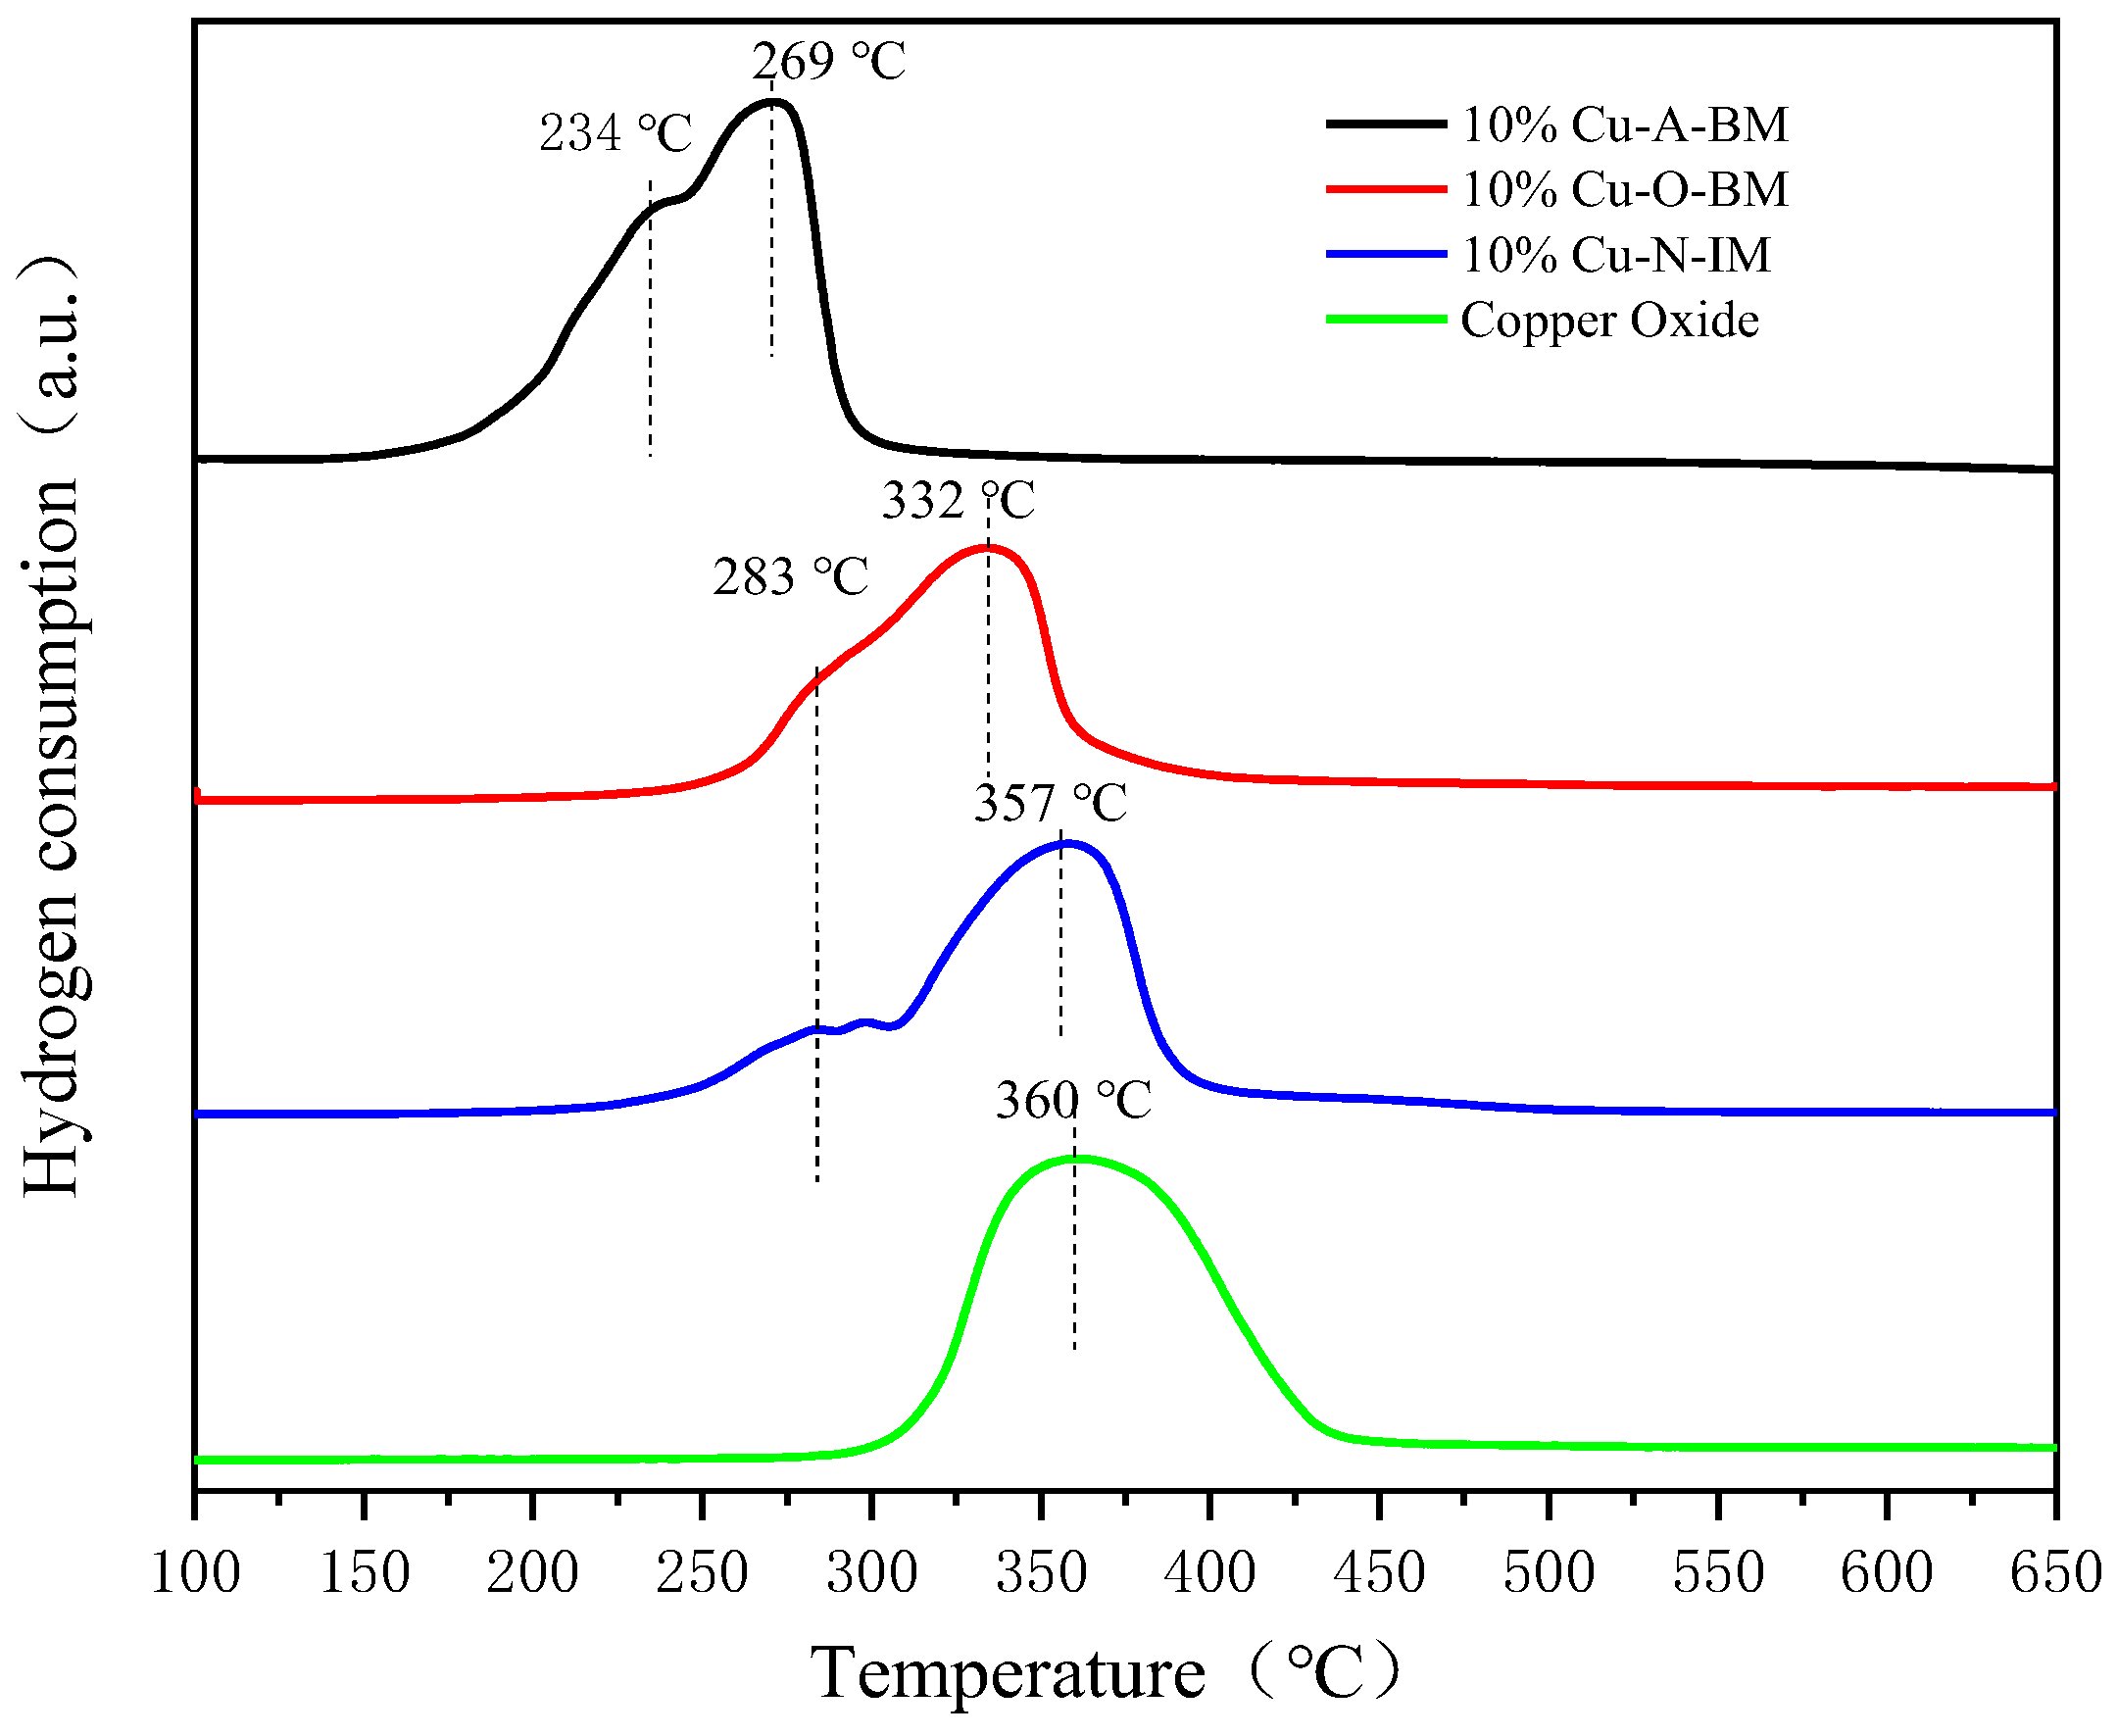
H2-TPR experiments were carried out to characterize the reduction properties of the samples. The reduction behaviors of the copper oxide and the samples prepared by different precursors and methods are displayed in Figure 6. The sample of 10% Cu-N-IM had two obvious reduction peaks located at 283 °C and 357 °C. And the high-temperature reduction peak was close to the bulk CuO reduction peak at 360 °C. The reduction peaks of 10% Cu-O-BM were a big peak at 332 °C and a shoulder peak at 283 °C. Evidently, the reduction peaks of 10% Cu-A-BM shifted to lower temperatures at 269 °C and 234 °C. The aforementioned XRD results also corroborated the TPR results that the high dispersion of CuO shifted to the lower reduction temperature. The molar ratio of H2 consumption to CuO (nH2/nCuO) on the 10% Cu-N-IM sample was 0.99, which was very close to one. However, the ratios of nH2/nCuO over the 10% Cu-O-BM sample and the sample of 10% Cu-A-BM were 0.90 and 0.80. The ratio of nH2/nCuO was less than one representing that there was an amount of Cu2+ species that could not be reduced to Cu0. It was reported that the copper phyllosilicate species could only be reduced to Cu2O [34]. Based on the CO/CP values listed in the Table 3, the calculated results of nH2/nCuO over the 10% Cu-N-IM and the 10% Cu-O-BM and the 10% Cu-A-BM samples were 1.0 and 0.90 and 0.79, respectively, which were exactly matched the above values calculated from the TPR results.
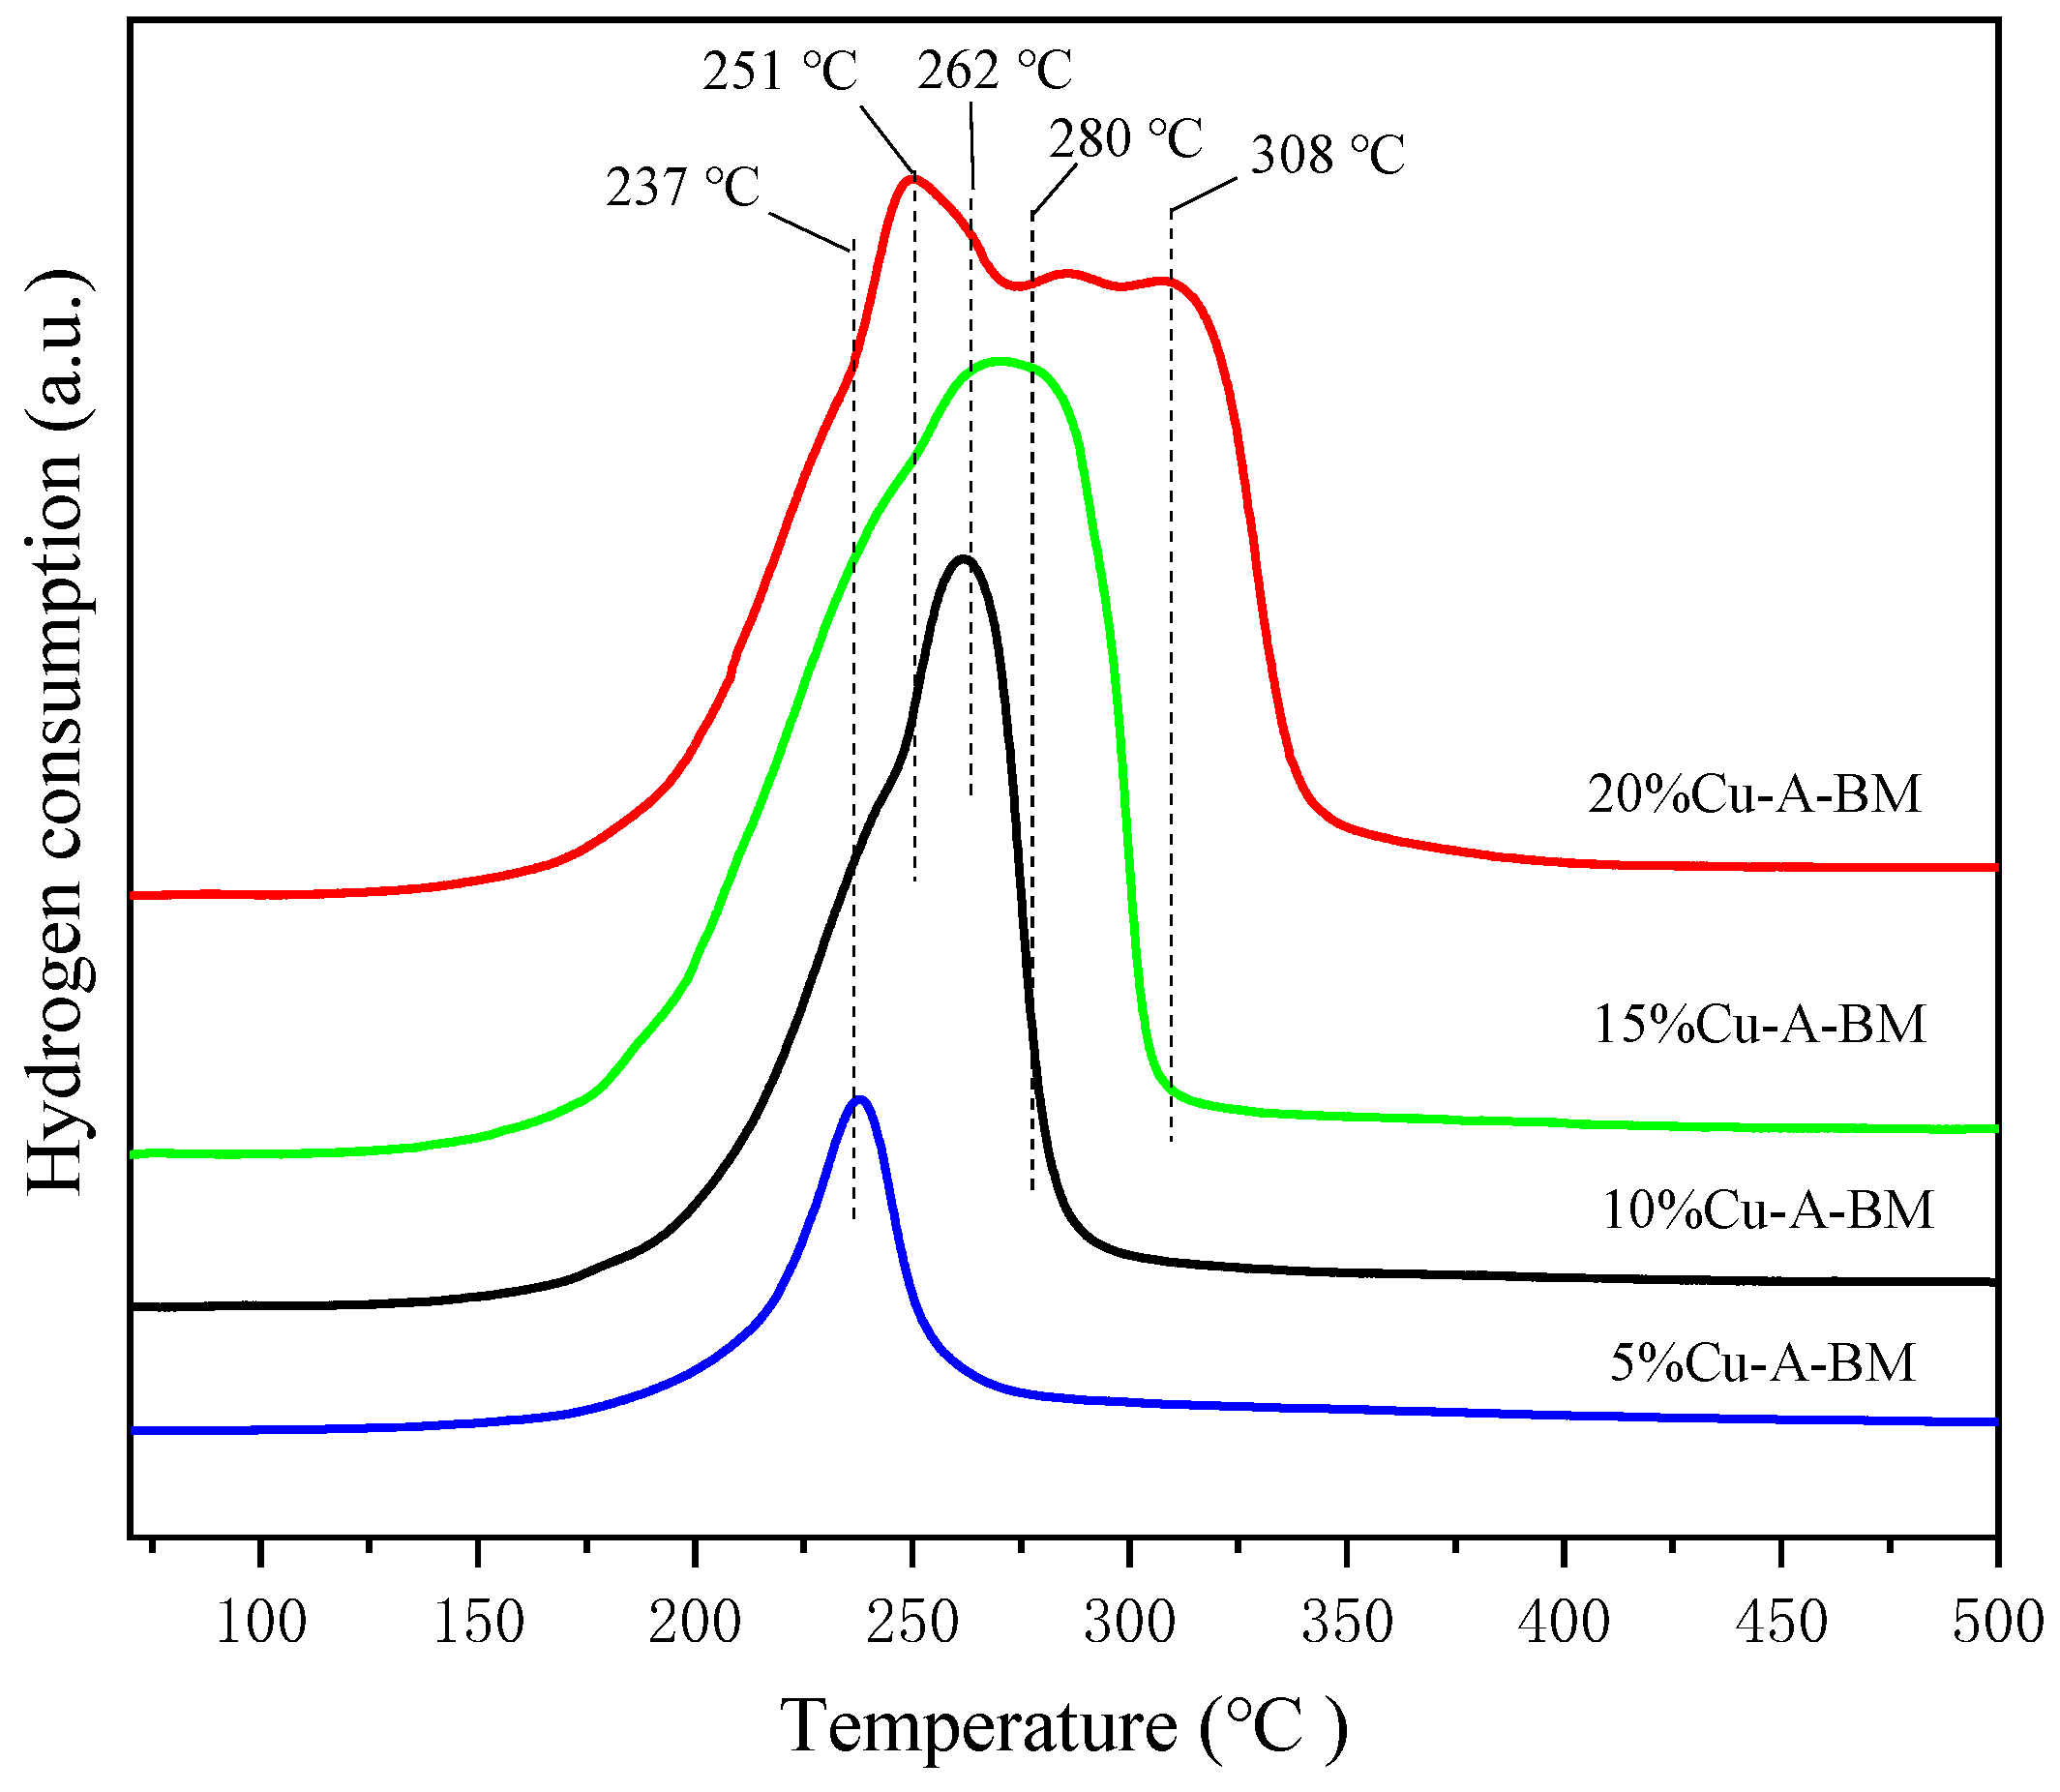
Figure 7 depicts H2-TPR profiles of W% Cu-A-BM catalysts. With the increase of W from 5 to 20, the reduction peaks toward high temperatures emerged besides low temperature peaks at 237 °C. Typically, the sample of 20% Cu-A-BM catalyst exhibited very big overlap peaks between 237 °C and 308 °C. The results of nH2/nCuO over 5% Cu-A-BM, 10% Cu-A-BM, 15% Cu-A-BM and 20% Cu-A-BM catalysts were 0.69, 0.79, 0.79, and 0.85, respectively. According to the CO/CP values listed in the Table 3, the calculated results of nH2/nCuO over the W% Cu-A-BM catalysts were 0.72, 0.79, 0.79, and 0.77 as W were 5, 10, 15, and 20, respectively, which were very close to the above values calculated from TPR results.
From the above analysis, the low temperature reduction peaks (240 °C< Tr <280 °C) could be assigned to the reduction of highly dispersed CuO species. And copper phyllosilicate species and the CuO cluster could be reduced at ~240 °C [31,34]. Furthermore, the high-temperature reduction peaks (Tr >280 °C) could be attributed to the reduction of bulk CuO [35,36].
2.8. HAADF-STEM Results
HAADF-STEM images and CuO particle size distributions of the the 15% Cu-A-BM are displayed in Figure 8. It could be observed that the particles of CuO on the 15% Cu-A-BM were highly dispersed on SiO2 ranging from 0.5 nm to 4.0 nm with average particle size of 1.8 nm. The particle size of CuO measured by the HAADF-STEM was smaller than the crystalline size calculated by XRD (7.3 nm) as the crystalline of CuO on the 15% Cu-A-BM sample was too small to be detected by XRD.
2.9. N2O Chemisorption Results
The N2O chemisorption is a useful method to evaluate the particle size, dispersion, and active area of highly dispersed, supported copper catalysts, which is difficult to measure by XRD and TEM [37]. As previously mentioned, the catalysts prepared by BM method would result in the formation of copper phyllosilicate which could not be reduced to Cu0 but Cu+. Consequently, the dispersion and particle size of Cu could not be calculated directly by using the formulas in the literature of [37]. The X in the experimental section for N2O chemisorptions must be calibrated and subtract the reduction peak area owed to the copper phyllosilicate reduction according to XPS results listed in Table 3. The results of dChem, D, and S were listed in Table 4 including dTEM and dXRD. Evidently, the dChem of copper particles on 5% Cu-A-BM was 1.0 nm with 100% dispersion. The copper particle sizes of the 10% Cu-A-BM sample and the 15% Cu-A-BM sample increased slightly to 1.2 nm and 1.4 nm. Drastically, the dChem of copper of the 20% Cu-A-BM reached 3.0 nm. The dChem of copper of the 10% Cu-O-BM was 3.2 nm, which was bigger than that of the 10% Cu-A-BM. Not surprisingly, the dChem of copper of the 10% Cu-N-IM was the biggest (10.1 nm). In terms of the surface active area of copper, the W% Cu-A-BM samples also owned the largest surface active area of 50.2 m2/g. The trend was completely consistent with the trend of surface copper atom proportion measured by XPS (shown in Table 3).
2.10. Catalytic Activity Results
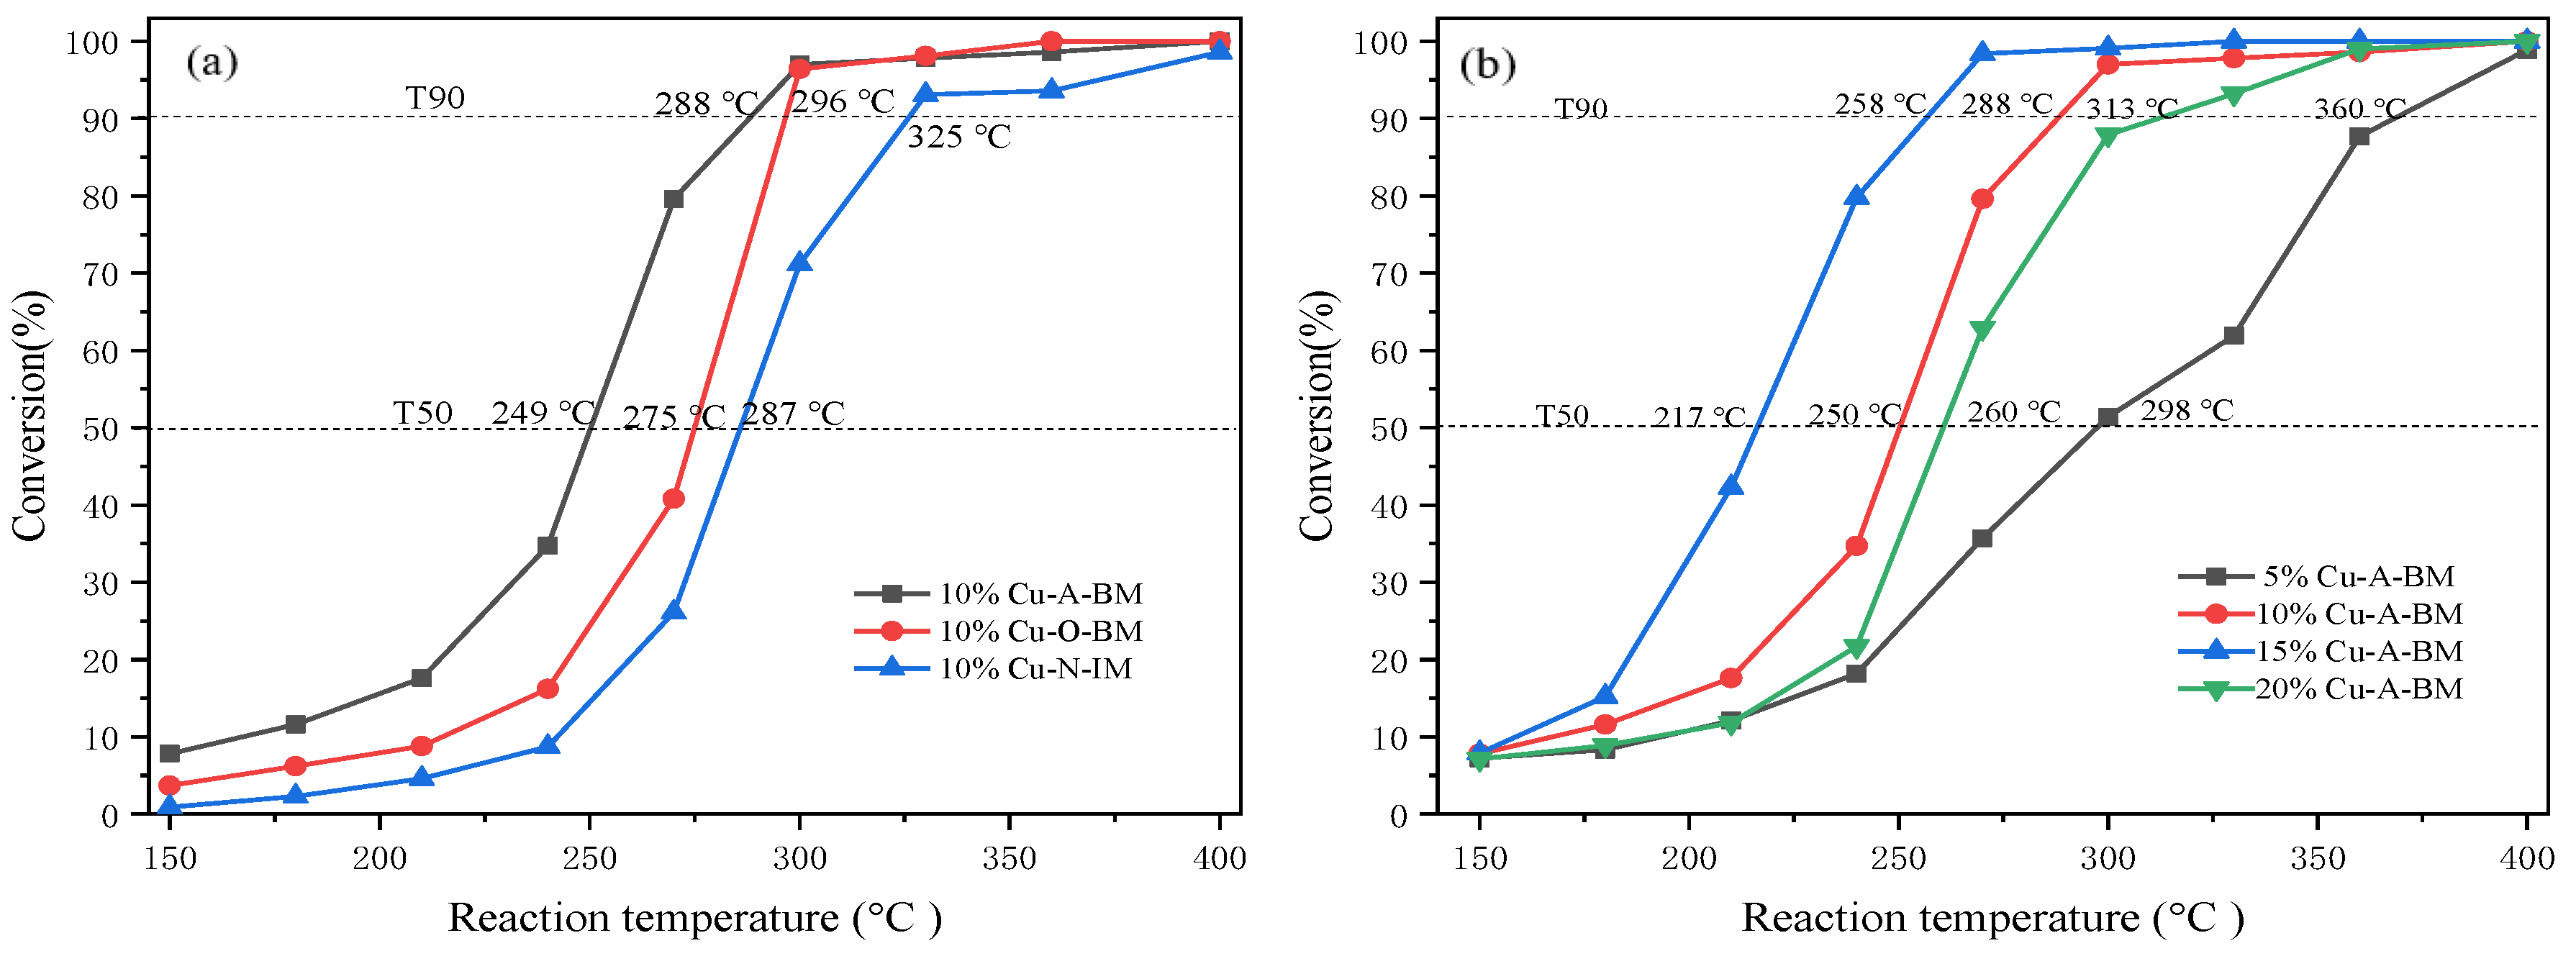
In order to directly evaluate catalytic activities of all prepared catalysts, ethyl acetate, a typical compound of VOCs, was used as a model compound of VOCs for catalytic combustion reaction. The conversion of ethyl acetate curves is described in Figure 9a. The T50 (the temperature at the conversion of 50%) of 10% Cu-A-BM, 10% Cu-O-BM and 10% Cu-N-IM were 249 °C, 275 °C, and 287 °C, respectively. And the T90 (the temperature at the conversion of 90%) of 10% Cu-A-BM, 10% Cu-O-BM and 10% Cu-N-IM were 288 °C, 296 °C, and 325 °C, respectively. Obviously, the catalysts prepared via BM method showed higher catalytic activities than the catalyst prepared by impregnation. In addition, the 10% Cu-A-BM exhibited higher catalytic performance than the 10% Cu-O-BM showing that the precursor of copper acetate was better than the precursor of copper oxide for the BM method. The catalytic combustion products of ethyl acetate were CO2, H2O, and CO as well. The desired product was CO2 rather than the toxic CO. The selectivities of CO2 over all the catalysts of 10% Cu-A-BM, 10% Cu-O-BM and 10% Cu-N-IM were >95% as the reaction temperature were >330 °C (Figure S8a).
The catalytic activities of the catalysts of W% Cu-A-BM (W = 5, 10, 15, 20) were described in Figure 9b. It could be seen that the activity of the W% Cu-A-BM heavily depended on the W. As the W increased from 5 to 15, the T50 decreased from 298 °C to 217 °C. However, as the W continuously increased to 20, the T50 shifted to a high temperature at 260 °C. Regarding T90, the temperature sequence was 5% Cu-A-BM (360 °C) > 20% Cu-A-BM (313 °C) > 10% Cu-A-BM (288 °C) > 15% Cu-A-BM (258 °C). It could be seen that the activity of the W% Cu-A-BM heavily depends on the W and the optimal loading of copper is 15%. The selectivities of CO2 over the W% Cu-A-BM catalysts were presented on the Figure S8b. The 15% Cu-A-BM catalyst had the highest CO2 selectivity with 100% as the reaction temperature was >270 °C. However, the others catalysts exhibited lower selectivities of CO2.
The catalytic stability performance of 15% Cu-A-BM catalyst was conducted at 270 °C (shown in Figure S9). The conversion of ethyl acetate decreased significantly from 98.8% to 96.3% after 16 h reaction on stream. In order to reveal the reason of catalytic decay, the spent 15% Cu-A-BM catalyst was characterized by XRD (Figure S10). It was found that the crystalline size of CuO increased from 7.2 nm to 9.5 nm after reaction. Thus, the sinter of CuO was the major cause of catalytic decrease of 15% Cu-A-BM catalyst.
3. Discussion
3.1. Structural Evolution of the W% Cu-A-BM Catalysts during Preparation
From the catalytic results, we could learn that the catalysts of CuO/SiO2 prepared via BM method exhibited better catalytic activities for the catalytic combustion of ethyl acetate. The structure of catalysts is well known to be crucial for catalytic activity. It is of great importance to understand the structural evolution of the W% Cu-A-BM catalysts during the BM process, which is critical to the mechanism for the active structure formation. The dehydration occurred in the temperature region of 50–150 °C as shown in the TG-DSC curve of uncalcined the 20% Cu-A-BM sample, proving by the FT-IR that the peaks for the adsorbed H2O had completely disappeared below 200 °C as shown in Figure 4. The TG-DSC results of uncalcined W% Cu-A-BM samples also showed that the species’ decomposed temperature of copper acetate shifted to a lower temperature between 200 °C and 300 °C after being subjected to BM which milled the copper acetate from bulk to nanostructure (Figure S4). The absorption peaks corresponded to methyl and carbonyl group disappeared between 200 and 300 °C verified the results of TG-DSC. The weight loss of uncalcined 20% Cu-A-BM sample was almost half of the theoretical value. The XPS results of uncalcined 20% Cu-A-BM sample exhibited copper acetate and copper phyllosilicate species on the sample with a molar ratio of 4.92, which matched well with the TG-DSC results. The crystal phase evolution over the 20% Cu-A-BM with different pretreated temperatures was detected by XRD. The formation of copper oxide over the 20% Cu-A-BM as the pretreated temperature increased to 200 °C was also clearly observed. In the range of 300–400 °C, cuprous oxide (Cu2O) crystal phases were detected. Nevertheless, when increasing the pretreated temperature to 500 °C, the diffraction peak of Cu2O disappeared and the intensity of CuO diffraction peak became strong accordingly. The slight recovery of the mass at 400–500 °C was also detected by the TG-DSC of the copper acetate sample, indicating that Cu2O was oxidized to CuO [37]. Combined with the literature [20,27] and the results of XRD, FT-IR, TG-DSC, and XPS, the structural evolution of the W% Cu-A-BM catalyst could be inferred as below. (The copper phyllosilicate was not illustrated in the following evolution steps as it was partially formed during BM process.
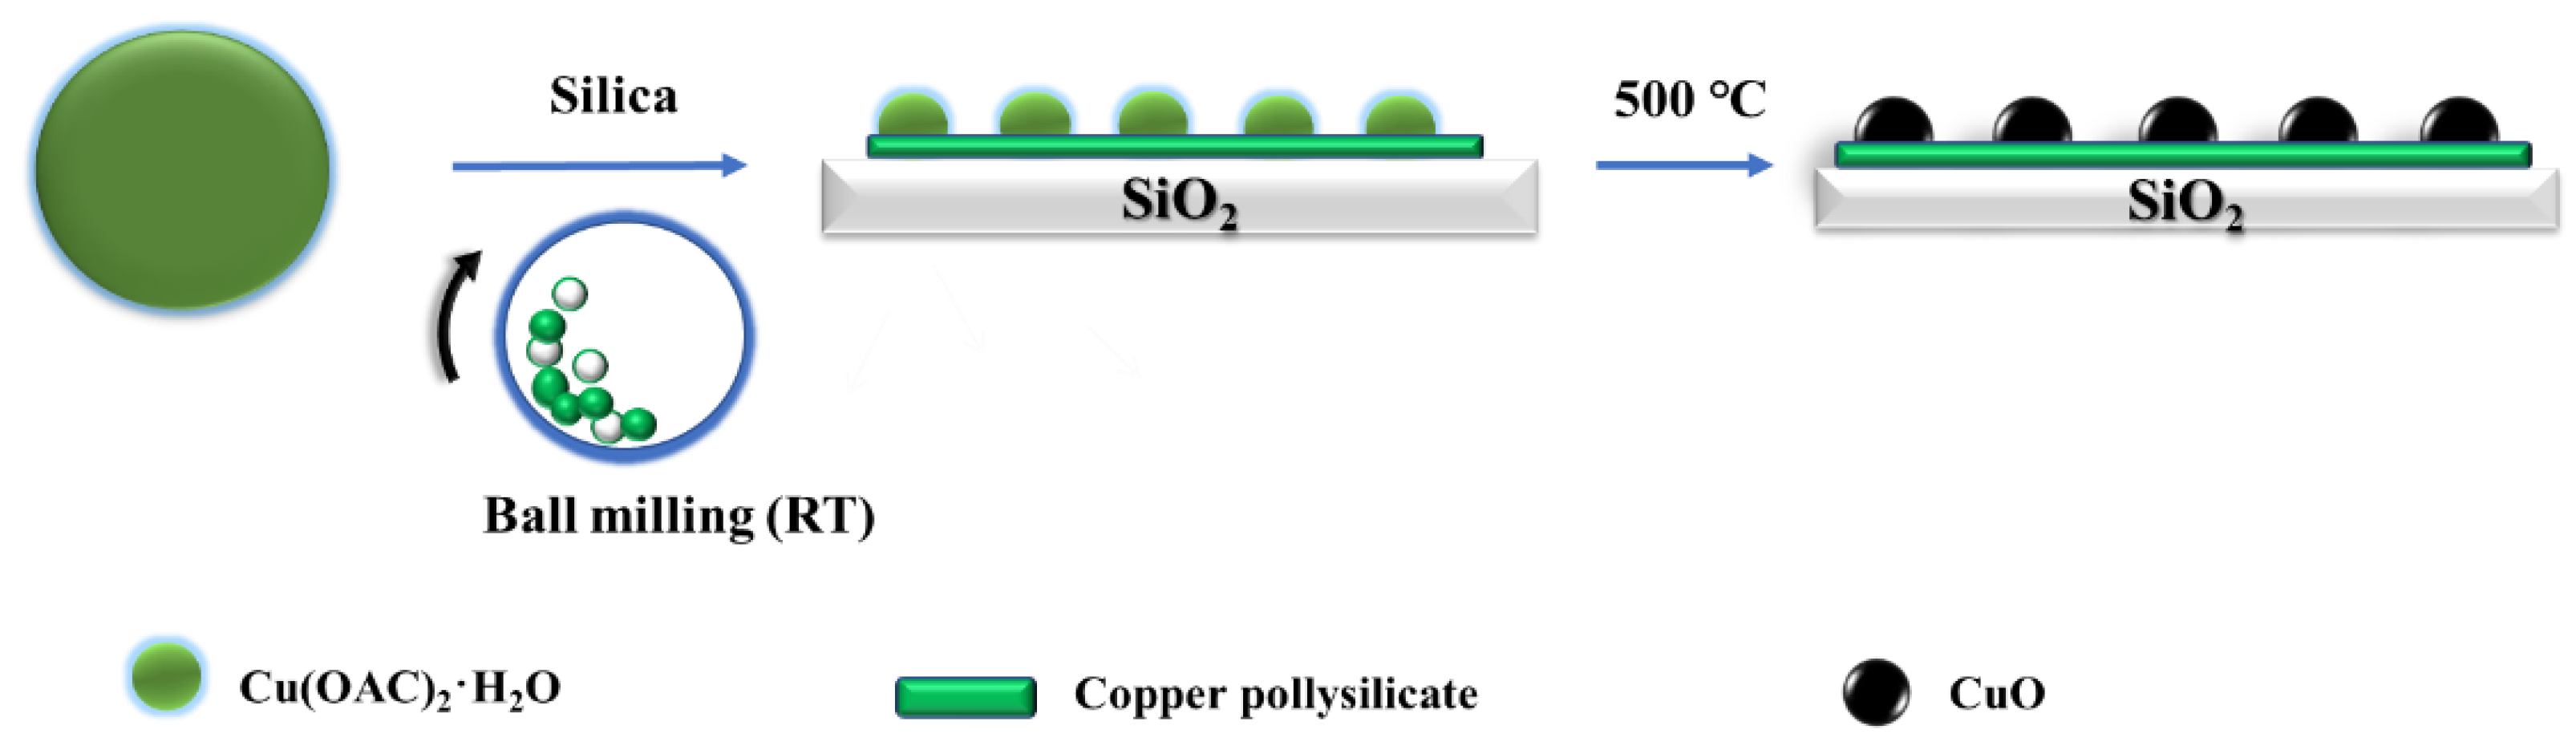
Based on the above results, the simplified evolution scheme of W% Cu-A-BM catalysts is presented in the Scheme 1. The CuO clusters (<2.0 nm) on the W% Cu-A-BM catalysts (W < 20) were highly dispersed on the supports after calcination at 500 °C as the copper phyllosilicate layer could disperse the bulk of copper acetate through BM. Meanwhile, the CuO clusters were also stabilized by the copper phyllosilicate layer, which were formed during the thermal pretreatment and the BM processes.
- Ball milling steps:
- (1)
- (2)
- Cu(OAC)2 · H2O + SiO2 → Cu(OAC)2 · H2O /SiO2
- Thermal pretreatment steps:
- (1)
- 50–200 °C
- (2)
- 200–400 °C
- (3)
- 400–500 °C+ O2 CuO/SiO2
3.2. Structure-Activity Relationship
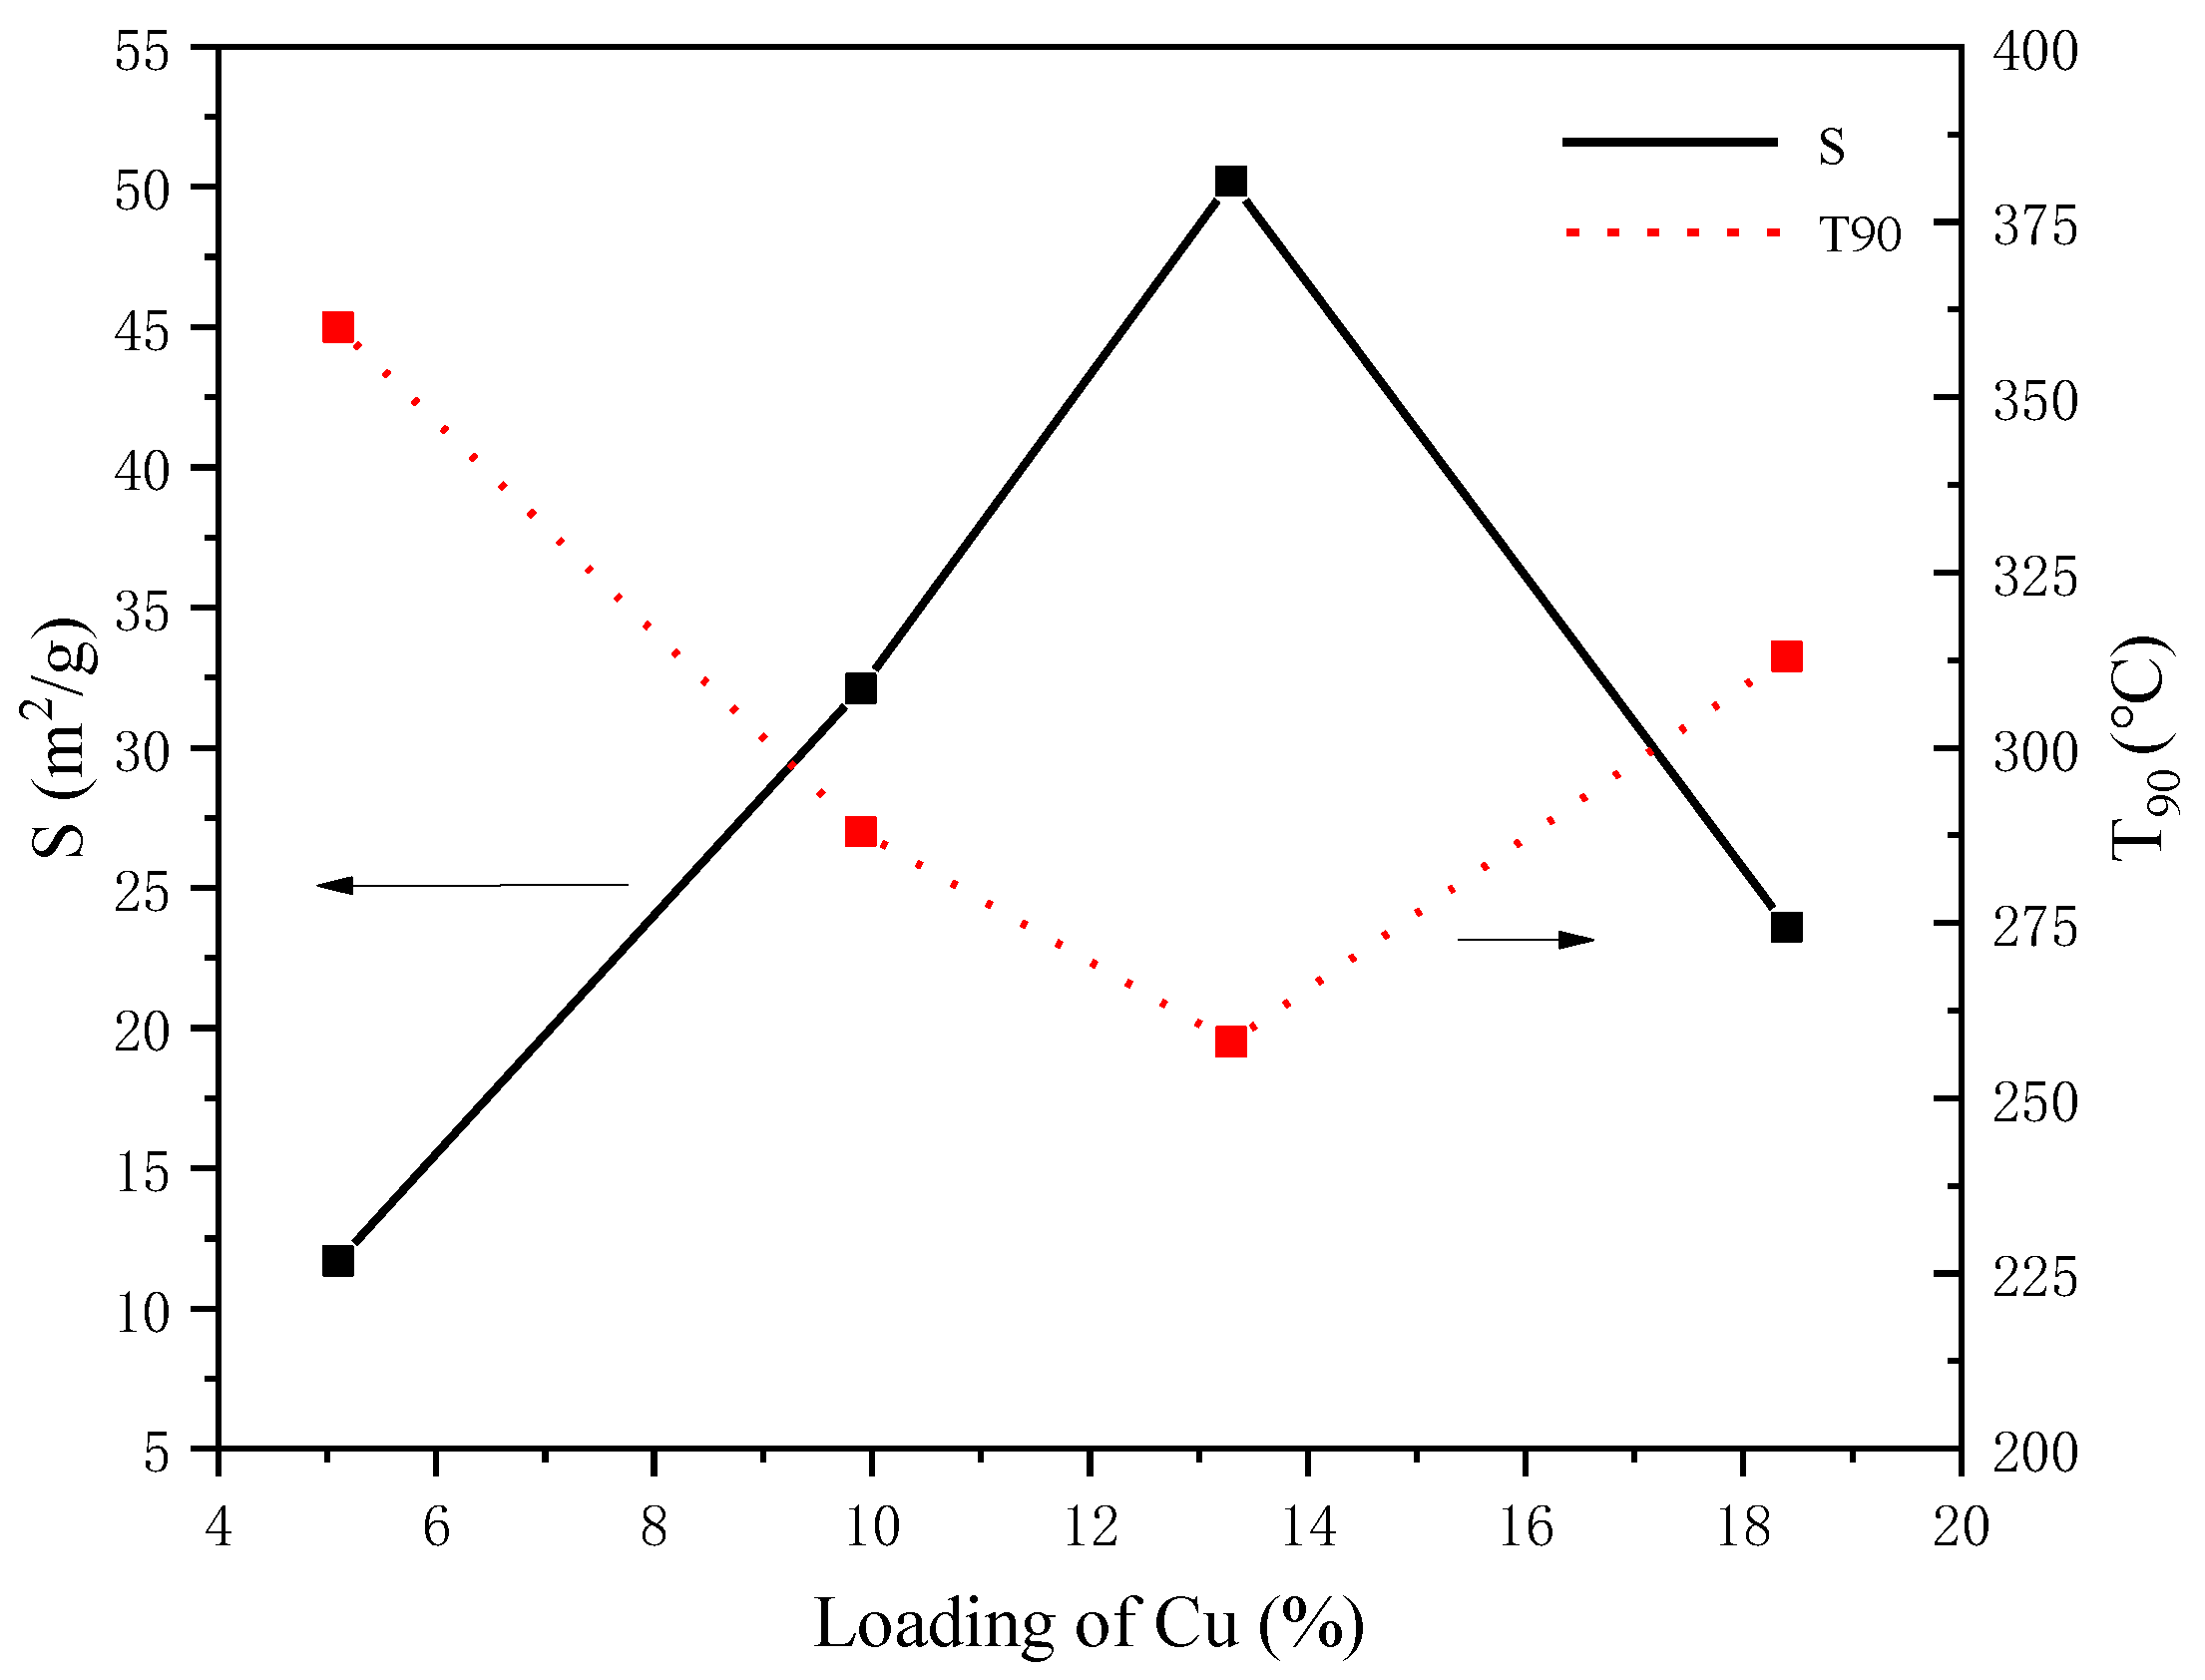
The CuO/SiO2 catalysts were prepared by traditional impregnation and BM methods. The results of XRD (Figure 2), XPS (Table 3), HAADF-STEM (Figure 8), and N2O chemisorptions (Table 4) confirmed that CuO particles supported by the BM method were highly dispersed on the silica. The catalytic activities of the catalysts prepared by BM were higher than that of the 10% Cu-N-IM. Meanwhile, the precursors of CuO had an important effect on the catalytic activities of the catalysts prepared with BM. The copper acetate was an ideal precursor for the CuO/SiO2 catalysts not only for the catalysts prepared from it having higher CuO dispersion and thus better catalytic performance but also for its eco-friendly property without highly toxic gases emitted during thermal pretreatment. The effect of Cu loading over the W% Cu-A-BM catalysts on the catalytic combustion of ethyl acetate was also investigated (Figure 9b). The effect of copper loading over the W% Cu-A-BM catalysts on the copper active surfaces and the T90 is depicted in the Figure 10. Evidently, the T90 was related closely with the S (m2/g catalyst, copper active surface area) that higher S had lower T90. In summary, the catalytic performances of the CuO/SiO2 catalysts for ethyl acetate combustion could be correlated with the dispersion of CuO over the silica support.
4. Experimental
4.1. Catalyst Preparation
The catalysts of CuO/SiO2 were prepared by the ball milling (BM) method on a planetary mill PULVERISETTE 5 premium line (FRITSCH, Idar-Oberstein, Germany). The appropriate amounts of copper acetate or CuO and SiO2 support were milled in a 150 mL zirconia BM jar with zirconia grinding balls (diameter: 3 mm) by using a rotation speed of 500 rpm for 2 h. And the powder-to-ball mass ratios were kept at 1:5 in all the BM experiments. After BM, the samples were dried at 100 °C for 8 h, and then calcined in a muffle furnace in static air atmosphere for 4 h at 500 °C unless stated otherwise. The prepared CuO/SiO2 catalysts are denoted as W%Cu-A-BM or W%Cu-O-BM, in which W, A, O, and BM stand for weight percent of Cu in a sample, copper acetate, copper oxide, and ball milling method, respectively. For example, 10% Cu-A-BM means that the loading of Cu is 10% over the CuO/SiO2 catalyst prepared with BM method and the precursor of CuO is copper acetate.
The reference sample of CuO/SiO2 with 10% loading of copper named as 10% Cu-N-IM was prepared by the incipient wetness impregnation method. The copper nitrate was adopted as precursor instead of copper acetate which is less dissoluble in water. The thermal pretreatment procedure of 10% Cu-N-IM was the same as that of the aforementioned catalysts.
4.2. Catalyst Characterization
Simultaneous thermogravimetric—differential scanning calorimetry (TG-DSC) measurements were carried out by using a NETZSCH-STA449 F3 Thermal Analyzer (Selb, Germany). The experiments were performed in flowing air atmosphere (flow rate = 10 mL/min) with a heating rate of 10 °C/min.
X-ray diffraction (XRD) tests were performed on a Rigaku Miniflex600 (Tokyo, Japan) with 2θ range from 20 to 80° and a step size of 0.02° by using Cu Kα radiation. The crystalline sizes of CuO were estimated by using the Scherrer equation.
Fourier transform infrared (FT-IR) spectra were recorded by an attenuated total reflection Fourier transform infrared spectrometer (Frontier, PE, USA) with the spectral range of 4000–650 cm−1 and diffuse mode in air atmosphere.
High-angle annular dark field scanning transmission electron microscope images were obtained on a transmission electron microscope (FEI Talos F200S, Hillsboro, OR, USA). Transmission electron microscope (TEM) images were taken on a Titan G260-300 (Hillsboro, OR, USA). Before the HAADF-STEM/TEM measurements, the samples were dispersed in ethanol by sonication for 10/30 min. And then, the sample suspensions were dropped on copper grids.
X-ray photoelectron spectroscopy (XPS) characterizations were conducted on the Thermo Scientific K-Alpha X-ray photoelectron spectrometer (Hillsboro, OR, USA) with monochromatic Al Kα irradiation with a voltage of 12 kw and a filament current of 6 mA. The binding energy (BE) of C 1s signal of contaminant carbon at 284.8 eV was used as a reference for BE calibration.
Hydrogen temperature programmed reduction (H2-TPR) was investigated on VDSorb-91i-BMFC automatic chemical adsorption instrument (Vodo, QuZhou, China). The reactant of 5%H2/N2 mixed gas was introduced to the 0.050-g catalyst plugged with quartz wool in the U-shaped reaction tube (I.D.: 1/4 inch) with a flow rate of 10 mL/min and a heating rate of 10 °C/min. The effluent gas was analyzed by TCD after being dried with silica gel.
The Brunauer–Emmett–Teller (BET) specific surface area, isothermal curves and BJH pore-size distribution of the samples were measured by using an instrument of Quantachrome NOVA 2200e (Boynton Beach, FL, USA). The samples were degassed at 300 °C for 3 h before measurements. The BET determination was based on the data of the adsorption isotherms of N2 at liquid nitrogen temperature (77 K). The surface areas were calculated from the BET equation in the relative pressure from 0.05 to 0.25 with 10 adsorption points. The authentic copper loadings over the samples were determined by using an inductive coupled plasma emission spectrometer (ICP-OES, Agilent 720ES, Santa Clara, CA, USA). Before ICP-OES measurement, the weighed samples were dissolved with aqua regia and hydrofluoric acid by an electrothermal digestion apparatus at 200 °C for 30 min.
N2O chemisorption for copper dispersion measurements were performed on TP5080 according to the literature [37]. The procedure was briefly described as follows. First, 50 mg of the sample was loaded into the reactor and reduced by 5% H2/N2 at room temperature to 350 °C and continuously reduced at 350 °C for 1 h. The reduction peak was recorded by TCD. After reduction, the temperature was cooled down to 90 °C under an N2 atmosphere. Then, N2O gas was introduced to the reduced sample at 90 °C for 30 min. Subsequently, the oxidized sample was purged by N2 from 90 °C to room temperature. Finally, a TPR experiment was performed at room temperature to 500 °C. After the above procedures, two groups of reduction peaks were obtained. The first and the second group of reduction peak area were denoted as X and Y. The average particle size, dispersion, and active area of the catalyst were calculated as follows:
Average particle size, d = 0.5 X/Y (nm).
Dispersion, D = (2 Y/X) 100%.
Surface area of copper, S = x% (1353Y/X) (m2Cu/gcatalyst). In the formula, x% is the Cu loading of the catalyst.
It was notable that the values of X in the above equations were calibrated as they could not be used directly, which was elucidated in Section 2.9.
4.3. Catalytic Reaction
The catalytic combustion of ethyl acetate was carried out on a fixed-bed reactor (Vodo, Quzhou, China). Typically, 100 mg of the catalyst was loaded in the middle of the vertical quartz reactor (DI: 6 mm) and plugged by quartz wool. A thermocouple was inserted into the reactor above the catalyst (no contact) to control the reaction temperature. The reactant of ethyl acetate, which was kept at 0 °C by a cooler, was diluted with synthetic air to control the concentration of 1000 ppm with a total flow rate of 100 mL/min monitored by mass flow controllers (Horiba, Beijing, China). A gas hourly space velocity (GHSV) of mL·h−1·g−1 was adopted. The effluent gas was analyzed by a gas chromatograph (GC, Fuli GC9700, Taizhou, China) equipped with two FID detectors and two columns. The one column was a SE-30 column for organic gases separation. The other column was a TDX-01 column combining with a methanizer for the analysis of CO and CO2. During the catalytic combustion reaction of ethyl acetate, the only detected by-product was CO.
5. Conclusions
Highly dispersed CuO/SiO2 catalysts for catalytic combustion of ethyl acetate were prepared by a green process of solvent-free BM method. We found that copper acetate was an ideal precursor for the highly dispersed CuO/SiO2 catalysts as no toxic gas was emitted during preparation. The structural evolution of CuO/SiO2 catalysts during BM and thermal pretreatment was elucidated via TG-DSC, FT-IR and XPS techniques. It was found that the copper acetate interacted with the silica support to form copper phyllosilicate during BM process. The copper phyllosilicate layer might play an important role in preventing the CuO clusters from sintering as the copper loading was <20%. The 15% CuO/SiO2 catalyst exhibited the highest catalytic activity for the catalytic combustion of ethyl acetate as it owned the highest surface area of CuO.
However, the catalytic performance of 15% Cu-A-BM catalyst decayed mildly when the catalytic reaction was performed time on stream for 17 h due to the slight sinter of CuO. The anti-sintering ability of CuO/SiO2 may be improved by introducing rare earth metal oxides such as CeO2, which is in progress in our group. The BM method is a versatile methodology for the preparation of different highly dispersed supported catalysts, which is also proceeding in our group.
Supplementary Materials
The following supporting information can be downloaded at: https://www.mdpi.com/article/10.3390/catal12050497/s1, Figure S1-A: Image of all uncalcined catalysts (a: 5%Cu-A-BM, b: 10%Cu-A-BM, c: 15%Cu-A-BM, d: 20%Cu-A-BM, e: 10%Cu-O-BM, f: 10%Cu-N-IM); Figure S1-B: Image of all catalysts (a: 5%Cu-A-BM, b: 10%Cu-A-BM, c: 15%Cu-A-BM, d: 20%Cu-A-BM, e:10%Cu-O-BM, f: 10%Cu-N-IM); Figure S2: TG-DSC of the 20%Cu-A-MM sample; Figure S3. N2 adsorption isotherms curves (A) and pore size distribution (B); Figure S4: XRD comparison of copper acetate standard before and after BM; Figure S5: FT-IR spectra of the calcined samples of 30%Cu-A-BM and 20%Cu-A-BM (The two samples were calcined at 500 °C); Figure S6: XPS surveys of all catalysts; Figure S7. Cu2p spectra of 20%Cu-A-BM (uncalcined); Figure S8: (a,b) Selectivities of CO2 over the CuO/SiO2 catalysts; Figure S9: Stability of the 15%Cu-A-BM catalyst at 270 °C; Figure S10: XRD patterns of the spent and the fresh 15%Cu-A-BM catalysts.
Author Contributions
Data curation, Y.Y. (Yuhang Ye) and Y.Y. (Yuchuan Ye); Investigation, L.M.; Methodology, H.C., H.Z., J.X. and L.W.; Supervision, L.M.; Writing—review & editing, L.M. All authors have read and agreed to the published version of the manuscript.
Funding
This research was funded by the NSFC-Zhejiang Joint Fund for Integration of Industrialization and Diversification (U1809214) and Zhoushan city science & technology research project (2019C21012).
Data Availability Statement
Data sharing is not applicable to this article.
Conflicts of Interest
The authors declare no conflict of interest.
References
- He, C.; Cheng, J.; Zhang, X.; Douthwaite, M.; Pattisson, S.; Hao, Z. Recent Advances in the Catalytic Oxidation of Volatile Organic Compounds: A Review Based on Pollutant Sorts and Sources. Chem. Rev. 2019, 119, 4471–4568. [Google Scholar] [CrossRef] [PubMed]
- Zhou, Y.; Zhang, H.; Yan, Y. Catalytic oxidation of ethyl acetate over CuO/ZSM-5 catalysts: Effect of preparation method. J. Taiwan Inst. Chem. Eng. 2018, 84, 162–172. [Google Scholar] [CrossRef]
- Kamal, M.S.; Razzak, S.A.; Hossain, M.M. Catalytic oxidation of volatile organic compounds (VOCs)—A review. Atmos. Environ. 2016, 140, 117–134. [Google Scholar] [CrossRef]
- Guo, Y.; Wen, M.; Li, G.; An, T. Recent advances in VOC elimination by catalytic oxidation technology onto various nanoparticles catalysts: A critical review. Appl. Catal. B: Environ. 2021, 281, 119447. [Google Scholar] [CrossRef]
- Dou, B.; Zhao, R.; Yan, N.; Zhao, C.; Hao, Q.; Hui, K.S.; Hui, K.N. A facilitated synthesis of hierarchically porous Cu–Ce–Zr catalyst using bacterial cellulose for VOCs oxidation. Mater. Chem. Phys. 2019, 237, 122181. [Google Scholar] [CrossRef]
- Kim, J.; Lee, B.-K. Enhanced photocatalytic decomposition of VOCs by visible-driven photocatalyst combined Cu-TiO2 and activated carbon fiber. Process Saf. Environ. Prot. 2018, 119, 164–171. [Google Scholar] [CrossRef]
- Munnik, P.; Wolters, M.; Gabrielsson, A.; Pollington, S.D.; Headdock, G.; Bitter, J.H.; de Jongh, P.E.; de Jong, K.P. Copper Nitrate Redispersion To Arrive at Highly Active Silica-Supported Copper Catalysts. J. Phys. Chem. C 2011, 115, 14698–14706. [Google Scholar] [CrossRef] [Green Version]
- Wang, S.; Li, X.; Yin, Q.; Zhu, L.; Luo, Z. Highly active and selective Cu/SiO2 catalysts prepared by the urea hydrolysis method in dimethyl oxalate hydrogenation. Catal. Commun. 2011, 12, 1246–1250. [Google Scholar] [CrossRef]
- Chen, C.-C.; Lin, L.; Ye, R.-P.; Huang, L.; Zhu, L.-B.; Huang, Y.-Y.; Qin, Y.-Y.; Yao, Y.-G. Construction of Cu-Ce composite oxides by simultaneous ammonia evaporation method to enhance catalytic performance of Ce-Cu/SiO2 catalysts for dimethyl oxalate hydrogenation. Fuel 2021, 290, 120083. [Google Scholar] [CrossRef]
- Huang, Z.; Cui, F.; Xue, J. Synthesis and structural characterization of silica dispersed copper nanomaterials with unusual thermal stability prepared by precipitation-gel method. J. Phys. Chem. C 2010, 114, 16104–16113. [Google Scholar] [CrossRef]
- Huang, Z.; Cui, F.; Kang, H. Highly dispersed silica-supported copper nanoparticles prepared by precipitation-gel method: A simple but efficient and stable catalyst for glycerol hydrogenolysis. Chem. Mater. 2008, 20, 5090–5099. [Google Scholar] [CrossRef]
- Chen, L.; Guo, P.; Qiao, M.; Yan, S.; Li, H.; Shen, W.; Xu, H.; Fan, K. Cu/SiO2 catalysts prepared by the ammonia-evaporation method: Texture, structure, and catalytic performance in hydrogenation of dimethyl oxalate to ethylene glycol. J. Catal. 2008, 257, 172–180. [Google Scholar] [CrossRef]
- He, X.; He, Q.; Deng, Y.; Peng, M.; Chen, H.; Zhang, Y.; Yao, S.; Zhang, M.; Xiao, D.; Ma, D.; et al. A versatile route to fabricate single atom catalysts with high chemoselectivity and regioselectivity in hydrogenation. Nat. Commun. 2019, 10, 1–9. [Google Scholar] [CrossRef] [PubMed] [Green Version]
- Chen, C.S.; Lin, J.H.; You, J.H. Properties of Cu (thd) 2 as a precursor to prepare Cu/SiO2 catalyst using the atomic layer epitaxy technique. J. Am. Chem. Soc. 2006, 128, 15950–15951. [Google Scholar] [CrossRef] [PubMed]
- Chen, C.S.; Chen, C.C.; Chen, C.T.; Kao, H.M. Synthesis of Cu nanoparticles in mesoporous silica SBA-15 functionalized with carboxylic acid groups. Chem. Commun. 2011, 47, 2288–2290. [Google Scholar] [CrossRef]
- Kohler, M.K.; Curry-Hyde, H.E.; Hughes, A.E. The structure of CuSiO2 catalysts prepared by the ion-exchange technique. J. Catal. 1987, 108, 323–333. [Google Scholar] [CrossRef]
- Zhang, K.; Chew, C.H.; Xu, G.Q. Synthesis and characterization of silica-copper oxide composite derived from microemulsion processing. Langmuir 1999, 15, 3056–3061. [Google Scholar] [CrossRef]
- Mo, L.; Saw, E.T.; Du, Y.; Borgna, A.; Ang, M.L.; Kathiraser, Y.; Li, Z.; Thitsartarn, W.; Lin, M.; Kawi, S. Highly dispersed supported metal catalysts prepared via in-situ self-assembled core-shell precursor route. Int. J. Hydrogen Energy 2015, 40, 13388–13398. [Google Scholar] [CrossRef]
- Mo, L.; Kawi, S. An in situ self-assembled core–shell precursor route to prepare ultrasmall copper nanoparticles on silica catalysts. J. Mater. Chem. A 2014, 2, 7837–7844. [Google Scholar] [CrossRef]
- James, S.L.; Adams, C.J.; Bolm, C.; Braga, D.; Collier, P.; Friscic, T.; Grepioni, F.; Harris, K.D.; Hyett, G.; Jones, W.; et al. Mechanochemistry: Opportunities for new and cleaner synthesis. Chem. Soc. Rev. 2012, 41, 413–447. [Google Scholar] [CrossRef] [Green Version]
- Kamolphop, U.; Taylor, S.F.R.; Breen, J.P.; Burch, R.; Delgado, J.J.; Chansai, S.; Hardacre, C.; Hengrasmee, S.; James, S.L. Low-Temperature Selective Catalytic Reduction (SCR) of NOx with n-Octane Using Solvent-Free Mechanochemically Prepared Ag/Al2O3 Catalysts. ACS Catal. 2011, 1, 1257–1262. [Google Scholar] [CrossRef]
- Yang, L.; Fan, C.; Luo, L.; Chen, Y.; Wu, Z.; Qin, Z.; Dong, M.; Fan, W.; Wang, J. Preparation of Pd/SiO2 Catalysts by a Simple Dry Ball-Milling Method for Lean Methane Oxidation and Probe of the State of Active Pd Species. Catalysts 2021, 11, 725. [Google Scholar] [CrossRef]
- He, X.; Deng, Y.; Zhang, Y.; He, Q.; Xiao, D.; Peng, M.; Zhao, Y.; Zhang, H.; Luo, R.; Gan, T.; et al. Mechanochemical Kilogram-Scale Synthesis of Noble Metal Single-Atom Catalysts. Cell Rep. Phys. Sci. 2020, 1, 100004. [Google Scholar] [CrossRef]
- Gan, T.; He, Q.; Zhang, H.; Xiao, H.; Liu, Y.; Zhang, Y.; He, X.; Ji, H. Unveiling the kilogram-scale gold single-atom catalysts via ball milling for preferential oxidation of CO in excess hydrogen. Chem. Eng. J. 2020, 389, 124490. [Google Scholar] [CrossRef]
- Amrute, A.P.; De Bellis, J.; Felderhoff, M.; Schüth, F. Mechanochemical synthesis of catalytic materials. Chem. Eur. J. 2021, 27, 6819–6847. [Google Scholar] [CrossRef]
- Zhang, K.; Hong, J.; Cao, G.; Zhan, D.; Tao, Y.; Cong, C. The kinetics of thermal dehydration of copper(II) acetate monohydrate in air. Therm. Acta 2005, 437, 145–149. [Google Scholar] [CrossRef]
- Lin, Z.; Han, D.; Li, S. Study on thermal decomposition of copper(II) acetate monohydrate in air. J. Therm. Anal. Calorim. 2011, 107, 471–475. [Google Scholar] [CrossRef]
- Habibi, M.H.; Karimi, B. Application of impregnation combustion method for fabrication of nanostructure CuO/ZnO composite oxide: XRD, FESEM, DRS and FTIR study. J. Ind. Eng. Chem. 2014, 20, 1566–1570. [Google Scholar] [CrossRef]
- Bette, S.; Costes, A.; Kremer, R.K.; Eggert, G.; Tang, C.C.; Dinnebier, R.E. On Verdigris, Part III: Crystal Structure, Magnetic and Spectral Properties of Anhydrous Copper(II) Acetate, a Paddle Wheel Chain. Z. Anorg.Und Allg. Chem. 2019, 645, 988–997. [Google Scholar] [CrossRef]
- Geng, L.; Li, G.; Zhang, X.; Wang, X.; Li, C.; Liu, Z.; Zhang, D.-S.; Zhang, Y.-Z.; Wang, G.; Han, H. Rational design of CuO/SiO2 nanocatalyst with anchor structure and hydrophilic surface for efficient hydrogenation of nitrophenol. J. Solid State Chem. 2021, 296, 121960. [Google Scholar] [CrossRef]
- Ren, Z.; Younis, M.N.; Zhao, H.; Li, C.; Yang, X.; Wang, E.; Wang, G. Silver modified Cu/SiO2 catalyst for the hydrogenation of methyl acetate to ethanol. Chin. J. Chem. Eng. 2020, 28, 1612–1622. [Google Scholar] [CrossRef]
- Chen, C.-C.; Lin, L.; Ye, R.-P.; Sun, M.-L.; Yang, J.-X.; Li, F.; Yao, Y.-G. Mannitol as a novel dopant for Cu/SiO2: A low-cost, environmental and highly stable catalyst for dimethyl oxalate hydrogenation without hydrogen prereduction. J. Catal. 2020, 389, 421–431. [Google Scholar] [CrossRef]
- Bian, Z.; Zhong, W.; Yu, Y.; Jiang, B.; Kawi, S. Cu/SiO2 derived from copper phyllosilicate for low-temperature water-gas shift reaction: Role of Cu+ sites. Int. J. Hydrogen Energy 2020, 45, 27078–27088. [Google Scholar] [CrossRef]
- Wang, Z.-Q.; Xu, Z.-N.; Peng, S.-Y.; Zhang, M.-J.; Lu, G.; Chen, Q.-S.; Chen, Y.; Guo, G.-C. High-Performance and Long-Lived Cu/SiO2 Nanocatalyst for CO2 Hydrogenation. ACS Catal. 2015, 5, 4255–4259. [Google Scholar] [CrossRef]
- He, M.; Luo, M.; Fang, P. Characterization of CuO Species and Thermal Solid-Solid Interaction in CuO/CeO2-Al2O3 Catalyst by In-Situ XRD, Raman Spectroscopy and TPR. J. Rare Earths 2020, 24, 188–192. [Google Scholar] [CrossRef]
- Marrero-Jerez, J.; Chinarro, E.; Moreno, B.; Peña-Martínez, J.; Núñez, P. CGO20–CuO composites synthesized by the combus-tion method and characterized by H2-TPR. Ceram. Int. 2015, 41, 10904–10909. [Google Scholar] [CrossRef]
- Van Der Grift, C.J.G.; Wielers, A.F.H.; Jogh, B. Effect of the reduction treatment on the structure and reactivity of sili-ca-supported copper particles. J. Catal. 1991, 131, 178–189. [Google Scholar] [CrossRef]
Figure 1.
TG/DSC curves of Cu (OAC)2·H2O (a) and 20%Cu-A-BM (b).

Figure 2.
XRD patterns of W%Cu-A-BM, 10%Cu-O-BM, 10%Cu-N-IM catalysts calcined at 500 °C.

Figure 3.
XRD patterns of 20%Cu-A-BM samples pretreated at different temperatures.

Figure 4.
FT-IR spectra of 20% Cu-A-BM samples calcined at different temperatures.

Figure 5.
Cu2p spectra of CuO/SiO2 catalysts.

Figure 6.
TPR profiles of CuO/SiO2 catalysts prepared from different precursors and methods.

Figure 7.
TPR profiles of W% Cu-A-BM catalysts.

Figure 8.
HAADF-STEM and particle size statistics of 15% Cu-A-BM catalyst.

Figure 9.
Catalytic activity of 10% Cu-A-BM, 10% Cu-O-BM, 10% Cu-N-IM (a) and W% Cu-A-BM catalysts (b).
Figure 9.
Catalytic activity of 10% Cu-A-BM, 10% Cu-O-BM, 10% Cu-N-IM (a) and W% Cu-A-BM catalysts (b).

Scheme 1.
Simplified diagrammatic evolution of W% Cu-A-BM catalysts.

Figure 10.
Effect of copper loading over the W% Cu-A-BM catalysts on the copper active surfaces and the T90.
Figure 10.
Effect of copper loading over the W% Cu-A-BM catalysts on the copper active surfaces and the T90.


Table 1.
The textural properties and ICP results of W%Cu-A-BM, 10%Cu-O-BM, 10%Cu-N-IM.
| Catalyst | Surafce Area (m2/g) | Pore Volume (cm3/g) | Pore Size (nm) | Cu Loading (wt%) | CuO Crystalline Size (XRD) (nm) |
|---|---|---|---|---|---|
| 5% Cu-A-BM | 298.3 | 0.43 | 22.9 | 5.1 | - |
| 10% Cu-A-BM | 251.6 | 0.36 | 17.2 | 9.9 | - |
| 15% Cu-A-BM | 188.7 | 0.27 | 18.0 | 13.3 | 7.3 |
| 20% Cu-A-BM | 132.6 | 0.31 | 24.8 | 18.4 | 14.5 |
| 10% Cu-O-BM | 244.3 | 0.35 | 19.2 | 9.8 | 16.2 |
| 10% Cu-N-IM | 139.4 | 0.29 | 33.2 | 10.1 | 22.9 |
| SiO2 | 390.1 | 0.97 | 33.2 | - | - |
Table 2.
The crystalline sizes of CuO and Cu2O on the 20% Cu-A-BM samples calcined at different temperatures.
Table 2.
The crystalline sizes of CuO and Cu2O on the 20% Cu-A-BM samples calcined at different temperatures.
| Pretreated Temperature/°C | CuO Crystalline Size | Cu2O Crystalline Size |
|---|---|---|
| 100 | 6.3 nm | - |
| 200 | 9.1 nm | - |
| 300 | 14.8 nm | 39.2 nm |
| 400 | 20.7 nm | 50.4 nm |
| 500 | 25.5 nm | - |
Table 3.
Atomic ratio of Cu, CO, CP, and molar ratio of CO/CP over the prepared catalysts.
| Catalyst | Cu AR(%) a | CO AR(%) b | CP AR(%) c | CO/CP d |
|---|---|---|---|---|
| 5% Cu-A-BM | 1.33 | 0.59 | 0.74 | 0.79 |
| 10% Cu-A-BM | 1.71 | 0.99 | 0.72 | 1.38 |
| 15% Cu-A-BM | 2.68 | 1.54 | 1.14 | 1.35 |
| 20% Cu-A-BM | 1.26 | 0.69 | 0.57 | 1.21 |
| 10% Cu-O-BM | 0.71 | 0.57 | 0.14 | 4.04 |
| 10% Cu-N-IM | 0.49 | 0.49 | - | - |
a: AR, atomic ratio; b: CO, Copper oxide; c: CP, copper phyllosilicate; d: molar ratio of copper oxide/copper phyllosilicate.
Table 4.
Particle sizes measured by different methods, dispersion, and active area of all catalysts.
Table 4.
Particle sizes measured by different methods, dispersion, and active area of all catalysts.
| Catalyst | dChem (nm) a | D (%) b | S (m2 Cu/gCatal) c | dTEM (nm) d | dXRD (nm) e |
|---|---|---|---|---|---|
| 5% Cu-A-BM | 1.0 | 100.0 | 11.7 | - | - |
| 10% Cu-A-BM | 1.2 | 83.3 | 32.1 | - | - |
| 15% Cu-A-BM | 1.4 | 78.1 | 50.2 | 1.8 | 7.2 |
| 20% Cu-A-BM | 3.0 | 35.6 | 23.6 | - | 15.3 |
| 10% Cu-O-BM | 3.2 | 32.8 | 25.4 | - | 16.7 |
| 10% Cu-N-IM | 10.1 | 11.3 | 7.4 | - | 22.1 |
a: Particle size measured by N2O chemisorptions; b: Dispersion measured by N2O chemisorptions; c: Surface active area measured by N2O chemisorptions; d: Crystalline size measured by XRD; e: particle size measured by HAADF-STEM.
Publisher’s Note: MDPI stays neutral with regard to jurisdictional claims in published maps and institutional affiliations. |
© 2022 by the authors. Licensee MDPI, Basel, Switzerland. This article is an open access article distributed under the terms and conditions of the Creative Commons Attribution (CC BY) license (https://creativecommons.org/licenses/by/4.0/).
Share and Cite
MDPI and ACS Style
Ye, Y.; Chen, H.; Ye, Y.; Zhang, H.; Xu, J.; Wang, L.; Mo, L. Silica-Supported Copper (II) Oxide Cluster via Ball Milling Method for Catalytic Combustion of Ethyl Acetate. Catalysts 2022, 12, 497. https://doi.org/10.3390/catal12050497
AMA Style
Ye Y, Chen H, Ye Y, Zhang H, Xu J, Wang L, Mo L. Silica-Supported Copper (II) Oxide Cluster via Ball Milling Method for Catalytic Combustion of Ethyl Acetate. Catalysts. 2022; 12(5):497. https://doi.org/10.3390/catal12050497
Chicago/Turabian StyleYe, Yuhang, Han Chen, Yuchuan Ye, Huiqiu Zhang, Jing Xu, Luhui Wang, and Liuye Mo. 2022. "Silica-Supported Copper (II) Oxide Cluster via Ball Milling Method for Catalytic Combustion of Ethyl Acetate" Catalysts 12, no. 5: 497. https://doi.org/10.3390/catal12050497
Note that from the first issue of 2016, this journal uses article numbers instead of page numbers. See further details here.