Article

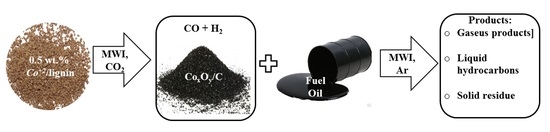
Activity and Structure of Nano-Sized Cobalt-Containing Systems for the Conversion of Lignin and Fuel Oil to Synthesis Gas and Hydrocarbons in a Microwave-Assisted Plasma Catalytic Process

by
Mark V. Tsodikov
1,
Olga V. Bukhtenko
1,
Alexander V. Naumkin
2,3,
Sergey A. Nikolaev
4,
Andrey V. Chistyakov
1,* and
Grigory I. Konstantinov
1
1
A.V. Topchiev Institute of Petrochemical Synthesis, Russian Academy of Sciences, 29 Leninsky Prosp., 119991 Moscow, Russia
2
A.N. Nesmeyanov Institute of Organoelement Compounds, Russian Academy of Sciences, 28 Vavilova St., 119991 Moscow, Russia
3
A.N. Frumkin Institute of Physical Chemistry and Electrochemistry Russian Academy of Sciences, 31, Bld.4 Leninsky Prosp., 119071 Moscow, Russia
4
Department of Chemistry, M.V. Lomonosov Moscow State University, 1 Leninskie Gory, 119991 Moscow, Russia
*
Author to whom correspondence should be addressed.
Catalysts 2022, 12(11), 1315; https://doi.org/10.3390/catal12111315
Submission received: 4 October 2022 / Revised: 20 October 2022 / Accepted: 21 October 2022 / Published: 27 October 2022
(This article belongs to the Special Issue Nanoparticles in the Catalysis)

Abstract

:
In this study, we present the results of lignin and fuel oil conversion to hydrogen, synthesis gas, and liquid hydrocarbons in the presence of nano-sized cobalt-containing systems in a microwave-assisted plasma catalytic process. The deposition of a small amount of cobalt on lignin increases its microwave absorption capacity and provides plasma generation in the reaction zone. The role of Co-containing particles in the above catalytic reactions is probably to activate the carbon bonds of lignin, which substantially increases the microwave absorption capacity of the system as a whole. The subsequent use of the cobalt-containing residue of lignin conversion as a catalytic system and MWI-absorbing material results in active fuel oil pyrolysis in a plasma catalytic process to afford gaseous and liquid hydrocarbons. In the plasma catalytic pyrolysis, fuel oil conversion is probably accompanied by the conversion of the organic matter of the residue and agglomeration of cobalt oxide particles.

Graphical Abstract

1. Introduction

Addressing the problem of expansion of energy sources and protection of the environment has initiated vigorous research with the aim of developing efficient approaches to conversion of renewable raw materials to energy carriers and important monomers [1,2]. Renewable sources of hydrocarbons include products of enzymatic fermentation of biomass; selected microalgae with increased lipid contents; and lignin (derived from the Latin word lignum, meaning wood), which is a complex three-dimensional crystalline polymer contained in plant cells and in some algae. This goal stimulated the interest of industry in the partial replacement of raw fossil materials by renewable materials [2,3].
Lignin is a byproduct of wood-based industry [2,3]. The cross-linked stable macromolecular structure of lignin composed of phenylpropane units makes its processing difficult. The conversion of lignin to single arenes is complicated by its high chemical stability and repolymerization of intermediates in the decomposition stage, resulting in the formation of compounds with higher molecular weight compared to the initial lignin [3,4,5].
According to the most recent data, 150–200 million tons of lignin waste are generated annually. The continuous increase in the generation of lignin waste and others anthropogenic pollutants determine the specific character of lignin as a raw material, as it undergoes almost no biochemical oxidation. Therefore, a challenging task in this area is to develop efficient approaches for lignin processing to produce energy carriers and valuable chemicals [5].
Among crude-oil-based products, residual fuel oil and vacuum residue are most stable. In addition to high stability, processing of these residual oil products is also complicated by high contents of heteroatomic compounds of sulfur and nitrogen, which poison many of most active heterogeneous catalysts. Another complexity associated with the processing of high-boiling-point crude oil feed is fast coking of catalytic systems. The content of oil residues can be as high as 40% in many oil deposits [6,7]. Therefore, considerable effort in oil processing has been dedicated to the development of catalytic processes for the processing of oil residues [8,9,10].
Residual fuel oil is a complex mixture of hydrocarbons with boiling points above 450 °C that remain after atmospheric crude oil distillation [10,11]. In the current geopolitical context, processing of atmospheric residues is especially relevant, as they are present in large amounts in Russian oil refineries due to insufficient capacity of processing facilities.
In recent years, considerable attention has been paid to studies on the microwave-assisted plasma catalytic conversion of highly stable organic substrates [12,13,14,15,16].
Microwave irradiation causes polarization and polarization reversal of molecules, which is accompanied by the conversion of electrical energy to thermal energy [17,18]. The vibrational fluctuations in compounds that efficiently absorb microwave irradiation (MWI) induce an electron gas discharge effect on small surface sites. These sites are called “hot spots” [18,19]. Intensification of the discharge leads to plasma generation and is used for plasma ignition [19]. It has been shown that in the presence of a carbon adsorbent possessing a high microwave absorption capacity, passing a lignin and methane mixture through plasma results in cleavage of the most stable hydrocarbon-C–H bonds to afford hydrogen, which is released to the reaction zone [20,21].
In this study, we present the results of lignin and fuel oil conversion to hydrogen, synthesis gas, and liquid hydrocarbons in the presence of nano-sized cobalt-containing systems in a microwave-assisted plasma catalytic process.

2. Results and Discussion

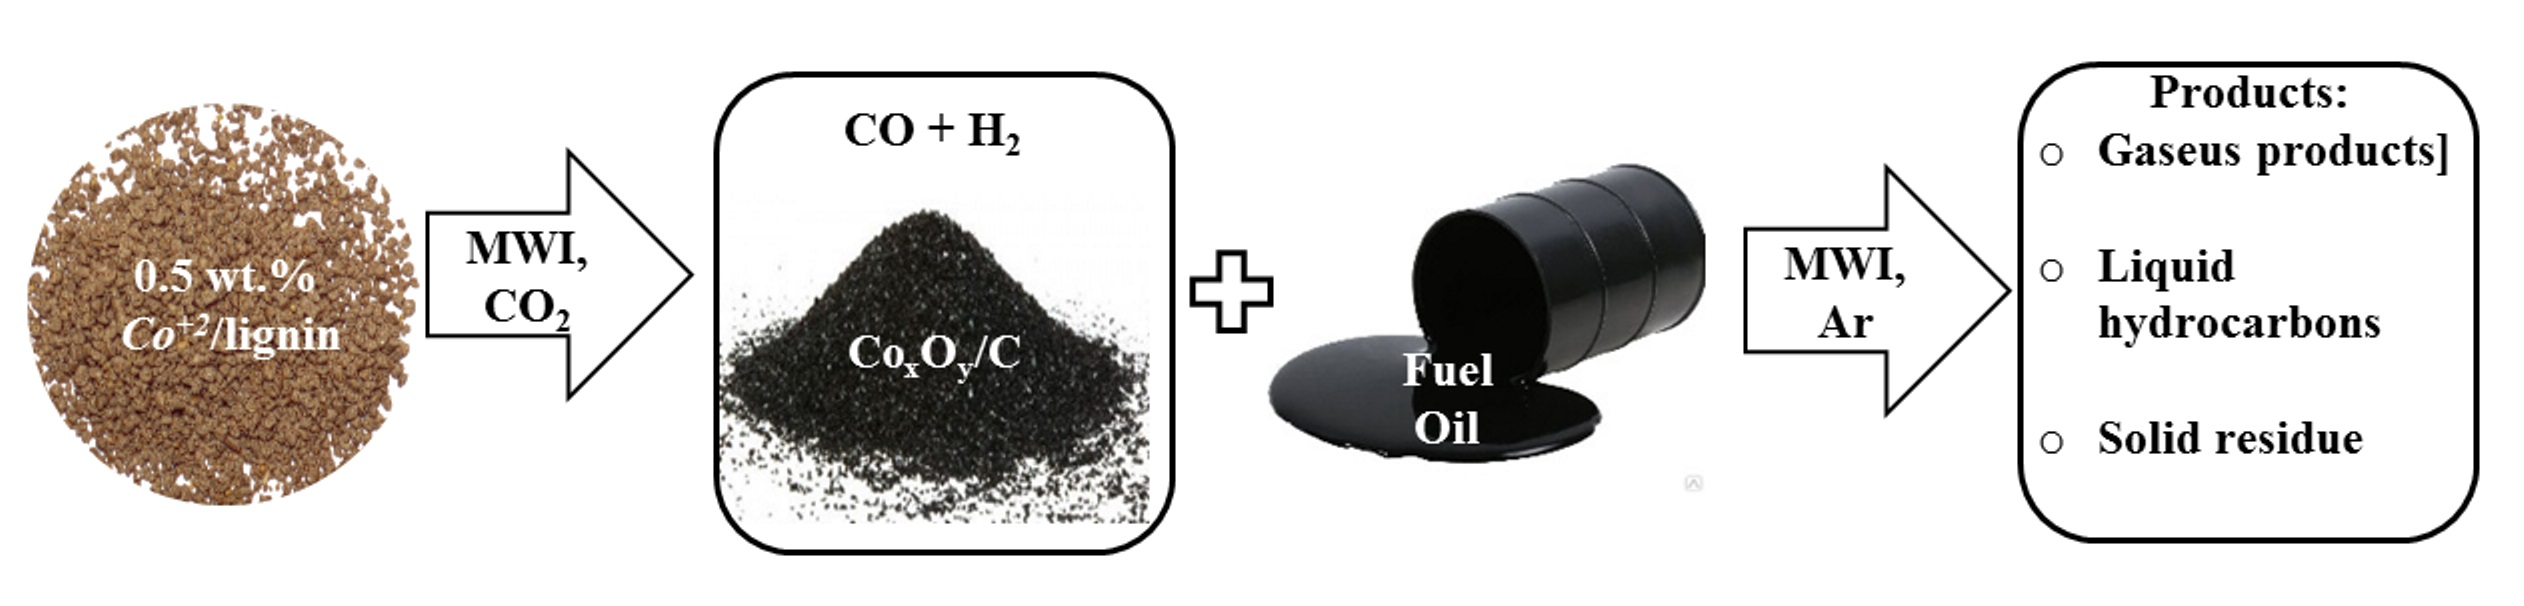
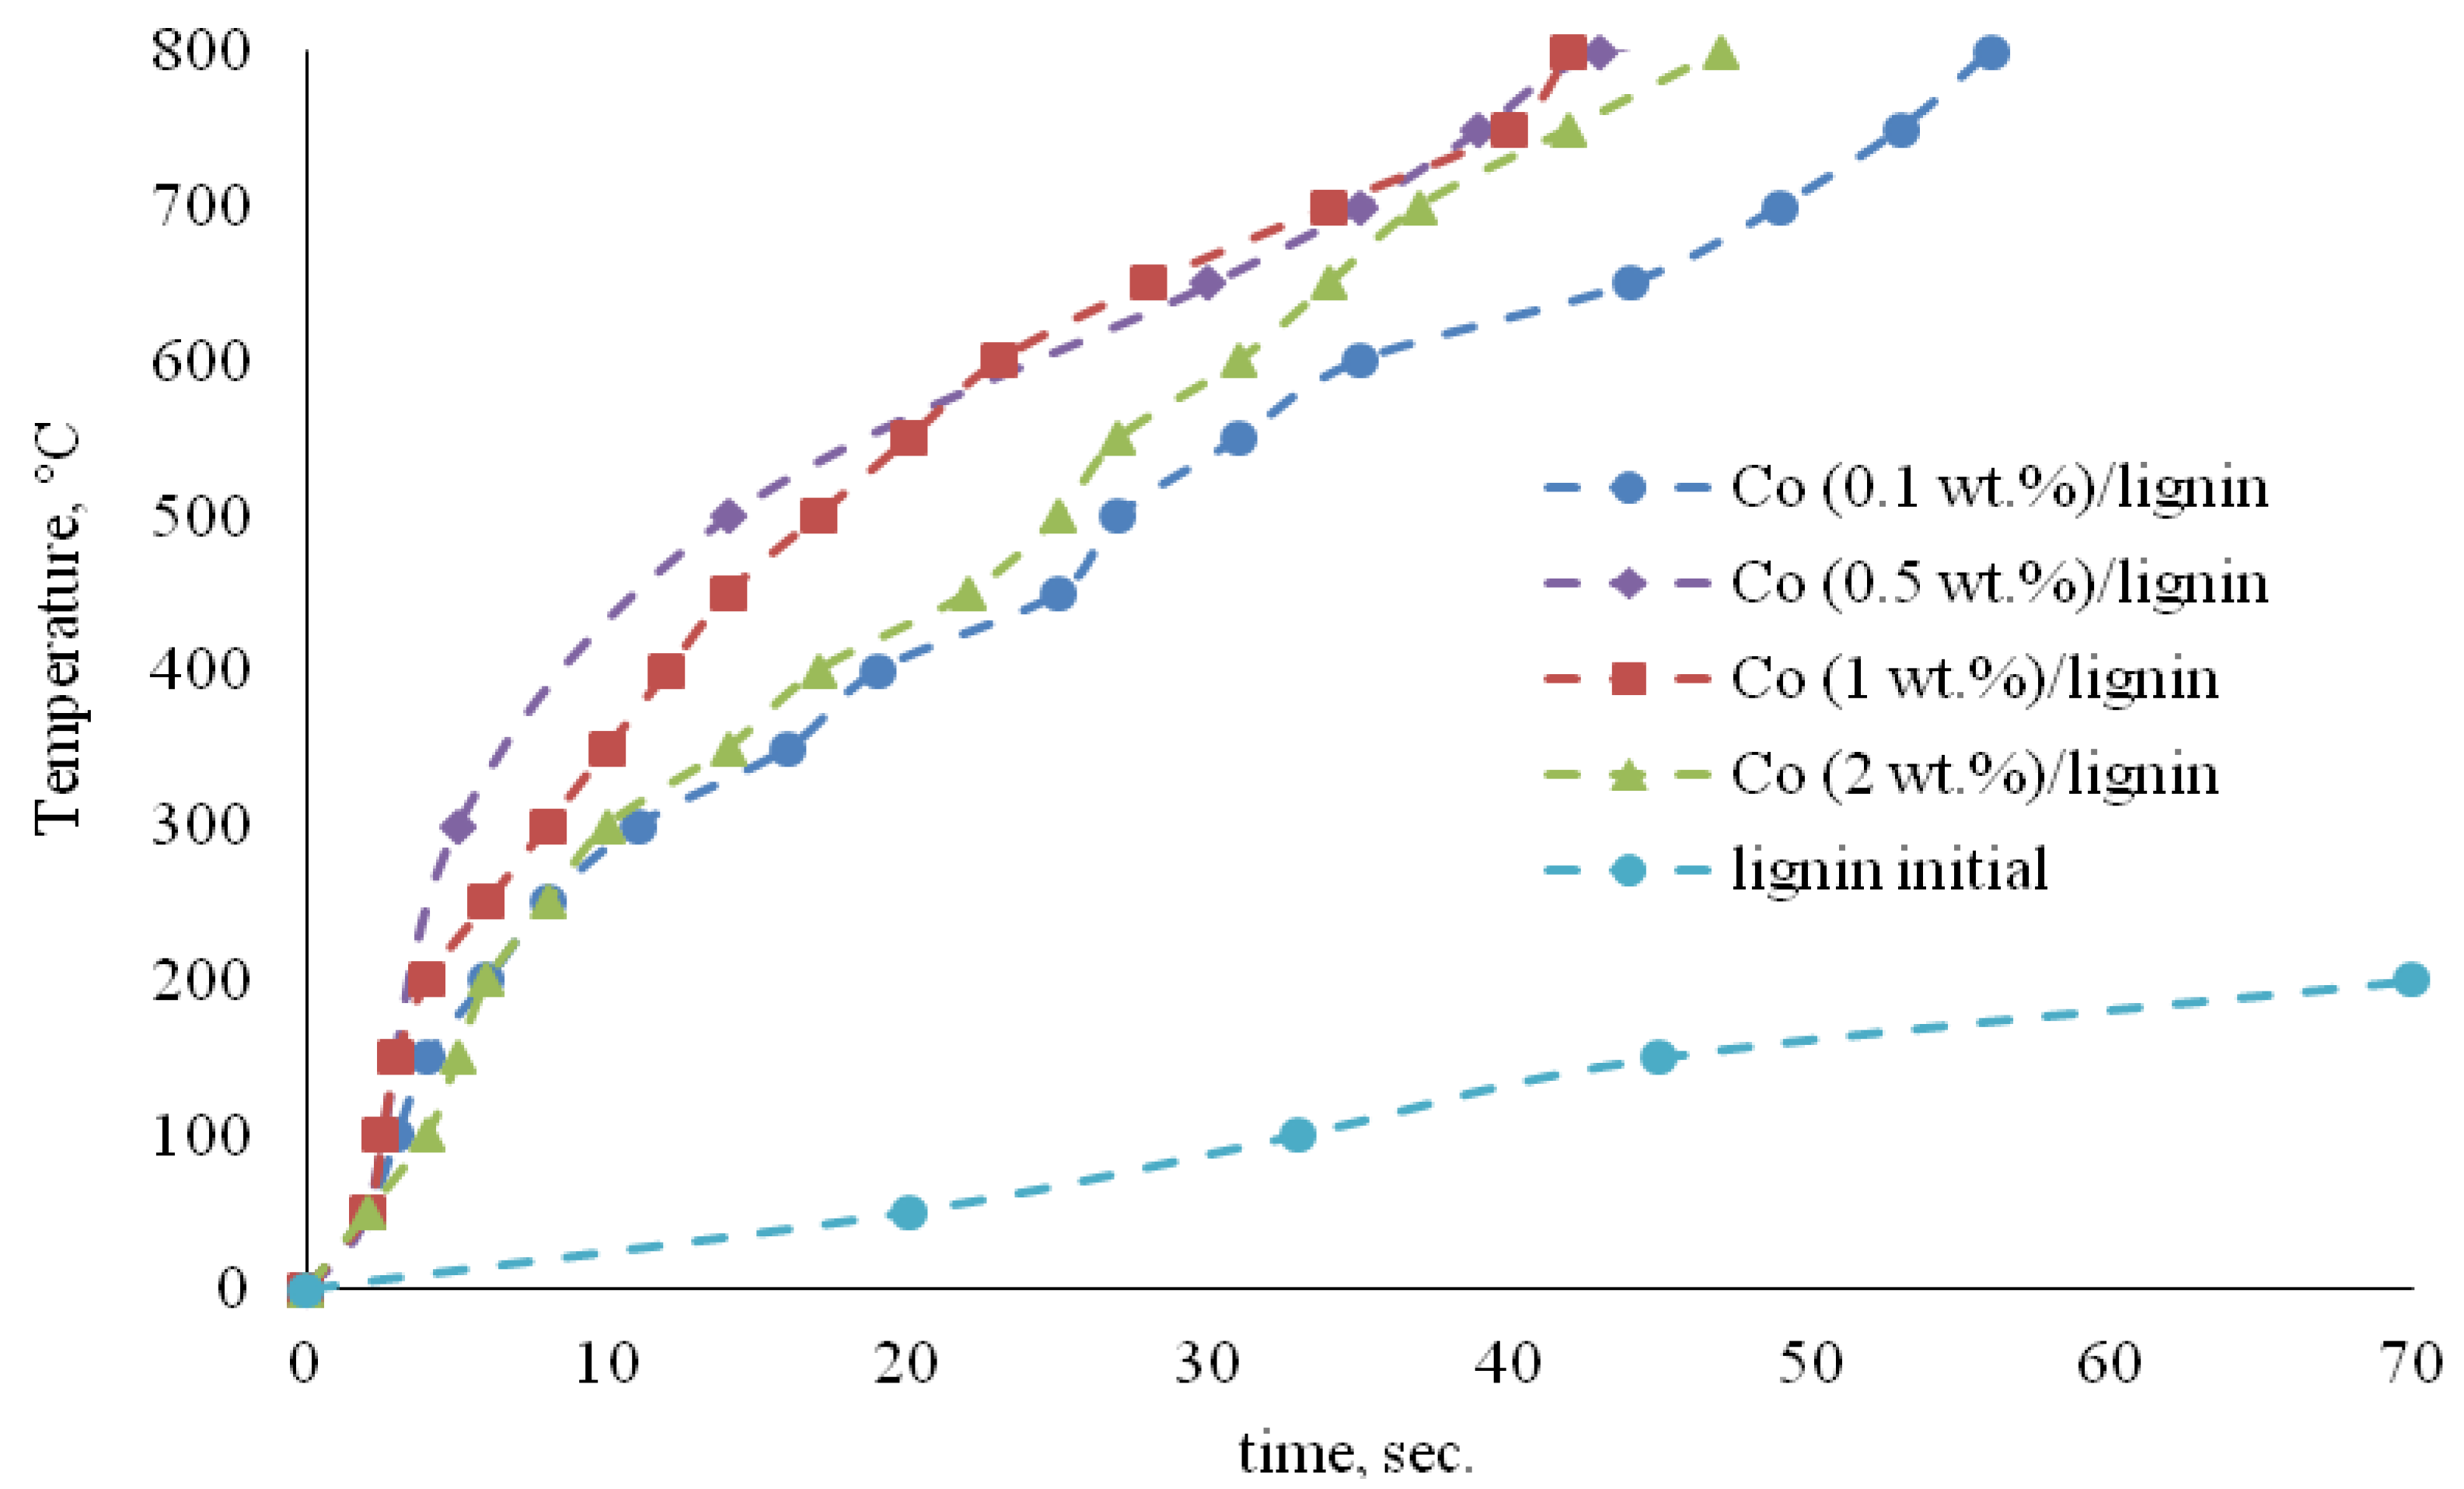
2.1. Carbon Dioxide Reforming of Lignin

Natural lignin (sample 1) has a poor ability to absorb microwave irradiation, and during 70 s of microwave irradiation, it is heated to only 200 °C (Figure 1). The deposition of a small amount of cobalt from the acetylacetonate complex markedly increases the microwave absorption capacity. As shown in Figure 1, after deposition of 0.1 wt.% Co, the cobalt-containing lignin can be heated up to 800 °C within 56 s.
An increase in the cobalt concentration on lignin to 0.5 (sample 2) and 1 wt.% reduces the time needed to attain 800 °C to 43 and 42 s, respectively (Figure 1). A further increase in the cobalt content to 2 wt.% increases the time of heating of the reaction volume to 800 °C. The amount of cobalt deposited on lignin likely results in cobalt clusters with varying average size distribution on the lignin surface, and the heating dynamics depend on the size of the formed cobalt-containing particles [12,21,22,23,24].
The microwave irradiation of lignin at an induced temperature of 650–700 °C was accompanied by intense evolution of gaseous products. In a CO2 flow at a microwave-induced temperature of 650–700 °C, all cobalt-containing lignin samples were converted to the synthesis gas, methane, and a minor portion of C2+ alkanes and olefins (Table 1). A study of the dynamics of the formation of the products of carbon dioxide reforming of lignin showed that the intense transformation of lignin occurs within 20–25 min. After this irradiation time, the formation of products virtually ceases. Table 1 presents data on the transformation of lignin with varying amounts of deposited cobalt during CO2 treatment at a microwave-induced temperature of 650–700 °C. According to Table 1, samples containing 0.5–1.0% Co show the highest conversion. The loss of organic matter during irradiation was 61.5%. The composition of the synthesis gas corresponds to an H2:CO ratio of ~1.2–1.3.
The cobalt-containing residue of the carbon dioxide reforming of lignin (sample 3) has a high microwave absorption capacity (Figure 2). This residue was used to convert fuel oil in a plasma catalytic process under MWI. Three successive experiments on fuel oil conversion were carried out. The cobalt-containing solid residue was used to initiate the plasma catalytic process for the subsequent experiment. The content of cobalt in these solid residues after lignin conversion increased to 0.75–0.80%.
The cobalt-containing solid residue formed in the first experiment on fuel oil conversion has a substantially higher microwave absorption capacity than the carbon-containing residues formed in the second and third fuel oil conversion experiments.
Table 2 presents the fractional composition of the products formed in the three successive fuel oil pyrolysis experiments, in which the solid residue that formed in the reactor in each preceding experiment was added to the reactor for the subsequent experiment. After the third fuel oil conversion experiment, the solid residue (sample 4) was not used for further processing of fuel oil because it did not exhibit the ability to absorb microwave radiation and heat the reaction zone to the pyrolysis temperature.
As shown in Table 2, the fuel oil conversion exceeds 90%. However, the yields of gas and liquid products indicate that activity of the catalytic system under MWI is retained in the first two successive experiments but drops in the third experiment, in which the yield of liquid fractions boiling away below 350 °C decreases.
The liquid products formed during fuel oil pyrolysis include a broad range of hydrocarbons of various classes. The hydrocarbon composition is approximately the same in all three runs, which indicates that plasma pyrolysis takes place in all cases (Table 3).
The amount of solid residue used as the catalyst to initiate the plasma catalytic process markedly increases by the third experiment. The decrease in the yield of liquid products is apparently caused by two factors: coating of the surface of the microwave-absorbing catalyst with carbon, which has a low MWI absorption capacity, as shown in Figure 2, or the change in the size factor of the cobalt-containing components, resulting in a pronounced decrease in the microwave absorption intensity.
Thus, here, we present a method for coprocessing of lignin, which is a renewable raw material, with a highly stable oil-based substrate in the presence of cobalt-containing systems possessing high microwave-absorption capacity.
When the content of cobalt components is 0.5–1 wt.%, the cobalt clusters that are formed have an apparently optimal size for microwave absorption and plasma generation (Figure 2). A similar effect of the metal particle size on the intensity of microwave absorption was observed previously [21,25,26,27] using nano-sized iron oxide clusters as catalytically active components. Another characteristic feature is the high rate of fuel oil conversion, as accumulation of reaction products is almost complete after 25 min of irradiation.

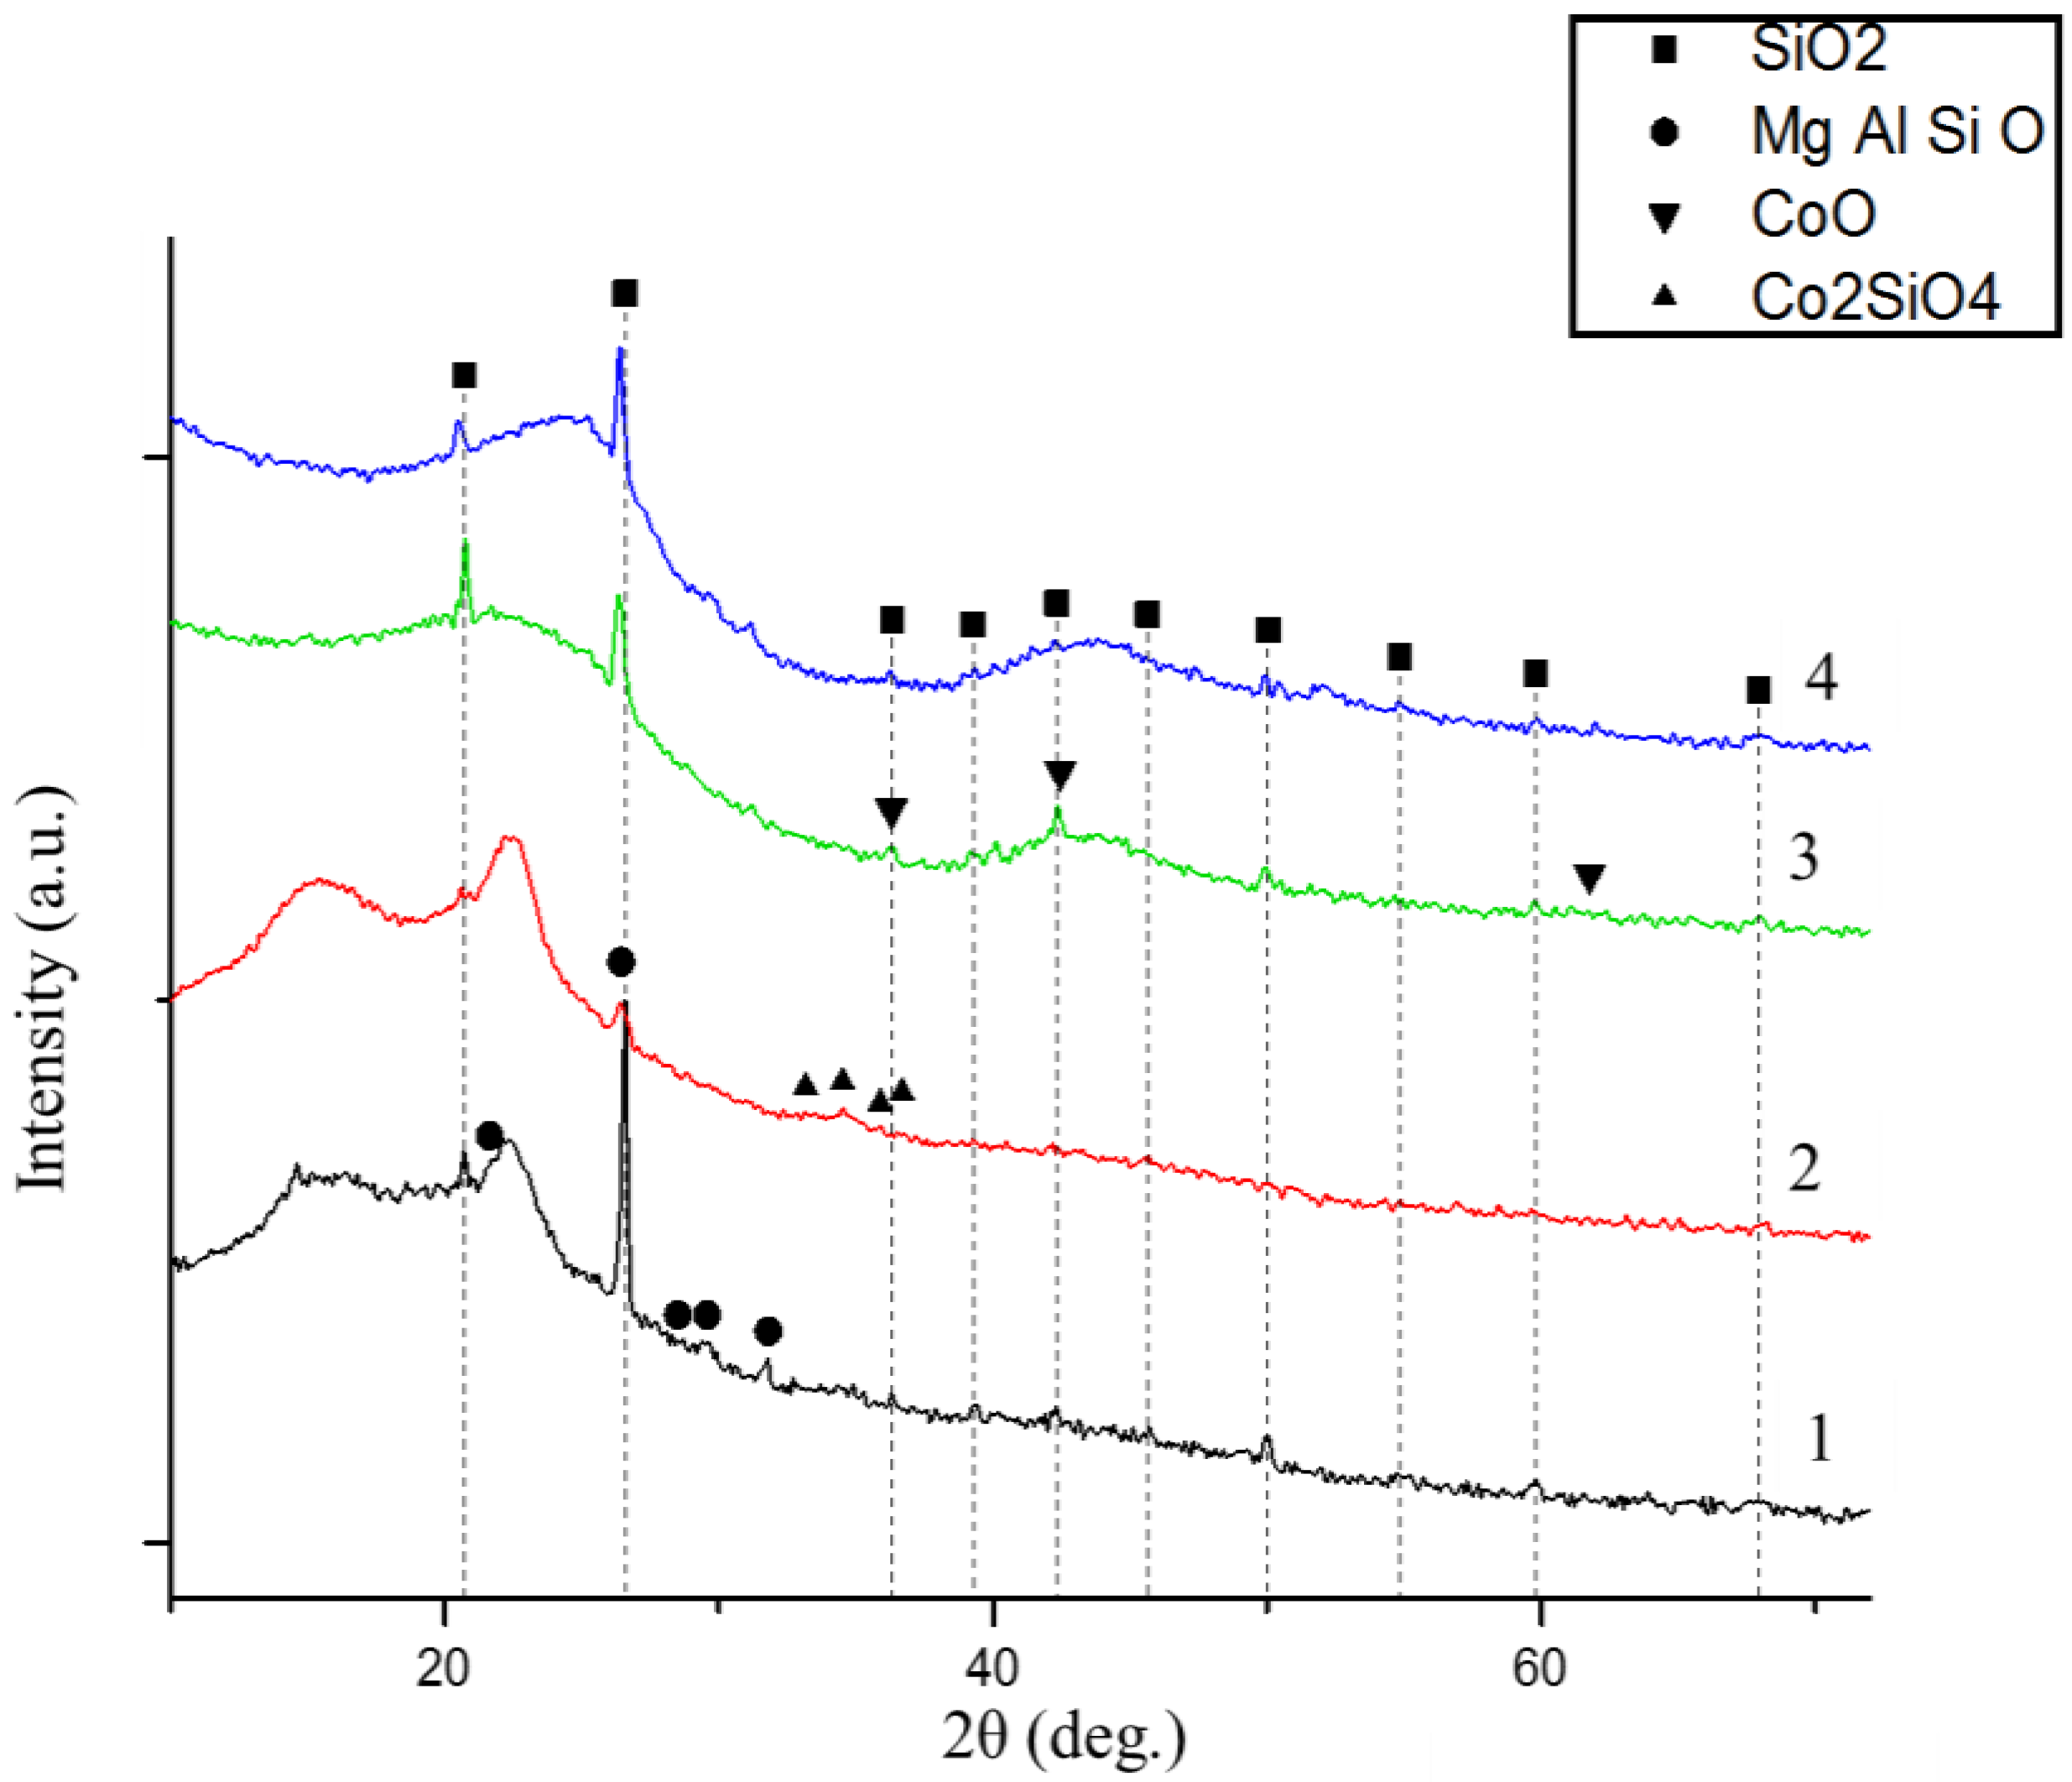
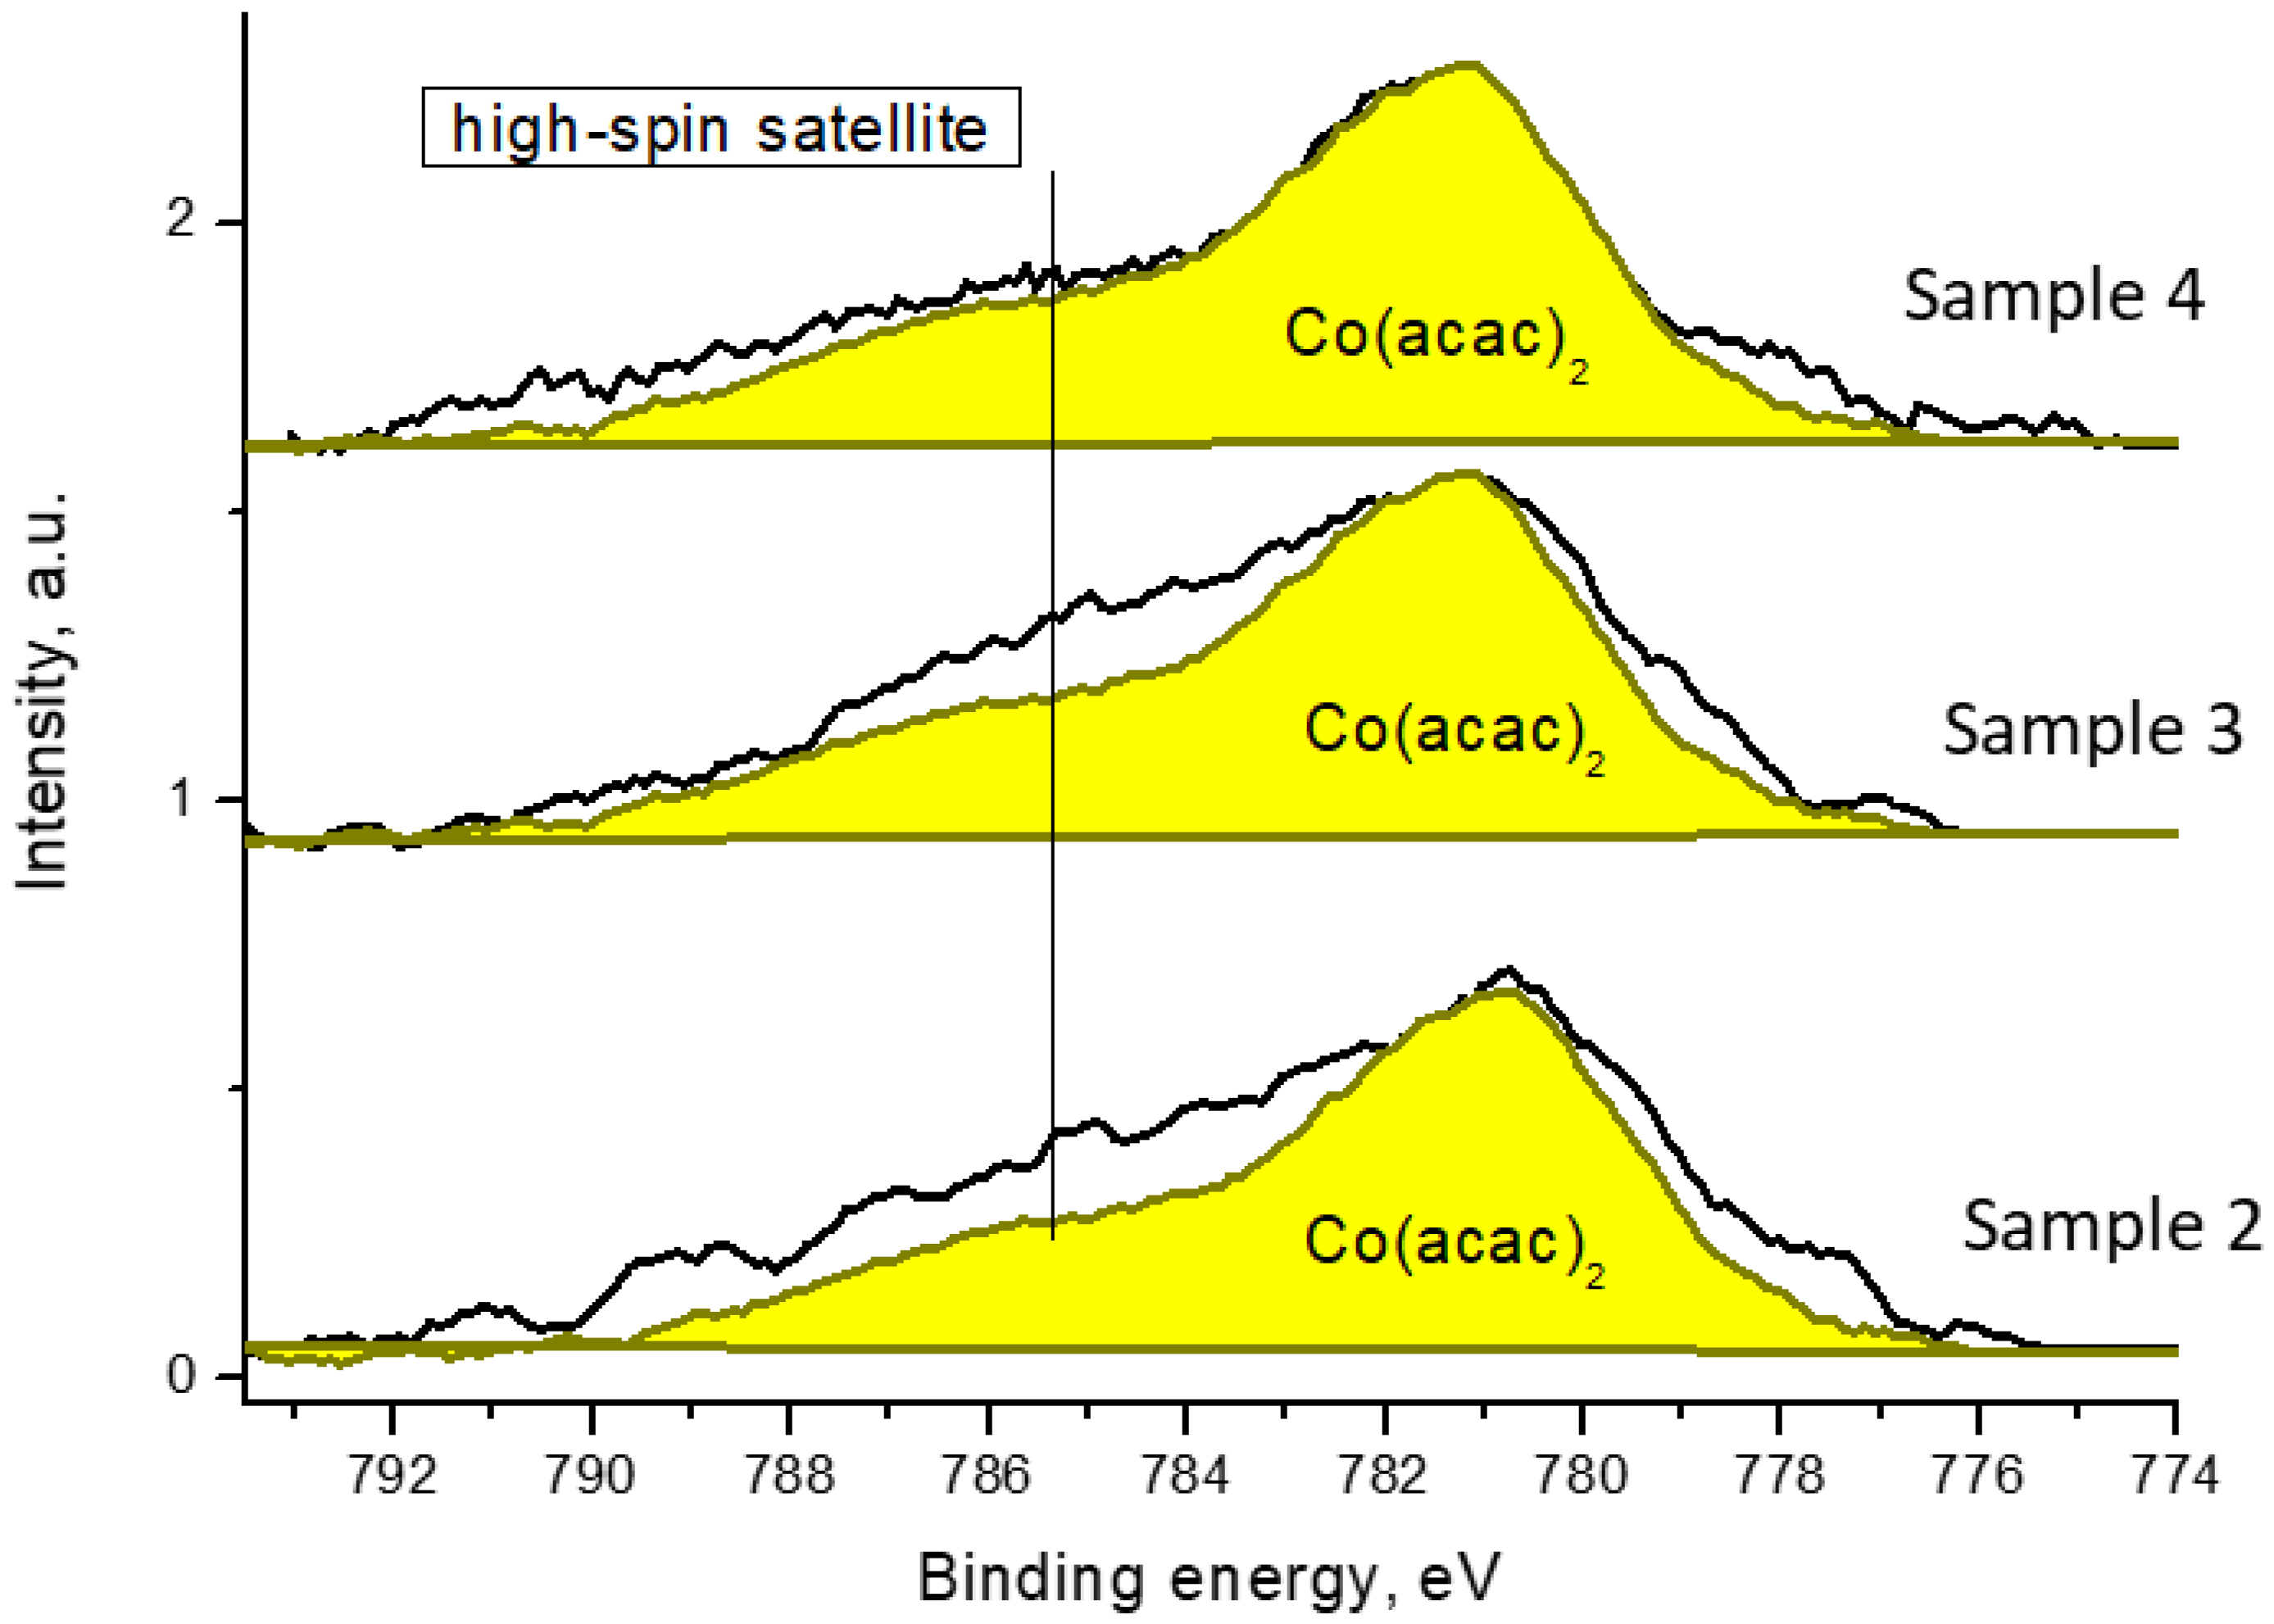
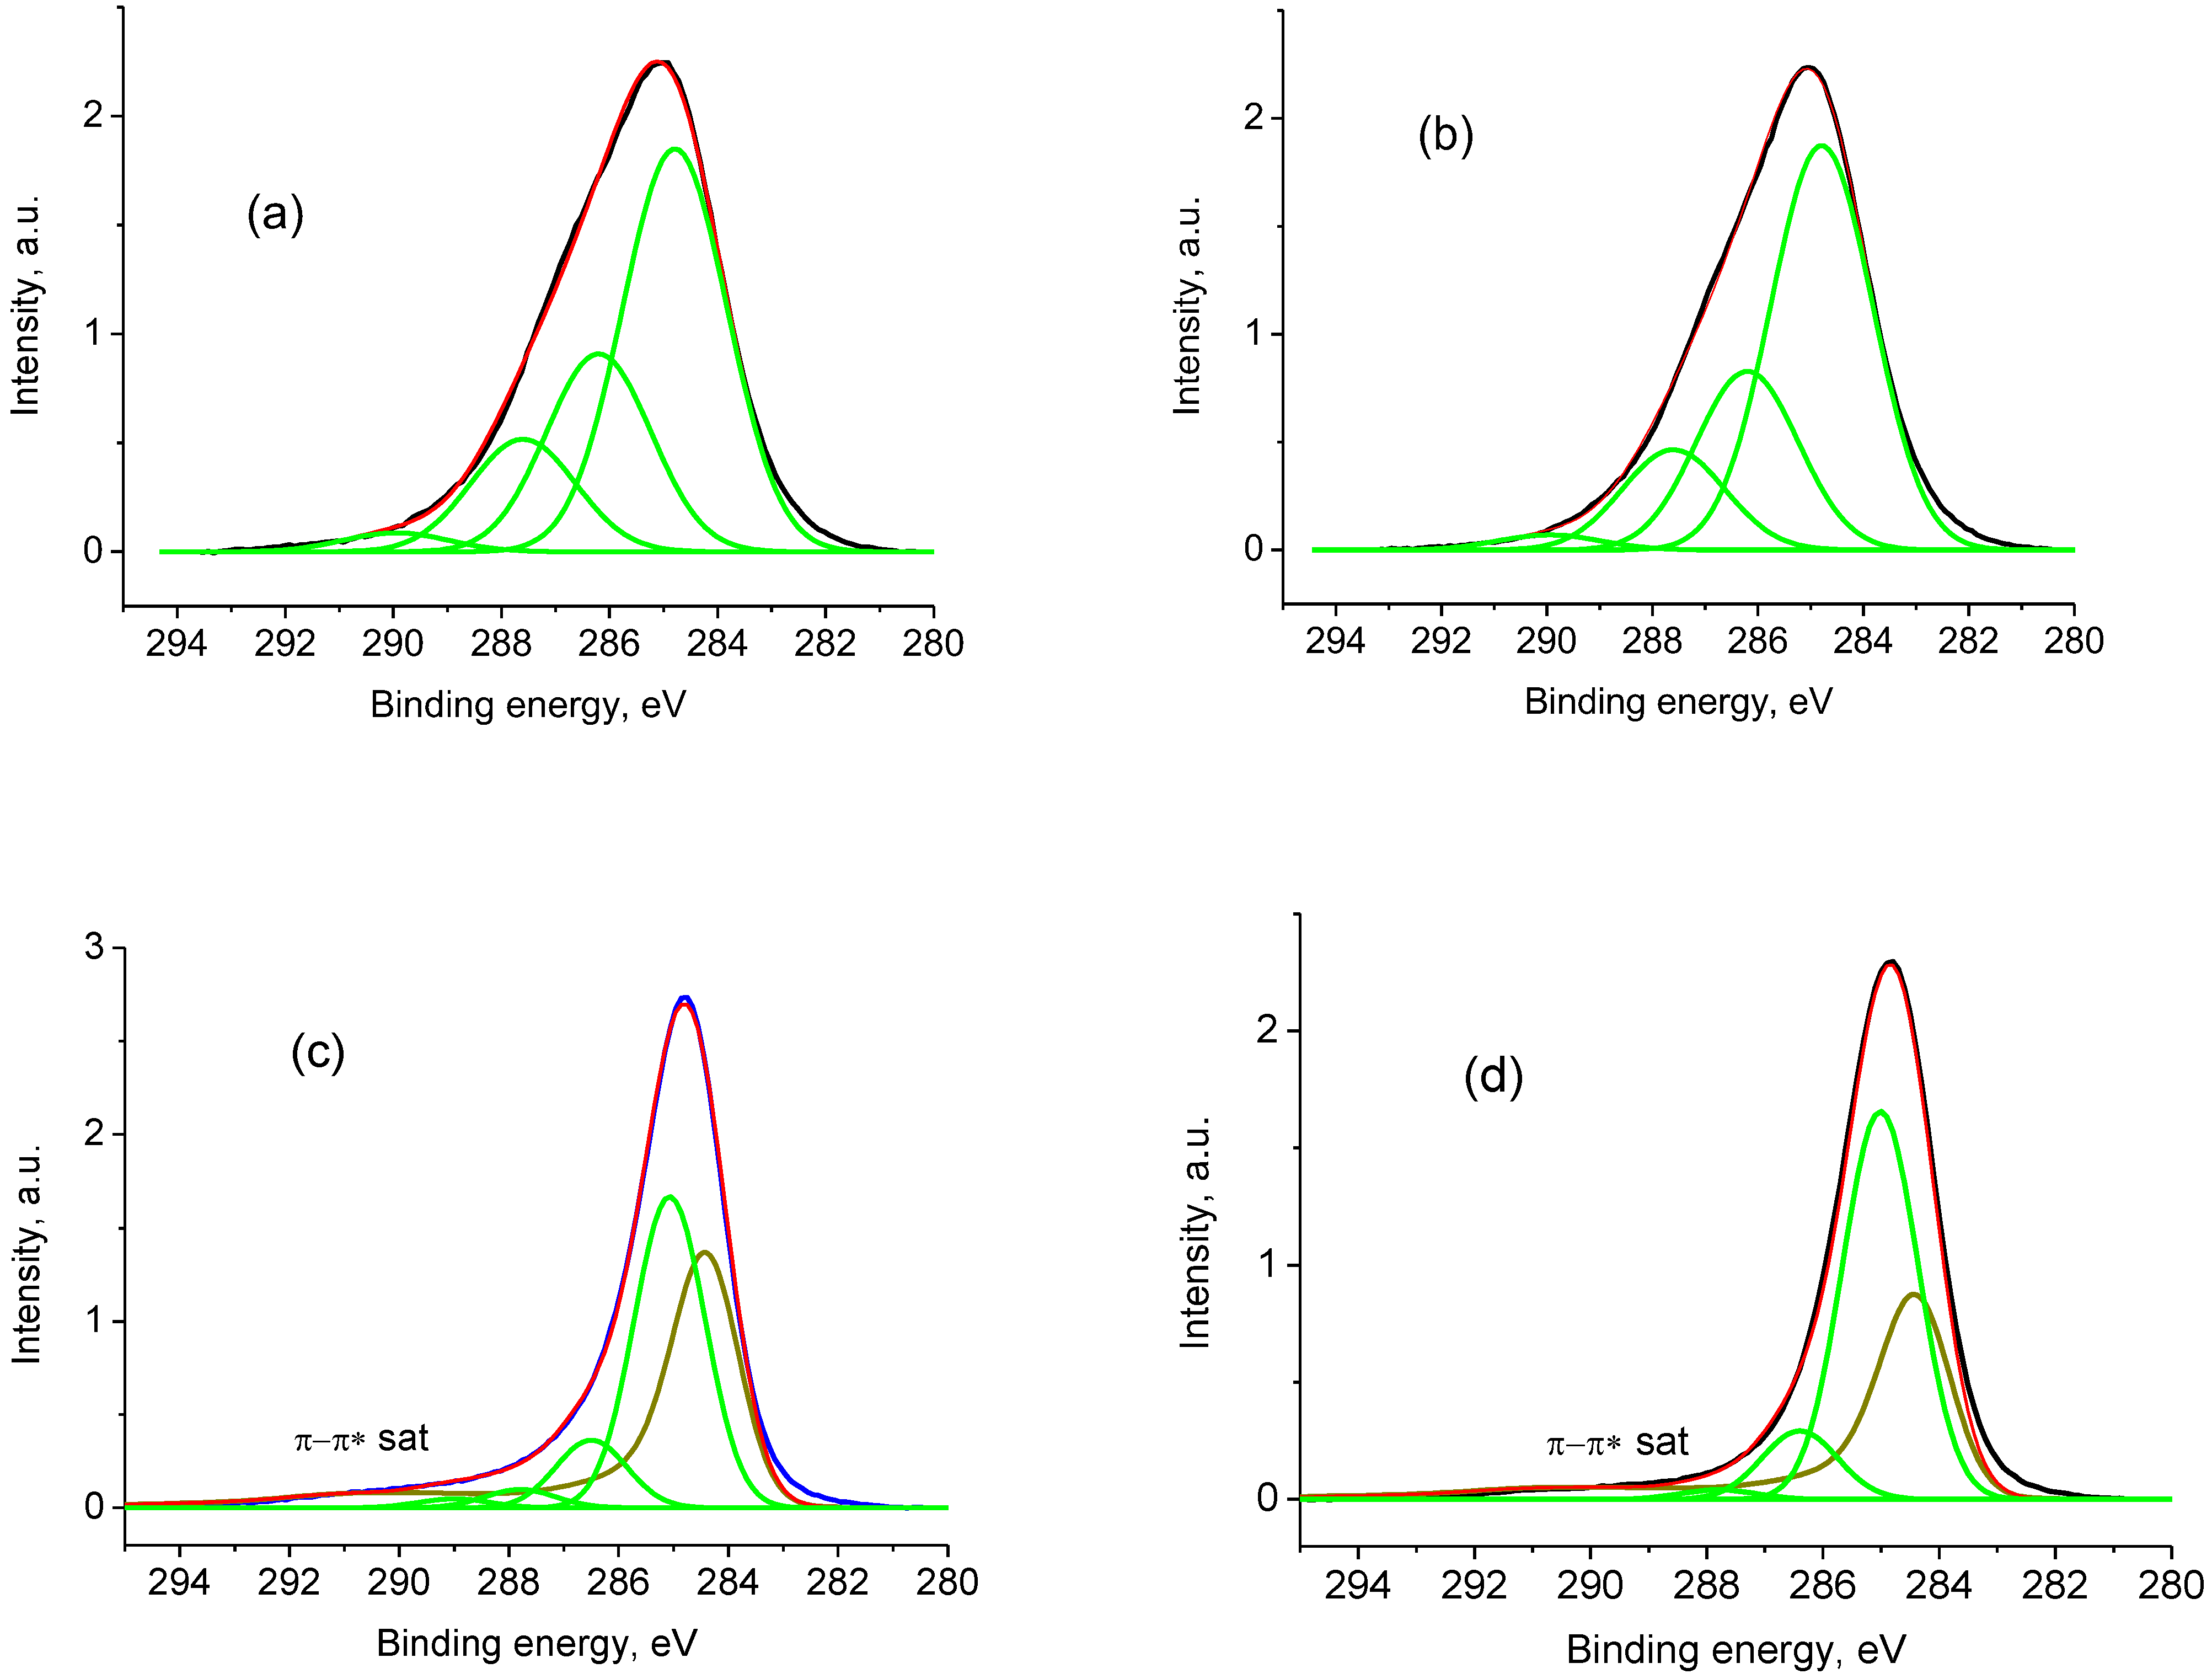
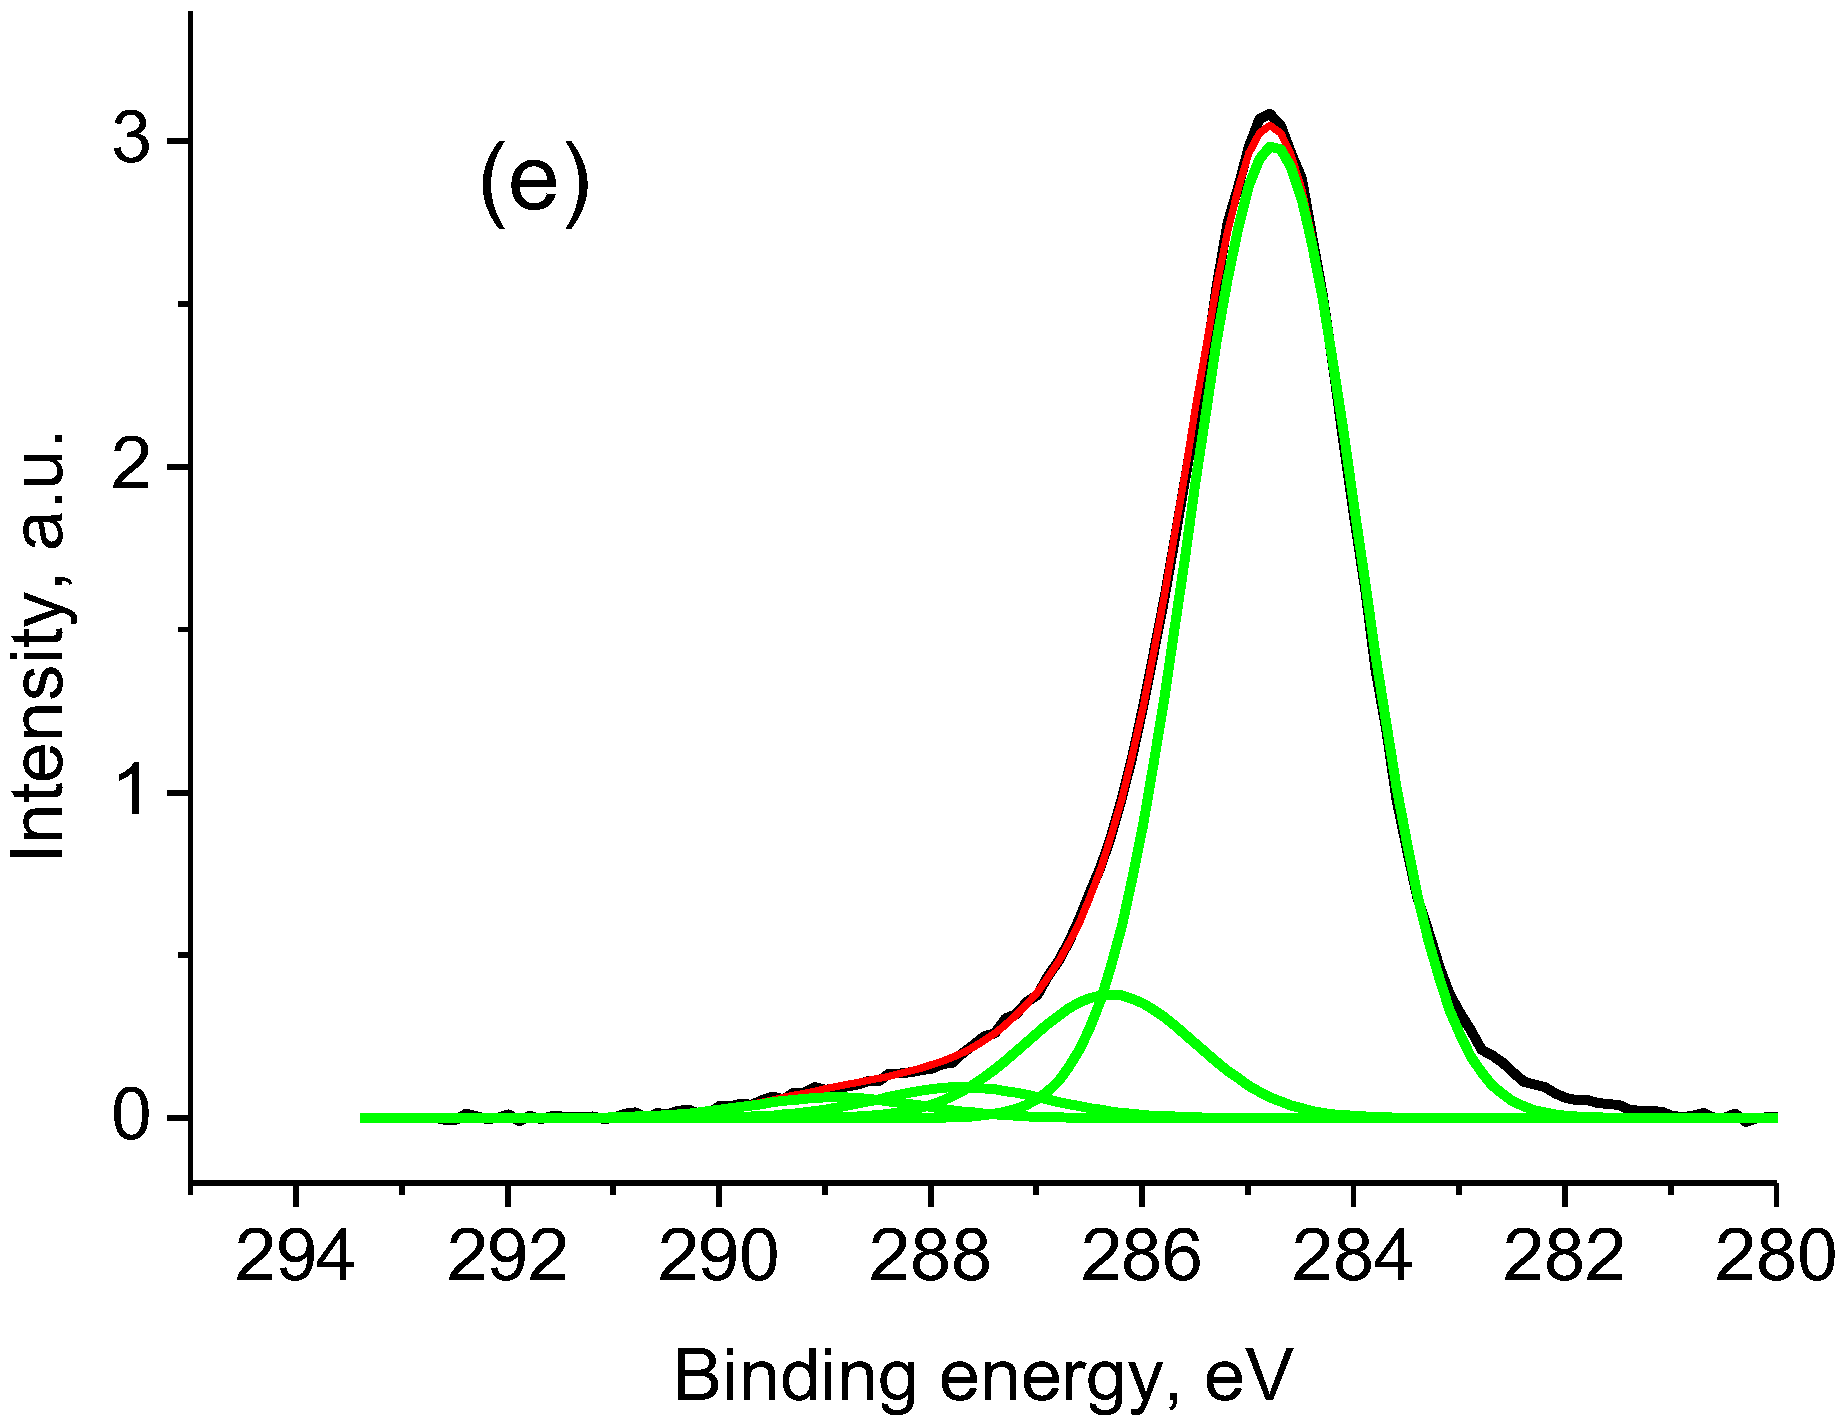
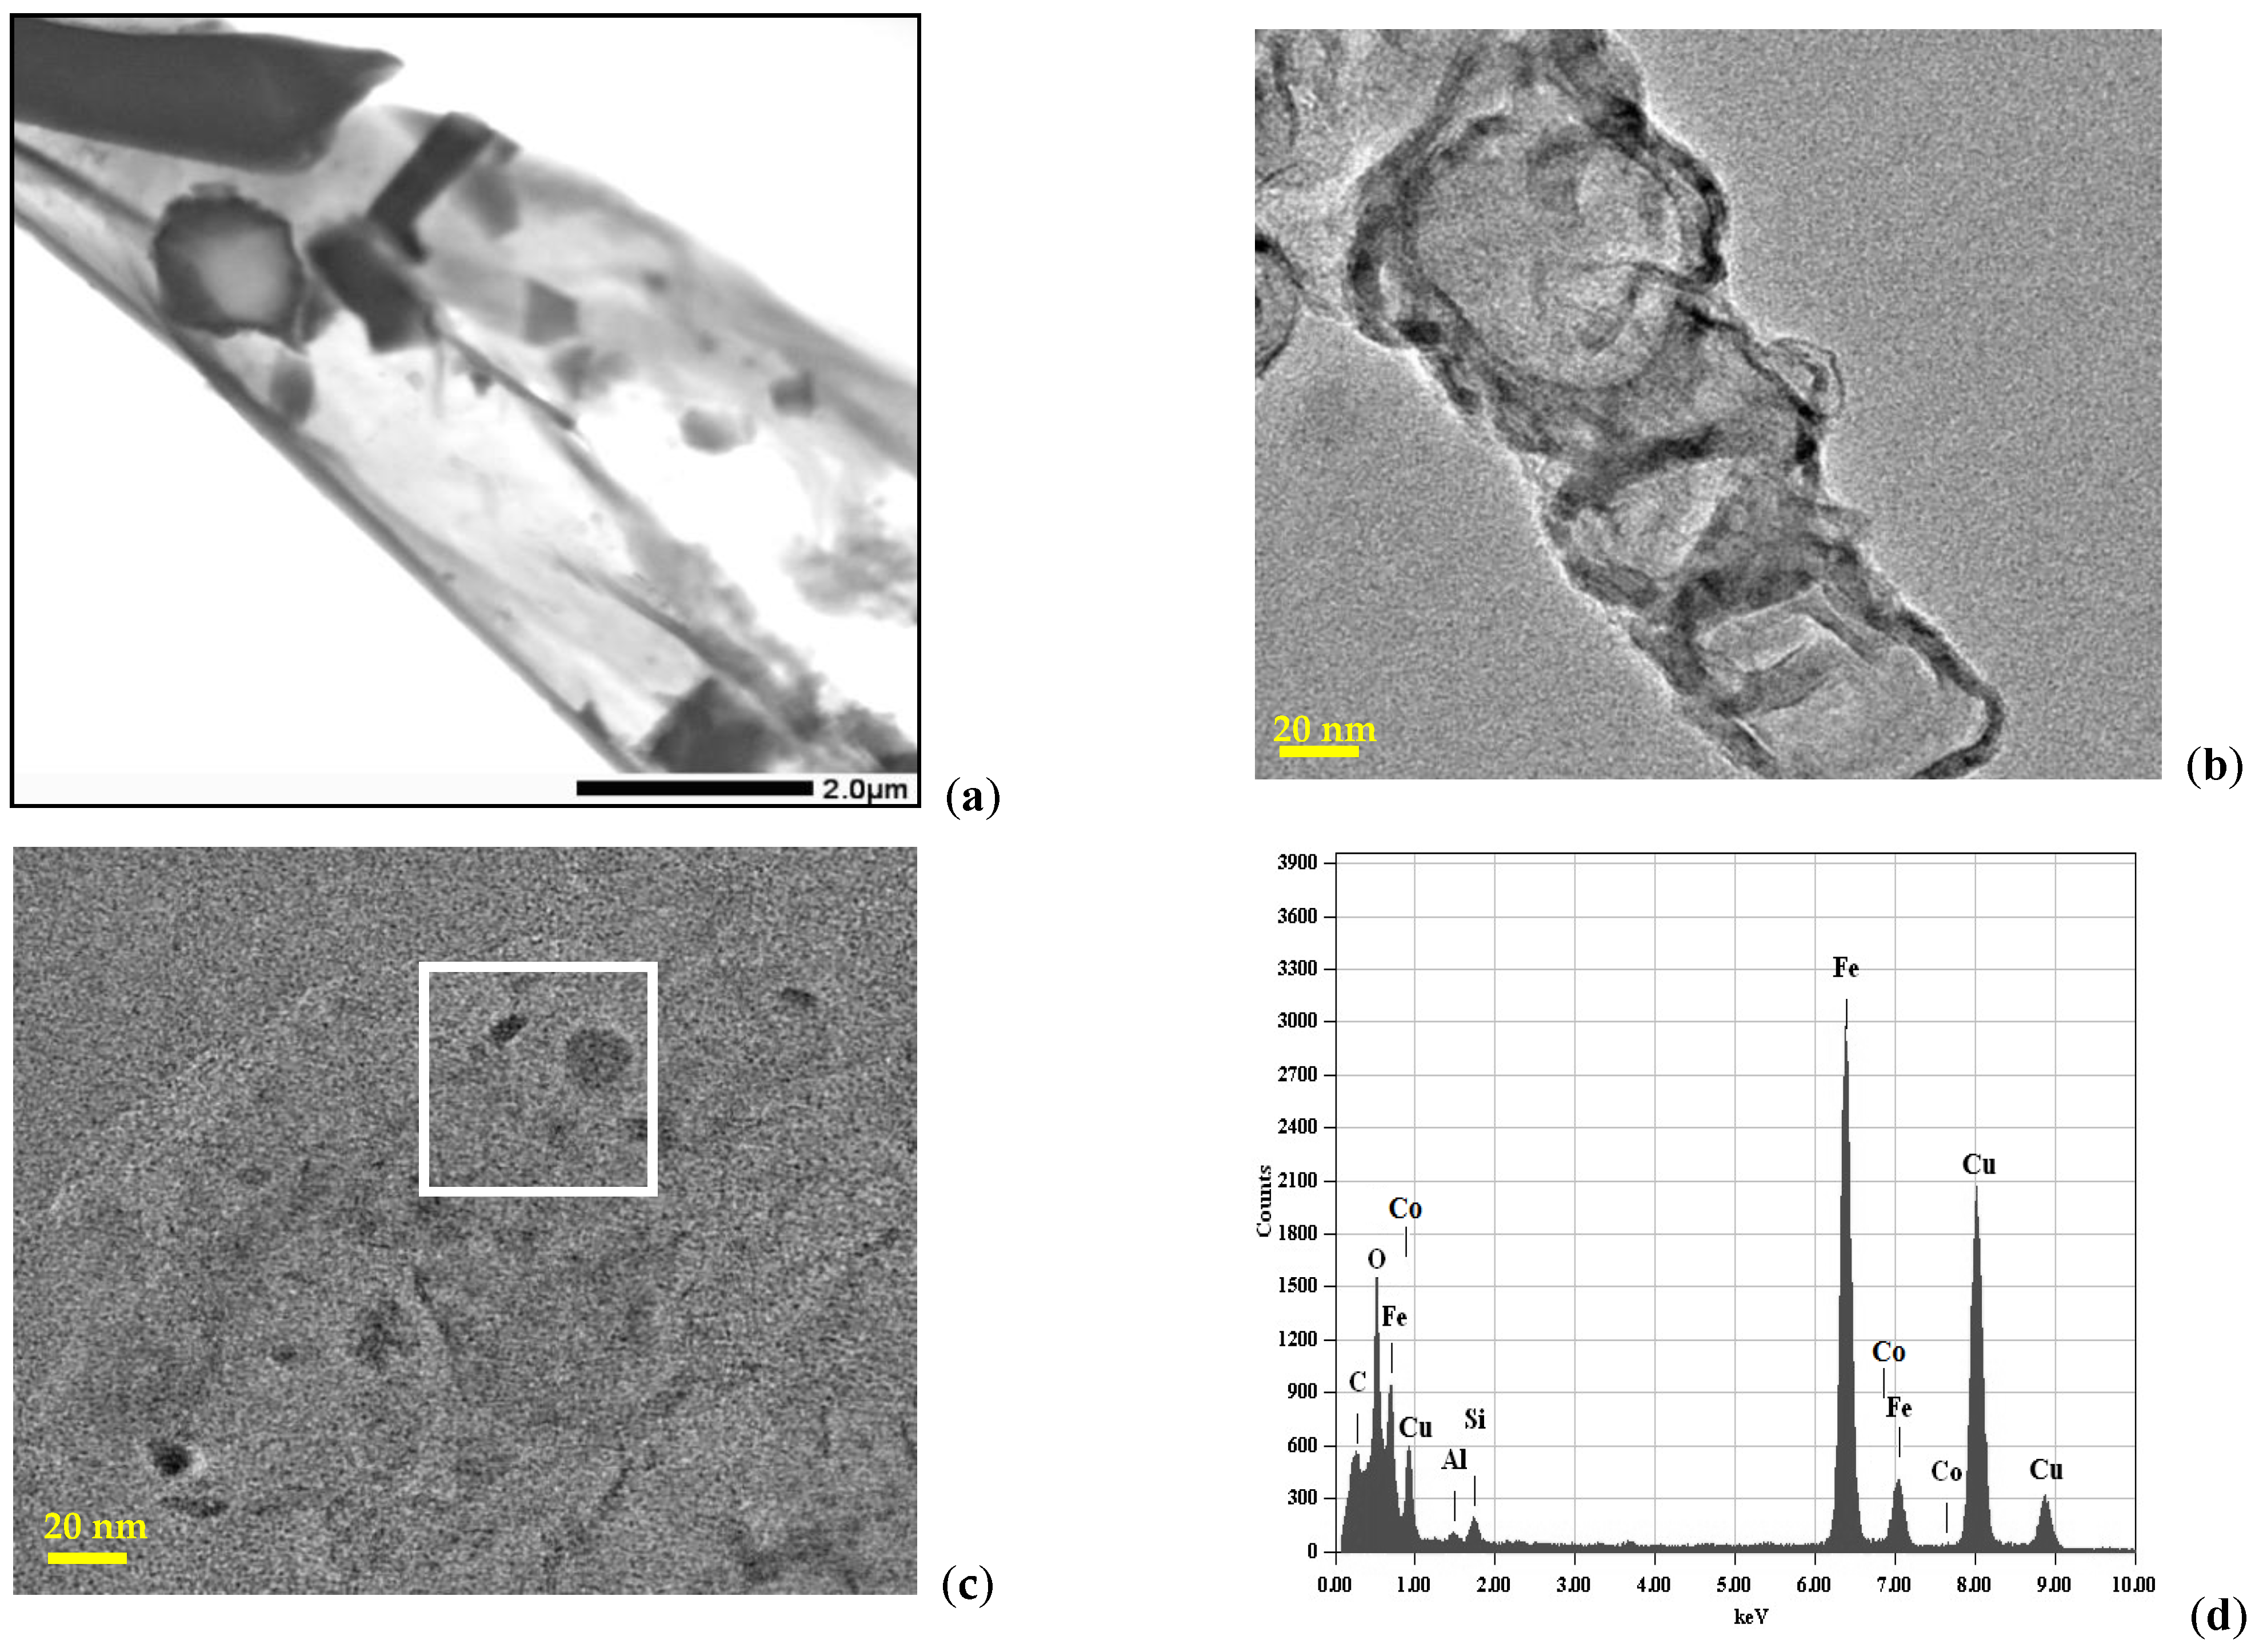
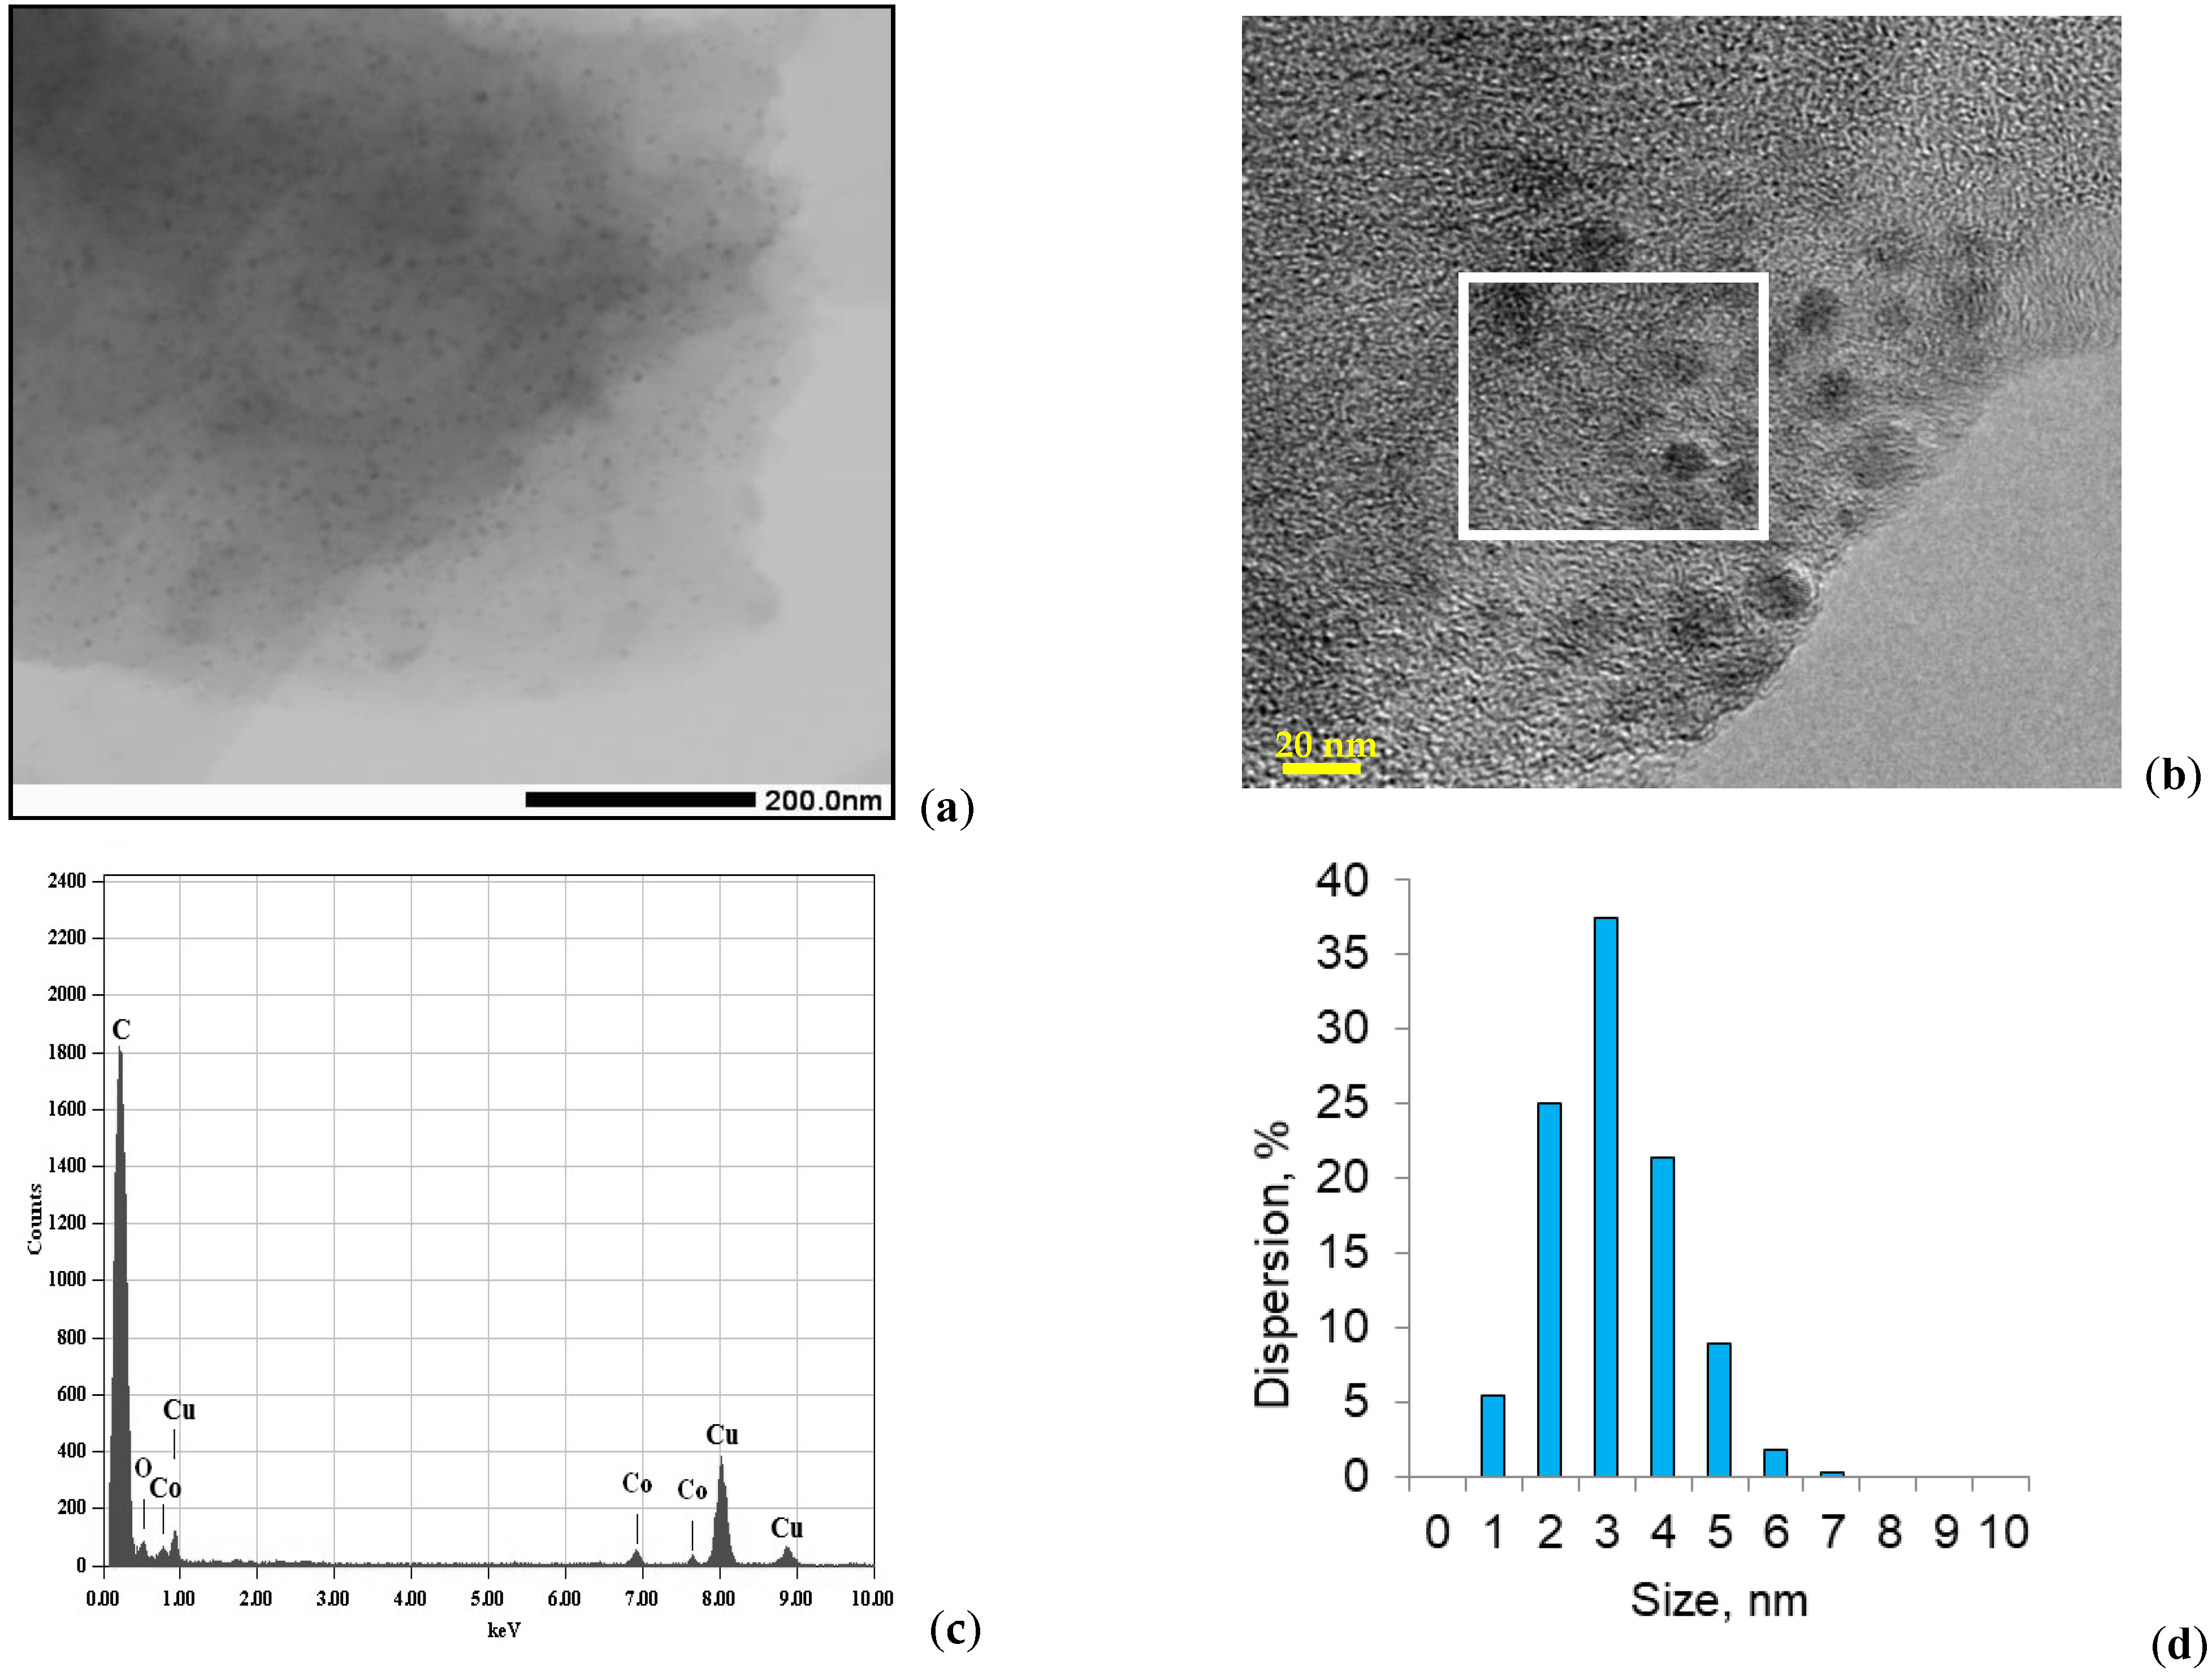
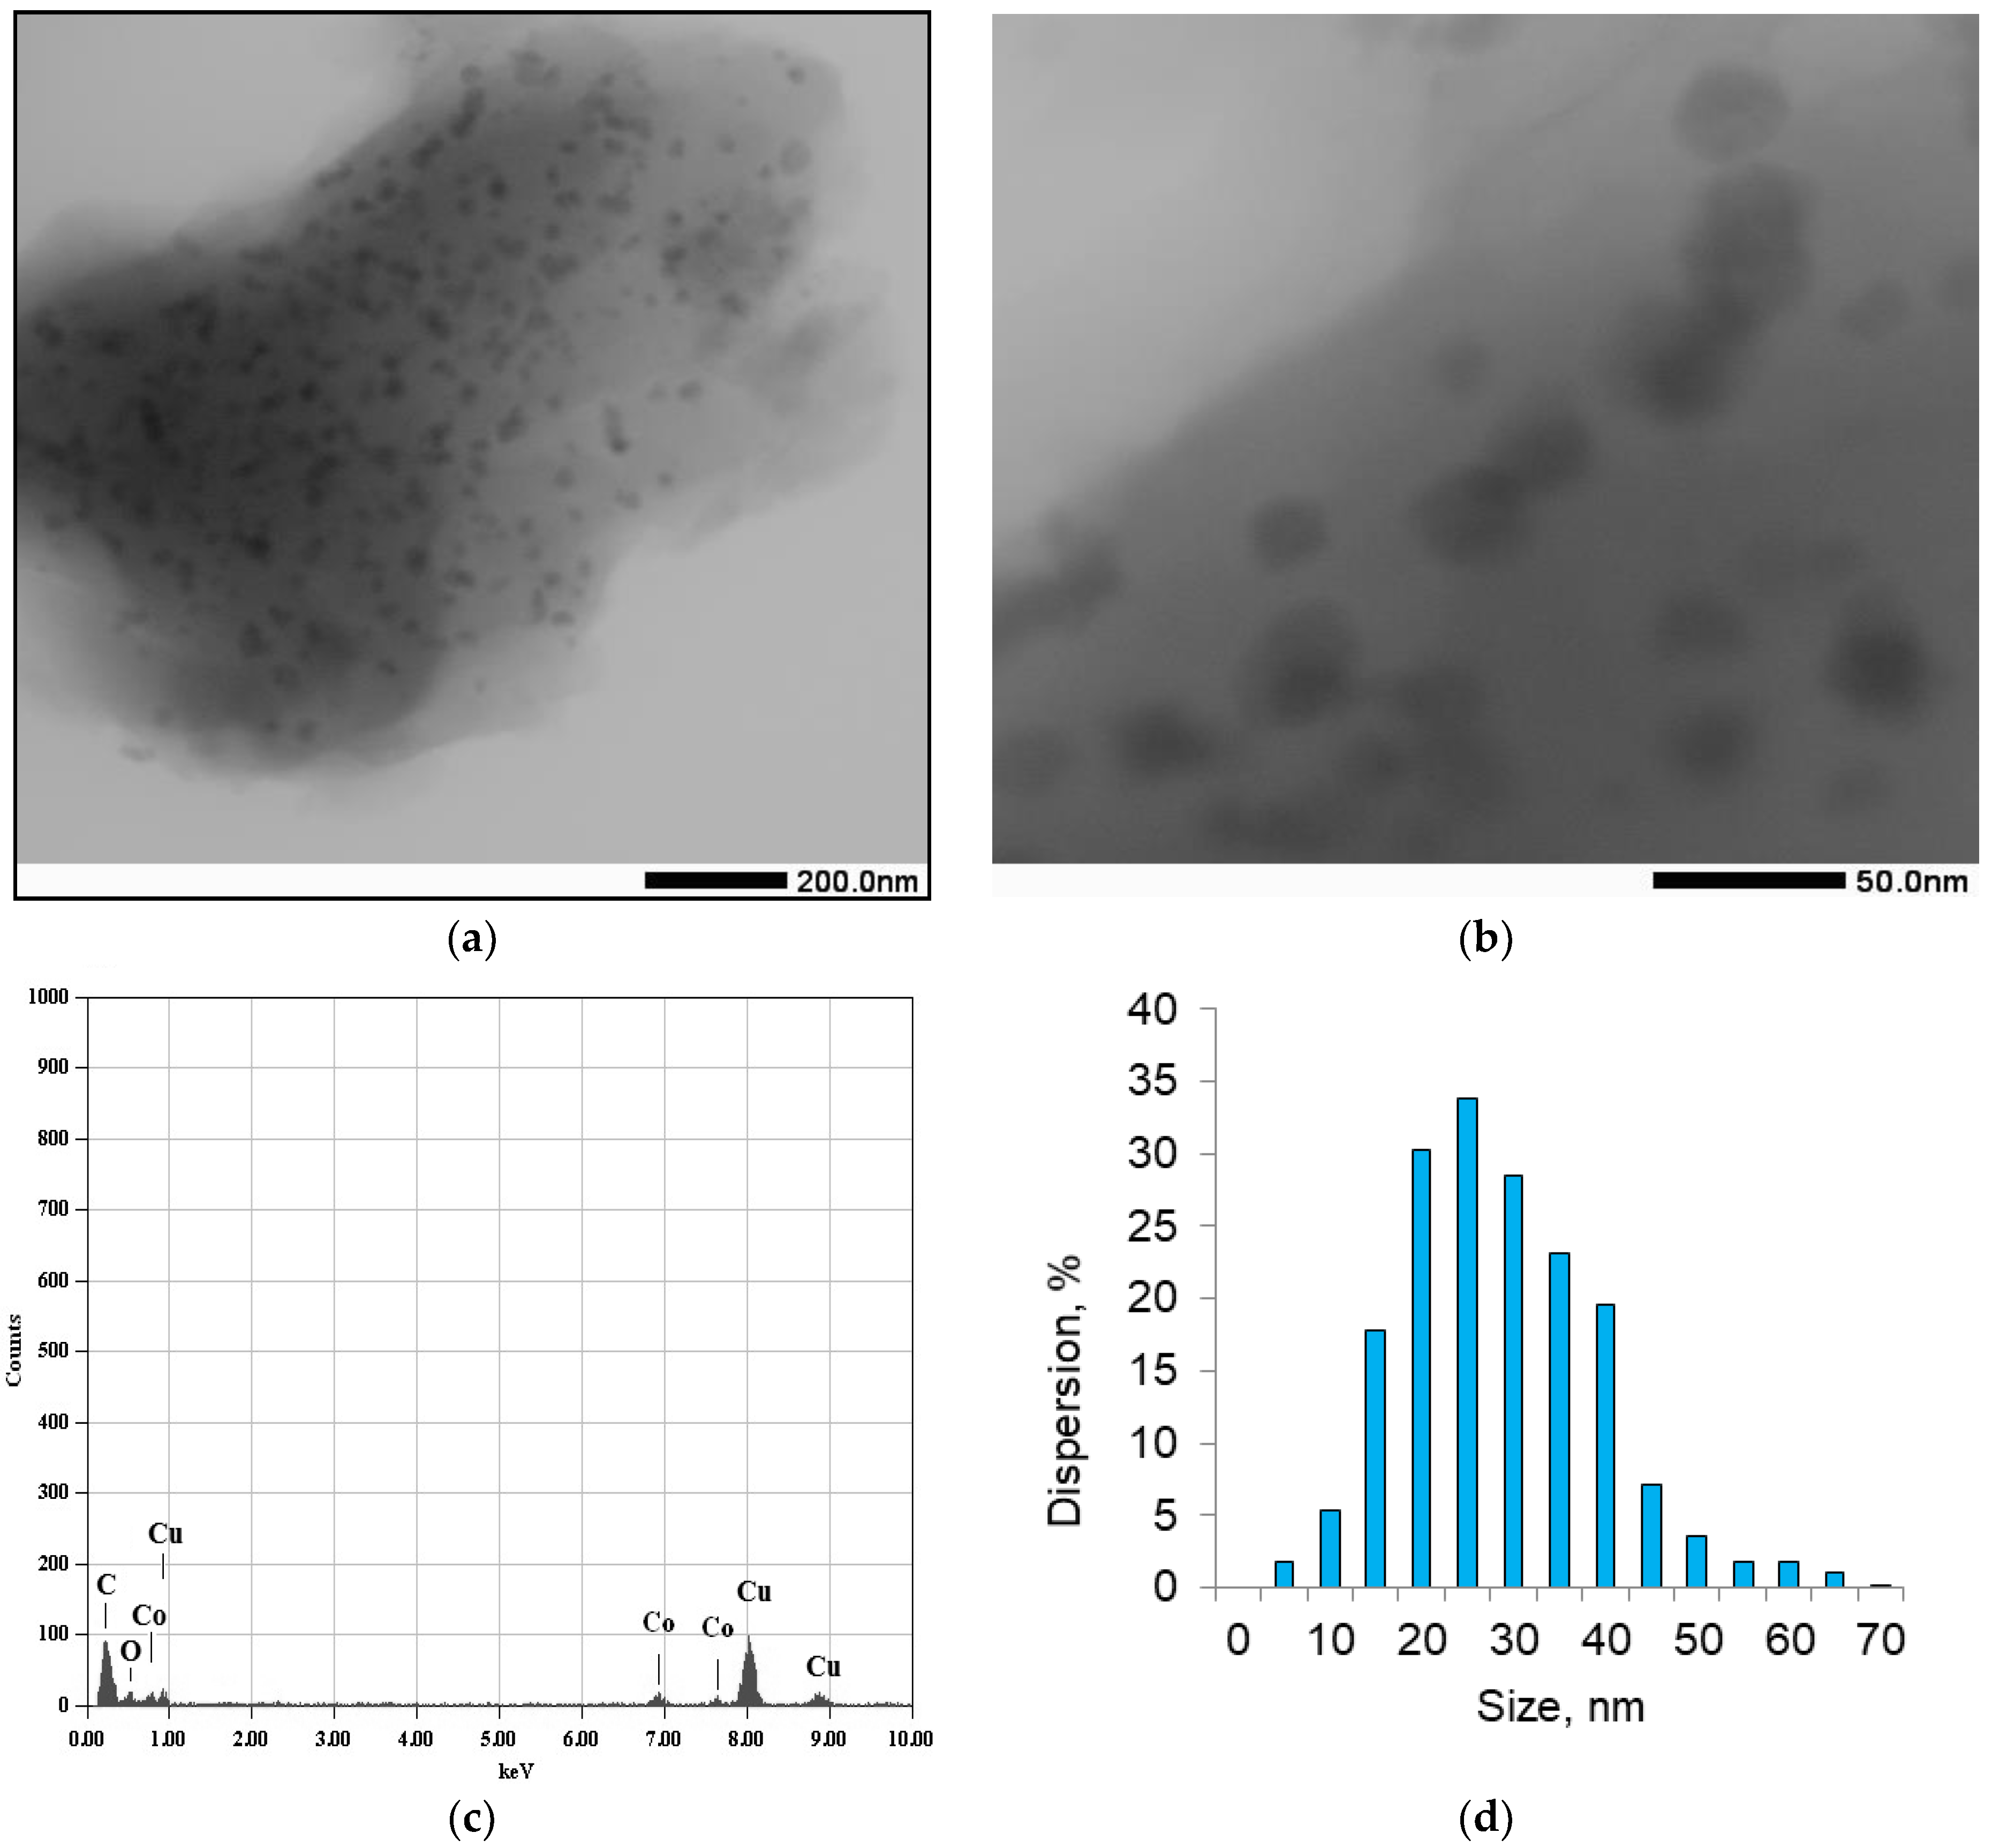
2.2. Study of the Structure of Cobalt-Containing Active Components

Figure 3 shows the X-ray diffraction (XRD) patterns of the initial lignin (sample 1), lignin containing 0.5 wt% cobalt deposited from the acetylacetonate complex Co(acac)2 *2H2O (sample 2), solid residue obtained after carbon dioxide reforming of cobalt-containing lignin (sample 3), and the solid residue obtained in the third experiment of fuel oil pyrolysis with lignin solid residue (sample 4).
The XRD patterns of sample 1 and sample 2 are similar; they show two diffuse peaks in the range of 2Θ = 10–30°, one of which (2Θ = 10–19°), with a maximum at 2Θ = 15.7°, is smoothly converted into a narrower halo (2Θ = 19–30°) with a maximum at 2Θ = 22.50°. In the initial lignin, diffuse peaks correspond to an amorphous structure and are related to the presence of copolymers formed by structurally similar aromatic monomers. These peaks are also retained after the deposition of cobalt, but they are more intense and more diffuse in the case of sample 2, which can be attributed to higher content of the carbon-containing phase in sample 2 due to the acetylacetonate ligand of the deposited cobalt complex. The XRD pattern of the initial lignin (sample 1) is correlated with the earlier data on its structure and phase composition [28,29]. The mineral components of lignin are manifested in the XRD patterns as crystalline phases. The intensity of the most typical SiO2 reflections with d100 = 0.426 nm and d101 = 0.334 nm markedly decreases after Co deposition (sample 2) in comparison with initial lignin, possibly because apart from quartz, initial lignin contains the hexagonal magnesium aluminosilicate phase Mg2Al4Si5O18, the reflections of which almost coincide with SiO2 reflections, whereas sample 1 contains the Co2SiO4 phase, that is, a silicate containing only Co2+, which could have formed upon the reaction of SiO2 with cobalt acetylacetonate.
Samples 3 and 4 prepared under MWI at high temperature show XRD patterns of highly dispersed amorphized materials. Unlike the initial lignin (sample 1) and sample 2, in this case, the first halo is located in the range of 2Θ = 10–32°, whereas the second halo is located at 2Θ = 32.0–49.6°. The XRD patterns of samples 3 and 4 show reflections for SiO2 and cobalt oxide (CoO). The X-ray amorphous phase might be carbon black with mineral impurities and Ξ and Ν within functional groups.
Figure 4 shows the high-resolution Co 2p3/2 of lignin after Co2+ deposition (sample 2), residue obtained after microwave-assisted carbon dioxide Co2+/lignin reforming (sample 3), and the solid residue obtained in the third experiment of fuel oil pyrolysis with lignin solid residue (sample 4), as well as Co(acac)2 complex, which is inscribed in them. Only a Co2+ state is present in the studied samples. For all samples, the strong peaks at 781.3 and 797.2 eV correspond to Co 2p3/2 and Co 2p1/2. The strong satellites at ~786.3 and 802.4 eV are also characteristic of the Co2+ state. The Co3+ state is characterized by reduced binding energies [29]. The Co 2p1/2-2p3/2 spin-orbit splitting (SOS) is ~16 eV for high-spin Co2+ and ~15 eV for low-spin Co3+ states. The observed SOS value of 15.9 eV is consistent with the Co2+ state.
It is evident that after deposition of Co(acac)2 on the lignin surface, the intensity of the satellite at ~785 eV in the spectra of sample 2 became larger than that of the Co(acac)2 complex. The changes in the spectra reflect changes in the local environment of cobalt atoms and probably indicate the appearance of additional coordination bonds of cobalt with active sites on the lignin surface. It can also be assumed that the formation of additional coordination bonds is a factor in the stabilization of Co2+ ions on the lignin surface. We previously showed that a similar stabilization is observed for ferric iron ions when Fe(acac)3 is deposited on the lignin surface [26,27].
Figure 5 shows the high-resolution C 1s spectra fitted with some Gaussian profiles using related chemical shifts [30,31,32]. Their characteristics are presented in Table 4. The peaks at 284.44, ~285.0, ~286.3, 287.7, and ~286.1, eV are attributed to the sp2 state, C–C/C–H, C–O–C/C–OH, C=O/O–C–O, and C(O)O groups. The C 1s spectra of samples 3 and 4 contain the π-π* satellite at ~291.5 eV, which is a fingerprint of the sp2 state. In the C 1s spectrum of sample 3 obtained as a solid residue of the CO2 reforming of sample 1, a π-π* satellite appears at ~291.5 eV, which is a fingerprint of the sp2 state. The relative intensity of the sp2 state is 0.45.
The appearance of the satellite is caused by graphitization of lignin affected by the removal of oxygen-containing groups of lignin and acetylacetonate ligands at the high temperature of carbon dioxide reforming, as well as the formation of a chemical bond between cobalt ions and active sites on the surface. The active sites interacting with Co2+ ions are most likely oxygen ions in hydroxyl groups present on the surface of lignin and the formed highly dispersed CoO clusters. This result is in agreement with the quantification data shown in Table 5, indicating a significant decrease in oxygen concentration.
In sample 4 obtained in the third experiment on the conversion of fuel oil, the fraction of the sp2 state decreases to 0.36, whereas the fraction of the sp3 state increases, which is most likely caused by the formation of a carbon coating.
Typical transmission electron microscopy (TEM) images of sample (1) are shown in Figure 6a–c. The sample consists of lignin and 5–20 nm dark particles located on the lignin surface.
A typical EDA spectrum of the dark particles present in sample 2 is shown in Figure 6d. The spectrum exhibits Cu, C, O, Fe, Si, K, Ca, Mg, and Al lines. The presence of Cu lines is due to the TEM grid material. The carbon line appears because carbon is present both in the TEM grid coating and in lignin. The O, Fe, Si, K, Ca, Mg, and Al lines correspond to impurities present in lignin, such as FeOx, SiO2, K2O, CaO, MgO, and Al2O3. The TEM EDA data suggest that the particles visible in the micrographs are oxide particles of the impurities. The Co line intensity in the EDA spectra (Figure 6d) is comparable with the background line intensity, which may be attributable to low metal concentration (≈0.5 wt.%) in the sample.
TEM EDA analysis of 40 random particles of sample 1 did not reveal pure cobalt. The presence of Co particles in sample 1 is due to the fact that the annealing temperature of the precursor of sample 1 (60 °C) is lower than the decomposition temperature of Co(acac)2 (215 °C, Aldrich SDS, item no. 802527). It is evident that under these synthetic conditions, the formation of cobalt particles on the lignin surface is unlikely.
Typical TEM images of sample 3 obtained after carbon dioxide reforming of lignin at 650–700 °C are shown in Figure 7a,b. The sample consists of dark nanoparticles located on the lignin surface. A typical EDA spectrum of the particles is shown in Figure 7c. The spectrum contains virtually no lines for impure Fe, Si, K, Ca, Mg, and Al oxides, which are detected for sample 2, possibly as a result of leaching of the impurity oxide particles weakly bound to the lignin surface and to the liquid reforming products.
As shown in Figure 7c, the EDA spectrum of sample 3 exhibits intense cobalt lines; hence, the particles shown in Figure 7a,b can be identified as Co-containing particles. The size distribution histogram of Co-containing particles is depicted in Figure 7d. The histogram is narrow and unimodal. The detected particle size ranges from 1 to 7 nm. The average particle size is 3 nm.
Typical TEM images of sample 4, which is the residue after fuel oil processing in the third experiment, are shown in Figure 8a,b. The sample consists of dark particles located on the lignin surface. The EDA spectrum of the particles is presented in Figure 8b. The spectrum exhibits intense cobalt lines; therefore, the particles visible in Figure 8a,b can be identified as Co-containing particles.
The size distribution histogram of Co-containing particles is depicted in Figure 8d. The histogram is broad and unimodal, and the size of the detected particles in the sample ranges from 5 to 70 nm. The average particle size is 25 nm. Figure 7d and Figure 8d indicate that the Co-containing particles in sample 4 are ~10 times larger than those in sample 3, possibly due to the increased experimental time for fuel oil processing and, as a consequence, more pronounced aggregation of small particles to larger particles.
The XRD, X-ray photoelectron spectroscopy (XPS), and TEM data indicate that during carbon dioxide reforming of lignin under induced heating and plasma generation, the deposited Co(acac)2 precursor decomposes on the surface to afford nano-sized Co-containing particles. The particle size distribution is unimodal, with a predominant particle size of 3 nm for sample 3 and 25 nm for sample 4.
The role of Co-containing particles in the above catalytic reactions is probably to activate the carbon bonds of lignin, which substantially increases the microwave absorption capacity of the system as a whole. The subsequent use of the cobalt-containing residue of lignin conversion as a catalytic system and MWI-absorbing material results in active fuel oil pyrolysis in a plasma catalytic process to afford gaseous and liquid hydrocarbons. In the plasma catalytic pyrolysis, fuel oil conversion is probably accompanied by the conversion of the organic matter of the residue and agglomeration of cobalt oxide particles.
The XPS data indicate that highly dispersed Co-containing particles strongly interact with the surface of the residue formed in the first stage of carbon dioxide reforming of lignin, promoting the subsequent agglomeration of the particles under conditions of intense fuel oil conversion. The formation of carbon deposits and the increase in the size of cobalt-containing particles reduce the microwave absorption capacity and the subsequent applicability. When the concentration of the cobalt-containing oxide is 0.5–1.0 wt.%, the size of the formed cobalt clusters is most appropriate for MWI absorption and plasma generation. A similar effect of the size of metal particles on the intensity of microwave irradiation absorption was observed previously [25,26], demonstrating that in the presence of nano-sized iron oxide particles, an increase in the concentration above 0.5% leads to a more pronounced decrease in the microwave absorption capacity compared to that for a cobalt-containing system.
The decrease in the cobalt content in the solid residue shown in Table 5 is most likely caused by the formation of a carbon coating screening cobalt clusters. During the carbonization of lignin, cobalt clusters are covered with a layer of carbon (sample 3), and during the pyrolysis of fuel oil and the carbon residue of cobalt conversion, the carbon layer on top of cobalt particles only increases (sample 4), that follows from the XPS data. The analyses performed by X-ray fluorescence spectroscopy showed that the cobalt content in the bulk of the carbon material is 0.5 wt.% in lignin after Co2+ deposition (sample 2), residue obtained after microwave-assisted carbon dioxide (Co2+/lignin sample 3; 1.3 wt.%), and solid residue obtained after the third experiment of lignin pyrolysis (sample 4; 0.5 wt.%).
Thus, the results demonstrate the possibility of highly efficient use of microwave irradiation in the two-stage processing of highly stable plant- and oil-based substrates, such as lignin, carbon dioxide, and fuel oil to important energy carriers, such as hydrogen and hydrocarbons, which are major components of fuels.

3. Materials and Methods

Wood-derived lignin provided by the LLC Kirov Biochemical Plant, Kirov, Russia was used in the present study. Elemental composition of lignin: carbon, 61.8%; hydrogen, 6.1%; and oxygen, 32.1%. The detailed composition and physicochemical characteristics of lignin were described in a previous study [20]. Fuel oil was provided by JSC Gazpromneft–Moscow Refinery, Moscow, Russia. The initial boiling point (IBP) of the fuel oil was 360 °C (elemental composition: carbon, 88.5%; hydrogen, 9.7%; nitrogen and oxygen, 0.9%; and sulfur, 0.9%.
Cobalt (II) acetylacetonate Co(acac)2 was deposited on the lignin surface from a solution in benzene. The initial lignin was dried in a drying oven at a temperature of 110 °C for 2 h and sieved, and the 0.5–2.0 mm fraction was selected. Prior to the deposition of Co(acac)2, lignin was dried in a vacuum for 2 h at 60 °C. The weight of Co(acac)2 was calculated from the specified cobalt content in lignin. For deposition, a specified volume of a benzene solution consisting of 0.298–0.372 g Co(acac)2 in 35 mL of benzene was added to 12–15 g of lignin placed in a glass-stoppered, round-bottom flask. After mixing the solution of cobalt acetylacetonate with lignin, the sample was kept for 2 h in a stoppered flask, and the content was periodically shaken for uniform precipitation The flask was opened, and the content was dried at room temperature in a fume hood for 24 h. Then, heat treatment was carried out in a vacuum drying oven at 60 °C for 3 h. The procedure afforded lignin samples containing 0.1, 0.5, 1.0, and 2.0 wt% cobalt.
The experiments on the conversion of lignin and fuel oil were carried out in an original laboratory microwave setup consisting of a magnetron generating a traveling wave with a frequency of 2.45 GHz, a waveguide, a 20 cm3 quartz reactor mounted in the waveguide, and an absorption chamber for residual radiation [3].
In the first stage, carbon dioxide reforming of lignin-containing, surface-deposited cobalt precursor was performed. In a typical experiment on the carbon dioxide reforming of lignin modified with Co(acac)2, the reactor was charged with 9.6–10 g of lignin microwaved at 15 mA current and 2500 V voltage, with CO2 passed at a flow rate of 30 cm3/min. The exposure time was 20–25 min. The carbon dioxide reforming of lignin was carried out at a microwave-induced temperature of 650–700 °C. The temperature was controlled by changing the magnetron current. The temperature in the reaction zone was measured by a thermocouple. The reforming of lignin afforded gaseous products and a solid carbon residue, which was used in the following experimental series on fuel oil conversion as a catalyst absorbing MWI.
In the second stage, fuel oil pyrolysis was carried out at a microwave-induced temperature of 600–650 °C. The ratio of the MWI-absorbing catalyst to the feed was ~1/8. Fuel oil (25 g) was charged into a quartz reactor in such a way that the height of the fuel oil layer was equal to the waveguide width. Then, the cobalt-containing carbon residue (3 g) obtained in the first stage of carbon dioxide reforming of lignin was added, and the mixture was thoroughly stirred. The experiments were carried out at a microwave-induced temperature of 600–650 °C in the reaction zone. Fuel oil pyrolysis afforded gaseous and liquid products.
The gaseous reaction products were analyzed by online gas chromatography on a CrystalLux-4000M chromatograph (LLC Research and Production Company Meta-Chrom, Yoshkar-Ola, Russia). Gaseous hydrocarbons were analyzed using a 1.5 m column packed with α-Al2O3 granules (0.5 mm) with 15% deposited squalane using a flame ionization detector and He (Brand 6.0, LLC Ballongaz, Moscow, Russia) as the eluent. The contents of H2, CH4, CO, and CO2 were determined using a column packed with the SKT carbon phase (LLC Research and Production Company Meta-Chrom) and a heat conductivity detector. Argon (high-purity 4.8, LLC Ballongaz) was used as the eluent.
The liquid products were distilled into fractions with IBPs of 220 °C and 220–350 °C and the residue boiling away above 350 °C. The selected liquid fractions were analyzed using a Leco Pegasus® BT 4D 2D gas chromatograph/time-of-flight mass-spectrometer (GC×GC-TOFMS Leco Corp., St. Joseph, MI 49085, USA). The columns were as follows: (1) Rxi-5Sil phase (30 m × 0.25 mm × 0.25 µm), (2) Rxi-17Sil phase (1.7 m × 0.10 mm × 0.10 µm). Conditions: helium as the carrier gas; 1 mL/min flow rate through the column; 1:500 split ratio; 3 mL/min injector (septum) purge; injector temperature of 300 °C. The temperature mode of the 1st furnace: initial temperature of 40 °C (2 min), heating at 3 °C/min to 320 °C, holding for 5 min. The temperatures of the 2nd furnace and the modulator were maintained 6 and 21 °C above the temperature of the 1st furnace, respectively; hence, the modulation time in the modulator was 6 s. Mass spectrometer operation mode: electron ionization (70 eV), ion source temperature of 280 °C, mass detection range of 35–520, and recording rate of 100 spectra per second. The analysis results were processed using CromaTOF software (Leco).
After removal of liquid products, a solid residue remained in the reactor. The time of experiments corresponded to the end of evolution of gaseous and liquid boiling products accompanied by a sharp temperature rise in the reactor. The overall conversion was estimated based on the yield of gaseous and liquid products.
Conversion of the feed mixture was estimated based on the loss of mass, which was in satisfactory agreement with the mass of the collected products (~10% discrepancy):
X = ( M F M R   ) M F   × 100   M P   M F   × 100   ,
where X is the conversion of the feed mixture (%), MF is the weight of the feed (g), MR is the weight of the solid residue in the reactor after the experiment (g), and MP is the weight of products.
The degree of hydrogen extraction (αH2) was estimated using the following equation:
α H 2 = n H 2 × 2 + n C H 4 × 4 +   ( n C 2 +   × m ) n H 2 l i g × 100 %
where, nH2 is the number of moles of obtained molecular hydrogen, nCH4 is the number of moles of produced methane, nC2+ is the number of moles of the corresponding hydrocarbon, m is the number of hydrogen atoms in the hydrocarbon molecule, nH2-lig is the number of moles of hydrogen in the initial lignin determined by the C, H method, N, S-analysis.
Selectivity for molecular hydrogen (SH2) was evaluated using the following equation:
S H 2 = n H 2 n H 2 × 2 + n C H 4 × 4 +   ( n C 2 +   × m ) × 100 %
The phase composition of the solid material remaining in the reactor after removal of liquid products was studied by XRD, XPS, and TEM.
The X-ray diffraction patterns of the solid samples were measured on a Rigaku Rotaflex D/Max-RC diffractometer (Rigaku Corp., Tokyo, Japan) with a rotating copper anode and a secondary graphite monochromator (CuKα radiation wavelength of 0.1542 nm) in continuous scanning mode. The X-ray source operated at 50 kV and 100 mA, and the scanning rate was 2 °min. The experimental X-ray diffraction patterns were processed using MDI Jade 6.5 software (ICDD, Newtown Square, PA 19073, USA). The phase composition was identified using the PDF-2 Database Copyright International Centre for Diffraction Data (ICDD) Copyright © 2003-2010 CRYSTAL IMPACT, Bonn, Germany.
X-ray photoelectron spectra were recorded using an ES-2403 spectrometer (Institute for Analytic Instrumentation of RAS, St. Petersburg, Russia) equipped with a PHOIBOS 100-MCD5 energy analyzer (SPECS, Berlin, Germany) and an XR-50 X-ray source (SPECS, Berlin, Germany) with Al Kα radiation in the fixed analyzer transmission mode. Samples were allowed to outgas for 180 min before analysis and were stable during the examination. The analyzer pass energy was set at 40 eV to record survey spectra and 20 eV to measure high-resolution spectra. The spectra were measured with a step size of 0.1 eV at room temperature. The photoelectron spectra were approximated by Gaussian functions, and the background caused by secondary electrons and photoelectrons that lost energy was approximated by a Shirley-type background line. Quantification was performed using atomic sensitivity factors included in the spectrometer software. The samples were fixed to the sample holder by double-sided adhesive tape. Sample charging was corrected by referencing the C–C/C–H state identified in the C 1s spectra of sample 1 an sample 2, as well as Co(acac)2, to which a binding energy of 284.8 eV was assigned. In the case of samples 2 and 3, it was corrected to the sp2 state in the C 1s spectra (284.44 eV) [22].
TEM examination was carried out for samples 2–4. TEM images were obtained on a JEOL JEM 2100F/UHR instrument (Jeol Ltd., Akishima, Japan) with a 0.1 nm resolution. Prior to examination, a sample (0.1 g) was placed into C2H5OH (30 mL) and ultrasonicated for 300 s. A drop of the resulting mixture was placed on a standard TEM grid, which was dried for 1 h and mounted in the microscope. Then, the examination was carried out. The particle size was determined as the maximum linear dimension [23,24,25]. The particles were identified using energy-dispersive analysis (EDA) on a JED–2300 instrument (Jeol Ltd., Akishima, Japan).

Author Contributions

Conceptualization and methodology, M.V.T.; cobalt nanoparticle synthesis, O.V.B.; XPS study, A.V.N.; TEM and EDX analyses, S.A.N.; catalytic investigations, GS; analysis and writing, A.V.C. and G.I.K. All authors have read and agreed to the published version of the manuscript.

Funding

The work was funded by the Russian Science Foundation (project no. 21-13-00457).

Acknowledgments

This work was performed using the equipment of the Shared Research Center Analytical center of deep oil processing and petrochemistry of TIPS RAS.

Conflicts of Interest

The authors declare no conflict of interest.

References

  1. Moiseev, I.I. Green chemistry in the bulk chemicals industry. Kinet. Catal. 2011, 52, 337–347. [Google Scholar] [CrossRef]
  2. Moiseev, I.I. Biotechnology is storming the heights of petrochemistry. Kinet. Catal. 2016, 57, 405–421. [Google Scholar] [CrossRef]
  3. Liu, W.J.; Jiang, H.; Yu, H.Q. Thermochemical conversion of lignin to functional materials: A review and future directions. Green Chem. 2015, 17, 4888–4907. [Google Scholar] [CrossRef]
  4. Strassberger, Z.; Tanase, S.; Rothenberg, G. The pros and cons of lignin valorisation in an integrated biorefinery. RSC Adv. 2014, 4, 25310–25318. [Google Scholar] [CrossRef] [Green Version]
  5. Hill, C.A. Wood Modification: Chemical, Thermal and Other Processes; John Wiley & Sons: Hoboken, NJ, USA, 2007. [Google Scholar]
  6. Cengiz, E.; Babagiray, M.; Aysal, F.E.; Aksoy, F. Kinematic viscosity estimation of fuel oil with comparison of machine learning methods. Fuel 2022, 316, 123422. [Google Scholar] [CrossRef]
  7. Del Bianco, A.; Panariti, N.; Di Carlo, S.; Beltrame, P.L.; Carniti, P. New developments in deep hydroconversion of heavy oil residues with dispersed catalysts. 2. Kinetic aspects of reaction. Energy Fuels 2014, 8, 593–597. [Google Scholar] [CrossRef]
  8. Degnan, T.F. Applications of zeolites in petroleum refining. Top. Catal. 2000, 13, 349–356. [Google Scholar] [CrossRef]
  9. Gary, J.H.; Handwerk, J.H.; Kaiser, M.J.; Geddes, D. Petroleum Refining: Technology and Economics; CRC Press: Boca Raton, FL, USA, 2007. [Google Scholar]
  10. Kiselev, V.P.; Efremov, A.A. Radiographic study of the interaction of petroleum bitumen and hydrolytic lignin in the preparation of compound binders. Chem. Veg. Raw Mater. 2002, 3, 49–52. [Google Scholar]
  11. Nedjat, V.T.; Sahin, S. Energy of the 21st century: Hydrogen energy. Altern. Energy Ecol. 2014, 2, 12–28. [Google Scholar]
  12. Tsodikov, M.V.; Ellert, O.G.; Nikolaev, S.A.; Arapova, O.V.; Bukhtenko, O.V.; Maksimov, Y.V.; Vasil’kov, A.Y. Fe-containing nanoparticles used as effective catalysts of lignin reforming to syngas and hydrogen assisted by microwave irradiation. J. Nanopart. Res. 2018, 20, 86. [Google Scholar] [CrossRef]
  13. Tsodikov, M.V.; Perederii, M.A.; Chistyakov, A.V.; Konstantinov, G.I.; Kadiev, K.M.; Khadzhiev, S.N. High-speed degradation of sorbed petroleum residues and pollutants. Solid Fuel Chem. 2012, 46, 121–127. [Google Scholar] [CrossRef]
  14. Vakhin, A.V.; Khelkhal, M.A.; Mukhamatdinov, I.I.; Mukhamatdinova, R.E.; Tajik, A.; Slavkina, O.V.; Morozov, O.G. Changes in Heavy Oil Saturates and Aromatics in the Presence of Microwave Radiation and Iron-Based Nanoparticles. Catalysts 2022, 12, 514. [Google Scholar] [CrossRef]
  15. Wu, Z.; Zhao, X.; Zhang, J.; Li, X.; Zhang, Y.; Wang, F. Ethanol/1, 4-dioxane/formic acid as synergistic solvents for the conversion of lignin into high-value added phenolic monomers. Bioresour. Technol. 2019, 278, 187–194. [Google Scholar] [CrossRef]
  16. Wang, W.; Ma, Z.; Zhao, X.; Liu, S.; Cai, L.; Shi, S.Q.; Ni, Y. Effect of Various Microwave Absorbents on the Microwave-Assisted Lignin Depolymerization Process. ACS Sustain. Chem. Eng. 2020, 8, 16086–16090. [Google Scholar] [CrossRef]
  17. Deminsky, M.; Jivotov, V.; Potapkin, B.; Rusanov, V. Plasma-assisted production of hydrogen from hydrocarbons. Pure Appl. Chem. 2002, 74, 413–418. [Google Scholar] [CrossRef]
  18. Slovetskii, D.I. Plasma-chemical processes for the preparation of pure hydrogen. High Energy Chem. 2006, 40, 86–92. [Google Scholar] [CrossRef]
  19. Grant, E.; Halstead, B.J. Dielectric parameters relevant to microwave dielectric heating. Chem. Soc. Rev. 1998, 27, 213–224. [Google Scholar]
  20. Chistyakov, A.V.; Konstantinov, G.I.; Tsodikov, M.V.; Maximov, A.L. Rapid Conversion of Methane to Hydrogen Stimulated by Microwave Irradiation on the Surface of a Carbon Adsorbent. Doklady Phys. Chem. 2021, 498, 49–53. [Google Scholar] [CrossRef]
  21. Tsodikov, M.V.; Ellert, O.G.; Nikolaev, S.A.; Arapova, O.V.; Konstantinov, G.I.; Bukhtenko, O.V.; Vasil’kov, A.Y. The role of nanosized nickel particles in microwave-assisted dry reforming of lignin. Chem. Eng. J. 2017, 309, 628–637. [Google Scholar] [CrossRef]
  22. Sharma, A.K.; Mishra, R.R. Role of particle size in microwave processing of metallic material systems. Mater. Sci. Technol. 2018, 34, 123–137. [Google Scholar] [CrossRef]
  23. Vakhin, A.V.; Khelkhal, M.A.; Tajik, A.; Gafurov, M.R.; Morozov, O.G.; Nasybullin, A.R.; Shchekoldin, K.A. The Role of Nanodispersed Catalysts in Microwave Application during the Development of Unconventional Hydrocarbon Reserves: A Review of Potential Applications. Processes 2021, 9, 420. [Google Scholar] [CrossRef]
  24. Liang, X.; Liu, W.; Cheng, Y.; Lv, J.; Dai, S.; Tang, D.; Ji, G. Recent process in the design of carbon-based nanostructures with optimized electromagnetic properties. J. Alloys Compd. 2018, 749, 887–899. [Google Scholar] [CrossRef]
  25. Naumkin, A.V.; Kraut-Vass, A.; Gaarenstroom, S.W.; Powell, C.J. NIST X-ray Photoelectron Spectroscopy Database, Version 4.1.; National Institute of Standards and Technology: Gaithersburg, MD, USA, 2012. [Google Scholar]
  26. Nikolaev, S.A.; Chistyakov, A.V.; Chudakova, M.V.; Yakimchuk, E.P.; Kriventsov, V.V.; Tsodikov, M.V. Novel gold catalysts for the direct conversion of ethanol into C3+ hydrocarbons. J. Catal. 2013, 297, 296–305. [Google Scholar] [CrossRef]
  27. Nikolaev, S.A.; Permyakov, N.A.; Smirnov, V.V.; Vasil’kov, A.Y.; Lanin, S.N. Selective hydrogenation of phenylacetylene into styrene on gold nanoparticles. Kinet. Catal. 2010, 51, 288–292. [Google Scholar] [CrossRef]
  28. Nikolaev, S.A.; Pichugina, D.A.; Mukhamedzyanova, D.F. Sites for the selective hydrogenation of ethyne to ethene on supported NiO/Au catalysts. Gold Bull. 2012, 45, 221–231. [Google Scholar] [CrossRef]
  29. Tsodikov, M.; Arapova, O.; Nikolaev, S.A.; Chistyakov, A.; Maksimov, Y.V. Benefit of Fe-containing catalytic systems for dry reforming of lignin to syngas under microwave radiation. Chem. Eng. Trans. 2018, 65, 367–372. [Google Scholar]
  30. Beamson, G. High resolution XPS of organic polymers: The Scienta ESCA300 Database. J. Chem. Educ. 1993, 70, A25. [Google Scholar]
  31. Chastain, J.; King, R.C., Jr. Handbook of X-ray Photoelectron Spectroscopy; Perkin-Elmer Corporation: Waltham, MA, USA, 1992; Volume 40, p. 221. [Google Scholar]
  32. Krivenko, A.G.; Ryabenko, A.G.; Naumkin, A.V. Active forms of oxygen as agents for electrochemical functionalization of SWCNTs. Carbon 2013, 53, 188–196. [Google Scholar]
Figure 1. Dynamics of microwave-induced heating of the reaction zone of lignin conversion with various amounts of deposited cobalt.
Catalysts 12 01315 g001
Figure 2. Heating dynamics of the reaction zone filled with the cobalt-containing residue of the carbon dioxide reforming of lignin modified with 0.5 wt.% cobalt (curve 1), the carbon residue of the first fuel oil pyrolysis experiment (curve 2), the carbon residue of the second fuel oil pyrolysis experiment (curve 3), and the carbon residue of the third fuel oil pyrolysis experiment (curve 4).
Catalysts 12 01315 g002
Figure 3. XRD patterns of the initial lignin (sample 1) and Co-containing lignin after Co2+ deposition (sample 2), and after microwave-assisted carbon dioxide reforming (sample 3), as well as the solid residue obtained in the third experiment of fuel oil pyrolysis with lignin solid residue (sample 4).
Catalysts 12 01315 g003
Figure 4. High-resolution Co 2p spectra of lignin after Co2+ deposition (sample 2), residue obtained after microwave-assisted carbon dioxide Co2+/lignin reforming (sample 3), and the solid residue obtained in the third experiment of fuel oil pyrolysis with lignin solid residue (sample 4) and Co(acac)2 (yellow area). The latter is superimposed on other spectra.
Catalysts 12 01315 g004
Figure 5. High-resolution C 1s spectrum of the samples: initial lignin (sample 1) (a), lignin after Co2+ deposition (sample 2) (b), residue obtained after microwave-assisted carbon dioxide Co2+/lignin reforming (sample 3) (c), the solid residue obtained in the third experiment of fuel oil pyrolysis with lignin solid residue (sample 4) (d), and Co(acac)2 (e).
Catalysts 12 01315 g005aCatalysts 12 01315 g005b
Figure 6. Micrographs of lignin after Co2+ deposition (sample 2) (ac) and EDA spectrum of the area with dark particles marked by a rectangle (d).
Catalysts 12 01315 g006
Figure 7. Micrographs of residue obtained after microwave-assisted carbon dioxide Co2+/lignin reforming (sample 3) (a,b), EDA spectrum of the area with dark particles marked by the rectangle (c), and cobalt particle size distribution histogram (d).
Catalysts 12 01315 g007
Figure 8. Micrographs of residue after fuel oil processing (sample 4) (a,b), EDA spectrum of the area with dark particles marked by the rectangle (c), and cobalt particle size distribution histogram (d).
Catalysts 12 01315 g008
Table 1. Key characteristics of the carbon dioxide reforming of lignin modified with various amounts of cobalt and compositions of gaseous products (reaction temperature: 600–650 °C, CO2 flow: 30 mL/min, exposure time: 20 min).
Key Characteristics of the Carbon Dioxide Reforming of LigninAmount of Deposited Cobalt, wt.%
0.10.512
Yield of gaseous products, wt.%52.661.561.151.4
Solid residue, wt.%47.438.538.948.6
Degree of hydrogen extraction (αH2), mol.%61.273.573.256.4
Lignin conversion (X), %52.661.561.151.4
Selectivity to molecular hydrogen (SH2), %40.146.746.339.2
Composition of gaseous products, mol.%
H234.143.242.732.6
CH413.917.117.814.3
C2+4.84.03.45.2
CO47.235.636.147.9
Table 2. Fractional composition of fuel oil conversion products formed in three successive microwave-assisted experiments (T = 600–650 °C; τ = 25 min).
Yield of the Main Product Fractions, wt.% 1st Experiment2nd Experiment3rd Experiment
Gas 8.26.15.4
Liquid, including 8585.387.5
IBP * 220 °C 13.77.710.1
220–350 °C 35.944.612.5
BP * ≥ 350 °C 35.532.964.9
Conversion, wt% 93.291.490.9
Solid residue 6.88.69.1
Carbon accumulation in the residue, rel.u. 11.32.2
* IBP—initial boiling point of liquid product, BP—fraction boiling point.
Table 3. Composition of liquid products of microwave-assisted fuel oil pyrolysis in three successive experiments in the presence of cobalt-containing carbon residue (T = 600–650 °C; τ = 25 min, percentages in the total ion current).
Composition Content, %
1st Experiment2nd Experiment3rd Experiment
Alkanes 29.424.424.0
Alkenes + naphthenes 32.528.228.5
Decalins, dienes 13.719.618.6
Benzene derivatives 6.07.06.9
Naphthalenes 2.62.62.6
Indanes + tetralins 4.44.54.2
Indenes 2.11.92.2
Biphenyls 1.11.31.2
Fluorenes 1.61.62.2
Polyaromatics 1.61.61.6
Thiophenes 0.60.70.7
Benzothiophenes 1.11.81.7
Dibenzothiophenes 0.60.60.7
Dibutylfluorenes 0.00.10.0
Unidentified products 2.64.14.5
Table 4. Binding energies (BE), Gaussian widths (W), and relative intensities (Irel) of some groups in the C 1s spectra.
Sample C=C, sp2C–C/CHC–O–C/C–OHO–C–O/C=OC(O)O
1BE, eV 284.8286.2287.6290.0
W, eV 1.931.931.951.95
Irel, a.u. 0.550.270.150.03
2BE, eV 284.8286.2287.6290.0
W, eV 1.931.931.951.95
Irel, a.u. 0.580.260.140.02
3BE, eV284.44285.1286.5287.8289.0
W, eV1.291.291.291.291.3
Irel, a.u.0.450.420.090.020.01
4BE, eV284.44285.0286.4287.8289.0
W, eV1.31.31.31.31.3
Irel, a.u.0.360.530.090.010.00
BE, eV 284.8286.3287.7288.9
Co(acac)2W, eV 1.591.61.61.6
Irel, a.u. 0.850.110.030.02
Table 5. XPS quantification data (at.%) determined from the survey spectra.
Sample 1Sample 2Sample 3Sample 4Co(acac)2
C 1s75.276.193.993.781.0
O 1s24.223.05.34.012.4
Si 2p0.60.50.50.74.7
Co 2p-0.40.30.11.7
S 2p---0.5-
N 1s---0.9-
F 1s----0.3
Publisher’s Note: MDPI stays neutral with regard to jurisdictional claims in published maps and institutional affiliations.

