Article

Assessment of a Euro VI Step E Heavy-Duty Vehicle’s Aftertreatment System

by
Barouch Giechaskiel
1,*,
Tommaso Selleri
2,
Roberto Gioria
1,
Anastasios D. Melas
1,
Jacopo Franzetti
1,
Christian Ferrarese
1 and
Ricardo Suarez-Bertoa
1
1
European Commission, Joint Research Centre (JRC), 21027 Ispra, Italy
2
European Environment Agency (EEA), 1050 Copenhagen, Denmark
*
Author to whom correspondence should be addressed.
Catalysts 2022, 12(10), 1230; https://doi.org/10.3390/catal12101230
Submission received: 25 September 2022 / Revised: 11 October 2022 / Accepted: 12 October 2022 / Published: 14 October 2022
(This article belongs to the Special Issue Catalytic Removal and Resource Utilization of NOx)

Abstract

:
The latest generation of heavy-duty vehicles (Euro VI step E) have to respect low emission limits both in the laboratory and on the road. The most challenging pollutants for diesel vehicles are NOx and particles; nevertheless, NH3 and N2O need attention. In this study, we measured regulated and unregulated pollutants of a Euro VI step E Diesel vehicle. Samples were taken downstream of (i) the engine, (ii) the Diesel oxidation catalyst (DOC) and catalyzed Diesel particulate filter (cDPF), and (iii) the selective catalytic reduction (SCR) unit for NOx with an ammonia slip catalyst (ASC). In addition to typical laboratory and real-world cycles, various challenging tests were conducted (urban driving with low payload, high-speed full-load driving, and idling) at 23 °C and 5 °C. The results showed high efficiencies of the DOC, DPF, and SCR under most testing conditions. Cold start cycles resulted in high NOx emissions, while high-temperature cycles resulted in high particle emissions. The main message of this study is that further improvements are necessary, also considering possible reductions in the emission limits in future EU regulations.

1. Introduction

Air pollution is the largest environmental health risk in Europe. Road transport is one of the principal sources, responsible for approximately 40% of NOx, 20% of CO, and 10% of particulate matter (PM) emissions [1]. In addition to its impact on air quality and public health, the transport sector produced a quarter of EU’s greenhouse gas emissions, with road transport representing the greatest share (72% in 2019). Within on-road diesel vehicles, heavy-duty vehicles are a significant contributor to exhaust emissions and health effects [2,3].
Emissions of heavy-duty vehicles are regulated with a test on an engine dynamometer. A big step in controlling the emissions of vehicles under actual operating conditions was the introduction of the on-road tests with portable emissions measurement systems [4]. Many studies have been conducted with vehicles fulfilling the latest standards (e.g., Euro VI or China VI) [5,6,7,8,9,10,11]. Some have demonstrated significant reductions compared to previous technologies [12,13,14,15]. Some studies have reported that differences can be found between engine-type-approval and actual application of the vehicle, but the regulatory test procedure has not always been followed at the on-road tests [16,17,18]. Some researchers have argued that the exclusion of cold start emissions from the evaluation resulted in significant underestimation of the total emissions [14,19]. In other cases, environmental conditions differing from those in the laboratory (e.g., low ambient temperatures) [20] or undetected failures [21] or tampering [22] can result in high emissions. To address these topics, in Europe, the last regulatory step (Euro VI, step E applicable since 2021) added cold start emissions during the on-road in-service conformity (ISC) evaluation and lowered the lower power threshold to 10% (from 20%). Furthermore, particulate emission measurements on the road were added. In Europe, a proposal for the next regulatory step is under discussion [23]. In addition to wider environmental conditions and lower emission limits, additional pollutants may be added. Some studies have presented demonstrator vehicles with extremely low emissions under a wide range of conditions [24,25,26]. However, the literature on the currently unregulated pollutants is limited [27].
The aim of this study was to measure the emissions of a Euro VI step E vehicle. The vehicle was equipped with, in this order, a Diesel oxidation catalyst (DOC), a catalyzed Diesel particulate filter (cDPF), a selective catalytic reduction unit (SCR) for NOx, and an ammonia slip catalyst (ASC). Measurements at engine out and downstream of the aftertreatment devices permitted us to assess the efficiency of the aftertreatment devices. In addition to the world harmonized vehicle cycle (WHVC) and real-world cycle (RWC), some challenging situations were examined (at 23 °C): long idling, driving at maximum load, urban driving with low payload, cold start, and low ambient temperature (5 °C). Details can be found in the Materials and Methods section.

2. Results

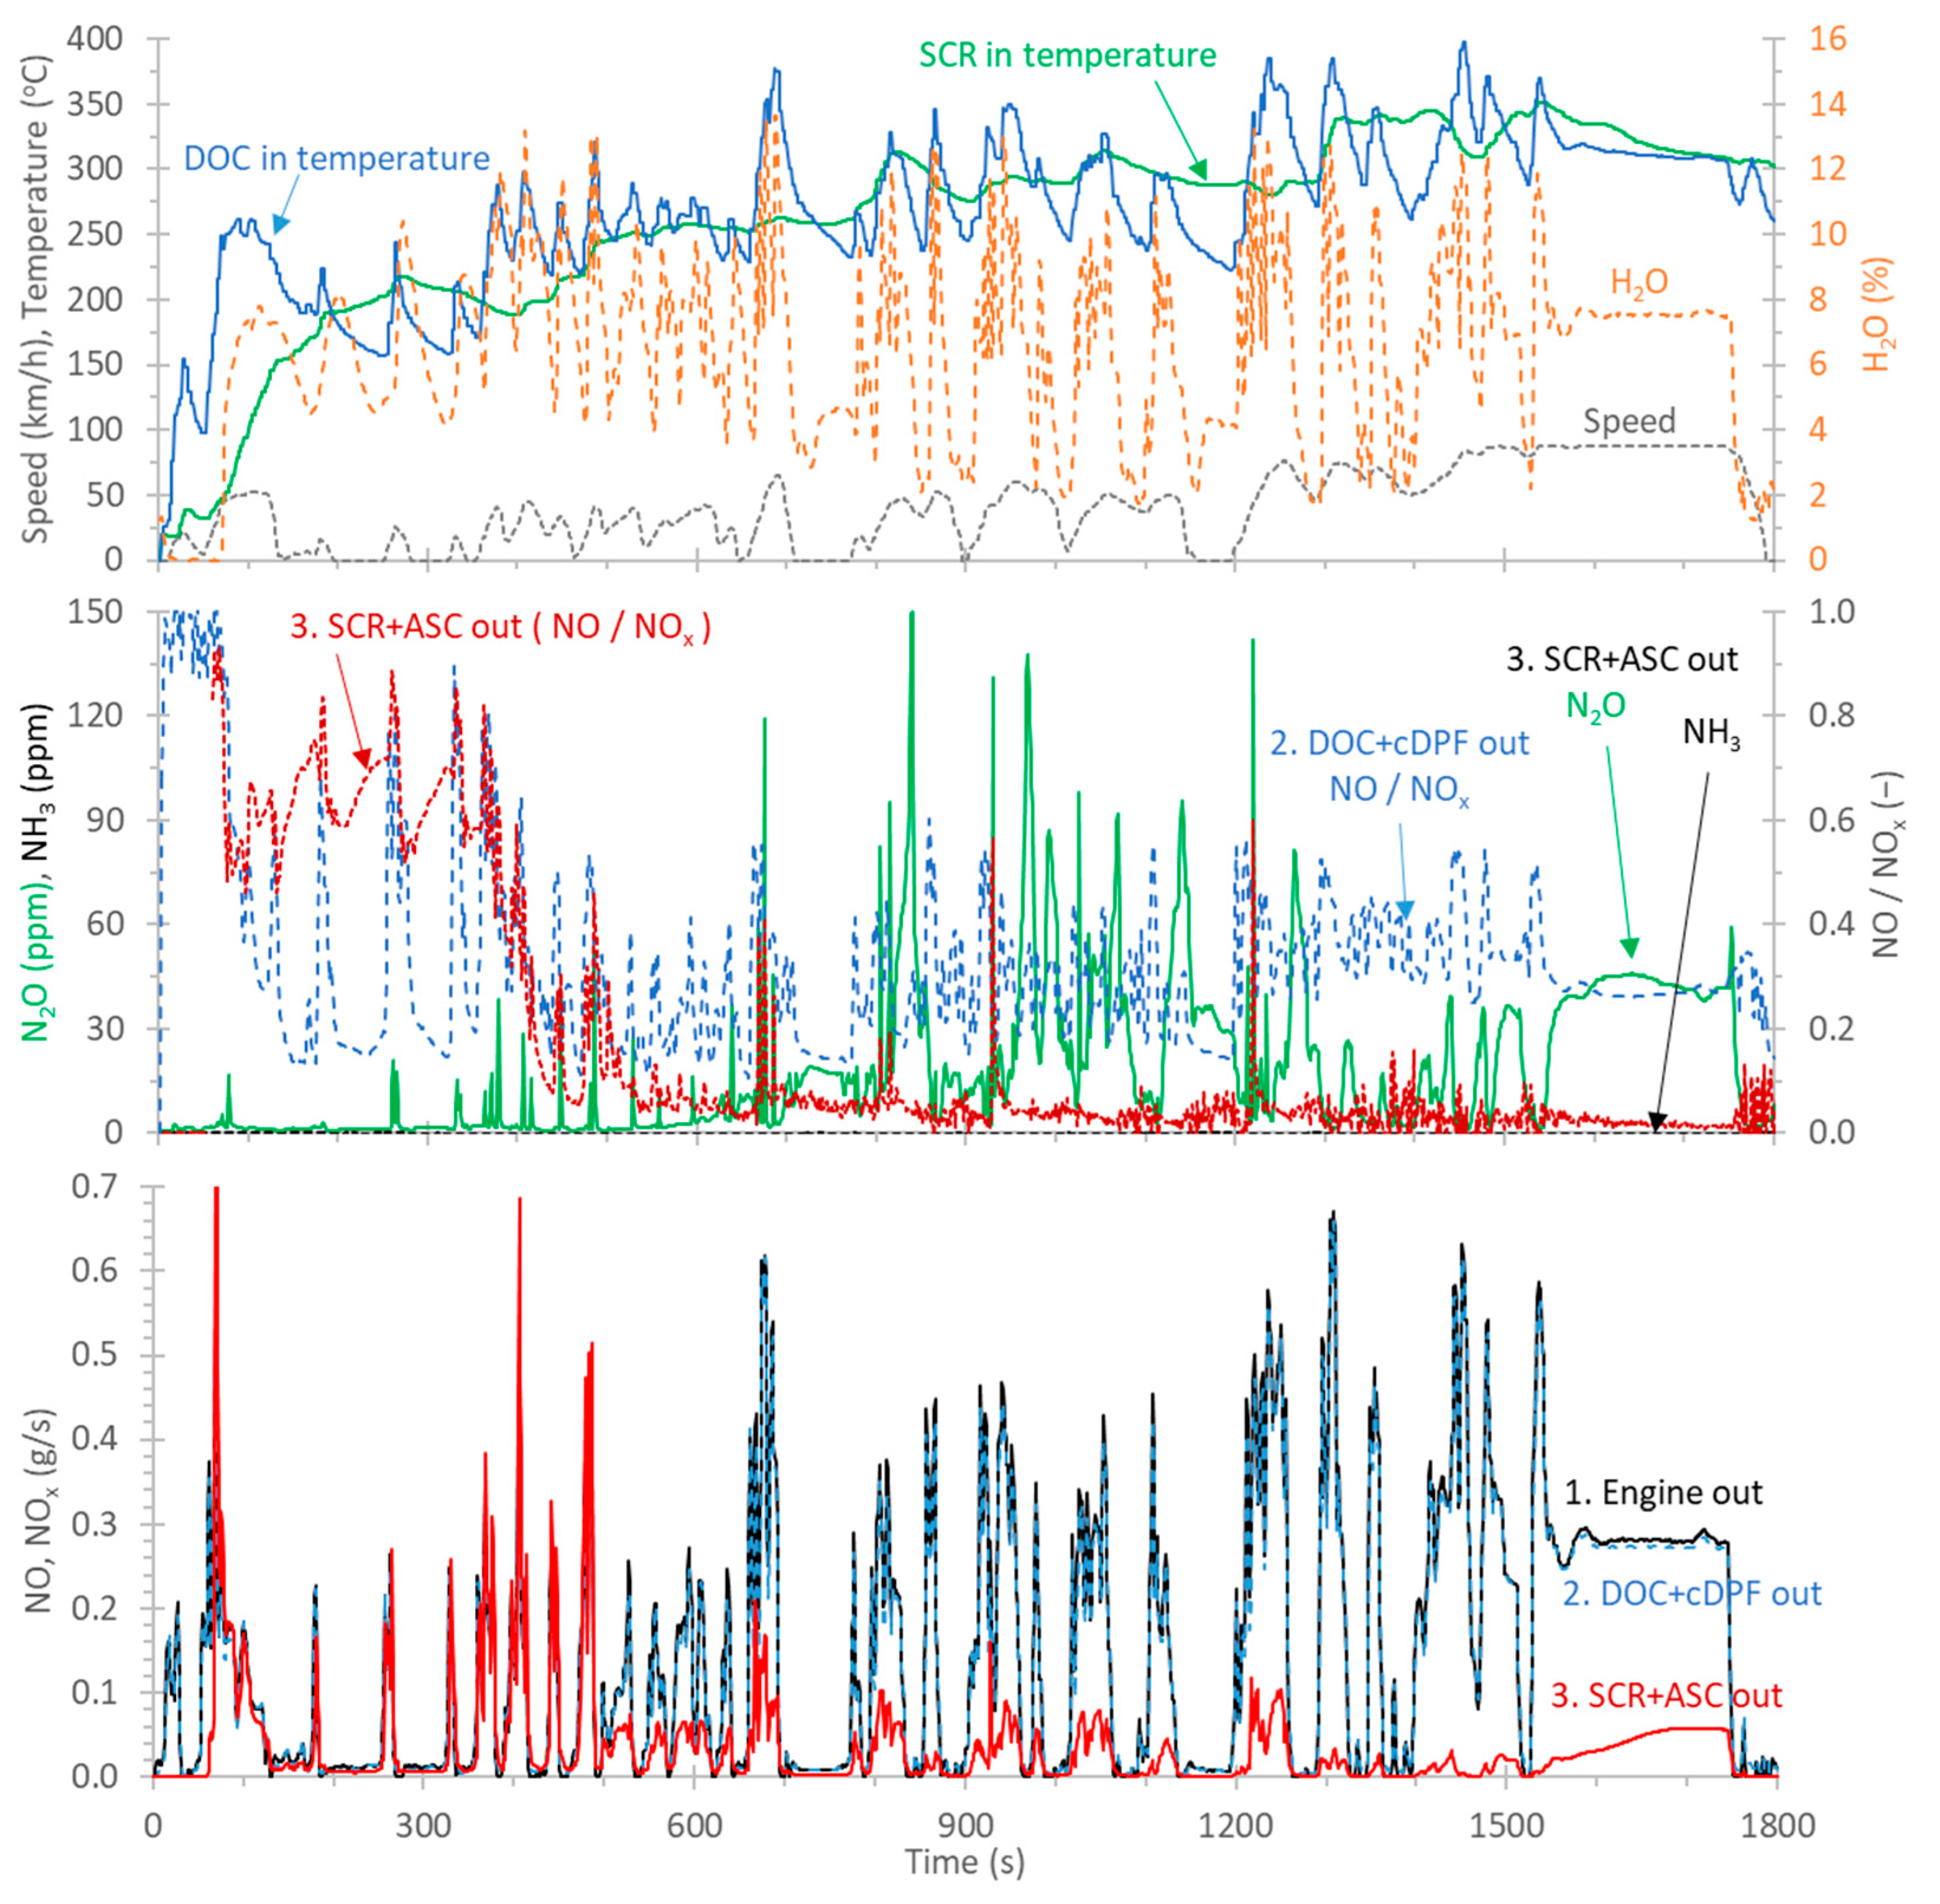
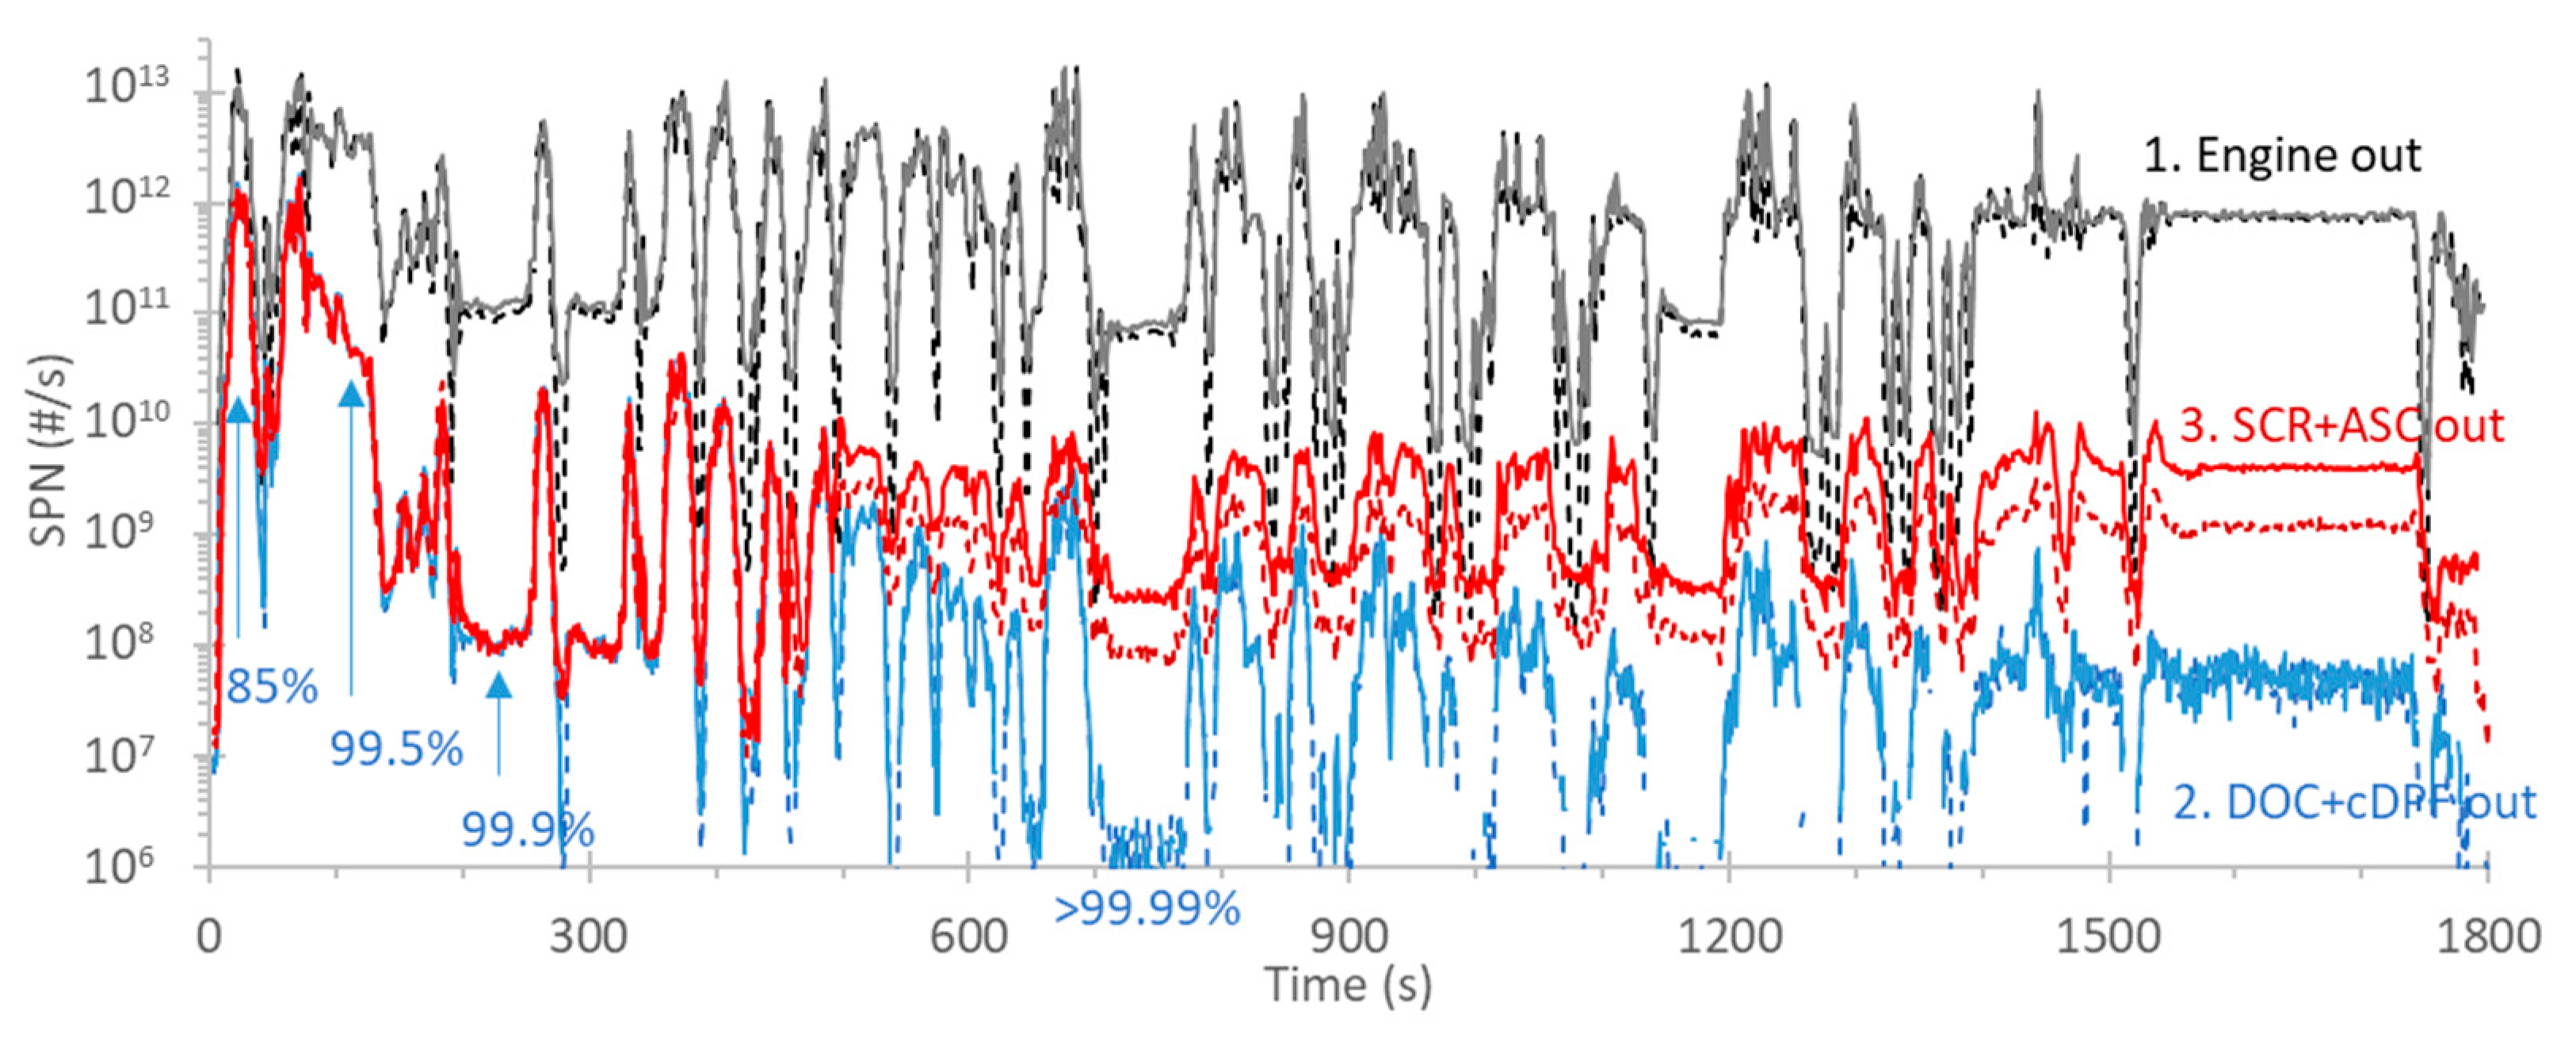
2.1. WHVC (World Harmonized Vehicle Cycle)
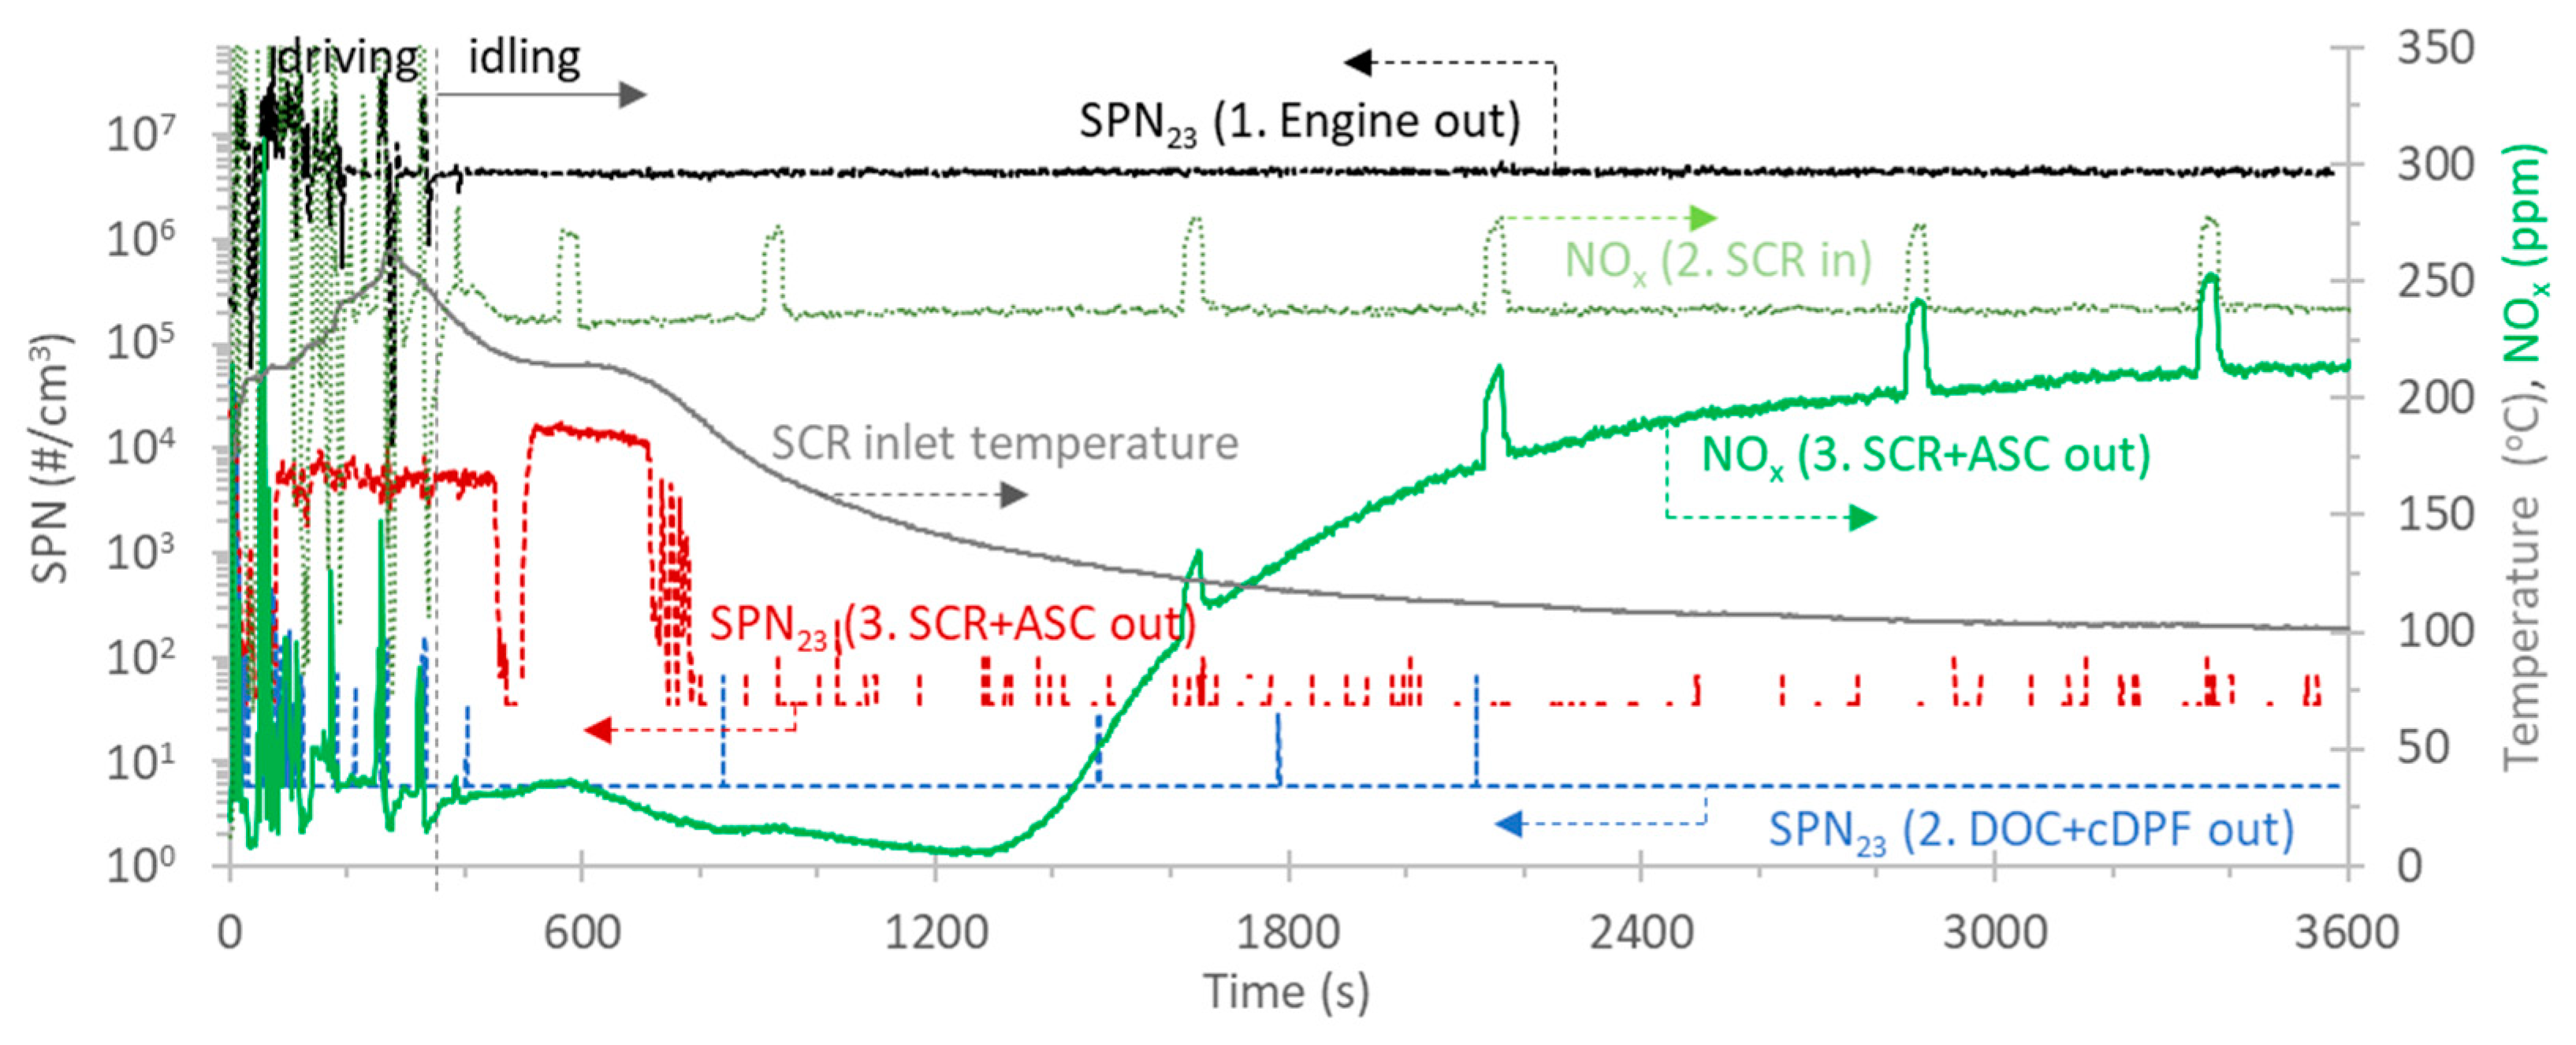
Figure 1 (lower panel) plots the NOx emissions over a cold start WHVC at 23 °C, separately for the three sampling positions: (1) engine out (black line), (2) DOC + cDPF out (blue lines), and (3) SCR + ASC out (tailpipe) (red lines). The middle panel gives the NH3 and N2O concentrations at the tailpipe (position 3) and the NO/NOx ratio for the two positions 2 and 3. The upper panel plots the speed profile, the exhaust gas temperatures at the DOC inlet and the SCR inlet, and the H2O concentration. Note that temperatures were measured at the three sampling positions stated above and we assumed that, given the closed-coupled configuration, differences between engine out and DOC in or DOC out and SCR in were minor. The pre-conditioning the day before was a high-load steady driving to passively regenerate the cDPF.
Comparing the engine out and DOC + cDPF out emissions, the total NOx were practically the same. Small differences can be attributed to limited NOx reduction in the DOC [28,29]. At the engine out position, there was no information regarding the NO and NO2 ratio, but typically, the majority is NO [28]. At the DPF outlet, the NO2 to NOx ratio was, on average, around 0.4 (middle panel), in agreement with other studies of similar vehicle technologies [30]. Such a high ratio is necessary for the passive regeneration of soot in the DPF at relatively low temperatures and later for higher NOx conversion efficiency through the Fast-SCR reaction on the SCR catalyst (Equation (1)) [28,31,32,33].
2 NH3 + NO + NO2 → 2 N2 + 3 H2O
Comparing the DOC + cDPF and SCR + ASC outlet emissions, a significant decrease in the NOx emissions started at approximately 500 s. The exhaust gas temperature at the SCR inlet was around 200 °C, a temperature considered safe for urea injection that can, on the one hand, promote a fast urea decomposition and, on the other, avoid unwanted deposition of ammonium nitrate (NH4NO3) [29,32,34].
It is worth mentioning that during the first 60 s, no NOx emissions were measured at the SCR + ASC outlet position. This has been mentioned in the literature under both laboratory [35,36] or vehicle conditions [25,26] and has been attributed to NOx adsorption at the SCR catalyst with dry exhaust [37,38], taking place due to condensation on the cold surfaces [39]. As soon as water reached the SCR catalyst, due to its exothermic condensation within zeolite pores, a significant spike of NOx associated with the thermal decomposition of adsorbed species, such as nitrates, previously stored on the catalyst was released. Interestingly, the peak was composed of both NO2 and NO at variance with what was expected from nitrates decomposition. This has been explained by the presence of CO and unburned hydrocarbons in the exhaust gas that can reduce NO2 to NO on the SCR catalyst in these conditions [38].
In the last part of the cycle, with almost constant-speed driving, SCR outlet NOx gradually increased. A few points are worth noting. First, in these conditions, the DOC was converting most of the NOx to NO2, with a NO2/NOx ratio exceeding 0.7 (see middle panel, NO/NOx is 0.3). Due to our pre-conditioning protocol (long high-load test the day before), there was not much soot in the DPF to consume NO2. In such a situation, all NO was effectively converted through the Fast SCR reaction (Equation (1)), which consumes equimolar amounts of NO and NO2. However, the remaining NO2 could be converted through two competing reactions, as long as NH3 was available:
8 NH3 + 6 NO2 → 7 N2 + 12 H2O
2 NH3 + 2 NO2 → N2 + 3 H2O + N2O
At these temperatures (approximately 300 °C, upper panel) in an environment with excess NO2, it is not uncommon to see significant production of N2O (Equation (3)), as we indeed also measured here (approximately 40 ppm, middle panel) [40,41]. NH3 was completely consumed, indicating that, probably in this situation, injection was not sufficient to completely convert the available NOx, even through the less efficient NO2 SCR pathway (Equation (2)).
Figure 2 plots the SPN emissions for the same cold start WHVC of Figure 1. The color code is the same: black lines for position 1 (engine out), blue lines for position 2 (DOC + cDPF out), and red lines for position 3 (SCR + ASC out). Dotted lines indicate the >23 nm (SPN23) emissions, while continuous lines indicate > 10 nm (SPN10).
The engine out emission levels were high (black lines), while the DPF out emissions (blue emissions) were practically zero, except during cold start. Nevertheless, even during cold start, the DPF filtration efficiency was 85% (first seconds) to 99.5% (first minutes). It reached >99.9% after four minutes, in agreement with other studies [20]. The SPN23 and SPN10 lines were on top of each other, meaning that there were no particles <23 nm and that they were mainly soot particles. The high cold start emissions were due to the “empty” DPF at the beginning of the test (it should be reminded that the preconditioning the day before consisted of a long high-load test in order to passively regenerate the filter).
The SCR + ASC out (and tailpipe) emissions followed the same trend as with the DPF out emissions during the first minutes, but then they remained at a higher level after approximately 500 s. Furthermore, the SPN23 and SPN10 lines had large differences after the first minutes, indicating the presence of sub-23 nm particles. The appearance of these particles coincided with the time that NOx were reduced (and the exhaust gas temperature at the inlet of the SCR was around 200 °C). NOx reduction occurred at the same time there was a sharp drop in the temperature close to the tip of the urea injector, supporting the idea that urea started to be injected (there were no other data from the electronic control unit (ECU) to confirm this). Thus, it can be assumed that the formed particles were urea-related. This finding is in agreement with the literature, which reports the formation of particles due to urea injection in the SCR [42].

2.2. Idling

Figure 3 summarizes the idling test results. The cycle preceding the “idling” test was the real-world cycle (RWC), which finished with 50 min of motorway driving. The “idling” test consisted of warmup driving at 50 km/h and 5 min of urban driving, and then the engine was left to idle for the rest of the test. The temperature at the inlet of the SCR was around 250 °C at the end of the driving and at the beginning of idling (grey line) and gradually decreased during the idling period. The tailpipe NOx (green line, position SCR + ASC out) were relatively low during the driving and very low when the idling started (<35 ppm). They remained low for 15 min (approximately until a time of 1300 s) and then they gradually started increasing, approaching the engine out levels at the end of the test. The NOx spikes coincided with the exhaust flow and CO2 variations, indicating that they originated from the engine, such as exhaust gas re-circulation, and not the aftertreatment systems.
Although there is no information regarding the urea injection, it can be assumed that urea was injected until a time of 700 s, because the particles downstream of the SCR were elevated compared to the upstream position (compare red and blue lines). As with the test in the previous section, this time also coincided with a temperature at the inlet of the SCR of at least 200 °C. The NOx emissions without urea injection from a time of 800 s remained low because the NOx reduction continued with the stored NH3 in the SCR. This has been shown and discussed in the literature [25]. The amount of stored NH3 available depends, among other things, on SCR volume and the previous operation. Another idling test (not shown) that followed a WHVC, instead of motorway driving as in Figure 3, maintained low NOx emissions for 20 min.
This test, in combination with previous work [25], shows a simple test that can be used to search for vehicles with malfunctioning SCR during the periodic technical inspection (PTI). For some period of time, the NOx emissions remained at low levels, in the presence of stored NH3, which is an indication that urea was injected before the test and consequently indicates a working SCR.
The same test can be used to assess the DPF status of the vehicle during PTI. Figure 3 plots the SPN23 emissions at engine out, DOC + cDPF out, and SCR + ASC out positions. Although the DOC + cDPF out concentrations were practically zero, the tailpipe concentrations (SCR + ASC out) were zero (background of the instrument) only when no urea was injected (time after 700 s). When urea was injected, the concentration was 0.5 × 10⁴ to 1.4 × 10⁴ #/cm3 (for SPN10: 1.2 × 10⁴ to 2.5 × 10⁴ #/cm3). The concentrations were well below solid particle number (SPN) PTI limits that will be employed for light-duty vehicles in different European countries; 2.5 × 10⁵ #/cm3 in Germany and 1 × 10⁶ #/cm3 in Netherlands and Belgium [43]. The engine out emissions were 4.5 × 10⁶ #/cm3.

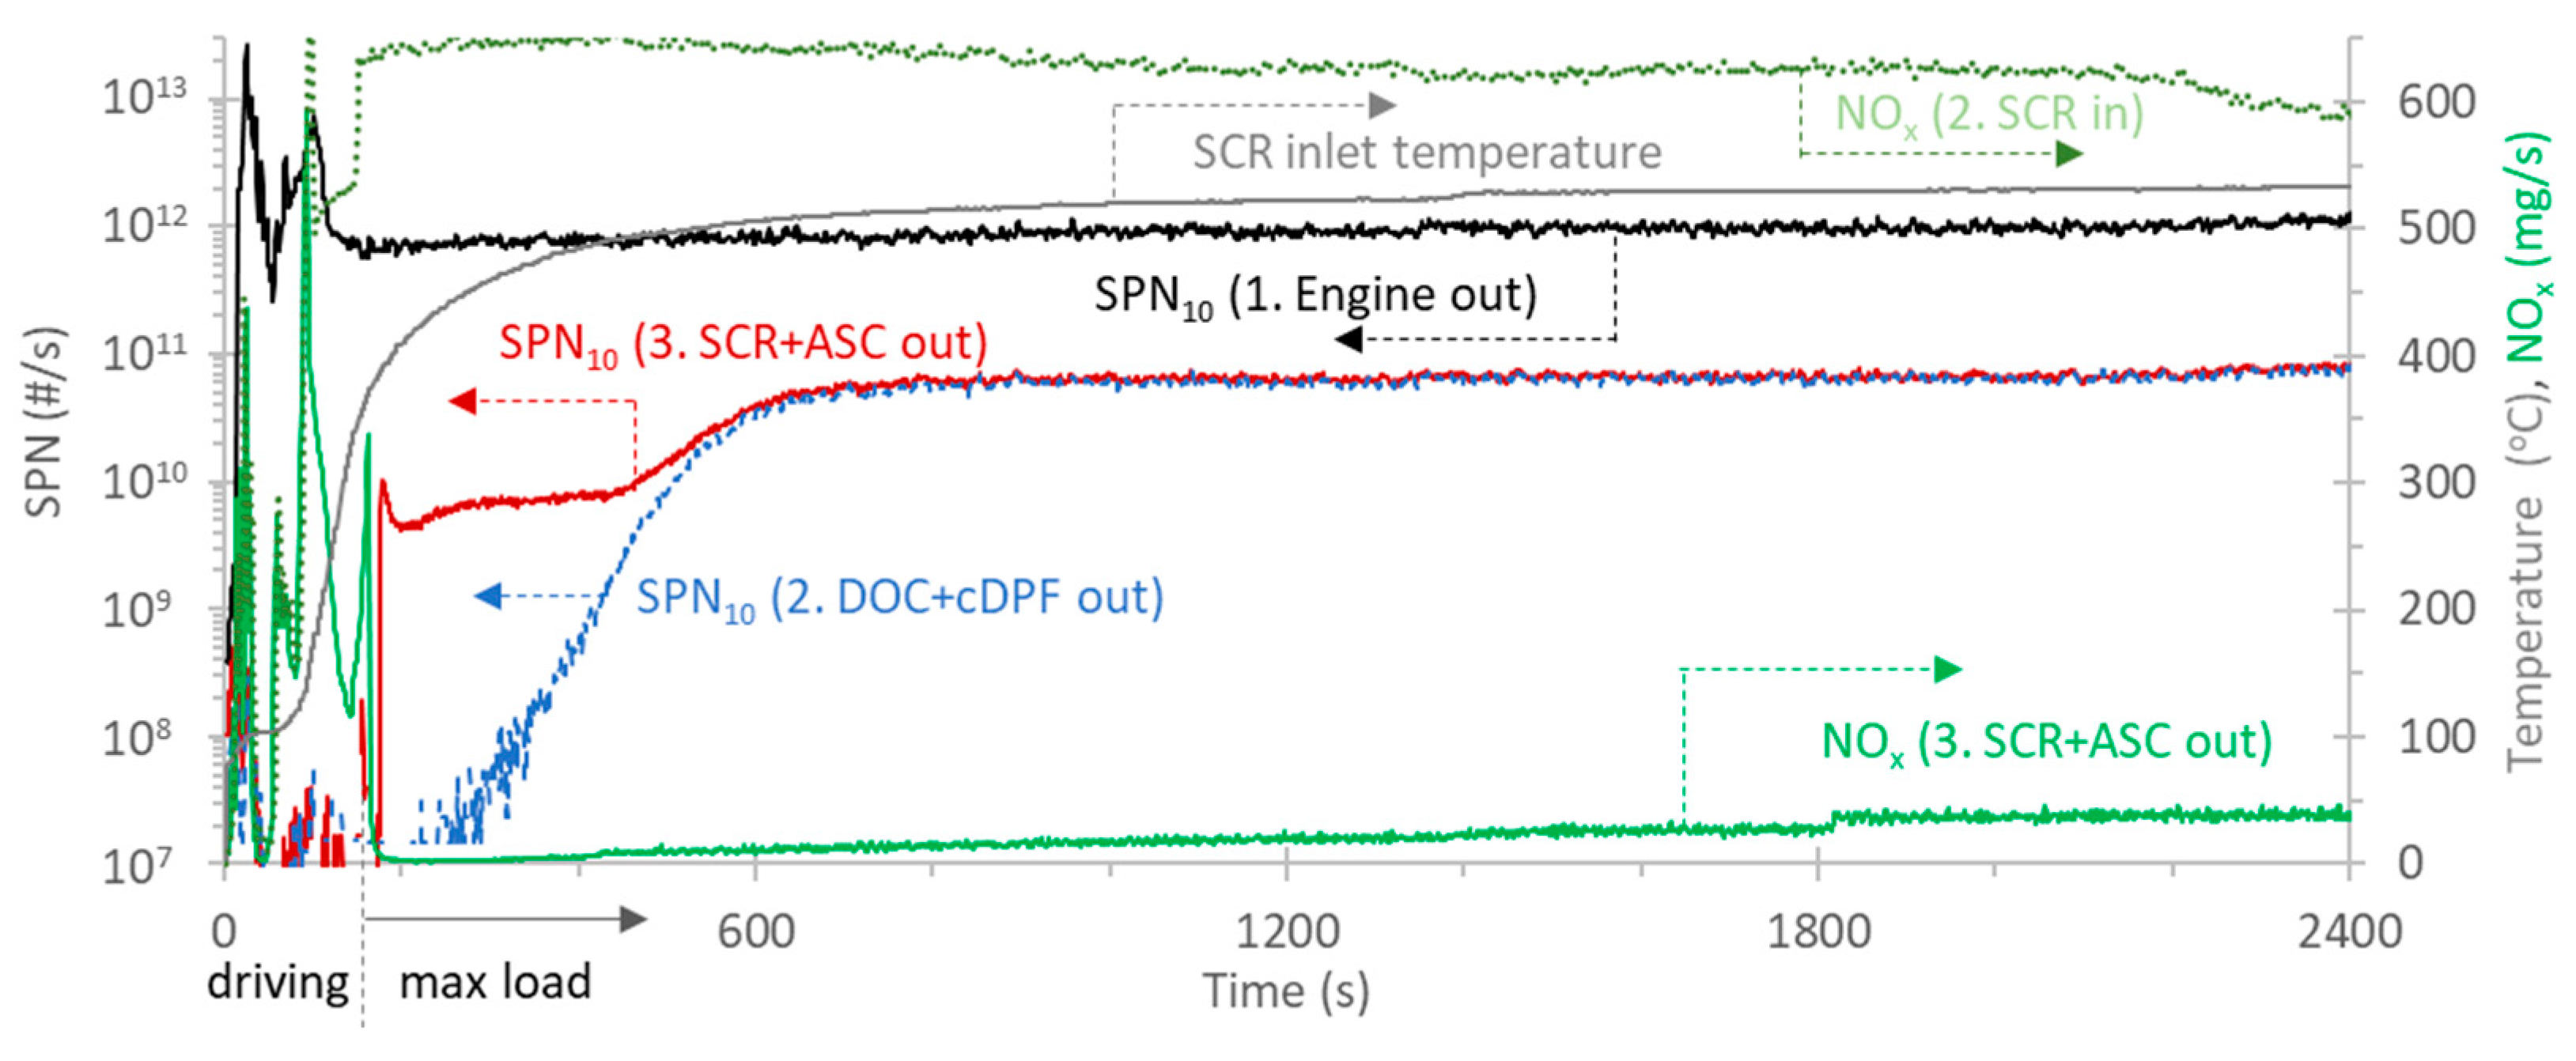
2.3. Maximum Load (Passive Regeneration)

Figure 4 plots a maximum load test, typically performed at the end of the day to precondition the aftertreatment devices for the next day’s cold start test. This test was selected in order to passively regenerate the cDPF and reach the same cDPF soot load (around 10%, as indicated by the vehicle) at the end of every day.
The driver accelerated the vehicle at 80 km/h, then the dynamometer was set to an 80 km/h constant-speed mode, and the driver was fully pressing the accelerator pedal (starting at approximately 150 s). The vehicle speed remained at 80 km/h, but the load was the maximum available (indicated as “max load” in the figure).
The NOx emissions at the inlet and outlet of the SCR were at the same levels for the first minutes of driving (green lines). When the exhaust gas temperature at the SCR exceeded 200 °C, the NOx emissions at the outlet of the SCR dropped to very low levels. After 400 s, the NOx emissions started to gradually increase (but remained at low levels). The increase was mainly due to NO (from 15 ppm to 72 ppm). NO2 remained practically at the same levels (from 6 ppm to 11 ppm). At this high exhaust gas temperature (500 °C), the NO to NO2 conversion was low due to the thermodynamic equilibrium. It is interesting to notice that these conditions of high flowrate and high temperature are compatible with the onset of mass transfer limitations [44]. Nevertheless, the NOx reduction remained at high levels (94.3% from 97.8%).
The engine out SPN10 emissions were around 1012 #/s (black line). They were at very low levels at the outlet of the DOC + cDPF (blue line) and the SCR + ASC outlet (tailpipe) (red line) during the first minutes. When the vehicle started to inject urea, particles were formed (time 200–400 s). Due to the high exhaust gas temperature, the filter started regenerating passively. As the soot was being oxidized, the filtration efficiency was dropping and more particles started appearing downstream of the cDPF. At a time around 650 s, an equilibrium was reached. The filtration efficiency from that point of time was around 93%.

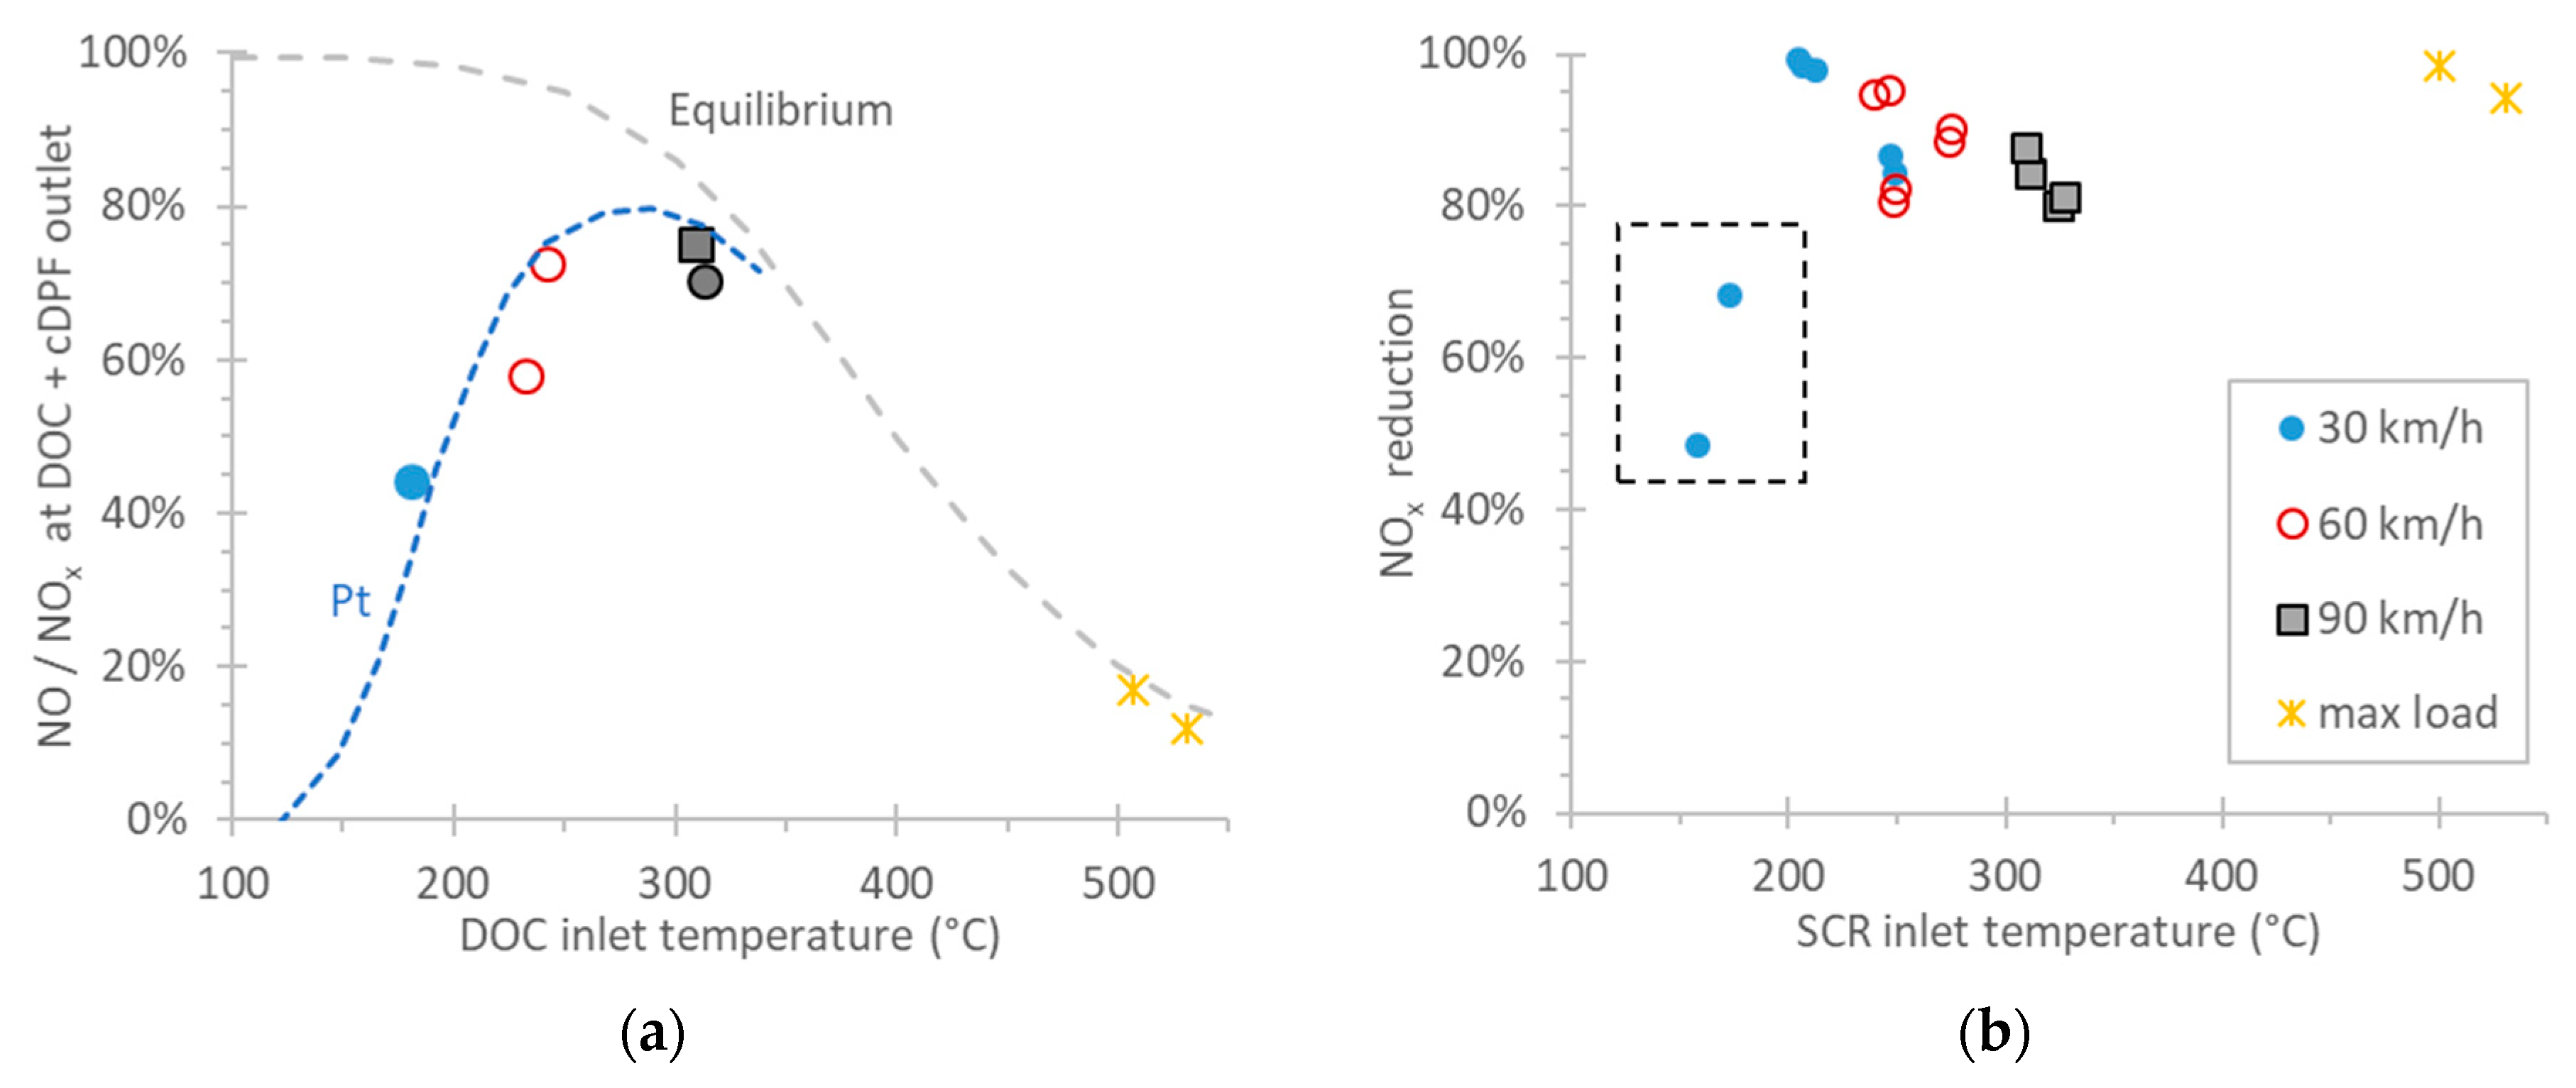
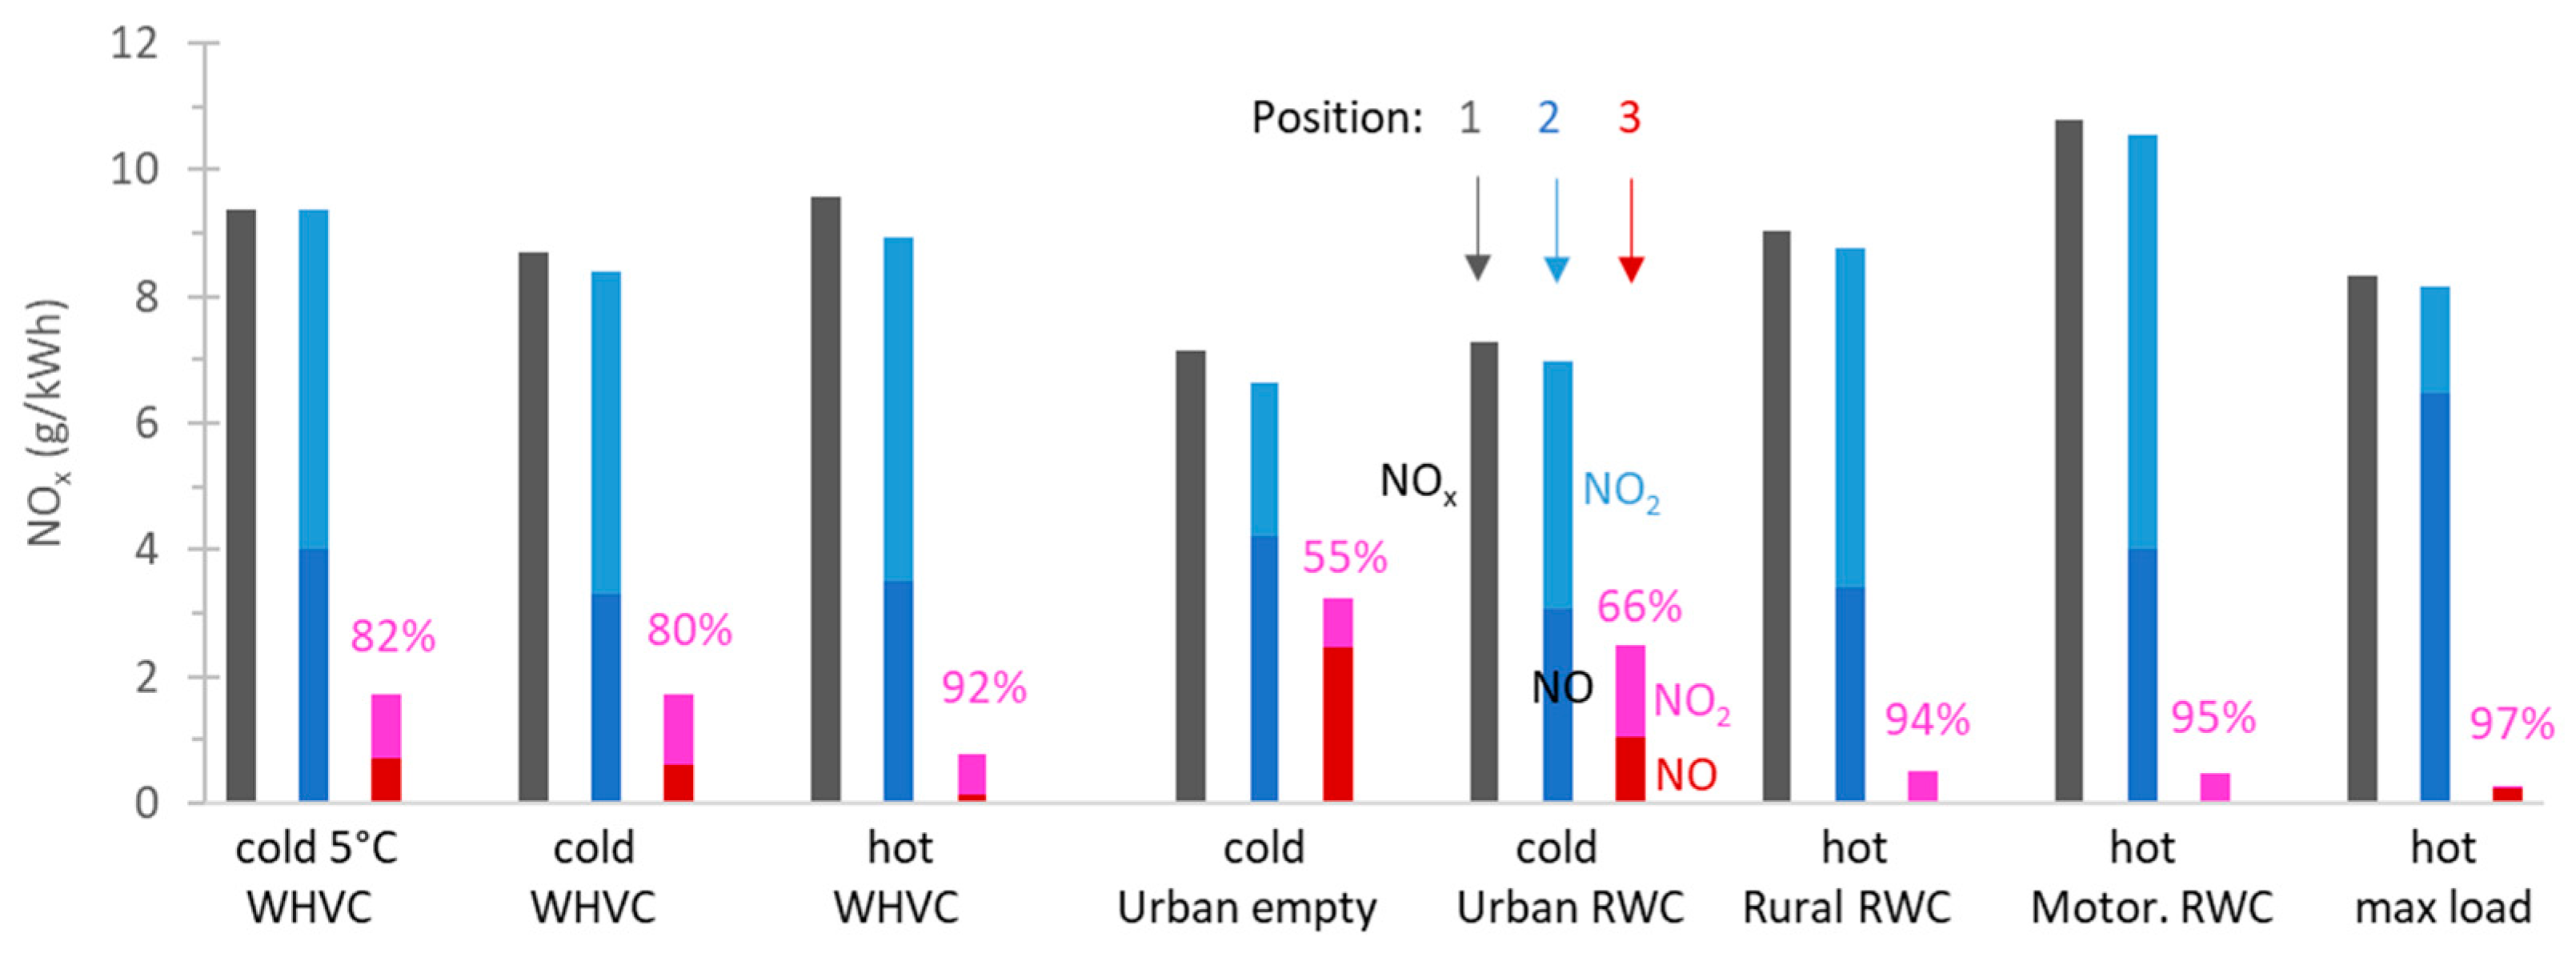
2.4. NOx Conversions

Figure 5a presents the NO to NOx ratios measured downstream of the DOC + cDPF (position 2) for a few constant speeds and the max load test (at 80 km/h) as a function of the exhaust gas temperature at the inlet of the DOC. The max load and high speed points lay on the equilibrium curve, which indicate the thermodynamic limitation for higher conversions. The other points lay on a typical NO to NO2 conversion curve for the Pt catalyst [31,45]. However, as the DOC formulation was unknown, the Pt curve is mainly an aid to the eye, rather than the expected performance of the catalyst.
Figure 5b presents the NOx conversion (i.e., reduction to N2) in the SCR + ASC (position 3) as a function of the SCR inlet temperature. The conversions were >80%, with the exception of a few points that, instead of hot (coolant temperature > 70 °C), were performed with a warm engine (coolant temperature around 55 °C), and the exhaust gas temperature at the inlet of the SCR was <200 °C. The stored NH3 also played a very important role contributing to the final NOx reduction, particularly for the points where no urea was injected, due to low exhaust gas temperature. Similar efficiencies have been reported in the literature [46].

2.5. Emission Factors

The following figures present the emission factors of various cycles at different locations: position 1 (engine out, grey bars), position 2 (DOC + cDPF out, blue bars), and position 3 (SCR + ASC out, tailpipe, red bars). The cycles were the WHVC, the urban, the rural, and the motorway parts of a real-world cycle (RWC), an urban cycle with a low payload, and the max load test. All tests were conducted at around 23 °C, except a cold start WHVC at 5 °C. Cold start means that the coolant (and oil) temperature was the same as the ambient temperature (5 °C or 23 °C). Hot start means the coolant (and oil) temperature was >70 °C.
Figure 6 plots the NOx emissions and, when the information was available, the NO and NO2 splitting. The engine out and DOC + cDPF out emissions were almost the same, ranging from 7 to 11 g/kWh. The SCR + ASC out (tailpipe) emissions were 55–97% lower. The lower percentages and higher absolute levels were noted for the cold start tests, where no urea injection could take place until the exhaust gas temperature had reached approximately 200 °C. For the cold start tests, the NOx emissions were 1.7–3.2 g/kWh. The results are higher than other Euro VI or China VI vehicles, having NOx emissions <1 g/kWh [6,8,10,13,14,18], highlighting the challenges of cold start, urban cycles, and lower ambient temperatures of our tests.
Figure 7 plots the CO emissions. The highest engine out emissions were during cold start cycles. The DOC and the catalyzed DPF oxidized most of the CO: from 2.5 to 5.0 g/kWh (position 1) to <1 g/kWh (position 2), with the exception of the cold start urban cycle (around 2.5 g/kWh). The efficiency for CO ranged from 46 to 100% The SCR reduced CO by 14–38% relative to the DOC + cDPF position (position 3). This reduction is likely due to the conversion of an equimolar amount of NO2 to NO, as also suggested by previous results discussed in Figure 1. The results are in agreement with other studies with Euro VI or China VI vehicles (around 1 g/kWh) [10,13] or lower [6,8].
Figure 8 plots the SPN emissions. Both SPN23 and SPN10 are given for all three positions, but the difference is very small for the engine out (position 1) and DOC + cDPF out (position 2) and is, thus, indistinguishable in the plot. The cDPF efficiency was >98% (for cold start cycles), reaching almost 100% for hot start cycles. The reason for the relatively lower filtration efficiency of the cold start cycles is that the tests started with an “empty” cDPF and some time was necessary to fill the cDPF with some soot. The SCR operation resulted in an increase in the emissions of approximately 1 × 10¹¹ #/kWh (position 3), as determined by the hot cycles where the DPF out emissions were very low. These results are in agreement with other studies [10,20,47,48].
Table 1 presents the tailpipe greenhouse gases emissions of the vehicle for various test cycles. It should be noted that in addition to promoting global warming, N2O is a pollutant currently considered as the most important Ozone-Depleting Substance [49]. In general, N2O was elevated (50–200 mg/kWh). The emissions of cold start and hot start WHVC were similar. N2O is formed as a by-product of (i) the DOC, aiming to increase the NO2 to NOx fraction; (ii) the SCR via formation of ammonium-nitrate-like surface species and their subsequent decomposition (lower temperatures) or via ammonia oxidation (higher temperatures); (iii) the ASC, via unselective oxidation of unreacted NH3 [29]. The tailpipe NH3 was practically close to zero for all conditions and, thus, no emissions were reported.

2.6. Euro VI and Future

In order to put the results into perspective, the emissions were compared with the Euro VI emission limits. The type-approval of an engine was performed in the engine dynamometer with the world harmonized transient cycle (WHTC). The cycle was conducted twice, first with a cold engine (i.e., at ambient temperature) and after 10 min of soaking with a hot engine. The results were weighted 14% and 86%, respectively. Even though not according to the regulation, we used the cold and hot WHVCs on the chassis dynamometer to calculate the emissions (Table 2). The emissions were well below the limits for CO and SPN23, but not for NOx, which were double.
Euro VI regulation includes an in-service conformity (ISC) test on the road with a portable emissions measurement system (PEMS). The evaluation was performed with the moving window methodology. The cold part is considered the maximum window from the windows after the coolant has exceeded 30 °C and has reached 70 °C (but no later than 10 min). The hot part is the 90th percentile of the windows after the coolant has reached 70 °C. The results of this methodology are summarized in Table 3 for the real-world cycle (RWC), which had similarities with the in-service conformity (ISC) requirements. The results were similar to the WHVC results: they were below the limits for CO and SPN23, but above for NOx.
The methodology that has been suggested for the post-Euro VI regulation is slightly different [50]: there are two limits, one for the 100th percentile and one for the 90th percentile and all the windows are included in one single analysis. The results are presented in Table 4, along with ranges of possible limits that could be achieved by future diesel-fueled technologies (with or without pre-heating).
The results of the present study clearly demonstrated the need for further improvements of the aftertreatment devices for upcoming regulations with lower emission limits. For NOx, various solutions have been presented, requiring a closed coupled SCR in order to address the cold start NOx emissions [25,26]. Increased urea dosing might also be required, which will also lead to high particle number emissions. A second DPF at the end of the tailpipe seems a viable solution, as it was recently demonstrated [51,52]. The increased N2O emissions from the DOC, SCR, and ASC need optimization of the catalyst materials and formulations, system architecture, and the operating strategies, as its subsequent removal is challenging [53,54].

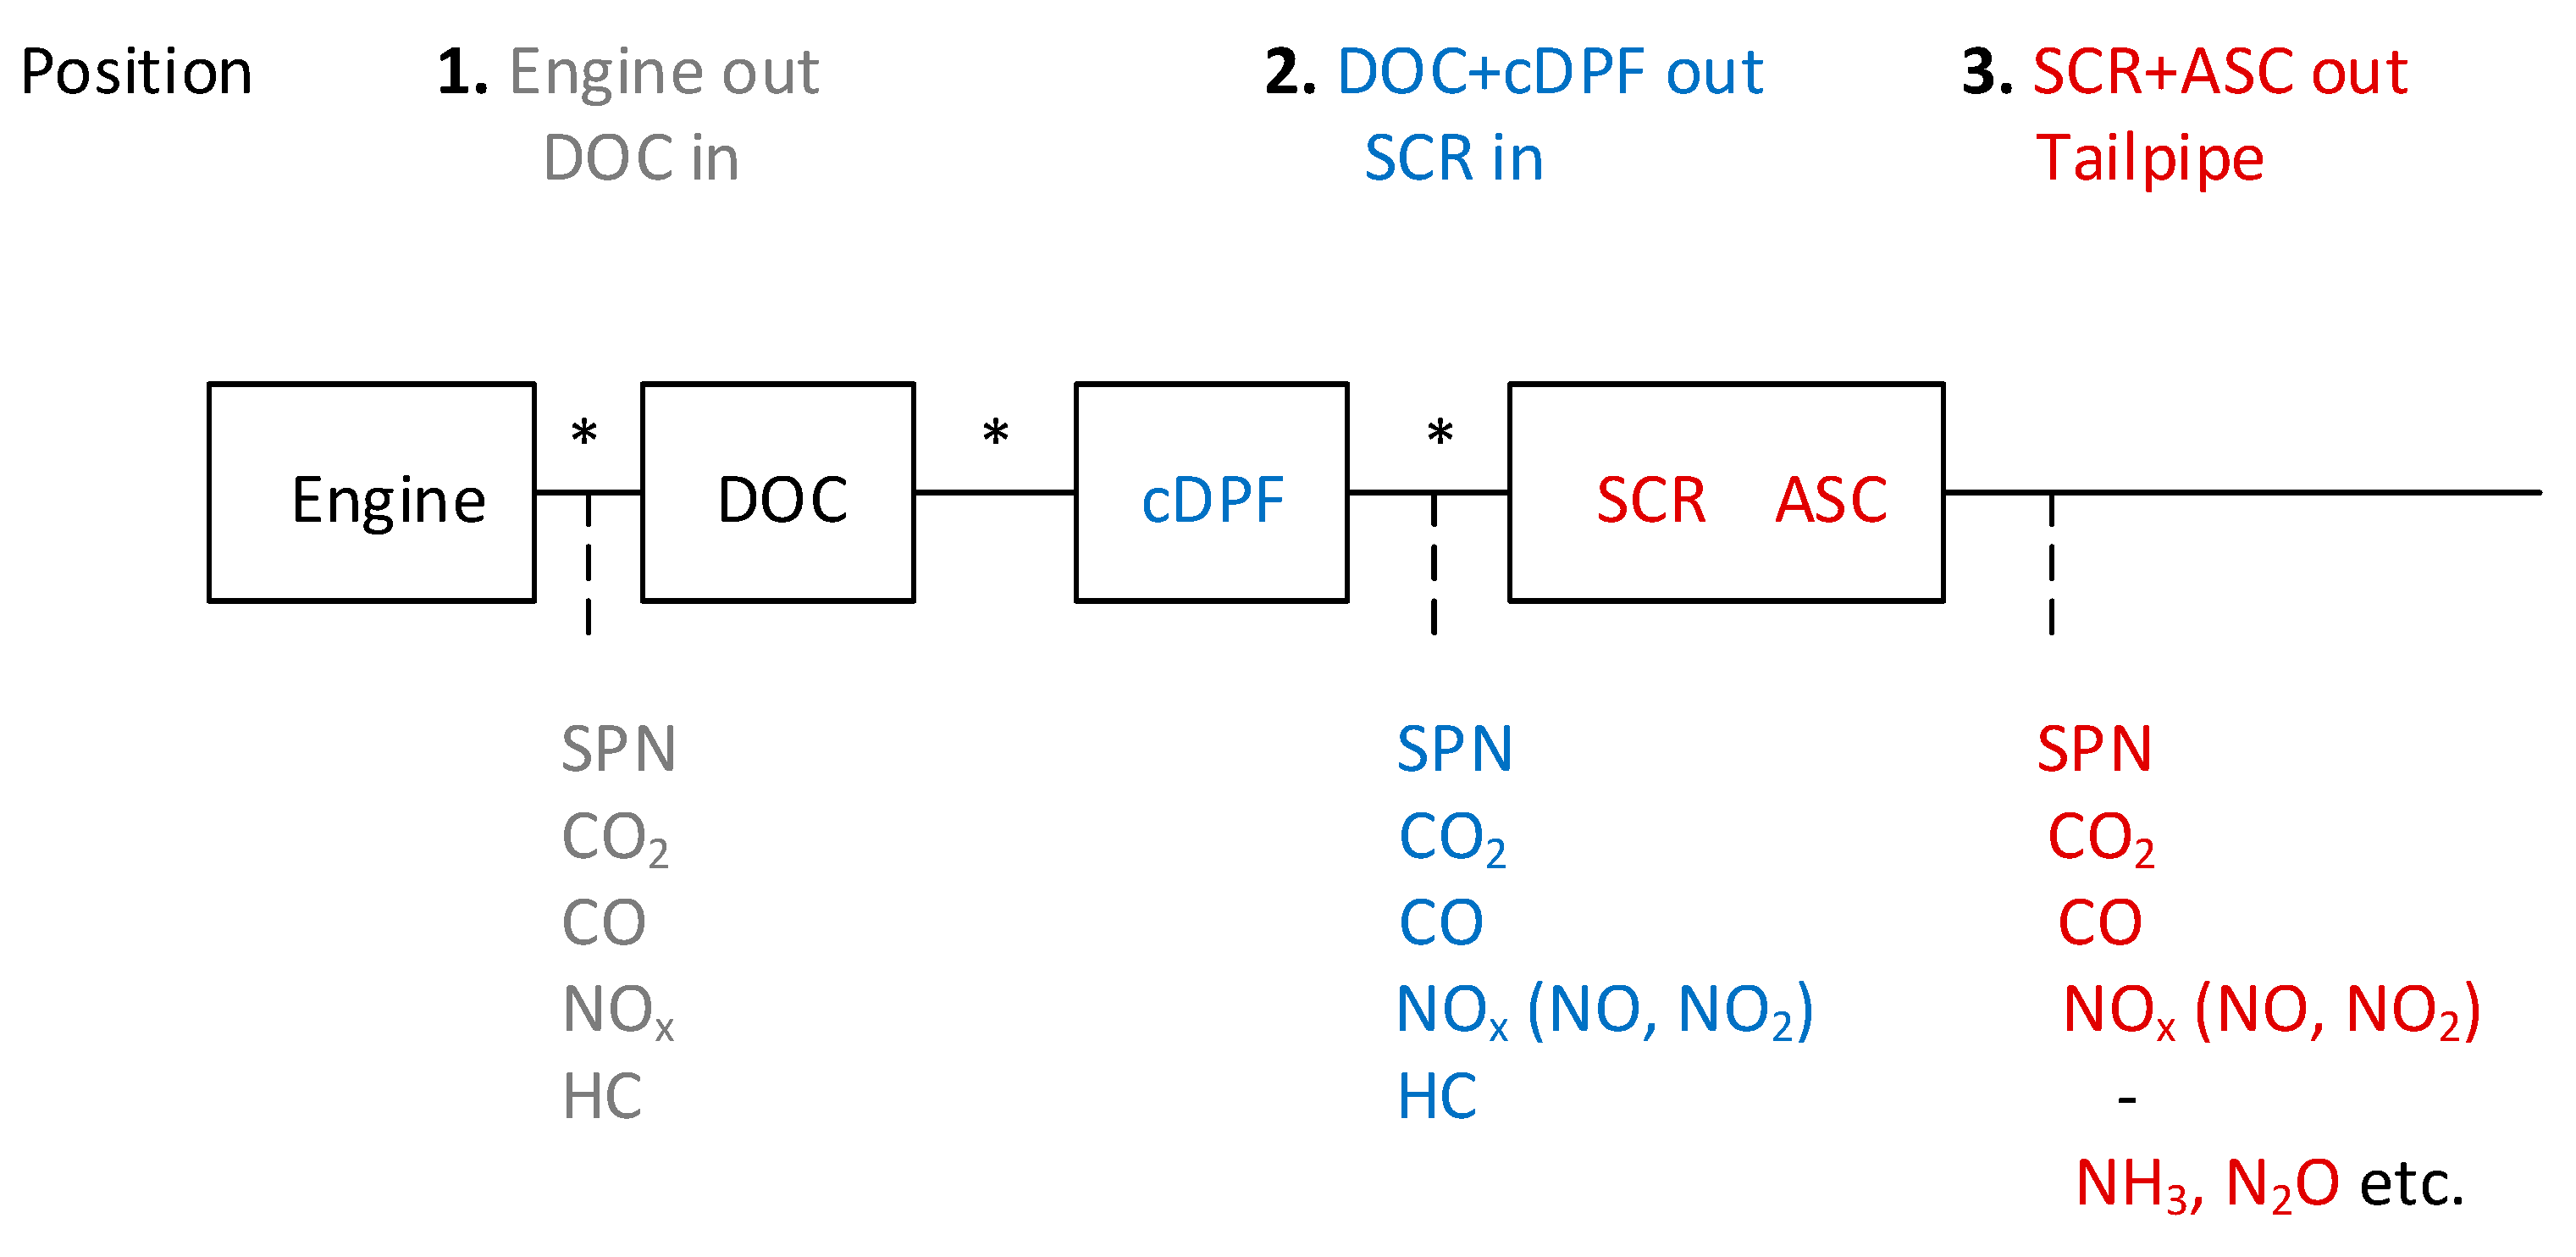
3. Materials and Methods

The test vehicle was a N3 category truck, compliant with the Euro VI step E regulation (registration December 2021). The diesel engine was 12.8 L with 375 kW power. The aftertreatment configuration (Figure 9) consisted of a Diesel oxidation catalyst (DOC), a 12″ ×12″ catalyzed Diesel particulate filter (cDPF), and a double selective catalytic reduction (SCR) for NOx with an ammonia slip catalyst (ASC). All systems were packed together in a box.
The tests were conducted at the vehicle emissions laboratory (VELA 7) of the Joint Research Centre (JRC) of the European Commission, in Italy. The vehicle was fixed on the 4-wheel drive roller dynamometer. The road load coefficients were estimated to be F0 = 1460 N and F2 = 0.247 N/(km/h)2 for an inertia of 29,000 kg, corresponding to 66% of maximum payload. One test (Urban empty) was conducted with 9% of the maximum payload to challenge the SCR system due to the lower exhaust gas temperatures. The dynamometer coefficients for this test were: F0 = 510 N, F2 = 0.191 N/(km/h)2, and 10,000 kg.
The instruments were sampling from three positions simultaneously (Figure 9):
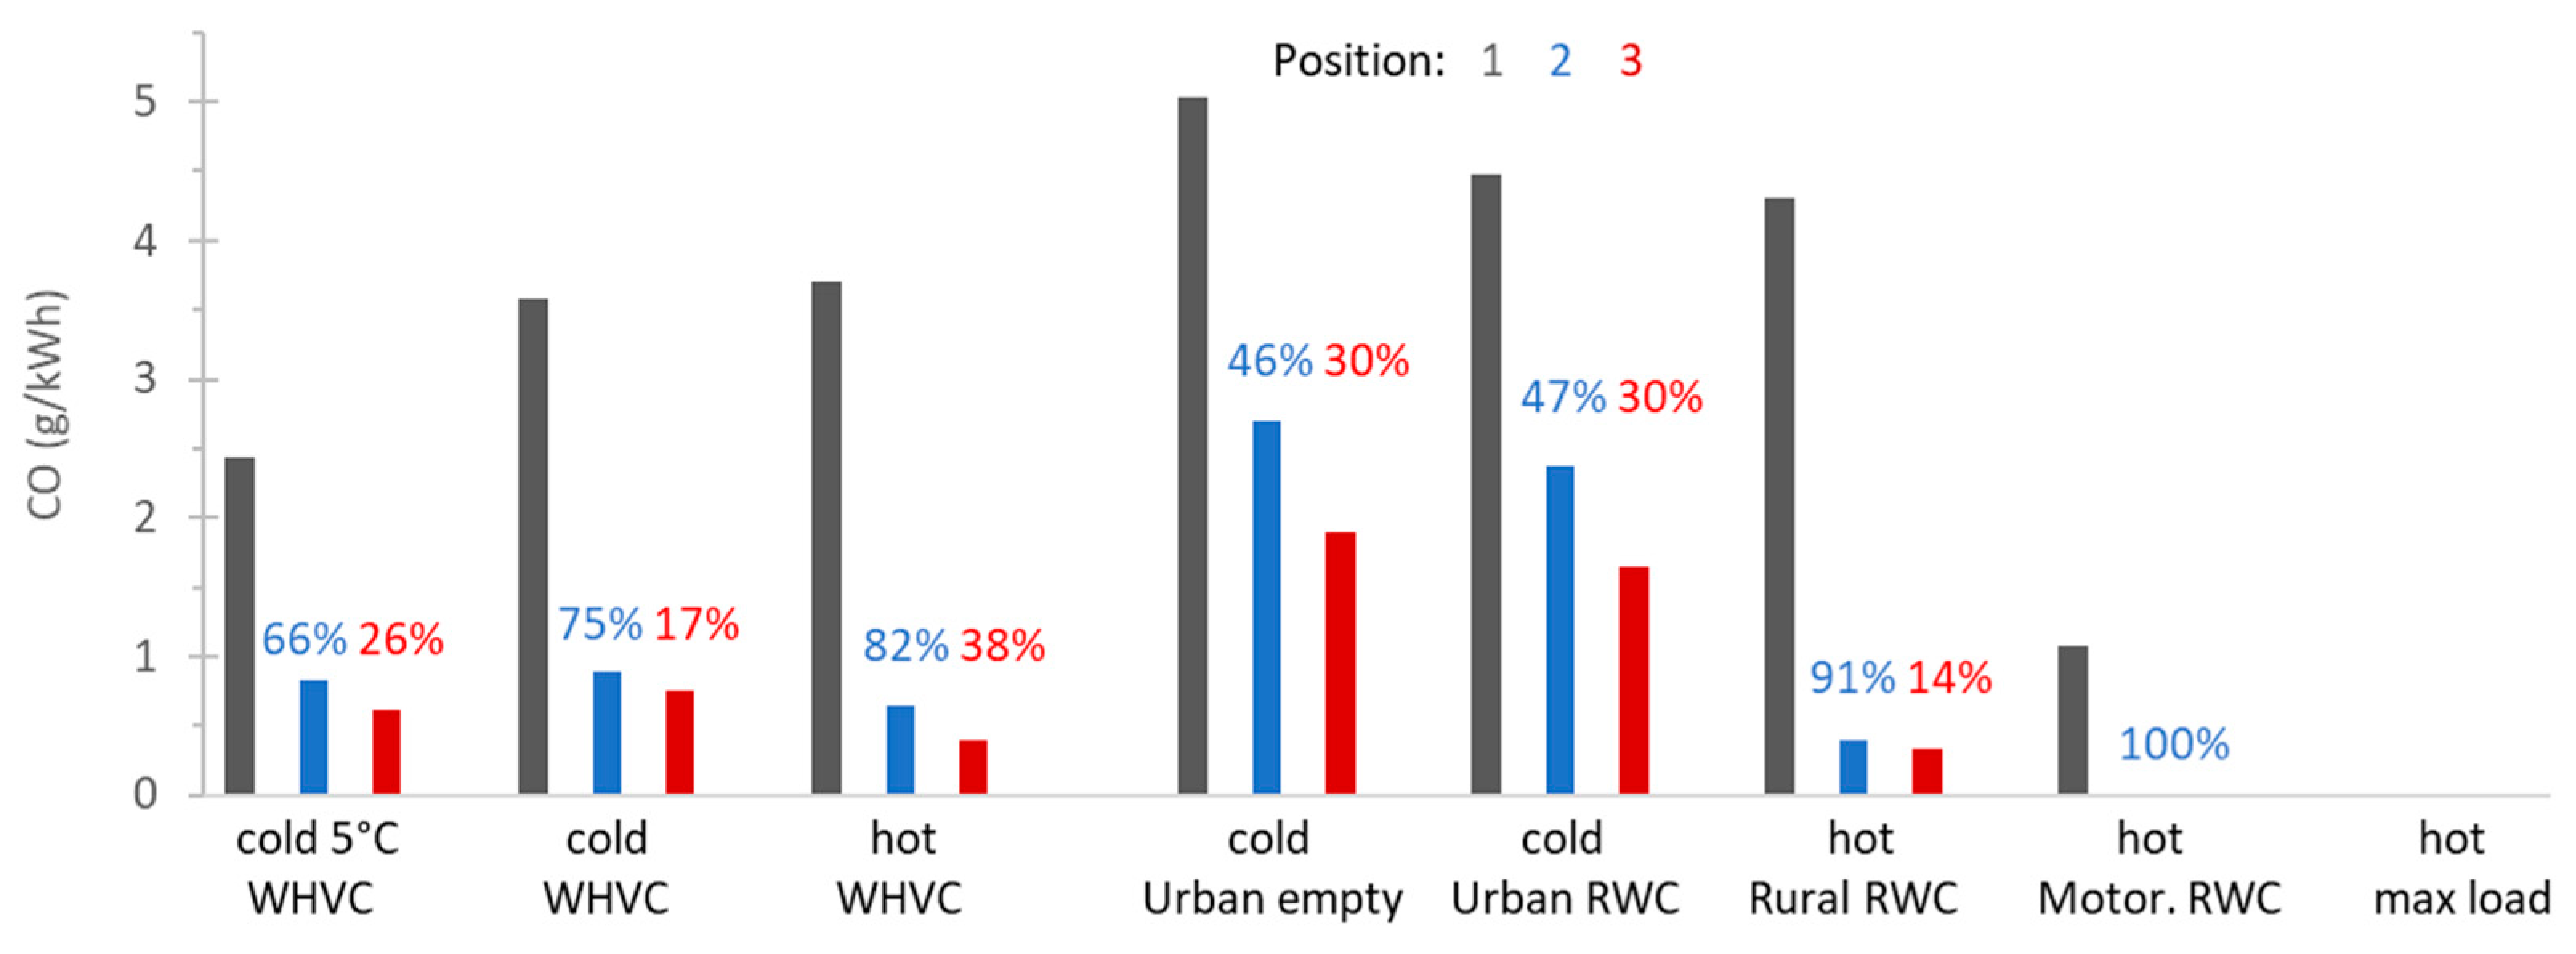
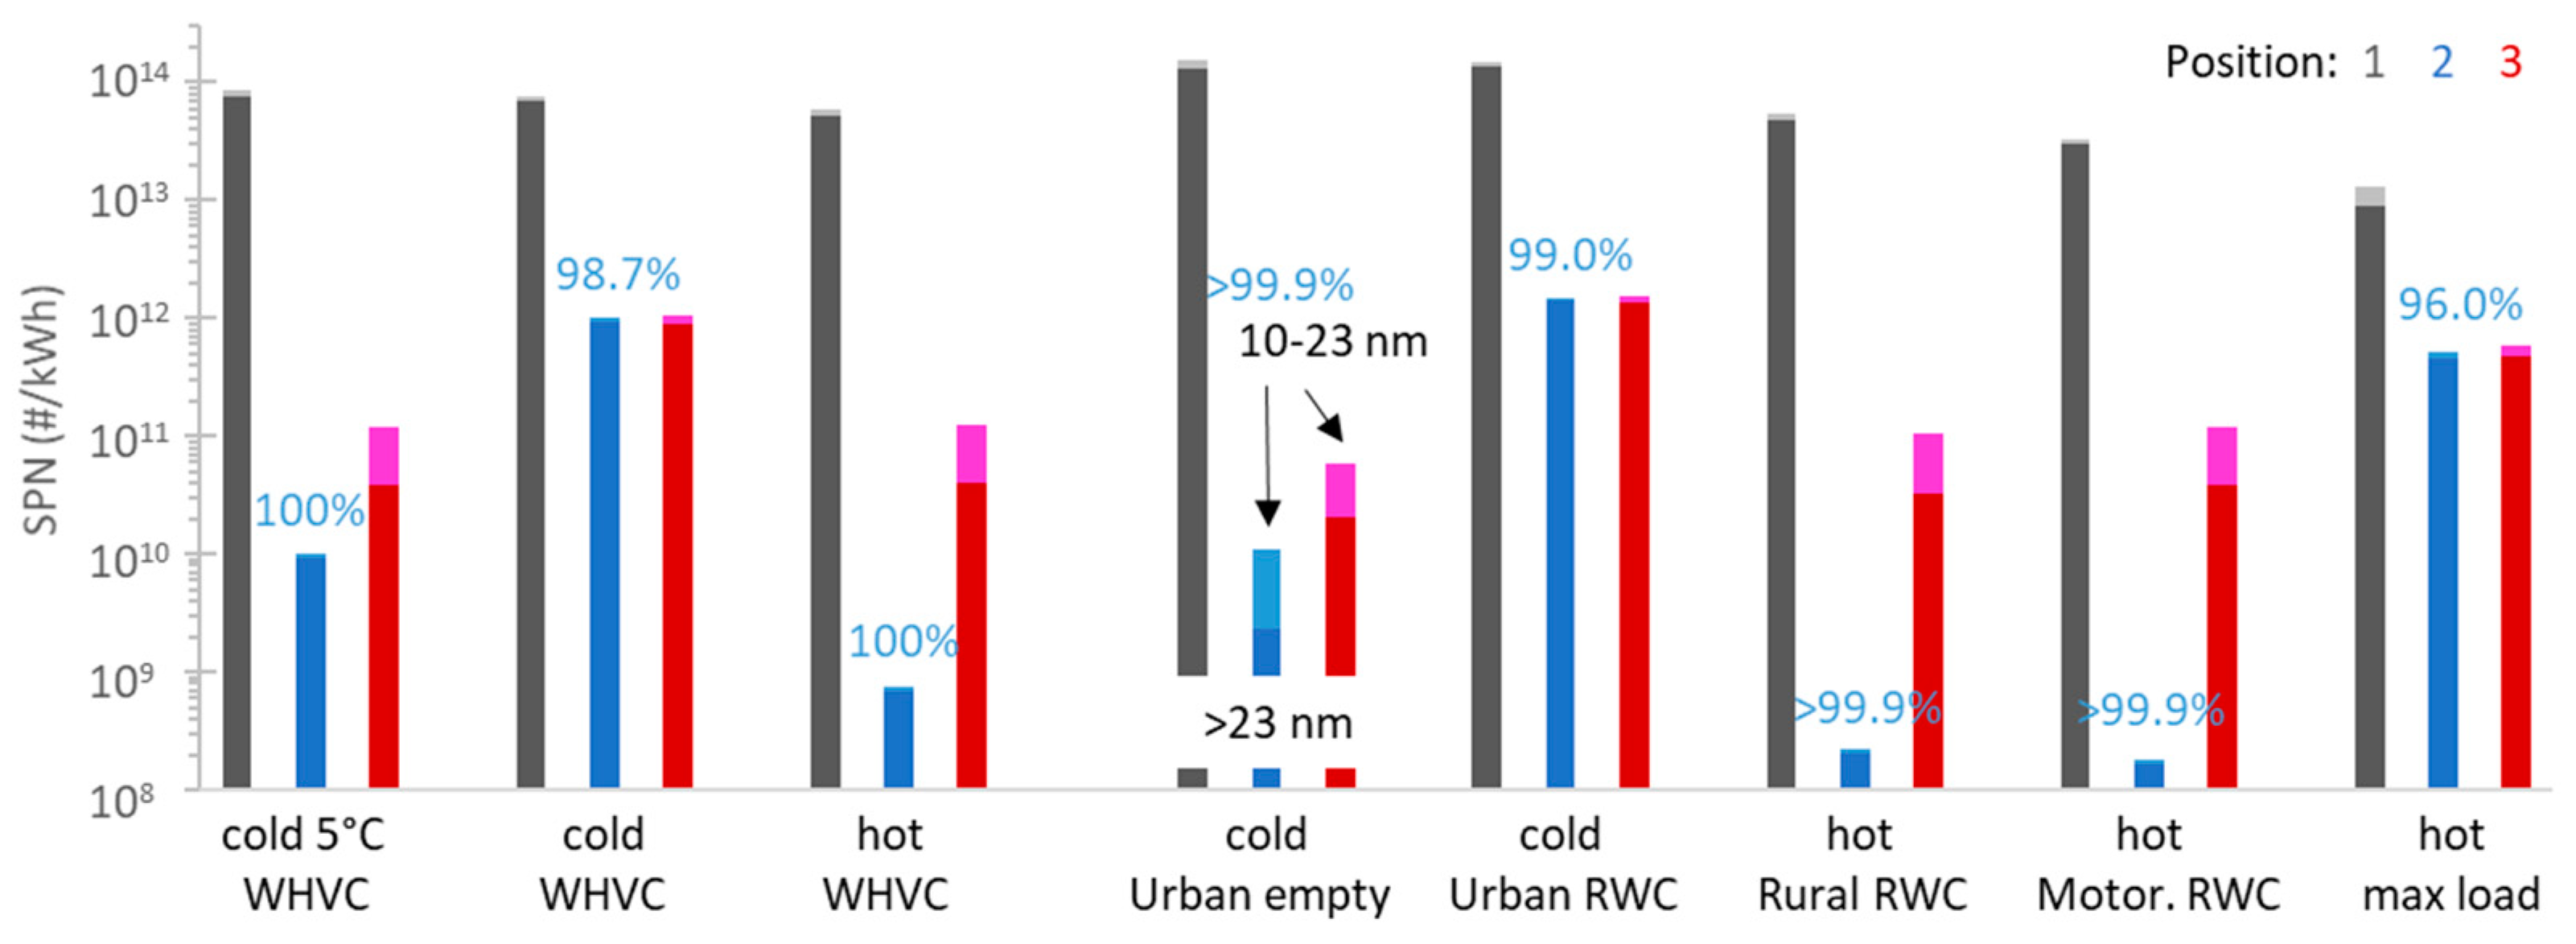
  • Engine out (or DOC in);
  • DOC + cDPF out (or SCR in);
  • SCR + ASC out (corresponding to the end of the tailpipe).
For particle emissions, three AVL particle counters were used (models APC 489 and APX xApp) [55] with similar characteristics: hot dilution at 150 °C (10:1 up to 300:1 depending on the position), catalytic stripper at 350 °C [56,57], cold dilution at ambient temperature (10:1), and two counters measuring from 23 nm [58] and 10 nm [59].
For gaseous emissions, AMA i60 analyzers were used at the first two positions and an AVL Sesam FTIR (Fourier transform infrared) spectrometer [60] at position three. The gas analyzers applied the following principles: nondispersive infrared for CO and CO2, and chemiluminescence for NOx.
The test protocol consisted of test cycles covering urban driving, up to high speed and load driving. The basis was the world harmonized vehicle cycle (WHVC), which is a cycle developed using the same data with which the engine-type-approval dynamometer transient cycle was developed: world harmonized transient cycle (WHTC). It consisted of urban, rural, and motorway parts with a total duration of 1800 s. The test was conducted with cold engine start (i.e., coolant temperature within ±3 °C ambient temperature) and hot engine start (i.e., coolant temperature > 70 °C), similarly to the engine-type-approval procedure.
The “urban empty” cycle represented driving in a city with low load, conditions challenging for the SCR system due to the low exhaust gas temperatures. The real-world cycle (RWC) was a typical cycle consisting of urban (28%), rural (30%), and motorway (42%) parts (shares in time). The “idling” test was conducted to test the emissions after prolonged idling. This test served to assess the future periodic technical inspection (PTI) procedures. The “max load” cycle was typically used at the end of the day to passively regenerate the DPF and reach a low level of soot in the DPF, as a challenging condition for the next day’s cold start (for particle emissions).
The ambient temperature was approximately 23 °C (±2 °C), except one WHVC conducted at 5 °C. Table 5 summarizes the tests in the order that were conducted and their basic characteristics. In the Results section, when two or more repetitions are available, the average is reported.

4. Conclusions

A heavy-duty vehicle fulfilling the latest Euro VI step E requirements was tested on a chassis dynamometer with various cycles. The NOx reduction was 55% (cold start urban cycle) to 97% (high load steady driving), resulting in low emissions for hot start cycles (<0.8 g/kWh), but 2–3 g/kWh for cold start cycles. The CO emissions were <1 g/kWh, except for the cold start urban cycles (around 2.5 g/kWh). The particle number emissions were around 1 × 10¹¹ #/kWh. It was clearly shown that these particles were formed by the urea injection downstream of the particulate filter. During cold start cycles, emissions were 10 times higher. The empty particulate filter had a filtration efficiency of 85% at the beginning of the cycle, reaching >99.9% after approximately four minutes. During the passive regeneration, the filtration efficiency was around 93%. The N2O emissions reached 200 mg/kWh, while the NH3 slip was negligible. Of particular interest was the high NO2/NOx ratio needed for the passive regeneration of the particulate filter and the more efficient NOx reduction in the SCR. Emissions during idling were low (particle number emissions < 2.5 × 10⁴ #/cm3). NOx were <35 ppm and started increasing only after 15–20 min of idling. During the first 60 s of cold start, no NOx were measured. This was attributed to NOx storage when no water existed (i.e., during condensation on the surfaces). The results of this study highlight the need of better control of the emissions during cold start and challenging situations (e.g., extensive idling and passive regeneration), especially if the limits will be decreased in the future.

Author Contributions

Conceptualization, B.G. and R.S.-B.; methodology, B.G.; formal analysis, B.G., R.G., J.F. and C.F.; writing—original draft preparation, B.G. and T.S.; writing—review and editing, R.G., A.D.M., J.F., C.F., R.S.-B. All authors have read and agreed to the published version of the manuscript.

Funding

This research received no external funding.

Data Availability Statement

Data available upon request from the corresponding author.

Acknowledgments

The authors would like to acknowledge the JRC VELA technical staff (M. Cadario, D. Zanardini, and R. Quattro) and AVL’s resident engineer A. Bonamin for their support in the experimental activities. The authors would also like to thank AVL (C. Dardiotis and R. Davok) for providing one of the APCs of this study.

Conflicts of Interest

The authors declare no conflict of interest. The opinions expressed in this manuscript are those of the authors and should not in no way be considered to represent an official opinion of the European Commission. Mention of trade names or commercial products does not constitute endorsement or recommendation by the authors or the European Commission.

References

  1. European Environment Agency. Air Quality in Europe: 2020 Report; Publications Office: Luxembourg, 2020.
  2. European Environment Agency. Decarbonising Road Transport: The Role of Vehicles, Fuels and Transport Demand; Publications Office: Luxembourg, 2022.
  3. Wagner, V.; Rutherford, D. Survey of Best Practices in Emission Control of In-Use Heavy-Duty Diesel Vehicles. In International Council Clean Transportation (ICCT) Report; ICCT: Washington, DC, USA, 2013. [Google Scholar]
  4. Giechaskiel, B.; Bonnel, P.; Perujo, A.; Dilara, P. Solid Particle Number (SPN) Portable Emissions Measurement Systems (PEMS) in the European Legislation: A Review. Int. J. Environ. Res. Public Health 2019, 16, 4819. [Google Scholar] [CrossRef] [Green Version]
  5. Bielaczyc, P.; Woodburn, J. On-Road Emissions and Fuel Consumption Testing of Heavy-Duty Vehicles via PEMS—Comparisons of Various Performance Metrics; 2022-01–0571; Society of Automotive Engineers: Warrendale, PA, USA, 2022. [Google Scholar]
  6. Chen, L.; Wang, Z.; Liu, S.; Qu, L. Using a Chassis Dynamometer to Determine the Influencing Factors for the Emissions of Euro VI Vehicles. Transp. Res. Part D Transp. Environ. 2018, 65, 564–573. [Google Scholar] [CrossRef]
  7. Järvinen, A.; Timonen, H.; Karjalainen, P.; Bloss, M.; Simonen, P.; Saarikoski, S.; Kuuluvainen, H.; Kalliokoski, J.; Dal Maso, M.; Niemi, J.V.; et al. Particle Emissions of Euro VI, EEV and Retrofitted EEV City Buses in Real Traffic. Environ. Pollut. 2019, 250, 708–716. [Google Scholar] [CrossRef] [PubMed]
  8. Li, P.; Lü, L. Evaluating the Real-World NOx Emission from a China VI Heavy-Duty Diesel Vehicle. Appl. Sci. 2021, 11, 1335. [Google Scholar] [CrossRef]
  9. Li, X.; Ai, Y.; Ge, Y.; Qi, J.; Feng, Q.; Hu, J.; Porter, W.C.; Miao, Y.; Mao, H.; Jin, T. Integrated Effects of SCR, Velocity, and Air-Fuel Ratio on Gaseous Pollutants and CO2 Emissions from China V and VI Heavy-Duty Diesel Vehicles. Sci. Total Environ. 2022, 811, 152311. [Google Scholar] [CrossRef] [PubMed]
  10. Grigoratos, T.; Fontaras, G.; Giechaskiel, B.; Zacharof, N. Real World Emissions Performance of Heavy-Duty Euro VI Diesel Vehicles. Atmos. Environ. 2019, 201, 348–359. [Google Scholar] [CrossRef]
  11. Giechaskiel, B.; Gioria, R.; Carriero, M.; Lähde, T.; Forloni, F.; Perujo, A.; Martini, G.; Bissi, L.M.; Terenghi, R. Emission Factors of a Euro VI Heavy-Duty Diesel Refuse Collection Vehicle. Sustainability 2019, 11, 1067. [Google Scholar] [CrossRef] [Green Version]
  12. Zheng, F.; Zhang, H.; Yin, H.; Fu, M.; Jiang, H.; Li, J.; Ding, Y. Evaluation of Real-World Emissions of China V Heavy-Duty Vehicles Fueled by Diesel, CNG and LNG on Various Road Types. Chemosphere 2022, 303, 135137. [Google Scholar] [CrossRef] [PubMed]
  13. Keramydas, C.; Ntziachristos, L.; Tziourtzioumis, C.; Papadopoulos, G.; Lo, T.-S.; Ng, K.-L.; Wong, H.-L.A.; Wong, C.K.-L. Characterization of Real-World Pollutant Emissions and Fuel Consumption of Heavy-Duty Diesel Trucks with Latest Emissions Control. Atmosphere 2019, 10, 535. [Google Scholar] [CrossRef] [Green Version]
  14. Ko, S.; Park, J.; Kim, H.; Kang, G.; Lee, J.; Kim, J.; Lee, J. NOx Emissions from Euro 5 and Euro 6 Heavy-Duty Diesel Vehicles under Real Driving Conditions. Energies 2020, 13, 218. [Google Scholar] [CrossRef]
  15. McCaffery, C.; Zhu, H.; Tang, T.; Li, C.; Karavalakis, G.; Cao, S.; Oshinuga, A.; Burnette, A.; Johnson, K.C.; Durbin, T.D. Real-World NOx Emissions from Heavy-Duty Diesel, Natural Gas, and Diesel Hybrid Electric Vehicles of Different Vocations on California Roadways. Sci. Total Environ. 2021, 784, 147224. [Google Scholar] [CrossRef] [PubMed]
  16. Jiang, Y.; Tan, Y.; Yang, J.; Karavalakis, G.; Johnson, K.C.; Yoon, S.; Herner, J.; Durbin, T.D. Understanding Elevated Real-World NOx Emissions: Heavy-Duty Diesel Engine Certification Testing versus in-Use Vehicle Testing. Fuel 2022, 307, 121771. [Google Scholar] [CrossRef]
  17. Rosero, F.; Fonseca, N.; López, J.-M.; Casanova, J. Real-World Fuel Efficiency and Emissions from an Urban Diesel Bus Engine under Transient Operating Conditions. Appl. Energy 2020, 261, 114442. [Google Scholar] [CrossRef]
  18. Wang, J.; Wang, R.; Yin, H.; Wang, Y.; Wang, H.; He, C.; Liang, J.; He, D.; Yin, H.; He, K. Assessing Heavy-Duty Vehicles (HDVs) on-Road NOx Emission in China from on-Board Diagnostics (OBD) Remote Report Data. Sci. Total Environ. 2022, 846, 157209. [Google Scholar] [CrossRef] [PubMed]
  19. Su, S.; Ge, Y.; Hou, P.; Wang, X.; Wang, Y.; Lyu, T.; Luo, W.; Lai, Y.; Ge, Y.; Lyu, L. China VI Heavy-Duty Moving Average Window (MAW) Method: Quantitative Analysis of the Problem, Causes, and Impacts Based on the Real Driving Data. Energy 2021, 225, 120295. [Google Scholar] [CrossRef]
  20. Giechaskiel, B. Solid Particle Number Emission Factors of Euro VI Heavy-Duty Vehicles on the Road and in the Laboratory. Int. J. Environ. Res. Public Health 2018, 15, 304. [Google Scholar] [CrossRef] [Green Version]
  21. Su, S.; Ge, Y.; Zhang, Y. NOx Emission from Diesel Vehicle with SCR System Failure Characterized Using Portable Emissions Measurement Systems. Energies 2021, 14, 3989. [Google Scholar] [CrossRef]
  22. Giechaskiel, B.; Forloni, F.; Carriero, M.; Baldini, G.; Castellano, P.; Vermeulen, R.; Kontses, D.; Fragkiadoulakis, P.; Samaras, Z.; Fontaras, G. Effect of Tampering on On-Road and Off-Road Diesel Vehicle Emissions. Sustainability 2022, 14, 6065. [Google Scholar] [CrossRef]
  23. Samaras, Z.C.; Kontses, A.; Dimaratos, A.; Kontses, D.; Balazs, A.; Hausberger, S.; Ntziachristos, L.; Andersson, J.; Ligterink, N.; Aakko-Saksa, P.; et al. A European Regulatory Perspective towards a Euro 7 Proposal; 2022-37–0032; Society of Automotive Engineers: Warrendale, PA, USA, 2022. [Google Scholar]
  24. Ximinis, J.; Massaguer, A.; Massaguer, E. NOx Emissions below the Prospective EURO VII Limit on a Retrofitted Heavy-Duty Vehicle. Appl. Sci. 2022, 12, 1189. [Google Scholar] [CrossRef]
  25. Selleri, T.; Gioria, R.; Melas, A.D.; Giechaskiel, B.; Forloni, F.; Mendoza Villafuerte, P.; Demuynck, J.; Bosteels, D.; Wilkes, T.; Simons, O.; et al. Measuring Emissions from a Demonstrator Heavy-Duty Diesel Vehicle under Real-World Conditions—Moving Forward to Euro VII. Catalysts 2022, 12, 184. [Google Scholar] [CrossRef]
  26. Mendoza Villafuerte, P.; Demuynck, J.; Bosteels, D.; Wilkes, T.; Mueller, V.; Recker, P. Future-Proof Heavy-Duty Truck Achieving Ultra-Low Pollutant Emissions with a Close-Coupled Emission Control System Including Active Thermal Management. Transp. Eng. 2022, 9, 100125. [Google Scholar] [CrossRef]
  27. Clairotte, M.; Suarez-Bertoa, R.; Zardini, A.A.; Giechaskiel, B.; Pavlovic, J.; Valverde, V.; Ciuffo, B.; Astorga, C. Exhaust Emission Factors of Greenhouse Gases (GHGs) from European Road Vehicles. Environ. Sci. Eur. 2020, 32, 125. [Google Scholar] [CrossRef]
  28. Russell, A.; Epling, W.S. Diesel Oxidation Catalysts. Catal. Rev. 2011, 53, 337–423. [Google Scholar] [CrossRef]
  29. Selleri, T.; Melas, A.D.; Joshi, A.; Manara, D.; Perujo, A.; Suarez-Bertoa, R. An Overview of Lean Exhaust DeNOx Aftertreatment Technologies and NOx Emission Regulations in the European Union. Catalysts 2021, 11, 404. [Google Scholar] [CrossRef]
  30. Peng, M.; Xiao, G.; Zou, K.; Chen, Y.; Huang, W. Reality Driving Emission Characteristics of Gaseous Pollutants and Particles of China VI Heavy-Duty Diesel Vehicle; 2022-01–1155; Society of Automotive Engineers: Warrendale, PA, USA, 2022. [Google Scholar]
  31. Hong, Z.; Wang, Z.; Li, X. Catalytic Oxidation of Nitric Oxide (NO) over Different Catalysts: An Overview. Catal. Sci. Technol. 2017, 7, 3440–3452. [Google Scholar] [CrossRef]
  32. Ciardelli, C.; Nova, I.; Tronconi, E.; Chatterjee, D.; Bandl-Konrad, B.; Weibel, M.; Krutzsch, B. Reactivity of NO/NO2–NH3 SCR System for Diesel Exhaust Aftertreatment: Identification of the Reaction Network as a Function of Temperature and NO2 Feed Content. Appl. Catal. B Environ. 2007, 70, 80–90. [Google Scholar] [CrossRef]
  33. Grossale, A.; Nova, I.; Tronconi, E.; Chatterjee, D.; Weibel, M. The Chemistry of the NO/NO2–NH3 “Fast” SCR Reaction over Fe-ZSM5 Investigated by Transient Reaction Analysis. J. Catal. 2008, 256, 312–322. [Google Scholar] [CrossRef]
  34. Birkhold, F.; Meingast, U.; Wassermann, P.; Deutschmann, O. Modeling and Simulation of the Injection of Urea-Water-Solution for Automotive SCR DeNOx-Systems. Appl. Catal. B Environ. 2007, 70, 119–127. [Google Scholar] [CrossRef]
  35. Gramigni, F.; Selleri, T.; Nova, I.; Tronconi, E.; Dieterich, S.; Weibel, M.; Schmeisser, V. Analysis of AdSCR Systems for NOx Removal During the Cold-Start Period of Diesel Engines. Top. Catal. 2019, 62, 3–9. [Google Scholar] [CrossRef]
  36. Selleri, T.; Gramigni, F.; Nova, I.; Tronconi, E.; Dieterich, S.; Weibel, M.; Schmeisser, V. A PGM-Free NOx Adsorber + Selective Catalytic Reduction Catalyst System (AdSCR) for Trapping and Reducing NOx in Lean Exhaust Streams at Low Temperature. Catal. Sci. Technol. 2018, 8, 2467–2476. [Google Scholar] [CrossRef]
  37. Schmeisser, V.; Weibel, M.; Sebastian Hernando, L.; Nova, I.; Tronconi, E.; Ruggeri, M.P. Cold Start Effect Phenomena over Zeolite SCR Catalysts for Exhaust Gas Aftertreatment. SAE Int. J. Commer. Veh. 2013, 6, 190–199. [Google Scholar] [CrossRef]
  38. Lukas, D.; Michael, M.; Gert, B.; Andreas, K. Analysis of the NOx Storage Behaviour during Cold Start of Modern SCR Flow-through Substrates and SCR on-Filter Substrates. Automot. Engine Technol. 2022, 7, 81–96. [Google Scholar] [CrossRef]
  39. Giechaskiel, B.; Zardini, A.A.; Clairotte, M. Exhaust Gas Condensation during Engine Cold Start and Application of the Dry-Wet Correction Factor. Appl. Sci. 2019, 9, 2263. [Google Scholar] [CrossRef] [Green Version]
  40. Colombo, M.; Nova, I.; Tronconi, E. A Comparative Study of the NH3-SCR Reactions over a Cu-Zeolite and a Fe-Zeolite Catalyst. Catal. Today 2010, 151, 223–230. [Google Scholar] [CrossRef]
  41. Grossale, A.; Nova, I.; Tronconi, E.; Chatterjee, D.; Weibel, M. NH3–NO/NO2 SCR for Diesel Exhausts Aftertreatment: Reactivity, Mechanism and Kinetic Modelling of Commercial Fe- and Cu-Promoted Zeolite Catalysts. Top. Catal. 2009, 52, 1837–1841. [Google Scholar] [CrossRef]
  42. Mamakos, A.; Schwelberger, M.; Fierz, M.; Giechaskiel, B. Effect of Selective Catalytic Reduction on Exhaust Nonvolatile Particle Emissions of Euro VI Heavy-Duty Compression Ignition Vehicles. Aerosol Sci. Technol. 2019, 53, 898–910. [Google Scholar] [CrossRef] [Green Version]
  43. Melas, A.; Selleri, T.; Suarez-Bertoa, R.; Giechaskiel, B. Evaluation of Measurement Procedures for Solid Particle Number (SPN) Measurements during the Periodic Technical Inspection (PTI) of Vehicles. Int. J. Environ. Res. Public Health 2022, 19, 7602. [Google Scholar] [CrossRef] [PubMed]
  44. Metkar, P.S.; Balakotaiah, V.; Harold, M.P. Experimental Study of Mass Transfer Limitations in Fe- and Cu-Zeolite-Based NH3-SCR Monolithic Catalysts. Chem. Eng. Sci. 2011, 66, 5192–5203. [Google Scholar] [CrossRef]
  45. Salman, A.U.R.; Enger, B.C.; Auvray, X.; Lødeng, R.; Menon, M.; Waller, D.; Rønning, M. Catalytic Oxidation of NO to NO2 for Nitric Acid Production over a Pt/Al2O3 Catalyst. Appl. Catal. A Gen. 2018, 564, 142–146. [Google Scholar] [CrossRef]
  46. Wang, X.; Song, G.; Wu, Y.; Yu, L.; Zhai, Z. A NOx Emission Model Incorporating Temperature for Heavy-Duty Diesel Vehicles with Urea-SCR Systems Based on Field Operating Modes. Atmosphere 2019, 10, 337. [Google Scholar] [CrossRef]
  47. Giechaskiel, B.; Lähde, T.; Schwelberger, M.; Kleinbach, T.; Roske, H.; Teti, E.; van den Bos, T.; Neils, P.; Delacroix, C.; Jakobsson, T.; et al. Particle Number Measurements Directly from the Tailpipe for Type Approval of Heavy-Duty Engines. Appl. Sci. 2019, 9, 4418. [Google Scholar] [CrossRef] [Green Version]
  48. Giechaskiel, B.; Schwelberger, M.; Kronlund, L.; Delacroix, C.; Locke, L.A.; Khan, M.Y.; Jakobsson, T.; Otsuki, Y.; Gandi, S.; Keller, S.; et al. Towards Tailpipe Sub-23 Nm Solid Particle Number Measurements for Heavy-Duty Vehicles Regulations. Transp. Eng. 2022, 9, 100137. [Google Scholar] [CrossRef]
  49. Ravishankara, A.R.; Daniel, J.S.; Portmann, R.W. Nitrous Oxide (N2O): The Dominant Ozone-Depleting Substance Emitted in the 21st Century. Science 2009, 326, 123–125. [Google Scholar] [CrossRef] [PubMed] [Green Version]
  50. Hausberger, S.; Weller, K.; Ehrly, M. Supplements to the Scenarios for HDVs. Available online: https://circabc.europa.eu/sd/a/e0063651-4e84-4b95-aac4-edb85a719764/AGVES-2021-04-27-HDV_Exhaust-v6b.pdf (accessed on 12 October 2022).
  51. Boger, T.; Rose, D.; He, S.; Joshi, A. Developments for Future EU7 Regulations and the Path to Zero Impact Emissions—A Catalyst Substrate and Filter Supplier’s Perspective. Transp. Eng. 2022, 10, 100129. [Google Scholar] [CrossRef]
  52. Mamakos, A.; Rose, D.; Besch, M.C.; He, S.; Gioria, R.; Melas, A.; Suarez-Bertoa, R.; Giechaskiel, B. Evaluation of Advanced Diesel Particulate Filter Concepts for Post Euro VI Heavy-Duty Diesel Applications. Atmosphere 2022, 13. [Google Scholar]
  53. Guan, B.; Zhan, R.; Lin, H.; Huang, Z. Review of State of the Art Technologies of Selective Catalytic Reduction of NOx from Diesel Engine Exhaust. Appl. Therm. Eng. 2014, 66, 395–414. [Google Scholar] [CrossRef]
  54. Kamasamudram, K.; Henry, C.; Currier, N.; Yezerets, A. N2O Formation and Mitigation in Diesel Aftertreatment Systems. SAE Int. J. Engines 2012, 5, 688–698. [Google Scholar] [CrossRef]
  55. Giechaskiel, B.; Cresnoverh, M.; Jörgl, H.; Bergmann, A. Calibration and Accuracy of a Particle Number Measurement System. Meas. Sci. Technol. 2010, 21, 045102. [Google Scholar] [CrossRef]
  56. Amanatidis, S.; Ntziachristos, L.; Giechaskiel, B.; Katsaounis, D.; Samaras, Z.; Bergmann, A. Evaluation of an Oxidation Catalyst (“Catalytic Stripper”) in Eliminating Volatile Material from Combustion Aerosol. J. Aerosol Sci. 2013, 57, 144–155. [Google Scholar] [CrossRef]
  57. Giechaskiel, B.; Melas, A.D.; Lähde, T.; Martini, G. Non-Volatile Particle Number Emission Measurements with Catalytic Strippers: A Review. Vehicles 2020, 2, 342–364. [Google Scholar] [CrossRef]
  58. Giechaskiel, B.; Wang, X.; Horn, H.-G.; Spielvogel, J.; Gerhart, C.; Southgate, J.; Jing, L.; Kasper, M.; Drossinos, Y.; Krasenbrink, A. Calibration of Condensation Particle Counters for Legislated Vehicle Number Emission Measurements. Aerosol Sci. Technol. 2009, 43, 1164–1173. [Google Scholar] [CrossRef]
  59. Takegawa, N.; Sakurai, H. Laboratory Evaluation of a TSI Condensation Particle Counter (Model 3771) under Airborne Measurement Conditions. Aerosol Sci. Technol. 2011, 45, 272–283. [Google Scholar] [CrossRef]
  60. Giechaskiel, B.; Clairotte, M. Fourier Transform Infrared (FTIR) Spectroscopy for Measurements of Vehicle Exhaust Emissions: A Review. Appl. Sci. 2021, 11, 7416. [Google Scholar] [CrossRef]
Figure 1. Cold start world harmonized vehicle cycle (WHVC) at 23 °C. The upper panel plots the speed profile, the temperatures at the inlet of the DOC and the SCR, and the H2O concentration in the exhaust gas. The middle panel plots NH3 and N2O at position 3, and the NO/NOx ratios for positions 2 and 3. The lower panel plots the NOx emissions (continuous lines) at the three sampling locations. ASC = ammonia slip catalyst; DOC = Diesel oxidation catalyst; cDPF = catalyzed Diesel particulate filter; SCR = selective catalytic reduction.
Catalysts 12 01230 g001
Figure 2. Cold start world harmonized vehicle cycle (WHVC) at 23 °C. The different colors represent different sampling locations. Continuous lines indicate solid particle numbers >10 nm, SPN10; dotted lines indicate > 23 nm, SPN23, emissions. ASC = ammonia slip catalyst; DOC = Diesel oxidation catalyst; cDPF = catalyzed Diesel particulate filter; SCR = selective catalytic reduction.
Catalysts 12 01230 g002
Figure 3. Idling test. The different colors represent different sampling locations. ASC = ammonia slip catalyst; DOC = Diesel oxidation catalyst; cDPF = catalyzed Diesel particulate filter; SCR = selective catalytic reduction; SPN = solid particle number.
Catalysts 12 01230 g003
Figure 4. Maximum load test. The different colors represent different sampling locations. ASC = ammonia slip catalyst; DOC = Diesel oxidation catalyst; cDPF = catalyzed Diesel particulate filter; SCR = selective catalytic reduction; SPN = solid particle number.
Catalysts 12 01230 g004
Figure 5. NOx conversions in the aftertreatment device: (a) NO to NOx ratio at the outlet of the DOC + cDPF as a function of the exhaust gas temperature in the DOC inlet. Circles are the measured data. The blue dotted line is a typical curve for the Pt catalyst and the grey dashed line is the equilibrium; (b) NOx reduction efficiency in the SCR + ASC for NOx as a function of the exhaust gas temperature in the SCR inlet. The points in the square are tests after a warm start (coolant temperature 55 °C). DOC = Diesel oxidation catalyst; cDPF = catalyzed Diesel particulate filter; SCR = selective catalytic reduction.
Catalysts 12 01230 g005
Figure 6. NOx emission factors for various cycles at different sampling positions of the aftertreatment system. When available, NO and NO2 are given with different color shading. Position 1 (engine out, grey bars); position 2 (DOC + cDPF out, blue bars); position 3 (SCR + ASC out, tailpipe, red bars). Percentages give emissions reductions compared to the previous position. Tests at 23 °C, except “cold 5 °C WHVC”, and 66% of maximum payload, except “Urban empty” (9%). “Cold” and “hot” refer to the coolant temperature at engine cranking, i.e., at ambient temperature or >70 °C, respectively. ASC = ammonia slip catalyst; DOC = Diesel oxidation catalyst; cDPF = catalyzed Diesel particulate filter; RWC = real-world cycle; SCR = selective catalytic reduction; WHVC = world harmonized vehicle cycle.
Catalysts 12 01230 g006
Figure 7. CO emission factors for various cycles at different sampling positions of the aftertreatment system. Position 1 (engine out, grey bars); position 2 (DOC + cDPF out, blue bars); position 3 (SCR + ASC out, tailpipe, red bars). Percentages give emissions reductions compared to the previous position. Tests at 23 °C, except “cold 5 °C WHVC”, and 66% of maximum payload, except “Urban empty” (9%). “Cold” and “hot” refer to the coolant temperature at engine cranking, i.e., at ambient temperature or >70 °C, respectively. ASC = ammonia slip catalyst; DOC = Diesel oxidation catalyst; cDPF = catalyzed Diesel particulate filter; RWC = real-world cycle; SCR = selective catalytic reduction; WHVC = world harmonized vehicle cycle.
Catalysts 12 01230 g007
Figure 8. Solid particle number (SPN) emission factors for various cycles at different sampling positions of the aftertreatment system. SPN23 and SPN10 are given with different color shading. Position 1 (engine out, grey bars); position 2 (DOC + cDPF out, blue bars); position 3 (SCR + ASC out, tailpipe, red bars). Percentages give emissions reductions compared to the previous position. Tests at 23 °C, except “cold 5 °C WHVC”, and 66% of maximum payload, except “Urban empty” (9%). “Cold” and “hot” refer to the coolant temperature at engine cranking, i.e., at ambient temperature or >70 °C, respectively. ASC = ammonia slip catalyst; DOC = Diesel oxidation catalyst; cDPF = catalyzed Diesel particulate filter; RWC = real world cycle; SCR = selective catalytic reduction; WHVC = world harmonized vehicle cycle.
Catalysts 12 01230 g008
Figure 9. Experimental setup. Sampling positions and the naming conventions. Asterisks indicate exhaust gas temperature measurements. ASC = ammonia slip catalyst; cDPF = catalyzed Diesel particulate filter; DOC = Diesel oxidation catalyst; SCR = selective catalytic reduction; SPN = solid particle number.
Catalysts 12 01230 g009
Table 1. Emissions of greenhouse gases for the various cycles (measured at the tailpipe with an FTIR). All tests at around 23 °C, unless otherwise specified.
PollutantWHVC
Cold 5 °C
WHVC
Cold
WHVC
Hot
Urban
Cold
Urban RWC
Cold
Rural RWC
Hot
Motor RWC
Hot
Max Load
Hot
CO2 (g/kWh)710.3654.4649.7716.4727.9650.1640.8614.7
N2O (mg/kWh)82.2161.3176.352.891.8196.4196.363.9
CH4 (mg/kWh)4.93.02.913.06.61.91.00.1
FTIR = Fourier transform infrared; RWC = real-world cycle; WHVC = world harmonized vehicle cycle.
Table 2. Emission factors of type-approval-like WHVC of the vehicle of our study and the respective limits in the regulation for WHTC and engine dynamometer testing.
PollutantColdHotWeighted 1Limit
NOx (g/kWh)1.710.790.920.46
CO (g/kWh)0.750.400.454.00
SPN23 × 1011 (#/kWh)8.940.401.596.00
1 Applying 14% for the cold start and 86% for hot start cycle. SPN = solid particle number; WHTC = world harmonized transient cycle; WHVC = world harmonized vehicle cycle.
Table 3. Conformity factors of the real-world cycle (RWC) according to the Euro VI step E methodology for in-service conformity (ISC)-like testing.
PollutantColdHot (90th)Weighted 1On-Road 2
NOx (-)3.561.872.111.50
CO (-)0.310.210.221.50
SPN23 × 1011 (-)0.840.070.181.63
1 Applying 14% to the 100th% of the cold windows and 86% to the 90th% of the hot windows. 2 For on-road testing, a conformity factor of 1.50 applies for the gaseous pollutants and 1.63 for SPN23.
Table 4. Emission factors of the real-world cycle (RWC) and the respective limits ranges that have been suggested for the future regulation [50]. Note that on-road testing will not include any conformity factors.
Pollutant100thLimit 100th90thLimit 90th
NOx (g/kWh)1.670.18–0.351.020.09
CO (g/kWh)1.131.5–3.51.080.20
SPN10 × 1011 (#/kWh) 18.75.01.31.0
N2O (g/kWh)0.220.160.210.06
1 The proposal includes particles from 10 nm.
Table 5. Test protocol and main characteristics of the test cycles. All tests with 66% payload except “Urban empty” (9% payload).
CycleDuration
(s)
D
(km)
Speed
(km/h)
W/D
(kWh/km)
Tamb
(°C)
Tcoolant
(°C)
DPF 1
(%)
WHVC cold180020.240.41.52242911.8/11.8
WHVC hot180020.240.51.40257911.8/11.8
Max load130027.175.13.26258411.8/9.8
RWC urban208515.727.21.2423239.8/9.8
RWC rural219028.146.21.3423809.8/25.8
RWC motorway315071.381.51.00248025.8/26.7
Idling31500.00.0-258026.7/26.7
Max load274558.476.63.33257926.7/11.0
WHVC cold180020.240.31.44222111.0/11.0
WHVC hot180020.140.21.40218111.0/11.0
Urban empty274513.217.30.99222611.0/13.7
WHVC hot180020.140.31.34227913.7/13.7
WHVC cold180020.240.41.434613.7/13.7
30–60–90 km/h180025.530.00.87245513.7/13.7
1 Fill state of the DPF as stated at the respective channel of the electronic control unit (ECU). D = distance; DPF = Diesel particulate filter; RWC = real-world cycle; T = temperature; W = work; WHVC = world harmonized vehicle cycle.
Publisher’s Note: MDPI stays neutral with regard to jurisdictional claims in published maps and institutional affiliations.

