Catalytic Degradation of Chitosan by Supported Heteropoly Acids in Heterogeneous Systems
by
Hang Zhang
1, 
Zhipeng Ma
1,
Yunpeng Min
1,
Huiru Wang
1,
Ru Zhang
1,
Xuecheng Zhang
2 and
Yimin Song
1,* 1
Department of Pharmaceutical Engineering, Qingdao University of Science and Technology, No. 53 Zhengzhou Road, Qingdao 266000, China
2
Colloge of Marines Life Science, Ocean University of China, No. 5 Yushan Road, Qingdao 266000, China
*
Author to whom correspondence should be addressed.
Catalysts 2020, 10(9), 1078; https://doi.org/10.3390/catal10091078
Submission received: 10 July 2020
/
Revised: 6 September 2020
/
Accepted: 10 September 2020
/
Published: 18 September 2020
(This article belongs to the Special Issue Non-critical Element- and Non-critical Loading of Critical Element-Based Catalysts for Environmentally Friendly Catalytic Processes)
Abstract
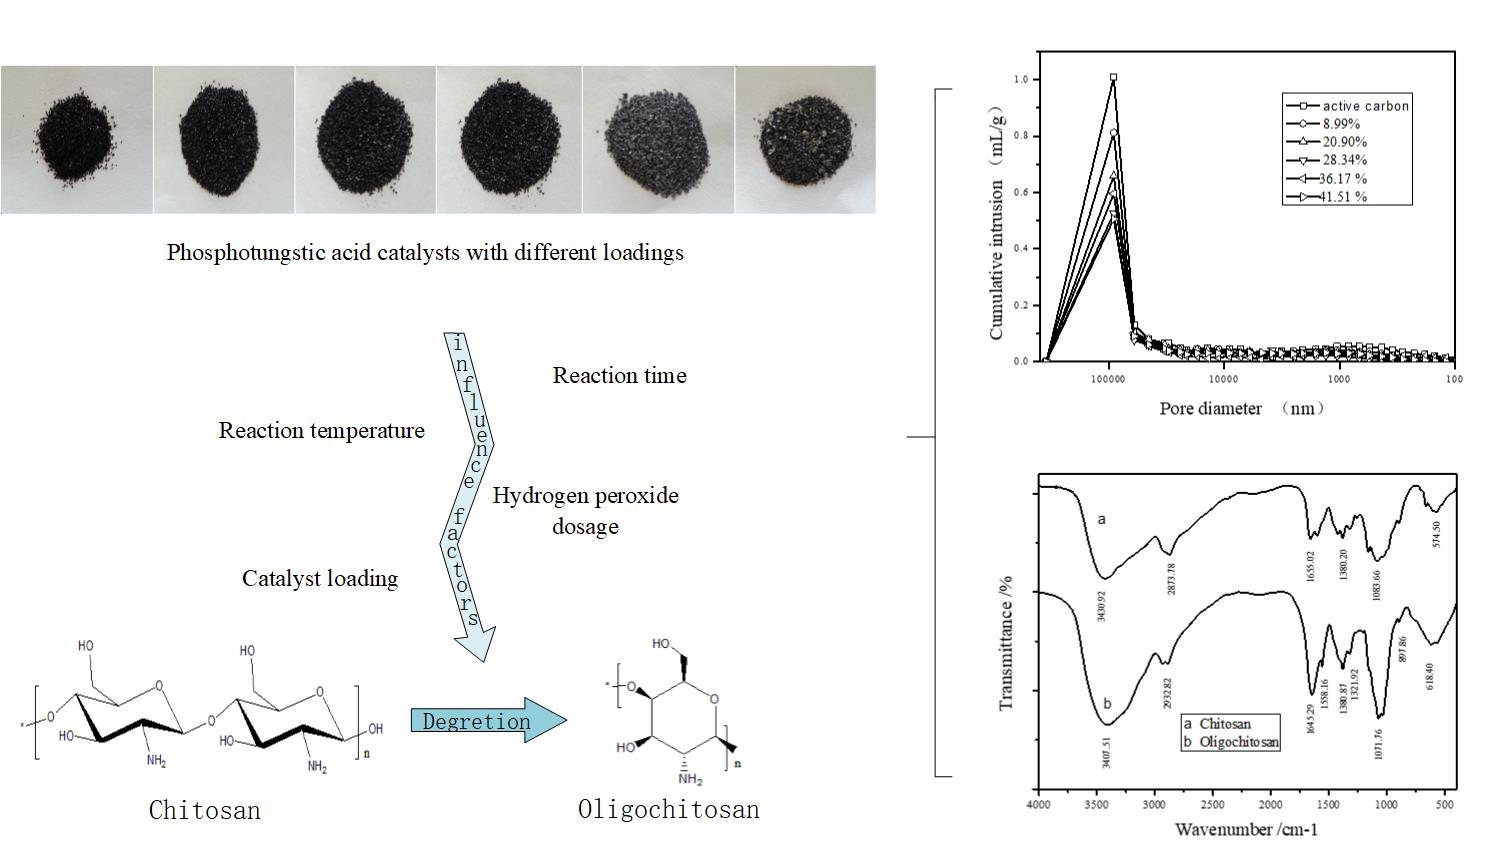
:Several kinds of composite materials with phosphotungstic acid (PTA) as the catalyst were prepared with activated carbon as support, and their structures were characterized. According to the Box–Behnken central combination principle, the mathematical model of the heterogeneous system is established. Based on the single-factor experiments, the reaction temperature, the reaction time, the amount of hydrogen peroxide and the loading capacity of PTA were selected as the influencing factors to study the catalyzed oxidation of hydrogen peroxide and degradation of high molecular weight chitosan. The results of IR showed that the catalyst had a Keggin structure. The results of the mercury intrusion test showed that the pore structure of the supported PTA catalyst did not change significantly, and with the increase of PTA loading, the porosity and pore volume decreased regularly, which indicated that PTA molecules had been absorbed and filled into the pore of activated carbon. The results of Response Surface Design (RSD) showed that the optimum reaction conditions of supported PTA catalysts for oxidative degradation of high molecular weight chitosan by hydrogen peroxide were as follows: reaction temperature was 70 ℃, reaction time was 3.0 h, the ratio of hydrogen peroxide to chitosan was 2.4 and the catalyst loading was 30%. Under these conditions, the yield and molecular weight of water-soluble chitosan were 62.8% and 1290 Da, respectively. The supported PTA catalyst maintained high catalytic activity after three reuses, which indicated that the supported PTA catalyst had excellent catalytic activity and stable performance compared with the PTA catalyst.

1. Introduction
Chitosan is the deacetylated product of chitin, which is abundant in nature. It is widely distributed in the crusts of marine arthropods, such as shrimps and crabs, fungi, insects, algae cell membranes and cell walls of higher plants. It is the second largest natural alkaline polysaccharide after cellulose in terms of annual output. Chitosan has broad application prospects in food, the chemical industry, textiles, biological materials and medicine [1,2,3], and it has attracted the attention of a large number of researchers. The molecular weight of chitosan has a great influence on its properties. High molecular weight chitosan has a strong hydrogen bond and a tight crystal structure. It is insoluble in ordinary solvents and can only be dissolved in some acidic media. Low molecular weight chitosan has high solubility and is easy to absorb in vivo. It also has anti-bacterial and anti-tumor functions and improves the immunity and defense ability of animals and plants [4,5,6]. Therefore, it has higher value for research than chitin and macromolecule chitosan [7]. At present, the main degradation methods of chitosan are acid degradation, enzymatic degradation and oxidative degradation. The acid degradation method is the most basic and convenient. However, it is difficult to control reaction conditions, and it is easy to form chitosan fragments with different molecular weight distribution. Moreover, the use of strong acid degradation seriously pollutes the environment, which seriously hinders its wide application. The bio-enzymatic degradation method is simple in operation and mild in reaction conditions, but it is not suitable for industrial production because of its high production cost. The oxidative degradation of hydrogen peroxide has attracted much attention because of its low cost, relatively fast degradation rate, low relative molecular weight, narrow distribution, lack of residue and easily realized industrialization [8]. Chitosan could be degraded by hydrogen peroxide in both homogeneous and heterogeneous conditions [9]. The results show that chitosan molecules are easy to carry out in a homogeneous system, the degradation reaction is uniform, the chitosan fragments with uniform molecular weight can be obtained effectively and the production cost is low. However, the reaction requires the use of low boiling point acidic substances, such as acetic acid or hydrochloric acid. These acidic substances have some shortcomings, such as high volatility, serious pollution, strong corrosiveness and difficulty to be recycled and reused. The heterogeneous degradation of chitosan can be carried out in alkaline or neutral conditions, and the conditions are mild. However, the slow permeation rate of hydrogen peroxide leads to non-uniform degradation, slow reaction speed and degradation efficiency to be improved. Therefore, how to improve the degradation efficiency of chitosan in a heterogeneous system is a valuable problem to be solved.
Heteropoly acid is a kind of catalytic material with redox, acid-base and environmental friendliness [10,11]. In recent years, there has been reports on the oxidative degradation of chitosan by hydrogen peroxide catalyzed by heteropoly acids [12]. However, there has been no literature report on the degradation of chitosan by hydrogen peroxide catalyzed by supported heteropoly acid. In this study, activated carbon-supported heteropoly acid catalysts were prepared by the reflux adsorption method, and their effects on the oxidation and degradation of high molecular weight chitosan by hydrogen peroxide in the heterogeneous system were investigated.
Activated carbon, also known as activated carbon black, is a carbon-containing material. It is black powder or granular amorphous carbon. It has high surface area, high adsorption capacity, good porosity and high mechanical strength. Activated carbon has a strong “physical adsorption” and “chemical adsorption” effect, which can adsorb some organic compounds and be used as a chemical catalyst carrier.
2. Results and Discussion
2.1. Single-Factor Experiment
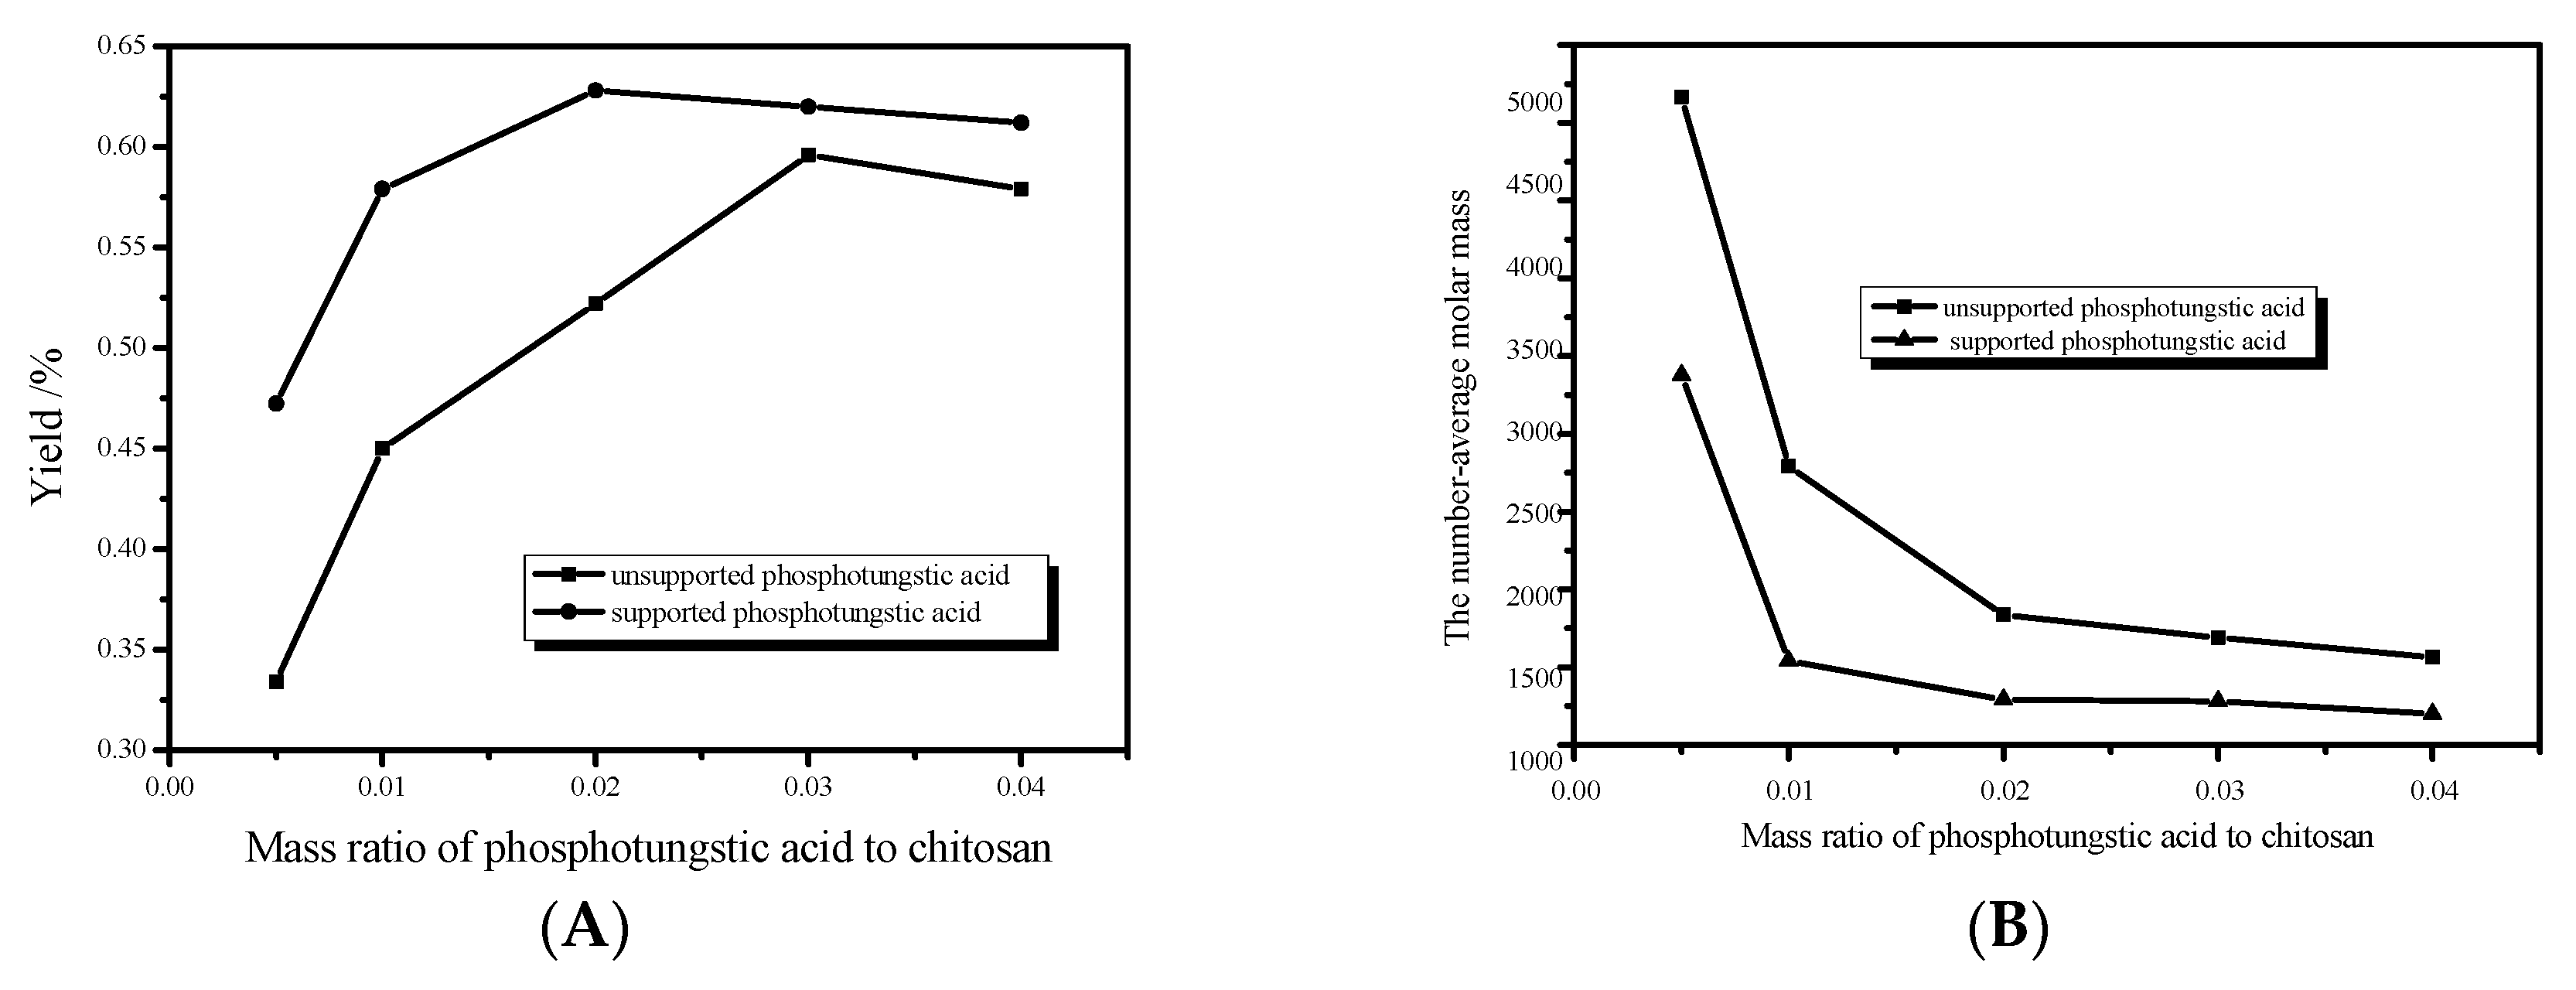
Compared to unsupported PTA under different catalyst dosage conditions, the LWCS obtained by the supported PTA catalyst had a higher yield and lower average molecular weight, which indicated that supported PTA could significantly improve the degradation efficiency of chitosan (Figure 1A,B).
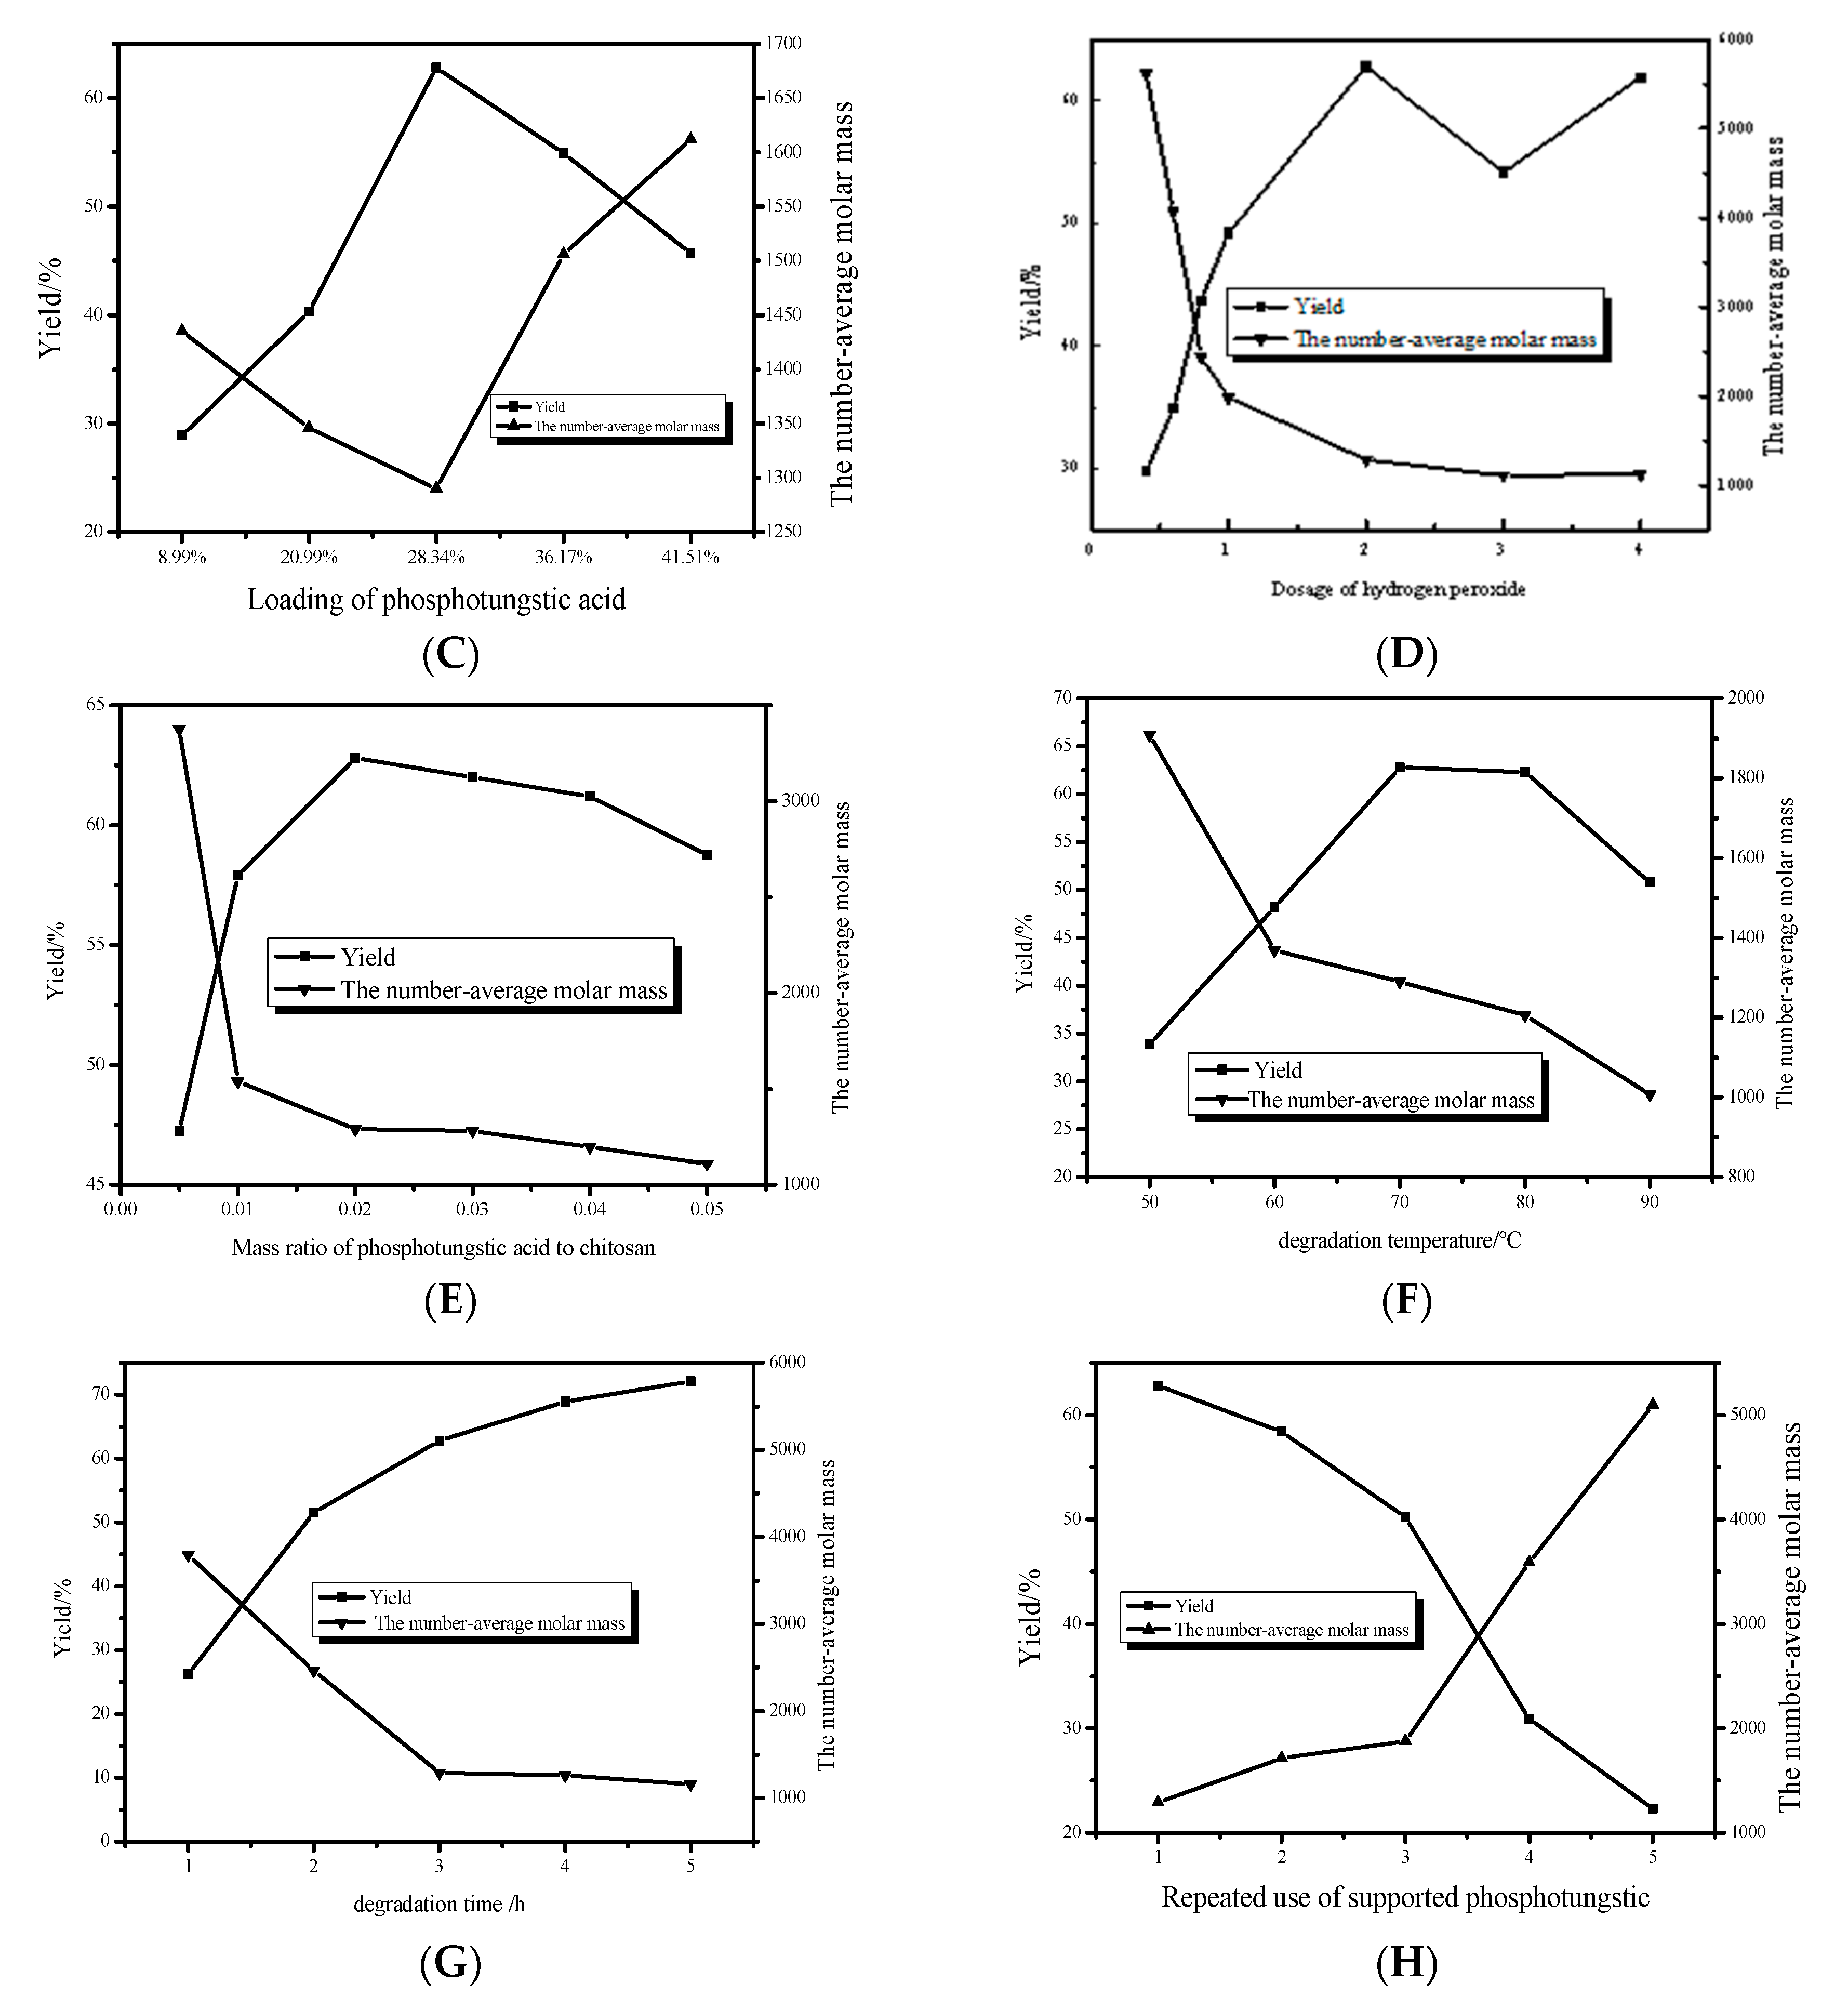
The effects of various factors on the yield and average molecular weight of LWCS were as follows: when the loading capacity was 28.3%, the optimal catalytic activity was obtained (Figure 1C). When PTA was overloaded, the yield of LWCS decreased and the average molecular weight increased. R-value 2 of hydrogen peroxide was the most suitable (Figure 1D). When the dosage of hydrogen peroxide continued to increase, the average molecular weight decreased slightly, mainly because hydrogen peroxide is a hydroxyl radical scavenger. When the concentration of hydrogen peroxide reached a certain level, some hydroxyl radicals would be eliminated. The oxidation ability of hydrogen peroxide could not be improved obviously [8]. When the catalyst mass ratio was 0.02, the yield of LWCS was the highest and the average molecular weight was the lowest (Figure 1E). When the degradation temperature of chitosan was 70 °C, the yield was the highest and the degradation was the most thorough (Figure 1F). The best degradation time of chitosan was 3 h (Figure 1G).
From Figure 1H, it was known that there might be a strong interaction between activated carbon and PTA. The catalytic activity remained higher after which it was recycled and reused three times. However, the catalytic efficiency decreased rapidly during the fourth time. After it was reused five times, the LWCS could not be completely dissolved. The main reason was that PTA was reused more than a certain number of times. Because PTA was desorbed from the pore of activated carbon, the catalytic efficiency of the supported catalyst was significantly reduced. Therefore, PTA supported on activated carbon could be reused, and the effect was good, but the binding degree between PTA and activated carbon was still not strong enough. If the preparation process of the catalyst was further optimized, there would still be large room for improvement in catalytic efficiency and reuse times.
2.2. Response Surface Methodology for Optimizing Experimental Design
2.2.1. Design and Results of Response Interview Experiments
According to the Box–Behnken central composite design principle, four factors, such as hydrogen peroxide dosage (A), catalyst loading (B), reaction time (C) and reaction temperature (D), were selected to design the response surface experiment with four factors and three levels, and regression analysis and significance analysis were carried out on the data. The ratio of average molecular weight to yield of chitosan was the response value (Y%). The experimental design and results are shown in Table 1.
2.2.2. Modeling and Variance Analysis
The Design Export 8.0 software was applied to analyze the data in response surface regression fitting (Table 2) to conduct variance analysis and the significance test. The quadratic regression fitting model could be obtained. The equation was as follows: Y = 251.76 − 13.85A − 0.76B − 54.50C − 3.3-D + 0.09AB + 0.68AC + 0.02AD + 010BC − 0.01BD + 0.10CD + 1.50A2 + 0.02B2 + 7.08C2 + 0.02D2. Detailed results are shown in Table 2.
The results of the variance analysis of the regression model in Table 2 show that the Model F-value of 2.95 implied the model was significant. The overall p value was 0.0261, which is less than 0.05, indicating that model terms were significant. The coefficient of the determinant was 74.67 (R2 = 74.67), and the missing items were not significant, so the model selection was correct, indicating that the model has significant statistical significance and the model fitting degree is good. Therefore, the model can be used to simulate and predict the experiment.
It is shown from the results of the significance test of the regression coefficient that the greater the F value is, the greater the impact on the response value is, in which the order of influence on the preparation process of water-soluble chitosan is as follows: hydrogen peroxide dosage > reaction time > catalyst loading > reaction temperature.
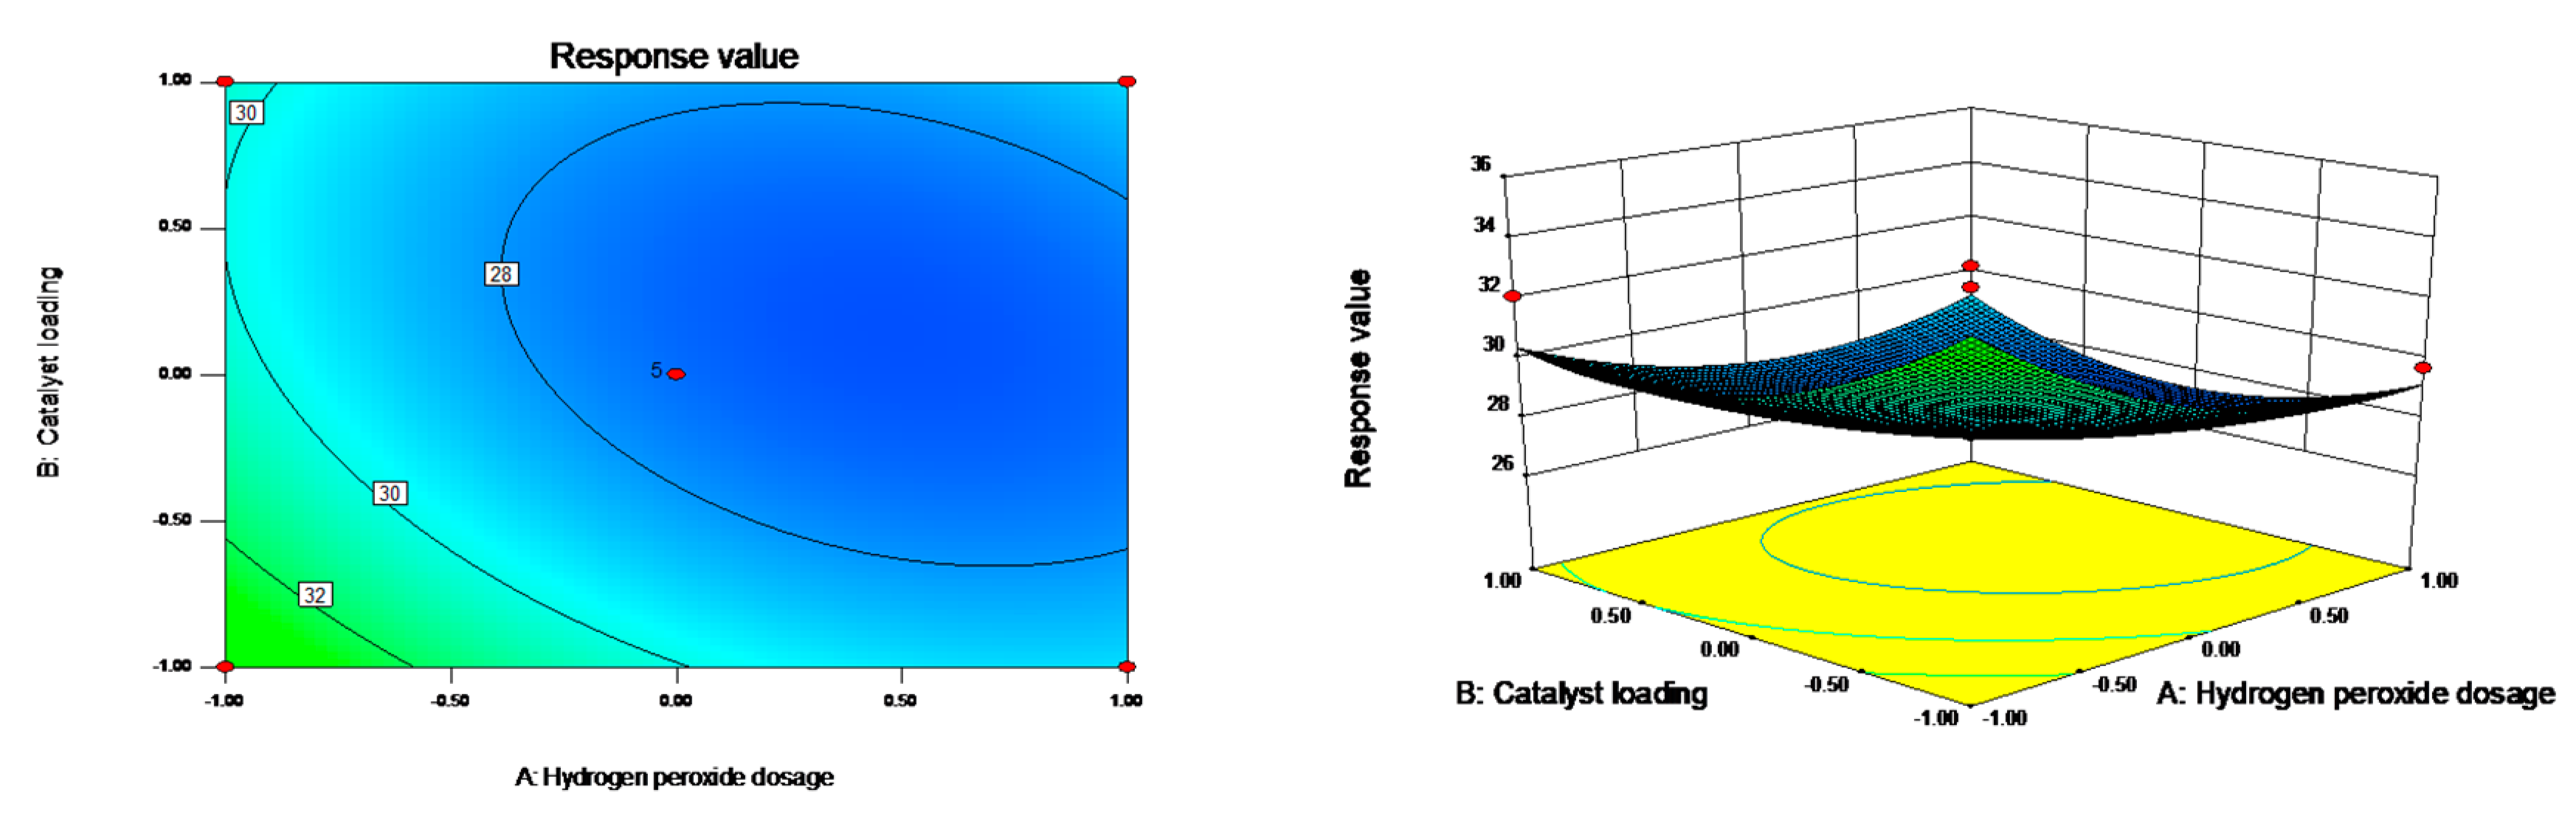
2.2.3. Response Surface and Contour Analysis
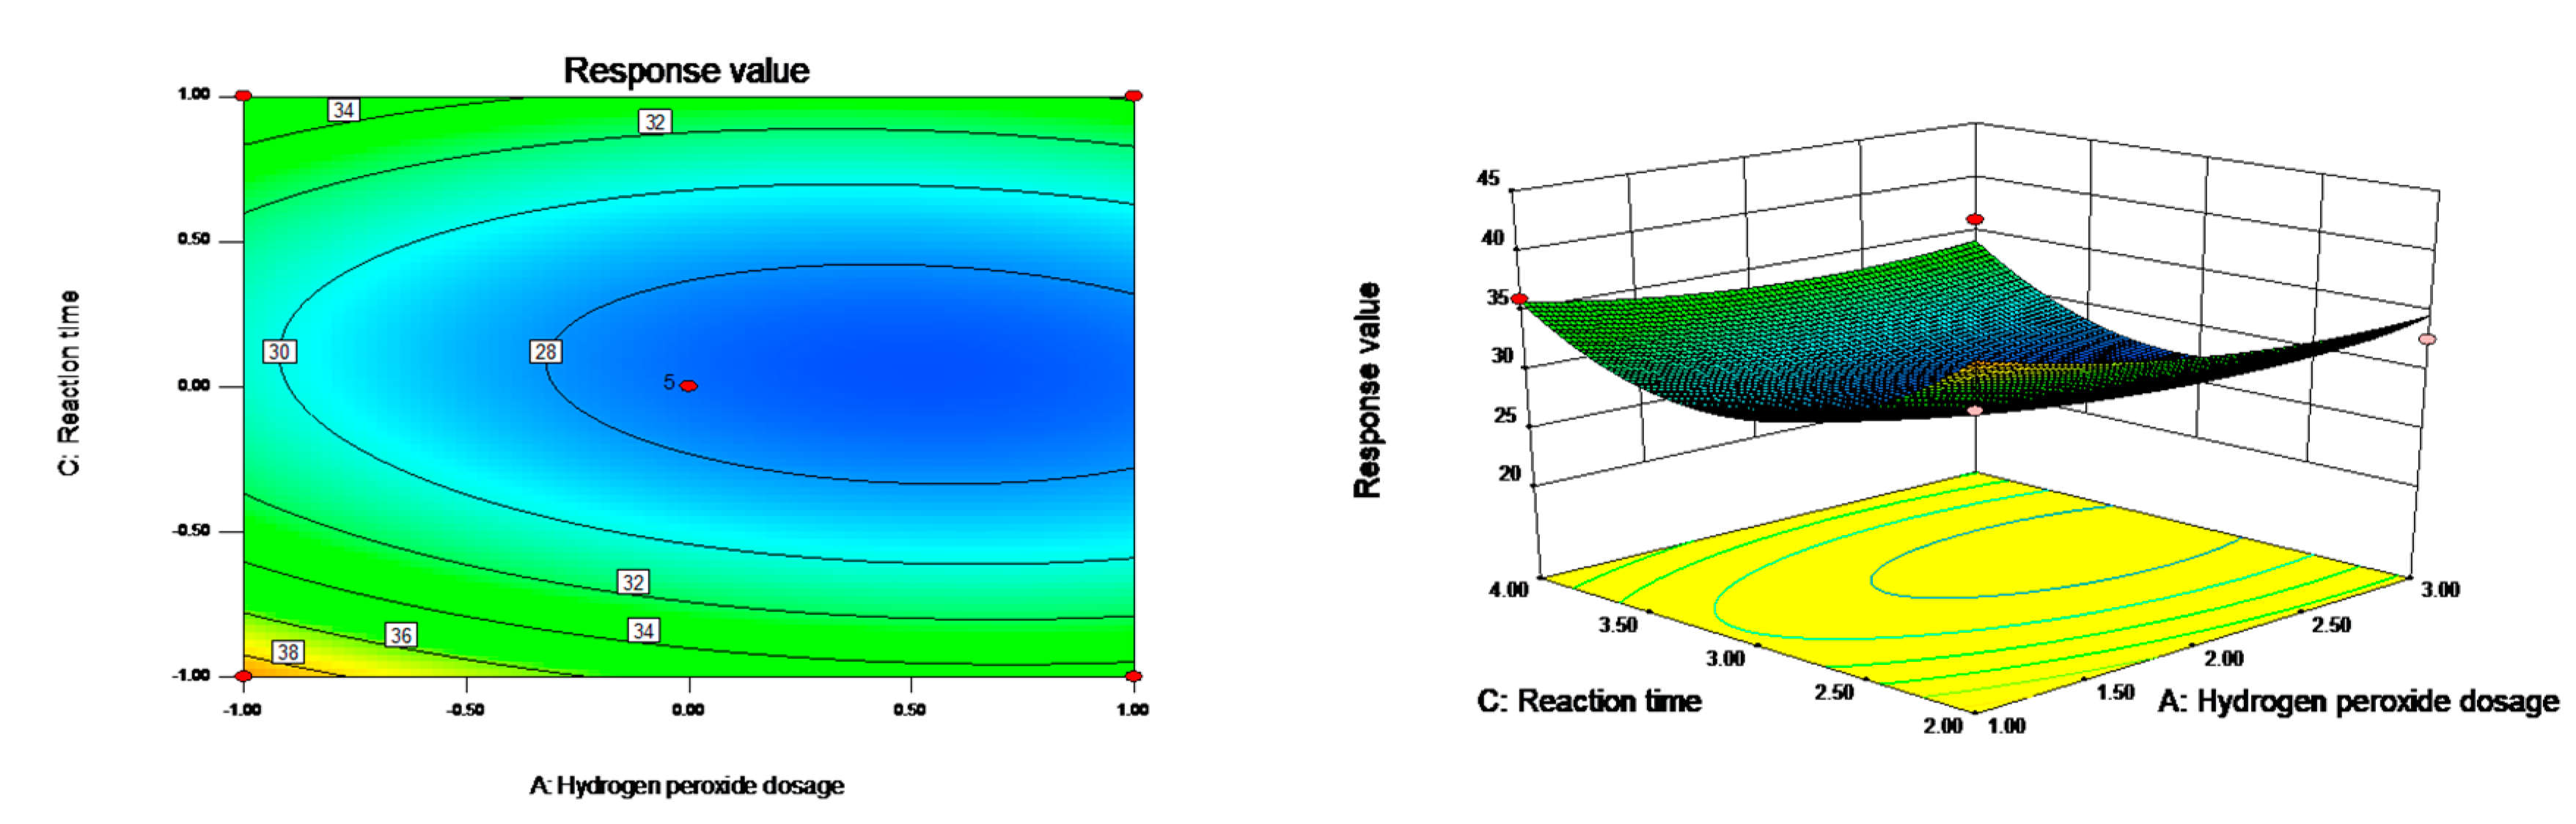
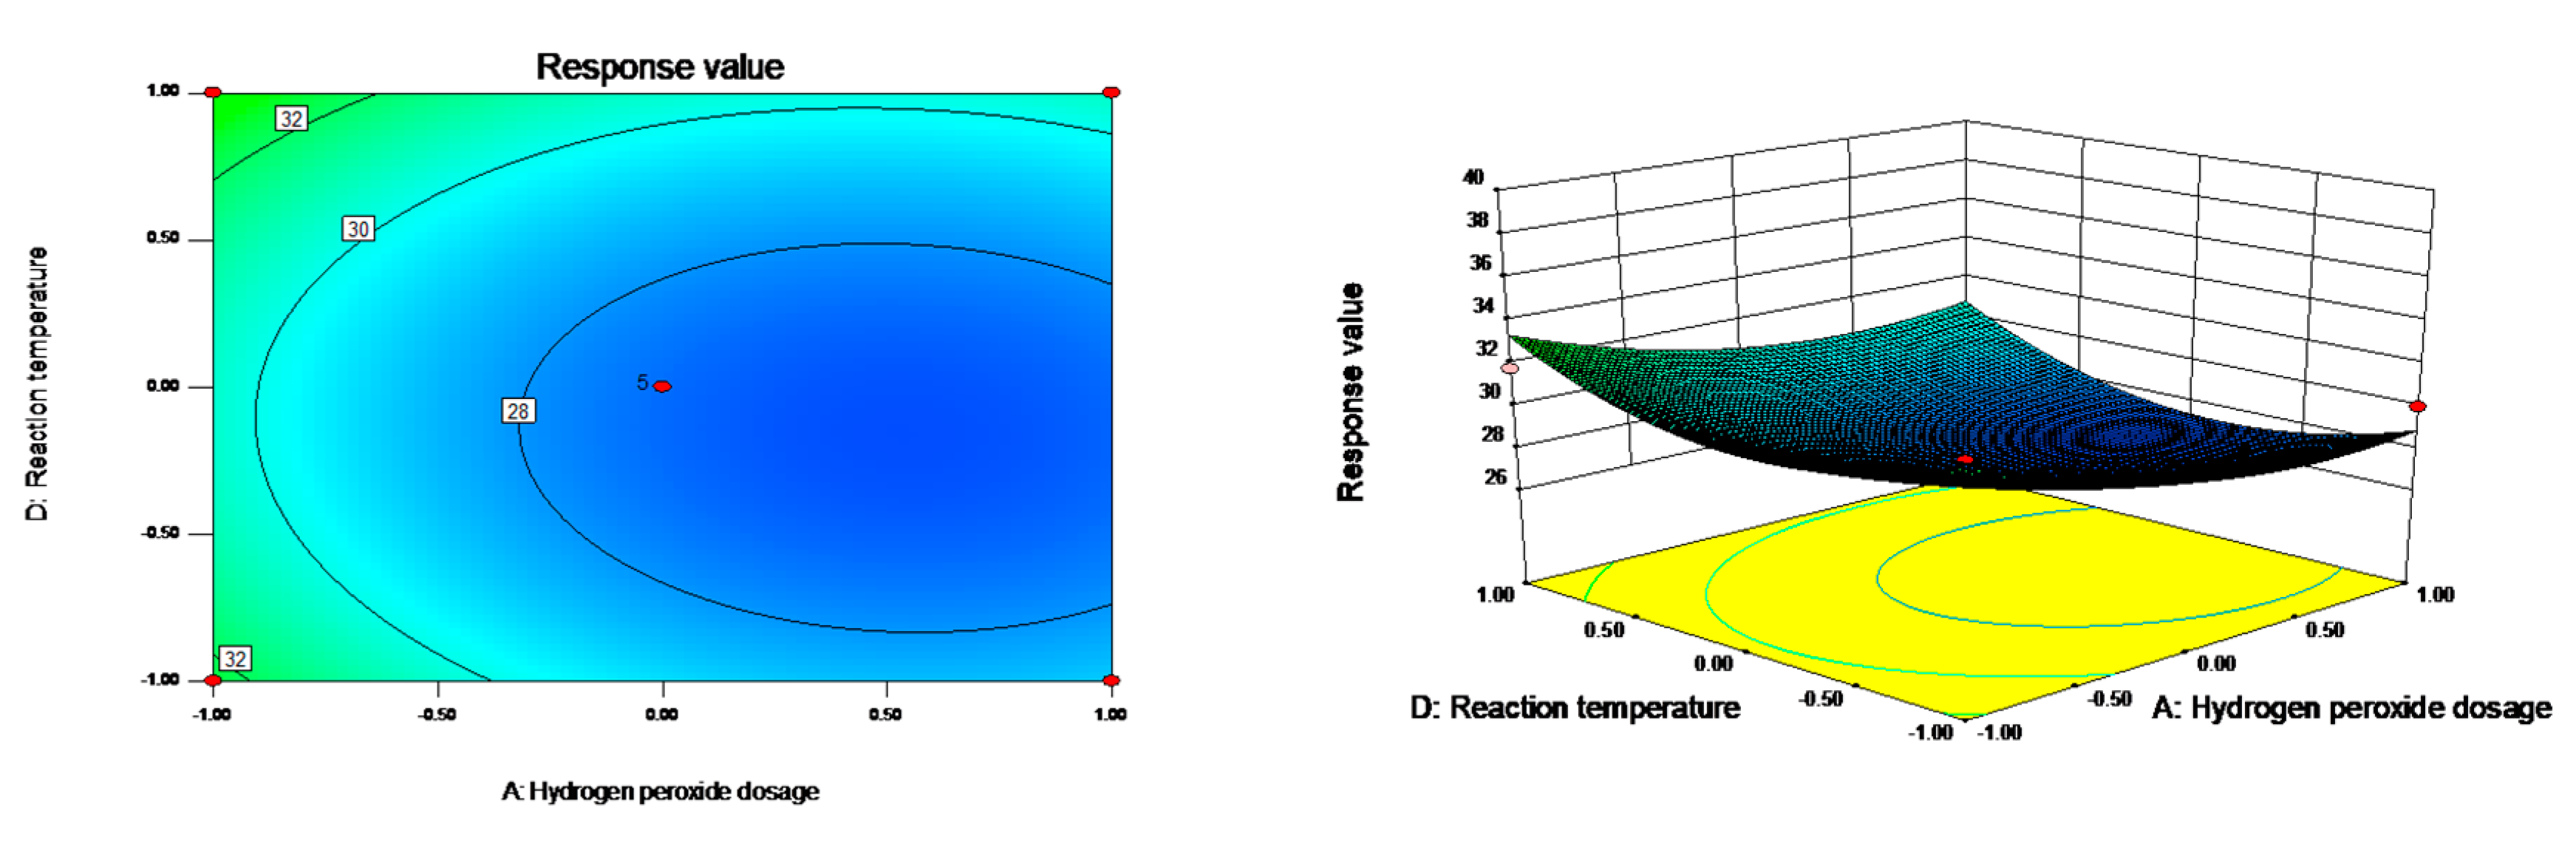
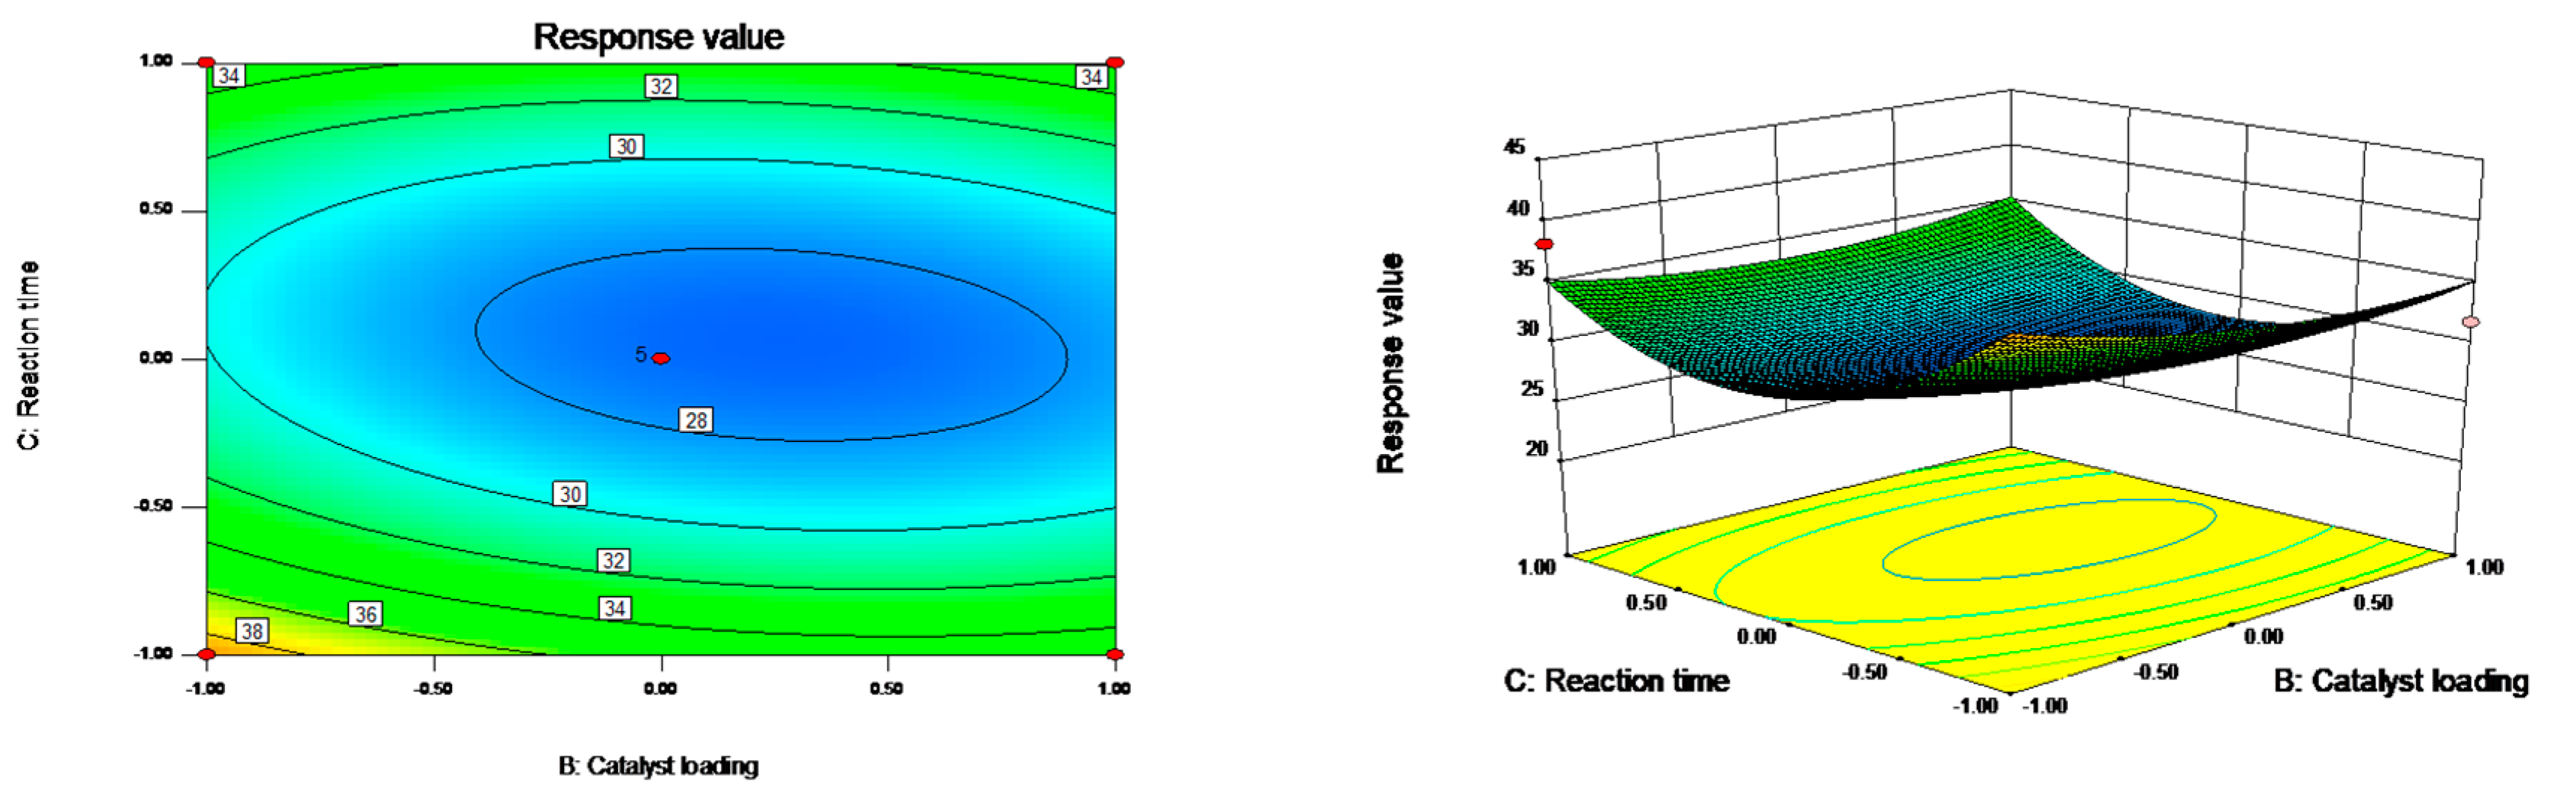
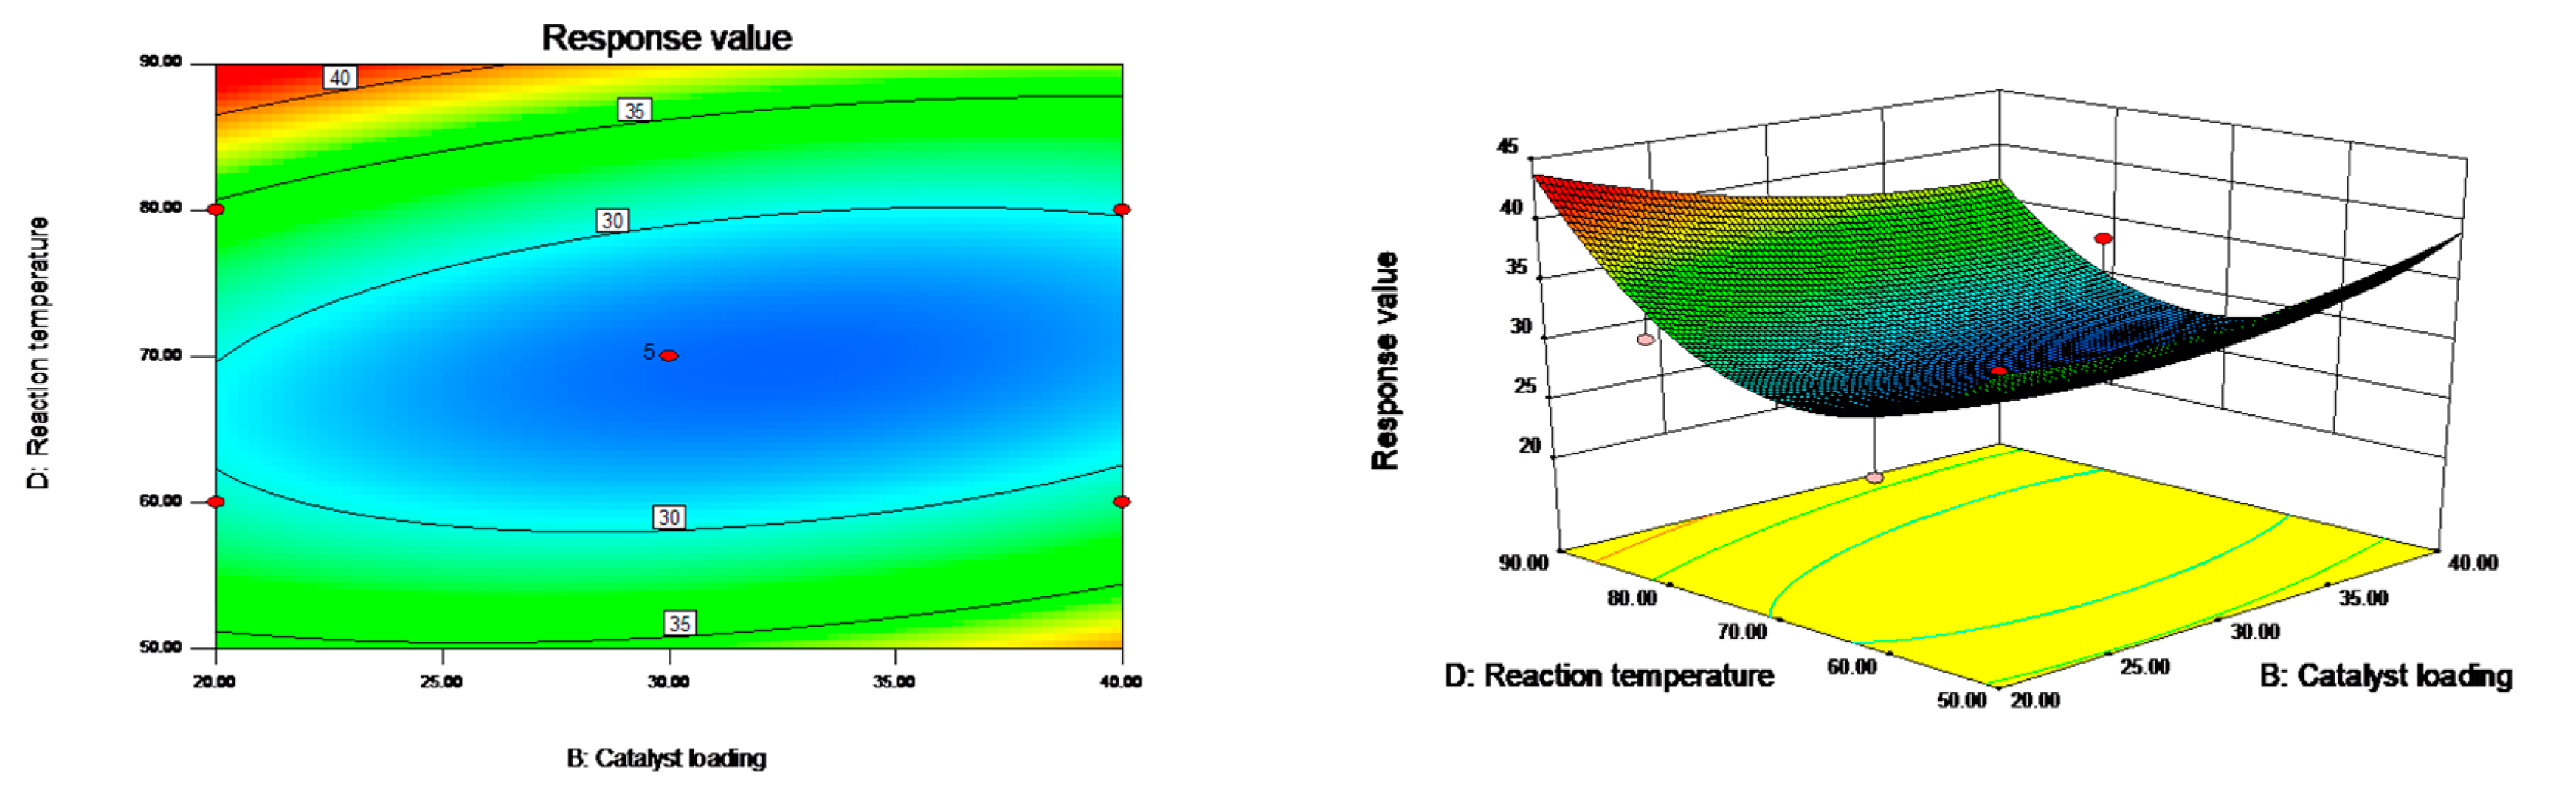
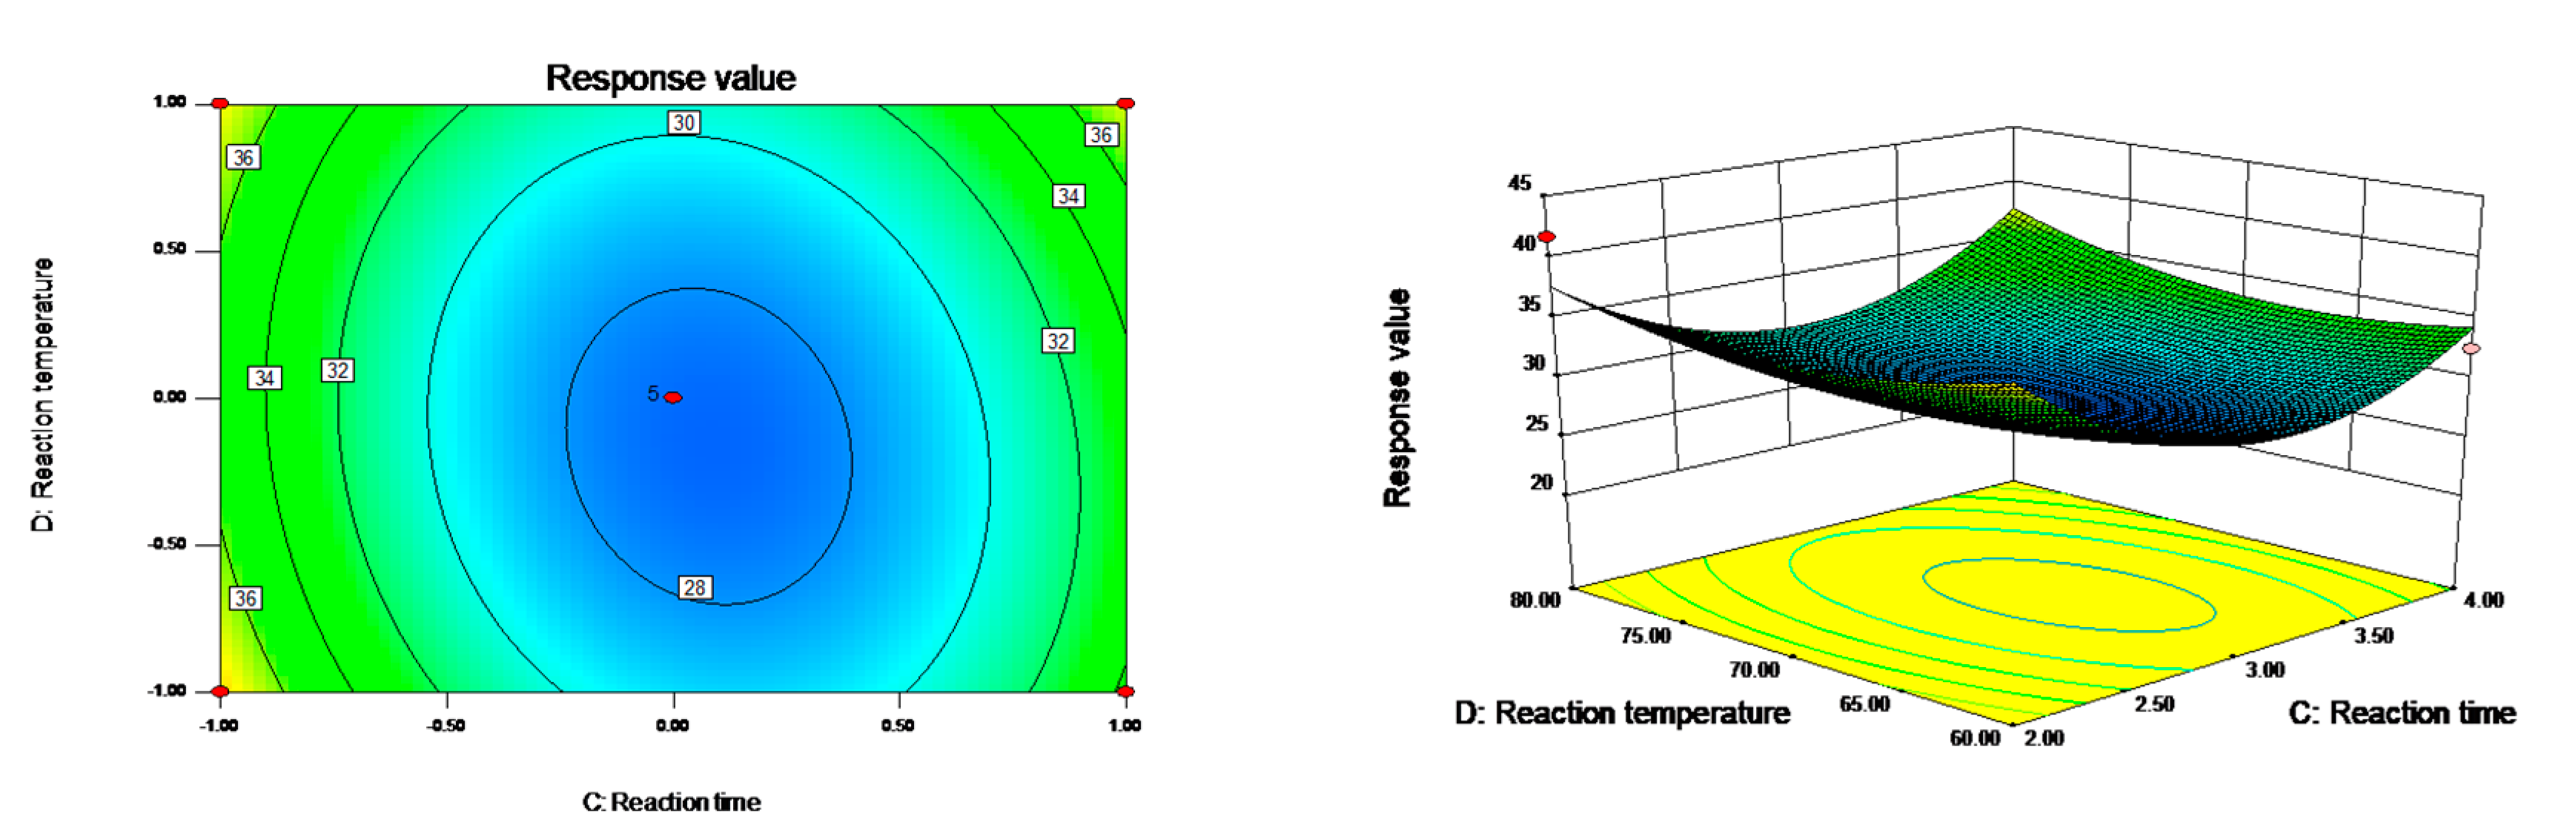
The shape of the contour was an ellipse, which indicates the interaction of factors. However, the circular shape indicated that the interaction was not significant [13]. It can also be seen from Figure 2, Figure 3, Figure 4, Figure 5, Figure 6, Figure 7 that the interactions between reaction temperature and time were significant. The interactions between reaction temperature and hydrogen peroxide dosage, catalyst loading and time on hydrogen peroxide dosage and catalyst loading were not significant.
2.2.4. Best Technology and Reproducibility Experiments
The software was used to solve the partial derivation of the regression equation, and the optimum technological conditions were selected as follows: degradation temperature 69.71 °C, time 3.06 h, the ratios of hydrogen peroxide to hydrogen peroxide 2.39 and catalyst to hydrogen peroxide 28.9%. According to the actual situation, it was revised as follows: degradation temperature 70 °C, time 3.0 h, hydrogen peroxide dosage 2.4, catalyst dosage 30%. Under these conditions, three repeatability experiments were carried out. The average molecular weight of LWCS ranged from 1515 Da to 1564 Da with an average yield of 58.47%. The quality of LWCS was good. Therefore, it could be shown that the model constructed by this experiment fitted well with the actual situation, and the best process obtained was feasible.
2.3. FTIR Spectral Analyses
2.3.1. Infrared Spectrum of Supported PTA
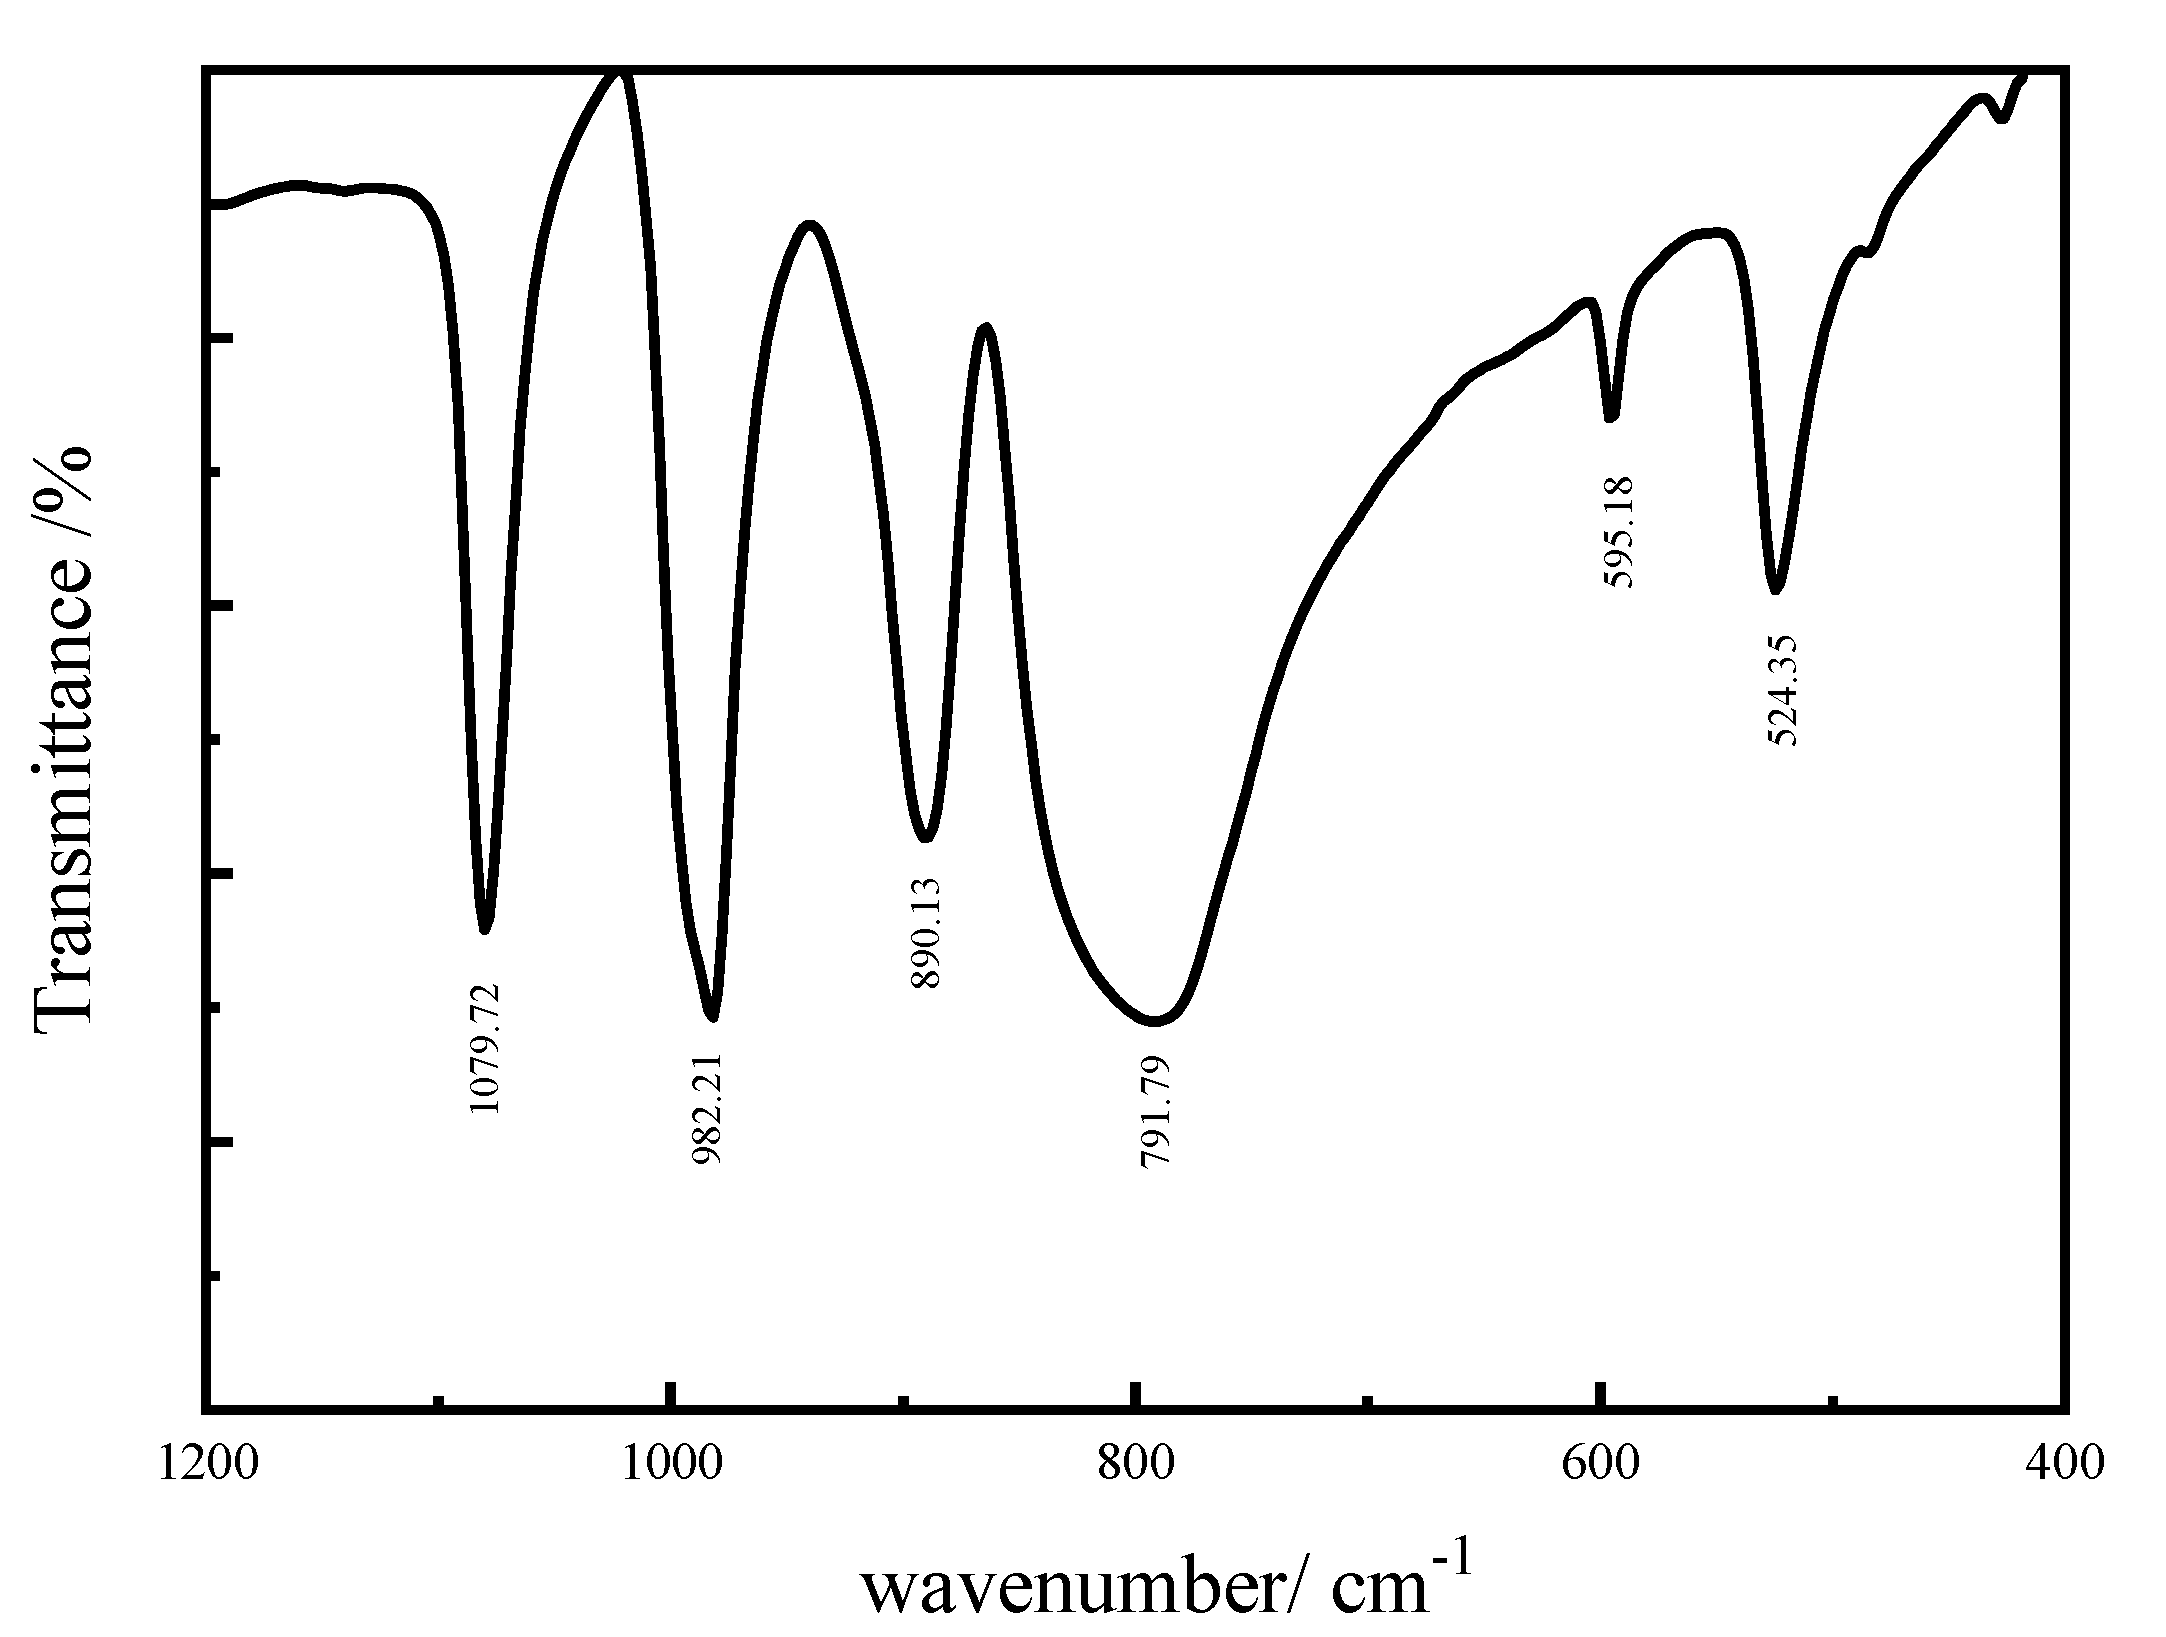
The FTIR spectra of supported PTA catalysts are presented in Figure 8. There were several characteristic absorption peaks of Keggin structure at 500–1100 cm−1 of supported PTA. Its characteristic bands were at 1079.72 cm−1 (P–Oa stretching), 982.21 cm−1 (W=Ot stretching), 890.13 cm−1 (W–Ob stretching), 791.79 cm−1 (W–Oa stretching), 595.18 cm−1 and 524.35 cm−1 (W–Oc stretching), indicating that the Keggin structure of PTA was maintained when it was loaded by activated carbon.
2.3.2. Infrared Spectra of Raw Materials/LWCS
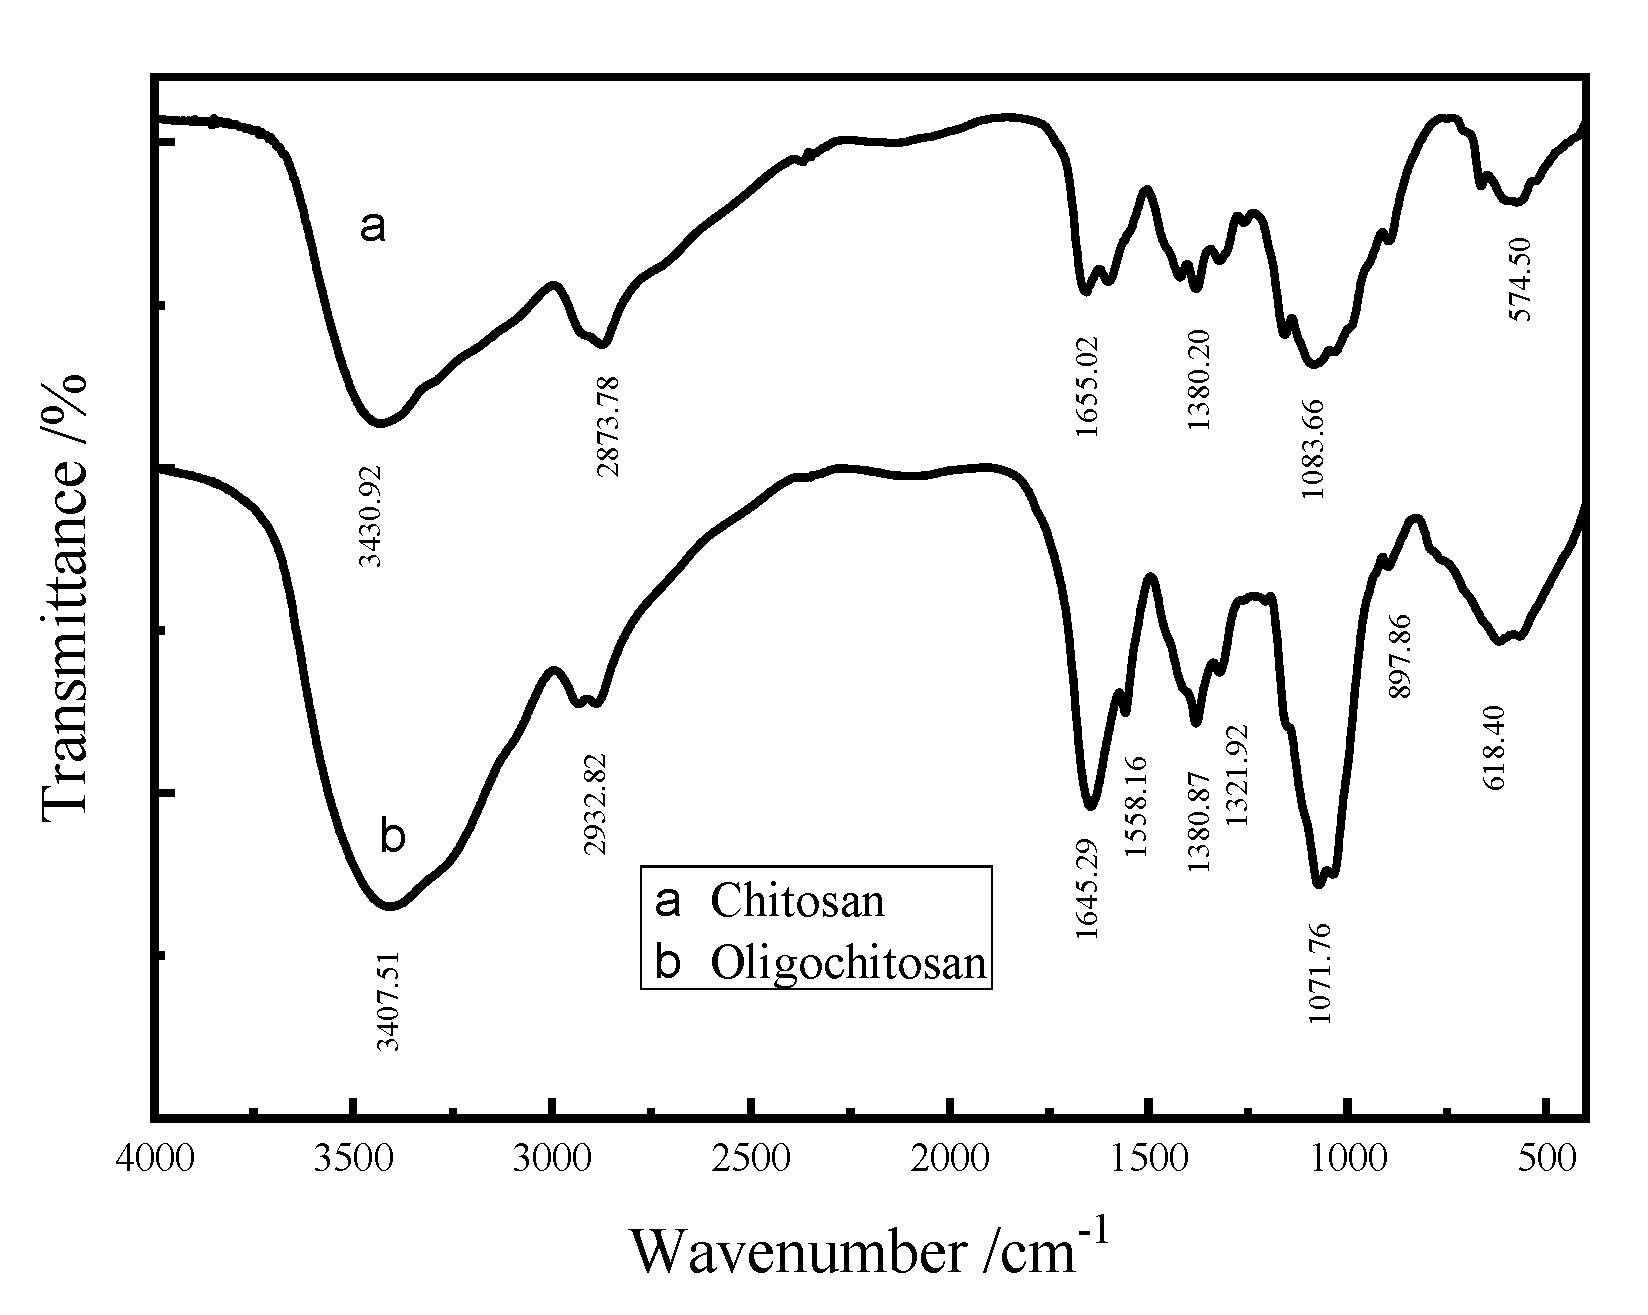
The FT-IR spectrum of Figure 9 shows that the functional group positions of raw chitosan and LWCS had not changed, but the absorption strengths were different. The stretching vibration of ether bond in the pyran ring caused a peak at 1071.76 cm−1, while the characteristic absorption peak of the beta-pyran glycoside bond was at 897.86 cm−1. The peaks at 3250–3500 cm−1 were related to the stretching vibration of –NH and –OH; the peaks at 2800–3000 cm−1 were ascribed to the stretching vibration of –CH, stretching vibration of –CH2 and stretching vibration of –CH3. In addition, there was no absorption peak at 1645–2000 cm−1, indicating that the reaction was carried out by disconnecting the beta–(1,4)–glycoside bond, without carbonyl and carboxyl groups. The above results verified that the molecular structure of chitosan had not changed before and after degradation, and only the molecular weight had been reduced.
2.4. Pore Structure Analysis of Supported PTA Catalyst
Table 3 shows that with the increase of PTA loading, the porosity and pore volume decreased regularly, indicating that PTA molecules had been adsorbed and filled into the pore of activated carbon when the loading was 28.34%, the average pore size of the PTA catalyst was the lowest, and the total pore-specific surface area was relatively large. In addition, as the density of PTA was much higher than that of activated carbon, the apparent density of activated carbon loaded with PTA increased with the increase of loading amount.
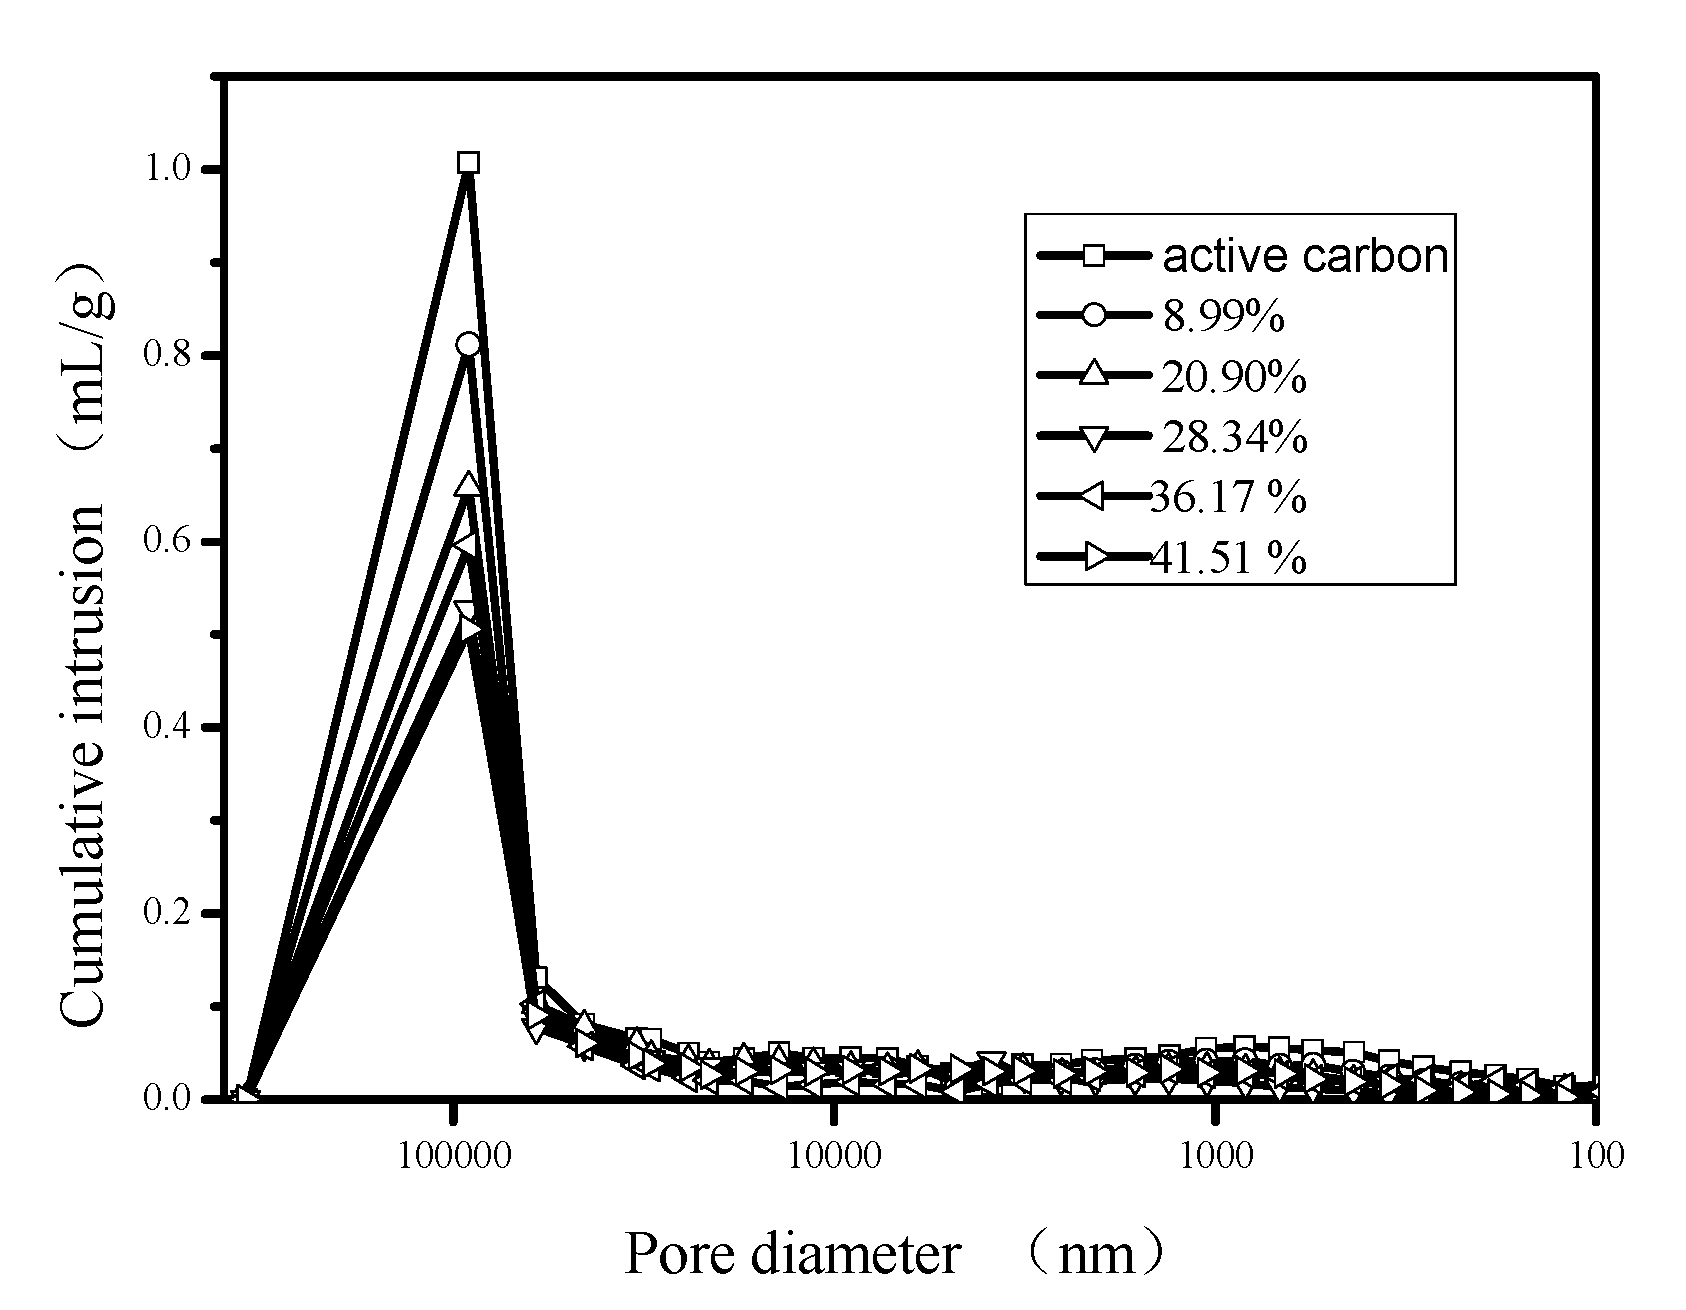
Figure 10 shows that the pore structure of the supported PTA catalyst had not changed under different preparation conditions, and the pore size was mainly distributed at 90 μm. With the increase of loading, the strength of the peak decreased gradually, which was due to the decrease of pore volume of activated carbon caused by PTA immersion in the pore structure of activated carbon.
3. Materials and Methods
3.1. Materials
Chitosan (medium molecular weight, extent of deacetylation 75–85%, Jinan Heidelberg Biopharmaceutical), phosphotungstic acid (PTA) (Tianjin Bodi Chemical Co., Ltd., Tianjin, China), activated carbon (40–60 mesh Tianjin Guangcheng Chemical Reagent Co., Ltd., Tianjin, China) and other chemical reagents such as hydrogen peroxide, silver nitrate, sodium hydroxide and hydrochloric acid were used, and all were analytically pure.
3.2. Preparation of the Activated Carbon-Supported PTA Catalyst
The activated carbon-supported PTA catalyst was prepared by the isovolumetric impregnation method, and the process was improved. A certain amount of activated carbon was soaked with 2 mol/L HCl at room temperature for 24 h, then washed with distilled water to no Cl- (silver nitrate test, no white precipitation formation), dried, sealed and stored for standby. W0 g activated carbon was added to a certain concentration of PTA soaking solution, heated and stirred to reflux for a certain time, then treated with Probe-type Ultrasonic Cell Crusher three times: power 75 Hz, pulse on 2 s, pulse off 4 s, time 3 min. Then, the solution was filtered by a water circulation multifunction vacuum pump. The filter cake was dried to a constant weight and weighed as W1 g. Activated carbon-supported PTA catalysts with different loading can be prepared by controlling the concentration of PTA and the stirring time of reflux heating. The formula for the calculation of loading of supported catalyst is as follows:
where W0—quantity of activated carbon, g; W1—quantity of filter cake, g.
Catalyst loading% = (W1 − W0)/W1 × 100%
3.3. Preparation of Low Molecular Weight Chitosan
Two grams of chitosan was put into a conical flask and combined with PTA, water and 30% (wt%) H2O2 aqueous solution. The solution was stirred at a certain temperature, and the recording time was started at the same time. After the reaction, the solution was filtrated, the collected liquid was adjusted with NaOH until reaching pH 9–10, and then the filtrate was distilled under reduced pressure. Calculation of water-soluble chitosan yield is as follows:
where Y—yield, %; M0—raw material chitosan quantity, g; Mx—the quantity of oligochitosan obtained, g.
Y(%) = Mx/M0 × 100%
3.4. Determination of Average Molecular Weight of Chitosan
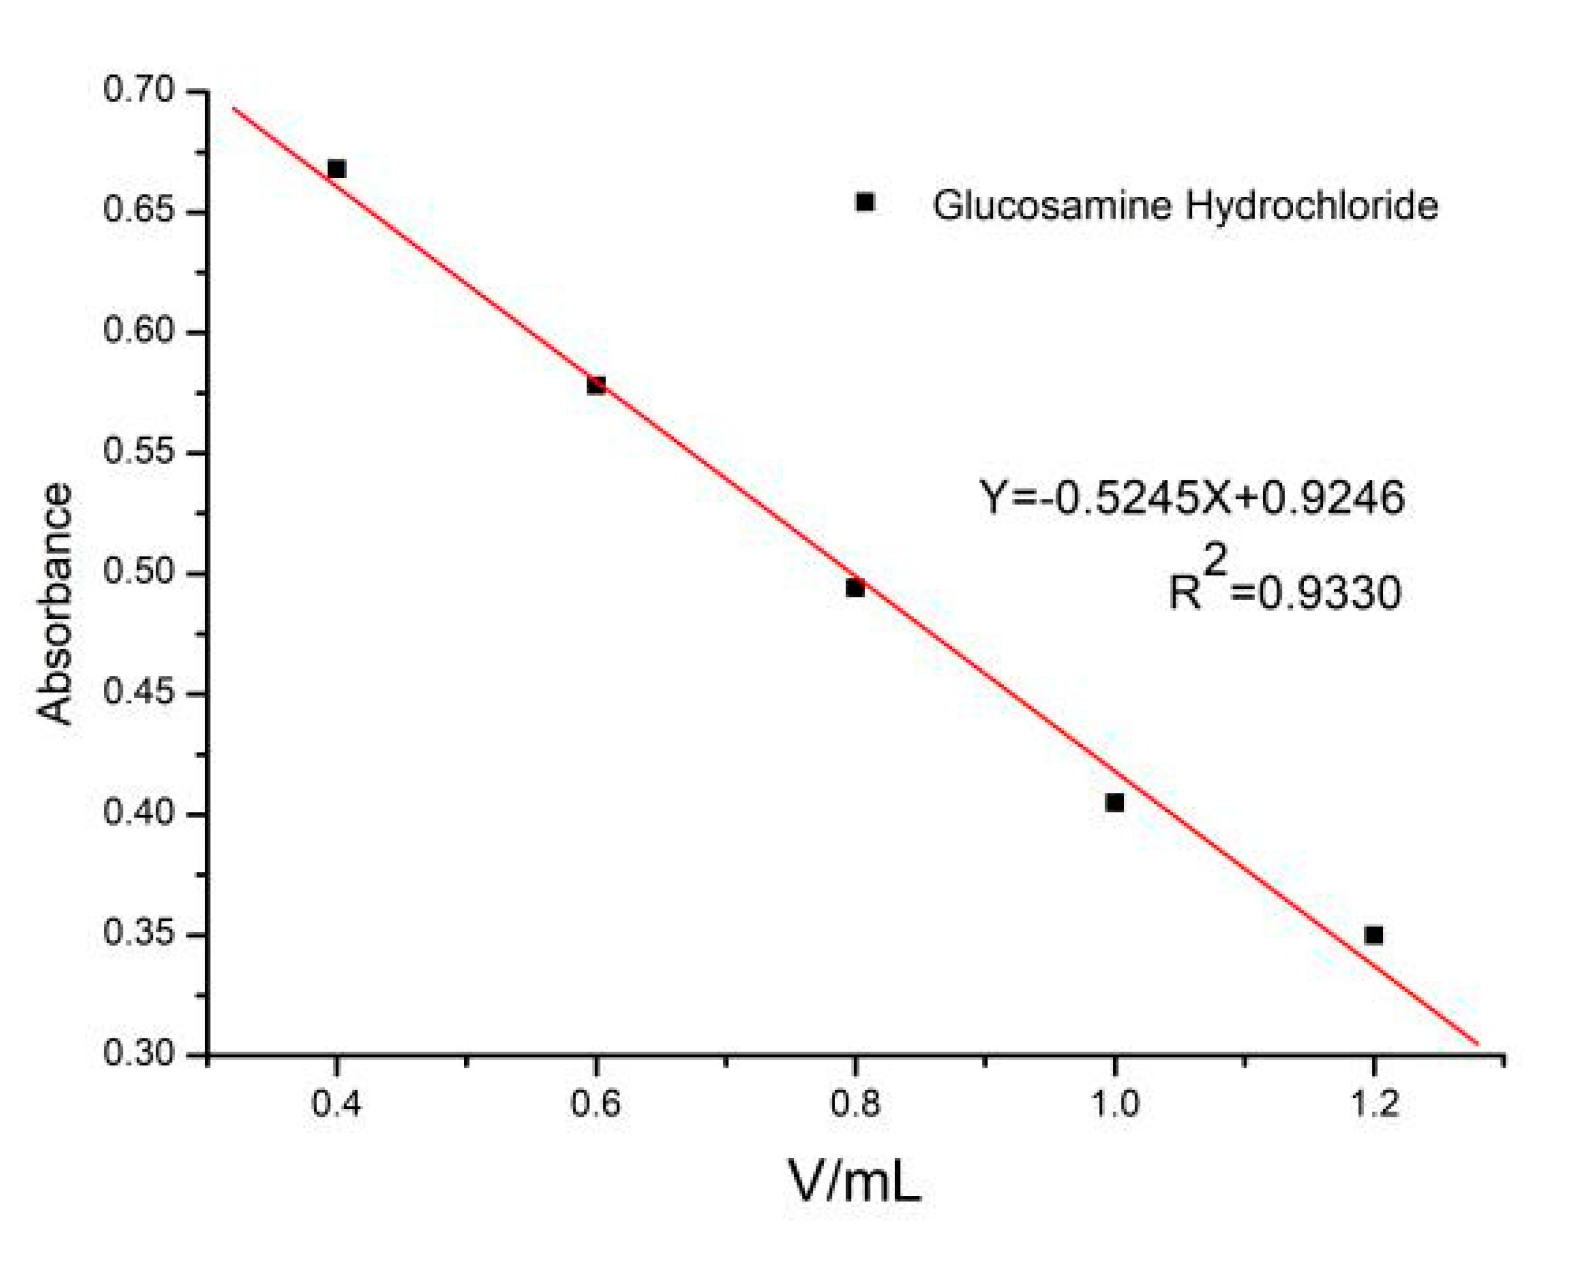
The average molecular weight of chitosan was determined by end-group analysis. A certain concentration of glucosamine hydrochloride was used as the standard solution. The absorbance of the standard solution was measured at 420 nm wavelength, and the standard curve was drawn as shown in Figure 11. Then, a certain concentration of chitosan solution was prepared, and the absorbance of chitosan was determined by repeating the steps mentioned above. The volume of the reference solution corresponding to the absorbance of the product chitosan solution was determined by the standard curve. The average molecular weight of chitosan was calculated according to the following formula.
where Mn—average molecular weight of chitosan; Csample—concentration of chitosan solution, g/mL; Vsample—volume of chitosan solution, mL; Cbaseline—concentration of glucosamine hydrochloride solution, g/mL; Vbaseline—volume of glucosamine hydrochloride solution, mL; Mbaseline—molecular weight of glucosamine hydrochloride, 216.5 g/mol.
Mn = (Csample × Vsample/Cbaseline × Vbaseline) × Mbaseline
3.5. Single-Factor Experiment
The effects of the PTA catalyst, hydrogen peroxide amount, catalyst amount, degradation temperature and degradation time on the degradation of chitosan were investigated, with the yield and average molecular weight of chitosan as indicators. The fixed parameters were as follows: the loading of the PTA catalyst was 28.34%, the ratio of hydrogen peroxide to chitosan was 2, the ratio of catalyst to hydrogen peroxide was 0.02, the degradation temperature was 70 ℃ and the degradation time was 3 h.
3.6. Response Surface Experiment
Based on the results of the single-factor experiment, the response surface experiment was designed by selecting four factors: hydrogen peroxide dosage (A), catalyst loading (B), reaction time (C) and reaction temperature (D). The response surface was optimized by using the ratio of the average molecular weight of chitosan product to the yield (Y1%). The factor levels were −1, 0 and 1. The factor levels are shown in Table 4.
3.7. Fourier Transform Infrared Spectrometer (FT-IR)
The appropriate amount of supported PTA catalyst, chitosan and low molecular weight chitosan (LWCS) samples were respectively mixed with 100 mg KBr, and the thin films were prepared by a pressing method. Then, the samples were analyzed by a Bruker Tensor-27 Fourier Transform Infrared Spectrometer (TENSOR, Germany) at wavelengths in the range of 400–4000 cm−1.
3.8. Mercury Intrusion Porosimetry (MIP)
The AutoPore IV 9500 mercury porosimeter produced by the Mike Company of America was used to measure the pore size of PTA with different loading samples ranging from 0 to 420,000 nm (about 5 mm in diameter, 25 °C). Then, the sample was placed into the instrument for the experiments, and finally, the relevant parameters of the pore of the PTA sample were obtained.
4. Conclusions
The efficiency of the supported PTA catalyst was significantly higher than that of a non-supported catalyst. The optimum reaction conditions of degradation of high molecular weight chitosan by the catalyzed oxidation of hydrogen peroxide were obtained as follows: the reaction temperature 70 °C, the reaction time 3.0 h, the ratio of hydrogen peroxide to chitosan 2.4 and catalyst loading 30%. The yield and molecular weight of water-soluble chitosan were 62.8% and 1290 Da, respectively. The quadratic equation simulation was obtained. The simulation regression was significant, and the experiment was well fitted, which had a certain value.
The pore structure of the supported PTA catalyst did not change under different preparation conditions, and the pore size was mainly distributed at 90 μm. The supported PTA catalyst maintained high catalytic activity after three reuses, which indicated that the supported PTA catalyst had excellent catalytic activity and stable performance compared with the PTA catalyst. This shows a new process for effectively preparing water-soluble chitosan that meets the requirements of green chemistry.
Author Contributions
H.Z., Z.M., Y.M., H.W., R.Z., X.Z., Y.S.: Conceived and designed the experiments; Performed the experiments; Analyzed and interpreted the data; Contributed reagents, materials, analysis tools or data; Wrote the paper; Literature search; Figures. All authors have read and agreed to the published version of the manuscript.
Funding
This research received no external funding.
Acknowledgments
The authors are grateful for the support for this work provided by the People’s Livelihood Science and Technology Project of Qingdao (18-6-1-82-nsh).
Conflicts of Interest
The authors declare no conflict of interest.
References
- Kim, I.Y.; Seo, S.J.; Moon, H.S. Chitosan and its derivatives for tissue engineering applications. J. Biotechnol. Adv. 2008, 26, 1–21. [Google Scholar] [CrossRef] [PubMed]
- Jayakumar, R.; Prabaharan, M.; Kumar, P.S.; Nair, S.V.; Tamura, H. Biomaterials based on chitin and chitosan in wound dressing applications. J. Biotechnol. Adv. 2011, 29, 322–337. [Google Scholar] [CrossRef] [PubMed]
- Hamed, I.; Özogul, F.; Regenstein, J.M. Industrial applications of crustacean by-products (chitin, chitosan, and chitooligosaccharides): A review. J. Trends Food Sci. Technol. 2016, 48, 40–50. [Google Scholar] [CrossRef]
- Yang, Z.; Fang, Y.; Ji, H. Controlled release and enhanced antibacterial activity of salicylic acid by hydrogen bonding with chitosan. J. Chin. J. Chem. Eng. 2016, 24, 421–426. [Google Scholar] [CrossRef]
- Shen, K.T.; Chen, M.H.; Chan, H.Y. Inhibitory effects of chitooligosaccharides on tumor growth and metastasis. J. Food Chem. Toxicol. 2009, 47, 1864–1871. [Google Scholar] [CrossRef] [PubMed]
- Huang, S.; Han, B.; Shao, K. Analgesis and wound healing effect of chitosan and carboxymethyl chitosan on scalded rats. J. Ocean Univ. China 2014, 13, 837–841. [Google Scholar] [CrossRef]
- Yuan, X.B.; Zheng, J.P.; Jiao, S.M.; Cheng, G.; Feng, C. A review on the preparation of chitosan oligosaccharides and application to human health, animal husbandry and agricultural production. J. Carbohydr. Polym. 2019, 220, 60–70. [Google Scholar] [CrossRef] [PubMed]
- Qin, C.Q.; Xiao, L.; Du, Y.M. Prediction and control of extent of deploymerization of chitosan by hydroperoxide. J. Wu Han Univ. J. (Nat. Sci. Ed.) 2000, 46, 195–198. [Google Scholar]
- Liu, Y.J.; Lou, C.Y.; Hou, Z.M.; Feng, Y.F. Process of Chitosan Oxide Degradation by Hydrogen Peroxide in Acetic Acid Homogeneous Phase. J. Funct. Polym. 2007, 19, 426–430. [Google Scholar]
- Zhao, Z.K.; Li, Z.S.; Wang, G.R.; Qiao, W.H.; Cheng, L.B. Heteropoly Acids Catalysts and Their Application in the Synthesis of Fine Chemicals. J. Prog. Chem. 2004, 16, 620–630. [Google Scholar]
- Wang, G.L.; Li, S.B.; Liu, J.L. Recent progress on heteropoly acid and its spurrort catalyst. J. Pet. Refin. Eng. 2002, 32, 46–51. [Google Scholar]
- Huang, Q.Z.; Wang, S.M.; Huang, J.F. Study on the heterogeneous degradation of chitosan with hydrogen peroxide under the catalysis of phosphotungstic acid. J. Carbohydr. Polym. 2007, 68, 761–765. [Google Scholar] [CrossRef]
- Xian, L.M.; Guo, H.C.; Jin, H. Discussion on Determination of Relative Number Average Molecular Weight of Chitosan-Oligosaccharide by Terminal Group Analysis Method. J. Ocean Univ. Qingdao 2005, 1, 142–144. [Google Scholar]
Figure 1.
Effects of different factors on the degradation of chitosan. (A) Mass ratio of phosphotungstic acid to chitosan. (B) Mass ratio of phosphotungstic acid to chitosan. (C) Loading of phosphotungstic acid. (D) Dosage of hydrogen peroxide. (E) Mass ratio of phosphotungstic acid to chitosan. (F) degradation temperature. (G) degradation time. (H) Repeated use of supported phosphotungstic.


Figure 2.
Effect of hydrogen peroxide dosage and loading rate on catalytic efficiency.

Figure 3.
Effect of hydrogen peroxide dosage and reaction time on catalytic efficiency.

Figure 4.
Effect of hydrogen peroxide dosage and reaction time on catalytic efficiency.

Figure 5.
Effect of load and reaction time on catalytic efficiency.

Figure 6.
Effect of load and reaction temperature on catalytic efficiency.

Figure 7.
Effect of reaction time and temperature on catalytic efficiency.

Figure 8.
FT-IR spectrum of the supported PTA catalyst.

Figure 9.
FT-IR spectrum for chitosan/LWCS.

Figure 10.
The cumulative intrusion vs. the pore diameter of active carbon under different loading.

Figure 11.
Different concentrations of glucosamine hydrochloride corresponding to absorbance.


Table 1.
Design and result of Box–Behnken design.
| Laboratory No. | Hydrogen Peroxide Dosage (A) | Catalyst Loading (B)/% | Reaction Time (C)/h | Reaction Temperature (D)/°C | Response Value (Y)% |
|---|---|---|---|---|---|
| 1 | −1 | 0 | 1 | 0 | 36.1 |
| 2 | 1 | −1 | 0 | 0 | 29.7 |
| 3 | 0 | 0 | 0 | 0 | 27.4 |
| 4 | −1 | 0 | 0 | 1 | 31.8 |
| 5 | 0 | 0 | −1 | −1 | 41.7 |
| 6 | 0 | −1 | 0 | −1 | 25.7 |
| 7 | 0 | 1 | −1 | 0 | 31.8 |
| 8 | 0 | 1 | 0 | 1 | 33.2 |
| 9 | 0 | 0 | −1 | 1 | 41.7 |
| 10 | 0 | 1 | 1 | 0 | 33.4 |
| 11 | 0 | −1 | 1 | 0 | 38.2 |
| 12 | 0 | −1 | 0 | 1 | 32.2 |
| 13 | 1 | 0 | −1 | 0 | 32.7 |
| 14 | −1 | 1 | 0 | 0 | 32.1 |
| 15 | 1 | 1 | 0 | 0 | 29.4 |
| 16 | 0 | 0 | 0 | 0 | 27.4 |
| 17 | 0 | 0 | 0 | 0 | 27.4 |
| 18 | 0 | 0 | 0 | 0 | 27.4 |
| 19 | 0 | 1 | 0 | −1 | 31.7 |
| 20 | −1 | 0 | 0 | −1 | 33.8 |
| 21 | 0 | 0 | 1 | −1 | 32.5 |
| 22 | 0 | 0 | 0 | 0 | 27.4 |
| 23 | 0 | −1 | −1 | 0 | 40.7 |
| 24 | 0 | 0 | 1 | 1 | 36.3 |
| 25 | 1 | 0 | 0 | −1 | 30 |
| 26 | 1 | 0 | 1 | 0 | 36.1 |
| 27 | −1 | −1 | 0 | 0 | 36 |
| 28 | 1 | 0 | 0 | 1 | 28.9 |
| 29 | −1 | 0 | −1 | 0 | 35.4 |
Table 2.
Analysis of variance for the regression equation.
| Source | Squares | df | Square | F-Value | Prob > F |
|---|---|---|---|---|---|
| Model | 408.27 | 14 | 29.16 | 2.95 | 0.0261 |
| A | 28.21 | 1 | 28.21 | 2.85 | 0.1134 |
| B | 9.90 | 1 | 9.90 | 1.0 | 0.3341 |
| C | 10.83 | 1 | 10.83 | 1.09 | 0.3132 |
| D | 6.31 | 1 | 6.31 | 0.64 | 0.4380 |
| AB | 3.24 | 1 | 3.24 | 0.33 | 0.5762 |
| AC | 1.82 | 1 | 1.82 | 0.18 | 0.6743 |
| AD | 0.20 | 1 | 0.20 | 0.020 | 0.8883 |
| BC | 4.20 | 1 | 4.20 | 0.42 | 0.5251 |
| BD | 6.25 | 1 | 6.25 | 0.63 | 0.4400 |
| CD | 3.61 | 1 | 3.61 | 0.36 | 0.5555 |
| A2 | 14.68 | 1 | 14.68 | 1.48 | 0.2434 |
| B2 | 20.25 | 1 | 20.25 | 2.05 | 0.1745 |
| C2 | 325.07 | 1 | 325.07 | 32.85 | <0.0001 |
| D2 | 38.67 | 1 | 38.67 | 3.91 | 0.0681 |
| Residual | 138.52 | 14 | 9.89 | ||
| Lack of Fit | 138.52 | 10 | 13.85 | ||
| Pure Error | 0.32 | 4 | 0.054 | ||
| Cor Total | 546.80 | 28 |
Table 3.
Active carbon pore parameters obtained from the MIP under different loading.
| Loadings | Porosity | Average Pore Size (nm) | Total Pore Volume (mL/g) | Total Hole Specific Surface Area (m2/g) | Apparent Density (g/mL) |
|---|---|---|---|---|---|
| activated carbon | 51.23% | 1275.6 | 0.7375 | 676.9 | 1.42 |
| 8.99% | 47.30% | 9893.3 | 0.5845 | 784.6 | 1.53 |
| 20.90% | 43.58% | 6336.7 | 0.4901 | 821.2 | 1.58 |
| 28.34% | 39.27% | 759.3 | 0.3889 | 890.1 | 1.66 |
| 36.17% | 27.71% | 4928.6 | 0.4314 | 734.6 | 1.70 |
| 41.51% | 40.96% | 8667.6 | 0.3870 | 643.9 | 1.79 |
Table 4.
Response surface experimental design factors and levels.
| Level | Hydrogen Peroxide Dosage (A) | Catalyst Loading (B)/% | Reaction Time (C)/h | Reaction Temperature (D)/°C |
|---|---|---|---|---|
| −1 | 1 | 20% | 2 | 60 |
| 0 | 2 | 30% | 3 | 70 |
| 1 | 3 | 40% | 4 | 80 |
© 2020 by the authors. Licensee MDPI, Basel, Switzerland. This article is an open access article distributed under the terms and conditions of the Creative Commons Attribution (CC BY) license (http://creativecommons.org/licenses/by/4.0/).
Share and Cite
MDPI and ACS Style
Zhang, H.; Ma, Z.; Min, Y.; Wang, H.; Zhang, R.; Zhang, X.; Song, Y. Catalytic Degradation of Chitosan by Supported Heteropoly Acids in Heterogeneous Systems. Catalysts 2020, 10, 1078. https://doi.org/10.3390/catal10091078
AMA Style
Zhang H, Ma Z, Min Y, Wang H, Zhang R, Zhang X, Song Y. Catalytic Degradation of Chitosan by Supported Heteropoly Acids in Heterogeneous Systems. Catalysts. 2020; 10(9):1078. https://doi.org/10.3390/catal10091078
Chicago/Turabian StyleZhang, Hang, Zhipeng Ma, Yunpeng Min, Huiru Wang, Ru Zhang, Xuecheng Zhang, and Yimin Song. 2020. "Catalytic Degradation of Chitosan by Supported Heteropoly Acids in Heterogeneous Systems" Catalysts 10, no. 9: 1078. https://doi.org/10.3390/catal10091078
Note that from the first issue of 2016, this journal uses article numbers instead of page numbers. See further details here.