

Payment Systems, Supplier-Induced Demand, and Service Quality in Credence Goods: Results from a Laboratory Experiment

Faculty of Social Sciences, Tampere University, Kanslerinrinne 1, 33014 Tampere, Finland
*
Author to whom correspondence should be addressed.
Games 2023, 14(3), 46; https://doi.org/10.3390/g14030046
Submission received: 6 April 2023
/
Revised: 23 May 2023
/
Accepted: 29 May 2023
/
Published: 31 May 2023
(This article belongs to the Special Issue Competition, Coordination, and Cooperation: Theory and Evidence)
Abstract
:This experiment examines the relationship between payment systems and the quality and quantity of services provided in credence goods markets. By using a real-effort task to stimulate the decision making of service providers, the study finds that payment systems do indeed have an impact on service provision. Specifically, providers in fee-for-service systems over-provide, while those in salary systems under-provide services. Additionally, there is a lack of alignment between the services provided under fee-for-service and the actual needs of customers, resulting in a substantial loss of customer benefits under fee-for-service in comparison to under salary. The study also finds that providers in fee-for-service systems perform more faulty tasks than those in salary, indicating that they may prioritize quantity over quality in their services. As for insurance, the results of this study show no significant effect of insurance on the number of services provided; however, customers without insurance received significantly more faulty tasks. Based on these results, the study concludes that payment systems play an important role in determining the quality and quantity of services provided in credence goods markets. Overall, this study highlights the need for a better alignment between customer needs and services provided under fee-for-service systems.
1. Introduction
From the perspective of economics, car repairs, financial advice, tech support, and medical services have one thing in common. In these markets, consumers rely heavily on the reputation or expertise of the supplier providing goods and services. These types of services are referred to as credence goods. Credence goods are specialized services with inherent uncertainty, making it challenging for consumers to assess the quality of services provided, even after consuming it [1]. In such markets, suppliers/providers have the advantage of information and knowledge, which could be used to increase the utilization of services by customers, even beyond what the customer needs, a phenomenon known as supplier-induced demand [2]. In such markets, the intersection between supplier-induced demand and payment systems, such as fee-for-service (FFS) and salary-based systems, can significantly impact providers’ behavior and the quality/quantity of services provided. In this study, we use a controlled laboratory setting to study the impact of different payment systems on supplier-induced demand in credence goods markets. We specifically aim to identify the effect payment systems, mainly fee-for-service and salary, have on the quantity and the quality of care provided by experts.
The inherent information asymmetries in credence goods markets make certain inefficiencies unavoidable. These include overtreatment (experts provide more goods and services than required), undertreatment (experts provide fewer goods and services than required) and overcharging (charging for a higher quality than the goods and services provided) [3,4]. This experiment focuses on unpacking the connection between payment systems and the first two types of inefficiencies: overtreatment and undertreatment.
Payment systems are likely to impact the types of inefficiencies that arise from a credence good problem. The literature is rife with examples [3,5]. We investigate arguments regarding responses to two payment types—salary and fee-for-service—in this study. The literature on credence goods and contract theory argues that providers in a salary system may under-provide services or provide inferior-quality services due to the lack of financial incentives [6,7]. In this type of system, providers receive a fixed salary regardless of the number of services they provide, which may reduce their motivation to provide services to their fullest extent, particularly when the effort is costly. Providers have no financial incentive to increase the number of services or the quality of services they provide, as their salary is not directly tied to their output. Additionally, in a salary system, providers may have limited flexibility in the services they can provide, as their scope of services is defined by the salary agreement. This can result in a reduction in the quality of services provided, as providers may not have the ability to tailor their services to meet the needs of individual consumers. Hart, Shleifer, & Vishny [7] argue that providers in a salaried system have little incentive to engage in activities that could either enhance efficiency or reduce costs. Arrow [8], however, argues that doctors care about their patients and often work hard, despite the effort costs for treating them.
Arrow’s observations highlight a key source of interest for us. Arrow [8] notes that doctors are agents for themselves (or for the companies that hire them) but, given the context, also agents for the patients. This dual-agent role can incentivize them to forgo their own profits if pursuing them would undermine the health outcome of the patient. Arrow notes that some doctors will even charge nothing for patients who cannot afford to pay for services. The potential life-or-death aspect of healthcare seemingly puts it into a separate category in credence goods. As described below, numerous experimental results show that subjects that make decisions with a medical framing tend to be more patient-oriented and less profit-oriented than those who see neutral framing. Similarly, medical students tend to be less profit-oriented than non-medical students. To the best of our knowledge, economic lab experiments investigating the interplay between credence goods markets and payment systems have exclusively focused on the healthcare markets, with the exception of Bejanaro et al. [9]. Such experiments, even when conducted with a neutral framing and a general subject pool, have been interpreted in the context of healthcare. This emphasis on healthcare is due to the unique characteristics of credence goods in the healthcare sector and the significant impact payment systems can have on provider behavior and patient outcomes. On the other hand, lab experiments investigating general credence goods tend to emphasize concerns such as verifiability, liability, competition, and fraud.
We are curious as to how much concern for the customer or job satisfaction might prompt actions that are less than profit-oriented outside of the healthcare context. Hart, Shleifer, and Vishny [7] note that the more a salaried worker’s actions are associated with the worker (they note difficulties in replacing a worker with another as a factor in measuring this trait), the less likely it is that worker is to take actions that are not beneficial to the customer. We are interested in the extent to which providers in either payment system might be motivated to engage in costly efforts in order to solve problems their customers face. It is possible that they may also be willing to do so because they enjoy the tasks or gain personal satisfaction from them. As just one example, tenured professors continue to engage in teaching and research, which may be an indication that financial incentives may not be the sole decisive factor in explaining behavior.1.
On the contrary, economic theories [10,11,12] assume that providers in an FFS system may over-provide services due to the financial incentives to increase their revenue. In an FFS system, providers receive payment for each service they provide, creating a direct financial incentive to increase the number of services they provide. This can lead to the over-utilization of services, as providers have a financial incentive to provide services even when they may not be necessary. In addition, providers in an FFS system may be incentivized to recommend treatments or procedures that are not necessarily in the best interest of the patient but that generate additional revenue for the provider. This phenomenon, known as “supplier-induced demand”, can result in the over-utilization of services and increased costs—for example, in the healthcare sector [2], but also in taxi services or car repair services [3,5]
Financial incentives and inefficiencies in credence goods markets are not solely driven by payment systems. In fact, the presence of insurance further exacerbates the economic inefficiencies in markets for credence goods [4]. Studies have explored the role of insurance in providing financial incentives for providers to increase the volume of services they offer in these markets [4,13,14,15]. For example, in the healthcare industry, insurance coverage can give providers more freedom to increase their prices or the number of services they provide, as they are less bound by ethical and psychological considerations [16]. Empirical evidence supports this notion, with studies showing that when patients are fully insured, providers tend to recommend more expensive treatments and drugs [17,18,19]. Research has also found that providers are more likely to perform additional services when they are reimbursed by insurance or a third party compared to when patients are paying out of pocket [13,20]. However, the extent to which insurance affects provider behavior may differ between payment systems, as provider behavior is influenced by a multitude of factors, including financial incentives, institutional structures, and cultural norms. Our hypothesis is that the role of insurance in influencing provider behavior is greater in an FFS system as compared to a salaried system.
To assess the potential effect of different payment systems and of job interest or satisfaction on worker behavior in a non-healthcare context, we designed an experiment that was similar to the seminal Hennig-Schmidt et al. [21,22,23] experiments but differed in that we use neutral framing and non-medical students. As described below, we also use a real-effort task for the providers to assess the effect of interest in the job, or job satisfaction, on provider behavior. Real-effort tasks allow us to test whether individuals will exhibit a degree of dedication towards tasks that are semi-enjoyable, even if doing so requires an investment of personal resources.
Additionally, in our experiment, hypothetical customers have two different types of insurance coverage. Our interest in service provision extends beyond the issues of over- and under-treatment. We are interested in the impact of the payment system and of semi-enjoyable tasks on the quality and quantity of services provided. We aim to assess whether any of the more altruistic behavior seen in a medical framing context can be seen in a non-medical context.
Our research demonstrates that payment systems have an impact on the behavior of providers in credence goods markets, in terms of both the quality and the number of services provided. We observed that the mean deviation from the optimal number of tasks required was lower in the salaried system compared to the FFS system. When accounting for all customer types, in the FFS treatment, customers received optimal services only 9.6% of the time, compared to 25.2% under the salaried treatment. However, when not accounting for customer type, we found that providers in the salaried treatment were under-providing services, while those in the FFS treatment were significantly over-providing. After controlling for the customer type, we observed that only in the salary treatment did we see a variation of provision decisions based on the customer type and the optimal number of services needed to maximize customer benefits. However, if a customer requires a higher number of services, providers in the salaried treatment were generally unwilling to meet their needs optimally, in terms of quantity. Interestingly, under FFS treatment, we do not notice a difference in provision decisions based on customers’ insurance status. In considering benefit losses and accounting for customer characteristics, we found significant differences between the two payment types, with losses for customers in the FFS treatment exceeding those in the salaried treatment. Interestingly, we find the quality of service to be superior under the salary system than under the FFS system. We notice the quality under FFS to deteriorate in the latter stages of the game, whereas under salary, quality improves as the game progress. We also note that, on average, experts in an FFS system perform more faulty procedures on customers without insurance. This was not possible by design in the experiment by Hennig-Schmidt et al. [21].
Our research, conducted in a controlled laboratory environment, provides valuable insights into the management of credence goods markets, particularly regarding the impact of information asymmetries on market outcomes. Additionally, we examine the role that insurance and third-party payment systems play in shaping provider behaviors.
Balafoutas and Kerschbamer [5] note that most of the early literature on credence goods was focused on the healthcare sector. They note that the general property of a credence good problem is one in which there is asymmetric information such that the provider knows more than the customer about what the customer truly needs. In these cases, there is the potential that either the provision of goods or services does not fit the needs of the customers or that the provider charges for goods or services that have not been provided [5]. In this context, healthcare credence problems are not strongly different from other credence goods problems such as those involving auto mechanics or taxi drivers. A doctor, for instance, has the same profit incentive to engage in supplier-induced demand and prescribe unnecessary tests and treatments as a taxi driver may have to take a longer than necessary route to a destination. As noted, however, there is reason to suspect that ethical considerations in the medical profession may affect behavior and that, if left to make their own decisions, individual doctors might be less motivated by profit and more by patient wellbeing2. Green [25] notes that physicians are motivated to solve patient problems. Hennig-Schmidt et al. [21] find, in experiments, that medical students are less inclined to focus on their own profit if doing so is detrimental to patient welfare. As such, our interest is to explore the reactions to a general service provider–customer credence good problem in order to compare the results to experiments based on a doctor–patient credence good problem.
Our findings hold relevance to general credence goods. They offer valuable information that can inform the design and assessment of credence goods systems and their impact on market outcomes and costs. By assessing the impact of differential payment systems on provider incentives, our study contributes to the credence good literature by isolating the impact of payment systems on service provision decisions and customer welfare. Methodologically, our study highlights the growing role that experimental economics plays in the economics of credence goods.
2. Related Literature
2.1. Payment Systems, Provider Behavior, and Quality of Services
Payment systems serve as a crucial factor in shaping provider behavior in markets for credence goods, serving as both an incentive and constraint in service delivery. Research on payment systems in markets for credence goods is mixed, and, as noted, there is a large focus on healthcare [5]. Some empirical studies looking at the association between payment systems and the behavior of physicians argue payment systems, especially FFS, provide ample incentives to prescribe more, not fewer, tests and treatments and to overcharge [17,26]. Under a salary system, where providers receive a lump-sum salary, usually on a monthly basis, empirical research shows that providers tend to under-provide care [27,28].
A growing body of experimental health economic research has examined the relationship between payment systems and provider behavior. Many of these studies build on the seminal experimental design of Hennig-Schmidt et al. [21]. This experiment assessed the choices that medical students made in different payment systems. The subjects were presented with hypothetical patients of different types with different needs for treatment. The ideal level of treatment for each patient type was known to the subjects: for each patient type, subjects were given a table that indicated their own costs and profits and the patient benefit for each level of treatment. Subjects were asked to choose a level of treatment for each patient and enter that number into a box. The subjects earned money based on the profits associated with each chosen level of treatment. Patients, as stated, were hypothetical, but the benefits earned for the patients were sent to a charity, and this information was known to the subjects. Subjects in the FFS sessions earned more money for each treatment chosen, whereas subjects in the CAP (capitation) sessions earned less for each treatment chosen. Comparing fee-for-service and capitation, Hennig-Schmidt et al. [21] note that the supply of medical services is higher under FFS than under capitation. According to them, patients in need of high-level medical services are better served under an FFS system.
On a similar note, Brosig-Koch et al. [22] show over-provision to be widespread under FFS and under-provision to be common under capitation. Keser and colleagues [29], using an experimental model similar to that of Hennig-Schmidt et al. [21], look at whether physicians customize care in response to financial incentives at the individual patient level. They found that patients treated in the FFS system receive considerably more medical care than patients under CAP with similar illnesses and treatment preferences. Using a real effort task, where subjects had to proofread essays, Green [25] looks at five separate payment structures and their impact on provider behavior and quality of care. The study examined the dynamics among a physician, a patient, and a healthcare provider by employing a neutrally framed dual principal agent game framework. The participant pool for this research consisted of 136 students enrolled in Principles of Economics courses at Virginia Tech. Unlike ours, in the first phase of Green’s [25] experiment, subjects were recruited to play the role of a patient. The results of this experiment show that the highest number of services are provided under FFS; however, the care with the highest overall quality is provided in a salaried system. Similar to ours, Lagarde & Blaauw use a real effort task of data entry, where subjects entered data from blood reports. Lagarde & Blaauw [30] assess the impact of different incentives on the quantity and the quality of services provided. Their experiment was medically framed and included a subject pool comprising exclusively medical students. According to their results, the lowest number of services is provided under the salary treatment; however, the highest quality of care can be seen under salary. Using Green’s [25] real effort task as a basis, Bejarano et al. [9] investigated the impact of expert self-selection based on payment schemes on customer well-being. In their experiment, conducted in a non-medical context and neutrally framed, significant variations in provider behavior were observed under different payment systems. Specifically, experts who opted for fee-for-service payment performed a significantly higher number of services compared to those randomly assigned. This increase in services included a noteworthy proportion of unnecessary service, while the number of beneficial services remained consistent. In contrast, experts who chose salary payment did not exhibit any change in the number of services, whether beneficial or unnecessary, relative to those randomly assigned to receive a salary payment.
The use of non-medical students as subject pools and neural framing in experimental economics research within the healthcare domain is a topic of debate among researchers. Brosig-Koch et al. [22], for instance, compared the effect of FFS and capitation on provision decisions using medical and non-medical students. Overall, they found significant over-provision (under-provision) of services under FFS (capitation). However, medical students cared more for patients than non-medical students such that medical students were less influenced by the incentives of payment systems in that they chose fewer medical services than non-medical students. Ahlert et al. [31] assessed allocation decisions in a laboratory setting using a homogeneous payment system, a heterogeneous subject pool consisting of medical students and economists, and different framing techniques (neutral and medically framed). Their findings suggested that prospective economists tend to be more self-interested in their decision making compared to prospective physicians, who are influenced by professional norms. Furthermore, the study identified noteworthy disparities in behavior between medical and economic students, particularly when exposed to medical framing. Interestingly, both groups displayed a reduced emphasis on maximizing profits, with medical students exhibiting a greater inclination towards this behavior compared to their economic counterparts. Similarly, Hennig-Schmidt and Wiesen [23], using medical framing, conducted a study comparing other behavior between prospective physicians and non-medical students in a similar experiment. They found significant differences between the two subject pools, with non-medical students being less willing to sacrifice their profits to improve patients’ health compared to medical students. Angerer and colleagues [32] analyzed the impact of framing and subject pool effects on healthcare credence goods, both on consumers and experts. They show that the subject pool and healthcare framing have a significant impact on both expert and customer behavior. Specifically, it demonstrates that patients exhibit a greater willingness to engage in the market under medical framing, while experts display a lower occurrence of undertreatment.
2.2. Customers’ Insurance Coverage and Provider Behavior
The insurance coverage of customers plays a significant role in determining provider behavior in credence goods markets, affecting both the supply and demand of services. On the supply side, customer insurance can bring in an additional layer of inefficiencies to markets of credence goods. In markets for computer repairs, Kerschbamer et al. [4] found that insurance can foster second-degree moral hazard and inflate bills through fraudulent over-provision and over-charging. In the case of the markets for taxis, Balafoutas and colleagues [13], using a field experiment in Athens, found significant over-charging when a customer is insured3. They did not find over-treatment to be common; however, over-charging was widespread and significant. Similarly, in a laboratory experiment looking at diagnostic uncertainty and insurance coverage in credence goods markets, Balafoutas and colleagues [14] found that insurance increases mistreatment rates and lowers investments in diagnostic precession.
In the context of medical care, the ability of a physician to induce demand is balanced by the budget curves of patients, the professional code of ethics, and concerns for patient welfare. However, if a patient is insured, providers can feel less constrained by ethical and psychological considerations in raising their prices or the number of services they provide [16,33]. Sülzle & Wambach [15] theoretically look at the impact of insurance on the amount of fraud in physician–patient behavior in terms of the over-charging dimension of markets for credence goods. They find a negative correlation between coinsurance rates and fraud in medical care markets. Huck and colleagues [20], conducted a laboratory experiment to identify how medical insurance and patient choice shape over-treatment. Their results show higher consultation rates and over-treatment when a patient is insured. As they explain, insurance leads to more over-treatment because physicians anticipate that patients are less concerned about the costs of their treatment. Limited empirical evidence on the matter has shown that when patients are fully insured, providers tend to recommend more expensive treatment and drugs [18,34,35].
Karunadasa and Sieberg [36] develop a theoretical model to assess the effects of payment systems and insurance coverage on physician choices. They explore the various incentives given to doctors in fee-for-service systems and in salary. In FFS, they assume that the number of tasks performed by a provider depends on the ideal level of treatment, the service fee, the insurance coverage of the customer, the effort a provider puts in, and the degree to which the provider prioritizes customer satisfaction.
Assuming that a provider is a utility maximizer, the provider earns a profit () which is equivalent to the difference between the total revenue and total cost. The former is comprised of the income a provider earns, which depends on the fee (f), the number of services prescribed to the patient i (), the providers’ regard for solving the problem (γ), and the customer’s utility4 (). Following the Downsian model of policy preference [37], the model assumes that Bi is determined by the distance between the ideal number of procedures a customer should receive and the number of services a customer does receive []. Additionally, Bi also captures the fee customers should pay (f) and the level of insurance coverage (∅)5. Total cost is a combination of fixed costs (fc)6 and variable costs, which is measured as a function of a unit of effort times the number of services provided ()7.
Taking the first derivative with regard to yields the following:
Thus, in an FFS payment system, the number of tasks performed by a provider is influenced by several factors, including the optimal level of treatment, service fees, insurance coverage for the customer, the level of effort required by the provider, and the extent to which the provider prioritizes customer statisfaction.
In the salary treatment, they assume that the number of tasks performed is influenced by the effort required by a provider and how much a provider prioritizes customer satisfaction. In a scenario where providers receive a fixed salary and customers pay a flat service fee, they assume that a provider’s revenue depends on their salary (W) and the importance they attach to customer satisfaction (Bi) and solving problems that customers face (γ). Bi, in the case of a salaried system, is related to the difference between the ideal number of tasks required and the actual number received, as well as the user charges (c) paid by the customer. They assume that the total costs to a provider in the salary system is equivalent to that in an FFS system.
The first derivative with respect to shows the following: if a provider is compensated through a fixed salary, the volume of tasks is determined by the level of effort required by the provider and how committed he/she is to solving the issues customers face.
We use this model as a theoretical basis for our experiments.
Our work makes significant contributions to the study of credence goods markets. As noted, researchers such as Green [25], Bejarano et al. [9], and Lagarde & Blaauw [30] started with and expanded the Hennig-Schmidt et al. [20] experiments, making small changes to the design to assess the impact on results. We have incorporated a number of these changes from the individual experiments and added the aspect of insurance coverage8. First, we adopted a neutral framing in our study. With this, we aim to analyze actions in a general credence good case. Second, we recruited a diverse sample of participants from various academic disciplines to ensure representativeness. Third, our study makes a unique contribution to the literature by incorporating diverse insurance statuses, particularly in the FFS treatment, to address any added inefficiencies brought about by insurance. Previous studies have largely treated insurance as a separate issue from payment systems. However, our research examines the intersection of insurance and payment systems, filling a gap in the literature. This approach is inspired by the work of Balafoutas et al. [13], who argue that insurance introduces further inefficiencies into credence goods markets. Our study builds on this idea and tests its implications for payment systems.
We utilized a real effort task, in addition to an effort cost, as a proxy for effort and for potential interest in the work. The task was a straightforward decoding task, in which participants were presented with a matrix of letters and a decoding key and were instructed to translate numerical representations into letters. This task was designed to increase the generalizability of our findings to credence goods markets beyond the healthcare sector. As noted, many of these aspects have been included in other studies, but ours is the only one, to our knowledge, that combines all of them9. These contributions have allowed us to provide a more comprehensive analysis of actions in a general sense in the context of credence goods markets, paving the way for further research in this field.
3. Hypotheses
Hypothesis 1.
Subjects assigned to fee-for-service will perform more tasks on average than those assigned to salary.
The payment models of fee-for-service and salary can influence the incentives and behavior of providers, leading to potential differences in the average number of tasks performed. In the fee-for-service system, providers’ profits are directly tied to the quantity of tasks performed. They receive financial compensation for each task, creating a financial incentive to increase the number of services provided. Providers may be motivated to maximize their earnings by performing more tasks, even if they are not strictly necessary or beneficial. This can result in an over-provision of services in the fee-for-service system, as providers aim to increase their revenue by performing as many tasks as possible. On the other hand, the salary payment model offers providers a fixed salary, regardless of the number of tasks performed. Providers receive a predetermined amount of compensation, independent of the quantity of services rendered. In this model, there may be less financial motivation for providers to increase the number of tasks, as their earnings are not directly linked to the quantity of services provided. This can potentially result in a lower average number of tasks performed in the salary system compared to in the fee-for-service system.
Hypothesis 2.
Customers will face losses in both fee-for-service and salary systems.
In credence goods markets, where information asymmetry exists between providers and customers, customers face the risk of incurring losses due to inadequate or unnecessary services. Both fee-for-service and salary payment models can potentially result in losses for customers, albeit through different mechanisms.
In the fee-for-service system, providers are incentivized to maximize their profits by performing more tasks, as their earnings are directly tied to the quantity of services performed. This can create a risk of over-treatment, where providers may recommend or perform unnecessary tasks to increase their revenue. These unnecessary services can lead to losses for customers who bear the costs of the additional tasks without deriving corresponding benefits. On the other hand, in the salary system, providers receive a fixed salary regardless of the number of tasks performed. While this model may mitigate the risk of over-treatment, it does not guarantee protection against losses. Providers may be less motivated to go above and beyond their duties or invest additional effort into delivering high-quality services since their compensation is not directly tied to the quantity of tasks performed. This lack of incentive may result in the under-treatment or neglect of customer needs, which can also cause losses for customers. Accordingly, there will be no significant difference in the losses that customers face between fee-for-service and salary systems.
Hypothesis 3.
Service provision decisions will not be influenced by customer needs and benefits.
Credence goods markets are characterized by information asymmetry, where providers possess specialized knowledge and expertise that customers may lack. In these markets, providers have the potential to overstate the need for treatments, which can be advantageous for them in terms of financial gain [2,38]. Arrow [8] argued that medical ethics and pro-social motivations will constrain such behavior, but in a general framing context, we should not expect to see altruistic behavior. Considering the economic theory of agency and the potential for information asymmetry, our hypothesis speculates that service provision decisions in credence goods markets will not be significantly influenced by customer needs and benefits. Providers may prioritize their own interests and financial gains over aligning their decisions with the specific needs and benefits of individual customers. The issue of overstatement in credence goods markets arises from the inherent difficulty customers face in accurately assessing the quality and necessity of services. Providers, being more knowledgeable about the nature of the service, may exploit this information advantage to maximize their own profits. As a result, customer needs and benefits may not play a substantial role in shaping service provision decisions.
Hypothesis 4.
The quality of services in the fee-for-service system will be no better or worse than that in the salary payment model.
The salary payment model offers providers a fixed salary regardless of the number of tasks performed. Without direct financial incentives tied to service quantity, providers may have less motivation to increase the quantity of services they provide. However, this does not automatically guarantee that the quality of services will be superior. Providers might lack the personal drive to go above and beyond or improve the quality of care if they do not perceive a direct benefit or reward for doing so. In contrast, providers in the FFS system have strong incentives to improve the quantity of services they offer. However, without repeated interaction between providers and customers, there is no incentive for quality. Furthermore, without a situation of personal benefit from the quality10 of what they produce, providers have little internal motivation to increase quality [7]. Additionally, in the fee-for-service payment model, providers are incentivized to maximize the quantity of services they offer in order to increase their profits. The more tasks performed, the higher their financial returns. However, this focus on quantity may not necessarily align with the quality of services provided. Providers may be motivated to prioritize the volume of tasks over the thoroughness or appropriateness of care, potentially leading to variations in quality. Considering these factors, our hypothesis suggests that the quality of services in the fee-for-service system will be comparable to that in the salary payment model.
Hypothesis 5.
In the fee-for-service treatment, the mean deviation from the ideal number of tasks will be higher when experts serve customers with insurance coverage.
Credence goods markets, such as healthcare, often involve complex decision-making processes influenced by multiple factors, including insurance coverage. In healthcare, insurance coverage plays a crucial role in shaping provider decisions and patient outcomes [4,13,20]. In the fee-for-service treatment, providers receive payment for each task or service they perform. The profit motive in this payment model incentivizes providers to increase the number of tasks performed in order to maximize their financial returns. However, when customers have insurance coverage, providers may perceive less financial risk and potential financial burden on the customers. As a result, providers may feel more inclined to recommend and perform additional tasks or services, even if they are not necessary [16,33]. In our experiment, customers have heterogeneous insurance coverage. Customers in the salary treatment pay a flat service fee regardless of the number of tasks, while customers in the fee-for-service system either bear the total cost of their services or have full insurance coverage. Accordingly, we hypothesize that, in the FFS treatment, the mean deviation from the ideal number of tasks will be higher when experts serve customers with insurance coverage.
4. Materials and Methods
The experiment was conducted at Tampere University DMLab between 24 October 2022 and 1 December 2022. A total of 160 students took part in the experiments. The subjects were recruited from Tampere University and Tammerkosken Lukio using the online recruiting system ORSEE. The subjects had the opportunity to choose a desired session from among 14 sessions. The experiments were designed and conducted with oTree [39].
The experimental design was based on that of Karunadasa & Sieberg, which in turn builds on that of Hennig-Schmidt et al. [21,36]. However, our design makes some key changes to the theoretical model of Karunadasa & Sieberg and Hennig-Schmidt et al. [21,36]. Instead of squared differences between the number of treatments and the optimal value, in this experiment, payoffs to the customer monotonically decline with the distance from the optimal number. This was a conscious decision on our part to make the experiment similar to that of Hennig-Schmidt et al. [21]. Additionally, to capture all elements of credence goods, we also allowed subjects to get paid, even when a task was performed incorrectly.
As we recruited students from all disciplines, our experiment, as stated above, used a neutral framing. Neutral framing in economic lab experiments provides advantages in terms of increasing the validity and reliability of the results. Given findings that medical providers may have different motivations from non-medical subjects [21,25], a neutral frame allows us to assess a general credence good problem. We therefore describe a situation between a service provider and a customer, where the service provider has the advantage of information asymmetry. The instructions used in our experiment are provided in Appendix A.
In our experiment, instead of having our subjects simply choose a level of effort, we use real effort tasks. A real-effort task requires participants to perform some actual work, which could either be psychological, manual, or both, to achieve a certain outcome [40]. This was done to make the effort real and either potentially costly or potentially interesting, depending on how they individually viewed it. Jokipalo and Sieberg [41] found that a majority of subjects engaging in a similar real-effort task found it to be interesting or enjoyable. This is an important consideration in terms of understanding provider behavior in credence goods situations. The assumption that any provider behavior is costly is reasonable, but it overlooks the possibility that a provider may choose to engage in the effort anyway because the provider is motivated to do so, either because it is an intellectual challenge or because the work is enjoyable11.
Real effort tasks are an advantageous method in economic lab experiments because they provide a slightly more realistic representation of behavior in real-world situations. In these tasks, participants are asked to perform a task that requires genuine effort, rather than simply answering hypothetical questions about what level of effort would be chosen or making decisions based on simulated scenarios. Additionally, real effort tasks can provide a more accurate representation of preferences and decision making under conditions of uncertainty or risk. The use of real effort tasks in economic lab experiments can therefore lead to a deeper understanding of economic behavior and the factors that influence decision making in the real world. There is a variety of real-effort tasks used in economic lab experiments [42]. We used a repetitive decoding task, where participants were given a grid of letters and a decoding key and were required to convert numbers into letters. Appendix B provides a screenshot of the decoding task.
Our experiment included two treatments: Salary and Fee for Service (FFS). In the Salary treatment, regardless of the number of tasks performed, the subjects received a flat wage of 13 ECUs per round. In the FFS treatment, the amount the subjects earned was tied to how many tasks they performed and varied between 0 and 23 ECUs. The exchange rate per ECU was 0.09. In both treatments, each completed task had a cost of 1 ECU, which was deducted from their payments to determine payoffs per round12. This was a deliberate decision on our part to identify if customer conditions and the number of tasks required to optimally serve the customer would impact the behavior of providers, especially in the salaried system.
In all treatments, the subjects took on the role of a service provider who would be solving a problem a hypothetical customer faced. Each subject was randomly matched with a hypothetical customer in each round. The experiment included three different types of customers: type 1 with moderate conditions, type 2 with mild conditions, and type 3 with severe conditions. Depending on the type of customer, the optimal number of tasks that needed to be performed to solve the problem was different. However, the subjects could choose how many tasks they wished to perform, between and including 0 and 10.
The decisions made by each subject not only determined their own earnings but also the benefits to the customers they were serving. Customer benefits varied according to the customer type but followed a concave pattern. The point of benefit maximization depended on the customer type. The Figure 1 below shows customer benefits according to the number of tasks and customer type. Drawing from Karunadasa & Sieberg [36], depending on the treatment, the subjects were informed that their customers will bear a cost depending on the number of tasks performed. In the salary treatment, the subjects were notified that the customers bear a flat fee cost regardless of the number of services provided. In FFS, the subjects were informed that customers bear a cost for each service provided, and the cost of services was either borne by the customer or was covered through insurance13. While customers in our experiment were hypothetical, 60% of the benefits to the customers were allocated to a fund supporting experimental research at Tampere University14.
4.1. Experimental Procedure
An experiment session lasted approximately 60 min. Each participant was given a show-up fee of EUR 5. One session was allocated for one treatment, and in each session, subjects had the opportunity to earn a maximum of 156 ECUs. While the researchers knew which treatment would be conducted in which session, this information was not available to the participants. This allowed for a controlled between-subject comparison. After the participants had taken their seats, instructions were read aloud. Participants also had the opportunity to read the instructions on their computer screens. Depending on the session, instructions were given in either Finnish or English; however, the instructions on the screen were available only in English. After the instructions were read, the participants were given the opportunity to clarify any questions they would have.
The experiment included a total of 12 rounds of play. In each round, the subjects were matched with a different type of customer, and customer benefits varied depending on the type of the customer. Before the start of a new round, the subjects were informed of the customer type they were matched with and were shown a table containing the payment and costs per task, individual profits, and customer benefit. Throughout the experiment, the subjects had the opportunity to move to the next round if they had completed the number of tasks they wished to perform. The Table 1 below summarizes the order of matching and the optimal number of tasks required in each round.
During each round, the subjects had to choose and perform several real-effort tasks that could be any number between and including 0 and 1015. In each round, the decisions the subjects made determined their own profit and customer benefits. The Table 2 below provides an overview of provider profits and customer benefits depending on the number of tasks performed.
At the end of 12 rounds of decision making, the subjects were asked to fill out a brief questionnaire before receiving the payments, explaining the factors influencing their decision making. The questionnaire is provided in Appendix C.
4.2. Overview of the Dataset
The data analyzed included data for 158 participants, across 14 sessions. A total of 54% of the participants were assigned to salary treatment. The experiment followed a within-subject design, and each participant was assigned to either salary treatment or FFS. Each session included 12 rounds of play, and in each round, participants performed between 0 and 10 real-effort tasks. A total of 1884 observations were used in the final analysis16. Statistical analysis of the experimental data was carried out through R statistical software [43,44,45,46,47].
A total of 49.4% of the participants were female, while 41.1% were male17. Among our subjects, 34% were from social sciences, 27% were from STEM fields, and 12.5% were high-school students18. The Table 3 below provides an overview of the demographic characteristics of our sample.
On average, a participant earned 116.5 ECUs, an equivalent of EUR 15.6 (Mode 15.64). The average earnings in FFS were 131.77 ECUs, equivalent to EUR 17 (Mode EUR 19.2), and they were 103.4 ECUs (EUR 14.4) in Salary (Mode EUR 15)19. A total of 60% of the total earnings made by the participants, equivalent to EUR 896, were transferred to a research fund supporting experimental research at Tampere University.
5. Results
5.1. The Mean Deviation from the Optimal Number of Tasks Required Is Less under Salary Than under FFS
On average, across all rounds, 6.3 services were provided20. To identify the impact of the remuneration system on service provision, we isolated the number of services provided according to the remuneration type. The Figure 2 below provides a snapshot of the number of services provided.
Testing across all customers, providers under FFS largely deviated from the optimal number of services required. On average, providers under FFS provided 8.7 tasks (Mode 10, SD 2.7), which is significantly larger than the average number of tasks required (p < 0.0001, Wilcoxon signed-rank test). Of 888 decisions made under FFS, 769 decisions have a positive mean deviation between the number of tasks required and the number of tasks performed, and only 74 decisions had a difference of zero. The mean difference was negative for 45 decisions.
On average, providers remunerated under the salaried system provided 4.4 tasks (Mode 4, SD 3.1). Testing across all customers, providers under the salary treatment significantly underprovided procedures (p < 0.0001, Wilcoxon signed-rank test). Of 1020 decisions made by salaried providers, 553 decisions had a negative deviation from the number of tasks required, while 230 decisions had a positive deviation. The deviation between the required number of procedures and the number of procedures provided was zero for 257 decisions.
We tracked subject behavior across 12 rounds of play and observed that only two subjects completed tasks precisely equivalent to the ideal number of tasks. One subject was in the salary treatment, and the other was in FFS.
5.2. Unlike in FFS, Providers in Salary Increasingly Take Customer Needs into Account When Making Decisions
We notice that provision decisions under the salary system vary according to the customer type and the optimal number of services needed to maximize customer benefits, as shown in Figure 3 below. Comparing the average number of services provided per customer type, providers in the salaried system optimally served customer type 1 (p = 0.5, Wilcoxon signed rank test)21 and significantly overserved customer type 2 (p = 0.0006, one-sided Wilcoxon signed rank test)22.
However, under FFS, customers were consistently overserved, regardless of their needs. Across all customer types, the average number of tasks provided was 8.7 (Mode 10), which was significantly higher than the average required number of tasks (p < 0.0001, Wilcoxon signed-rank test). We could observe the same effect when isolating individual customer types. For customer type 1, the ideal number of tasks required was 5; however, providers in our sample, on average, provided 8.7 tasks (p < 0.0001, one-sided Wilcoxon signed rank test). Customer type 2, which required three tasks to be served optimally, on average, provided 8.2 tasks (p < 0.0001, one-sided Wilcoxon signed rank test). No customer type 3 providers in our sample, on average, performed nine tasks when the required number was seven (p < 0.0001, one-sided Wilcoxon signed rank test).
5.3. Under Salary, Providers Avoid Costly Effort
While subjects in our salaried treatment largely took the needs of the customer into account when choosing the number of tasks to perform, as shown in Figure 4 below, they, on average, underserved customer type 3. The optimal number of tasks required by customer type 3 was seven; however, on average, subjects in our salaried treatment only provided 4.3 tasks (p < 0.0001, one-sided Wilcoxon signed rank test). Of the 340 decisions made on customer type 3, only 19 decisions had a deviation of zero between the number of required tasks and the actual number of tasks provided, while 269 decisions had a negative deviation.
5.4. Unlike in Salary Treatment, Providers in FFS Strive for Profit Maximization
The decisions made in the experiment involved a trade-off between providers’ payoffs and customers’ benefits. We therefore compared how providers’ payoffs deviate from the maximum possible payoffs in each round, according to the payment system. As shown in Figure 5, in each round, regardless of the payment system, the maximum payoff a provider could receive is 13 ECUs, which is equivalent to 156 ECUs in total. We notice that under FFS treatment, on average, a provider earned 128.25 ECUs (Mode 156, sd 39.7), and under salary treatment, the mean payoff was 103 ECUs (Mode 110, sd 27.7). The difference in mean payoffs between the FFS treatment and the salary treatment is statistically significant (p < 0.0001, Mann–Whitney U Test). As we tracked subjects across 12 rounds, we observed that 38 subjects earned the maximum possible ECUs, and we found all of them in the FFS treatment.
In each round of play, subjects were informed of how much they could earn based on the decisions they made. Throughout the game, subjects had the option to move to the next round once they had made the number of decisions they wanted to make23 and moved on with the game, which allowed them to leave earlier than others still playing the game. This meant that although they had 10 potential tasks to perform per round, they could choose to perform fewer per round and leave the experiment when they decided they were done. We therefore assume that the tasks performed were performed either because the subject wanted to perform them or because they were motivated by their own gain or the customer’s gain.
Our assumption closely resonates with statements made in the self-reported post-experiment questionnaire. A total of 65.7% of the subjects assigned to the salary treatment mentioned they attempted to balance personal payoffs and customer benefits, while only 41.5% of the subjects in the FFS treatment mentioned the same. A total of 20% of the providers in the salary treatment also recognized customer benefits as a decisive factor when making decisions; however, only 3.8% of the subjects in the FFS treatment highlighted this. A total of 43.4% of the responders in the FFS treatment identified self-interest as a decisive factor. Interestingly, self-interest was not mentioned at all by those assigned to the salary treatment24.
5.5. In a Fee-For-Service System, the Insurance Coverage of Customers Has No Impact on the Number of Treatments Providers Perform
If we combine all customer types and assume that the customers in the salary system have social insurance, then we notice that customers with insurance are significantly underserved compared to customers with insurance (p < 0.0001). However, in our experiment, we describe the customers in the salaried system as paying a flat fee, and we otherwise never mention insurance. We therefore assume that if a customer is served by a subject in an FFS system, the customer pays a fee depending on how many services are provided. We make the assumption that insurance is only relevant when being served by a subject in the FFS system. In isolating for customers served under the FFS system, we do not see a significant association between how customers are served and their insurance coverage (p = 0.15, Wilcoxon rank sum test). As shown in the Figure 6 below, the mean number of tasks performed on a customer with insurance is 8.7 (Mode 10, sd 2.3), and the mean number of tasks performed on a customer without insurance is 8.8 (Mode 10, sd 2.4).
5.6. Salary Treatment Produces Better-Quality Services
In the experiment, FFS participants were compensated even when they performed tasks that were not carried out correctly25. This allows us to test if payment systems affect the quality of services. An analysis of the average number of incorrect tasks performed by subjects across both treatments revealed that the subjects performed 0.2 incorrect tasks, on average. However, further differentiation of the data based on the payment system revealed that subjects assigned to the FFS treatment performed an average of 0.33 incorrect tasks, while those under the salary treatment performed an average of 0.12 incorrect tasks. This difference was found to be statistically significant (p < 0.0001, Wilcoxon rank sum test). To investigate the impact of payment systems on the quality of work, we compared the proportion of faulty tasks performed by subjects under two different payment systems: fee-for-service (FFS) and salary. Our analysis included a two-sample test for the equality of proportions, which revealed that the proportion of faulty tasks as a fraction of total tasks was 0.037 under the FFS system, compared to 0.027 under the salary system. This difference was found to be statistically significant (p = 0.0033, Pearson’s Chi-squared test). A closer examination of the data, as per Figure 7 below, showed that the rate of incorrect tasks increased as the game progressed under the FFS treatment, while the opposite effect was observed under the salary treatment. When differentiating between customer types, the observed effect persisted. However, the effect size was the greatest for customer type 3. Under the FFS treatment, customer type 3 received an average of 0.32 incorrect treatments, compared to 0.08 incorrect treatments under the salary treatment (p < 0.0001, as determined by a Wilcoxon rank sum test).
To determine the impact of insurance coverage on the quality of services, a comparison was made between the mean number of faulty tasks performed on customers with and without insurance in the FFS treatment. The results indicate a higher occurrence of faulty tasks when customers did not have insurance coverage. Specifically, customers with insurance received an average of 0.28 faulty treatments, while those without insurance received 0.37 faulty treatments. The difference was found to be statistically significant (p < 0.0001, Wilcoxon rank sum test).
5.7. Differences in Customer Benefits Losses under Different Payment Systems Are Significant
In analyzing profit maximization behavior and self-reported factors affecting providers’ decision making, we realize that customers’ benefits and benefit losses26 are affected by the payment system. On average, across all customer types, the benefit loss is 1.3; however, in differentiating the payment types, we find significant differences in benefit losses, as shown in Figure 8 below. The mean loss of benefits under salary treatment was 0.6 (Mode 0, sd 3.4), whereas under FFS, the mean loss was 3.7 (Mode 3, sd 2.7). In examining the difference in the mean benefit loss, we identify that significant differences exist between payment systems (p < 0.0001, Wilcoxon signed-rank test).
By separating observations by round and payment systems, we notice an unusual increase in welfare loss for customer 3 in the latter rounds of play (round 12), which could be an indication of an end-game effect [48]. The end-game effect refers to a situation where individuals interacting in a set number of rounds substantially reduce their contributions towards the end of the game. This increase could also be attributed to the occurrence of a learning effect.
6. Regression Analysis
We ran a multinomial logistic regression model to forecast service provision based on four predictor variables: customer type, insurance status and method of remuneration27 and service quality28. Service provision was categorized into three levels based on the difference between the number of tasks performed by the subject in each round and the actual number of tasks required. Observations, where the difference was zero, were categorized as “Optimal”, observations with negative differences were considered as “under-provision”, and observations with positive differences were treated as “over-provision”. We used the optimal level of service provision as the reference category for the dependent variable. This type of regression is appropriate when the dependent variable is nominal and has more than two categories that cannot be ranked in order of preference. The results are shown in Table 4 below. By examining the results in Table 4, we find that the service provision is significantly affected by the customer type and the remuneration method in our experiment. Additionally, we find a statistically significant relationship between over-provision and faulty tasks.
Based on the regression results, we notice that, in comparison to a type 1 customer, the odds of a type 2 customer being over-served is 0.6 (p = 0.001), while the odds of the same type being under-served is 0.3 (p < 0.001). In comparison to a type 1 customer, the odds of a type 3 customer being overserved is 1.9 (p = 0.005), whereas the odds of being underserved is 5.1 (p < 0.001). Controlling for customer type, the odds of a customer being overtreated is 10.6 (p < 0.001) if the customer is served by a subject remunerated via FFS as opposed to a flat salary. The odds of being under-served by a subject remunerated by FFS is 0.2 (p < 0.001). Additionally, we find that faulty tasks are more likely to happen under over-provision. According to our results, faulty tasks increase the odds of over-provision by 3.8, and this effect is statistically significant (p < 0.001). The odds of faulty tasks are considerably low in comparison to when services are under-provided; however, this effect is not statistically significant. Our model specifications are statistically significant (X2 = 1204.3; p < 0.0001). Overall, we explain about 55% of the variance in service provision status using the customer type, remuneration type, and quality of services.
Additionally, we used linear mixed-effect regression models to examine the effect of payment systems (FFS and salary) on a series of outcome variables (the total number of tasks completed, the deviation from the ideal number of tasks, and the rate of faulty tasks) while controlling for customer type. Our findings are summarized in Table 5.
We found that providers in the FFS treatment performed 4.4 more tasks than those in the salary treatment, and this effect was statistically significant. However, the effect of customer type on the total number of tasks was not statistically significant, except for customer type 2. This leads us to argue that subjects complete more tasks when customers have a lower optimal service level.
Regarding the deviation from the ideal number of tasks, we found that providers in the FFS system deviated from the ideal number of tasks by 4.4 tasks, on average, which was significantly higher than the value of those in the salary system, and this deviation proves to be significant. We also observed that type 2 customers received 1.2 more procedures than their ideal number, while type 3 customers received 2.2 fewer procedures than their ideal level, and these effects were statistically significant.
Finally, we examined the rate of faulty tasks and found that experts performed 0.2 more faulty tasks under the FFS system than under the salary system. However, we did not find any significant impact of customer types on faulty tasks. These results provide important insights into the impact of payment systems and customer types on provider performance and can inform policy decisions.
7. Discussion and Conclusions
In this controlled economic experiment, we used a real-effort task to test the behavior of providers in credence goods markets based on how they are paid: FFS and salary-based. In the case of FFS, we tested if the insurance coverage of a customer would impact provider–customer interactions. Our aim was to examine if subjects would be purely affected by personal profit or if factors such as a concern for the customers’ wellbeing or an enthusiasm towards tasks that are semi-enjoyable would provide incentives to provide more or less costly effort, even if such activity would decrease their own payoffs.
We find that customers served by providers in an FFS system face significantly higher benefit losses than those in a salaried system. We further notice that providers in the fee-for-service treatment consistently significantly over-performed tasks. In fact, the over-provision rate in the FFS rate was 86.6%, in comparison to 22.5% under salary. We did observe the under-provision rate to be higher under the salary system: 52.3% compared to 5.1% under FFS; however, when differentiating for customer types, providers in the salary system did serve customers with moderate conditions optimally. Interestingly, customers with mild conditions were significantly overserved. While we notice that providers in the salaried system are influenced by the needs of the customers, we do not see customer needs as having any significant impact on the decisions made by providers in the FFS system. Our observations are corroborated through the self-reported post-experiment questionnaire, in which the majority of the subjects assigned to the salary treatment listed balancing personal pay-offs and customer benefits to be the decisive factor in decision making. In comparison, for the majority of the subjects assigned to the FFS treatment, self-interest was the critical factor in decision making.
Our analysis of the quality of services provided shows that the quality is significantly better in the salary treatment than in the fee-for-service treatment. On average, subjects in the FFS treatment performed 0.33 tasks incorrectly, while subjects in the salary treatment performed only 0.12 tasks incorrectly. Our results also reveal that the largest difference in quality is for customer type 3. Under the FFS treatment, customer type 3 received an average of 0.32 incorrect treatments, while under the salary treatment, they received only 0.08 incorrect treatments. We also observed that the number of faulty tasks performed by subjects in the FFS treatment increased as the game progressed, while the number of faults decreased in the salary treatment. This finding is consistent with previous studies by Keser & Schnitzler and Lagarde & Blaauw [30,49].
Our findings differ from previous evidence primarily in terms of profit maximization and providers’ responsiveness to customer needs. Studies by Henning-Schmidt et al. [21] and Ahlert et al. [31] demonstrate that, with medical framing, experts in both payment systems deviate from profit maximization to enhance customer welfare. However, in our study, without medical framing, we observe a different pattern. In the salaried treatment, providers appear to be influenced by customer-regarding behavior, while the opposite holds true in the case of FFS.
This discrepancy in results can be attributed to several differences in our experimental design. Again, unlike Hennig-Schmidt et al. [21] and Ahlert et al. [31], we employed a general subject pool and used neutral framing. That being said, our findings closely align with neutrally framed experiments conducted with similar subject pools. For instance, Ahlert et al. [31], in their treatment involving economic students and neutral framing, did find subjects to be profit maximizers. Furthermore, Green [25] demonstrated that retrospective payment systems such as FFS can diminish intrinsic motivations and promote profit-maximizing behavior. Similar to our approach, Green [25] used a neutrally framed real effort task and a general subject pool. Bejarano et al. [9], in their neutrally framed real-effort experiment, also found that, under an FFS system, providers tend to maximize profit and provide more services than under salary. Additionally, Karunadasa & Sieberg [36] suggest that, in an FFS system, physicians will strive to maximize profit by increasing the number of services provided. They argue that a salaried system eliminates financial incentives for overtreatment, although overtreatment remains a possibility if a provider is highly concerned about patients’ welfare. The results of our experimental analysis further support these claims.
Surprisingly, our results do not show insurance to be a significant factor in provider–customer interactions in the FFS treatment. This finding largely contradicts experimental and empirical research before us. Sülzel & Wambach [15], Balafoutas et al. [13], and Huck et al. [20] confirm that, in credence goods markets, such as healthcare, a positive correlation exists between the insurance coverage of a customer and the number of services provided. While Balafoutas et al. [13] and Huck et al. [20] utilized a subject pool and framing effect similar to ours, their findings regarding insurance significantly diverged from ours. Consequently, we presume that the observed effect in our study is independent of any design modifications we have implemented. Instead, it could potentially be attributed to an unaccounted random factor. It is plausible that the observed effect could be attributed to ambiguities or a lack of clarity in the instructions provided to the subjects, leading to potential misunderstandings or misinterpretations. However, we do see interesting differences in the quality of services for customers with and without insurance. In the FFS treatment, we found that customers without insurance received lower-quality care, as evidenced by the higher number of faulty tasks. Moreover, we observed that customers in the FFS treatment experienced more benefit losses. These findings combined raise significant questions. The combination of increased benefit losses and more faulty tasks in fee-for-service treatment for customers without insurance raises serious concerns about the accessibility and equity of services.
Our findings are of relevance in the context of public vs. private ownership and payment systems in markets for credence goods. The general consensus, especially in the non-medical service market, is that public ownership tends to be ineffective and inefficient in delivering credence goods. In a public ownership model, when providers are paid a flat fee, financial incentives tend to be weak or absent. These incentives, however, also have a benefit in that there is a lack of motivation for the overprovision of services or other costly actions [6,7]. The absence of financial incentives may also hinder providers from optimally responding to cases that require additional effort. Nevertheless, this type of ‘cream skimming’ could occur regardless of the ownership model and payment structures [6,7]30.
Based on our results, we challenge the notion that sub-optimal treatment is a consequence of public ownership. Our experiment demonstrates that, even in the absence of medical framing, providers who operate under a salaried treatment system are motivated to treat their customers optimally, although it requires personal costs. However, we also observed that customers who require additional effort are often underserved by providers under the salaried system. Unlike previous studies [21,29], we are hesitant to claim that customers in need of intermediate or extensive attention are better served under an FFS system than under a salary. While it may seem that the number of tasks completed is the primary metric for evaluation, the quality of those tasks is just as important. Overprovision in an FFS system can lead to poor-quality services, particularly for customers with extensive needs. This highlights a significant disadvantage of incentives in private markets, where the drive to reduce costs can come at the expense of quality. This phenomenon has been noted previously by Hart, Shleifer, and Vishny [5].
In closing, we are aware of the challenges associated with generalizing findings from lab experiments for the real world [50]. We believe our experiment constructs a more realistic credence goods set-up, using, for instance, real-effort tasks and neutral framing. Yet, the findings of our experiment are limited by the constraints and abstracts of the lab. For instance, in a real-world situation, customer benefits may not be as explicit and obvious as in our experiment. In more delicate credence goods markets, it might be difficult to explicitly identify the optimal level of service. We suggest that future research on this matter should incorporate personal and contextual elements involved in customer–provider interactions and the framing effect to better understand the potential for supplier-induced demand in credence goods markets.
Author Contributions
Conceptualization, M.K., K.K.S. and T.T.K.J.; Software, T.T.K.J.; Formal analysis, M.K., K.K.S. and T.T.K.J.; Writing – original draft, M.K., K.K.S. and T.T.K.J.; Funding acquisition, K.K.S. All authors have read and agreed to the published version of the manuscript.
Funding
This experiment was funded by Academy of Finland’s’ grant to Tampere University (336357). The university granted seed funds from this grant through the Sustainable Welfare System program. Furthermore, Finnish Cultural Foundation (grant number 00220457) provided support for the efforts of MK. The funders had no role in design, data collection, analysis, decision to publish or preparation of the manuscript.
Data Availability Statement
Data presented in this study are available on request from the corresponding author.
Acknowledgments
Authors would like to thank the participants in Brunel University Economics and Finance Talks seminar participants on 22 March 2033 for their helpful questions and suggestions. We would like to express our sincere appreciation to the two anonymous reviewers for their valuable comments and insightful suggestions, which greatly contributed to the improvement of this work.
Conflicts of Interest
The authors declare no conflict of interests.
Appendix A. Experimental Instructions
Appendix A.1. Salary Treatment
Rounds and Matchings: The experiment sets up a decision-making game for a number of rounds.
The decisions that you make will determine your earnings.
Decisions: During the entire experiment, you are in the role of a service provider. You will be randomly matched with a hypothetical customer, who is experiencing a problem that you could solve. There will be three types of customers in this experiment, and the problems they each experience are different. For each customer type, there is an optimum number of tasks you should perform to solve the problem. You can choose how many tasks you want to perform: you can choose to perform no tasks, less than the optimum number, the optimum number of tasks, or a maximum of 10 tasks.
Earnings: You will earn the difference between the wage, which is given regardless of the number of tasks you perform, and a cost per task of 1 ECU.
Conversion: 11 ECU = EUR 1.
You will receive a salary of 13 ECU for each round. You will choose a number of tasks to perform. That may be any number between (and including) 0 and 10.
If you have completed the number of tasks you wish to perform before the allotted time has run out, you may press the Next Round button to start a new round.
Earnings: More effort is costly in terms of effort costs. Each task completed will cost 1 ECU. Your earnings for the round are the difference between your salary and the effort cost (number of tasks times per-unit effort cost). Note: you do not have to complete the task successfully to earn money.
Interdependence: While the person you are serving is hypothetical in this game, a certain benefit for the customer is assigned to each task performed successfully. Therefore, the number of tasks you decide to perform not only determines your own profit but also the benefit of your customer. The customer gets a benefit from each task you perform correctly.
Customers bear a flat fee cost, regardless of the number of services provided. They benefit differentially, based on type, from how many services are provided.
There are no real customers in this experiment, but 60% of the total benefits to the customers at the end of the experiment will be transferred to a fund.
Cumulative Earnings: The program will keep track of your total earnings for all rounds, and these will be shown as ‘cumulative earnings’ on a results page.
The ideal number of tasks for the customer is detailed below:
Customer Type 1.
| Number of Tasks | Your Payment | Your Cost | Your Profit | Customer Benefit |
| 0 | 13 | 0 | 13 | 0 |
| 1 | 13 | 1 | 12 | 1 |
| 2 | 13 | 2 | 11 | 2 |
| 3 | 13 | 3 | 10 | 4 |
| 4 | 13 | 4 | 9 | 7 |
| 5 | 13 | 5 | 8 | 10 |
| 6 | 13 | 6 | 7 | 9 |
| 7 | 13 | 7 | 6 | 8 |
| 8 | 13 | 8 | 5 | 7 |
| 9 | 13 | 9 | 4 | 6 |
| 10 | 13 | 10 | 3 | 5 |
For each task that you perform, you will earn the indicated amount of profit (wage minus the cost per task), and the associated proceeds from successfully completed tasks will go to a fund.
For example, if you successfully solve one task, you will earn 13 ECU–1 ECU for a profit of 12 ECU, and 60% of 1 ECU will be donated to a fund.
If you successfully solve one task and fail one task, you will earn 13 ECU–2ECU for a profit of 11 ECU, and 60% of 1 ECU will be donated to a fund.
If you successfully solve 10 tasks, you will earn 13 ECU–10 ECU = 3 ECU, and 60% of 5 ECU will be donated to a fund.
Customer Type 2
| Number of Tasks | Your Payment | Your Cost | Your Profit | Customer Benefit |
| 0 | 13 | 0 | 13 | 0 |
| 1 | 13 | 1 | 12 | 7 |
| 2 | 13 | 2 | 11 | 8 |
| 3 | 13 | 3 | 10 | 10 |
| 4 | 13 | 4 | 9 | 9 |
| 5 | 13 | 5 | 8 | 7 |
| 6 | 13 | 6 | 7 | 6 |
| 7 | 13 | 7 | 6 | 5 |
| 8 | 13 | 8 | 5 | 4 |
| 9 | 13 | 9 | 4 | 3 |
| 10 | 13 | 10 | 3 | 1 |
For each task that you perform, you will earn the indicated amount of profit (wage minus the cost per task), and the associated proceeds from successfully completed tasks will go to a fund.
For example, if you successfully solve one task, you will earn 13 ECU–1 ECU for a profit of 12 ECU, and 60% of 7 ECU will be donated to a fund.
If you solve 10 tasks, you will earn 13 ECU–10 ECU = 3 ECU, and 60% of 1 ECU will be donated to a fund.
Customer Type 3
| Number of Tasks | Your Payment | Your Cost | Your Profit | Customer Benefit |
| 0 | 13 | 0 | 13 | 0 |
| 1 | 13 | 1 | 12 | 1 |
| 2 | 13 | 2 | 11 | 2 |
| 3 | 13 | 3 | 10 | 4 |
| 4 | 13 | 4 | 9 | 7 |
| 5 | 13 | 5 | 8 | 8 |
| 6 | 13 | 6 | 7 | 9 |
| 7 | 13 | 7 | 6 | 10 |
| 8 | 13 | 8 | 5 | 9 |
| 9 | 13 | 9 | 4 | 8 |
| 10 | 13 | 10 | 3 | 7 |
For each task that you perform, you will earn the indicated amount of profit (wage minus the cost per task), and the associated proceeds from successfully completed tasks will go to a fund.
For example, if you successfully solve one task, you will earn 13 ECU–1 ECU for a profit of 12 ECU, and 60% of 1 ECU will be donated to a fund.
If you solve 10 tasks, you will earn 13 ECU–10 ECU = 3 ECU, and 60% of 7 ECU will be donated to a fund.
Instructions Summary
Matchings: Please remember that you will be randomly matched with different customer types in each round.
Wage: The wage is 13 ECU.
Effort: Each worker sees the wage and then chooses an effort (number of tasks) that can be any amount between (and including) 0 and 10.
Worker Earnings: The worker earns the difference between the wage and the cost of that worker’s effort (per-unit effort cost times effort choice).
Charity Earnings: The fund will receive a donation based on the customer type and the successful effort of the worker.
Appendix A.2. Fee-for-Service Treatment
Rounds and Matchings: The experiment sets up a decision-making game for a number of rounds.
The decisions that you make will determine your earnings.
Decisions: During the entire experiment, you are in the role of a service provider. You will be randomly matched with a hypothetical customer, who is experiencing a problem that you could solve. There will be three types of customers in this experiment, and the problems they each experience are different. For each customer type, there is an optimum number of tasks you should perform to solve the problem. You can choose how many tasks you want to perform: you can choose to perform no tasks, less than the optimum number, the optimum number of tasks, or a maximum of 10 tasks.
Earnings: You will earn the difference between the wage, which is based on the number of tasks you perform, and a cost per task of 1 ECU.
Conversion: 11 ECU = EUR 1.
The amount that you will be paid for the completed tasks may vary between 0 and 23 ECU. You will see the amount and then choose a number of tasks to perform. That may be any number between (and including) 0 and 10.
If you have completed the number of tasks you wish to perform before the allotted time has run out, you may press the Next Round button to start a new round.
Earnings: More worker effort earns you more money but is also costly in terms of effort costs. Each additional task completed will cost 1 ECU. Your earnings for the round are the difference between the amount per task earned and the effort cost (number of tasks times per-unit effort cost). Note: you do not have to complete the task successfully to earn money.
Interdependence: While the person you are serving is hypothetical in this game, a certain benefit for the customer is assigned to each task performed. Therefore, the number of tasks you decide to perform not only determines your own profit but also the benefit of your customer. The customer receives a benefit from each task you perform correctly.
Customers bear a cost for each service provided. In this treatment, the customer has insurance that covers the entire cost; thus, they receive the total benefit.
There are no real customers in this experiment, but 60% of the total benefits to the customers at the end of the experiment will be transferred to a fund.
Cumulative Earnings: The program will keep track of your total earnings for all rounds, and these will be shown as “cumulative earnings” on a results page.
The ideal number of tasks for the customer are detailed below:
Customer Type 1
| Number of Tasks | Your Payment | Your Cost | Your Profit | Customer Benefit |
| 0 | 0 | 0 | 0 | 0 |
| 1 | 1 | 1 | 0 | 1 |
| 2 | 3 | 2 | 1 | 2 |
| 3 | 6 | 3 | 3 | 4 |
| 4 | 7 | 4 | 3 | 7 |
| 5 | 9 | 5 | 4 | 10 |
| 6 | 11 | 6 | 5 | 9 |
| 7 | 13 | 7 | 6 | 8 |
| 8 | 18 | 8 | 10 | 7 |
| 9 | 21 | 9 | 12 | 6 |
| 10 | 23 | 10 | 13 | 5 |
For each task that you perform, you will earn the indicated amount of profit (payment per task minus the cost per task), and the associated proceeds from successfully completed tasks will go to a fund.
For example, if you successfully solve one task, you will earn 1 ECU–1 ECU for a profit of 0 ECU, and 60% of 1 ECU will be donated to a fund.
If you successfully solve one task and fail one task, you will earn 3 ECU–2 ECU for a profit of 1 ECU, and 60% of 1 ECU will be donated to a fund.
If you successfully solve 10 tasks, you will earn 23 ECU–10 ECU = 13 ECU, and 60% of 5 ECU will be donated to a fund.
Customer Type 2
| Number of Tasks | Your Payment | Your Cost | Your Profit | Customer Benefit |
| 0 | 0 | 0 | 0 | 0 |
| 1 | 1 | 1 | 0 | 7 |
| 2 | 3 | 2 | 1 | 8 |
| 3 | 6 | 3 | 3 | 10 |
| 4 | 7 | 4 | 3 | 9 |
| 5 | 9 | 5 | 4 | 7 |
| 6 | 11 | 6 | 5 | 6 |
| 7 | 13 | 7 | 6 | 5 |
| 8 | 18 | 8 | 10 | 4 |
| 9 | 21 | 9 | 12 | 3 |
| 10 | 23 | 10 | 13 | 1 |
For each task that you perform, you will earn the indicated amount of profit (payment per task minus the cost per task), and the associated proceeds from successfully completed tasks will go to a fund.
For example, if you successfully solve one task, you will earn 1 ECU–1 ECU for a profit of 0 ECU, and 60% of 7 ECU will be donated to a fund.
If you solve 10 tasks, you will earn 23 ECU–10 ECU = 13 ECU, and 60% of 1 ECU will be donated to a fund.
Customer Type 3
| Number of Tasks | Your Payment | Your Cost | Your Profit | Customer Benefit |
| 0 | 0 | 0 | 0 | 0 |
| 1 | 1 | 1 | 0 | 1 |
| 2 | 3 | 2 | 1 | 2 |
| 3 | 6 | 3 | 3 | 4 |
| 4 | 7 | 4 | 3 | 7 |
| 5 | 9 | 5 | 4 | 8 |
| 6 | 11 | 6 | 5 | 9 |
| 7 | 13 | 7 | 6 | 10 |
| 8 | 18 | 8 | 10 | 9 |
| 9 | 21 | 9 | 12 | 8 |
| 10 | 23 | 10 | 13 | 7 |
For each task that you perform, you will earn the indicated amount of profit (payment per task minus the cost per task), and the associated proceeds from successfully completed tasks will go to a fund.
For example, if you successfully solve one task, you will earn 1 ECU–1 ECU for a profit of 0 ECU, and 60% of 1 ECU will be donated to a fund.
If you solve 10 tasks, you will earn 23 ECU–10 ECU = 13 ECU, and 60% of 7 ECU will be donated to a fund.
Instructions Summary
Matchings: Please remember that you will be randomly matched with different customer types in each round.
Wage: The wage from completed tasks can be between 0 and 23 ECU.
Effort: Each worker sees the wage and then chooses an effort (number of tasks) that can be any amount between (and including) 0 and 10.
Worker Earnings: The worker earns the difference between the wage and the cost of that worker’s effort (per-unit effort cost times effort choice).
Charity Earnings: The charity will receive a donation based on the customer type and the successful effort of the worker.
There will be two treatments in the game. When you complete treatment one, you may read the instructions for treatment two and begin the next rounds.
When you have completed the experiment, please raise your hand, and an assistant will tell you where to go to get paid.
Appendix B. Screenshot of the Decoding Task
Figure A1.
Decoding task used in the experiment.

Appendix C. Post-Experiment Survey
Thank you very much for participating in our decision-making experiment. We would like to ask you a few questions.
We confirm that your anonymity will be protected, and this survey will not require you to disclose any personal information. Your responses to the questions below will not have an impact on your payment.
- Field of Study
- Gender
- What was the most important factor when making decisions in this experiment?
Please answer the following questions on a scale of 1–5, where 1 is Strongly Disagree and 5 is Strongly Agree. Please choose the number that represents your best answer.
- 4.
- I understood the tasks of this game.1 2 3 4 5
- 5.
- I wanted to make as much money as possible.1 2 3 4 5
- 6.
- I was concerned about the money going to the charity.1 2 3 4 5
- 7.
- I did not worry about the cost of my decisions.1 2 3 4 5
- 8.
- I only solved puzzles because the more puzzles I did, the more money I got.1 2 3 4 5
| 1 | Academic work is not often included in the credence good literature, but there are good reasons to compare it here. Following tenure, a professor does not necessarily have to engage in the costly effort needed for research. Many of us do so because, despite the costs, it is an enjoyable endeavor. |
| 2 | |
| 3 | In their Moral hazard treatment, the customer explicitly requested for a receipt in order to have their expenses reimbursed by the employer. |
| 4 | , with 1 being high priority and 0 being low. |
| 5 | For simplicity, this model assumes that ranges between 0 and 1, with 0 depicting full coverage and 1 depicting no insurance. |
| 6 | Fixed costs include the cost for education and other facility fees related to the profession. |
| 7 | For simplicity, this model assumes the unit of effort e is constant across all services provided. |
| 8 | That of Bejarano et al. [9] is methodologically closest to ours in that they use a neutrally framed real effort task to test Payment Scheme self-selection in Credence Goods Markets. Their study is also neutrally framed and uses a real-effort task (the same used by Green [25]). Unlike ours, they run a treatment where subjects can self-select themselves into one of the payment methods: FFS, Salary, and Capitation. Another striking difference is that, unlike them, we include an element of insurance in our FFS treatment. |
| 9 | Like Green [25] and Bejarano et al. [9], our study employs neutral framing and involves a diverse subject pool. Similarly, we utilize a real effort task, although it differs from the one used by Green [25] and Bejarano et al. [9]. Additionally, our study shares similarities with that of Hennig-Schmidt et al. [21], as we compare two crucial payment systems and establish payoffs that decrease monotonically as the distance from the optimal number increases. |
| 10 | Hart et al. [7] refer to the variable λ that signifies the extent to which a public employee is irreplaceable. As λ approaches 1, the employee is less easily replaced and thus has a share in any improvement gains he/she makes, increasing incentives to make improvements. Correspondingly, as λ approaches 0, these incentives erode. |
| 11 | Again, the comparison with research comes to mind. Most tenured professors continue to engage in research, which requires costly effort, because it is enjoyable and intellectually challenging. |
| 12 | In the salary treatment, individual earnings were the difference between 13 ECUs and the cost per task depending on the number of tasks performed, e.g., if a person performed seven tasks in a given round, the earnings for that round were 13 ECUs – 7 ECUs = 6 ECUs. In FFS, the earnings for a round were the difference between the amount per task earned and the effort cost depending on the number of tasks performed, e.g., if a person performed 10 tasks in a given round, the earnings for that round were 23 ECUs – 10 ECUs = 13 ECUs |
| 13 | Subjects were informed upfront if they would be serving a customer who has insurance coverage or not. Insurance coverage had no effect on the optimal number of services required; instead, it only impacted customer benefits. |
| 14 | The expectation was to allocate a monetary value equivalent to 60% of total benefits to a charity focused on pediatric care in Helsinki, Finland. However, given grant rules, we were compelled to change the recipient. Subjects were informed of this limitation and were notified that the benefits will be allocated to a research fund. |
| 15 | This meant that subjects could choose to not perform any task at all or a maximum of 10 tasks. |
| 16 | Three subjects did not complete the experiment. The final dataset does not include decisions made by these subjects. |
| 17 | In total, 9.5% of the participants did not wish to mention their gender. |
| 18 | All participants were 18 years old or older. |
| 19 | The exchange rate per ECU was 0.09. In addition to the earnings made in the game, each participant received a show-up fee of EUR 5. |
| 20 | Mode of 7 and SD of 3.5. |
| 21 | Alternative hypothesis: true location is not equal to 5. Based on the p-value, we failed to reject the null hypothesis. |
| 22 | The ideal number of services required for customer type 2 was three, and the average number of services provided was 3.8 |
| 23 | The subjects were informed that they could choose to make any number of decisions between and including 0 and 10, and should they choose to perform less than 0, they could press the “Next round” button on the screen and move to the next round. |
| 24 | In total, 2.9% of the subjects assigned to salary treatment did mention ‘having fun’ as a decisive factor in decision making. |
| 25 | Salary subjects were charged 1 ECU per task, regardless of whether the tasks were performed correctly or not. |
| 26 | The absolute difference between the number of tasks required and the number of tasks provided. |
| 27 | As the insurance condition was not included in the salary treatment, it was not considered in the regression analysis. |
| 28 | For each round of play, we recorded the number of faulty tasks completed by each subject and then generated a binary variable to indicate whether any faulty tasks were performed during that round. |
| 29 | The similar standard errors observed in the first two models and the consistent coefficient estimation for the FFS treatment variable can be attributed to several factors. First, the FFS treatment consistently influences the outcomes of interest, such as the total number of tasks and the deviation from the ideal number of tasks. As described in sections 6a and 6b of the analysis, subjects receiving the FFS treatment tend to perform a higher number of tasks and exhibit a positive mean deviation from the ideal task count. This consistent effect of the FFS treatment can lead to similar coefficient estimates across the two models. Additionally, the similarity in variance between the two dependent variables contributes to the identical standard errors. We conducted an F-test to compare the variances of the residuals or errors from the two models, which yielded a p-value of 1, indicating that the variances were statistically similar. This suggests that the variability in observations remains consistent across different levels of the predictors, irrespective of the specific dependent variable. Consequently, the standard errors are comparable between the models. |
| 30 | For instance, Lindqvist [6] claims that, in the absence of financial incentives to induce treatment, public sector managers always give a diagnosis against treatment in case the treatment requires additional effort, while Hart, Shleifer, and Vishny [7] argue that private hospitals could find ways to save money by rejecting extremely sick and expensive-to-treat patients. |
References
- Darby, M.R.; Karni, E. Free Competition and the Optimal Amount of Fraud. J. Law Econ. 1973, 16, 67–88. [Google Scholar] [CrossRef]
- Ellis, R.P.; McGuire, T.G. Provider Behavior under Prospective Reimbursement: Cost Sharing and Supply. J. Health Econ. 1986, 5, 129–151. [Google Scholar] [CrossRef] [PubMed]
- Balafoutas, L.; Beck, A.; Kerschbamer, R.; Sutter, M. What Drives Taxi Drivers? A Field Experiment on Fraud in a Market for Credence Goods. Rev. Econ. Stud. 2013, 80, 876–891. [Google Scholar] [CrossRef]
- Kerschbamer, R.; Neururer, D.; Sutter, M. Insurance Coverage of Customers Induces Dishonesty of Sellers in Markets for Credence Goods. Proc. Natl. Acad. Sci. USA 2016, 113, 7454–7458. [Google Scholar] [CrossRef] [PubMed]
- Balafoutas, L.; Kerschbamer, R. Credence Goods in the Literature: What the Past Fifteen Years Have Taught Us about Fraud, Incentives, and the Role of Institutions. J. Behav. Exp. Financ. 2020, 26, 100285. [Google Scholar] [CrossRef]
- Lindqvist, E. Privatization of Credence Goods: Theory and an Application to Residential Youth Care; IFN Working Paper: Stockholm, Sweden, 2008. [Google Scholar]
- Hart, O.; Shleifer, A.; Vishny, R.W. The Proper Scope of Government: Theory and an Application to Prisons. Q. J. Econ. 1997, 112, 1127–1161. [Google Scholar] [CrossRef]
- Arrow, K.J. 21—Uncertainty and the Welfare Economics of Medical Care. In Uncertainty in Economics; Diamond, P., Rothschild, M., Eds.; Academic Press: Cambridge, MA, USA, 1978; pp. 345–375. ISBN 978-0-12-214850-7. [Google Scholar]
- Bejarano, H.; Green, E.P.; Rassenti, S. Payment Scheme Self-Selection in the Credence Goods Market: An Experimental Study. J. Econ. Behav. Organ. 2017, 142, 396–403. [Google Scholar] [CrossRef]
- Tulchinsky, T.H.; Varavikova, E.A. Chapter 11—Measuring Costs: The Economics of Health. In The New Public Health (Third Edition); Tulchinsky, T.H., Varavikova, E.A., Eds.; Academic Press: San Diego, CA, USA, 2014; pp. 575–611. ISBN 978-0-12-415766-8. [Google Scholar]
- Rice, T. Chapter 2—Key Components of National Health Insurance Systems. In Health Insurance Systems; Rice, T., Ed.; Academic Press: Cambridge, MA, USA, 2021; pp. 9–33. ISBN 978-0-12-816072-5. [Google Scholar]
- Dowd, B.E.; Laugesen, M.J. Fee-for-Service Payment Is Not the (Main) Problem. Health Serv. Res. 2020, 55, 491–495. [Google Scholar] [CrossRef]
- Balafoutas, L.; Kerschbamer, R.; Sutter, M. Second-Degree Moral Hazard in a Real-World Credence Goods Market. Econ. J. 2017, 127, 1–18. [Google Scholar] [CrossRef]
- Balafoutas, L.; Fornwagner, H.; Kerschbamer, R.; Sutter, M. Diagnostic Uncertainty and Insurance Coverage in Credence Goods Markets. CESifo Work. Pap No. 8681. 2020. [CrossRef]
- Sülzle, K.; Wambach, A. Insurance in a Market for Credence Goods. J. Risk Insur. 2005, 72, 159–176. [Google Scholar] [CrossRef]
- Hsiao, W. Abnormal Economics in the Health Sector. Health Policy 1995, 32, 125–139. [Google Scholar] [CrossRef]
- Chalkley, M.; Tilley, C. The Existence and Nature of Physician Agency: Evidence of Stinting from the British National Health Service. J. Econ. Manag. Strategy 2005, 14, 647–664. [Google Scholar] [CrossRef]
- Lagarde, M.; Blaauw, D. Overtreatment and Benevolent Provider Moral Hazard: Evidence from South African Doctors. J. Dev. Econ. 2022, 158, 102917. [Google Scholar] [CrossRef]
- Zabrodina, V.; Dusheiko, M.; Moschetti, K. A Moneymaking Scan: Dual Reimbursement Systems and Supplier-Induced Demand for Diagnostic Imaging. Health Econ. 2020, 29, 1566–1585. [Google Scholar] [CrossRef]
- Huck, S.; Lünser, G.; Spitzer, F.; Tyran, J.-R. Medical Insurance and Free Choice of Physician Shape Patient Overtreatment: A Laboratory Experiment. J. Econ. Behav. Organ. 2016, 131, 78–105. [Google Scholar] [CrossRef]
- Hennig-Schmidt, H.; Selten, R.; Wiesen, D. How Payment Systems Affect Physicians’ Provision Behaviour—An Experimental Investigation. J. Health Econ. 2011, 30, 637–646. [Google Scholar] [CrossRef]
- Brosig-Koch, J.; Hennig-Schmidt, H.; Kairies-Schwarz, N.; Wiesen, D. The Effects of Introducing Mixed Payment Systems for Physicians: Experimental Evidence: The Effects of Introducing Mixed Payment Systems for Physicians. Health Econ. 2017, 26, 243–262. [Google Scholar] [CrossRef]
- Hennig-Schmidt, H.; Wiesen, D. Other-Regarding Behavior and Motivation in Health Care Provision: An Experiment with Medical and Non-Medical Students. Soc. Sci. Med. 2014, 108, 156–165. [Google Scholar] [CrossRef]
- Seyedin, H.; Afshari, M.; Isfahani, P.; Hasanzadeh, E.; Radinmanesh, M.; Bahador, R.C. The Main Factors of Supplier-Induced Demand in Health Care: A Qualitative Study. J. Educ. Health Promot. 2021, 10, 49. [Google Scholar] [CrossRef] [PubMed]
- Green, E.P. Payment Systems in the Healthcare Industry: An Experimental Study of Physician Incentives. J. Econ. Behav. Organ. 2014, 106, 367–378. [Google Scholar] [CrossRef]
- Brill, S. Bitter Pill: Why Medical Bills Are Killing Us|Time. Available online: https://time.com/198/bitter-pill-why-medical-bills-are-killing-us/ (accessed on 22 February 2023).
- Brekke, K.R.; Holmås, T.H.; Monstad, K.; Straume, O.R. How Does the Type of Remuneration Affect Physician Behaviour? Fixed Salary versus Fee-for-Service. Am. J. Health Econ. 2020, 6, 104–138. [Google Scholar] [CrossRef]
- Gaynor, M.; Gertler, P. Moral Hazard and Risk Spreading in Partnerships. RAND J. Econ. 1995, 26, 591–613. [Google Scholar] [CrossRef]
- Keser, C.; Montmarquette, C.; Schmidt, M.; Schnitzler, C. Custom-Made Health-Care: An Experimental Investigation. Health Econ. Rev. 2020, 10, 41. [Google Scholar] [CrossRef] [PubMed]
- Lagarde, M.; Blaauw, D. Physicians’ Responses to Financial and Social Incentives: A Medically Framed Real Effort Experiment. Soc. Sci. Med. 2017, 179, 147–159. [Google Scholar] [CrossRef]
- Ahlert, M.; Felder, S.; Vogt, B. Which Patients Do I Treat? An Experimental Study with Economists and Physicians. Health Econ. Rev. 2012, 2, 1. [Google Scholar] [CrossRef]
- Angerer, S.; Glätzle-Rützler, D.; Waibel, C. Framing and Subject Pool Effects in Healthcare Credence Goods. J. Behav. Exp. Econ. 2023, 103, 101973. [Google Scholar] [CrossRef]
- Kreier, R. Moral Hazard: It’s the Supply Side, Stupid. World Aff. Wash. World Aff. 2019, 182, 205–223. [Google Scholar] [CrossRef]
- Lu, F. Insurance Coverage and Agency Problems in Doctor Prescriptions: Evidence from a Field Experiment in China. J. Dev. Econ. 2014, 106, 156–167. [Google Scholar] [CrossRef]
- Lundin, D. Moral Hazard in Physician Prescription Behavior. J. Health Econ. 2000, 19, 639–662. [Google Scholar] [CrossRef]
- Karunadasa, M.; Sieberg, K. Moral Hazard: Who’s to Blame? A Conceptual Analysis Approach to Supply-Side Moral Hazard in Healthcare. Health Care Anal. 2023. [Google Scholar]
- Duggan, J. Candidate Objectives and Electoral Equilibrium. In The Oxford Handbook of Political Economy; Weingast, B.R., Wittman, D., Eds.; Oxford University Press: Oxford, UK, 2006; ISBN 978-0-19-927222-8. [Google Scholar]
- McGuire, T.G. Physician Agency. In Handbook of Health Economics 1, Part A; Culyer, A.J., Newhouse, J.P., Eds.; Elsevier: Amsterdam, The Netherlands, 2000; pp. 461–536. ISBN 978-0-444-50470-8. [Google Scholar]
- Chen, D.L.; Schonger, M.; Wickens, C. OTree—An Open-Source Platform for Laboratory, Online, and Field Experiments. J. Behav. Exp. Financ. 2016, 9, 88–97. [Google Scholar] [CrossRef]
- Charness, G.; Gneezy, U.; Henderson, A. Experimental Methods: Measuring Effort in Economics Experiments. J. Econ. Behav. Organ. 2018, 149, 74–87. [Google Scholar] [CrossRef]
- Jokipalo, V.; Sieberg, K. Power, Responsibility and Social Policy: The Impact of Basic Income in a Competitive Experimental Labor Market. In Power and Responsibility: Interdisciplinary Perspectives for the 21st Century in Honor of Manfred J. Holler; Leroch, M.A., Rupp, F., Eds.; Springer International Publishing: Cham, The Netherlands, 2023; pp. 75–103. ISBN 978-3-031-23015-8. [Google Scholar]
- Lezzi, E.; Fleming, P.; Zizzo, D.J. Does It Matter Which Effort Task You Use? A Comparison of Four Effort Tasks When Agents Compete for a Prize. 2015. Available online: https://doi.org/10.2139/ssrn.2594659 (accessed on 22 February 2023).
- R Studio Team. RStudio: Integrated Development for R; RStudio, PBC: Boston, MA, USA, 2020. [Google Scholar]
- Hlavac, M. Stargazer: Well-Formatted Regression and Summary Statistics Tables, R package version 5.2.3; Social Policy Institute: Bratislava, Slovakia; Available online: https://CRAN.R-project.org/package=stargazer (accessed on 22 February 2023).
- Wickham, H. Ggplot2: Elegant Graphics for Data Analysis; Springer: Berlin/Heidelberg, Germany, 2016. [Google Scholar]
- Venables, W.N.; Ripley, B.D. Modern Applied Statistics with S, 4th ed.; Springer: New York, NY, USA, 2002; ISBN 0-387-95457-0. [Google Scholar]
- Bates, D.; Mächler, M.; Bolker, B.; Walker, S. Fitting Linear Mixed-Effects Models Using Lme4. J. Stat. Softw. 2015, 67, 1–48. [Google Scholar] [CrossRef]
- Andreoni, J. Why Free Ride?: Strategies and Learning in Public Goods Experiments. J. Public Econ. 1988, 37, 291–304. [Google Scholar] [CrossRef]
- Keser, C.; Schnitzler, C. Money Talks—Paying Physicians for Performance. Revised Version, Cege Discussion Paper Number 173. 2014. Available online: https://doi.org/10.2139/ssrn.2357326 (accessed on 22 February 2023). [CrossRef]
- Levitt, S.D.; List, J.A. Viewpoint: On the Generalizability of Lab Behaviour to the Field (A Propos de Lapossibilité de Généraliser Les Comportements de Laboratoire à Ce Qui Se Passe Sur Le Terrain). Can. J. Econ. Rev. Can. Econ. 2007, 40, 347–370. [Google Scholar] [CrossRef]
Figure 1.
Customer benefits according to the number of tasks performed.

Figure 2.
Average number of tasks performed per round according to remuneration types.

Figure 3.
Boxplot of the number of tasks performed on each customer type according to the remuneration system.
Figure 3.
Boxplot of the number of tasks performed on each customer type according to the remuneration system.

Figure 4.
Average number of tasks per customer type according to the remuneration system.

Figure 5.
Average payoff per round according to the remuneration system.

Figure 6.
Number of tasks performed in FFS according to insurance coverage.

Figure 7.
Average number of faulty tasks per round.

Figure 8.
Customer benefit losses according to the remuneration system.


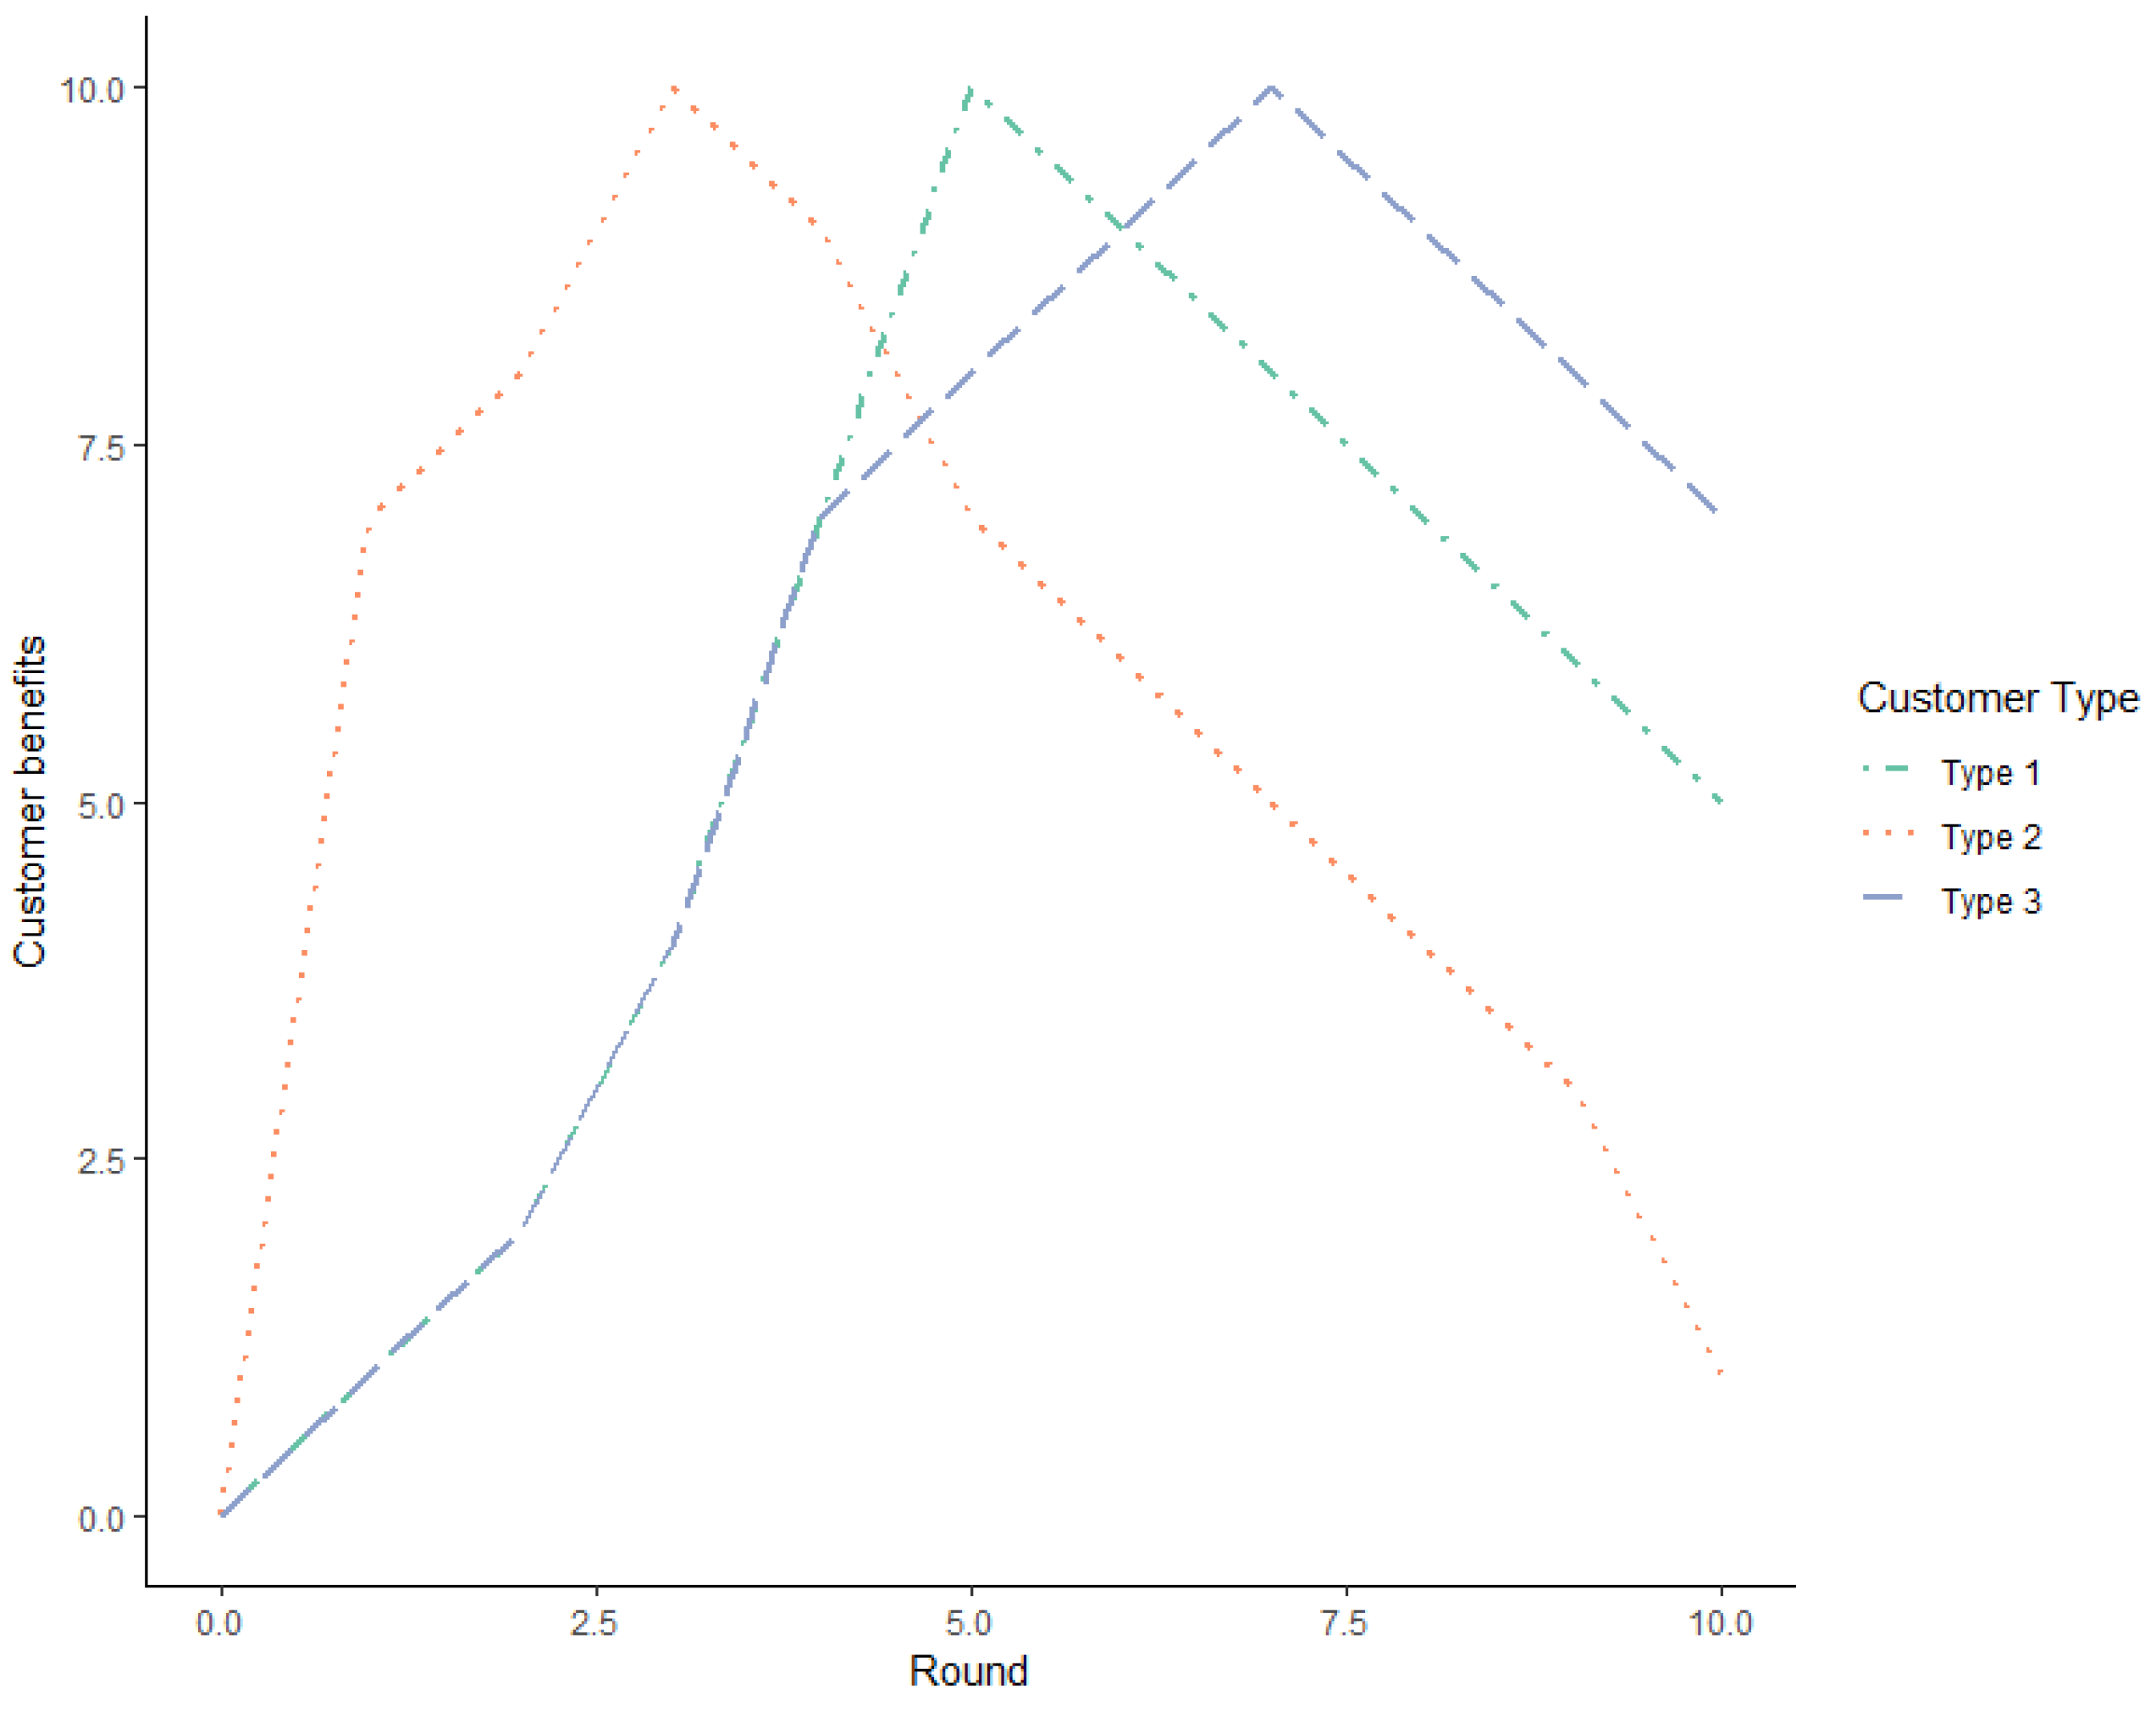
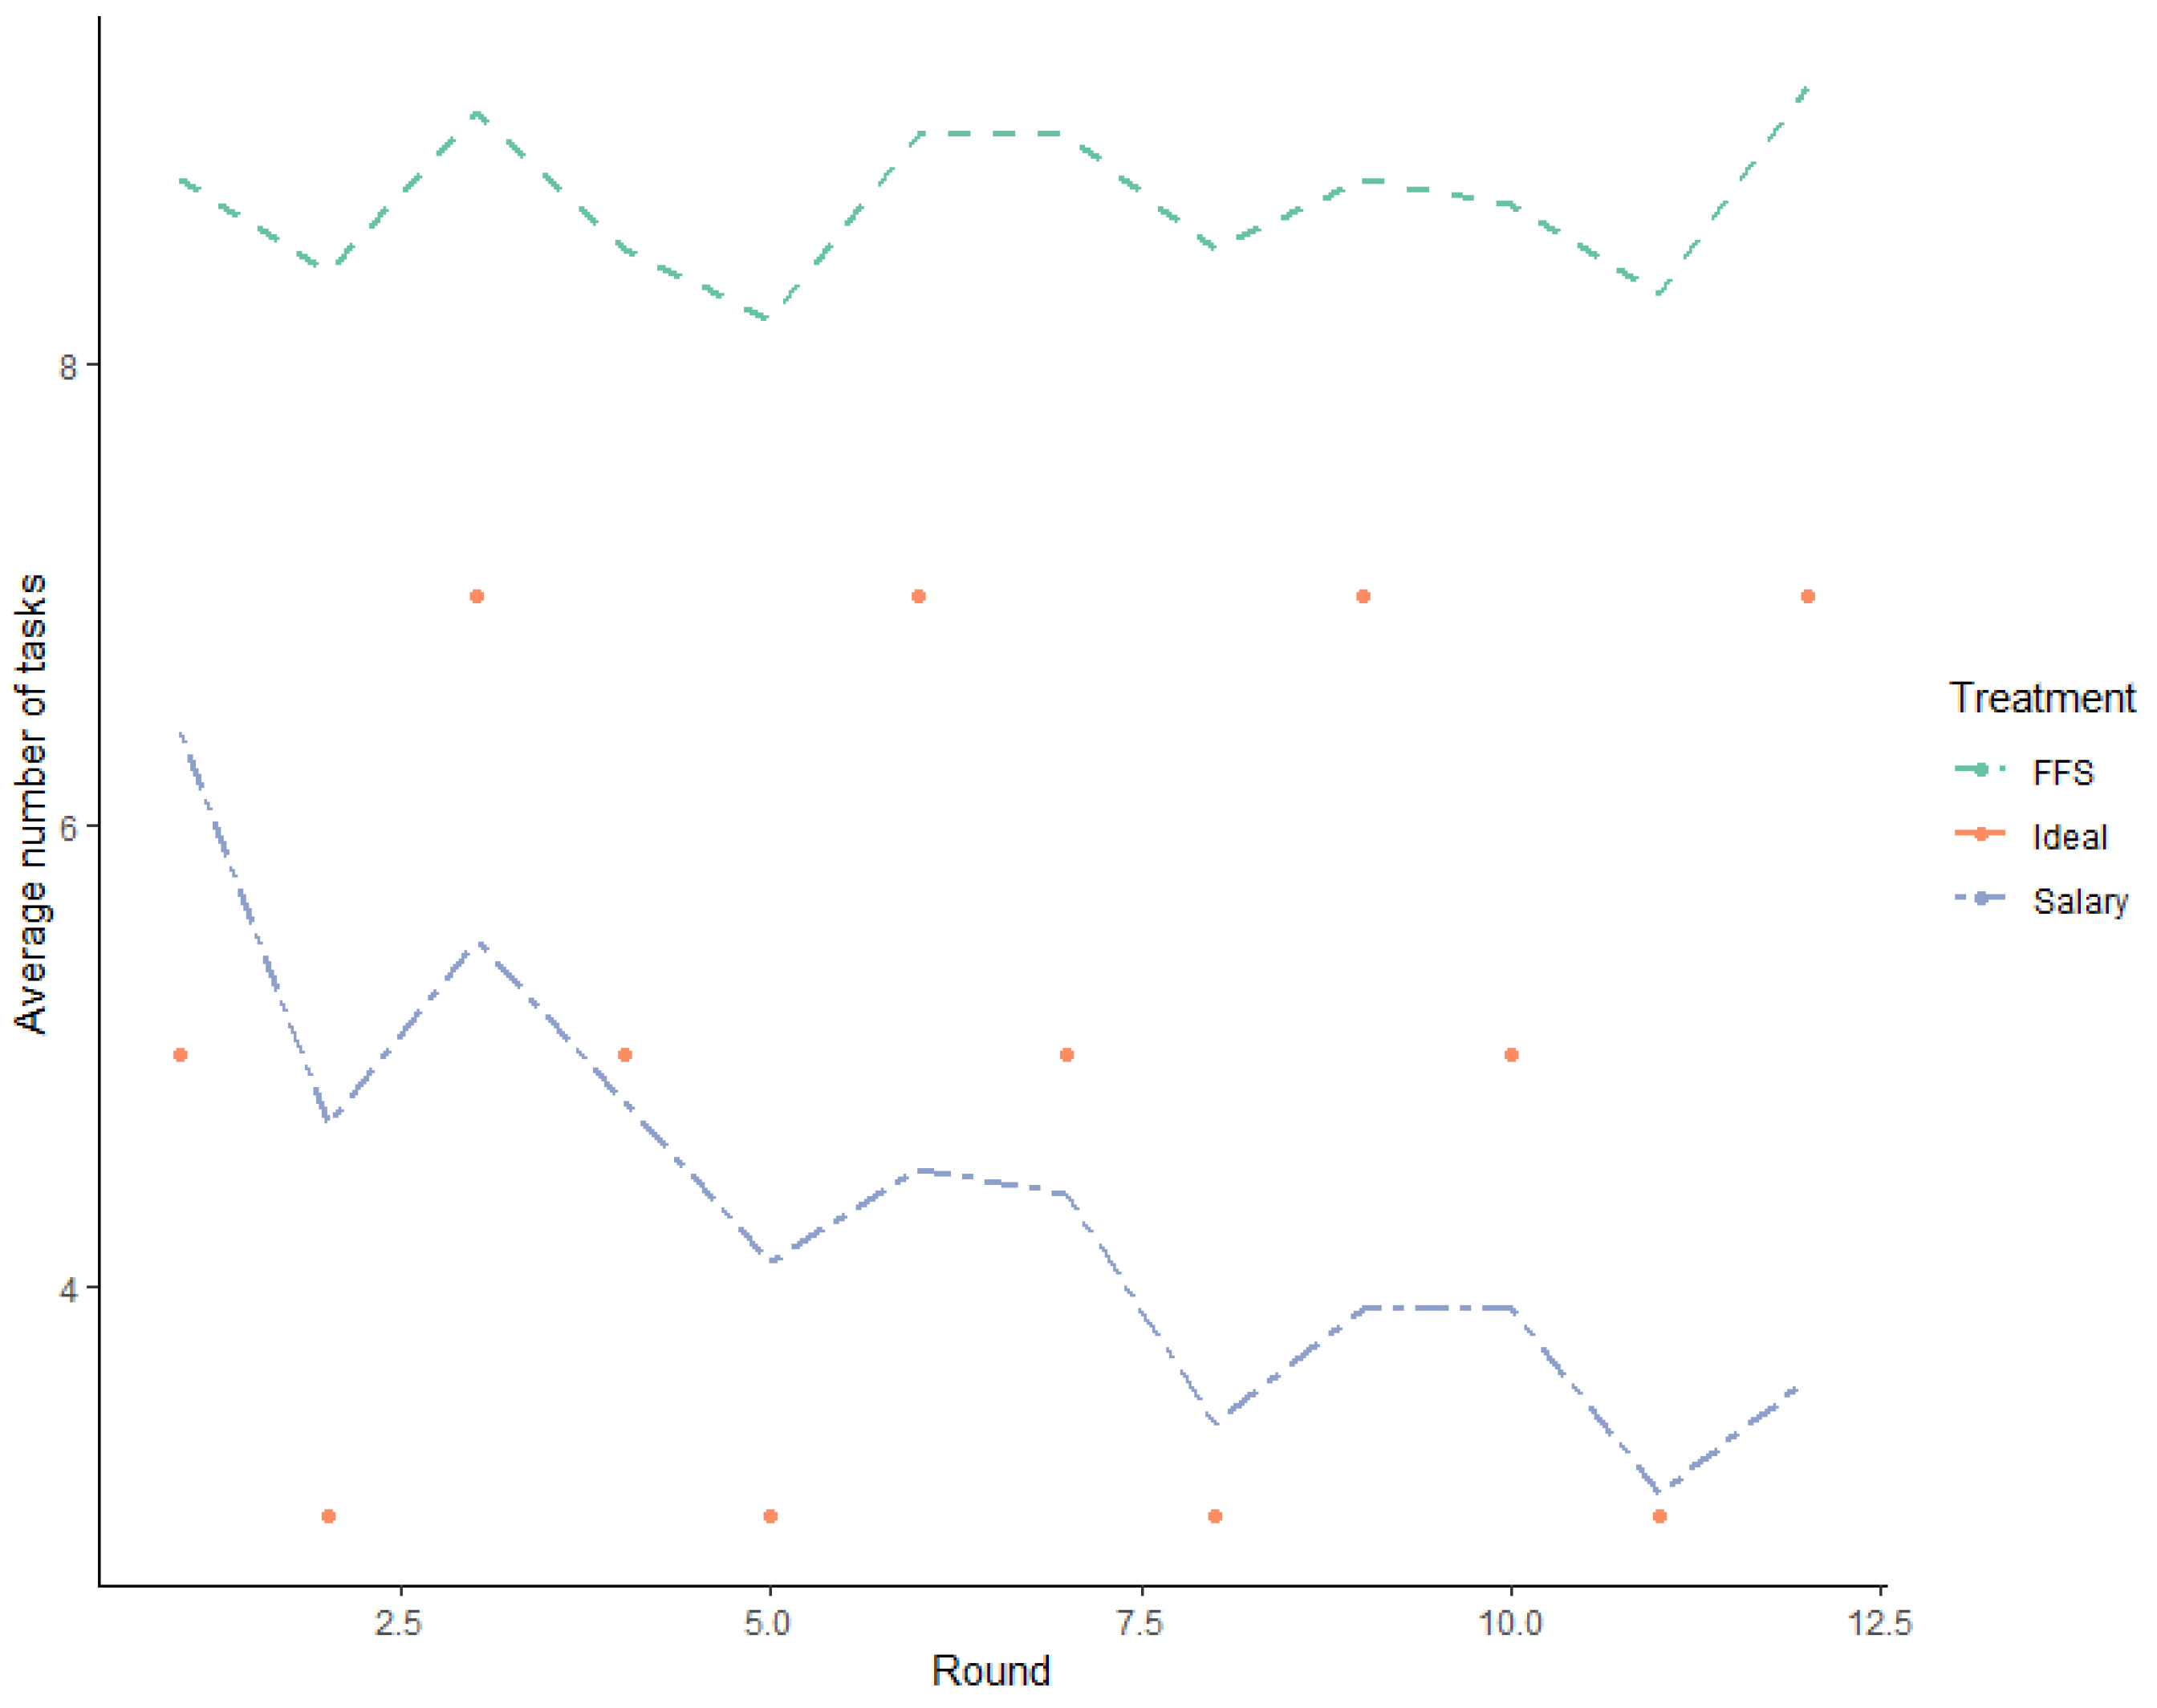
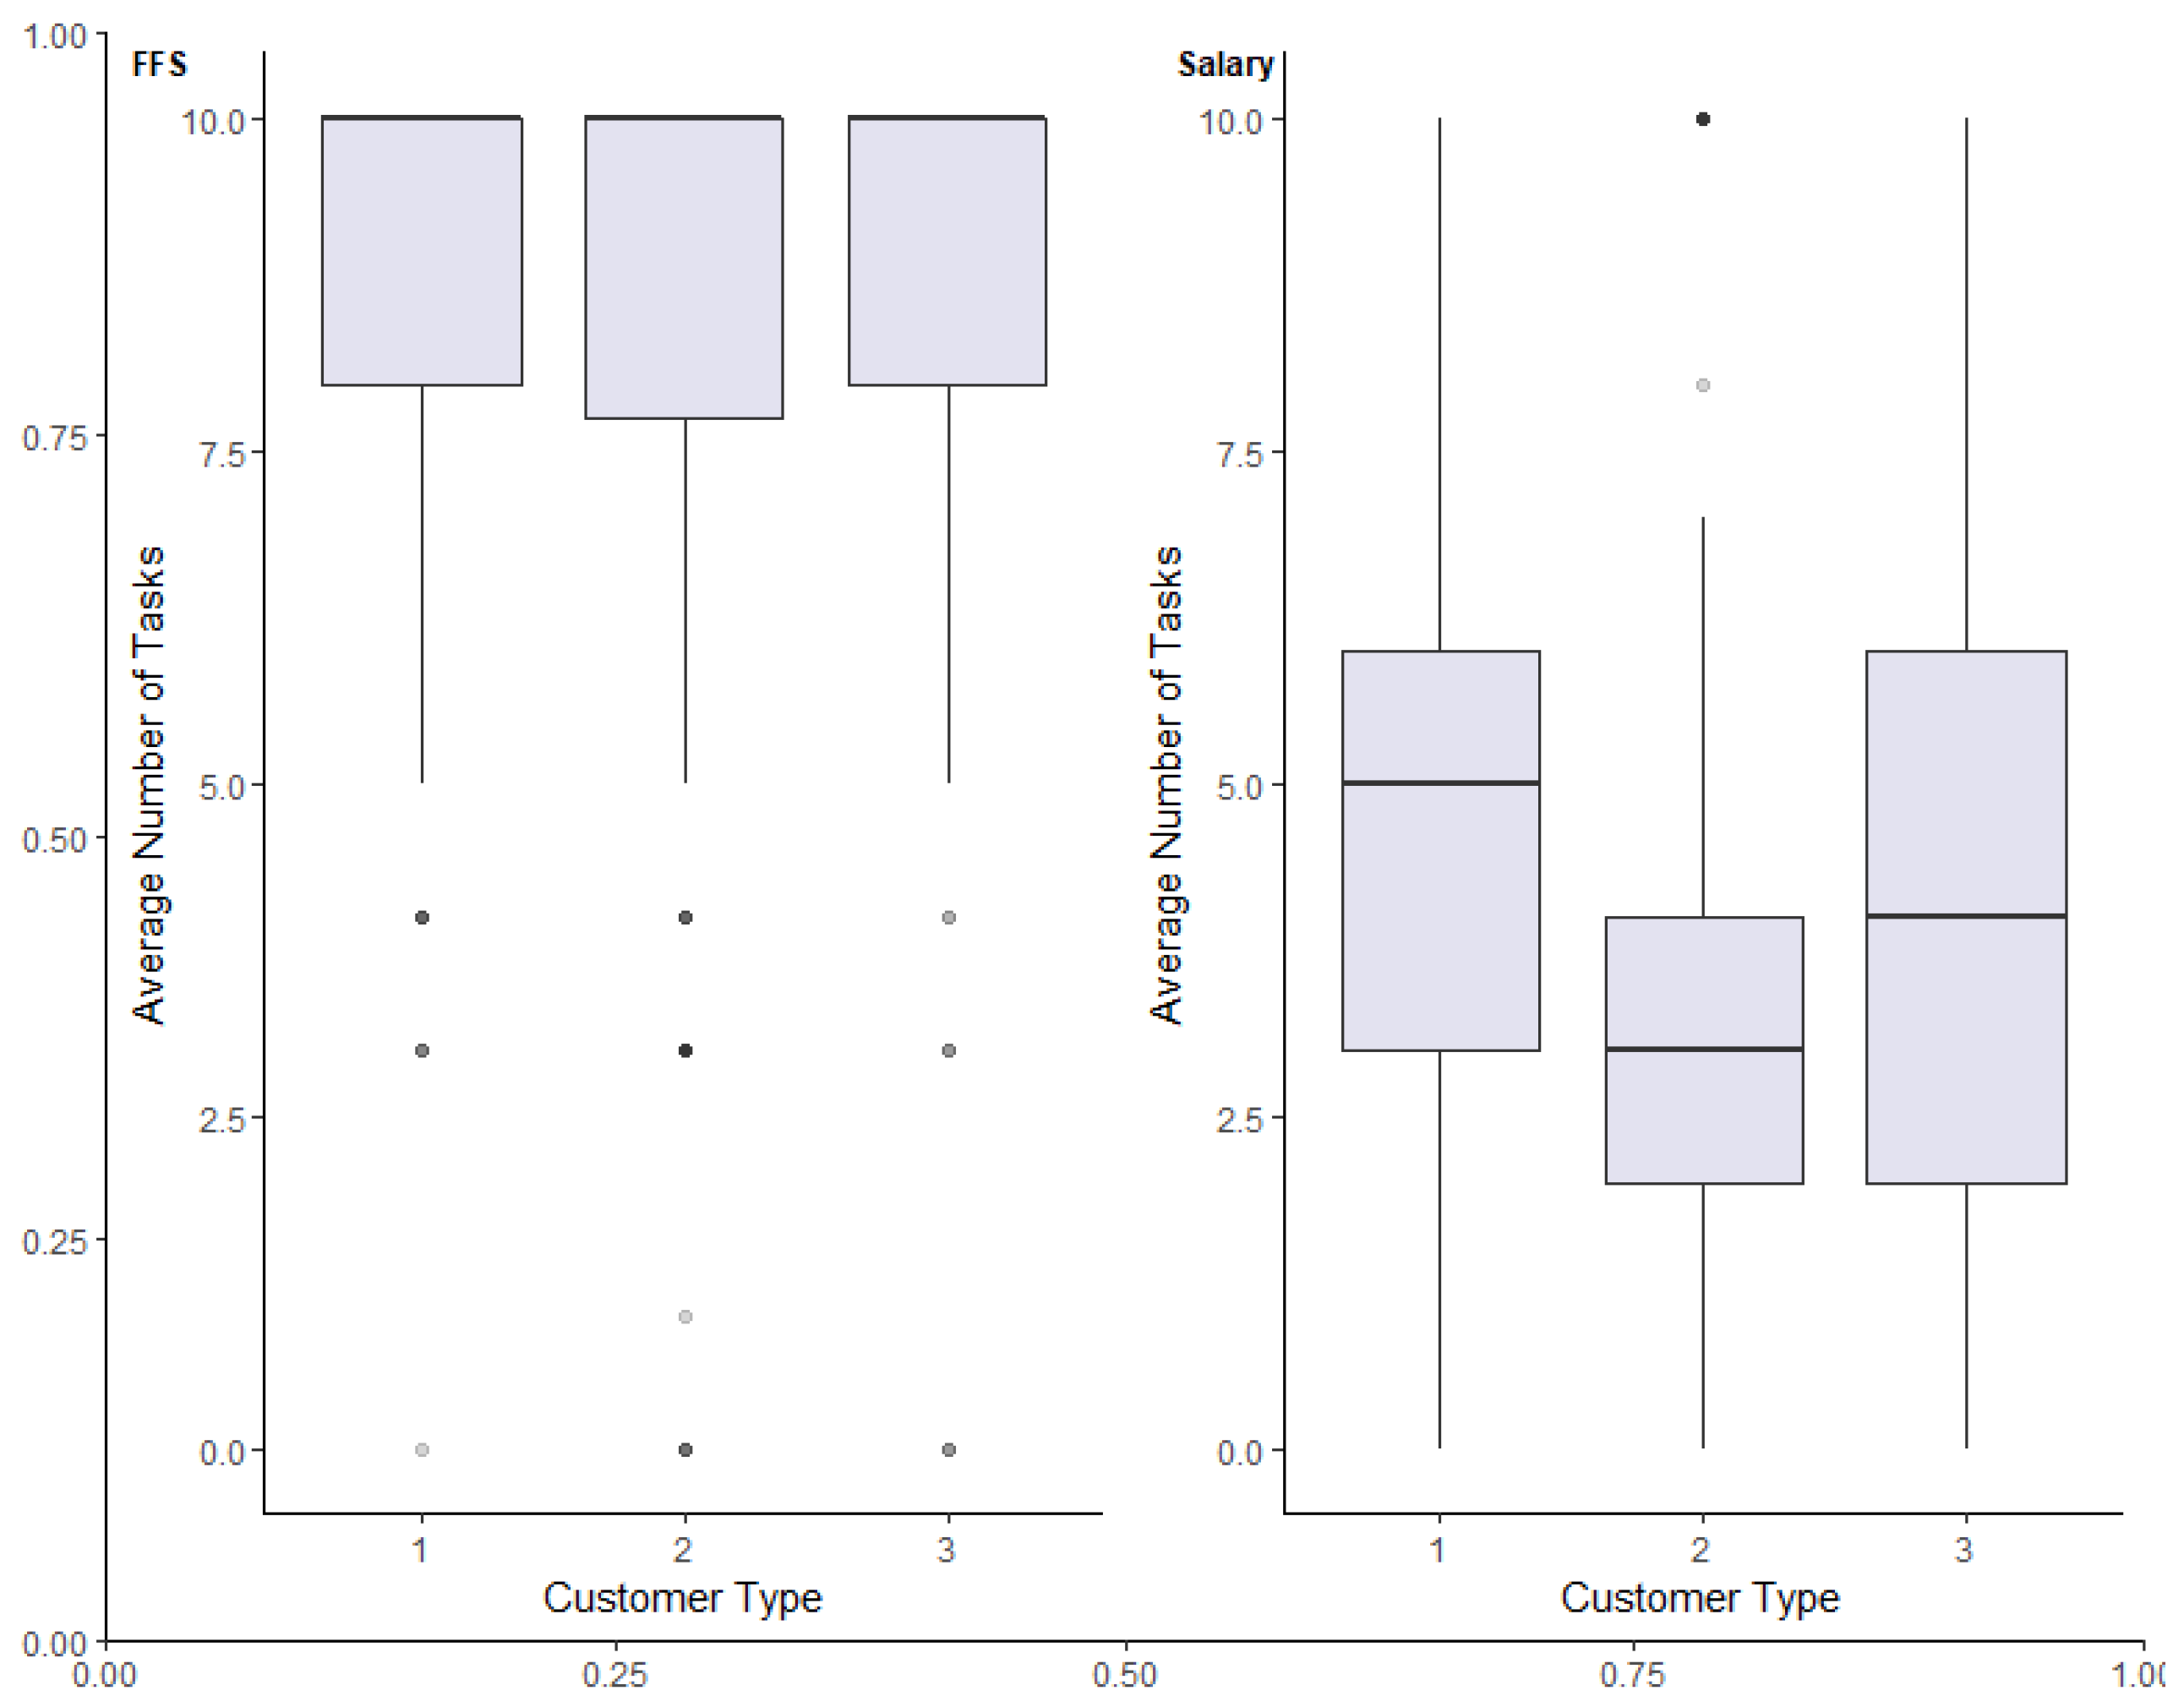
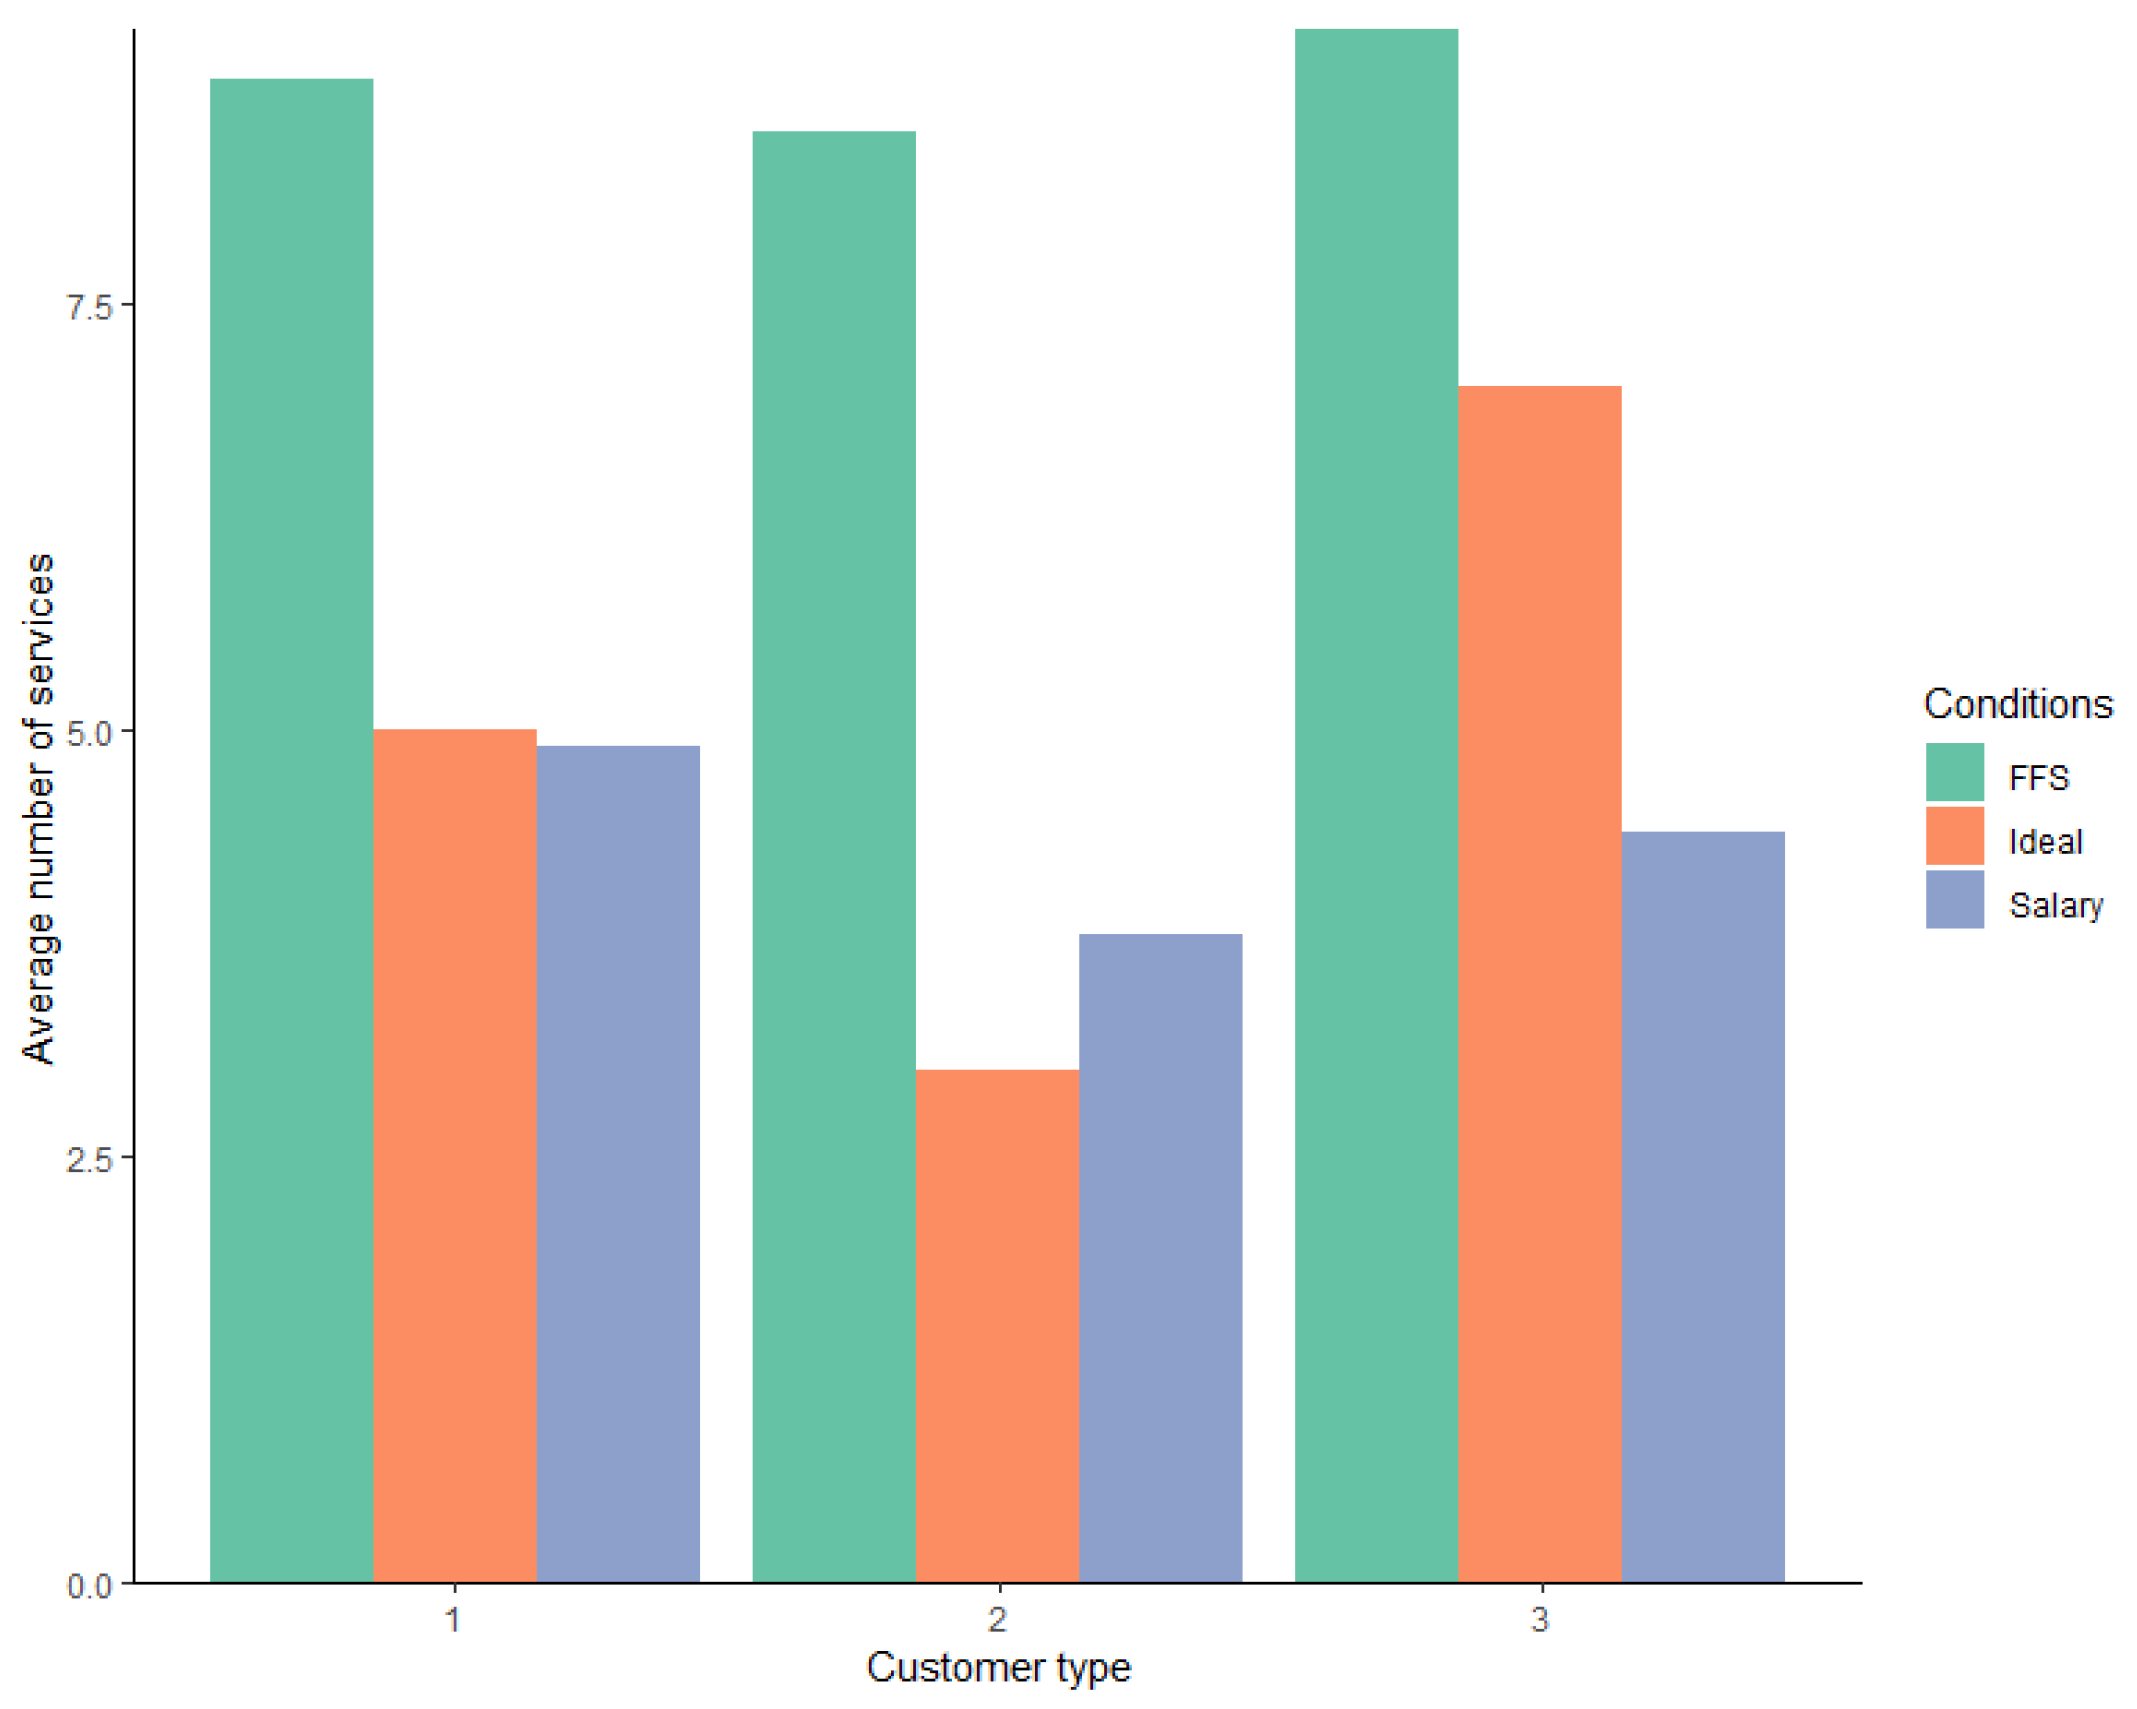
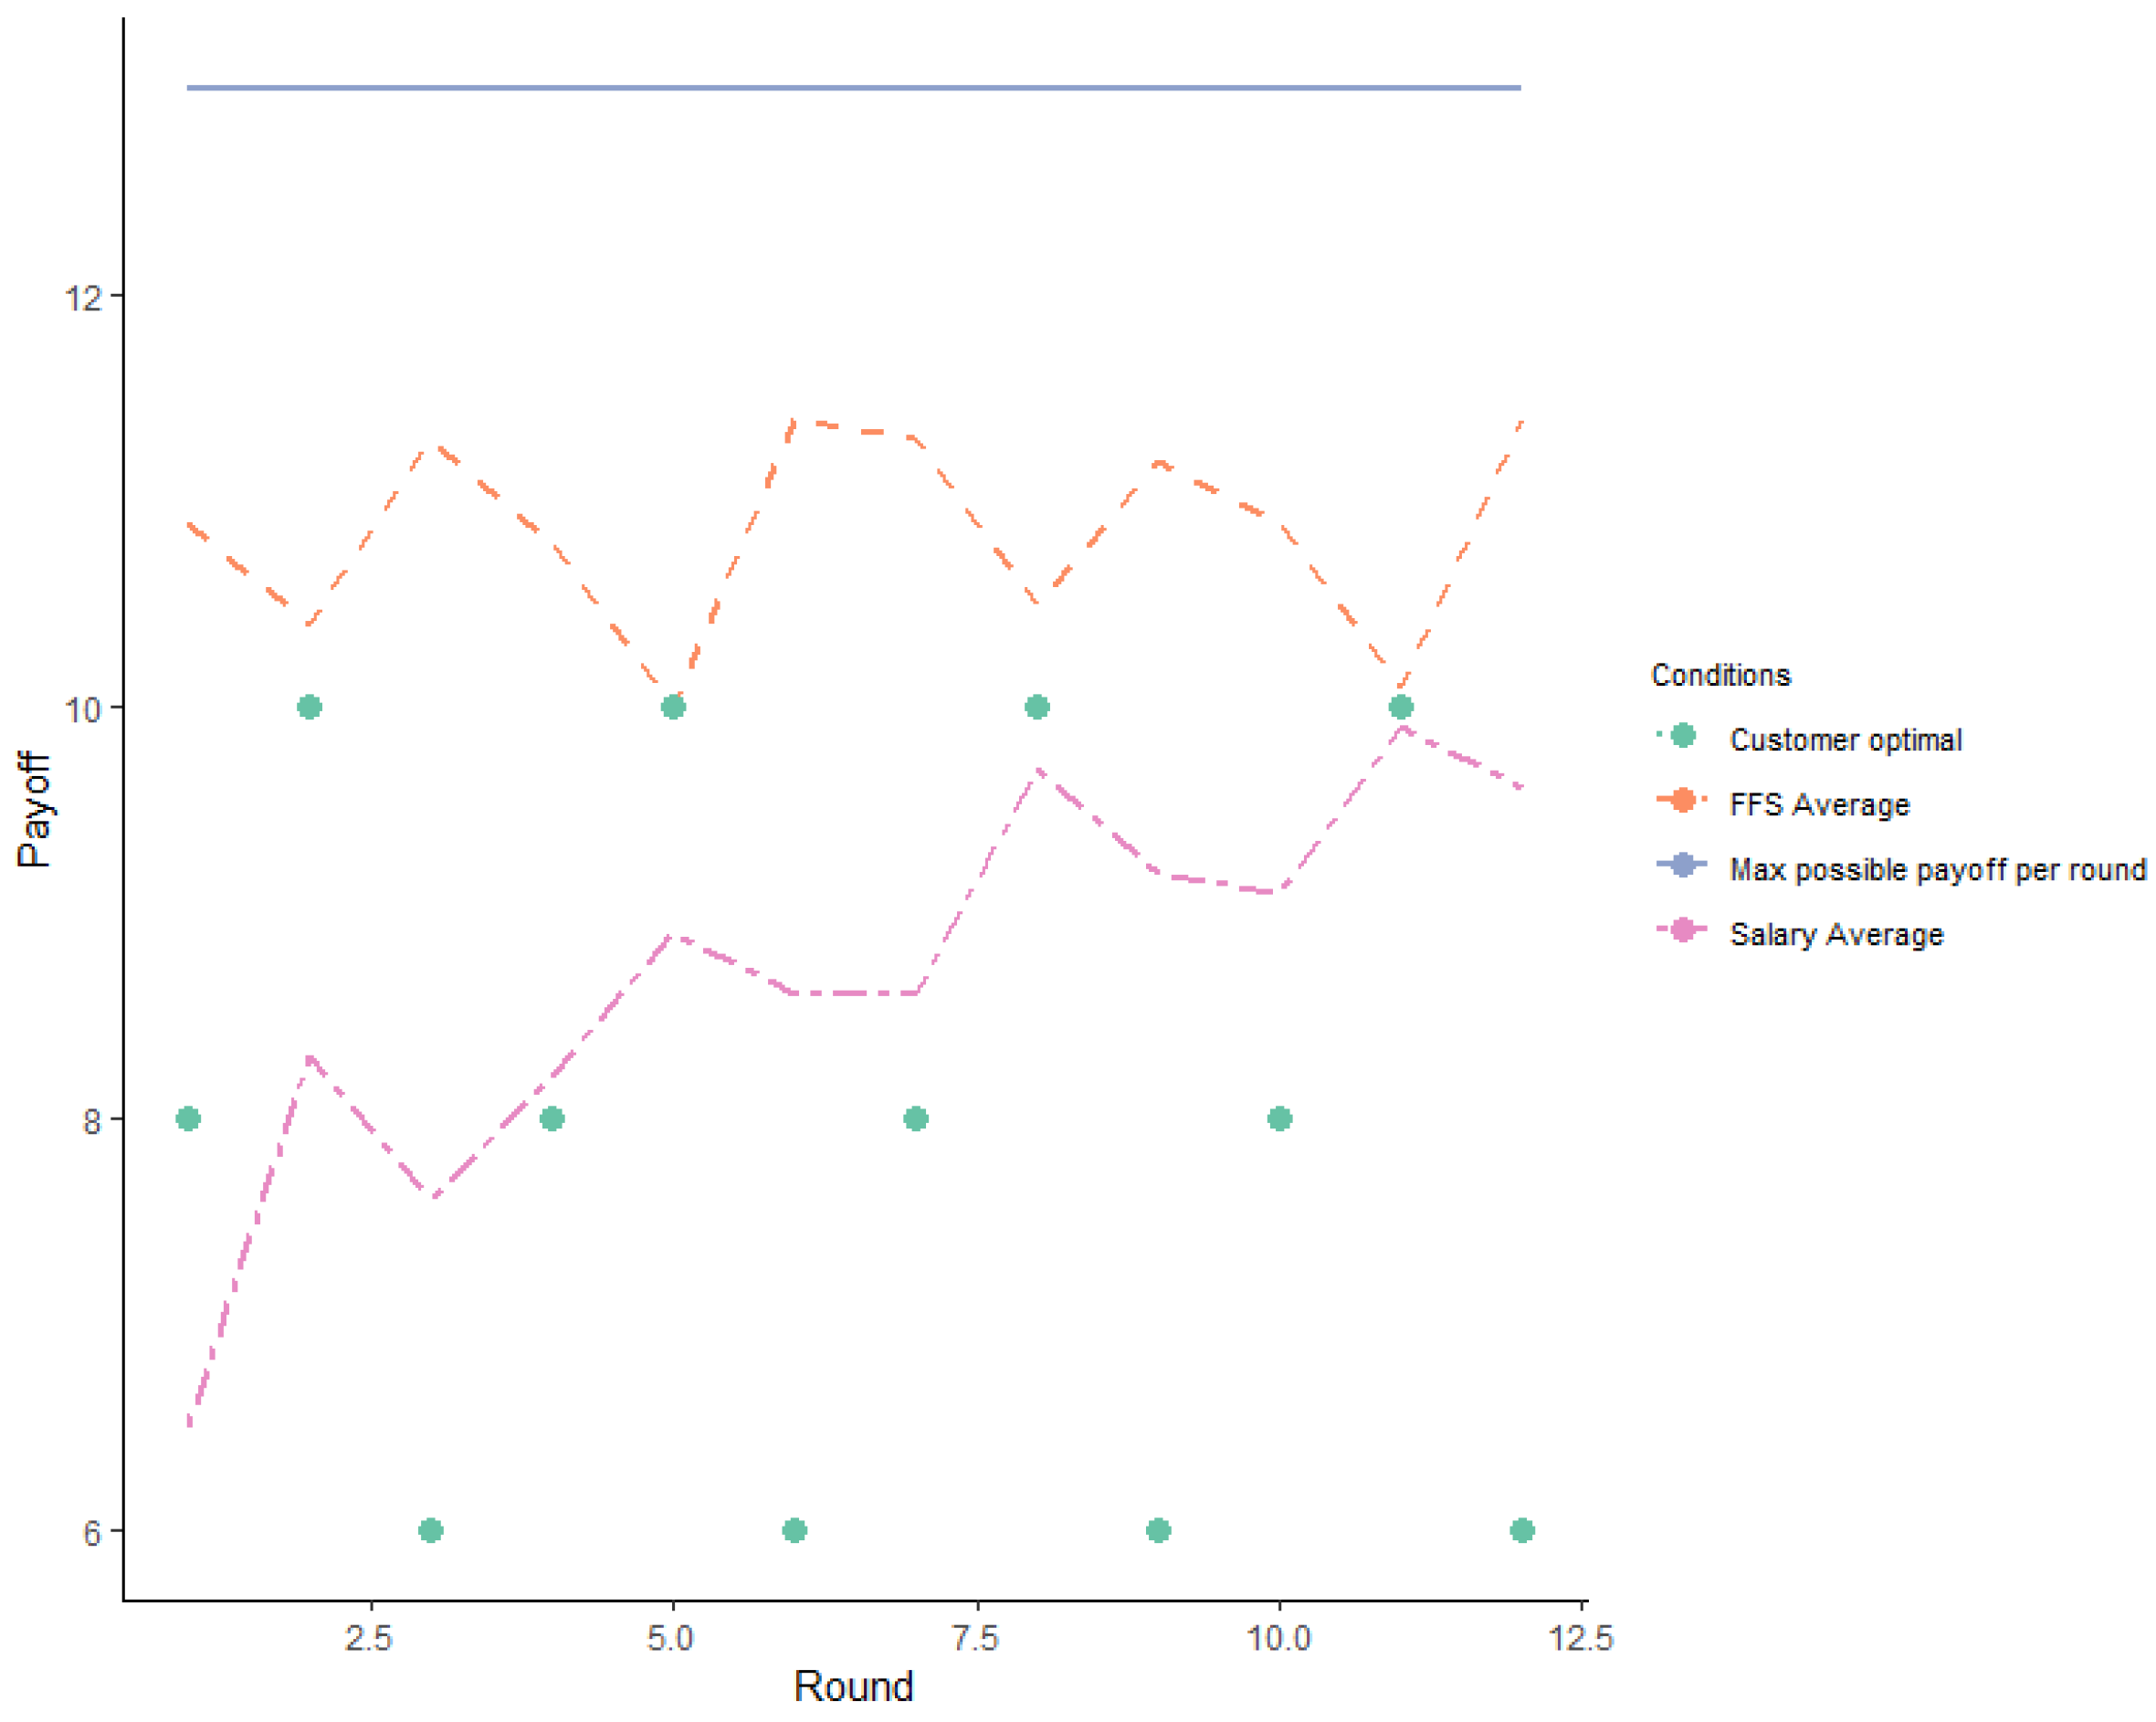
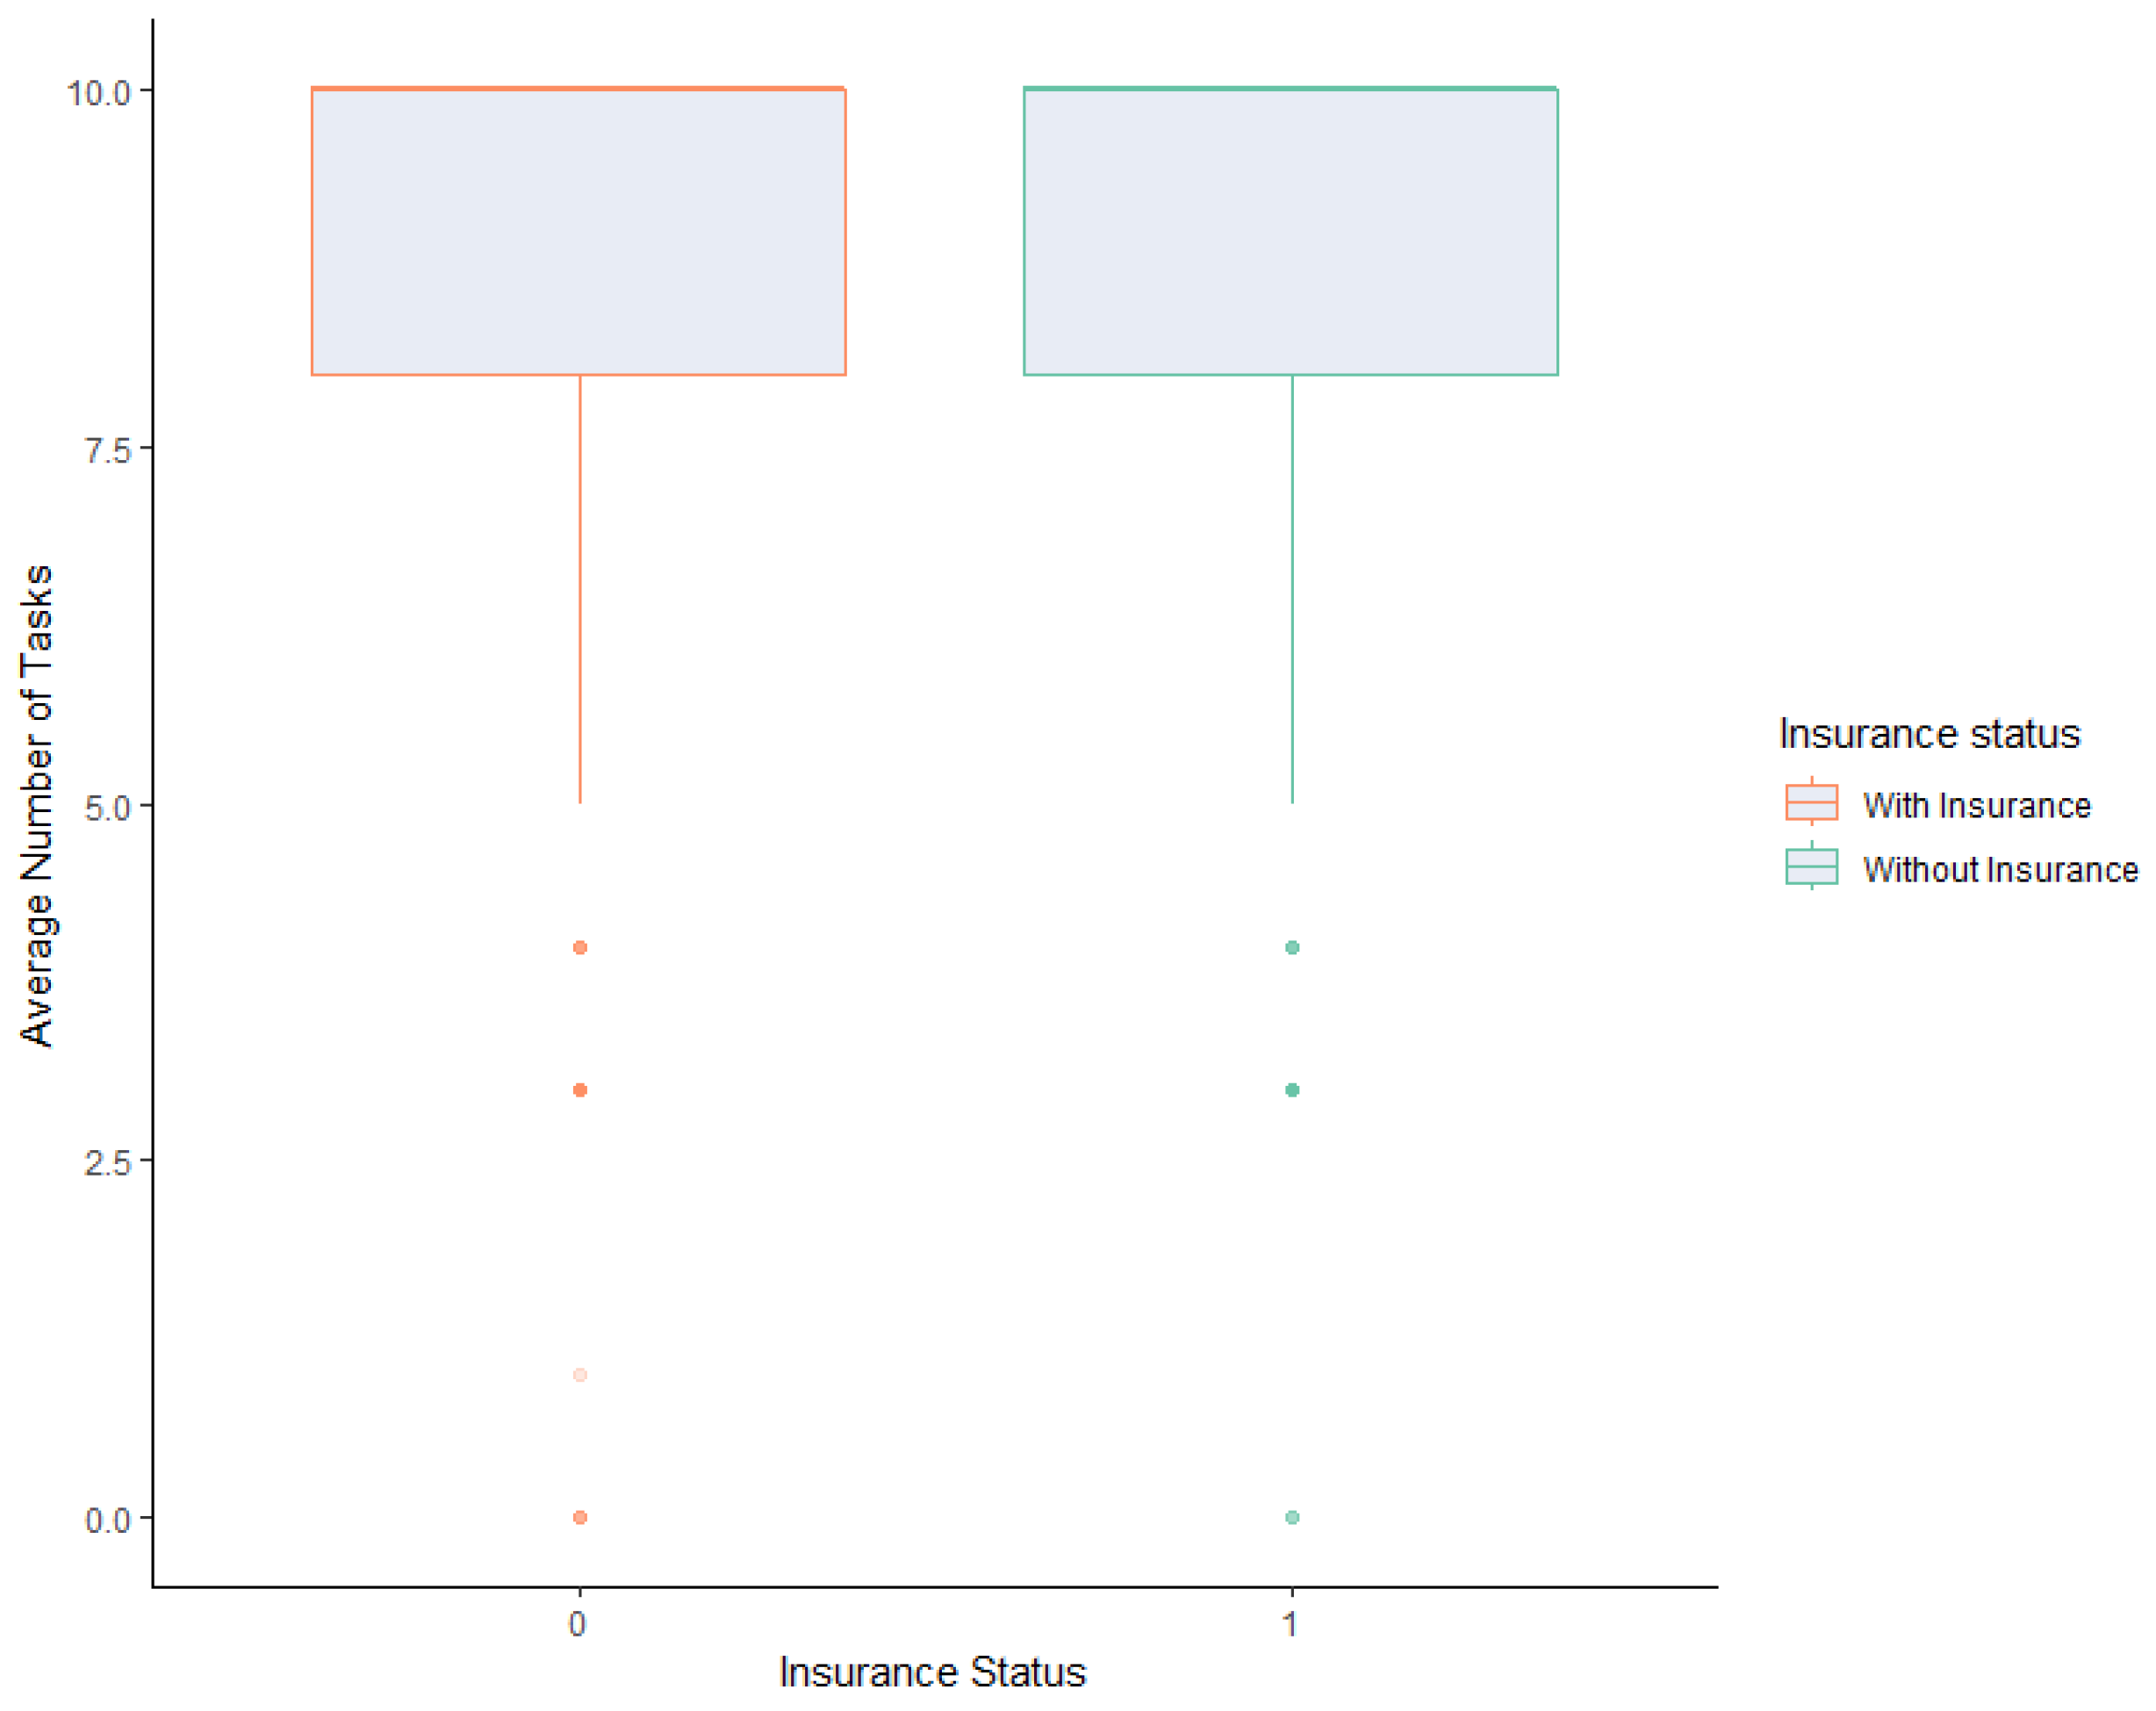
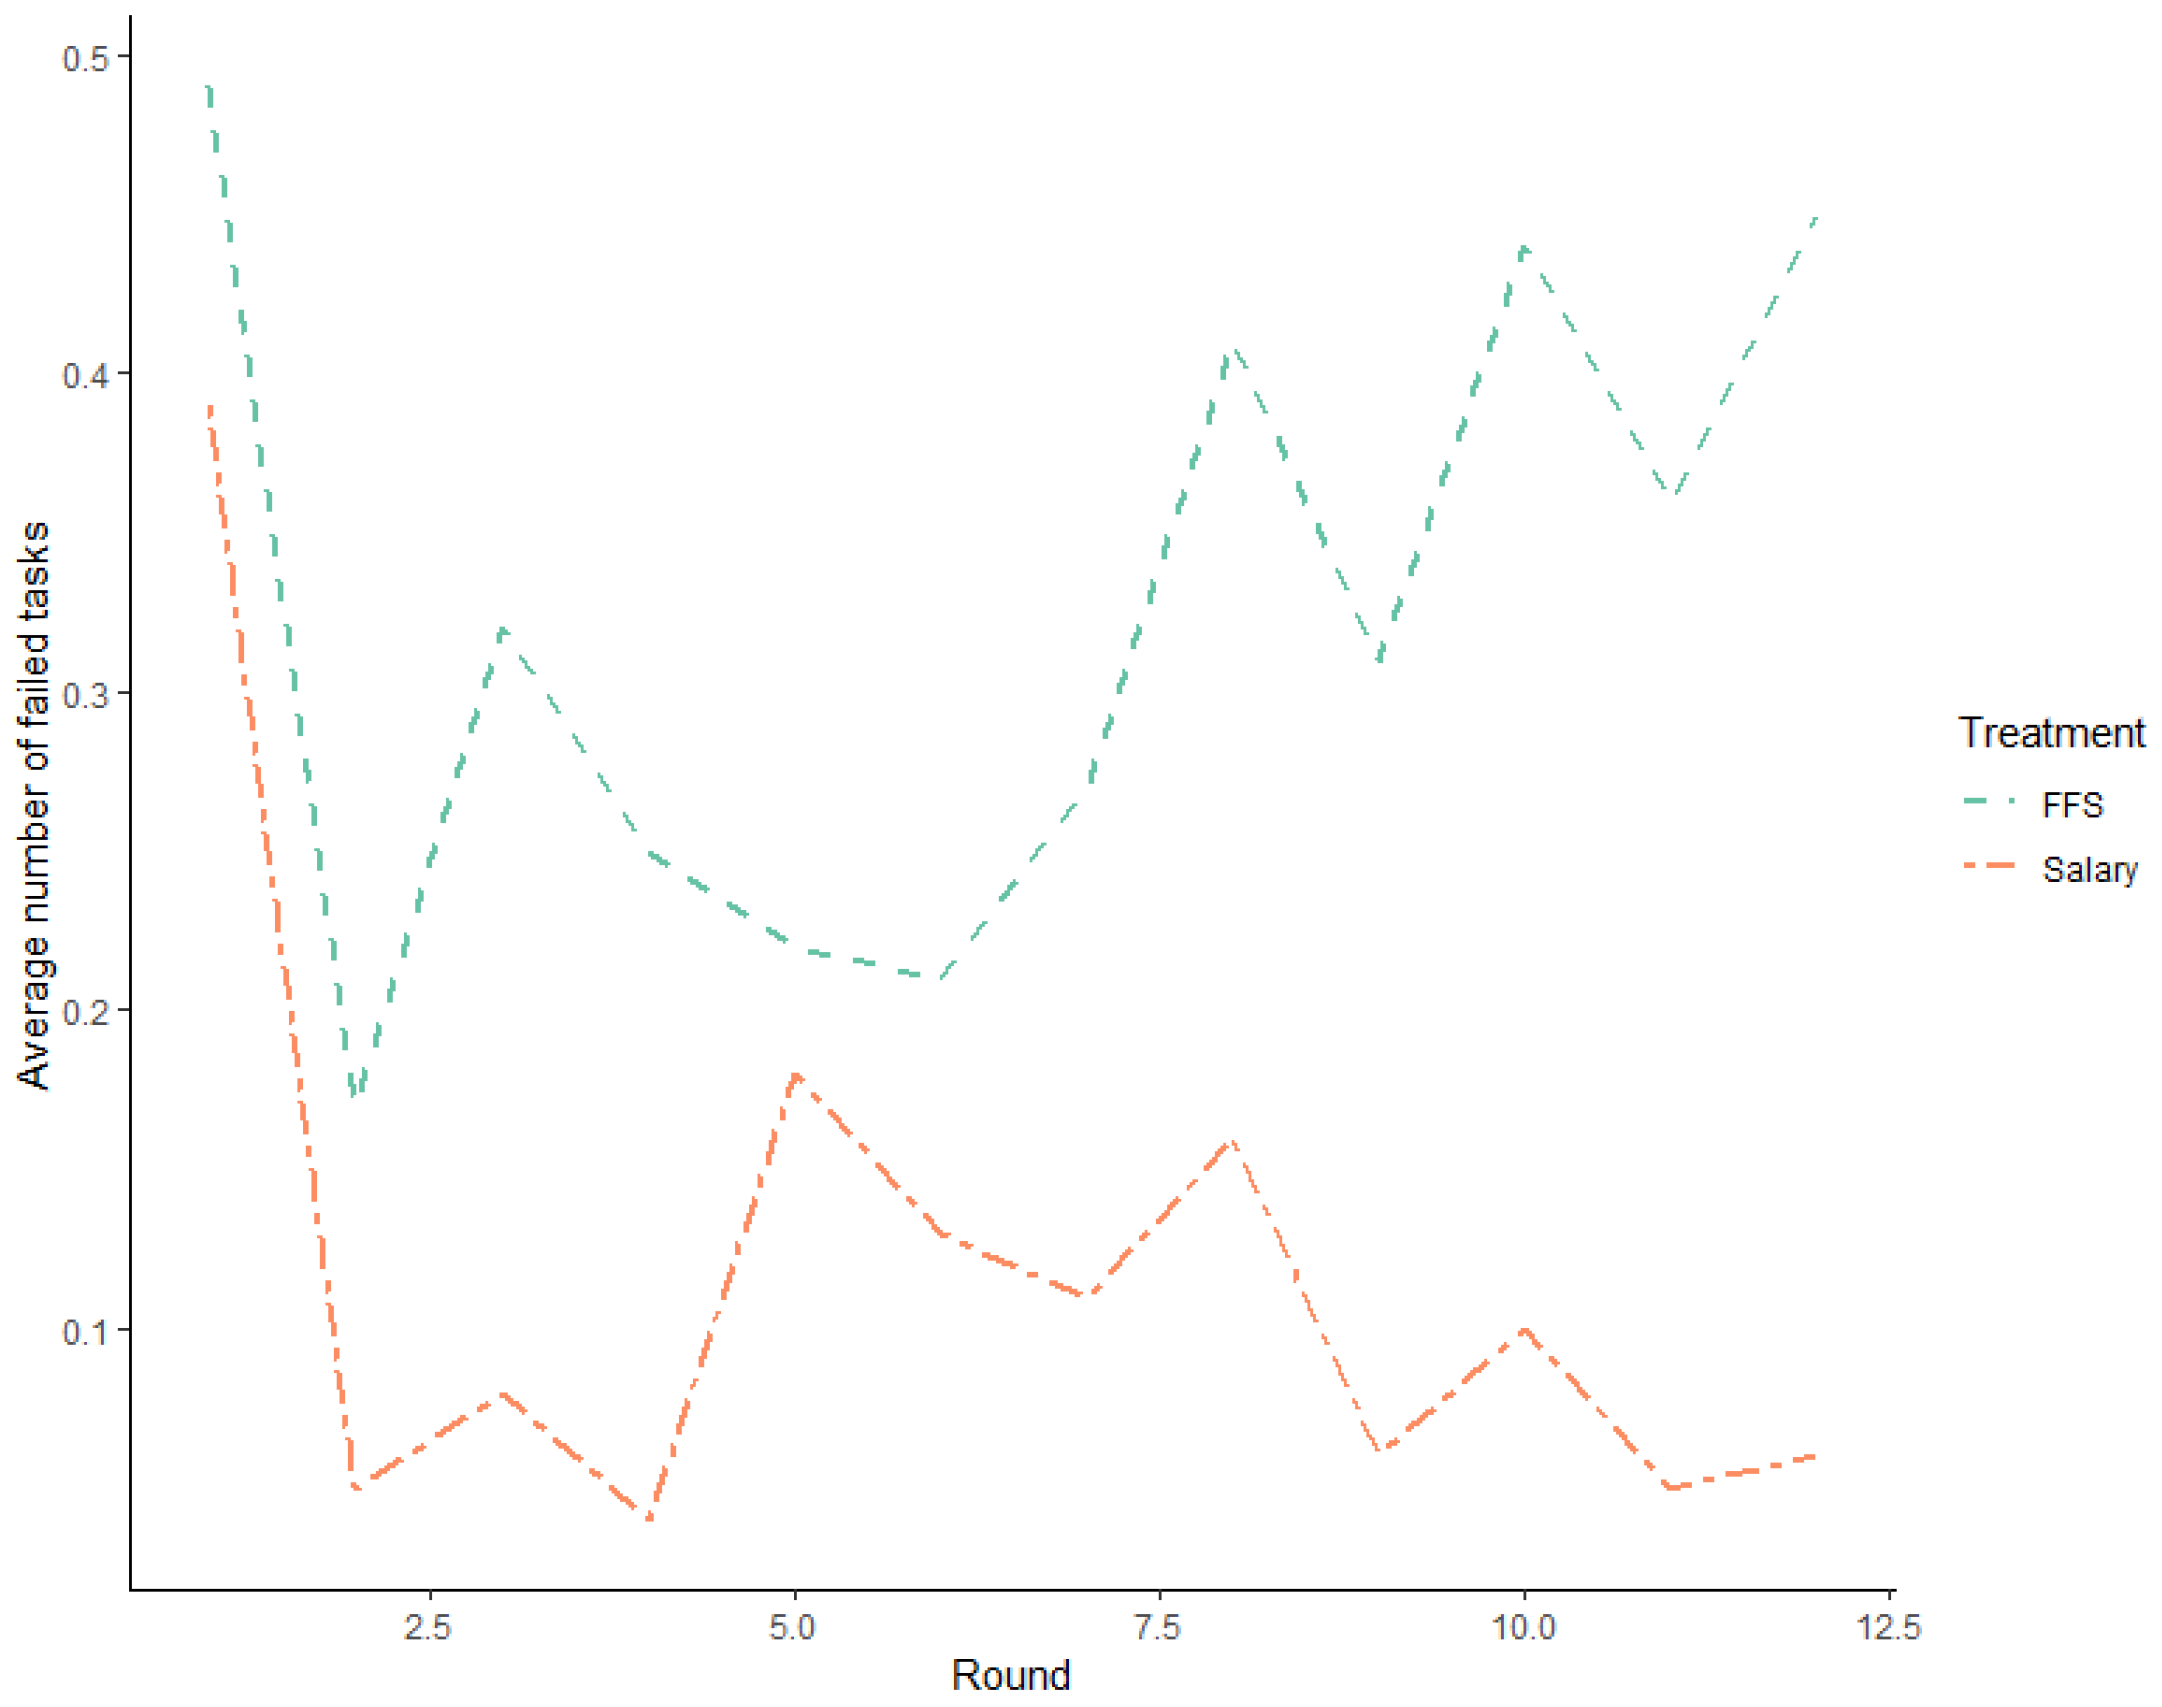
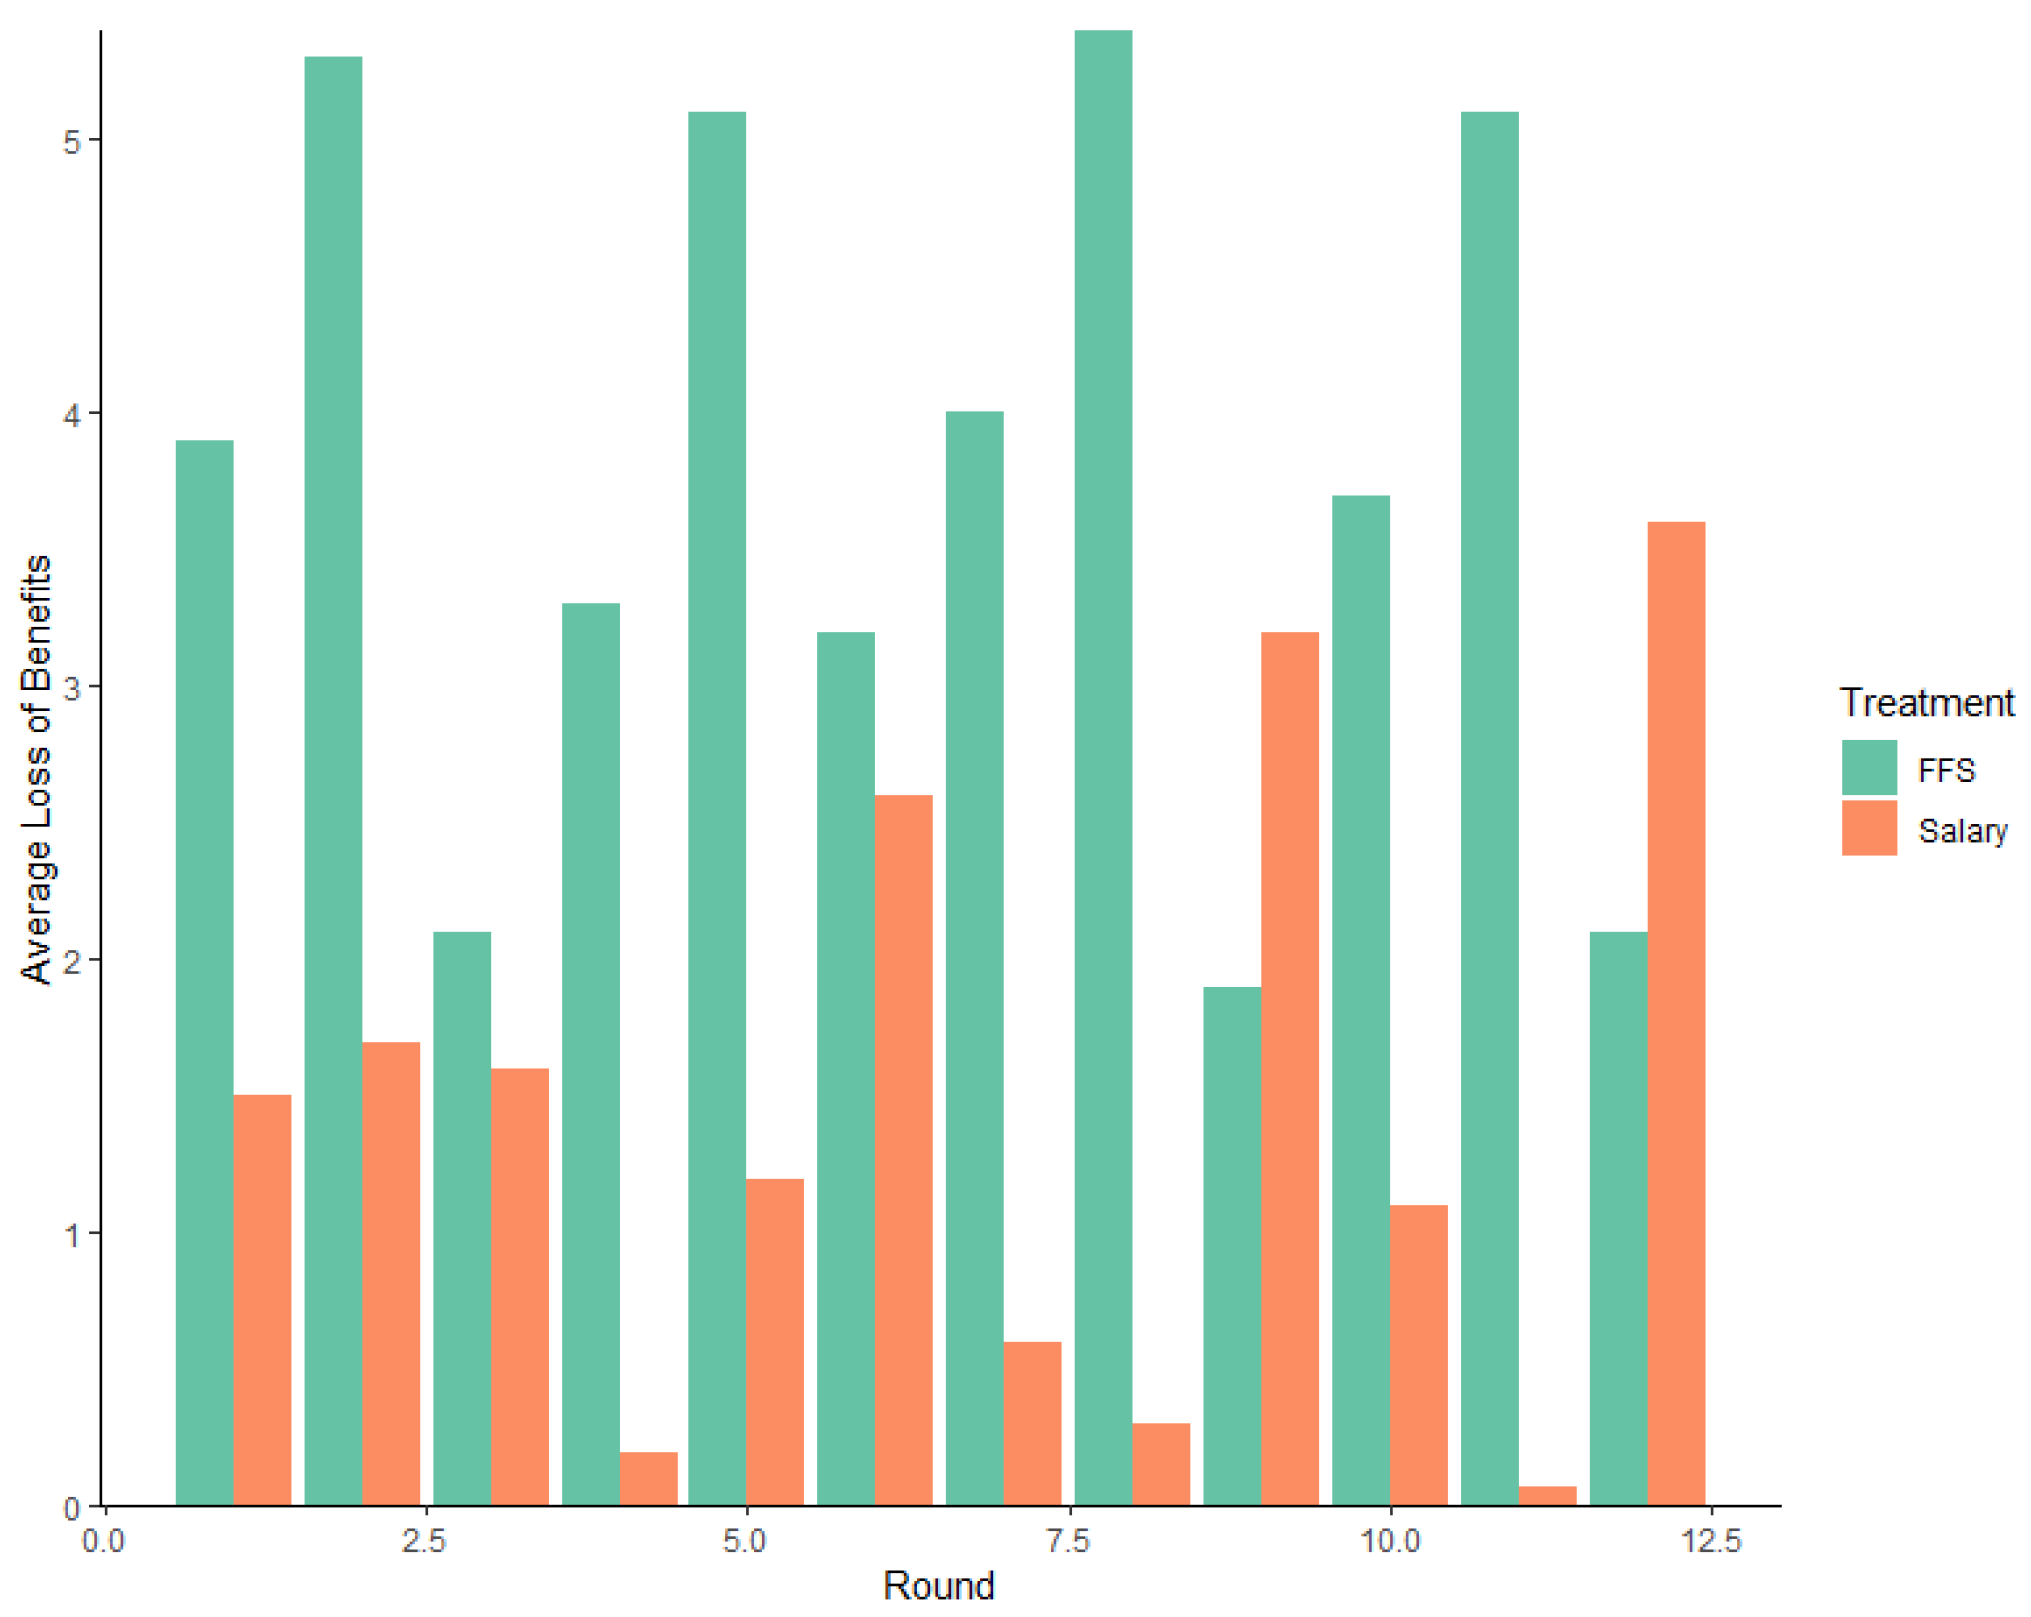
Table 1.
Order of matching and number of tasks required.
| Round | 1 | 2 | 3 | 4 | 5 | 6 | 7 | 8 | 9 | 10 | 11 | 12 |
|---|---|---|---|---|---|---|---|---|---|---|---|---|
| Customer Type | 1 | 2 | 3 | 1 | 2 | 3 | 1 | 2 | 3 | 1 | 2 | 3 |
| Optimal Number of tasks | 5 | 3 | 7 | 5 | 3 | 7 | 5 | 3 | 7 | 5 | 3 | 7 |
Table 2.
Provider profits and customer benefits depending on the number of tasks performed.
| No. of Tasks | 0 | 1 | 2 | 3 | 4 | 5 | 6 | 7 | 8 | 9 | 10 |
|---|---|---|---|---|---|---|---|---|---|---|---|
| Providers’ profit | |||||||||||
| FFS | 0 | 0 | 1 | 3 | 3 | 4 | 5 | 6 | 10 | 12 | 13 |
| Salary | 13 | 12 | 11 | 10 | 9 | 8 | 7 | 6 | 5 | 4 | 3 |
| Customer benefit (without insurance) | |||||||||||
| Type 1 | 0 | 1 | 2 | 3 | 4 | 6 | 5 | 4 | 3 | 2 | 1 |
| Type 2 | 0 | 4 | 5 | 6 | 5 | 4 | 3 | 3 | 2 | 1 | 1 |
| Type 3 | 0 | 1 | 1 | 2 | 3 | 4 | 5 | 6 | 5 | 4 | 3 |
| Customer benefit (with insurance) | |||||||||||
| Type 1 | 0 | 1 | 2 | 4 | 7 | 10 | 9 | 8 | 7 | 6 | 5 |
| Type 2 | 0 | 7 | 8 | 10 | 9 | 7 | 6 | 5 | 4 | 3 | 1 |
| Type 3 | 0 | 1 | 2 | 4 | 7 | 8 | 9 | 10 | 9 | 8 | 7 |
Table 3.
Description of the sample.
| Total | Salary | FFS | |
|---|---|---|---|
| Number of subjects | 168 | 85 | 73 |
| Age (mean) | 26.1 | 25.6 | 26.6 |
| Gender (% female) | 49.4 | 49.4 | 49.3 |
| Social science students (%) | 34 | 11.9 | 22 |
| Average payoff (ECUs) | 115 | 103 | 128 |
| Payoff in Euros (Mode) | 15.64 | 15 | 19.2 |
Table 4.
Multinomial logistic regression results for service provision status.
| Dependent Variable: | ||
|---|---|---|
| Over | Under | |
| (1) | (2) | |
| Customer T2 | 0.598 *** | 0.319 *** |
| (0.274, 0.922) | (−0.028, 0.666) | |
| Customer T3 | 1.911 *** | 5.071 *** |
| (1.469, 2.353) | (4.642, 5.500) | |
| FFS | 10.771 *** | 0.241 *** |
| (10.377, 11.165) | (−0.328, 0.811) | |
| No Insurance | 0.969 | 0.401 ** |
| (0.485, 1.453) | (−0.484, 1.285) | |
| Faulty Tasks | 3.787 *** | 0.817 |
| (3.257, 4.317) | (0.187, 1.466) | |
| Constant | 0.899 | 2.084 *** |
| (0.623, 1.175) | (1.827, 2.341) | |
| Akaike Inf. Crit. | 2592.677 | 2592.677 |
Note: ** p < 0.05; *** p < 0.01 CIs in parenthesis. Model fit: Chi-Square (Df = 10) 1204.3 *** Nagelkerke R-Squared 0.55.
Table 5.
Impact of the payment system on the quantity and the quality of tasks performed29.
Table 5.
Impact of the payment system on the quantity and the quality of tasks performed29.
| Total Number of Tasks | Deviation from the Ideal Number of Tasks | Faulty Tasks | |
|---|---|---|---|
| FFS | 4.420 *** | 4.420 *** | 0.208 ** |
| (0.328) | (0.328) | (0.08) | |
| Type 2 | −0.795 * | 1.205 *** | −0.059 |
| (0.354) | (0.354) | (0.063) | |
| Type 3 | −0.181 | −2.182 *** | −0.059 |
| (0.354) | (0.354) | (0.063) | |
| Intercept | 4.673 *** | −0.327 | 0.156 * |
| (0.333) | (0.333) | (0.069) | |
| No. of subjects | 157 | 157 | 157 |
| No. of observations | 1884 | 1884 | 1884 |
| R2 cond. | 0.739 | 0.773 | 0.377 |
Note: Significance codes *** p < 0.0001, ** p < 0.001, * p < 0.05, Robust standard errors are given within parentheses; Subject ID and round number were treated as random effects.
Disclaimer/Publisher’s Note: The statements, opinions and data contained in all publications are solely those of the individual author(s) and contributor(s) and not of MDPI and/or the editor(s). MDPI and/or the editor(s) disclaim responsibility for any injury to people or property resulting from any ideas, methods, instructions or products referred to in the content. |
© 2023 by the authors. Licensee MDPI, Basel, Switzerland. This article is an open access article distributed under the terms and conditions of the Creative Commons Attribution (CC BY) license (https://creativecommons.org/licenses/by/4.0/).
Share and Cite
MDPI and ACS Style
Karunadasa, M.; Sieberg, K.K.; Jantunen, T.T.K. Payment Systems, Supplier-Induced Demand, and Service Quality in Credence Goods: Results from a Laboratory Experiment. Games 2023, 14, 46. https://doi.org/10.3390/g14030046
AMA Style
Karunadasa M, Sieberg KK, Jantunen TTK. Payment Systems, Supplier-Induced Demand, and Service Quality in Credence Goods: Results from a Laboratory Experiment. Games. 2023; 14(3):46. https://doi.org/10.3390/g14030046
Chicago/Turabian StyleKarunadasa, Manela, Katri K. Sieberg, and Toni Tapani Kristian Jantunen. 2023. "Payment Systems, Supplier-Induced Demand, and Service Quality in Credence Goods: Results from a Laboratory Experiment" Games 14, no. 3: 46. https://doi.org/10.3390/g14030046
Note that from the first issue of 2016, this journal uses article numbers instead of page numbers. See further details here.