Article

First You Get the Money, Then You Get the Power: The Effect of Cheating on Altruism

by
David B. Johnson
1,* and
Jonathan Rogers
2
1
Department of Economics and Finance, University of Central Missouri, 116 W South Street, Warrensburg, MO 64093, USA
2
Division of Social Science, New York University Abu Dhabi, Saadiyat Island, Abu Dhabi P.O. Box 129188, United Arab Emirates
*
Author to whom correspondence should be addressed.
Games 2023, 14(3), 40; https://doi.org/10.3390/g14030040
Submission received: 15 February 2023 / Revised: 3 April 2023 / Accepted: 6 April 2023 / Published: 4 May 2023

Abstract

:
When there is direct competition for a position of power (promotion, elected office, etc.), competitors are tempted to cheat to increase their chances of winning. If they do so successfully, then how they rationalize their cheating can determine how they treat the losers of the competition. In this paper, we explore how the winners of a promotion tournament treat the losers, using a two stage laboratory experiment run in Canada and the United Arab Emirates. In the first stage, subjects compete to earn the role of the dictator in a dictator game, which takes place in the second stage. We vary whether or not subjects can cheat during the competition. The results of the experiment can be summarized as follows: (1) cheating significantly increases altruism in some tournament winners, (2) winners who cheat the most are significantly less altruistic than winners who cheated only a little, (3) there are significant differences in cheating behavior across the two populations, and (4) cheating behavior can be at least partially attributed to differences in intelligence and beliefs across the two populations.

1. Introduction

In the well-populated literature on other-regarding behavior, it is established that individuals in positions of authority are more altruistic than sub-game perfect Nash equilibrium (SGPNE) predictions. For instance, in a dictator game, the dictator does not typically keep the entire pie for themselves [1], but rather keeps the majority of it, while leaving a non-trivial amount for the other player. Giving in the dictator game, is often taken as a measure of altruism or fairness, as the receiver is passive and cannot punish or reciprocate. The game has also been adapted to explore how the winners of tournaments treat the defeated. This is accomplished by having subjects compete in a tournament to determine their role in the dictator game, e.g., [2,3]. Typically in such experiments, tournament winners view their role as earned, and therefore send smaller amounts to their matched partner who lost the tournament.
In practice, agents participating in tournaments can cheat, and evidence suggests that when people are allowed to cheat, many do so, c.f., [4]. This is somewhat surprising when juxtaposed with the fact that most people consider themselves moral and honest [5]. Thus, individual behavior often does not align with individual beliefs. This conflict is known as an ethical dissonance, c.f., [6,7]. There are a variety of justifications individuals use to lessen an ethical dissonance. Some of these justifications suggest that if the individual cheats, they will be more altruistic; other preferences suggest the opposite. Therefore, the effect of the opportunity to cheat in a tournament on post-tournament behavior may be positive, negative, or have no net effect. This is the purpose behind the present work. We explore how tournament winners treat the losers, after tournaments in which cheating is possible.
Cheating in tournaments is ubiquitous but (with a few notable exceptions that will be discussed later) the behavior of cheaters post-tournament has not been extensively researched. While one would expect cheaters to be more purely self-interested than non-cheaters, some exhibit greater levels of generosity and charity with their ‘ill-gotten gains’ than a self-interested model would predict. Consider the case of Lance Armstrong, who confessed, in an interview with Oprah Winfrey, to using performance-enhancing drugs during his record-breaking run in the Tour de France.1 While Mr. Armstrong did cheat to win, as a result of his victories and notoriety, he was able to raise hundreds of millions of dollars for cancer research through the charity Livestrong.2 Mr. Armstrong’s cheating harmed the earnings of other athletes, but it also went on to indirectly help many others. This strange pairing of cheating and charitable giving is not unique to athletes, as captains of industry who are later convicted of fraud are often also large donors to charitable organizations.3
Though cheating is viewed as bad, its presence in society can produce benefits that may be forgotten when the cheater is caught. What makes the above-mentioned cases interesting, is how the perpetrators justified their behavior to themselves/made amends to society. While rewarding (or ignoring) cheaters is generally inconsistent with existing social mores, a cheater suffering an ethical dissonance may end up behaving more altruistically than an honest winner. We test this possibility using a lab experiment. In our experiment, subjects first complete a real effort task and subsequently participate in a dictator game. Subjects performing in the top half of subjects in a session are assigned the role of the dictator, while subjects in the bottom half are assigned the role of the receiver. In control sessions, a computer automatically assesses subjects’ performance on the task and assigns roles based on objectively tallied scores.
In treatment sessions, subjects self-report their scores and the computer assigns roles based on claimed performance. We observe statistical cheating: average self-reports being significantly higher than observed scores and then compare dictator giving across the two treatments. Our primary findings are as follows: (i) we find some of the dictators who had the opportunity to cheat, behave more altruistically toward tournament losers than dictators who did not have the opportunity to cheat, and (ii) tournament winners who are the most dishonest, give significantly less than tournament winners who were less dishonest. This suggests individuals may use “pro-social” strategies to satisfy an ethical dissonance, while others may not care about dishonest behavior. Consequently, the net effect of cheating depends on the distribution of types and the scale by which these types respond.
Our work most directly builds on Thielmann and Hilbig [8], which reported the results of three online experiments in which, in some treatments, subjects had the opportunity to cheat. Broadly speaking, Thielmann and Hilbig [8] find that individuals assigned an endowment to split with another person, are equally as generous/stingy if the endowment is acquired by chance, earned, or earned through dishonesty. Our study expands on this finding. Unlike Thielmann and Hilbig [8], in our study cheating harms a fellow competitor. This environment leads to two different types: (i) Selfish Cheaters, who cheat a lot and give minimally, and (ii) Unselfish Cheaters, who cheat but send larger amounts to their matched partner. Answers from a survey given after the experiment, suggest that unselfish cheating behavior may be motivated by a desire to help another, but it is also possible that the decision to be more altruistic was made to resolve an ethical dissonance.

2. Background

One of the reasons for cheating, involves satisfying a selfish component of one’s preferences [9]. This is true in a wide range of settings, from sports [10] to taxes [11], and is relevant to any situation that can be manipulated with private information. One such scenario is a promotion mechanism that can be gamed by misrepresenting performance. Not all aspects of job performance are observable and in these cases, competitors have the incentive to signal that they are higher performers than they are.4 Workers (even academics) can do this in several creative ways. Some of these may even be considered benign/justifiable and even beneficial for the firm.5 Workers can stretch the truth [14], by drafting emails during the day, but sending them in the wee hours of the morning; boasting several active projects, even if some of the projects are defunct; listing a committee membership, though the committee has never met; or using drugs to increase academic performance [15].
Cheating has been shown to differ by culture, religion, and many other factors. Hugh-Jones [16] argues that honesty correlates with long-run economic development and with the percentage of the population that identifies as Protestant. Women are more likely to tell white lies to help others [17] than men are. Rettinger and Jordan [18] also find that motivation matters. For example, student subjects who are grade motivated are more likely to engage in cheating. The experimental literature regarding cheating is quite robust. People cheat and lie, but usually only a little, and most often below the maximum amount possible, e.g., [4,19]. This is not too surprising, as cheating is thought to impose a psychological cost on the cheater. If a person who thinks of themselves as an ethical person cheats, it can create an ethical dissonance. Barkan et al. [7] discuss the concept of ethical dissonance, which is a special case of cognitive dissonance [20].6 Barkan et al. [7] suggest one-way agents reduce the tension between dishonest behavior, and their morality is to rationalize the dishonest behavior as ethical. The person separates their actions from their morality by not acknowledging the behavior as a reflection of themselves, which preserves the agent’s favorable self-concept [19]. One way an individual might settle an ethical dissonance, is by being more altruistic toward those they harmed with their dishonesty.
Experimenters often use the dictator game (DG) as a tool to measure an individual’s preferences for fairness and altruism. The rules of the dictator game are simple: the dictator is given an endowment and instructed to choose an amount to share with another player. The other player, the receiver, is forced to accept it.7 Assuming an own payoff maximizing agent, the SGPNE is that the dictator keeps the entire endowment for themselves and sends nothing to the receiver. While this behavior is sometimes observed, it is more uncommon than one might think [21]. Concerns with fairness, social ties, and group identity are all linked with more generous allocations [22,23,24,25]. Moreover, an array of demographic characteristics affect dictator game allocations [1], as does the observation of the behavior of others [26]. Cochard et al. [27] posit that preferences over fairness, depends on the level of economic development in the subject’s country.
As it pertains to the present work, Ref. [28] argues that ownership affects allocation decisions. Ample evidence illustrates that when a position of authority is earned through better performance in a skill or effort task, the authority is seen as legitimate or just. Within the context of the DG, newly minted dictators give less of their endowments when their role is selected by performance rather than at random, e.g., [2,3]. This is thought to occur because they see themselves as deserving a larger slice of the pie than the other player. This influence of legitimacy of power or ownership is also illustrated in the amounts sent in DGs. Oxoby and Spraggon [29] find that, when the dictator earns the endowment, they give less to the receiver. This effect is also seen in the ultimatum game, as offers increase when the proposer’s endowment is produced by the responder Carr and Mellizo [30]. Similarly, when the receiver generates the dictator’s endowment in the DG, the dictator sends larger amounts to skillful receivers than their less skillful cohortsRuffle [31].8 However, what is not known is, if a subject cheats to become the dictator, will this affect their allocation to the receiver?
The effect of cheating on post-tournament behavior has not been extensively researched, but there has been a recent exception worth discussing. Schurr and Ritov [35] explore subject dishonesty after what is essentially a promotion tournament—albeit one in which subjects do not know that they are participating. However, unlike the present work, the potential for dishonesty comes after the tournament. While this design is attractive for studying cheating after a victory, in the world outside of the lab, people tend to be aware that they are participating in a tournament. This is an important distinguishing characteristic, as the findings of [35] assume that the path to victory is without the potential for deception that is costly to other tournament players. As such, there is no reason for the individual who cheated in the tournament and won, to assuage feelings of guilt from their ‘ill-gotten gains’, or cheat to prevent more selfish players from winning the promotion tournament. It stands to reason, that if there is cheating during the promotion stage, we may observe both increased and decreased levels of generosity due to subjects’ motivation for cheating and the subjective legitimacy of their victory.

3. Theory

Explanations of altruism in gift exchange games, typically involve an aspect of warm glow [36]. Subjects give because they derive utility from the act of kindness, just as they enjoy the consumption of the private good. Other explanations of allocations in DGs relate to inequality aversion. Subjects care about their own payoffs, but also about their payoffs relative to those of the other player, e.g., [37,38]. Let us start with the standard inequality aversion utility function, borrowed from [37]:
u i ( x i , x j ) = x i α i max | x j x i , 0 | β i max | x i x j , 0 |
In Equation (1), x i is the monetary payoff to player i, α i is i’s aversion to disadvantageous inequality and β i is i’s aversion to advantageous inequality. This implies, the player derives utility from private consumption, dislikes earning less than their counterpart, and also dislikes earning more than the other player. Further, as is the general assumption in these types of models, we assume i dislikes earning less than the other player (disadvantageous inequality) at least as much as they dislike earning more than the other player (advantageous inequality). Players do not enjoy inequality, but would still rather earn more than their peers—which implies α i β i 0 .
With this simple model, individuals with an extreme distaste for disadvantageous inequality relative to advantageous inequality (i.e., α i > > β i ), would cheat more (increase x i through higher earnings), to avoid suffering disadvantageous inequality ( α i max | x j x i , 0 | ). Mechanically, this might lead to a relatively large population of selfish dictators in CHEAT if there is not also a part of the population with advantageous inequality aversion. Yet, if there is a portion of people who are inequality averse, they might also cheat to win the advantaged role, but then give larger amounts, to limit advantageous inequality. Both of these outcomes could be exacerbated if they are related to some other preference, combined with a way to reconcile a cognitive dissonance (e.g., lying but also being lie averse, and rationalizing their choices by later being more altruistic, or being less altruistic due to seeing themselves as more deserving of the endowment).

4. Design

To examine the effect of cheating on altruism, we use a two-stage experiment. In the first stage, all subjects participate in an abbreviated version of Raven’s Progressive Matrices [39,40]. Each question in this test presents subjects with a series of patterns with the bottom right corner piece missing. Subjects are asked to identify which of six possible images best completes the pattern. Subjects have ten minutes to complete as many of these tasks as they can, up to a maximum of twelve. For each correct answer, subjects earn a piece rate (50 Canadian cents in Calgary sessions, 2 dirhams in Abu Dhabi sessions).9
In control sessions (CONTROL, hereafter), the computer grades subjects’ answers automatically. In treatment sessions (CHEAT, hereafter), subjects write their answers on a sheet of paper. After 10 min, the experimenter tells the subjects to stop and then passes out answer keys. Subjects then grade their own quizzes and are then asked to enter their number of correct answers into the computer. They are also instructed to hide/destroy their answer sheets. As such, subjects in CHEAT know that the experimenter will never see their actual answers, thus leaving them free to lie (which we interpret as cheating) about their performance on the test. Subjects know only their performance on the quiz and, in CHEAT, the experimenter does not observe their actual scores.
In both treatments, subjects know that the top half of performers will be advantaged in the second stage, but they do not know what the second stage will be. The first stage of the experiment is a promotion tournament. Like in the world outside the lab, subjects in the first stage are competing for an advantaged position, that provides power over the earnings of the losers of the promotion tournament. Only in this case, the promotion tournament’s outcome is not subject to the biases of the employers but rather purely a result of the subjects’ scores or reported scores.
In the second stage, subjects are assigned to either the blue (dictator, hereafter) or green (responder, hereafter) role, half to each. Dictators are subjects who performed (reported to perform) in the top half of subjects in CONTROL (CHEAT). Subjects know that their scores in the first stage determined their roles in the second stage. In stage two, subjects play a standard dictator game. The dictator’s endowment is ten Canadian dollars in Canadian sessions and fifty dirhams in United Arab Emirates sessions. Cheating is measured statistically, as the difference in average scores between the two treatments.10
We recruited subjects for our group-based experiment at a university in Canada and a university in the United Arab Emirates. For each session, we recruited student subjects, using the ORSEE recruitment system [41] at author 1’s institution, and Hroot [42] at author 2’s institution. Upon being seated, subjects are given instructions and the experiment commences. The exact instructions can be found in the Supporting Information. Subjects participate in either the CHEAT or CONTROL only.
At the end of each session, subjects complete a short survey investigating their lying behavior (or how they would have lied). The questions are given below, along with the possible answers and corresponding numerical values for each answer. In CONTROL, the questions are posed as hypothetical and are preceded with “If given the opportunity”, after which the questions are virtually identical across treatments.
  • (LIE-SELF) How much did you lie about your test score? Answers: 0 = “I would/did not lie”; 1 = “Very Little”; 2 = “Little”; 3 = “Moderately”; 4 = “A Lot”; 5 = “Completely”.
  • (LIE-OTHERS) How much do you think other subjects lied about their test score? Answers: 0 = “They would not lie”; 1 = “Very Little”; 2 = “A Little”; 3 = “Moderately”; 4 = “A Lot”; 5 = “Completely”.
  • (RELATIVE) Do you think other subjects lied more or less than you? Answers: 1 = “More”; 2 = “Less”.
  • (REASON) Which aspect of the experiment was most tempting you to cheat? The role assignment or quiz earnings? Answers: 1 = “Role”; 2 = “Quiz Earnings”; 3 = “Both”.
While these questions are different depending on the treatment, in the interest of the narrative, we refer to each by its name as shown in parentheses above. We asked additional questions, described in the Appendix, to measure lie and risk aversion. All surveys were not incentivized. As a final question, we explicitly ask subjects how many questions they answered correctly. We use these questions because subjects in experiments generally admit to some degree of lying [43]. In addition to the questions above, subjects complete short lie aversion and risk preference questionnaires.
The experiment is programmed in zTree [44]. Human subjects approval granted by the Institutional Review Board at New York University Abu Dhabi and the Institutional Review Board at the University of Calgary.11
There were 192 student subjects in the experiment (98 in Abu Dhabi, and 94 in Calgary). Abu Dhabi subjects earned a 30 dirham (USD 8.17) show-up fee and had average total earnings of AED 71.60 (USD 19.50), for sessions lasting less than half an hour. Canadian sessions lasted around half an hour and subjects earned on average 13.40 Canadian dollars (at the time, around USD 12.30), including a 5 Canadian dollar show-up fee (around USD 4.50).12 The treatment variable is the opportunity to cheat. Cheating is measured statistically as the difference between average IQ scores in the control sessions and self-reported IQ scores in the treatment sessions. Subject IQ test performance is reported with the variable SCORE. Given that sessions are run in different currencies, second-stage dictator behavior is reported as the percent of the endowment sent to the receiver.

5. Hypotheses

We now state our hypotheses based on the previous literature. For narrative purposes, hypotheses are stated in terms of the alternative. Because we are unable to tell exactly what justification subjects are using to settle a possible ethical dissonance/inequality aversion, but can observe how it affects the payoff of others, we classify dictators who send larger amounts to tournament losers in which cheating is possible, as “Pro-Social Cheaters”. Their counterparts, who treat tournament losers relatively worse, will be called “Selfish Cheaters”.
The first hypothesis (Hypothesis 1), is testing for a direct treatment effect, and is based on previous literature demonstrating that people cheat when given the opportunity, e.g., [4,17,19]. However, the extent of cheating is specific: many people cheat but will do so by only a little. Few will cheat on a larger scale.
Hypothesis 1 (H1). 
(Cheat) Subjects in CHEAT will report higher performance than subjects in CONTROL.
Hypothesis 2 posits individuals will honestly report their dishonesty. This hypothesis is crucial for our study, because the identification of a treatment effect in the presence of different ways to settle an ethical dissonance leading to different outcomes, in terms of treatment of the losers, relies on the assumption that subjects will not only truthfully reveal their dishonesty, but the scale of their dishonesty. Thus, we not only require that subjects admit to their dishonesty but also to the scale of their dishonesty. Fortunately, previous research has shown people generally confess to some degree of dishonest behavior, e.g., [45]. Given that there is no penalty for admitting having cheated, we expect there to be a significant correlation between reported scores and self-reported cheating in CHEAT.
Hypothesis 2 (H2). 
(Honest Cheaters) Subjects will admit to cheating, and the level of reported cheating will be positively correlated with actual cheating.
We now discuss the different types of cheaters. Hypothesis 3 proposes subjects will cheat. However, they will cheat by only a little and treat the victims well. This is in line with Erat and Gneezy [17], who find that subjects are willing to tell white lies that hurt themselves slightly but help other players substantially. Pro-Social Cheaters will cheat a bit but will treat their victims better than the dictators in CONTROL.
Hypothesis 3 (H3). 
(Pro-Social Cheaters) Dictators in the CHEAT treatment will give more to responders than dictators in CONTROL. These subjects will cheat, but only a little.
Hypothesis 4 is somewhat the opposite of Hypothesis 3, and proposes that some dictators will cheat much more than others and that these types will be significantly less generous. Selfish Cheaters will also be significantly less altruistic on average than dictators in CONTROL. This is similar to Thielmann and Hilbig [8], which shows that dictators that earned their endowment through dishonesty are as altruistic as those who earned it via effort or luck.
Hypothesis 4 (H4). 
(Selfish Cheaters) The higher a subject’s self-reported performance in stage one, the lower the amount they will send to the responder in stage two.
The total effect of cheating on post-tournament altruism, depends on the distribution of types and the scale at which these types behave. For instance, it is possible that there could only be a few cheaters in CHEAT of the selfish type, but these Selfish Cheaters may send shares that are so low that they swamp the larger (but smaller in scale) shares sent by the more altruistic Pro-Social Cheaters.

6. Experimental Results

Summary statistics are presented in Table 1. Subjects participated in either the CONTROL (n = 100) or CHEAT (n = 92) treatments. More than half of the subjects indicated they were male (57 percent). Table A1 and Table A2 (Appendix A) give the summary statistics by treatment, and Table A3 and Table A4 give summary statistics by location. The average age is about 21 years old. The average IQ score is 7.32 (of 12). Dictators on average send about 18 percent of the endowment.

6.1. Main Results

Subjects consider themselves to be honest, indicating they would not lie or, if they did lie, would lie very little. Contrary to their beliefs about themselves, subjects are reasonably suspicious of their fellows and believe that they would lie somewhere between a little and moderately.
Result 1. 
Subjects in CHEAT report significantly higher performance in CHEAT in comparison to actual performance in CONTROL.
Hypothesis 1 asks “do subjects cheat?”, and here we find evidence college students cheat when given the chance, and reject the null of Hypothesis 1. This is similar to what is reported in other studies, e.g., [43,46]. Visually, this is seen in Figure 1, which provides the full distribution of scores and percentages of the endowments sent (by dictators) in both treatments. Overall, when subjects are given the ability to cheat, the distribution of scores shifts to the right, with fewer subjects reporting low scores and more subjects reporting extremely high scores in CHEAT. Statistical tests confirm visual tests. In CONTROL, subjects on average correctly answer 6.88 questions. In CHEAT, subjects’ self-reported scores are about one question higher ( 7.82 ); this difference is significant (t-test: p < 0.01 ; U-test: p < 0.01 ). Of the 100 subjects in CONTROL, only 2 scored an 11 or 12 (twelve being a perfect score). Among the 92 subjects in CHEAT, 11 reported scores of 11 or 12.
The primary result is in Figure 2, which illustrates the relationship between the amounts dictators send to receivers and how well they performed on the IQ test. The graph on the left-hand side of Figure 2 presents data from CONTROL sessions, while the graph on the right presents data from CHEAT sessions. In each graph, the horizontal axis is the dictators’ IQ test results (or reported results), while the vertical axis is the amount sent by the dictators. Each line on the vertical axis represents the upper limit of a band of amounts sent.13 The radius of the circle, indicates how often a dictator scored X on the IQ test, and sent between R and T to the receiver in a particular treatment (i.e., the larger the circle, the more common the outcome). As can be seen in the right side of Figure 2, in CHEAT, stingy offers often come from dictators who report high scores on the IQ test but, for all other IQ scores, it looks as if dictators are somewhat more generous.
Visually, Figure 2 supports Result 1. In comparison to CONTROL, the distribution of IQ scores in CHEAT sessions is shifted to the right. Additionally, there are no longer any dictators with IQ scores lower than seven. This is reflected in the IQ scores of dictators. On average, dictators in CONTROL answered 8.52 questions correctly, while dictators in CHEAT reported that they answered 9.28 questions correctly (t-test: p = 0.01 ). Moreover, there is a relationship between how much one cheats and the amount the dictator sends to their partner; dictators who report relatively “reasonable” scores (i.e., fewer than 11 questions answered correctly) in CHEAT, are more altruistic than their CONTROL counterparts. Dictators in CHEAT who report perfect (or nearly perfect) scores are comparatively more selfish.
Result 2. 
Subjects admit to dishonest behavior, and the level of reported cheating is positively correlated with actual cheating.
We reject the null of Hypothesis 2, which tests if subjects will admit to cheating—they are, to some extent, honest cheaters. Subjects in CHEAT are cheating (as opposed to miscalculating performance) and admit to this. Consistent with Tenbrunsel et al. [45], subjects in CHEAT admit to lying when reporting their test scores. LIE-SELF is significantly greater than 0 (t-test: p < 0.01 ). Additionally, and as a more direct test of Hypothesis 2, we estimate, using an ordered probit with robust standard errors, subjects’ self-reported lying (LIE-SELF), using the difference between reported (in CHEAT) and actual (in CONTROL) scores, and self-reported test scores, asked after the experiment was completed. This self-reported lying is not being driven by financial motivation, as the questions about lying behavior are unincentivized and, if anything, are likely an underestimate of actual dishonesty. Consequently, we interpret this measure as a scale of lying by subjects, albeit one that is likely conservative. Overall, we find a significant positive relationship between the scale of lying and LIE-SELF (ordered probit: coef = 1.79; robust standard errors, p < 0.01 ) in CHEAT, and no significant relationship between the two in CONTROL (ordered probit: coef = −0.07; robust standard errors, p = 0.48 ).14
We find some evidence that giving is influenced by IQ scores in CONTROL. Each additional correctly answered question decreases dictator game giving by about 4 percent, but this effect is not significant at conventional levels (tobit: coef = −4.23, robust standard errors; p = 0.14 ). Subjects in CHEAT with higher IQ scores are significantly less altruistic; each additional question a dictator claims to have answered correctly decreases dictator game giving by 6 percent (tobit: coef = −6.08, robust standard errors; p < 0.01 ). However, this result is somewhat misleading and, as we will show shortly, it is being driven by a particular type of dictator.
Result 3. 
Subjects in CHEAT who self-report performance lower than the top quartile, are significantly more altruistic than counterparts in CONTROL.
Result 4. 
Subjects self-reporting their performance in the top quartile, are significantly less altruistic than other dictators in CHEAT.
We now test for the existence of different types of cheaters: Pro-social Cheaters and Selfish Cheaters. To start, and as in [47], we differentiate dictators performing in the top quartile in stage 1 from other dictators (HIGH SCORE).15 In our case, HIGH SCORE dictators correctly answered (reported to correctly answer) at least 11 questions.16 In CHEAT, roughly 76 percent of dictators reported having answered the same number of quiz questions as their recorded (and self-reported) score in Stage 1. However, while 88 percent of non-HIGH SCORE dictators in CHEAT report consistent quiz scores (i.e., their reported score matches the score they gave to earn the dictator role), only 36 percent of HIGH SCORE dictators in CHEAT do so. This difference is highly significant (test of proportions: p < 0.01 ). Additionally, dictators in CHEAT who correctly answer more than 10 questions, admit to a higher degree of misrepresenting their scores (LIE-SELF) than other dictators in CHEAT who correctly answer 10 or fewer questions (ordered probit: coef = 1.37; robust standard errors, p < 0.01 ).17 Last, HIGH SCORE dictators in CHEAT think other subjects lied less (RELATIVE equal to 2) than them (test of proportions: 0.06 vs. 0.46 p < 0.01 ).
This shows that the high-scoring dictators in CHEAT, admit not only to dishonest behavior (like other subjects in CHEAT) but to (correctly) believing themselves to be more dishonest than their peers. In sum, the subjects who answer more than 10 questions correctly, are generally in the CHEAT treatment. These subjects admit to a higher degree of lying, think they lied more than other subjects, and are more likely to self-report a different number of correct answers in the post-experiment questionnaire than they reported at the end of Stage 1.
We reject the null for Hypotheses 3 and 4. In Table 2, we show results of models estimating the percentage of the endowment sent as a function of the dictators’ IQ test score, HIGH SCORE, demographics, and treatment, using a series of tobits.18 At a cursory level, first, it would appear that there is no treatment effect (M1); dictators in CHEAT do not give a significantly different percent of their endowment to their partner than dictators in CONTROL. Second, amounts sent by dictators are primarily driven by the dictator’s score on the stage 1 quiz (M2). That is, dictators performing relatively better on the IQ test, are less altruistic than dictators who performed relatively worse. This is an incomplete story.
In M3, we estimate the percentage the dictator sends conditional on HIGH SCORE, and find that the dummy variable has a statistically and substantively strong effect. In M4 and M5, we estimate dictators’ giving using the treatment dummy and either SCORE or HIGH SCORE, and compare both of these models to M1. When we include CHEAT, SCORE, and HIGH SCORE as independent variables, SCORE is no longer significant, while CHEAT and HIGH SCORE are. This suggests that it is not subjects’ test results driving dictator allocations but rather the subjects who perform (or report to perform) above the top quartile. These subjects behave differently to other subjects, and send less to their matched partner, when compared to other dictators. This explains the lack of the treatment effect: in CHEAT, many subjects become more generous after they have been assigned their role; other subjects in CHEAT (particularly those who cheat a lot) become less generous. The existence of these two types, mitigates the treatment effect.
Survey evidence seems to rule out some characteristics driving the differences in the types of dictators—though it is always possible that there is an omitted characteristic. First, it does not seem that the non-HIGH SCORE dictators are honest, and honesty itself is correlated with generosity. These types of dictators admit to some marginally significant dishonest behavior (t-test: H 0 : LIE-SELF = 0; p = 0.09) and on average over-report by about a third of a question.19 Yet, the level of lying is significantly less than HIGH SCORE dictators; so it is possible that those who are just a little dishonest, are more generous. Three survey questions call even this into question. When asked “how likely they would lend money to a friend,” both types of dictators in CHEAT indicated they would be equally likely (ordered probit: coef = −0.04; robust standard errors, p = 0.92 ) in the activity.20 Second, when asked how much they agreed with the following statement, “You either lie or you don’t, there are no degrees of lying”, there was no significant difference across dictator types (ordered probit: coef = −0.41; robust standard errors, p = 0.33 ). Finally, when asked how much they agreed with the statement “I could lie to help someone else even if it hurts me”, non-HIGH SCORE dictators were significantly more in agreement with the statement (ordered probit: coef = 1.51; robust standard errors, p = 0.01 )—suggesting that it is indeed a taste for altruism/fairness that is influencing their decision.

6.2. Population Differences

We now examine population differences. Recall that the experiment was run at two different locations (Calgary and Abu Dhabi) and that the coefficient on the Calgary dummy in Model 9, presented in Table 2, was positive and significant. This significant dummy variable suggests dictators participating in the sessions run in Calgary treated losers better than dictators participating in sessions run in Abu Dhabi. Table 3 presents the average amounts sent by dictators in both locations, by treatment and overall. Clearly, subjects participating in the Calgary sessions are significantly more altruistic than subjects participating in Abu Dhabi sessions.
Additionally, Table 3 suggests that before controlling for the extent of the cheating, the treatment had the same effect in both locations—none. The average amounts sent by dictators in the sessions run in Abu Dhabi in CHEAT and CONTROL, are not significantly different (t-test: p = 0.7087 ), and the same is true for the sessions run in Calgary (t-test: p = 0.6721 ). There are two natural questions from this result: (1) are the treatment effects, after controlling for the extent of cheating, similar in both locations? and (2) if there are differences, can these differences be reconciled with the survey data?
We begin by addressing question 1. In Table 4, we re-estimate Models 6 and 8, from Table 2, but for only the Calgary or Abu Dhabi samples. Models 1 and 2, in Table 4, correspond to the Calgary sessions, and Models 3 and 4 correspond to the Abu Dhabi sessions. There are 47 dictators in the Calgary sample and 49 dictators in the Abu Dhabi sample. All models presented in Table 2 are tobits with robust standard errors. The results in Table 2, suggest the findings reported in the previous section are through the Abu Dhabi sample. Subjects playing the role of the dictator in CHEAT sessions run in Abu Dhabi, often send a larger percentage of their endowment to their partners, however, HIGH SCORE dictators send significantly less. Subjects playing the role of the dictator in the CHEAT sessions run in Calgary, are generally unresponsive to the treatment.21
Since we have established that subjects in the Abu Dhabi sample respond to the treatment (albeit in a way that is dependent upon their cheating), and subjects in Calgary do not, we now explore some possibilities as to why this is occurring. A first, and troubling, possibility, is that there is a difference in the details of how each of the coauthors ran their sessions (e.g., the cadence of instructions, emphases, on certain words, etc.) or differences in the experimenters’ appearance led to subjects responding differently in the two treatments across the two locations, e.g., “a tall RA effect”, c.f., [50]. Unfortunately, however, identifying this type of effect will be difficult, because author 1 ran all of the sessions in Calgary and author 2 ran all of the sessions in Abu Dhabi. While this possibility cannot be definitively ruled out, we propose that if there are substantial differences in the two populations, then differential responses to the treatments may be explained by population differences.22 We focus on three demographics: age, gender, and IQ test scores (particularly, IQ test scores in CONTROL).
There are no statistically significant differences in the age and gender of participants. The average ages of subjects participating in the sessions run in Calgary and Abu Dhabi are 20.72 and 20.36. This difference is not statistically significantly different (t-test: p = 0.27 ). Reported gender follows a similar pattern: 59 percent of subjects participating in the sessions run in Calgary report to be male, and 55 percent of subjects participating in sessions run in Abu Dhabi report to be male. Again, this difference is not statistically different (test of proportions: p = 0.53 ).
There are significant differences in IQ test scores.23 The average IQ test scores in CONTROL for subjects participating in the sessions run in Calgary and Abu Dhabi, are 6.39 and 7.30. Unlike age and gender, the difference in IQ test scores is statistically significant (t-test: p = 0.04 ).24 Previous research suggests subjects with higher intelligence generally behave more rationally in one-shot dictator games. For instance, Ref. [51] presented evidence that subjects with higher intelligence send smaller amounts to matched partners in a dictator game.25 Thus, if we consider misreporting IQ test scores in this experiment as rational, it would suggest that cheating would be more common in sessions run in Abu Dhabi and less common in Calgary. Moreover, if there is not a significant number of subjects who would be willing (or would consider) to misreport their IQ test scores in one population, there would be no reason to expect a treatment effect in this population, due to the fact there is no way for guilt to enter into the utility function.26
We find evidence in support of the conjecture above. In the sessions run in Calgary, the average IQ test scores were approximately 6.96 in CHEAT and 6.39 in CONTROL. This difference is not statistically significant (t-test: p = 0.17 ). Likewise, in the sessions run in Abu Dhabi, the average IQ test scores were 8.75 in CHEAT and 7.30 in CONTROL. This difference is statistically significant (t-test: p < 0.01 ). These results suggest that, on average, subjects in the Calgary sessions did not cheat on the IQ test, while those in Abu Dhabi did. Subjects’ self-reported dishonesty corresponds to their IQ test scores. Subjects in the CHEAT sessions run in Calgary, had an average LIE-SELF score of 0.18, while subjects in the CHEAT sessions run in Abu Dhabi had an average LIE-SELF score of 0.56. This difference is marginally significant at the 10 percent level (t-test: p = 0.08 ). Additionally, the differences between self-reported lying by only the dictators in CHEAT, across the Abu Dhabi and Calgary sessions, is larger (t-test: 1.05 vs. 0.21; p = 0.03 ). Interestingly enough, the observed difference in dishonesty and self-reported dishonesty, is likely at least partially related to expectations of dishonesty in others.27 When asked “How much do you think other subjects lied about their test score?”, subjects in the CHEAT sessions that ran in Calgary reported an average belief of 2.21, while subjects in the same treatment but participating in the sessions run in Abu Dhabi, reported an average belief of 2.75. This difference is significant (t-test: p = 0.04 ). The level of cheating, measured by the difference between post-experiment quiz scores and quiz scores reported during the experiment, is also significantly correlated with an expectation of dishonesty in others (OLS coef = 0.64; robust standard errors, p < 0.01 ). Consequently, we find evidence that differences in cognitive ability and beliefs are at least partially leading to subjects misrepresenting their scores.28 Abu Dhabi subjects also had a more flexible definition of lying and were more likely to disagree with the statement “You either lie or you don’t, there are no degrees of lying” (see Table A5 of Appendix A).

7. Conclusions

To conclude, we find that the manipulation worked. Subjects in the CHEAT treatment reported higher IQ test scores than those who had their scores graded by the computer. Further, the scale of cheating (difference between reported score during the experiment and post-experiment questionnaire), in the CHEAT treatment, was highly correlated with a subjective measure of lying. While many subjects cheated, few cheated maximally, and those who did were significantly less altruistic than those who cheated less. These results are consistent with Mazar et al. [53], Fischbacher and Föllmi-Heusi [19], and Thielmann and Hilbig [8]. These subjects possibly see themselves as smarter, for having figured out the game, and give less and/or are very adverse (in-averse) to disadvantageous (advantageous) inequality. At the same time, we find that many subjects who cheated just a little, are significantly more altruistic. While these subjects might be more sensitive to advantageous inequality, survey evidence suggests there may have been altruistic motivations for their dishonesty. Alternatively, the extra giving might have been a way to settle an ethical dissonance. This suggests two types of cheaters: those who cheat a little but feel bad about it and those who cheat a lot and feel proud of themselves/do not care. This is an interesting idea, as normatively speaking, those who commit larger offenses should feel worse about it, but the evidence demonstrates the opposite.
Interestingly, cheating only significantly occurred in sessions run in Abu Dhabi. While there are many possibilities as to why this is occurring, our results suggest the relatively more prolific cheating in Abu Dhabi is due to a mixture of intelligence and beliefs. Subjects participating in sessions run in Abu Dhabi indicated, in a post-experiment survey, that they believed that participants would lie more about their test scores than subjects participating in sessions run in Calgary. As it turns out, both beliefs were correct. Cheating in the Abu Dhabi sessions was significant, and it was not significant in the Calgary sessions. This difference in cheating behavior led to different treatment effects: subjects in Calgary believed that fellow participants would cheat less and therefore did not cheat themselves. Because participants in Calgary sessions did not lie (or lied very little), there was no reason to feel bad and adjust the amounts sent to the losers. Likewise, subjects in Abu Dhabi often did misreport their scores, and therefore had reason to feel bad/good, which led to an adjustment in the amount they sent. The biggest concern, however, is that we do not know if the result of the biggest cheaters being the least altruistic, is being driven by intelligence or some other demographic variable that is correlated with intelligence (e.g., culture, family wealth, etc.).
Within the domain of the world outside of the lab, our results do not suggest that a firm should knowingly promote a cheater, in the hope that the cheater will treat the losers relatively well. Rather, we argue that cheating is common, often not excessive, and mostly unobserved by outside parties. Even though cheating is viewed as normatively bad, it can still generate positive externalities. In the context of the firm, this type of cheating may be one of the more benign types, discussed earlier in the text. Workers who cheat like this tend to feel bad, and assuage their guilt by treating their coworkers better—which is a good thing. The problem with cheating, comes from the types who commit more egregious forms (e.g., overstating earnings). These types are different and treat the losers badly. Consequently, our results suggest that, given that cheating is common and hard to detect, firms should be especially careful when considering promoting workers who perform well outside the norm. If observed performance measures are too good to be true, scrutiny may well be warranted. A timely audit is in the best interests of the firm and those workers who are not cheating.

Author Contributions

Conceptualization, D.B.J. and J.R.; Methodology, J.R.; Software, D.B.J.; Formal analysis, D.B.J. and J.R.; Resources, J.R.; Data curation, D.B.J.; Writing—original draft, D.B.J. and J.R.; Writing—review and editing, D.B.J. and J.R. All authors have read and agreed to the published version of the manuscript.

Funding

This research was funded by the University of Calgary and New York University Abu Dhabi.

Institutional Review Board Statement

The study was conducted in accordance with the Declaration of Helsinki, and approved by the Institutional Review Boards of the University of Calgary and New York University Abu Dhabi.

Informed Consent Statement

Informed consent was obtained from all subjects involved in the study.

Data Availability Statement

The data presented in this study are openly available in the Open Science Framework at https://osf.io/zqx9f/.

Conflicts of Interest

The authors declare no conflict of interest.The funders had no role in the design of the study; in the collection, analyses, or interpretation of data; in the writing of the manuscript; or in the decision to publish the result.

Appendix A. Online Appendix

Table A1. Summary statistics (CHEAT).
Obs.MeanStd. Dev.MinMax
Percentage sent9219.2217.93050
Calgary920.520.5001
Male920.620.4901
Score927.822.20312
Age9220.452.161731
LIE-SELF920.371.0705
LIE-OTHERS922.471.2805
RELATIVE921.100.3012
Table A2. Summary statistics (CONTROL).
Obs.MeanStd. Dev.MinMax
PERCENT SENT10016.5417.67050
Calgary1000.460.5001
Male1000.530.5001
Score1006.882.15112
Age10020.632.281732
LIE-SELF1000.931.2705
LIE-OTHERS1002.441.0605
RELATIVE1001.160.3712
Table A3. Summary statistics (Calgary).
Obs.MeanStd. Dev.MinMax
Percentage sent9423.5117.38050
CHEAT940.510.5001
Male940.600.4901
Score946.682.00111
Age9420.722.791732
LIE-SELF940.521.1105
LIE-OTHERS942.351.2105
RELATIVE941.150.3612
Table A4. Summary statistics (Abu Dhabi).
Obs.MeanStd. Dev.MinMax
PERCENT SENT9812.3716.51050
CHEAT980.450.5001
Male980.550.5001
Score987.952.26212
Age9820.371.471823
LIE-SELF980.801.2905
LIE-OTHERS982.551.1205
RELATIVE981.110.3212
Figure A1. Distribution of test scores by treatment. Notes: Distribution of Raven’s test scores by treatment and location.
Games 14 00040 g0a1
Table A5. Ordered probit regression results—dependent variable: lie question.
Calgary
A white lie that makes someone else feel good is only positive.−0.20
(0.16)
I could lie to help someone else even if it hurts me.−0.46 ***
(0.16)
I could lie to get revenge even if it hurts me.−0.18
(0.16)
I am more inclined to lie, the more I have to gain from the lie.−0.24
(0.16)
I am less inclined to lie, the more others have to lose from the lie.−0.19
(0.16)
I am less inclined to lie, the greater the risk of discovery.−0.04
(0.17)
You either lie or you don’t, there are no degrees of lying.0.32 **
(0.16)
I am less inclined to lie, the greater the lie has to be for me to be believed.0.06
(0.16)
If I promise someone to tell the truth, that makes it very difficult for me to lie to that person.−0.11
(0.174)
There are degrees of promises, some formulations contain a greater promise than others.−0.08
(0.16)
Robust standard errors in parentheses. ***: p < 0.01 and **: p < 0.05.
Table A6. Ordered probit regression results—dependent variable: risk question.
Calgary
Betting a day’s income at the horse races.−0.22
(0.17)
Investing 10% of your annual income in a blue chip (well established and financially sound) stock.−0.03
(0.15)
Investing 10% of your annual income in a very speculative stock.0.03
(0.152)
Lending a friend an amount of money equivalent to one month’s income.−0.06
(0.15)
Spending money impulsively.−0.05
(0.15)
Taking a job where you get paid exclusively on a commission basis.−0.15
(0.15)
Not having a smoke alarm in or outside of your bedroom.−0.54 ***
(0.15)
Not wearing a seatbelt in a taxi.−0.71 ***
(0.16)
Not wearing sunscreen when you sunbathe.−0.18
(0.15)
Ignoring some persistent physical pain by not going to the doctor.<−0.001
(0.15)
Eating expired food products that still look and smell okay.0.13
(0.15)
Walking across the street at a busy intersection, when the light has already turned red.−0.56 ***
(0.15)
Exploring an unknown city or section of town alone.−0.26 *
(0.15)
Going camping in the wild.0.05
(0.152)
Taking up mountain climbing or sky diving as a hobby.−0.21
(0.15)
Showing up to a major event (like a concert or game) without a ticket.−0.29 *
(0.16)
Openly disagreeing with your boss in front of your coworkers (or with your professor in front of the class).−0.40 ***
(0.15)
Robust standard errors in parentheses. ***: p < 0.01 and *: p < 0.1.

Appendix A.1. Experimental Instructions

First Stage
Welcome to the experiment. I will read the instructions using this script so that you can be sure that you will all receive the same information. Please feel free to ask questions as they arise, but please raise your hand to do so and I will answer you privately. I ask that you do not talk to other participants or look at their monitors during the experiment. If you have a question or problem, please raise your hand and I will come and assist you. Please turn off your cell phones and put away your belongings. I will need your complete attention.
The instructions of this experiment are simple, and if you follow them carefully, you can earn a considerable amount of money, in addition to the 5 dollar/30 AED show-up payment. All the money you earn is yours to keep, and will be paid to you privately, in cash, after the experiment ends. All pay records will be kept confidential and your earnings today will not be revealed to other participants or known to anyone other than the experimenter.
This experiment will consist of two phases. In phase one you will participate in a quiz to earn money. The money you earn depends on the number of questions you correctly answer. You will earn (50 cents) [2 dirhams] for each question you answer correctly. Your performance in the first task will also determine your role in the second phase of the experiment. Those scoring in the top half of subjects in today’s session will be assigned the BLUE role. Subjects performing in the bottom half will be assigned the GREEN role. Those assigned the BLUE role will be advantaged and will be in a position to earn more money than the subjects in the GREEN role in phase two.
Your type will be assigned to you at the conclusion of phase one. Unless there are questions, we will now begin the first phase of the experiment.
CONTROL SESSIONS
You will be presented with problems that show a pattern with a portion missing from it. Determine what piece is needed to complete the pattern correctly, both along the rows and down the columns, BUT NOT THE DIAGONALS. You have 10 min to complete the quiz.
Subjects complete quiz and the computer automatically puts subjects in their proper role.
TREATMENT SESSIONS
You will be presented with problems that show a pattern with a portion missing from it. Determine what piece is needed to complete the pattern correctly, both along the rows and down the columns, BUT NOT THE DIAGONALS. You have 10 min to complete the quiz. Write your answers on the sheet that I have provided for you.
Subjects complete quiz.
At the conclusion of ten minutes the experimenter passes out the answer key and instruct subjects to grade themselves.
Experimenter reads aloud: I am now passing out the answer key for the quiz you just completed. I would like you to take a few moments and grade your own quiz. When you are finished grading your quiz, I would like to turn your papers over so that I know that you are finished. When prompted, enter the number of questions you answered correctly into the computer.
Now that everyone has completed their quizzes, I would like you to put your answers and key in your backpack/pocket/purse. After the experiment is over, I would like you take your quizzes and answers home and throw them away in your own trash.
Experimenter waits until all test materials have been put away.
Please turn to your screen and click the OK button. After everyone has clicked the OK button, you will be prompted to enter your score. After you have entered your score, you will be told the amount you earned from completing the quiz and will be assigned a role and partner.
Second Stage
You have now been assigned your role.
Please remain quiet and do not communicate with other participants during the entire experiment. Raise your hand, if you have any questions.
Half of the participants in the room have been assigned the role of the BLUE player, the other half have been assigned to the role of the GREEN player. The computer has placed you all in groups of two, composed of one randomly chosen GREEN player and one randomly chosen BLUE player. The BLUE players were the top performers in phase one. The GREEN players were the weaker performers in phase one.
In this game, the BLUE player decides the allocation of (1000 cents) [50 dirhams] that will go to each of the two players. That is, the BLUE player is selecting the amount she/he would like to keep and the amount they wish send to the GREEN player. If you have been assigned the GREEN role, you will receive information about the BLUE player’s decision, but you will get no information on who that person actually is, neither during the experiment, nor at any point after the experiment. Similarly, the BLUE will not be given any information about your identity.
This game will be played once—no repetition will follow. After the BLUE player has selected the allocations, the GREEN player will be informed of the amount the BLUE player kept and the amount that was sent. GREEN players will make no decisions.
At the conclusion of this phase, you will be asked to complete a questionnaire. Please raise your hand now if you have questions about the game. I will come to your terminal and try to help you.

Appendix A.2. Questionnaires

Appendix A.2.1. Lie Aversion

1. 
A white lie that makes someone else feel good is only positive.
2. 
I could lie to help someone else even if it hurts me.
3. 
I could lie to get revenge even if it hurts me.
4. 
I am more inclined to lie, the more I have to gain from the lie.
5. 
I am less inclined to lie, the more others have to lose from the lie.
6. 
I am less inclined to lie, the greater the risk of discovery.
7. 
You either lie or you don’t, there are no degrees of lying.
8. 
I am less inclined to lie, the greater the lie has to be for me to be believed.
9. 
If I promise someone to tell the truth, that makes it very difficult for me to lie to that person.
10.
There are degrees of promises, some formulations contain a greater promise than others.

Appendix A.2.2. Risk

For each of the following statements, please indicate the likelihood that you would engage in the activity. Provide a rating from 1 to 7, 1 meaning extremely unlikely, 7 meaning extremely likely.
1. 
Betting a day’s income at the horse races.
2. 
Investing 10% of your annual income in a blue chip (well established and financially sound) stock.
3. 
Investing 10% of your annual income in a very speculative stock.
4. 
Lending a friend an amount of money equivalent to one month’s income.
5. 
Spending money impulsively.
6. 
Taking a job, where you get paid exclusively on a commission basis.
7. 
Not having a smoke alarm in or outside of your bedroom.
8. 
Not wearing a seatbelt in a taxi.
9. 
Not wearing sunscreen, when you sunbathe.
10.
Ignoring some persistent physical pain by not going to the doctor.
11.
Eating expired food products that still look and smell okay.
12.
Walking across the street at a busy intersection, when the light has already turned red.
13.
Exploring an unknown city or section of town alone.
14.
Going camping in the wild.
15.
Taking up mountain climbing or sky diving as a hobby.
16.
Showing up to a major event (like a concert or game) without a ticket.
17.
Openly disagreeing with your boss in front of your coworkers (or with your professor in front of the class).

Notes

1
“Lance Armstrong’s Confession” Oprah. com 17 January 2013. Web. 12 January 2016.
2
Livestrong Foundation. No title. No Date. Web. 12 January 2016. http://www.livestrong.org/what-we-do/ (accessed on 10 April 2023).
3
Feuer, Alan and Haughney, Christine. “Standing Accused: A Pillar of Finance and Charity” The New York Times. N.p., 12 December 2008. Web. 12 January 2016.
4
For example, when deciding whether or not to promote an assistant professor, departments want to reward faculty who will remain productive. But Faria and McAdam [12] find all faculty have the incentive to signal that they will be productive, though not all will.
5
Paying workers to take sick leave may encourage absenteeism, but it can also keep ill employees from showing up and infecting others, thus resulting in more loss to the company [13].
6
A cognitive dissonance is an internal tension from holding two conflicting ideas concurrently.
7
We use the term “game” here, as it is standard in the literature, but technically the dictator game really is not a game, as there is no interaction between the players.
8
Similar findings are outlined in Cherry et al. [32], Frohlich et al. [33], and Konow [34], among others.
9
At the time of the sessions, these piece rates converted to USD 0.45 and USD 0.54, respectively.
10
It was important to not run the CHEAT treatment electronically, as we needed subjects to trust that they were completely free to cheat, without the possibility of detection.
11
Raw data and code can be found at https://osf.io/zqx9f/ (accessed on 10 April 2023). Experimental materials are available upon request. This project was not pre-registered as it was started in 2013, before the pre-registration norm was established.
12
Payments at both locations were calibrated to compensate subjects for their opportunity cost of participation.
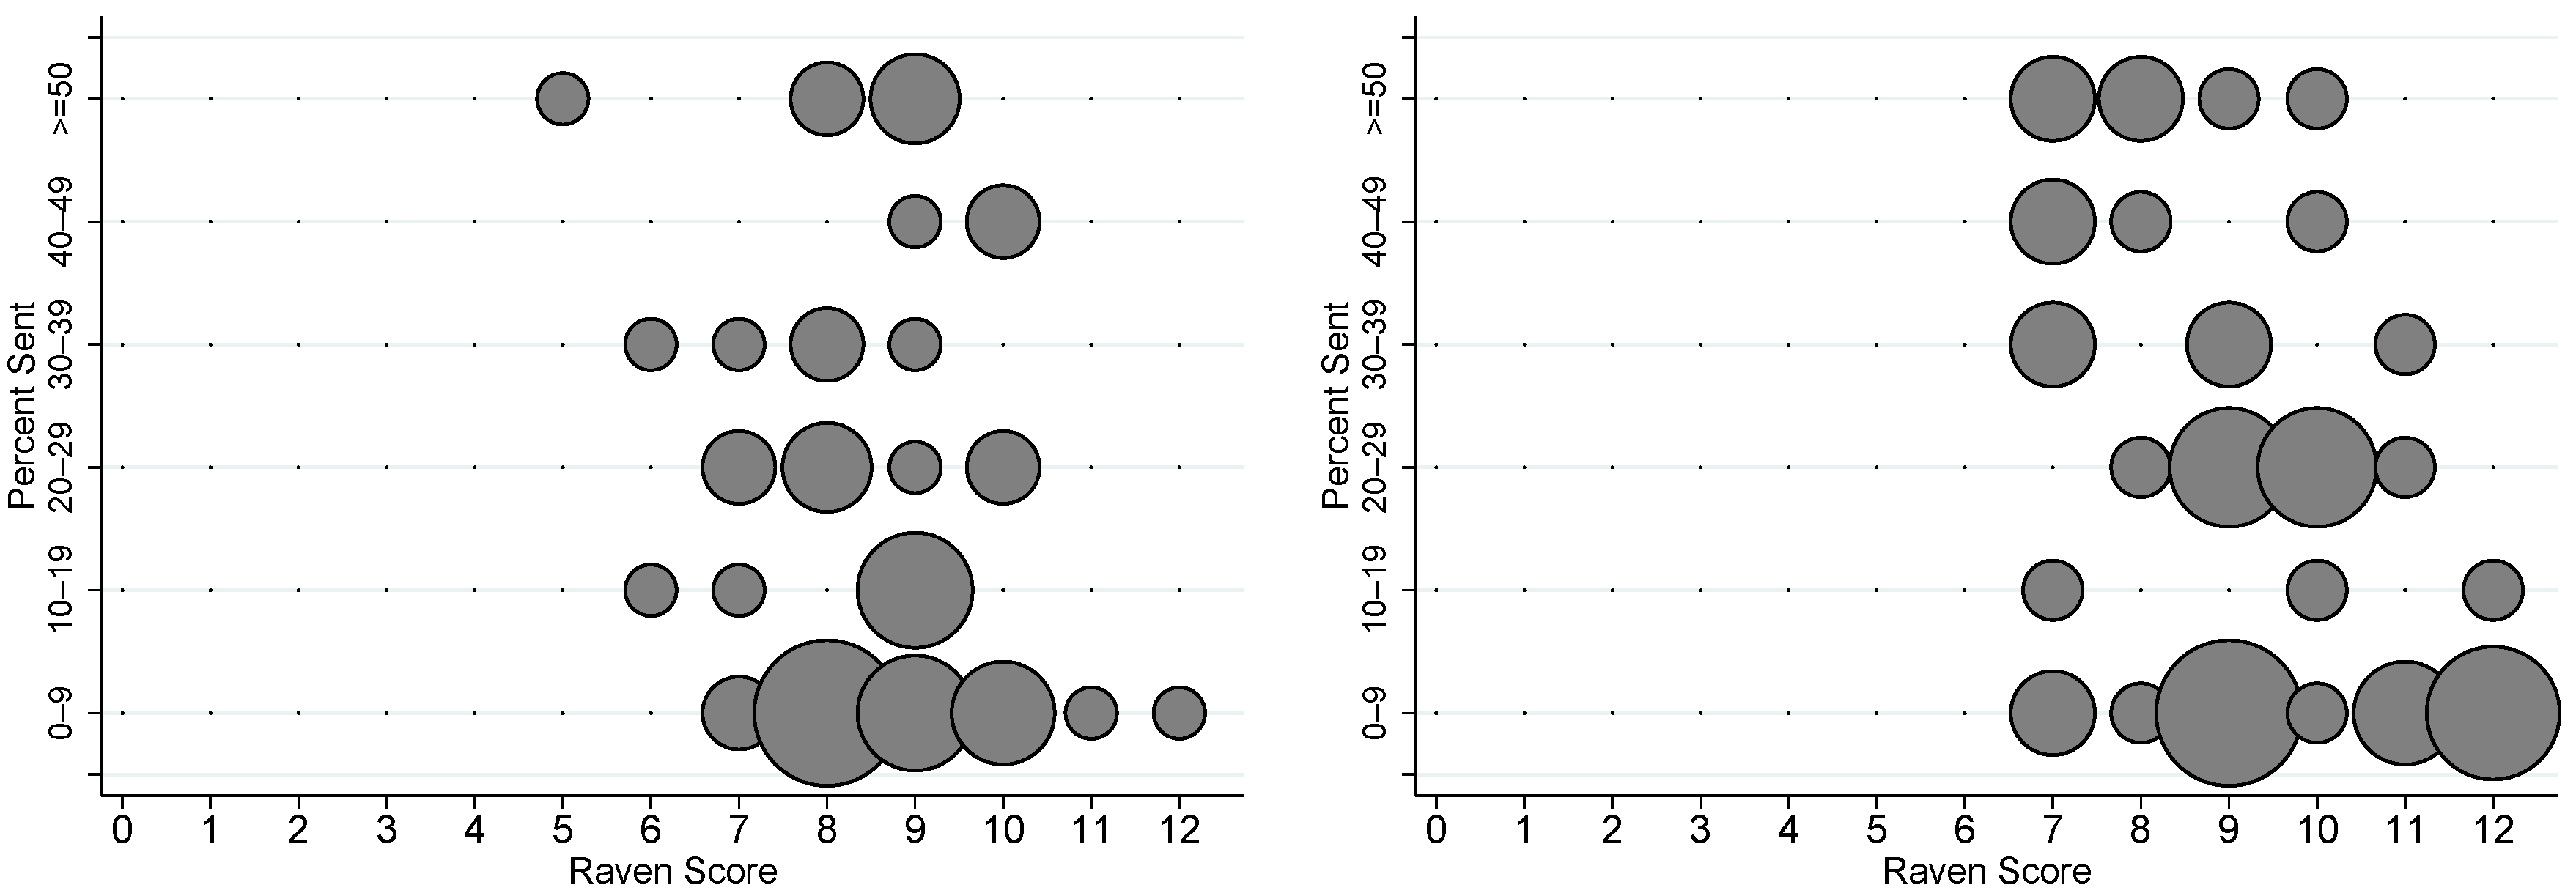
13
So for instance, circles on the lowest line represent the percentage of offers sent by dictators that are greater than zero but less than 10 percent of the endowment.
14
Interestingly, subjects in both treatments find their cohorts equally suspicious. When subjects in CHEAT are asked “How much do you think other subjects lied about their test score?”, the expected level of cheating is no different than what subjects in CONTROL report when asked the same question but posed in terms of the hypothetical (ordered probit: coef = 0.05; robust standard errors, p = 0.75 ). This suggests that expectations of dishonest behavior are independent of its possibility of occurring.
15
This is a reasonable classification scheme, that has been employed in multiple studies, e.g., [48,49].
16
Dictators in CHEAT are significantly more likely to answer more than 10 questions correctly than dictators in CONTROL (test of proportions: 0.24 vs. 0.04; p < 0.01 ).
17
HIGH SCORE dictators in CHEAT also indicated that they answered two fewer questions on average in the post-experiment survey, than they reported in the experiment. This is significantly greater than 0.31, which was the average difference between the reported score in the experiment and the post-experiment survey for the non-HIGH SCORE dictators.
18
We use the tobit regression here, as the data is censored from below 0. Some dictators may like to send negative amounts (outright steal from the receiver), but the game does not allow this.
19
We note that the significance here is marginal. We choose to report it because, by the nature of the question, it likely under-reports actual dishonesty.
20
This result should be taken with some skepticism because there is an element of risk here too.
21
There is one exception here. In Model 1, the coefficient estimate on HIGH SCORE is positive and significant. However, this is being driven by one observation, i.e., only one subject in the Calgary sessions got more than 10 questions correct on the IQ test and this subject participated in a CHEAT session.
22
While cultural norms may have influenced gameplay, we purposefully avoid such analysis, because doing so would be misleading. Both universities where the experiments were run, have a substantial international presence. Thus, attributing gameplay differences to cultural norms in the two countries, would be misleading.
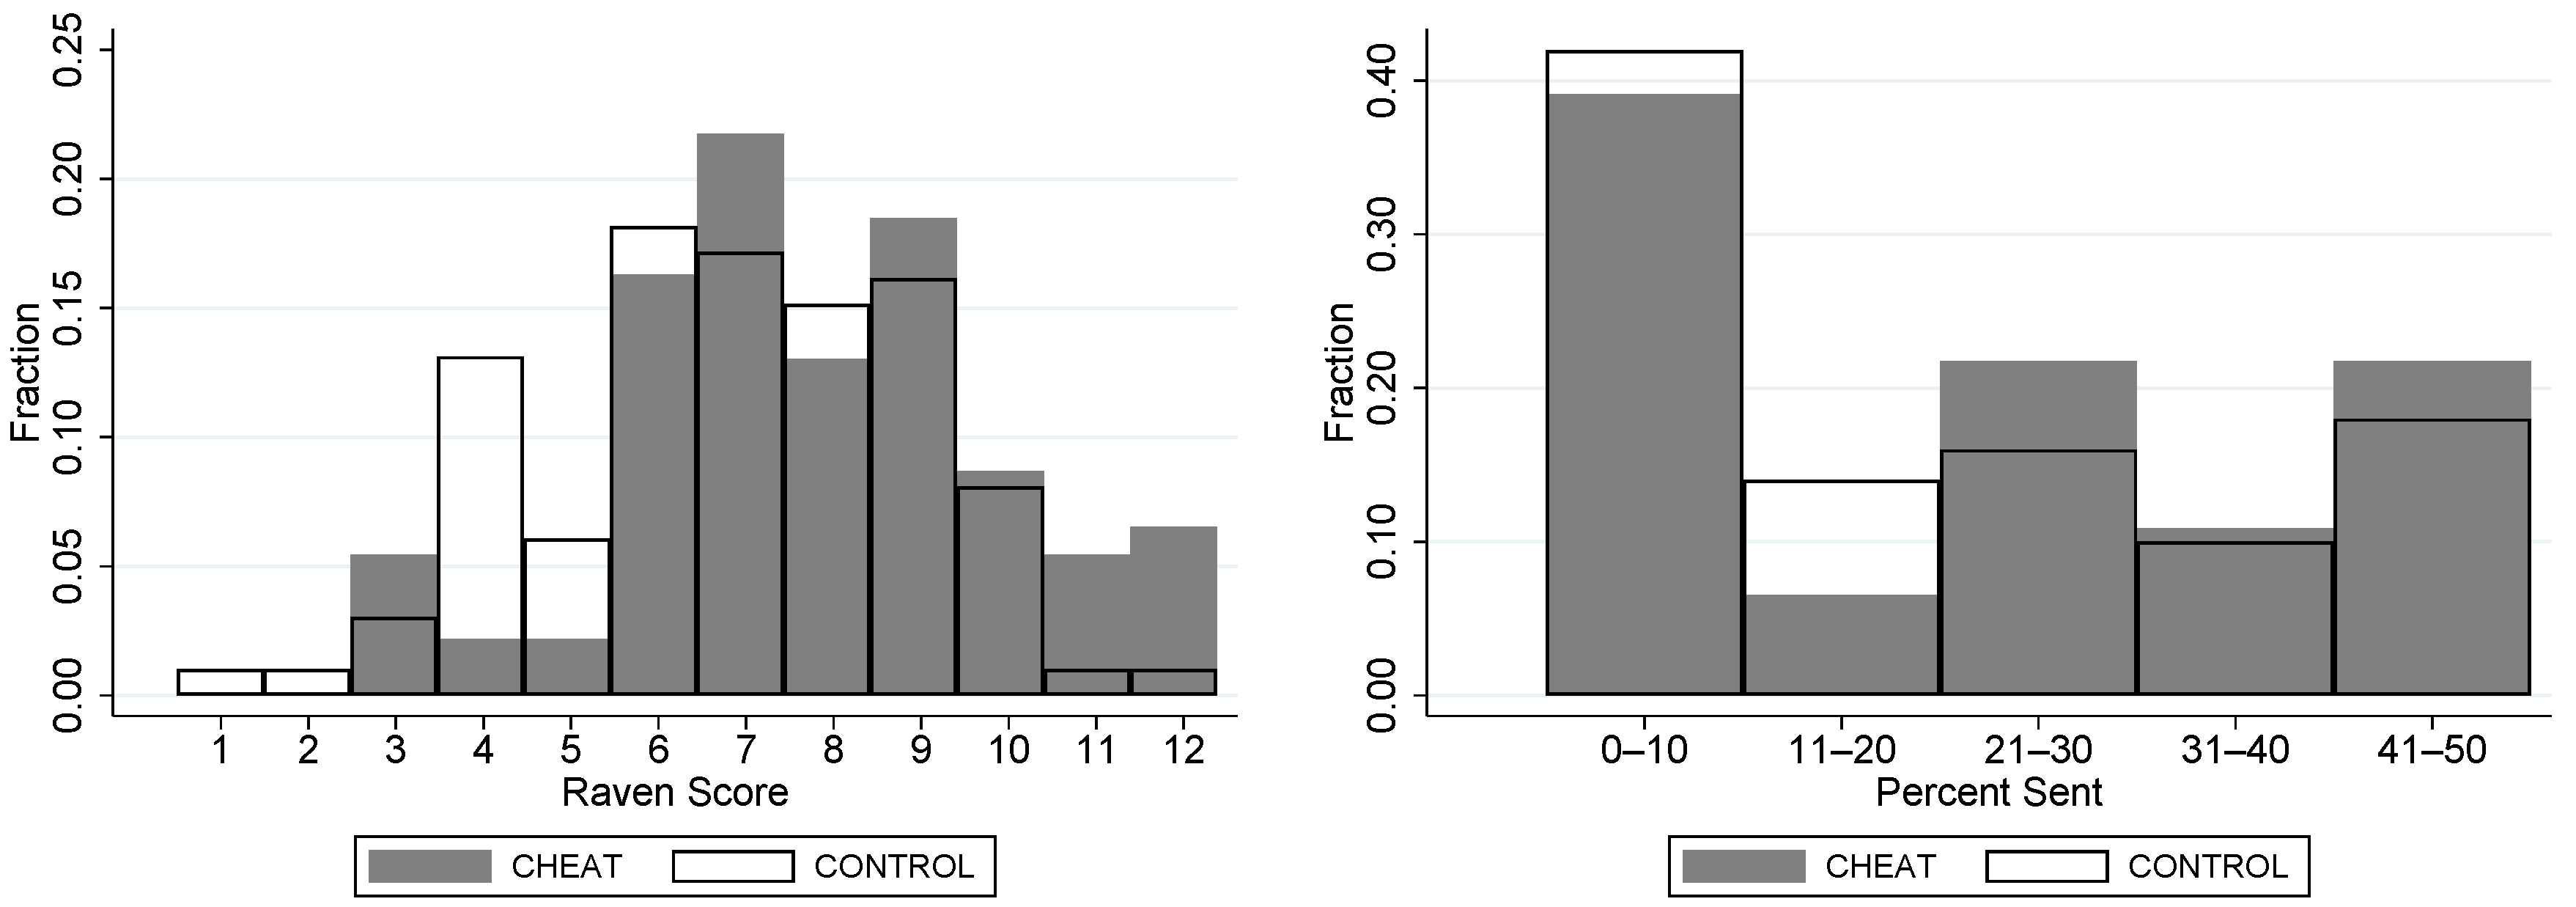
23
The distribution of IQ test scores by treatment and location is found in Figure A1 of Appendix A.
24
We also note that Abu Dhabi subjects had a higher GPA on average (t-test 3.93 vs. 3.60 h: p < 0.01 ; U-test: p < 0.01 ).
25
The reasoning behind this behavior is laid out in [51]. Essentially, deviations from the own monetary payoff maximizing prediction, are more likely to be made by those with lower cognitive ability.
26
While Abu Dhabi subjects had higher test scores, the presence of scores above 10 were almost certainly largely due to cheating. Only two subjects in CONTROL in Abu Dhabi had a score above 10 in CONTROL, while 10 answered more than 10 questions in CHEAT.
27
The causality may go in either direction c.f., [52].
28
When asked to self-report their actual scores, HIGH SCORE dictators in CHEAT reported having correctly answered 9.63 questions correctly, while non-HIGH SCORE dictators in CHEAT reported that their actual score was 8.25. This difference is statistically significant (t-test: p = 0.01 ). Note, we are assuming that the biggest cheaters are also later being honest.

References

  1. Engel, C. Dictator games: A meta study. Exp. Econ. 2011, 14, 583–610. [Google Scholar] [CrossRef]
  2. Hoffman, E.; McCabe, K.; Shachat, K.; Smith, V. Preferences, Property Rights, and Anonymity in Bargaining Games. Games Econ. Behav. 1994, 7, 346–380. [Google Scholar] [CrossRef]
  3. Schurter, K.; Wilson, B.J. Justice and fairness in the dictator game. South. Econ. J. 2009, 76, 130–145. [Google Scholar] [CrossRef]
  4. Mazar, N.; Amir, O.; Ariely, D. The dishonesty of honest people: A theory of self-concept maintenance. J. Mark. Res. 2008, 45, 633–644. [Google Scholar] [CrossRef]
  5. Aquino, K.; Reed, A., II. The self-importance of moral identity. J. Personal. Soc. Psychol. 2002, 83, 1423. [Google Scholar] [CrossRef] [PubMed]
  6. Ayal, S.; Gino, F. Honest rationales for dishonest behavior. In The Social Psychology of Morality: Exploring the Causes of Good and Evil; American Psychological Association: Washington, DC, USA, 2011. [Google Scholar]
  7. Barkan, R.; Ayal, S.; Gino, F.; Ariely, D. The pot calling the kettle black: Distancing response to ethical dissonance. J. Exp. Psychol. Gen. 2012, 141, 757. [Google Scholar] [CrossRef]
  8. Thielmann, I.; Hilbig, B.E. No gain without pain: The psychological costs of dishonesty. J. Econ. Psychol. 2019, 71, 126–137. [Google Scholar] [CrossRef]
  9. Becker, G.S. Crime and punishment: An economic approach. In Essays in the Economics of Crime and Punishment; UMI: Anaheim, CA, USA, 1974; pp. 1–54. [Google Scholar]
  10. Preston, I.; Szymanski, S. Cheating in contests. Oxf. Rev. Econ. Policy 2003, 19, 612–624. [Google Scholar] [CrossRef]
  11. Kleven, H.J.; Knudsen, M.B.; Kreiner, C.T.; Pedersen, S.; Saez, E. Unwilling or unable to cheat? Evidence from a tax audit experiment in Denmark. Econometrica 2011, 79, 651–692. [Google Scholar]
  12. Faria, J.R.; McAdam, P. Academic productivity before and after tenure: The case of the ‘specialist’. Oxf. Econ. Pap. 2015, 67, gpv002. [Google Scholar] [CrossRef]
  13. Chatterji, M.; Tilley, C.J. Sickness, absenteeism, presenteeism, and sick pay. Oxf. Econ. Pap. 2002, 54, 669–687. [Google Scholar] [CrossRef]
  14. Schweitzer, M.E.; Hsee, C.K. Stretching the truth: Elastic justification and motivated communication of uncertain information. J. Risk Uncertain. 2002, 25, 185–201. [Google Scholar] [CrossRef]
  15. El Hazzouri, M.; Carvalho, S.W.; Main, K.J. An Investigation of the Emotional Outcomes of Business Students’ Cheating “Biological Laws” to Achieve Academic Excellence. Acad. Manag. Learn. Educ. 2015, 14, 440–460. [Google Scholar] [CrossRef]
  16. Hugh-Jones, D. Honesty, beliefs about honesty, and economic growth in 15 countries. J. Econ. Behav. Organ. 2016, 127, 99–114. [Google Scholar] [CrossRef]
  17. Erat, S.; Gneezy, U. White Lies. Manag. Sci. 2012, 58, 723–733. [Google Scholar] [CrossRef]
  18. Rettinger, D.A.; Jordan, A.E. The relations among religion, motivation, and college cheating: A natural experiment. Ethics Behav. 2005, 15, 107–129. [Google Scholar] [CrossRef]
  19. Fischbacher, U.; Föllmi-Heusi, F. Lies in disguise—An experimental study on cheating. J. Eur. Econ. Assoc. 2013, 11, 525–547. [Google Scholar] [CrossRef]
  20. Festinger, L. A Theory of Cognitive Dissonance; Stanford University Press: Redwood City, CA, USA, 1962; Volume 2. [Google Scholar]
  21. List, J.A. On the interpretation of giving in dictator games. J. Political Econ. 2007, 115, 482–493. [Google Scholar] [CrossRef]
  22. Hoffman, E.; McCabe, K.; Smith, V.L. Social distance and other-regarding behavior in dictator games. Am. Econ. Rev. 1996, 86, 653–660. [Google Scholar]
  23. Bolton, G.E.; Katok, E.; Zwick, R. Dictator game giving: Rules of fairness versus acts of kindness. Int. J. Game Theory 1998, 27, 269–299. [Google Scholar] [CrossRef]
  24. Brañas-Garza, P.; Cobo-Reyes, R.; Espinosa, M.P.; Jiménez, N.; Kovářík, J.; Ponti, G. Altruism and social integration. Games Econ. Behav. 2010, 69, 249–257. [Google Scholar] [CrossRef]
  25. Leider, S.; Möbius, M.M.; Rosenblat, T.; Do, Q.A. Directed altruism and enforced reciprocity in social networks. Q. J. Econ. 2009, 124, 1815–1851. [Google Scholar] [CrossRef]
  26. Charness, G.; Rabin, M. Understanding social preferences with simple tests. Q. J. Econ. 2002, 117, 817–869. [Google Scholar] [CrossRef]
  27. Cochard, F.; Le Gallo, J.; Georgantzis, N.; Tisserand, J.C. Social preferences across different populations: Meta-analyses on the ultimatum game and dictator game. J. Behav. Exp. Econ. 2021, 90, 101613. [Google Scholar] [CrossRef]
  28. Cherry, T.L. Mental accounting and other-regarding behavior: Evidence from the lab. J. Econ. Psychol. 2001, 22, 605–615. [Google Scholar] [CrossRef]
  29. Oxoby, R.J.; Spraggon, J. Mine and Yours: Property Rights in Dictator Games. J. Econ. Behav. Organ. 2008, 65, 703–713. [Google Scholar] [CrossRef]
  30. Carr, M.D.; Mellizo, P. Entitlement in a Real Effort Ultimatum Game; Working Paper; University of Massachusetts Boston: Boston, MA, USA, 2013. [Google Scholar]
  31. Ruffle, B.J. More is better, but fair is fair: Tipping in dictator and ultimatum games. Games Econ. Behav. 1998, 23, 247–265. [Google Scholar] [CrossRef]
  32. Cherry, T.L.; Frykblom, P.; Shogren, J.F. Hardnose the Dictator. Am. Econ. Rev. 2002, 92, 1218–1221. [Google Scholar] [CrossRef]
  33. Frohlich, N.; Oppenheimer, J.; Kurki, A. Modeling Other-regarding Preferences and an Experimental Test. Public Choice 2004, 119, 91–117. [Google Scholar] [CrossRef]
  34. Konow, J. Fair Shares: Accountability and Cognitive Dissonance in Allocation Decisions. Am. Econ. Rev. 2000, 90, 1072–1091. [Google Scholar] [CrossRef]
  35. Schurr, A.; Ritov, I. Winning a competition predicts dishonest behavior. Proc. Natl. Acad. Sci. USA 2016, 113, 201515102. [Google Scholar] [CrossRef] [PubMed]
  36. Andreoni, J. Giving with Impure Altruism: Applications to Charity and Ricardian Equivalence. J. Political Econ. 1989, 97, 1447–1458. [Google Scholar] [CrossRef]
  37. Fehr, E.; Schmidt, K. A Theory of Fairness, Competition, and Cooperation. Q. J. Econ. 1999, 144, 817–868. [Google Scholar] [CrossRef]
  38. Bolton, G.; Ockenfels, A. ERC: A theory of equity, reciprocity, and competition. Am. Econ. Rev. 2000, 90, 166–193. [Google Scholar] [CrossRef]
  39. Raven, J. The Raven Progressive Matrices: A review of national norming studies and ethnic and socioeconomic variation within the United States. J. Educ. Meas. 1989, 26, 1–16. [Google Scholar] [CrossRef]
  40. Raven, J. Psychometrics, cognitive ability, and occupational performance. Rev. Psychol. 2000, 7, 51–74. [Google Scholar]
  41. Greiner, B. An online recruitment system for economic experiments. Forsch. Wiss. Rechn. 2004, 63, 79–93. [Google Scholar]
  42. Bock, O.; Baetge, I.; Nicklisch, A. hroot: Hamburg registration and organization online tool. Eur. Econ. Rev. 2014, 71, 117–120. [Google Scholar] [CrossRef]
  43. DePaulo, B.M.; Kashy, D.A.; Kirkendol, S.E.; Wyer, M.M.; Epstein, J.A. Lying in everyday life. J. Personal. Soc. Psychol. 1996, 70, 979. [Google Scholar] [CrossRef]
  44. Fischbacher, U. z-Tree: Zurich toolbox for ready-made economic experiments. Exp. Econ. 2007, 10, 171–178. [Google Scholar] [CrossRef]
  45. Tenbrunsel, A.E.; Diekmann, K.A.; Wade-Benzoni, K.A.; Bazerman, M.H. The ethical mirage: A temporal explanation as to why we are not as ethical as we think we are. Res. Organ. Behav. 2010, 30, 153–173. [Google Scholar] [CrossRef]
  46. McCabe, D.L.; Trevino, L.K.; Butterfield, K.D. Cheating in academic institutions: A decade of research. Ethics Behav. 2001, 11, 219–232. [Google Scholar] [CrossRef]
  47. Zhang, J.; Casari, M. How groups reach agreement in risky choices: An experiment. Econ. Inq. 2012, 50, 502–515. [Google Scholar] [CrossRef]
  48. Zeiner, A.R.; Schell, A.M. Individual differences in orienting, conditionability, and skin resistance responsivity. Psychophysiology 1971, 8, 612–622. [Google Scholar] [CrossRef] [PubMed]
  49. Andreoni, J.; Petrie, R. Beauty, gender and stereotypes: Evidence from laboratory experiments. J. Econ. Psychol. 2008, 29, 73–93. [Google Scholar] [CrossRef]
  50. Fréchette, G.R. Session-effects in the laboratory. Exp. Econ. 2012, 15, 485–498. [Google Scholar] [CrossRef]
  51. Ben-Ner, A.; Kong, F.; Putterman, L. Share and share alike? Gender-pairing, personality, and cognitive ability as determinants of giving. J. Econ. Psychol. 2004, 25, 581–589. [Google Scholar] [CrossRef]
  52. Ross, L.; Greene, D.; House, P. The “false consensus effect”: An egocentric bias in social perception and attribution processes. J. Exp. Soc. Psychol. 1977, 13, 279–301. [Google Scholar] [CrossRef]
  53. Mazar, N.; Amir, O.; Ariely, D. More Ways to Cheat-Expanding the Scope of Dishonesty. J. Mark. Res. 2008, 45, 651–653. [Google Scholar]
Figure 1. PDFs of total correct scores and percentage sent by dictators. Notes: The left side is the PDF of Raven’s Progressive Matrices test scores by treatment (all subjects). The right side is the percentage of the endowment the dictator sends to the receiver by treatment. Shaded regions correspond to CHEAT and outlined regions correspond to CONTROL.
Games 14 00040 g001
Figure 2. Cheating and generosity: CONTROL (left) vs. CHEAT (right). Notes: The above graphs present plots of the dictators’ Raven’s Progressive Matrices test scores against the fraction of the endowment sent to receivers. The size of the dots correspond to the frequency of a given test score and the fraction of the endowment sent. The left side presents data from CONTROL sessions; right is CHEAT sessions.
Games 14 00040 g002
Table 1. Summary statistics.
Obs.MeanStd. Dev.MinMax
Percent Sent9617.8217.78050
CHEAT1920.480.5001
Calgary1920.400.5001
Male1920.570.5001
Score1927.332.22112
Age19220.542.221732
LIE-SELF1920.661.2105
LIE-OTHERS1922.451.1705
RELATIVE1921.130.3412
Table 2. Tobit results: dependent variable—percentage sent.
M1M2M3M4M5M6M7M8M9
CHEAT4.29 8.279.35 *9.83 *10.55 **10.73 **8.66 *
(5.39) (5.42)(5.24)(5.26)(5.25)(5.25)(4.97)
Score −4.66 *** −5.36 *** −2.60−2.88−2.64−0.59
(1.55) (1.61) (2.27)(2.31)(2.40)(2.51)
HIGH SCORE −23.66 *** −27.79 ***−19.89 *−19.45 **−20.48 **−20.47 **
(7.76) (7.74)(10.38)(9.75)(10.13)(10.02)
Male −4.14−5.29
(5.33)(5.20)
Age 2.29 **2.09 **1.66 *
(0.97)(1.01)(0.99)
Calgary 11.21 **
(5.398)
Constant10.20 **53.75 ***15.39 ***55.96 ***11.45 ***33.27 *−11.87−7.46−20.65
(4.04)(13.94)(2.98)(13.68)(3.86)(18.98)(30.84)(30.93)(30.56)
P. R 2 0.000.010.010.0150.020.020.030.030.03
Log. L.−321.41−318.26−317.55−317.04−316.00−315.38−313.33−313.00−311.05
Robust standard errors in parentheses. ***: p < 0.01, **: p < 0.05, and *: p < 0.1. All Models are tobit’s censored at 0. Thirty-three of the ninety-six observations are censored at the lower limit.
Table 3. Average offers by session location.
CONTROLCHEATALL
Abu Dhabi11.5613.3612.37
(3.479)(3.18)(2.37)
Calgary22.3924.5823.51
(3.30)(3.92)(2.55)
p-value0.030.0330.0018
Table 4. Tobit results: dependent variable—percentage sent.
CalgaryAbu Dhabi
M1M2M3M4
CHEAT0.821.8216.66 *16.09 *
(6.35)(6.16)(9.12)(9.44)
Score−2.55−2.312.863.00
(2.61)(2.91)(5.36)(4.86)
HIGH SCORE15.10 *7.41−38.02 **−37.80 **
(8.93)(11.69)(15.88)(14.47)
Male −6.34 −3.60
(6.79) (8.49)
Age 1.00 2.45
(1.12) (2.28)
Constant41.48 *22.27−24.00−72.94
(21.57)(33.33)(46.43)(58.44)
P R 2 0.000.010.030.04
Log L−178.36−177.25−131.54−130.94
OBS47474949
LL992424
Robust standard errors in parentheses. **: p < 0.05 and *: p < 0.1. All models are tobit’s censored at 0 (LL).
Disclaimer/Publisher’s Note: The statements, opinions and data contained in all publications are solely those of the individual author(s) and contributor(s) and not of MDPI and/or the editor(s). MDPI and/or the editor(s) disclaim responsibility for any injury to people or property resulting from any ideas, methods, instructions or products referred to in the content.

