
Default Matters in Trust and Reciprocity

1
Department of Psychology, College of Hengyi Jing Education, Hangzhou Normal University, Hangzhou 310030, China
2
Zhejiang Key Laboratory for Research in Assessment of Cognitive Impairment, Hangzhou Normal University, Hangzhou 310030, China
3
School of Systems Biology, George Mason University, Fairfax, VA 22030, USA
4
Department of Psychology, University of Mannheim, 68131 Mannheim, Germany
*
Authors to whom correspondence should be addressed.
Games 2023, 14(1), 8; https://doi.org/10.3390/g14010008
Submission received: 12 November 2022
/
Revised: 22 December 2022
/
Accepted: 11 January 2023
/
Published: 13 January 2023
(This article belongs to the Special Issue A Yin and Yang Perspective on the Trust Game: Trust and Reciprocity)
Abstract
:Trust and reciprocity promote cooperation and are key elements of a successful social life. This study investigated the framing effects on trust and reciprocity behaviors. Using an iterated one-shot within-subjects design, this study explored how trust and reciprocity decisions changed when the game was framed in terms of a give (i.e., using a standard trust game with a default of no trust) and a take (e.g., using a distrust game with a default of full trust) frame. Participants of both genders first completed the scenario version of the game (Session 1), and then played the roles of trustors (Session 2) and trustees (Session 3) with human and computer-mediated human partners either in the give or take frame. Our results showed increased trust in the give than in the take frame, but only pronounced in direct interaction with human (vs. indirect computer-mediated) partners. Participants also showed higher expectations of return in the give than in the take frame. The actual reciprocity was higher in the give than in the take frame when interacting both with human and computer-mediated human partners. The results contribute to our understanding of the factors that shape trust and reciprocity and emphasize the impact of framing the default.
1. Introduction
Trust and reciprocity play an essential role in a successful social life [1,2,3]. We do not only trust our family, friends, and even strangers but also reciprocate others’ kindness. Research over the past few decades further highlights the importance of trust and reciprocity to organizations and society [4,5,6,7,8]. However, previous work has focused primarily on behavior in the default of no trust. These studies usually employ the standard trust game [9] (TG) to measure trust and reciprocity, in which both trustors and trustees have endowments and no trust is the default for the trustor. Only a few studies have explored how trust and reciprocity change when the default involves full trust [10,11,12]. These studies employ the distrust game (DTG) to measure trust and reciprocity, in which only trustees have the endowments and full trust is the default for the trustor. Motivated by prior research on the relevance of reference points—a change in the default affects decision making [13,14,15]—we examined how default affects trust and reciprocity among strangers in this study.
Trust can be defined as “a psychological state comprising the intention to accept vulnerability based upon positive expectations of the intentions or behaviors of another” [16] (p. 395). People sometimes avoid this vulnerability; therefore, people might start with caution when interacting with strangers. When shopping online, for example, consumers will skip the stores with no credit scores. However, in many other situations, people start trusting strangers. For example, people who purchase funds typically trust their fund managers and would lose their money if they fail to distrust their managers earlier when the managers are untrustworthy. Compared with a reference point of no trust, people may be more optimistic about trustees’ trustworthiness. Therefore, the trust default may lead people to trust more than they would have to [10].
Reciprocity is a behavioral response to perceived kindness and unkindness [17]. People tend to reward others who are kind to them with kindness (i.e., positive reciprocity) and punish someone who is spiteful with spite (i.e., negative reciprocity) [18]. Identical consequences trigger different reciprocal responses in different contexts. For example, the percentage of trustees who share is twice as high when the trustor’s decision to trust is voluntary rather than involuntary [19]. Similarly, trustors’ lower control over the outcome has a negative effect on reciprocity behavior and beliefs [20]. The default may also affect reciprocity. The no trust default may lead people to reciprocate more to reward a trustor’s kindness compared to the full trust default [10]. Both trust and reciprocity are context-dependent and hence susceptible to framing.
The framing effect—wherein a situation described in different ways produces different responses [21]—is a well-known top-down process influencing decision making [13]. This effect has been shown to play a key role in many different fields, including stock market forecasting [22,23], rate of organ donation [24], and international conflicts [25]. For example, gain–loss framing has proven to be a powerful and persuasive information construction [26]. According to prospect theory, people distinguish the results by gain or loss based on a reference point. People are more sensitive to losses [27] and are more willing to risk in decisions involving losses [28]. Because of loss aversion, people prefer to keep their status rather than change it [15]. This status quo effect is pervasive in both inconsequential and major decisions. Often, people are held back by what they believe to be the safe option, simply because it is the default.
Framing effects have also been studied in the context of trust and reciprocity behaviors, employing the two-person reciprocal TG (also referred to as the investment game) [9]. For example, Evans and Beest (2017) examined changes in trust and reciprocity behavior by presenting the TG in the context of a gain vs. a loss frame [29]. In the gain frame, participants started at 0 points and received different amounts depending on their decision, whereas, in the loss frame, participants started at 1200 points and lost some or all of these points upon certain choices. If participants used the same strategy in both frames, they would have the same final outcomes. The results showed that decisions under the loss frame compared to the gain frame increased average trust behavior but not reciprocity behavior, suggesting that the loss frame makes trustors less likely to apply a calculative mindset. Further, these changes were only evident when participants interacted with human but not computer partners, demonstrating the unique social consequences of the loss frame.
Moreover, Bohnet and Meier (2005) investigated changes in trust and reciprocity behavior by comparing the TG with the DTG. In the TG, the default is no trust and represents a give frame. Two players are anonymously paired and endowed with some money (e.g., $10). The trustor (first player) is asked to send any amount of the money (X: $0 to $10) to the trustee (second player). Both players are informed that the chosen amount will be tripled by the experimenter (3 × X, max. $30). The trustee is then asked to return any of the received amount back to the trustor (Y: $0 to 10 + 3 × $10). The money sent by the trustor (i.e., X) measures trust, whereas the money returned by the trustee (i.e., Y) reflects reciprocity. In the DTG, the default is full trust and represents a take frame. The trustee is endowed with all the money (e.g., $40), and the trustor first decides how much to take from the trustee (Z: $0 to $30). The take amount is then divided by three by the experimenter and given to the trustor (Z/3, max. $10). The trustee then determines how much of the remaining money to return to the trustor (Y: $0 to $40−Z). The amount not taken by the trustor (10−Z/3) measures trust, whereas the amount returned by the trustee measures reciprocity.
Employing an anonymous one-shot game design, Bohnet and Meier (2005) reported that first players trusted more in the take compared to the give frame. The authors argued that participants in the DTG could not correctly predict the impact of the take frame on trustees’ behavior, in which they expected more reciprocity for higher trust and less reciprocity for lower trust in the DTG than in the TG. Further, trustees reciprocated more in the give compared to the take frame, punishing their partners more severely for the commission of distrust (i.e., taking money away) than for the omission of trust (i.e., giving less money).
To investigate the extent to which trust and distrust are influenced by genetics and family socialization, Reimann and colleagues [12] recruited identical and dizygotic female twins to play anonymous one-shot TG and DTG (within-subjects design) in the role of a trustor. They demonstrated higher trust in the give than in the take frame. Although the disposition to trust is explained to some extent by heritability but not by shared socialization, the disposition to distrust is explained by shared socialization but not by heritability.
Finally, Fang and colleagues (2022) employed prediction and lesion models to decode resting-state functional connectivity (RSFC) for the reciprocity decisions of healthy volunteers who underwent first RS functional magnetic resonance imaging and then completed one-shot TG and DTG as trustees [11]. They revealed that participants reciprocated more in the give than in the take frame, and RSFC between the default mode and frontoparietal networks contributed significantly to the prediction of reciprocity decisions under the give frame but not the take frame.
Previous findings about the framing effect (give vs. take) on reciprocity decisions are consistent with higher reciprocity in the give (TG) compared to the take (DTG) frame. However, findings regarding the trust decisions are inconsistent, with more trust in the take frame in the experiment of Bohnet and Meier (2005), studying both female and male participants, but more trust in the give frame in the study of Reimann et al. (2017), studying only female participants. These identified differences need further investigations to explore potential gender framing differences. Moreover, these prior studies employed a single one-shot game design, which may fail to exhibit consistency (e.g., how choices vary with partners) and coherence (e.g., how choices vary with contexts) in decision making [30]. A single one-shot design may encourage a heuristic decision preference for the extreme choices (e.g., in an all-or-none mode of trusting 0 or trusting all) and a stronger bias for default choices (e.g., trusting 0 in the TG and trusting all in the DTG) compared to an iterated one-shot game design. Furthermore, previous studies either included no boundary or control conditions [12] or only a control condition for intentions with a random mechanism on the reciprocity [10]. None of the previous studies investigated the boundary conditions of the framing effects in trust and reciprocity. It is unclear whether the framing effect in trust and reciprocity is pronounced for one-to-one social (i.e., with specific human partner) and non-specific (e.g., with computer partner) interactions Finally, previous studies used a between-subjects design in which participants acted either as trustors or trustees, but not as both. Previous evidence shows that participants who play both roles are more selfish than those who play only the role of trustors [31]. Playing both roles, trustors may feel less obligated to trust their counterparts because they know that their counterpart will have more than one opportunity to make money in the game. When trustors know in advance that they will also play the role of the trustees, they take the perspective of the trustees, which makes them more aware of the consequences of their trust decisions.
Our current study aimed to investigate the framing effect in the context of a give vs. take frame on trust and reciprocity behavior. We used TG to establish the give frame and DTG for the take frame. TG and DTG differ only in the starting point. They indicate equivalent content. First, they share the same payoff structure. Second, both games involve a two-stage strategic sequential decision to trust and then reciprocate. Third, the amount of distrust can be translated into the amount of trust to allow for a direct comparison.
Our study extended previous research in the following three ways. First, we expanded the single to an iterated one-shot game design by asking participants to interact once with multiple partners (i.e., strangers as identified in pictures) to obtain a stable decision pattern. Second, we implemented a computer-mediated human partner condition as a within-subjects factor to explore the boundary condition of the framing effects. Particularly, the participants would directly interact with specific strangers whose faces were present and whose responses were made during the experiment (i.e., mimicking real-life face-to-face interactions), or indirectly interact with non-specific strangers whose personal information was unknown and whose responses were randomly drawn from a data pool (i.e., representing an ambiguous and uncertain interaction context). Finally, we installed a within-subjects design, asking participants to play both roles, first as trustors and then as trustees, with a one-week interval between games, to investigate the relationship between trust and reciprocity at the individual level.
A rational trustee only cares about their maximum self-interest and thus will return nothing to the trustor. A rational trustor will predict the trustee’s behavior, and thus give no money in the TG and take the maximum amount of money in the DTG. However, prior research showed evident positive trust and reciprocity. In a trust relationship, intention is crucial: people are not only concerned with the material payoffs but also the intentions of their partners. Both aspects may be sensitive to the change in reference points: the game framing may affect the allocation process as well as outcome perception. For framing trust behavior, we hypothesized lower trust in the give (TG) than in the take (DTG) frame because of better perspective taking in trustors, as they knew in advance that they would play both roles, providing them with a lower expectation of return in the take compared to the give frame. For framing reciprocity behavior, we predicted that trustees would reciprocate less in the take (DTG) than in the give (TG) frame at the same level of trust, because of the interpretation of the trustor’s intention, interpreting taking money away (distrust) more as an act of commission than giving less money (trust) as an act of omission.
2. Results
2.1. Self-Report Measures
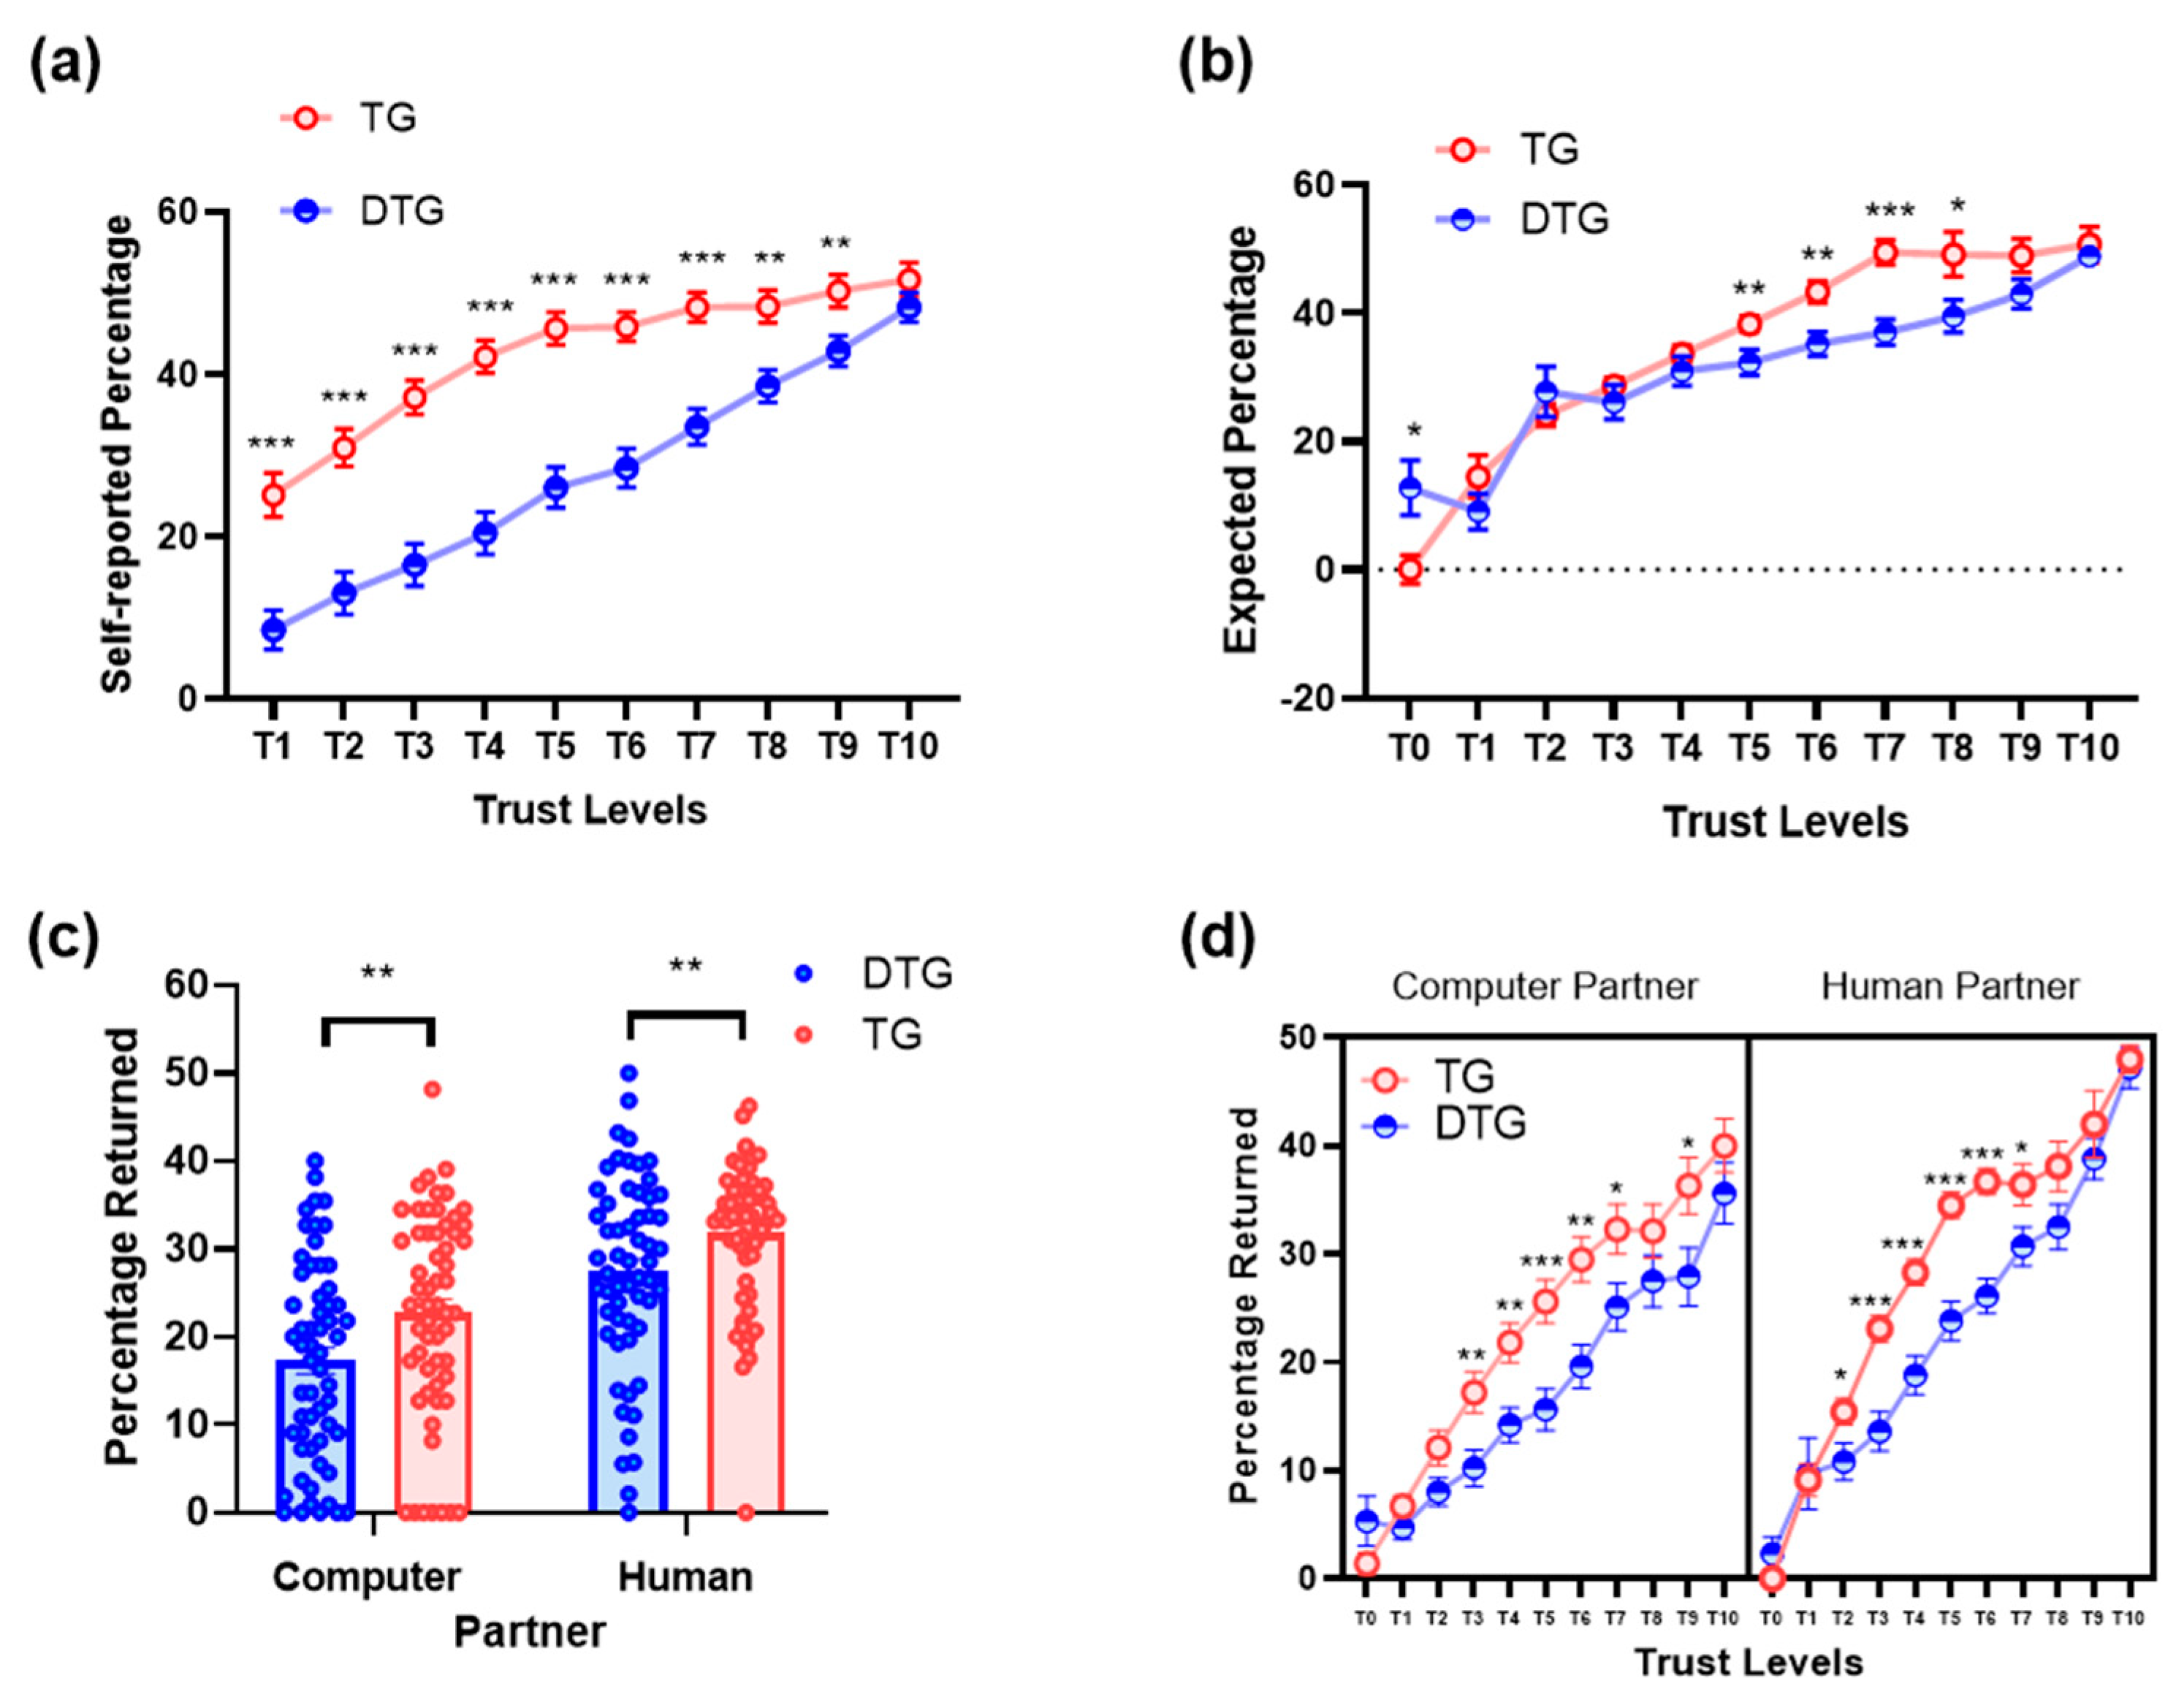
Table 1 shows the comparison between the TG and DTG groups in terms of self-reported measures. Independent-sample t-tests showed that the TG group scored higher than the DTG group in general distrust, positive reciprocity, and desire for intimacy. Self-reported trust was similar in the two groups, but self-reported reciprocity was higher in the TG than in the DTG (Figure 1a and Table 1).
2.2. Trust Measures
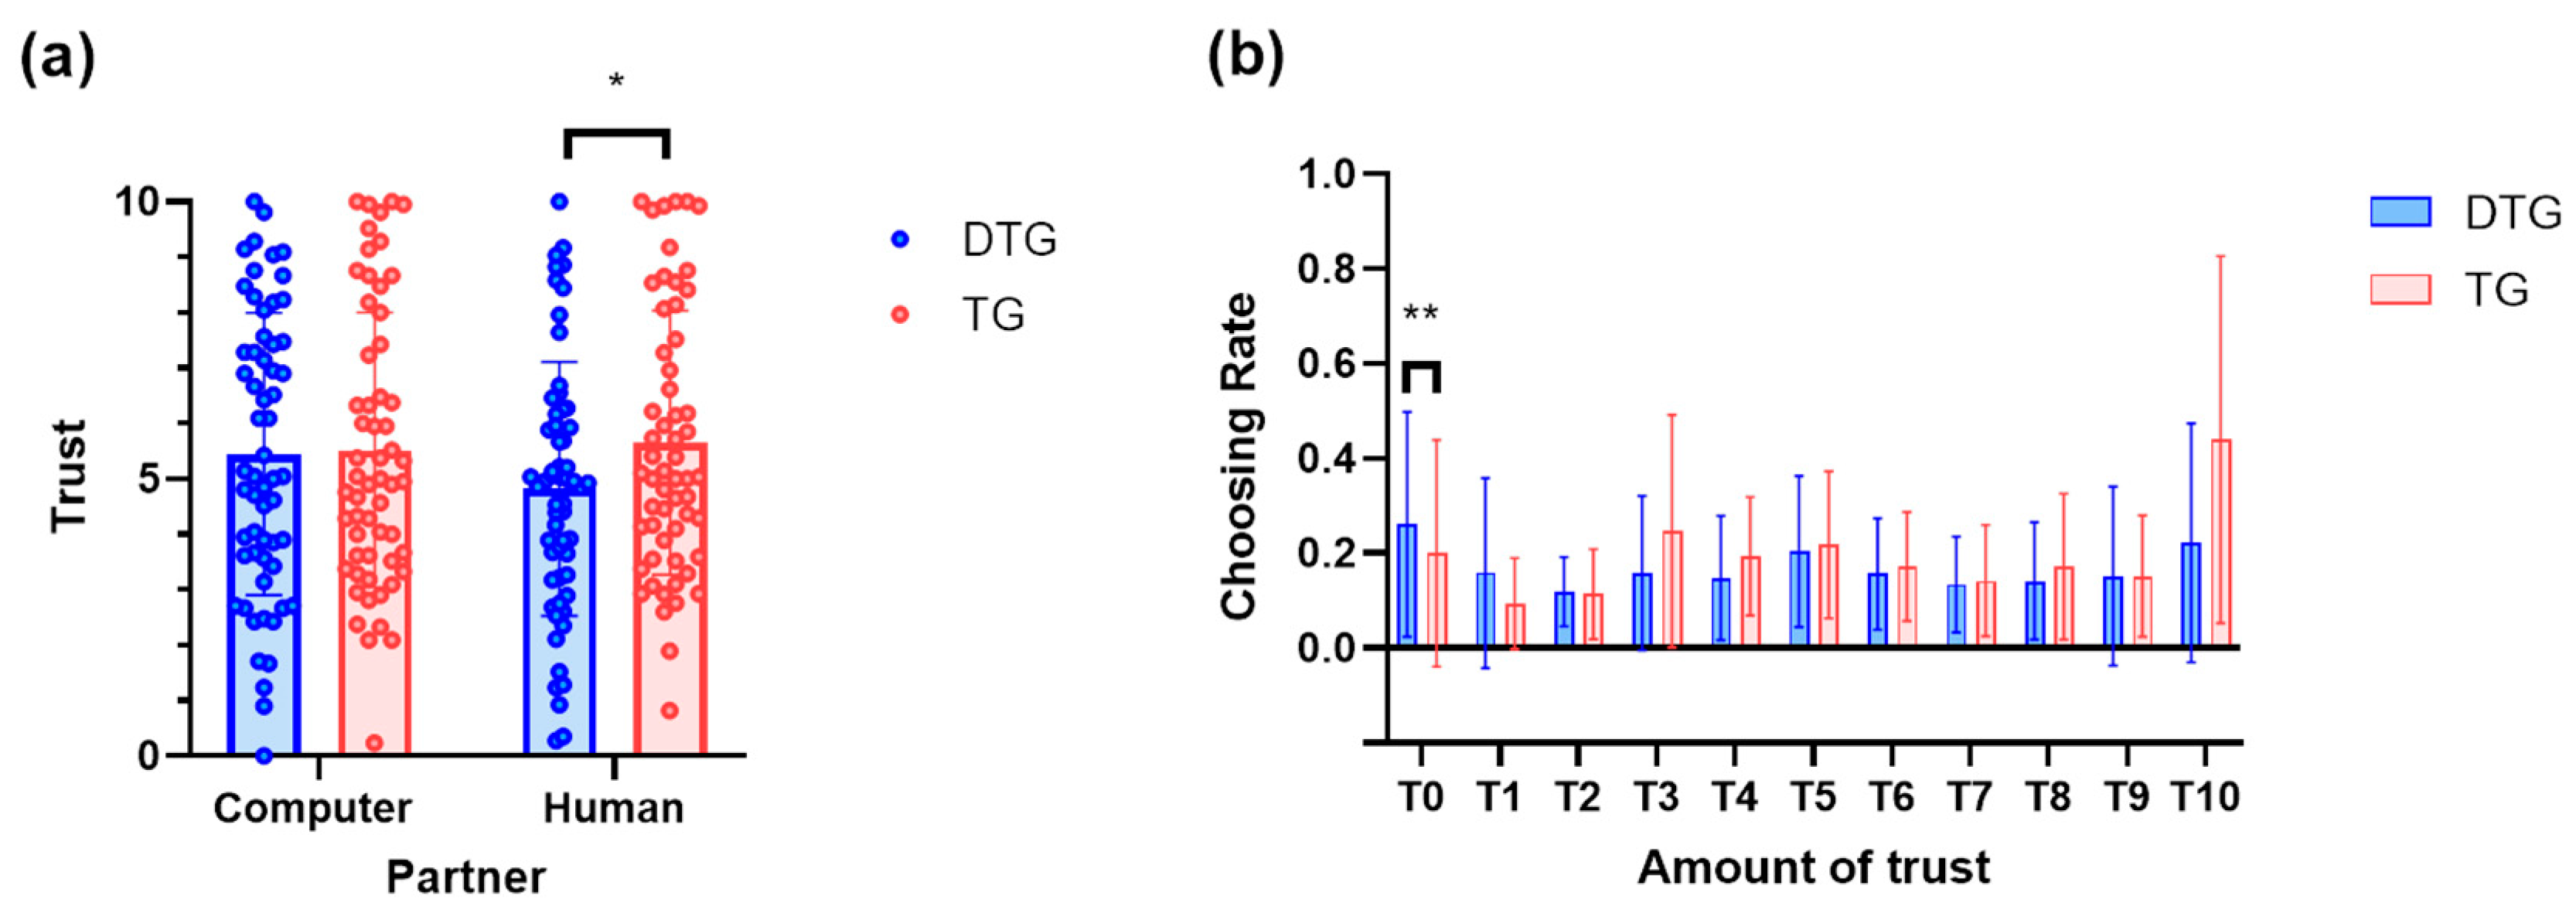
The repeated-measures ANCOVA on trust behavior yielded no significant main effects of Partner (F(1,111) = 0.469, p = 0.495, η2 p = 0.003) and Game (F(1,111) = 1.424, p = 0.235, η2 p = 0.013), but a significant Partner x Game interaction effect (F(1,111) = 8.625, p = 0.004, η2 p = 0.072) (Figure 2a and Table S1 in Supplementary Material). Further simple effect analyses on the trust for human partners revealed a significant main effect of Game (F(1,111) = 4.425, p = 0.038, η2 p = 0.038), with more trust in the TG compared to the DTG, whereas the trust for computer partners showed no main effect of Game (F(1,113) = 0.054, p = 0.816, η2 p = 0.000). Participants made more full trust decisions (i.e., give Ұ10) in the TG and full distrust decisions (i.e., take Ұ30) in the DTG for human partners (Figure 2b). No main effect of gender and interaction between Gender and Game was found.
The repeated-measures ANCOVA on response time yielded no main effects of Partner (F(1,111) = 0.390, p = 0.533, η2 p = 0.004) and Game (F(1,111) = 1.288, p = 0.259, η2 p = 0.011), or an interaction effect of Partner × Game (F(1,111) = 0.989, p = 0.322, η2 p = 0.009) (Table S2 in Supplementary Material).
To elucidate the effect of partner faces and the expected percentage of return, the hierarchical linear regression analysis on trust revealed a significant prediction effect of trustworthiness rating in the TG (β = 0.454, p < 0.001) and DTG (β = −0.145, p < 0.05), but a null effect of attractiveness rating (Table S3 in Supplementary Material).
2.3. Expectation Measures
The hierarchical linear regression analysis on the expected percentage of return revealed a significant prediction effect of Game (β = 0.043, p < 0.001) (Table 2). Further independent-sample t-tests revealed a higher expectation of trustors in the TG compared to the DTG upon middle to high trust levels (Figure 1b and Table S4).
2.4. Reciprocity Measures
The repeated-measures ANCOVA on reciprocity behavior (return rate) yielded a significant main effect of Game (F(1,106) = 10.624, p = 0.002, η2 p = 0.091), with more reciprocity in the TG than in the DTG (Table S5). There was no main effect of Partner (F(1,106) = 0.168, p = 0.682, η2 p = 0.002) or an interaction effect of Partner × Game (F(1,106) = 0.419, p = 0.519, η2 p = 0.004). No main effect of Gender and the interaction between Gender and Game was found.
The repeated-measures ANCOVA on response time yielded a significant main effect of Game (F(1,106) = 8.012, p = 0.006, η2 p = 0.070), with a longer response time in the TG (8574 ms) than in the DTG (6471 ms). There was no main effect of Partner (F(1,106) = 3.105, p = 0.081, η2 p = 0.028) or an interaction effect of the Partner × Game interaction (F(1,106) = 0.787, p = 0.377, η2 p = 0.007) (Table S6).
To elucidate the effects of Game and Trust Level, the hierarchical linear regression analysis on percentage returned revealed a significant prediction effect of Game (β = 0.136, p < 0.001) (Table 3).
2.5. Association between Trust and Reciprocity
The correlation between trust and reciprocity was not significant in the give (r = −0.091, p = 0.502) and take (r = 0.077, p = 0.569) frame. The correlation index showed no differences in Game, F(1,106) = 1.565, p = 0.214, η2 p = 0.015, and Gender, F(1,106) = 1.151, p = 0.286, η2 p = 0.011.
2.6. Earnings
Trustors earned more money in the give (M ± SD = Ұ13.83 ± 2.34) than take (M ± SD = Ұ12.80 ± 2.58) frame, F(1,110) = 5.430, p = 0.022, η2 p = 0.047, with no difference in Gender. Trustees earned more money in the take (M ± SD = Ұ19.46 ± 3.10) than give (M ± SD = Ұ16.79 ± 1.96) frame, F(1,110) = 31.308, p < 0.001, η2 p = 0.244, with no difference in Gender.
2.7. Rating Measures
The ANOVAs revealed no main effect of Game in trustworthiness (F(1,113) = 0.089, p = 0.765) and attractiveness (F(1,113) = 0.023, p = 0.880) in the ratings of faces, and no main effect of Gender or interaction.
3. Discussion
The goal of our study was to investigate the framing effects (give vs. take) on trust and reciprocity behavior with iterated one-shot games (TG, DTG). Participants directly interacted with strangers whose personal information regarding faces was present, compared to indirect interactions with unknown strangers whose identities were ambiguous, first in the role of trustor and then trustee. We changed the default in a trust interaction applying two exchange games: whereas no trust was the default in the give frame (TG), full trust was the default in the take frame (DTG). Overall, we revealed that participants were more trusting and reciprocating in the give than in the take frame. While the framing effect was only present in the specific one-to-one social interaction condition for trust behavior, framing effects were identified in both specific and non-specific social interaction conditions for reciprocity behavior.
3.1. More Trusting in the Give Than in the Take Frame for Human Partners
In accordance with our hypothesis for framing trust behavior, participants demonstrated higher trust in the give than take frame but only when interacting with a human and not a computer-mediated partner, suggesting that the framing effect on trust is limited to the one-to-one social interaction condition. The default in the two frames may change the trustors’ decision mode. In the TG (give frame), the decision to trust indicates a commission of a socially desired behavior (and not trusting corresponds to an act of omission). Trustors are motivated to show their benevolence by sending a positive amount of money. Meanwhile, in the DTG (take frame), the act of commission means to take money from partners (and full trust corresponds to an act of omission). According to prior research using a non-social task, participants preferred to engage in commission (i.e., expressing their responses by selecting a specific button) more than omission (i.e., checking whether a specific button was already selected) tasks and expected the commission to be more positive [32]. Due to the commission bias (i.e., the preference to engage in commission), participants may tend to give the trustee some money in the give frame and take away some money from the trustee in the take frame. For example, if a trustor chose to give Ұ7 in the give frame, and another trustor chose to take Ұ7 in the take frame, then the trust level would be higher in the give (i.e., trust Ұ7) than in the take frame (i.e., trust Ұ3). This tendency may result in a higher trust level in the give than in the take frame. However, commission bias cannot explain the present findings that the higher trust in the give frame (versus take frame) was isolated to the one-to-one social interaction condition.
Previous studies suggested that trust decisions rely heavily on participants’ subjective [33] and objective expectations of reciprocity [34]. The results of our expectation task, which required participants to estimate the percentage of return of each partner upon their trust decisions, indicated that participants had a higher expectation of return under the give frame than under the take frame, even after controlling for the level of trust, suggesting that they had more positive reciprocity expectations in the give frame. Trustors may understand the behavioral effects of a change in reference points on trustees’ reciprocity. In the take frame, the amount taken by the trustors is a loss to the trustee. Therefore, loss aversion may lead to less return for any given level of trust in the take than in the give frame. Trustors in the take frame expected less return than those in the give frame and they adjusted their trust behavior accordingly. The default in the two frames changed participants’ expectations of reciprocity.
Our finding that participants trusted more in the give frame compared to the take frame is consistent with the result reported by Reimann et al. (2017). In their study, both monozygotic female twins and dizygotic twins trusted more in the give than the take frame. However, this finding is contrary to the previous study conducted by Bohnet and Meier (2005), which found that participants trusted more in the take than in the give frame. These rather contradictory results may be due to the different game designs applied in our work compared to the previous studies. While both prior studies used a between-subjects design and obtained opposite framing results for trust behavior, our change from a between-subjects to a within-subjects design may not be the main cause of the differences in results. The prior research used a single one-shot game and between-subjects design, and we used an iterated one-shot and within-subjects (i.e., participants played both roles) design. Participants in a single one-shot design may prefer the extreme choices and the default option. For example, in Bohnet and Meier’s (2005) study, around 50% of participants chose to trust 0 (the default) and 18% chose to trust all in the give frame, while 35% chose to trust 0 and 40% chose to trust all (the default) in the take frame. The default bias may lead to higher trust in the take than the give frame in this study. On the contrary, we found a flat W-shaped pattern, with the choices of 11 possible options distributed almost evenly. With the iterated one-shot design, the trustors had the opportunity to think and adjust their choices to obtain the maximum benefits, whereas the singe one-shot design left no room for adaptive strategies.
The finding that the face trustworthiness could predict the amount of trust at the trial-by-trial level under both give and take frames confirmed that trustors adjusted their decisions for different partners. However, Reimann et al. (2017), using a single one-shot game with only female participants, also found higher trust in the give than the take frame, which suggests that the single or iterated trial design may not be the main cause of the controversies in the two studies. Instead, the main differences may lie in the performance of perspective taking. Whereas participants in Bohnet and Meier’s (2005) study reported the same average expected reciprocity in both frames, and higher expectations for higher levels of trust and lower expectations for lower levels of trust in the take than the give frame, participants in our study reported higher expectations of return for all levels of trust in the give than the take frame. The pattern of the expectation coincides with the actual reciprocity behavior of trustees. The higher trust in the give than the take frame may mainly be due to the accurate perspective taking in the current design. The accurate perspective taking might be due to the multi-round game design, where participants could better understand the game rules and vary their expectations for each partner when exposed to different faces. Another possibility is that participants had completed the scenario version of the TG and DTG in Session 1 (in which participants played both roles), which helped them to better perceive the game rules and the decision context, being able to perceive the trustees’ perspectives accurately. The null framing effect in the condition of interaction with computer-mediated ambiguous partners may also be due to the inability to form an expectation of return for the unknown trustees in both give and take frames.
Trustworthiness and attractiveness ratings of faces showed no difference between both frames; therefore, the differences in trust may not be attributed to the faces’ differences in trustworthiness and attractiveness. Moreover, there were no gender differences in trust and reciprocity, pointing to the null contribution of gender in the contradictory nature of the results between studies. Furthermore, no differences in response times between frames were identified either, indicating a similar decision difficulty in both frames.
In summary, the higher trust in the give than the take frame in one-to-one social interaction may be due to the accurate expectation of less reciprocity in the take frame.
3.2. More Reciprocating in the Give Than in the Take Frame
In accordance with our hypothesis for framing reciprocity behavior, we found that trustees’ average reciprocity across trust levels was higher in the give compared to the take frame. Overall, reciprocity increased with the level of trust, independently of frame: the more benign the trustees perceived the trustors’ intentions of an action to be, the more they rewarded trust. Reciprocity was also higher in the give than in the take frame when interacting with computer-mediated unknown partners, consistent with previous findings that reciprocity is a stronger social norm than trust in that it triggers feelings of indebtedness irrespective of the person who executed the favor [35]. The framing effect on reciprocity may be due to omission bias and loss aversion.
The change in the reference point may affect how trustees perceive a given level of trust. Omission of trust in the give frame is perceived as more benign than the commission of distrust in the take frame [10]. The finding also accords with earlier observations, which showed that trustees indicated experiencing a stronger negative evaluation toward distrust in the active (commission) condition than in the inactive (omission) condition [36]. Trustees tend to punish trustors more severely for committing distrust than for omitting trust. Moreover, the finding that participants made decisions faster in the take than in the give frame may suggest an easier solution to the conflict between the maximization of self-interest and the obedience of the reciprocate norm in the take frame. The trustee may be less impacted by the reciprocity norm when the trustor’s trust is an act of omission, and they may not feel obligated to reciprocate in the take frame.
It is also possible that some of the differences in reciprocity between the give and the take frame are due to trustees’ loss aversion. In the take frame, the endowment is owned by the trustee. Any amount taken by the trustor is a loss for the trustee. Any amount returned to the trustor is also a loss for the trustee (e.g., taking money away from his own pocket). Meanwhile, in the give frame, the amount of money returned to the trustor is taken away from the pool that benefits from the investment of the trustor. In other words, the trustor contributes a lot to the resources to be allocated. Therefore, trustees in the give frame are more motivated to reward the trustor’s investment.
Our results showed, on the individual level, that trust and reciprocity were not correlated. This result is inconsistent with previous studies that found a positive or weak correlation [37,38] between these two behaviors, but consistent with previous studies indicating distinctiveness between trust and reciprocity. For example, previous studies suggest that trust is not a simple reflection of trustworthiness [39], and motives such as egalitarianism impact trustworthiness but not trust [40]. Research also evidences that trustworthiness but not trusting behavior is a social norm [41]. These findings suggest that trust and reciprocity are independent constructs. A trustworthy person may be not also trusting. Our study confirms that the distinction between trust and reciprocity holds in the give and take frames.
In summary, the higher reciprocity in the give than the take frame in interaction with both specific and non-specific strangers may be due to the loss aversion of the trustees in the take frame or the omission bias whereby people punish the commission of distrust more heavily than the omission of trust.
3.3. Limitations, Future Directions, and Strengths
It is important to acknowledge the following limitations for our study. First, we changed to a within-subjects (from a between-subjects) design and iterated a one-shot (from a non-iterated one-shot) game at the same time. Each of these changes may impact the results. However, since previous research using both a single one-shot and single role design [10,12] also found opposite framing effects in trust behavior, these two changes may only account for minimal variance in the framing effects. Replication research systematically varying the changes is needed to clarify the impact of variations in game design.
Second, we used computer-mediated human partners as a control to test whether the framing effects were isolated to the one-to-one social interaction condition. We used the computer-mediated human condition rather than a simple computer partner condition (i.e., controlled by an algorithm) because it is meaningless for a computer to be rewarded with money. Moreover, computers may not be taken as a non-social condition either. Evidence confirms that people may mindlessly take computers as social actors in which they apply social rules, norms, and expectations that are integral to interpersonal relationships when they interact with computers [42]. Future studies with the elaborated manipulation of controls are needed to confirm the framing effects in trust and reciprocity behavior. These controls could be computer-mediated specific partner conditions (e.g., a computer acts as an agent of a human partner) or random mechanisms (e.g., the human partner can make the decision voluntarily or involuntarily).
Finally, as our reciprocity measure in both frames, we chose the percentage instead of the amount of return. The measurement of percentages has been used in previous trust studies [43] and ensured an equivalent measure in the give and take frames. However, it may involve calculations. The display of the full scale of percentages from 0% to 100% may be redundant in that participants seldom chose a percentage over 60% (1.5%). Future research could use a bounded option, with each indicating a different strategy of reciprocity, such as a selfish strategy (e.g., return none), reciprocate strategy (e.g., return equivalent to or slightly more than invested), and fairness strategy (e.g., return half).
Despite these limitations, the present study has several strengths. It is the first study to examine the framing effects in iterated one-shot interactions. This design could obtain a stable decision pattern and can be used for further brain imaging studies in which repeated trials are usually required to obtain brain data with a better signal-to-noise ratio. Our study explored the boundary conditions of framing effects in trust and reciprocity. We asked participants to interact with other participants whose faces were shown. This set-up mimics to the face-to-face interaction with strangers in social situations. Participants also interacted with unknown partners mediated by a computer. Comparison between partners helped to reveal whether the framing effects were more pronounced in the one-to-one social interaction. Finally, we asked participants to play both roles, which allowed for the investigation of the relationship between trust and reciprocity in the give and take frames.
4. Materials and Methods
4.1. Participants
We recruited 120 participants in Session 1, who were allocated to one of two groups: a TG group (n = 60, 30 females) completing the TG under a give frame and a DTG group (n = 60, 30 females) completing the DTG under a take frame. Six male participants dropped out so that 117 (TG: n = 58, 30 females; DTG: n = 59, 30 females) completed Session 2 and 114 (TG: n = 57, 30 females; DTG: n = 57, 30 females) completed Session 3. The two groups did not differ in age (TG: 20.52 ± 2.09 (M ± SD), DTG: 20.44 ± 1.89; t(115) = 0.21, p = 0.836) or gender distribution (M/F: TG = 28/30, DTG = 29/30; χ2 = 0.01, p = 0.925). Participants provided written informed consent before the experiment and received a debriefing and performance-contingent payout upon completion of the study. They received a fixed payment (Ұ45, ≈$6.69) and a bonus (minimum = Ұ10, maximum = Ұ40) determined by the outcome of one randomly chosen trial upon the completion of the third experimental session (see procedure). The total average earning for each participant was Ұ65 (≈$9.13). The study was conducted in accordance with the Declaration of Helsinki and approved by the Ethics Committee of the local university (project identification code 2022005) (preregistration number: https://doi.org/10.17605/OSF.IO/P6U83, accessed on 11 November 2022). No deception was used in this study.
4.2. Experimental Tasks
This study involved two economic two-player reciprocal exchange games (TG and DTG), with one player designated to the role of a trustor and the other of a trustee, making sequential decisions in two stages. Importantly, the TG and the DTG differed only in the starting point, with no trust as the default decision in the TG and full trust as the default decision in the DTG, but not in their payoff space. Throughout the study, roles were labeled using neutral terms of Player 1 and Player 2 to indicate trustor and trustee, respectively.
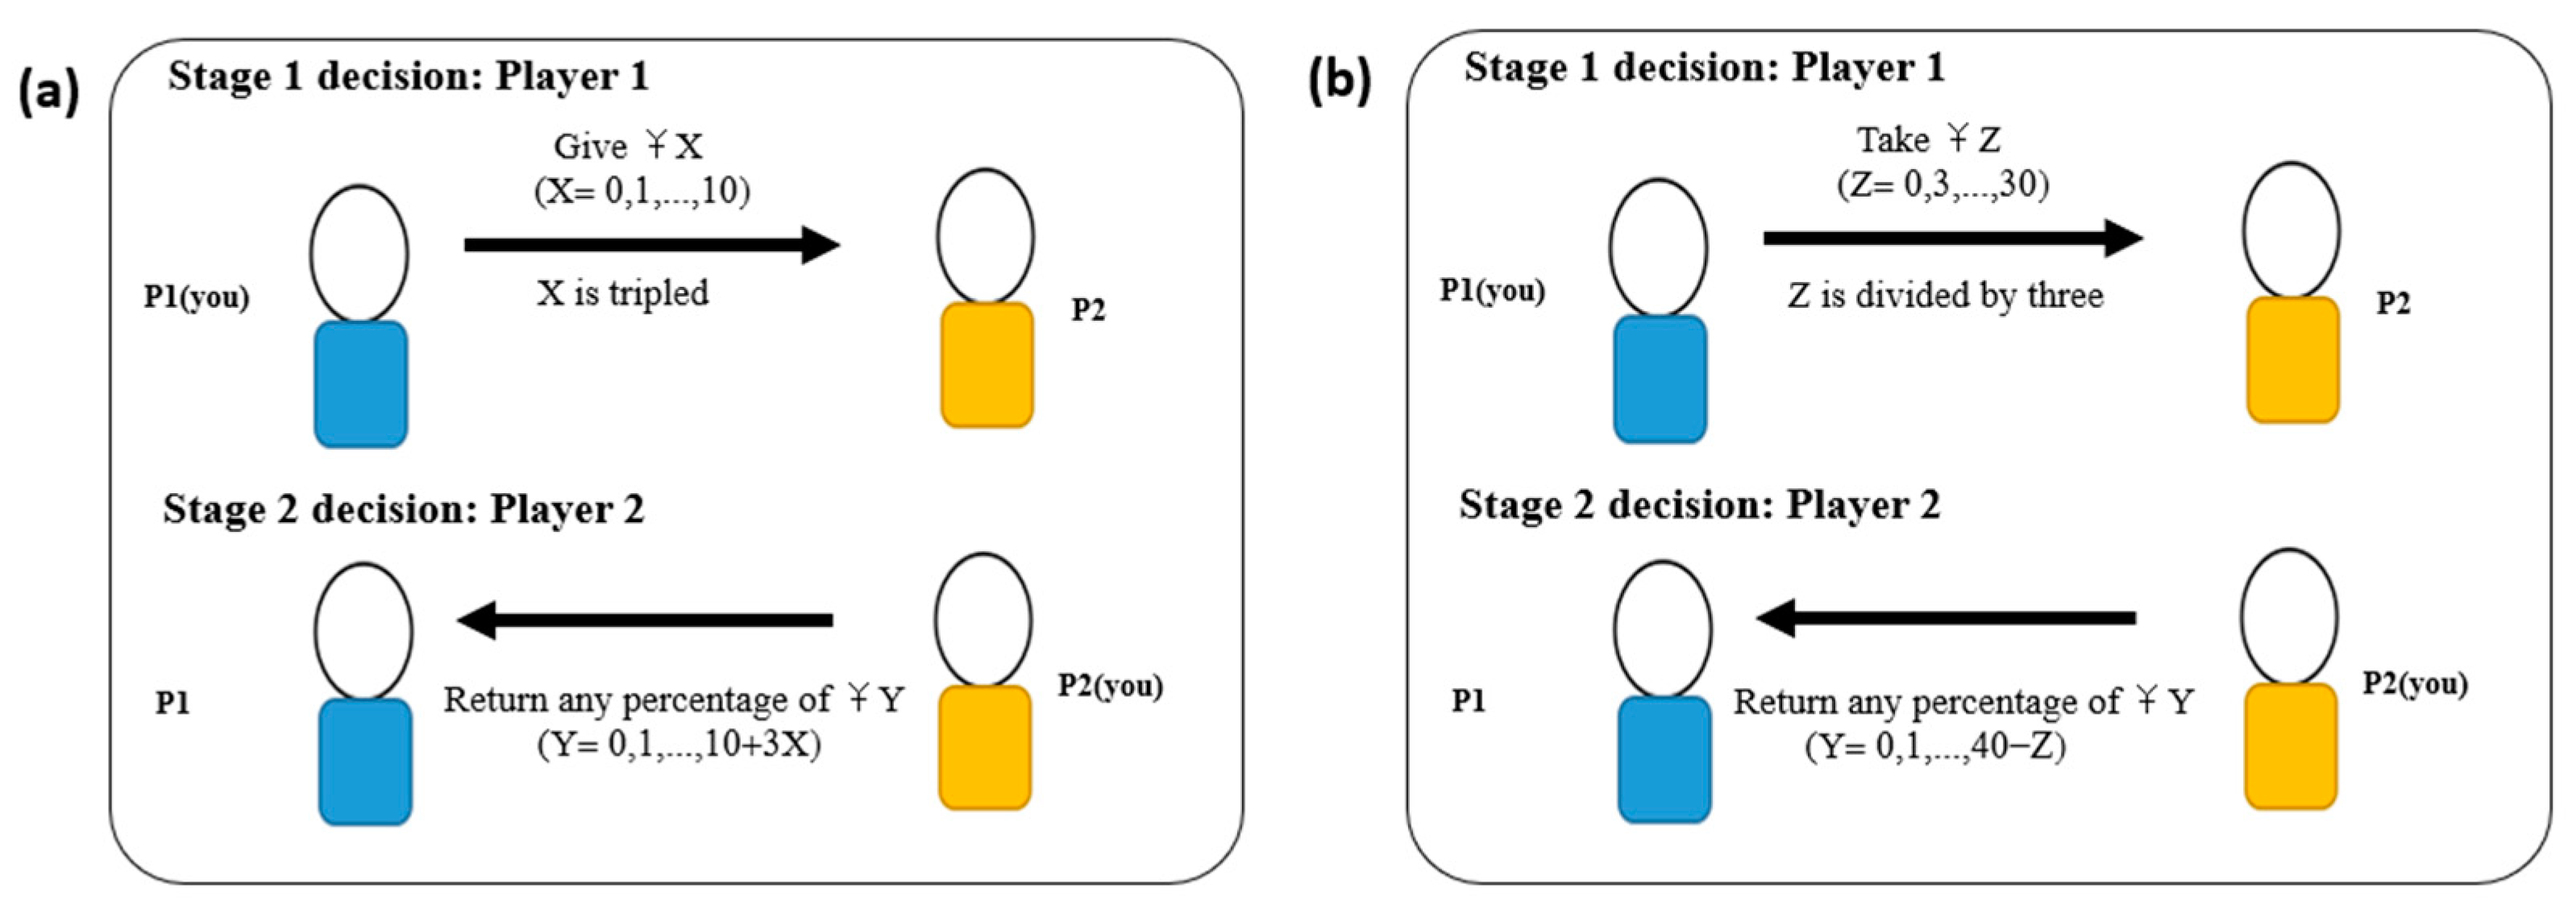
In the TG, both trustors and trustees received an initial amount of Ұ10. In the first stage, trustors decided to give any portion of their endowment to trustees (i.e., ҰX (X ∈ 0, 1, …, 10)) and the given amount was tripled by the experimenter (Figure 3a). For example, if a trustor gave Ұ5, the amount was tripled, and the trustee received Ұ15, plus the original endowment of Ұ10; the trustee then had Ұ25. In the second stage, trustees decided which percentage (i.e., 0–100% in 10% increments of ҰY (Y∈10, 13, …, 10 + 3X)) to return to trustors. For example, if a trustee had Ұ25, and he decided to return 40%, then the trustor received Ұ10 and left Ұ15 for the trustee, resulting in earnings of Ұ15 for both players. The amount given by trustors in the first stage measured trust (i.e., X), and the percentage returned by trustees in the second stage measured reciprocity (e.g., 10%).
In the DTG, trustors initially received Ұ0, while trustees received Ұ40. In the first stage, trustors decided to take ҰZ from trustees (Z∈ 0, 3, …, 30) (Figure 3b). Z was divided by three by the experimenter. The actual money received by trustors was Z/3. For example, if a trustor decided to take Ұ15, her payoff after stage 1 was Z/3 = Ұ5, and the trustee’s payoff Ұ40-Z =Ұ25. In the second stage, the trustee decided which percentage (i.e., 0–100% in 10% increments of ҰY (Y∈10, 13, …, 40-Z)) to return to the trustors. For example, if a trustee decided to return 40% of the remaining amount of Ұ25, then the trustor received Ұ10, resulting in earnings of Ұ15 for both players. The amount not taken by trustors in the first stage measured trust (i.e., X = 10-Z/3), and the percentage returned by trustees in the second stage measured reciprocity (e.g., 10%).
4.3. Procedure
This study was organized so that each participant completed three experimental sessions on three different days, with an interval of approximately one week between every two sessions. All tasks were computerized using Presentation (Version 0.71 Build 09.24.03, Neurobehavioral Systems 2003) for stimulus presentation and behavior recording (i.e., decision and response time).
Session 1. In the first experimental session, participants were randomly assigned to one group (DTG or TG). After providing written consent, they completed first an online battery (through the platform of Wenjuanxing, Ranxing IT Company) of the following self-report questionnaires: Inclusive General Trust Scale (IGTS, 9 items, with subscales of trust belief and trust preference) [44]; Distrust Scale (DTS, 8 items) [45]; NEO PI-R trust dimension (8 items) [46]; Dimensionality of trust measures in the World Values Survey [47] (e.g., “Generally speaking, would you say that most people can be trusted, or that you can’t be too careful in dealing with people?”); Interpersonal Trust Scenario Questionnaire (ITSQ, 8 items, measuring interpersonal trust based on typical everyday trust situations, such as the willingness to lend an expensive camera to a friend) [48]; Positive Reciprocity and Negative Reciprocity Scale (PRNR, 6 items, measuring the intention of rewarding (punishing) those who have been kind (mean) to us) [49]; Personal Norm of Reciprocity (PNR) Scale (27 items, with subscales of belief in reciprocity, positive reciprocity, and negative reciprocity) [50]; Pay-It-Forward (PIF) Scale (9 items, measuring the tendency for indirect reciprocity) [51]; Interpersonal Reactivity Index (IRI) (28 items, with subscales of perspective taking, fantasy, empathic concern, and personal distress) [52]; Relationship Scales Questionnaire (RSQ) (30 items, with subscales of independence, dependence, lack of trust, anxiety, desire for intimacy, and avoidance) [53]; Social Value Orientation (SVO) (6 items, measuring distributional preference) [54]; General Zero-Sum Beliefs Scale (ZSB) (7 items, measuring zero-sum beliefs) [55], and Self-Importance of Moral Identity Measure (MI) (10 items, measuring the internalization and symbolization of moral identity) [56].
Next, participants completed a scenario version of the economic exchange games depending on their assigned groups (TG or DTG). They were told that their decisions in this part would form a dataset to be used in the second and third sessions. Participants first read the instructions for the TG or DTG and completed a comprehension check to ensure that they understood the rules of the game. Then, in the first stage, they were asked to decide how much they would like to give (out of Ұ10) to the trustee in the TG or take away (out of Ұ40; the maximum amount would be Ұ30, in increments of Ұ3) from the trustee in the DTG.
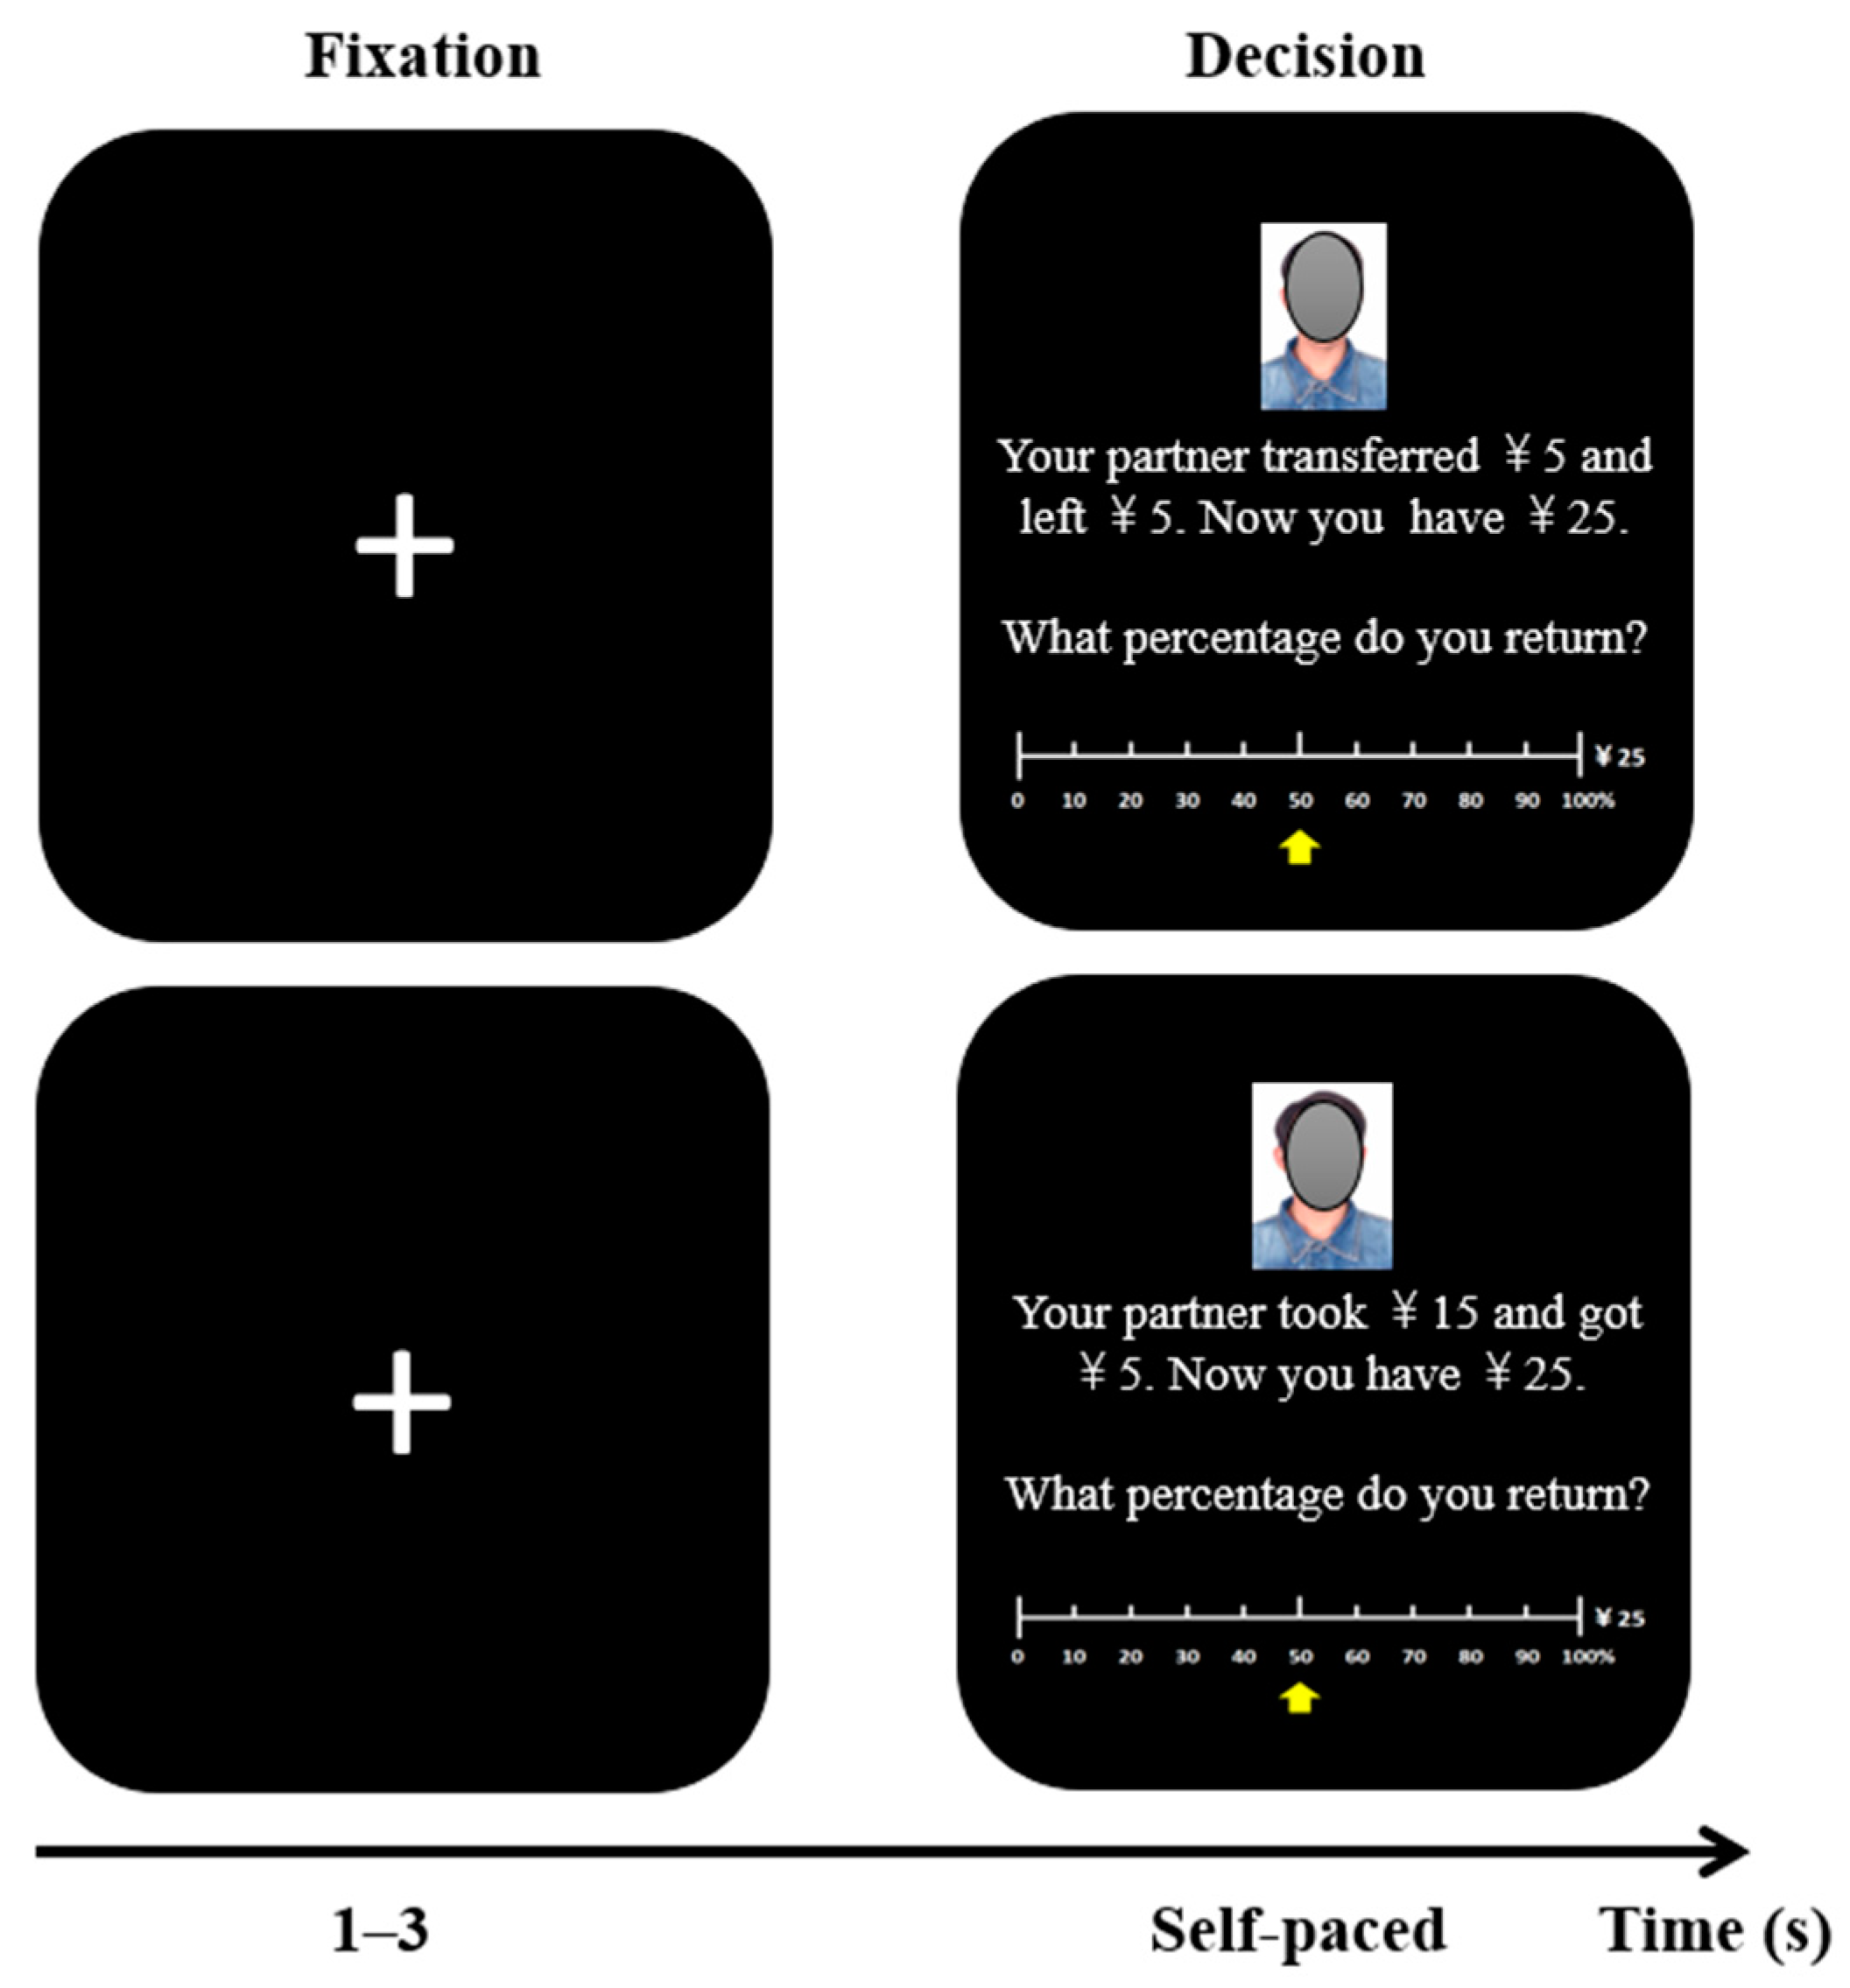
In the second stage, they were asked to report which percentage of their payoffs after stage 1 they wanted to return to trustors. The strategy method was used to collect information on all possible amounts that trustees could have received in stage 1. Specifically, the participants reported the percentage of return upon eleven levels of the given amount, from Ұ0 to Ұ10. One example question was “As Player 2, your partner gave you Ұ5 and left Ұ5 for herself. Now you have Ұ25. What percentage do you return?” For DTG, the question was “Your partner took Ұ15 and got Ұ5. Now you have Ұ25. What percentage do you return?” Each question had eleven options, with the percentage varying from 0% to 100% in 10% increments. The amount sent over (TG) or not taken (DTG) provided a measure of self-reported trust, and the percentage returned provided a measure of self-reported reciprocity.
At the end of Session 1, photos of participants’ faces were taken with neutral expressions and glasses off, which would be used as images in the experimental tasks in the second and third sessions to inform the interactive players who their partner was in each trial of the exchange game.
Session 2. The participants returned to the lab and completed four experimental tasks in the following order: (i) TG or DTG (with participants acting as trustors), (ii) expectation task, (iii) attractive rating task, and (iv) trustworthiness rating task. The order of the last two tasks was counterbalanced among participants.
TG/ DTG tasks. First, participants played the role of trustors either in the TG or DTG depending on their assigned group. They first received specific instructions before each task and took a quiz, including game rules and the consequences of decisions. An iterated one-shot version of the game was employed—consisting of 50 consecutive TG (DTG) trials with individual partners. Among them, 29 partners were other recruited participants of the same gender (identified by their faces) and 21 were computer-mediated human partners (displayed by an android image). Due to the dropout of three male participants after Session 1, the trial number of the human partner condition for male participants was 27 in the TG group and 28 in the DTG group.
In both conditions, the participants decided to give (or take) any amount of money to (or from) their partners (stage 1 decision). For the human partner condition, the partner’s decision (i.e., reciprocity in stage 2) would be made in the third session, in which their trust decisions would be revealed to their partners. For the computer-mediated human partner condition, the partner’s decision in the second stage would be randomly drawn from the pooled data of the self-reported percentage of return in the scenario version collected in Session 1. For example, if one participant decided to give Ұ5 to the computer-mediated human partner, then the partner’s return decision would be randomly chosen from the pooled data of 30 self-reported return percentages upon the trust level of Ұ5.
Each trial started with a fixation (1 s) and then the display of the face of the trustee and the initial endowments of both players (3 s) (Figure 4). This was followed by a jitter time of waiting (1–3 s) and then by a decision screen, which required participants to chose the trust amount by moving the arrow along a scale with the left or right arrow key on the keyboard (max. 8 s). The scale showed a horizontal axis with eleven cross/tick marks, with each mark aligned with a number on the upper and lower side. The upper line labeled “P1− 0, 1, …, 10” (TG) or “P1+ 0, 1, …, 10” (DTG), indicating the amount given (TG) or received (DTG) by Player 1. The lower line was labeled “P2+ 0, 1, …,10” (TG) or “P2− 0, 1, …, 10” (DTG), indicating the amount received (TG) or lost (DTG) by Player 2. The original location of the arrow was varied under each mark with equal probabilities across trials. The participants pressed the enter key to lock their choices, with a response restriction of 8 s. The next trial started after a jittered interval (2–4 s).
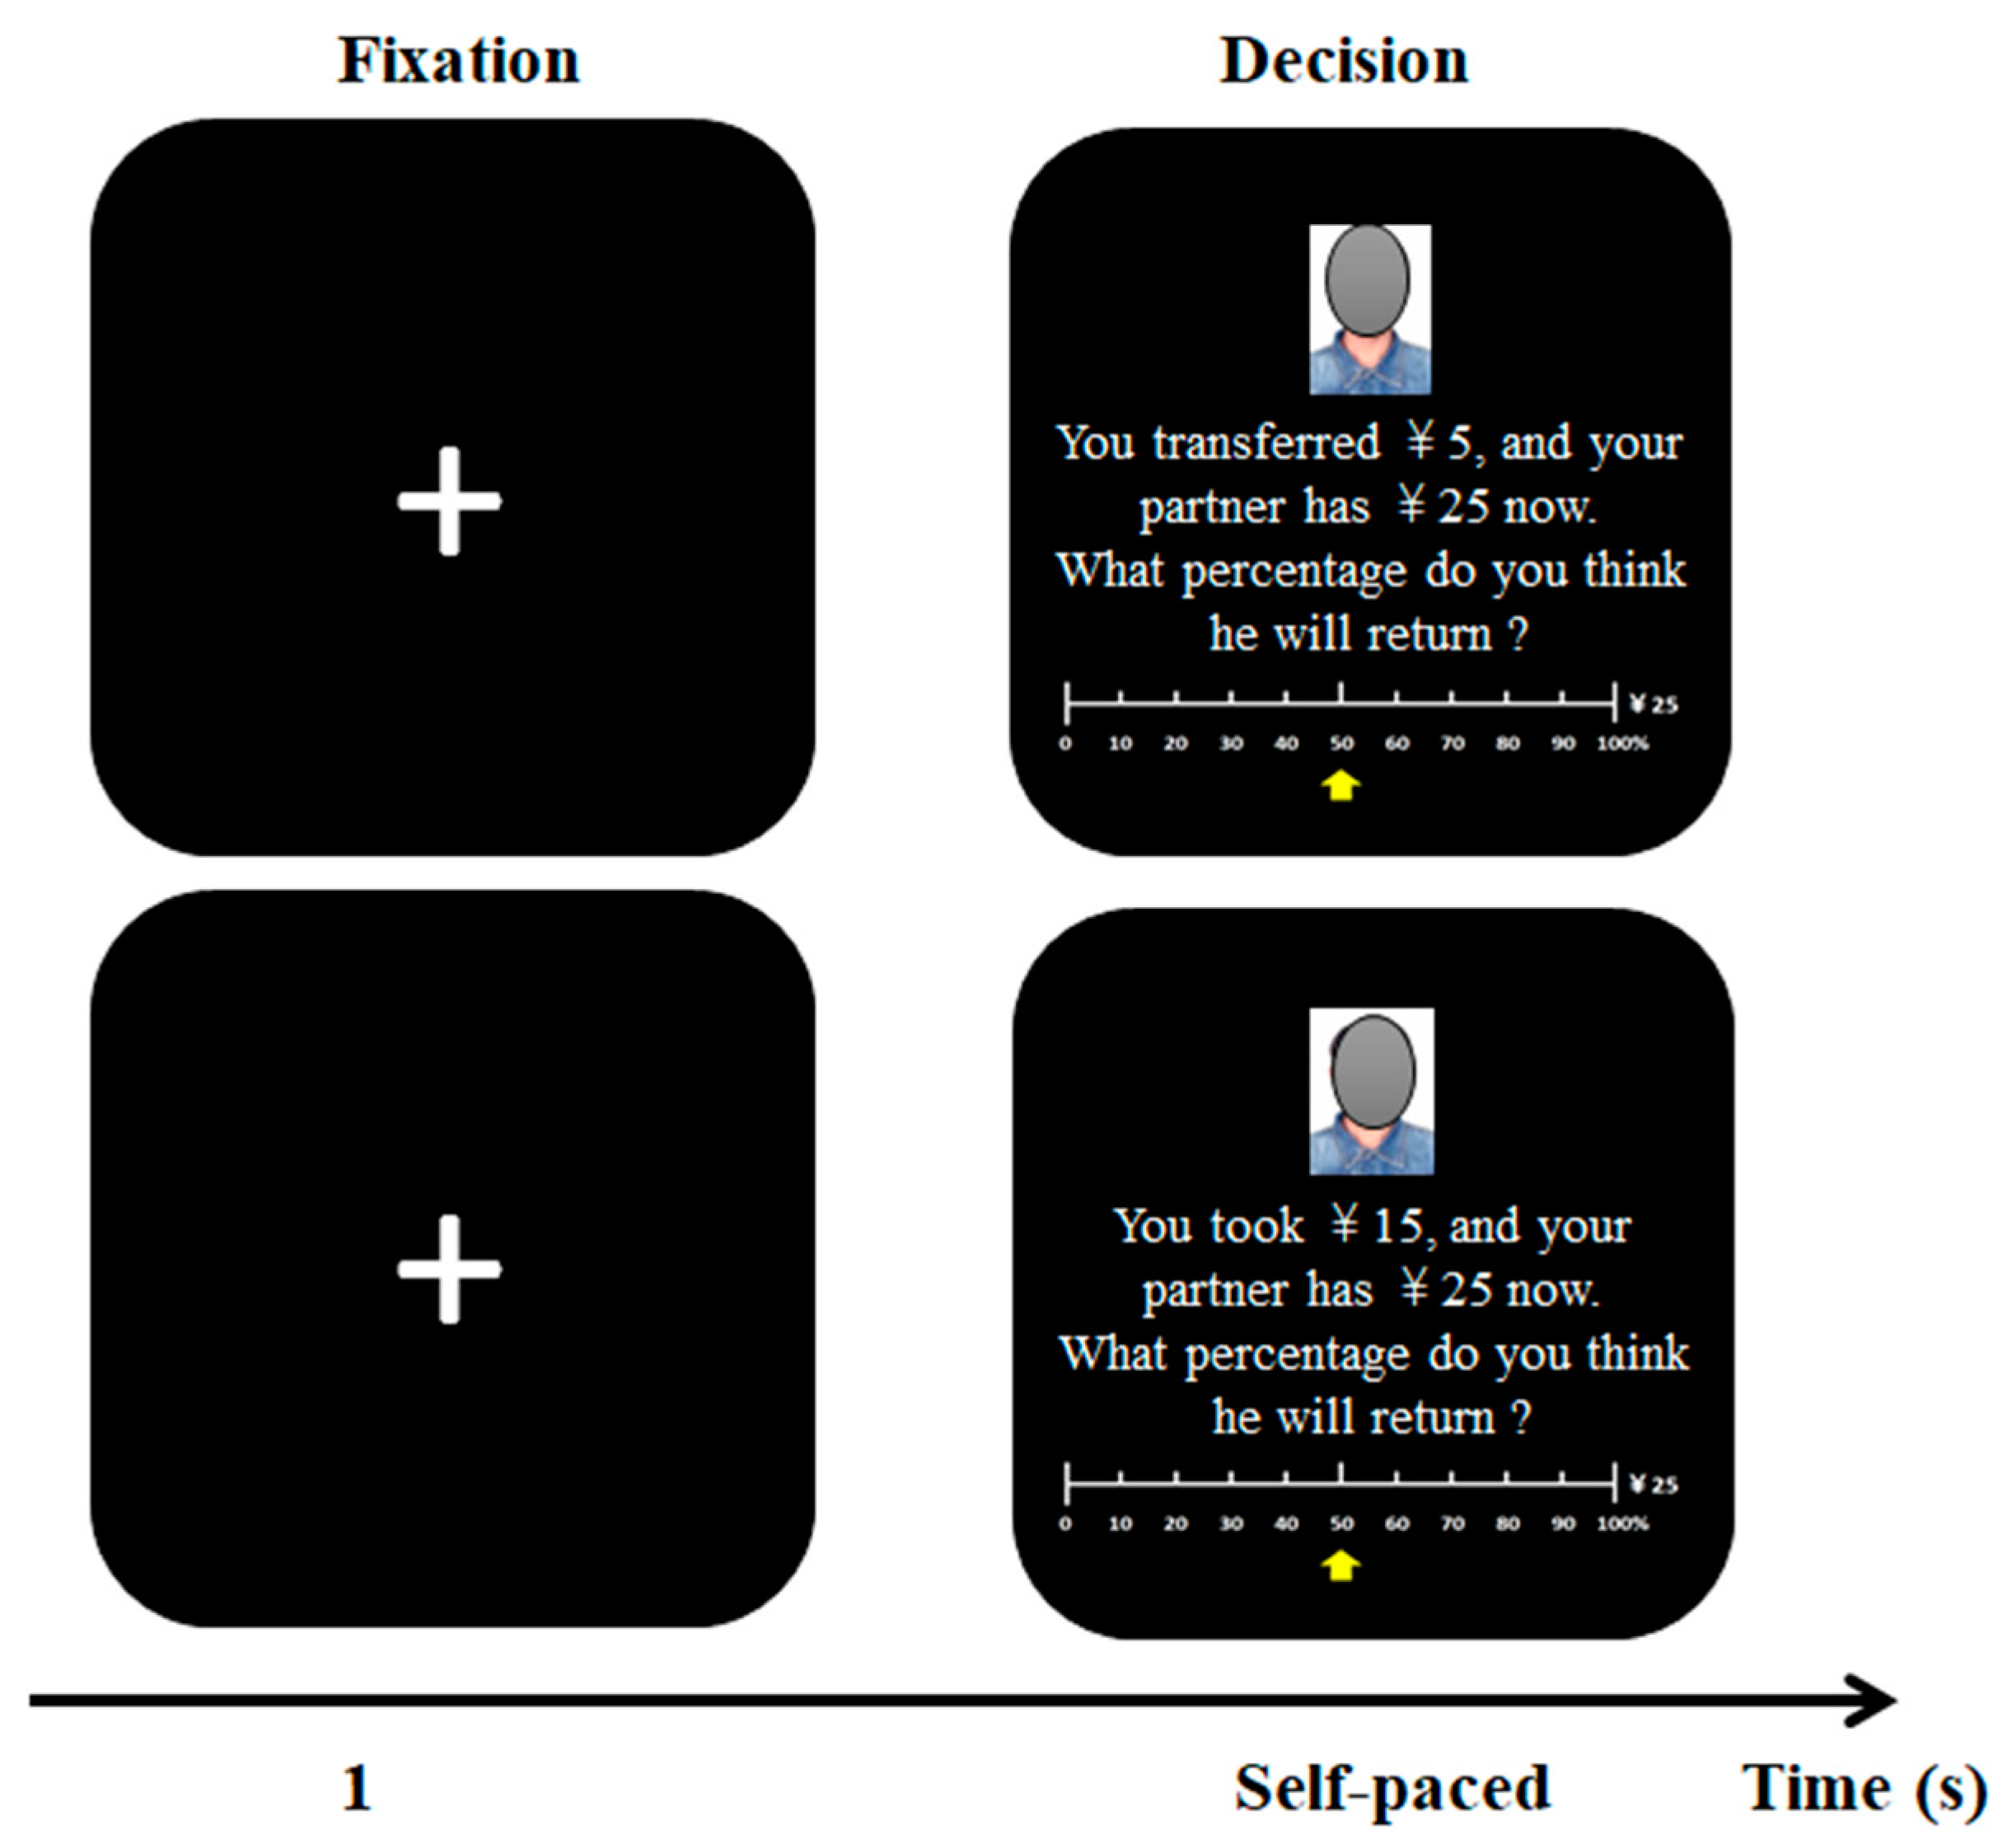
Expectation task. Next, participants completed the expectation task, in which they estimated the percentage of return of each partner based on their trust decision. The participants had to form expectations for each human partner. For each trial of the task, after fixation (1 s), participants saw the face of the partner, the amount they had given to (TG) or taken from (DTG) this partner in the previous game task, and the amount that the partner held after stage 1 (Figure 5). They were required to estimate which percentage (0–100% in 10% increments) the partner would return to the trustor by pressing the left or right arrow key along a scale at their own pace. The scale showed a horizontal axis with eleven cross/tick marks, which were labeled 0% to 100%. The amount that the partner held was highlighted on the right side of the scale. The original location of the arrow was varied under each mark with equal probabilities across trials. They pressed the enter key to lock their estimation.
Rating tasks. Next, participants rated the attractiveness (Figure 6a) and trustworthiness (Figure 6b) of each face on a 7-point Likert scale (1, not all; 7, completely) in a counterbalanced order. The original location of the arrow was varied under each mark with equal probabilities across trials.
Session 3. For the final session, participants returned to the lab and completed three experimental tasks: (i) TG or DTG (with participants playing the role of trustees), (ii) attractive rating task, and (iii) trustworthiness rating task. The order of the last two tasks was counterbalanced among participants.
In the first task, participants played the role of trustee either in the TG or DTG. They first received instructions, including examples to illustrate the games, and then completed the quiz to ensure that they correctly understood the decision situation. An iterated one-shot version of the game was used, which consisted of 40 consecutive TG/DTG trials with different partners. Among them, 29 partners were other recruited participants of the same gender (identified by their faces) and 11 were computer-mediated human partners (displayed by an android image). Again, the trial number of the human partner condition for male participants was 27 in the TG group and 28 in the DTG group. For the human partner condition, the partner’s decision in stage 1 (i.e., trust) and collected in Session 2 was present. For the 11 trials with a computer-mediated human partner, the partner’s decision in stage 1 was selected from the pooled data of the self-reported trust in the scenario version collected in Session 1, with one trial for each level of trust (Ұ0–Ұ10 in Ұ1 increments).
In both the TG and DTG, each trial started with a jittered fixation (1–3 s). Then, the decision screen showed the face of the trustor for that trial, the amount sent over (TG) or taken away (DTG) by the trustor, the amount that the participant held, and the response scale. Participants were required to choose which percentage (0–100% in 10% increments) to return to the trustor by moving the arrow with the left or right arrow key along a scale at their own pace (Figure 7). The scale showed a horizontal axis with eleven cross/tick marks, which were labeled 0% to 100%. The amount that the participant held was highlighted on the right side of the scale. The original location of the arrow was varied under each label with equal probabilities across trials.
After the economic exchange task, participants completed the attractiveness rating task and the trustworthiness rating task, similarly to Session 2.
Upon completion of the three sessions, one trial of decisions in the second stage (i.e., the reciprocity task in Session 3) of the TG or DTG was randomly selected to calculate the bonus. There were 40 trials in the reciprocity task and participants could select any number between 1 and 40. The payoff on this trial would be the participant’s bonus. For example, if a participant chose the number 15, and, in the fifteenth trial, the participant decided to return 40% to their partner when their partner had given Ұ5, then the participant would receive a bonus of Ұ15 [(Ұ10 + Ұ5 ×3) ∗ 60%]. The minimum bonus was Ұ10 (i.e., the partner gave Ұ0 and the participant returned 0%), and the maximum was Ұ40 (i.e., the partner gave Ұ10 and the participant returned 0%). To alleviate the sense of unfairness and ensure a good reputation for the lab, participants were also provided with an exit option of obtaining Ұ20, instead of implementing their decision in the game. Most participants chose the exit option and received a bonus of Ұ20.
4.4. Statistical Analysis
All data were analyzed using SPSS (Version 22.0.0.0, IBM Corporation 2013), applying a significance level of α < 0.05 (two-tailed). The following measures served as primary dependent variables: self-reported measures, trust behavior (money transferred in TG or not taken in DTG, response times), expected percentage of return (TG and DTG), reciprocity behavior (percentage of return in TG and DTG, response times), earnings, and attractiveness and trustworthiness ratings.
The normal distribution and variance homogeneity of the data were checked before data analysis. Standardized effect sizes were calculated, including Cohen’s d for t-tests and planned contrasts and η2 p (partial eta squared) for analyses of variance (ANOVAs) and analyses of covariance (ANCOVAs).
4.4.1. Self-Report Measures
To account for the individual differences in demographics and self-reported measurements, the difference in gender distribution was tested by the chi-square test and independent-sample t-tests were performed with Game (TG, DTG) as a between-subjects factor.
4.4.2. Trust Measures
To test differences in trust behavior and response times, a repeated-measures analysis of covariance (ANCOVA) was performed with Game (TG, DTG) as a between-subjects factor; Partner (Human, Computer) as a within-subjects factor; and gender, scores of general distrust, positive reciprocity, and desire for intimacy (since the t-test showed group differences in these traits) as covariates. In the case of significant main and interaction effects, post-hoc follow-up simple effect analyses were conducted. Moreover, to elucidate whether partner faces and expectations explained a statistically significant amount of variance in trust for human partners, a two-level hierarchical linear regression analysis [57] using the enter method was conducted, with the trust in the TD and DTG as the outcome variable; between-subjects factors of Gender, Subjects, and self-reported trait scores as the first-level predictors; and within-subjects factors of trustworthiness rating, attractiveness rating, and expected percentage of return as the second-level predictors.
4.4.3. Expectation Measures
To test the differences in the anticipation of positive reciprocity between the TG and DTG, a two-level hierarchical linear regression analysis using the enter method was conducted, with the expected percentage of return as the outcome variable; between-subjects factors of Game, Gender, and Subjects as the first-level predictors; and the within-subjects factor of Trust Level as the second-level predictor. Moreover, independent-sample t-tests with Game as a group variable were further performed on the expected percentage of return separately for each level of trust.
4.4.4. Reciprocity Measures
To test whether participants reciprocated more in the TG than in the DTG and the difference in response time, a repeated-measures ANCOVA with percentage returned or response time as the dependent variable; Game (TG, DTG) as a between-subjects factor; Partner (Human, Computer) as a within-subjects factor; and Gender, scores of general distrust, positive reciprocity, desire for intimacy, and Trust Level as covariates, was carried out.
Moreover, to elucidate whether Game and Trust Level explained a statistically significant amount of variance in reciprocity for human partners, a two-level hierarchical linear regression analysis using the enter method was conducted, with the percentage returned as the outcome variable; between-subjects factors of Game, Gender, and Subjects as the first-level predictors; and the within-subjects factor of Trust Level as the second-level predictor.
In addition, independent-sample t-tests with Game (TG, DTG) as a between-subjects factor were performed on percentages returned separately for each level of trust.
4.4.5. Association between Trust and Reciprocity
The relationship between trust and reciprocity was tested by Pearson correlation analysis based on each subject’s mean trust and mean reciprocity (mixed gender) separately in the give and take frames. Moreover, to test the frame differences in the correlation between trust and reciprocity, each subject’s correlation index (r) between his/her trust and reciprocity behaviors was calculated, and then the r index was submitted to the one-way ANOVA with Game (TG, DTG) and Gender (Female, Male) as independent variables.
4.4.6. Earnings
The earnings of each participant in the role of trustor and trustee were calculated. Note that only the earnings in interactions with human partners were calculated, since the responses of the computer-mediated partners were generated by a random procedure drawn from a data pool. These earnings were submitted to a one-way ANOVA with Game (TG, DTG) and Gender (Female, Male) as independent variables.
4.4.7. Rating Measures
Two analyses of variance (ANOVAs), with attractiveness rating or trustworthiness rating as the dependent variable, and with Game (TG, DTG) and Gender (male, female) as two between-subjects factors, were conducted to control for the confounding effect of faces.
5. Conclusions
In summary, trust and reciprocity decisions depend on whether the default is no trust (give frame as measured with TG) or full trust (take frame as measured with DTG): both trust and reciprocity increase in the give than in the take frame. Our work thus offers a possible means of promoting trust and reciprocity in social and economic relationships. To increase trust and reciprocity, the decision of trust is better framed as an act of commission (i.e., framed as a give context) rather than omission. In other words, it is more appropriate to set distrust as the default option when interacting with strangers or organizations. Moreover, when the default is full trust, it is preferable to be more cautious and more accurate in anticipating the consequences of trust. For example, shareholders and stakeholders may lose their jobs, their pensions, and their investments due to not ceasing to trust companies and their accounting firms earlier [10].
Supplementary Materials
The following are available online at https://www.mdpi.com/article/10.3390/g14010008/s1, Table S1: Repeated-measures ANCOVA on trust decisions. Table S2: Repeated-measures Analysis of Covariance (ANCOVA) on the response time of making trust decisions. Table S3: Hierarchical linear regression analysis on trust in the distrust game (DTG) and trust game (TG). Table S4: Descriptive (M [SD]) and t-test results on expected percentage of return in the trust game (TG) and distrust game (DTG) groups. Table S5: Repeated-measures Analysis of Covariance (ANCOVA) on the percentage of return. Table S6: Repeated-measures Analysis of Covariance (ANCOVA) on the response time of making reciprocity decisions. Table S7: Descriptive (M [SD]) and t-test results on the percentage returned for computer and human partners upon each trust level in the trust game (TG) and distrust game (DTG) groups.
Author Contributions
Conceptualization, Y.W. and F.K.; Methodology, Y.W.; Formal analysis, Y.Z. (Yao Zhang), Y.W. and F.K.; Data curation, Y.Z. (Yao Zhang) and Y.Z. (Yushu Zhang); Writing—original draft, Y.Z. (Yao Zhang), Y.Z. (Yushu Zhang) and Y.W.; Writing—review & editing, Y.W. and F.K.; Visualization, Y.W.; Supervision, Y.W.; Project administration, Y.W.; Funding acquisition, Y.W. All authors have read and agreed to the published version of the manuscript.
Funding
This research was funded by National Natural Science Foundation of China grant number 31471073 and Major Training Project of Provincial Advantageous Special Disciplines grant number 19JYXK002.
Informed Consent Statement
Informed consent was obtained from all subjects involved in the study.
Data Availability Statement
The Data files and accompanying data analysis procedure in SPSS are publicly available at https://osf.io/xwjma/?view_only=727c2715af354773b0590c178fbb876f, accessed on 11 November 2022.
Conflicts of Interest
The authors declare no conflict of interest.
References
- Ostrom, E.; Walker, J. (Eds.) Trust and Reciprocity: Interdisciplinary Lessons from Experimental Research; Russell Sage Foundation: New York, NY, USA, 2003. [Google Scholar]
- Torche, F.; Valenzuela, E. Trust and reciprocity: A theoretical distinction of the sources of social capital. Eur. J. Soc. Theory 2011, 14, 181–198. [Google Scholar] [CrossRef]
- Vilares, I.; Dam, G.; Kording, K. Trust and Reciprocity: Are Effort and Money Equivalent? PLoS ONE 2011, 6, e17113. [Google Scholar] [CrossRef] [Green Version]
- Schneider, P.A.; Fukuyama, F. Trust: The Social Virtues and the Creation of Prosperity. J. Mark. 1996, 60, 129. [Google Scholar] [CrossRef]
- Knack, S.; Keefer, P. Does Inequality Harm Growth Only in Democracies? A Replication and Extension. Am. J. Polit. Sci. 1997, 41, 323. [Google Scholar] [CrossRef] [Green Version]
- Uslaner, E.M. Producing and Consuming Trust. Polit. Sci. Q. 2000, 115, 569–590. [Google Scholar] [CrossRef]
- Zak, P.J.; Knack, S. Trust and Growth. Econ. J. 2001, 111, 295–321. [Google Scholar] [CrossRef]
- Dincer, O.C.; Uslaner, E.M. Trust and growth. Public Choice 2010, 142, 59–67. [Google Scholar] [CrossRef]
- Berg, J.; Dickhaut, J.; McCabe, K. Trust, Reciprocity, and Social History. Games Econ. Behav. 1995, 10, 122–142. [Google Scholar] [CrossRef] [Green Version]
- Bohnet, I.; Meier, S. Deciding to Distrust. 2005. Available online: https://ideas.repec.org/p/fip/fedbpp/05-4.html (accessed on 15 September 2021).
- Fang, H.; Liao, C.; Fu, Z.; Tian, S.; Luo, Y.; Xu, P.; Krueger, F. Connectome-based individualized prediction of reciprocity propensity and sensitivity to framing: A resting-state functional magnetic resonance imaging study. Cereb. Cortex 2022, 2022, 1–14. [Google Scholar] [CrossRef] [PubMed]
- Reimann, M.; Schilke, O.; Cook, K.S. Trust is heritable, whereas distrust is not. Proc. Natl. Acad. Sci. USA 2017, 114, 7007–7012. [Google Scholar] [CrossRef] [PubMed]
- Tversky, A.; Kahneman, D. The Framing of Decisions and the Psychology of Choice. Science 1981, 211, 453–458. [Google Scholar] [CrossRef] [PubMed] [Green Version]
- Thaler, R. Toward a positive theory of consumer choice. J. Econ. Behav. Organ. 1980, 1, 39–60. [Google Scholar] [CrossRef]
- Samuelson, W.; Zeckhauser, R. Status quo bias in decision making. J. Risk Uncertain. 1988, 1, 7–59. [Google Scholar] [CrossRef]
- Rousseau, D.M.; Sitkin, S.B.; Burt, R.S.; Camerer, C. Not So Different after All: A Cross-Discipline View of Trust. Acad. Manag. Rev. 1998, 23, 393–404. [Google Scholar] [CrossRef] [Green Version]
- Falk, A.; Fischbacher, U. A theory of reciprocity. Games Econ. Behav. 2006, 54, 293–315. [Google Scholar] [CrossRef]
- Du, S.; Nie, T.; Chu, C.; Yu, Y. Reciprocal supply chain with intention. Eur. J. Oper. Res. 2014, 239, 389–402. [Google Scholar] [CrossRef]
- McCabe, K.A.; Rigdon, M.L.; Smith, V.L. Positive reciprocity and intentions in trust games. J. Econ. Behav. Organ. 2003, 52, 267–275. [Google Scholar] [CrossRef]
- Toussaert, S. Intention-based reciprocity and signaling of intentions. J. Econ. Behav. Organ. 2017, 137, 132–144. [Google Scholar] [CrossRef]
- Kühberger, A. The Influence of Framing on Risky Decisions: A Meta-analysis. Organ. Behav. Hum. Decis. Process. 1998, 75, 23–55. [Google Scholar] [CrossRef]
- Haigh, M.S.; List, J.A. Do Professional Traders Exhibit Myopic Loss Aversion? An Experimental Analysis. J. Financ. 2005, 60, 523–534. [Google Scholar] [CrossRef]
- Tovar, P. The effects of loss aversion on trade policy: Theory and evidence. J. Int. Econ. 2009, 78, 154–167. [Google Scholar] [CrossRef] [Green Version]
- Johnson, E.J.; Goldstein, D. Do Defaults Save Lives? Science 2003, 302, 1338–1339. [Google Scholar] [CrossRef] [Green Version]
- Mercer, J. Rationality and Psychology in International Politics. Int. Organ. 2005, 59, 77–106. [Google Scholar] [CrossRef]
- Steiger, A.; Kühberger, A. A Meta-Analytic Re-Appraisal of the Framing Effect. Z. Für Psychol. 2018, 226, 45–55. [Google Scholar] [CrossRef]
- Novemsky, N.; Kahneman, D. How Do Intentions Affect Loss Aversion? J. Mark. Res. 2005, 42, 139–140. [Google Scholar] [CrossRef]
- Budescu, D.V.; Weiss, W. Reflection of transitive and intransitive preferences: A test of prospect theory. Organ. Behav. Hum. Decis. Process. 1987, 39, 184–202. [Google Scholar] [CrossRef]
- Evans, A.M.; van Beest, I. Gain-loss framing effects in dilemmas of trust and reciprocity. J. Exp. Soc. Psychol. 2017, 73, 151–163. [Google Scholar] [CrossRef]
- Dufwenberg, M. Game theory. WIREs Cogn. Sci. 2011, 2, 167–173. [Google Scholar] [CrossRef]
- Burks, S.V.; Carpenter, J.P.; Verhoogen, E. Playing both roles in the trust game. J. Econ. Behav. Organ. 2003, 51, 195–216. [Google Scholar] [CrossRef] [Green Version]
- Sunderrajan, A.; Albarracín, D. Are actions better than inactions? Positivity, outcome, and intentionality biases in judgments of action and inaction. J. Exp. Soc. Psychol. 2021, 94, 104105. [Google Scholar] [CrossRef]
- Evans, A.; Krueger, J. Outcomes and expectations in dilemmas of trust. Judgm. Decis. Mak. 2014, 9, 90–103. [Google Scholar] [CrossRef]
- Evans, A.M.; Krueger, J.I. Ambiguity and expectation-neglect in dilemmas of interpersonal trust. Judgm. Decis. Mak. 2017, 12, 584–595. [Google Scholar] [CrossRef]
- Fehr, E.; Fischbacher, U.; Gächter, S. Strong reciprocity, human cooperation, and the enforcement of social norms. Hum. Nat. 2002, 13, 1–25. [Google Scholar] [CrossRef] [PubMed] [Green Version]
- Schutter, M.; van Dijk, E.; de Kwaadsteniet, E.W.; van Dijk, W.W. The Detrimental Effects of No Trust: Active Decisions of No Trust Cause Stronger Affective and Behavioral Reactions Than Inactive Decisions. Front. Psychol. 2021, 12, 643174. [Google Scholar] [CrossRef]
- Dohmen, T.; Falk, A.; Huffman, D.; Sunde, U. Representative Trust and Reciprocity: Prevalence and Determinants. Econ. Inq. 2008, 46, 84–90. [Google Scholar] [CrossRef] [Green Version]
- Chaudhuri, A.; Gangadharan, L. An Experimental Analysis of Trust and Trustworthiness. South. Econ. J. 2007, 73, 959–985. [Google Scholar] [CrossRef]
- Kiyonari, T.; Yamagishi, T.; Cook, K.S.; Cheshire, C. Does Trust Beget Trustworthiness? Trust and Trustworthiness in Two Games and Two Cultures: A Research Note. Soc. Psychol. Q. 2006, 69, 270–283. [Google Scholar] [CrossRef]
- Espín, A.M.; Exadaktylos, F.; Neyse, L. Heterogeneous Motives in the Trust Game: A Tale of Two Roles. Front. Psychol. 2016, 7, 728. [Google Scholar] [CrossRef] [Green Version]
- Bicchieri, C.; Xiao, E.; Muldoon, R. Trustworthiness is a social norm, but trusting is not. Polit. Philos. Econ. 2011, 10, 170–187. [Google Scholar] [CrossRef] [Green Version]
- Nass, C.; Moon, Y. Machines and Mindlessness: Social Responses to Computers. J. Soc. Issues 2000, 56, 81–103. [Google Scholar] [CrossRef]
- Vermue, M.; Seger, C.R.; Sanfey, A.G. Group-based biases influence learning about individual trustworthiness. J. Exp. Soc. Psychol. 2018, 77, 36–49. [Google Scholar] [CrossRef] [Green Version]
- Yamagishi, T.; Akutsu, S.; Cho, K.; Inoue, Y.; Li, Y.; Matsumoto, Y. Two-Component Model of General Trust: Predicting Behavioral Trust from Attitudinal Trust. Soc. Cogn. 2015, 33, 436–458. [Google Scholar] [CrossRef]
- Yamagishi, T. The Provision of a Sanctioning System in the United States and Japan. Soc. Psychol. Q. 1988, 51, 265. [Google Scholar] [CrossRef]
- Costa, P.T.; McCrae, R.R. The Revised NEO Personality Inventory (NEO-PI-R). In The SAGE Handbook of Personality Theory and Assessment: Volume 2—Personality Measurement and Testing; SAGE Publications, Inc.: Los Angeles, CA, USA, 2008; pp. 179–198. [Google Scholar] [CrossRef]
- Banerjee, R. On the interpretation of World Values Survey trust question—Global expectations vs. local beliefs. Eur. J. Polit. Econ. 2018, 55, 491–510. [Google Scholar] [CrossRef] [Green Version]
- Botsford, J.; Schulze, L.; Bohländer, J.; Renneberg, B. Interpersonal Trust: Development and Validation of a Self-Report Inventory and Clinical Application in Patients With Borderline Personality Disorder. J. Personal. Disord. 2021, 35, 447–468. [Google Scholar] [CrossRef]
- Caliendo, M.; Fossen, F.; Kritikos, A. Trust, positive reciprocity, and negative reciprocity: Do these traits impact entrepreneurial dynamics? J. Econ. Psychol. 2012, 33, 394–409. [Google Scholar] [CrossRef] [Green Version]
- Matejkowski, J.; McCarthy, K.S.; Draine, J. The Personal Norm of Reciprocity among mental health service users: Conceptual development and measurement. Psychiatr. Rehabil. J. 2011, 34, 202–213. [Google Scholar] [CrossRef]
- Gray, K.; Ward, A.F.; Norton, M.I. Paying it forward: Generalized reciprocity and the limits of generosity. J. Exp. Psychol. Gen. 2014, 143, 247–254. [Google Scholar] [CrossRef] [Green Version]
- Davis, M.H. Measuring individual differences in empathy: Evidence for a multidimensional approach. J. Pers. Soc. Psychol. 1983, 44, 113–126. [Google Scholar] [CrossRef]
- Griffin, D.W.; Bartholomew, K. The metaphysics of measurement: The case of adult attachment. In Attachment Processes in Adulthood, Advances in Personal Relationships; Jessica Kingsley Publishers: London, UK, 1994; pp. 17–22. [Google Scholar]
- Murphy, R.O.; Ackermann, K.A.; Handgraaf, M. Measuring Social Value Orientation. SSRN Electron. J. 2011, 6, 771–781. [Google Scholar] [CrossRef] [Green Version]
- Wilkins, C.L.; Wellman, J.D.; Babbitt, L.G.; Toosi, N.R.; Schad, K.D. You can win but I can’t lose: Bias against high-status groups increases their zero-sum beliefs about discrimination. J. Exp. Soc. Psychol. 2015, 57, 1–14. [Google Scholar] [CrossRef]
- Aquino, K.; Reed, A. The self-importance of moral identity. J. Pers. Soc. Psychol. 2002, 83, 1423–1440. [Google Scholar] [CrossRef] [PubMed]
- Stawski, R.S. Multilevel Analysis: An Introduction to Basic and Advanced Multilevel Modeling (2nd Edition). Struct. Equ. Model. Multidiscip. J. 2013, 20, 541–550. [Google Scholar] [CrossRef]
Figure 1.
The percentage of return in the trust game (TG) and distrust game (DTG). (a) Self-reported reciprocity. The self-reported percentage of return as a function of trust levels for human partners measured by the scenario version in Session 1. Self-reported percentages of return were significantly higher in the TG than the DTG group at the levels of trust 1 to trust 9. (b) Expected reciprocity. The expected percentage of return as a function of trust levels for human partners measured in Session 2. Expected percentages of return were significantly higher in the TG than the DTG group at the levels of trust 5 to trust 8. Expected percentage of return was significantly higher in the DTG than the TG group at the levels of trust 0. (c) Average reciprocity. The actual percentage of return as a function of partners and game measured in Session 3. Actual percentages of return were significantly higher in the TG than the DTG group. (d) Actual reciprocity. The actual percentages of return as a function of partners, game, and trust levels measured in Session 3. For computer-mediated partners, actual percentages of return were significantly higher in the TG than the DTG group at the levels of trust 3 to trust 7, and trust 9. For human partners, actual percentages of return were significantly higher in the TG than the DTG group at the levels of trust 2 to trust 7. Bars and error lines indicate the mean value and the standard errors of means. * p < 0.05, ** p < 0.01, *** p < 0.001.

Figure 2.
The trust decision in the trust game (TG) and distrust game (DTG) groups. (a) Average trust. The mean trust amount (out of Ұ10) for human and computer-mediated human partners. Bars and error lines indicate the mean values and the standard errors of means. Raw data points are overlaid. (b) Average choosing rate. The average choosing rate of each amount of trust across participants when interacting with human partners. Bars and error lines indicate the mean values and the standard deviations. * p < 0.05, ** p < 0.01.

Figure 3.
The trust and distrust game frameworks. (a) Trust game (TG). Both players received an initial endowment of Ұ10. In the first stage, the trustors (Player 1) decided to give any amount of their endowment X to the trustees (Player 2). The amount would be tripled and sent to trustees. In the second stage, the trustees decided to return any percentage of the remaining money (Ұ10 + 3X) to the trustors. (b) Distrust game (DTG). Trustors were initially endowed with Ұ0, and trustees with Ұ40. In the first stage, trustors decided to take Z from trustees. Z was divided by three and sent to trustors. In the second stage, trustees decided to return any percentage of the remaining money (Ұ40-Z) to trustors.

Figure 4.
Example trust trial for TG (upper) and DTG (lower). The Fixation is displayed (1 s) and followed by the Partner screen (3 s). The face of a human partner (other recruited participants of the same gender) or computer-mediated partner (android image) is shown, together with the initial endowments for both players. After a Wait screen (1–3 s), the Decision screen prompts the trustor to choose an amount to give or take by moving the arrow with the left or right arrow key. The participants have a response restriction of 8 s. Then, the inter-trial interval (ITI) screen appears with a jittered time of 2–4 s.

Figure 5.
The display of the expectation task in the trust game (TG) (upper part) and distrust game (DTG) (lower part). After a Fixation was shown (1 s), the Decision screen showed the face of the partner, the amount given or taken away, and the amount that the partner held after stage 1. Participants made their estimations by moving the arrow with the left or right arrow key. They locked their choices by pressing the enter key. Participants made their choices at their own pace. Note that the texts in the original picture are in Chinese. They are translated into English for communication purposes.

Figure 6.
The rating of attractiveness (a) and trustworthiness (b) of each partner. After a Fixation was shown (1–3 s), the Decision screen showed the face of the partner and the rating scale. Participants made their ratings by moving the arrow with the left or right arrow key. They locked their choices by pressing the enter key. Participants made their ratings at their own pace. Note. The texts in the original picture are in Chinese. They are translated into English for communication purposes.

Figure 7.
Example reciprocity trial for TG (upper) and DTG (lower). After a Fixation was shown (1–3 s), the Decision screen showed the face of the partner, the amount sent over (TG) or taken away (DTG) by the trustor, the amount that the participant held, and the response scale. Participants were required to choose which percentage (0–100% in 10% increments) to return to the trustor by moving the arrow with the left or right arrow key. They locked their choices by pressing the enter key. Participants made their ratings at their own pace. Note. The texts in the original picture are in Chinese. They are translated into English for communication purposes.


Table 1.
Descriptive (M [SD]) and t-test results on demographic and self-reported measures in the trust game (TG) and distrust (DTG) groups.
Table 1.
Descriptive (M [SD]) and t-test results on demographic and self-reported measures in the trust game (TG) and distrust (DTG) groups.
| TG (n = 58) | DTG (n = 59) | p-Value | t Value | Cohen’s d | |
|---|---|---|---|---|---|
| Single Dimension Scales | |||||
| Pay-It-Forward Tendency | 4.11 (0.64) | 4.20 (0.64) | 0.448 | −0.76 | −0.14 |
| Social Value Orientation | 32.05 (10.25) | 34.10 (7.71) | 0.225 | −1.22 | −0.23 |
| General Distrust | 4.45 (0.67) | 4.07 (0.96) | 0.015 | 2.47 | 0.46 |
| Moral Identity | 10.40 (1.72) | 10.18 (1.56) | 0.455 | 0.74 | 0.14 |
| General Zero-Sum Beliefs | 2.86 (0.87) | 2.96 (0.83) | 0.550 | −0.60 | −0.11 |
| NEO-PI-R-trust | 3.44 (0.51) | 3.54 (0.50) | 0.306 | −1.02 | −0.19 |
| Trust strangers | 1.69 (0.60) | 1.76 (0.60) | 0.510 | 0.66 | −0.12 |
| Positive and Negative Reciprocity | 9.25 (1.40) | 9.01 (1.40) | 0.340 | −0.95 | 0.19 |
| Interpersonal Trust Scenario Questionnaire | 3.28 (0.61) | 3.17 (0.57) | 0.329 | −0.97 | 0.186 |
| Self-Reported Trust | 6.00 (2.49) | 6.56 (3.68) | 0.337 | −0.96 | −0.18 |
| Interpersonal Reactivity Index | |||||
| Interpersonal Reactivity Index | 99.71 (7.97) | 97.76 (11.91) | 0.301 | 1.04 | 0.19 |
| Perspective Taking | 25.22 (3.69) | 25.44 (3.80) | 0.755 | −0.31 | −0.06 |
| Fantasy | 24.16 (3.76) | 22.92 (4.54) | 0.111 | 1.61 | 0.30 |
| Empathic Concern | 26.98 (3.27) | 26.97 (3.66) | 0.979 | 0.03 | 0.00 |
| Personal Distress | 23.34 (4.15) | 22.44 (4.30) | 0.249 | 1.16 | 0.21 |
| General Trust | |||||
| Trust Belief | 5.26 (0.82) | 5.34 (0.88) | 0.597 | −0.53 | −0.10 |
| Trust Preference | 3.69 (0.85) | 3.95 (0.68) | 0.061 | −1.89 | −0.35 |
| General Trust | 8.94 (1.42) | 9.29 (1.34) | 0.170 | −1.38 | −0.26 |
| Personal Norm of Reciprocity | |||||
| Belief In Reciprocity | 4.70 (0.72) | 4.50 (0.80) | 0.159 | 1.42 | 0.26 |
| Positive Reciprocity | 5.78 (0.71) | 5.48 (0.70) | 0.027 | 2.24 | 0.41 |
| Negative Reciprocity | 4.22 (1.04) | 3.93 (0.87) | 0.115 | 1.59 | 0.29 |
| Relationship Scales Questionnaire | |||||
| Independence | 4.18 (0.56) | 4.25 (0.64) | 0.511 | −0.66 | −0.12 |
| Dependence | 3.12 (0.52) | 3.18 (0.61) | 0.604 | −0.52 | −0.10 |
| Lack Of Trust | 3.07 (0.55) | 2.95 (0.52) | 0.218 | 1.24 | 0.23 |
| Anxiety | 3.10 (0.69) | 2.95 (0.72) | 0.277 | 1.09 | 0.21 |
| Desire For Intimacy | 3.00 (0.77) | 2.69 (0.67) | 0.026 | 2.26 | 0.43 |
| Avoidance | 3.11 (0.45) | 3.02 (0.56) | 0.380 | 0.88 | 0.42 |
| Self-Reported Reciprocity | |||||
| Self-reported percentage of return when Player 1 trusted 10 | 52 (16) | 48 (14) | 0.218 | 1.24 | 0.23 |
| Self-reported percentage of return when Player 1 trusted 9 | 50 (15) | 43 (15) | 0.008 | 2.71 | 0.50 |
| Self-reported percentage of return when Player 1 trusted 8 | 48 (15) | 39 (15) | 0.001 | 3.48 | 0.64 |
| Self-reported percentage of return when Player 1 trusted 7 | 48 (14) | 34 (17) | <0.001 | 5.18 | 0.96 |
| Self-reported percentage of return when Player 1 trusted 6 | 46 (14) | 29 (19) | <0.001 | 5.73 | 1.06 |
| Self-reported percentage of return when Player 1 trusted 5 | 46 (15) | 26 (19) | <0.001 | 6.07 | 1.12 |
| Self-reported percentage of return when Player 1 trusted 4 | 42 (15) | 21 (20) | <0.001 | 6.67 | 1.23 |
| Self-reported percentage of return when Player 1 trusted 3 | 37 (16) | 17 (20) | <0.001 | 6.12 | 1.13 |
| Self-reported percentage of return when Player 1 trusted 2 | 31 (17) | 13 (20) | <0.001 | 5.24 | 0.97 |
| Self-reported percentage of return when Player 1 trusted 1 | 25 (21) | 9 (19) | <0.001 | 4.51 | 0.84 |
Note. The bold numbers indicate significant differences.
Table 2.
Hierarchical linear regression analysis on expected percentage of return.
| Predictors | Model 1 | Model 2 | ||||||
|---|---|---|---|---|---|---|---|---|
| Beta | SE. | t | p | Beta | SE. | t | p | |
| Constant | 0.34 | 0.01 | 27.33 | <0.001 | 0.15 | 0.01 | 12.21 | <0.001 |
| Game | 0.02 | 0.01 | 3.89 | <0.001 | 0.04 | 0.01 | 9.08 | <0.001 |
| Gender | −0.01 | 0.01 | −1.62 | 0.106 | −0.01 | 0.01 | −1.68 | 0.072 |
| Subjects | 0 | 0 | 0.82 | 0.413 | 0 | 0 | −1.47 | 0.257 |
| Trust Levels | 0.03 | 0.00 | 32.55 | <0.001 | ||||
| R Square | 0.005 | 0.237 | ||||||
| F Change | 6.248 | 217.886 | ||||||
| Sig. F Change | <0.001 | <0.001 | ||||||
Note. The bold numbers indicate significant differences. Predictors in Model 1 included Constant, Subjects, Gender, and Game; Predictors in Model 2 included Constant, Subjects, Gender, Game, and Trust Levels.
Table 3.
Hierarchical linear regression analysis on percentage returned.
| Predictors | Model 1 | Model 2 | ||||||
|---|---|---|---|---|---|---|---|---|
| Beta | SE. | t | p | Beta | SE. | t | p | |
| Constant | 0.01 | 16.05 | <0.001 | 0.01 | −6.46 | <0.001 | ||
| Game Type | 0.14 | 0.01 | 7.79 | <0.001 | 0.23 | 0 | 17.50 | <0.001 |
| Gender | −0.01 | 0.01 | −0.35 | 0.726 | 0.01 | 0 | 0.36 | 0.723 |
| Subjects | 0.06 | 0 | 3.51 | <0.001 | 0.07 | 0 | 5.62 | <0.001 |
| Trust Levels | 0.66 | 0 | 49.53 | <0.001 | ||||
| R Square | 0.022 | 0.423 | ||||||
| F Change | 24.305 | 2452.678 | ||||||
| Sig. F Change | <0.001 | <0.001 | ||||||
Note. The bold numbers indicate significant differences. Predictors in Model 1 included Constant, Subjects, Gender, and Game; Predictors in Model 2 included Constant, Subjects, Gender, Game, and Trust Levels.
Disclaimer/Publisher’s Note: The statements, opinions and data contained in all publications are solely those of the individual author(s) and contributor(s) and not of MDPI and/or the editor(s). MDPI and/or the editor(s) disclaim responsibility for any injury to people or property resulting from any ideas, methods, instructions or products referred to in the content. |
© 2023 by the authors. Licensee MDPI, Basel, Switzerland. This article is an open access article distributed under the terms and conditions of the Creative Commons Attribution (CC BY) license (https://creativecommons.org/licenses/by/4.0/).
Share and Cite
MDPI and ACS Style
Zhang, Y.; Zhang, Y.; Wu, Y.; Krueger, F. Default Matters in Trust and Reciprocity. Games 2023, 14, 8. https://doi.org/10.3390/g14010008
AMA Style
Zhang Y, Zhang Y, Wu Y, Krueger F. Default Matters in Trust and Reciprocity. Games. 2023; 14(1):8. https://doi.org/10.3390/g14010008
Chicago/Turabian StyleZhang, Yao, Yushu Zhang, Yan Wu, and Frank Krueger. 2023. "Default Matters in Trust and Reciprocity" Games 14, no. 1: 8. https://doi.org/10.3390/g14010008
Note that from the first issue of 2016, this journal uses article numbers instead of page numbers. See further details here.