

Risk-Averse and Self-Interested Shifts in Groups in Both Median and Random Rules

1
School of Political Science and Economics, Waseda University, 1-6-1 Nishi-Waseda, Shinjuku-ku, Tokyo 169-8050, Japan
2
School of Political Science and Economics, Tokai University, 4-1-1 Kitakaname, Tokyo 151-8677, Japan
*
Author to whom correspondence should be addressed.
Games 2023, 14(1), 16; https://doi.org/10.3390/g14010016
Submission received: 31 December 2022
/
Revised: 29 January 2023
/
Accepted: 1 February 2023
/
Published: 13 February 2023
(This article belongs to the Special Issue Applications of Game Theory with Mathematical Methods)
Abstract
:The purpose of this study was to determine whether attitudes toward risk and altruism are affected by being in a group or being alone. In contrast to previous economic research on group decision-making, we excluded the effects of group informal discussions, which are thought to be a “black box” when individuals make decisions in a group. In this regard, the subjects in our experiment were only requested to show their faces to the other members, without further communication. Moreover, we adopted two collective decision rules, i.e., the median rule and the random rule, which provide the truth-telling mechanism. In the experiments of both anonymous investment and donation, we found that the subjects who made decisions in a group offered significantly lower amounts than those who made decisions alone, after controlling for individuals’ risk and altruistic preferences. The findings imply that people are more risk-averse and self-interested when they are in a group, regardless of which collective decision rules are adopted.
1. Introduction
Although a decision-maker is almost always assumed to be an individual in normative economic models, in real-life situations, many important decisions are made by groups such as company boards, management teams, governments, legislators, etc. Meanwhile, since the importance of group decision-making has been growing, economists have been focusing increasing interest on this particular subject.
In the field of social psychology, the study of group decision-making has had a long history. For example, Stoner (1961) [1] conducted the first experiment in which decisions made by groups led to riskier positions, compared to individuals’ decisions, while Moscovici and Zavalloni (1969) [2] noted that decision-making in groups can result in both risky and cautious shifts.1 In related research, Kerr et al. (1996) [6] concluded that group interactions and discussions can yield different results.2
In previous economic studies of group decision-making,3 the preferential differences toward risk and altruism between individuals and groups were examined.4 However, the empirical evidence has been mixed. For instance, Baker et al. (2008), Shupp and Williams (2008), and Masclet et al. (2009) [33,34,35] reported that groups are more risk-averse than individuals, while Mifune et al. (2016) [36] found a similar tendency by comparing individual-on-individual treatment to group-on-individual treatment. Although Rockenbach et al. (2007) and Zhang and Casari (2012) [37,38] found that group decisions can display a risky shift, Harrison et al. (2012) [39] concluded that there are no significant differences between individuals and groups.
Regarding altruistic preferences, Cason and Mui (1997) [40] found that a dictator group was less self-interested than an individual dictator, whereas Luhan et al. (2009) [41] reported the contrary. Specifically, the method of communication within the dictator group in Cason and Mui (1997) [40] was face-to-face, whereas that in Luhan et al. (2009) [41] was online chat. In the latter, determining whether group decision-making was more self-interested than individual decision-making was based on the anonymity within the dictator group.
As the aforementioned economic literature on group decision-making, except for Masclet et al. (2009) [33] and Harrison et al. (2012) [39], featured groups that were allowed to communicate with the other group members via face-to-face discussions or electronic chats, the observed decisions of the groups were due to the mixed effect of the preferences of the individuals being in a group and the group’s formal/informal discussions. Consequently, little is known about the subjects’ actual preferences in terms of how they decide, i.e., alone or in a team.
The present study differs from the previous literature regarding three points. First, we excluded the effects of group informal discussions, which are thought to be a “black box” when individuals make decisions. Second, the prior literature adopted different “collective decision rules” on group decision-making (e.g., majority rule, unanimity, and dictator rule), which may have affected the results of the experiments (Gilet et al., 2009) [42]. To the best of our knowledge, this is the first experiment that compares two collective decision rules, i.e., the median rule and the random rule. Although these two rules can enhance the truth-telling mechanism (see Cason et al., 2006) [43], we determined whether there is a difference between both rules on group decision-making. Finally, we collected data regarding both individuals’ attitudes toward risk and altruism from the same subjects, since the effect of group decision-making may be influenced by these two aspects. We observed that the existence of other group members had a significant influence on both attitudes, regardless of which collective decision rules were adopted.
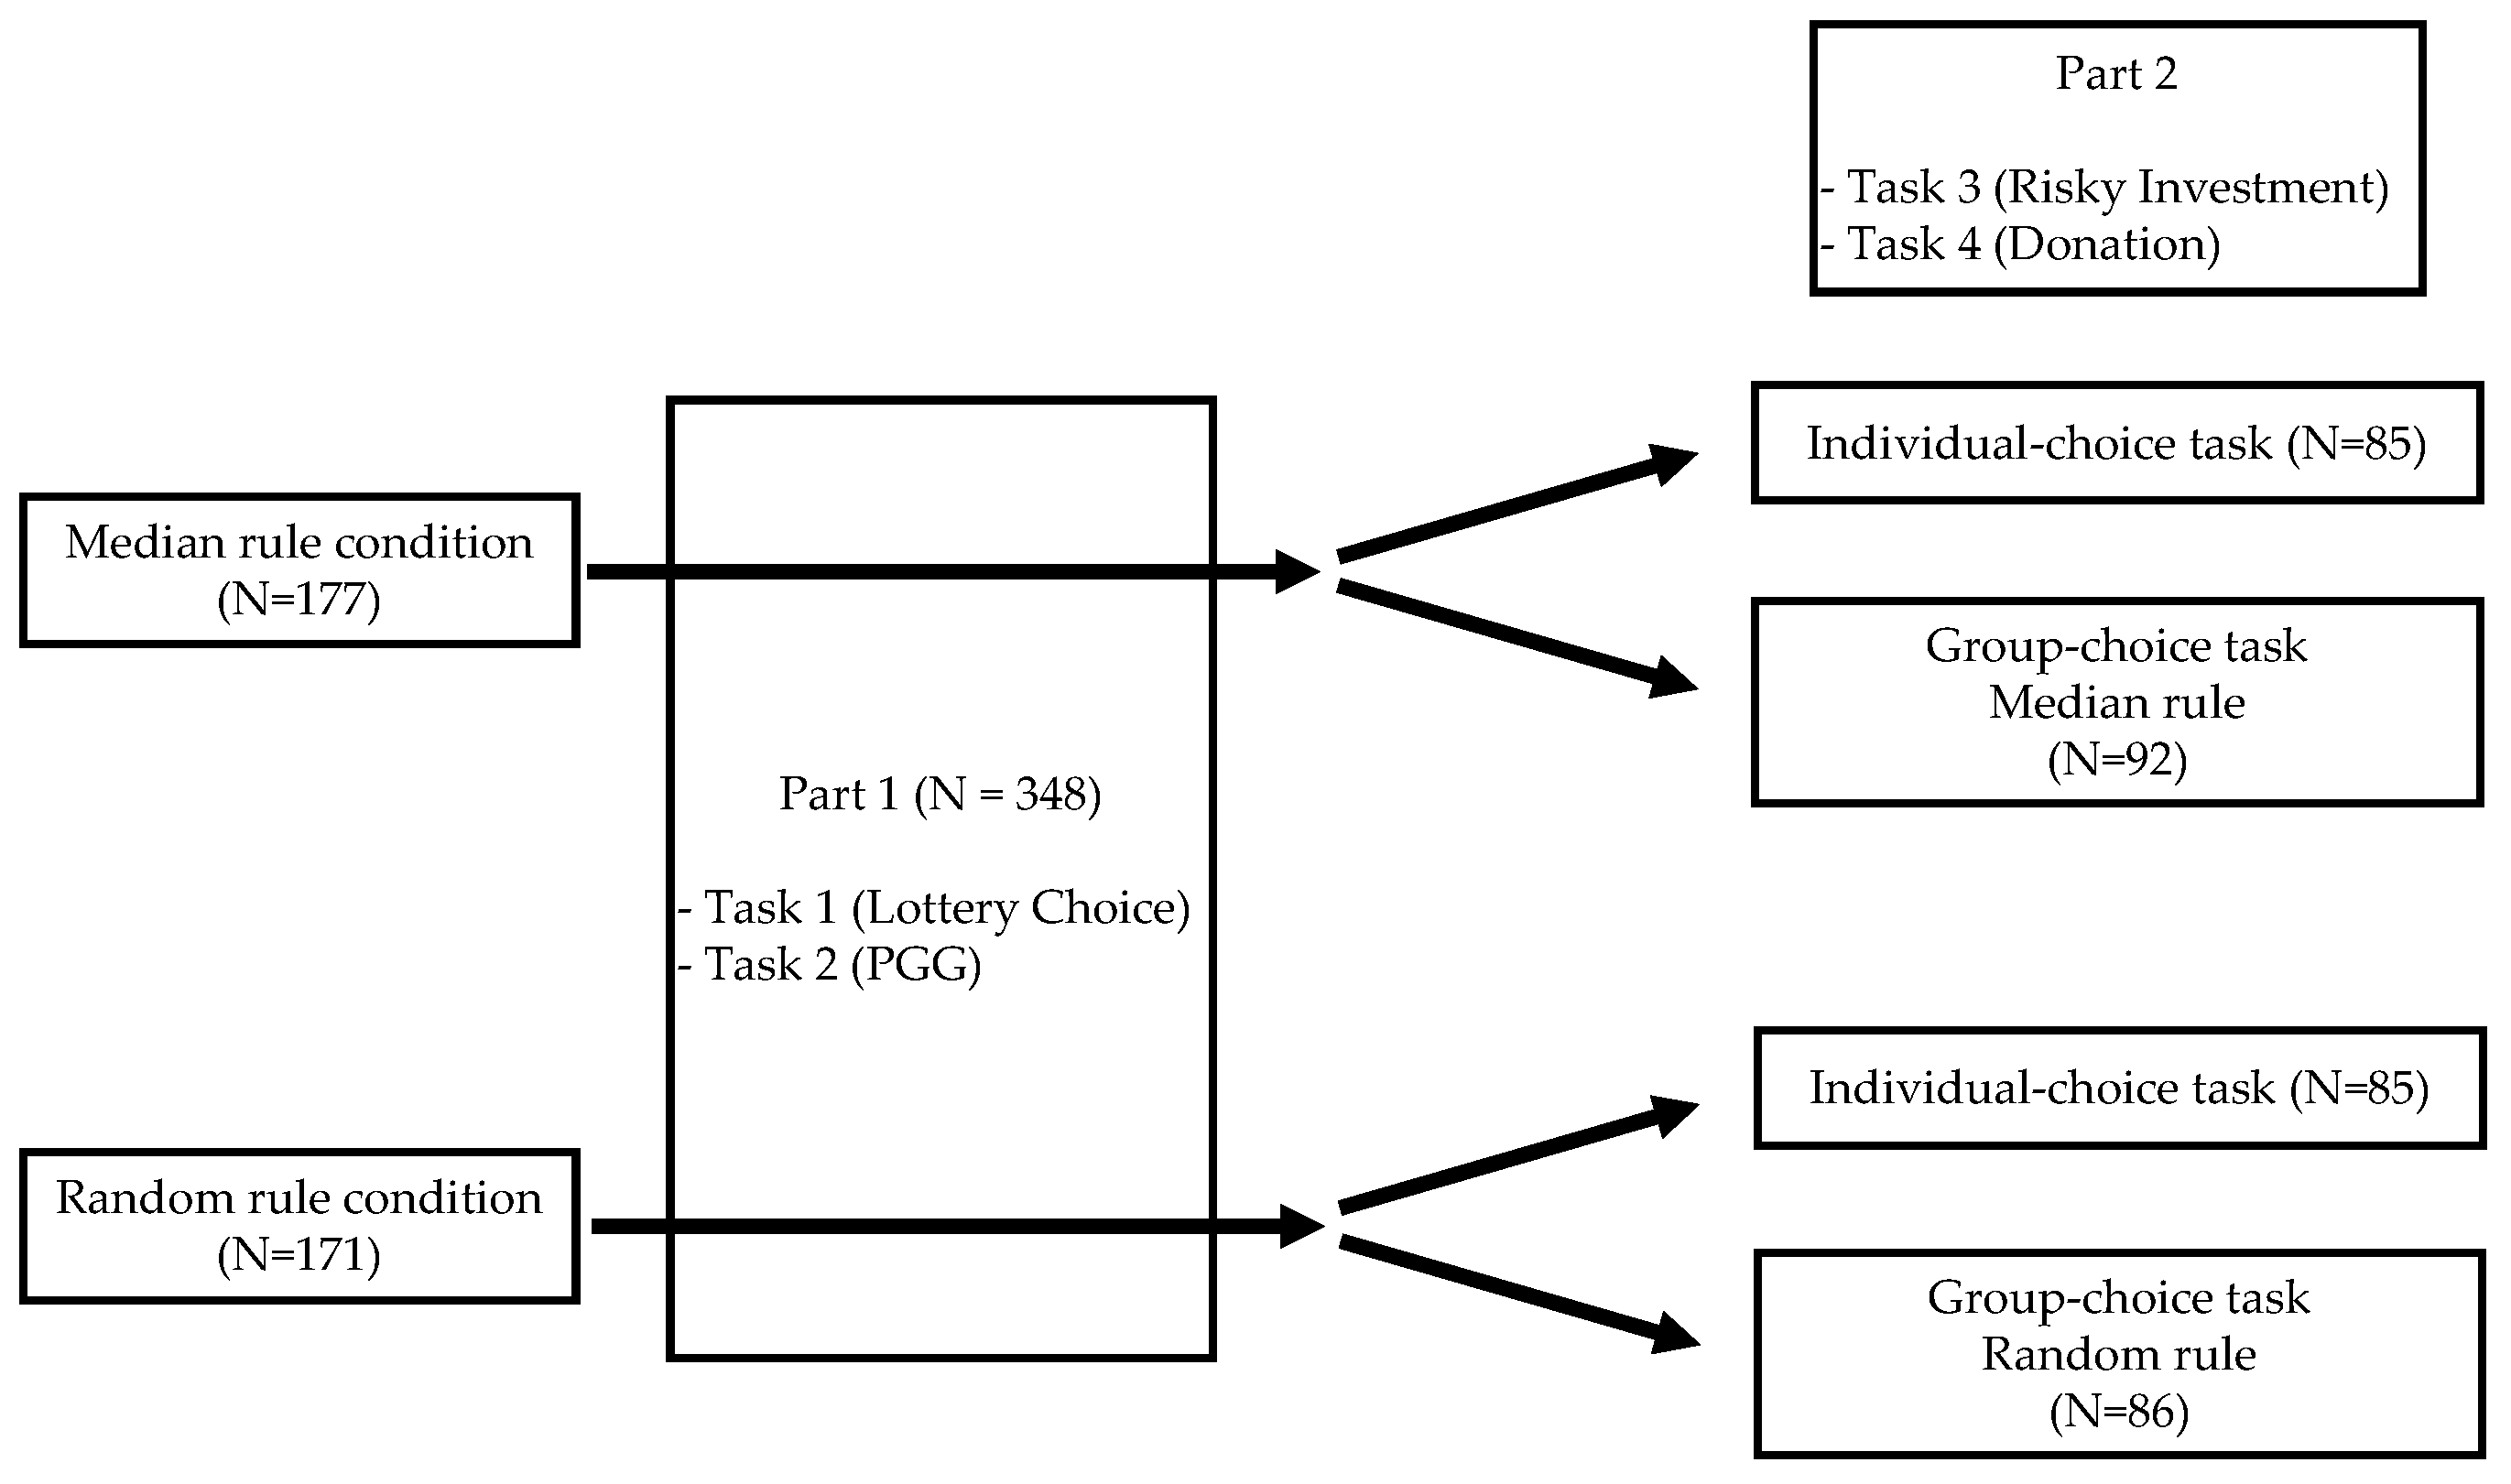
To compare the risk and altruistic attitudes of groups and individuals, our experiment was composed of two parts. First, all of the subjects were asked to conduct an individual task. For risk attitude, we implemented the lottery choice task introduced by Holt and Laury (2002) [44]. For altruism attitude, we used a standard public goods game (PGG). These variables were utilized as controls for individuals’ preferences toward risk and altruism in our regression model. Second, we separated the subjects into individual-choice and group-choice tasks and then conducted an anonymous investment game and donation game in each task. For the group-choice task, the subjects were requested to only show their faces to the other members, without further communication. Meanwhile, each Player made the same decision by the median rule condition and the random rule condition, after which he/she received the same payoff.
2. Materials and Methods
Figure 1 presents our experimental design, which consists of two parts. In Part 1, all of the subjects were asked to perform an individual task, as mentioned later in this section (i.e., Tasks 1 and 2). After the decisions in Part 1 were made, the instructions in Part 2 were presented. In Part 2, the subjects performed Tasks 3 and 4 after being randomly separated into the individual-choice task and the group-choice task.5 For the group-choice task, the subjects were divided into a group of three and the collective decision rule was either the median or the random rule, both of which provided the truth-telling mechanism at the time of decision-making. Since the collective decision rule applied in the group-choice task in Part 2 was predetermined, this became the name of the experiment. However, since the explanation of the collective decision rule was provided after the decisions in Part 1, the difference in the collective decision rules did not affect the decisions in this part.
2.1. Part 1 (Tasks 1 and 2)
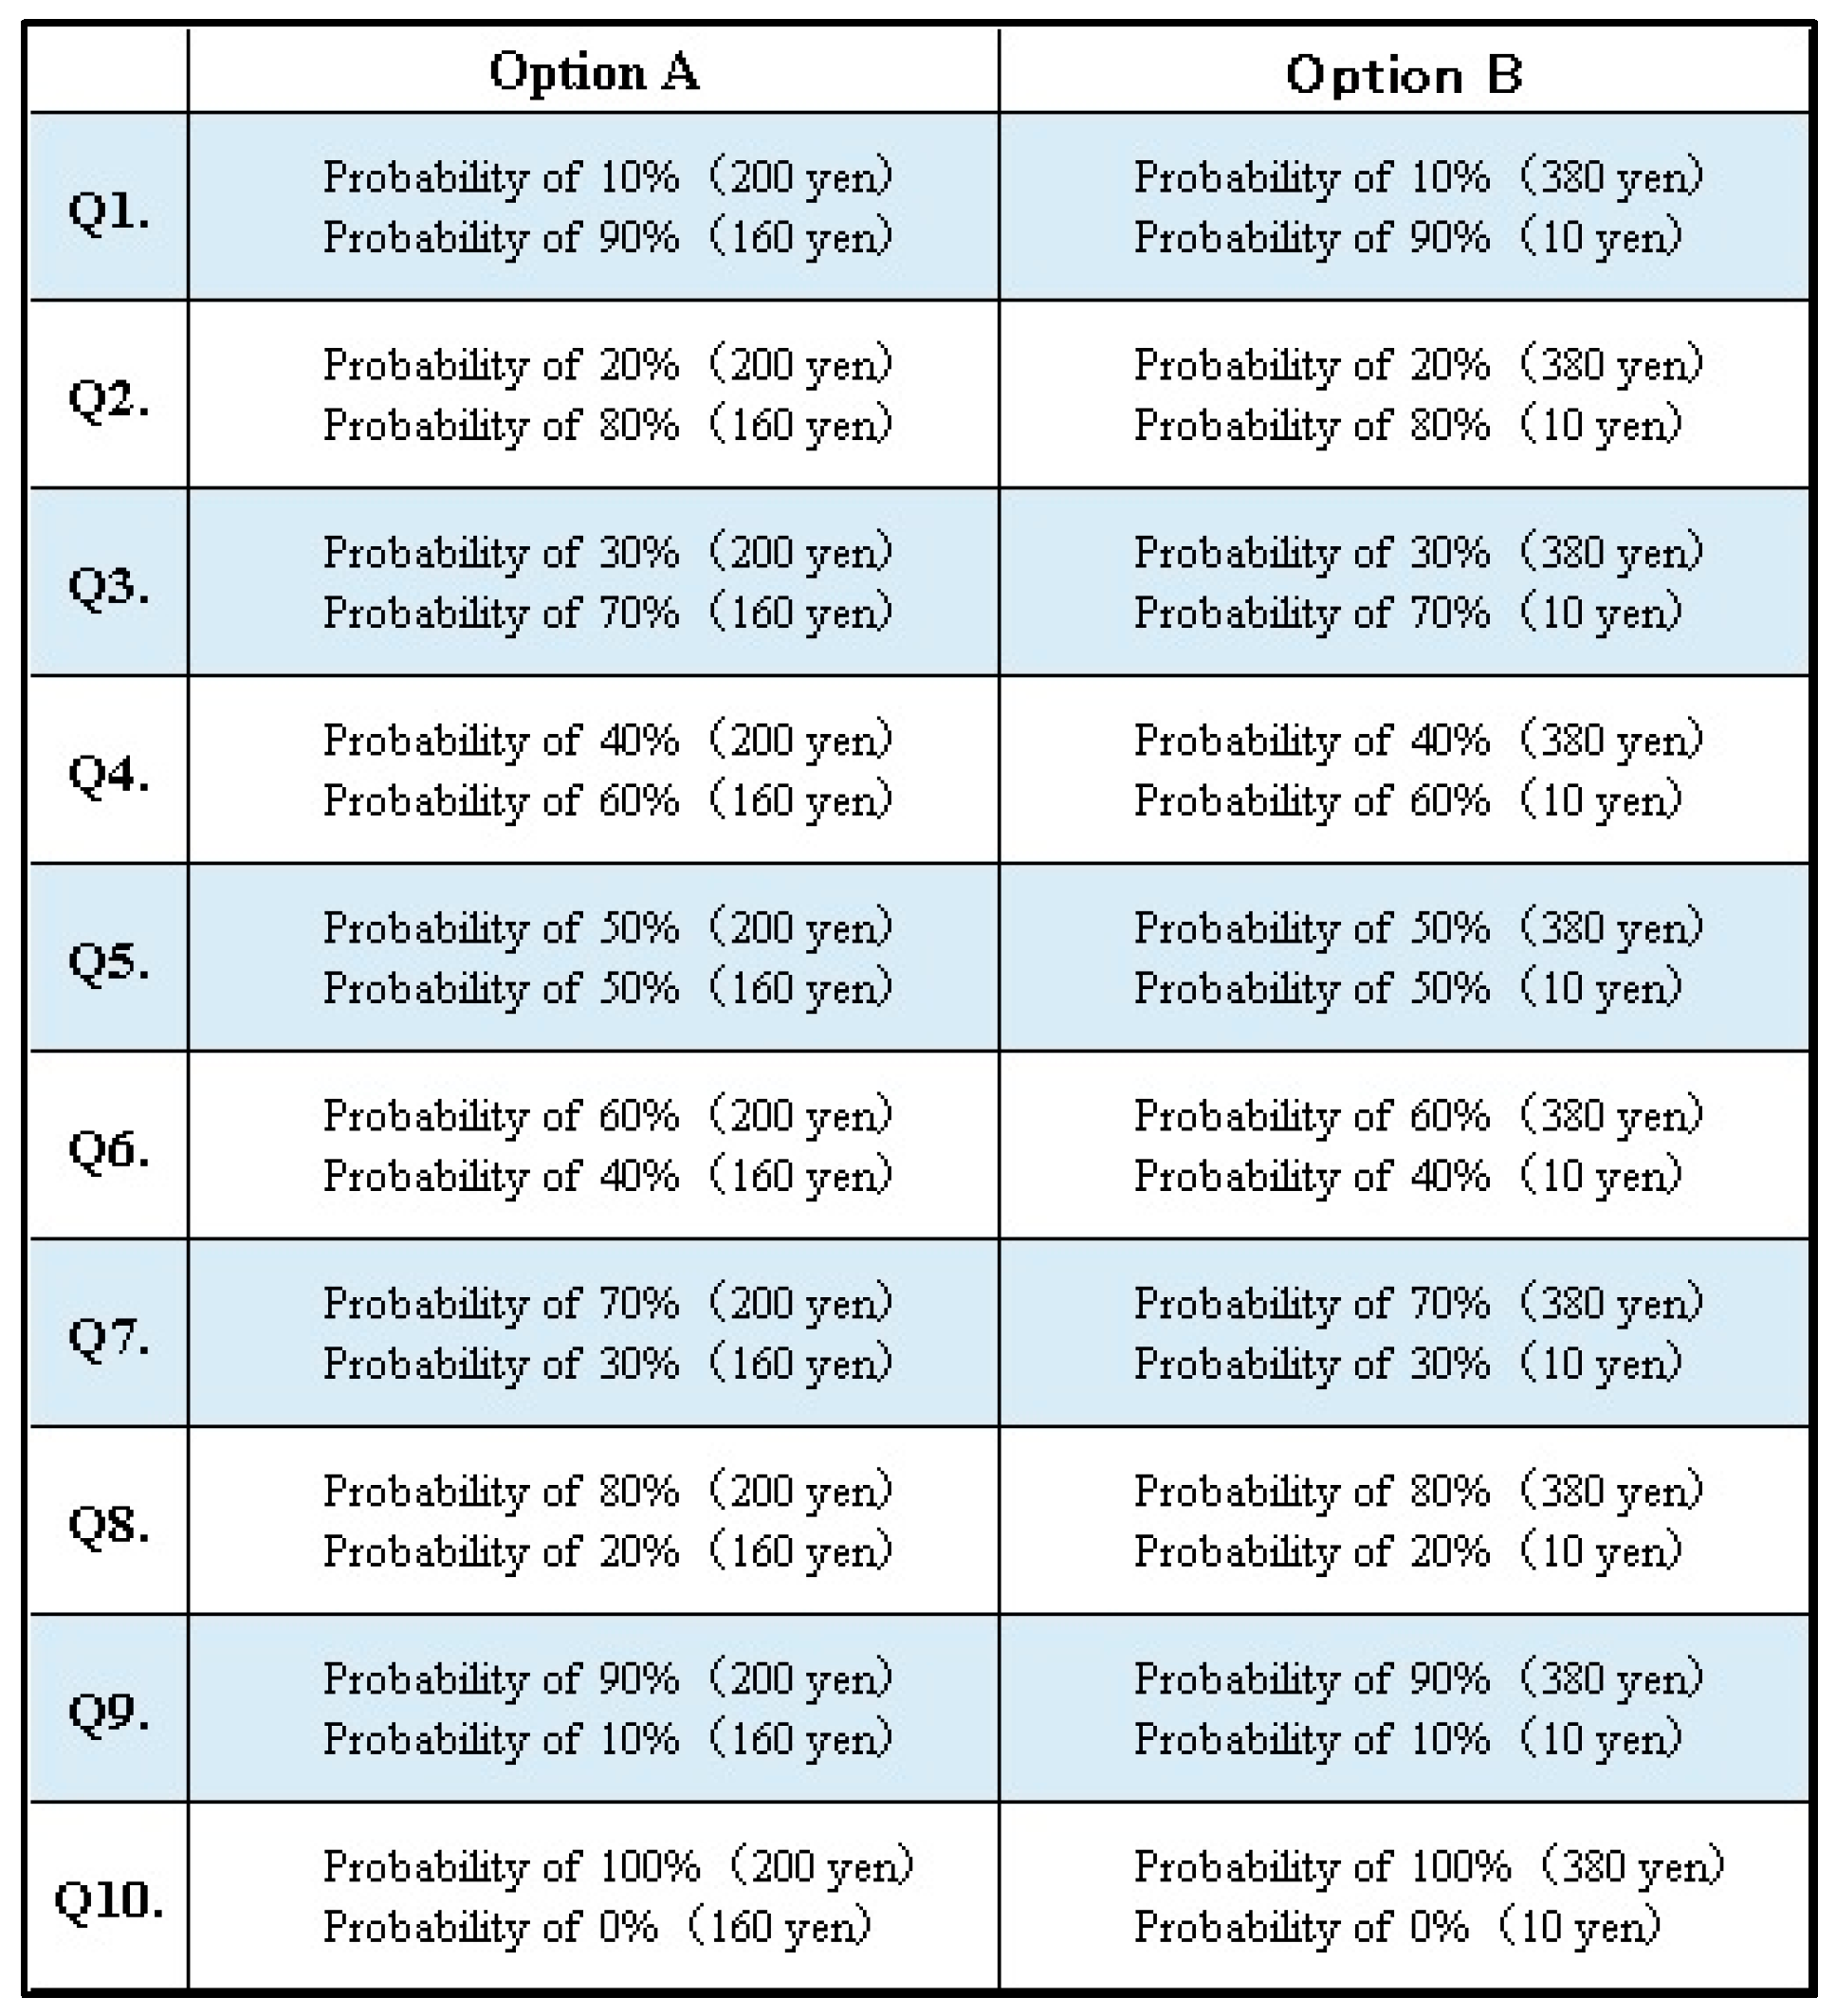
In this section, we describe our task in more detail. In Task 1, the lottery choice experiment introduced by Holt and Laury (2002) [44] was conducted, in which the subjects were asked to choose between a “safe” (Option A) and a “risky” (Option B) option. All 10 decisions simultaneously appeared (as shown in Table 1). At the time of the experiment, 110 yen equaled approximately one US dollar. One decision was randomly chosen by the computer for payment at the end of the experiment. Additionally, we calculated the coefficient of relative risk aversion based on the constant relative risk aversion (CRRA) utility function:
where is the coefficient of relative risk aversion and represents the lottery outcomes for subject i. In this case, the coefficient was less than 0 for the subjects who were risk-seeking, equal to 0 for the subjects who were risk-neutral, and greater than 0 for the subjects who were risk-averse.
In Task 2, a standard PGG was used to measure individual altruistic preferences. Specifically, the subjects determined how much of the 200-yen endowment to keep or invest in public goods. The payoffs were determined by the contributions of each member being doubled and evenly divided between the members. While Masclet et al. (2009) [35] controlled the socio-demographic variables, such as salaried and self-employed workers, we used these variables as controls in the regression model (e.g., Task 1: risk preference; Task 2: altruistic preference).
2.2. Part 2 (Tasks 3 and 4)
In Tasks 3 and 4, we used the anonymous investment and donation game. In this case, the subjects received a 200-yen endowment and decided how much money to invest or donate, ranging from 0 yen to 200 yen (in intervals of 10 yen). In Task 3, their investment options were as follows: 50% possibility of winning 2.5 times their invested amount or 50% possibility of losing their entire investment. In Task 4, they donated money to the Japanese Red Cross Society.
As explained earlier, the subjects were randomly allotted individual-choice and group-choice tasks. While their choice became their decision in the individual-choice task, the group decision was based on the collective decision rule (i.e., the median rule or the random rule) applied to the choices of the team members in the group-choice task, after which each team member received the same payoff. For the median rule, the instruction sheets explained that the median value was the middle value in the sorted order of values, after which the group decision was determined according to the median values. For the random rule, the subjects were instructed that the group decision was based on the choices of the group members, which were randomly selected with a one-third possibility. This setting enabled us to observe the individual choices for the group-choice task while considering both the median and random rules. Hence, the group choice is referred to as the “individual choice in a group” for the remainder of this study.
Furthermore, the subjects were told that the members of the groups are identical in Tasks 3 and 4. Meanwhile, they were not allowed to communicate with one another, since we attempted to exclude the effects of the group discussions from the decision-making processes. However, we considered that if there were no interactions between the group members before making any decisions, then the members would not realize that they were indeed assigned to groups. Therefore, to increase the credibility of our experiment, we used the same mutual identification6 employed in Bohnet and Frey (1999) [45], in which each member of the group would stand up and show their face to the other members (in silence).
Following these tasks, we ran other decision-related tasks, in which the subjects were asked to individually answer the post-experimental questionnaire, including the questions related to social value orientation (SVO). Further details are discussed in the Section 3.
2.3. Procedure
Overall, we managed our experiment according to the standards of economic experiments. The instruction sheets were individually distributed and the information was read aloud to the subjects at the beginning of each part. All of the tasks required one-shot anonymous decisions,7 and there was no feedback until the end of the experiment. All of the subjects were undergraduate students from various disciplines at the Kochi University of Technology, Kyoto Sangyo University, and Kansai University, recruited via the university website and e-mail solicitation.8 We conducted 18 sessions between July 2015 and December 2017. No subject participated in more than one session. The experiment was programmed and conducted by using z-Tree software (Fischbacher, 2007) [47]. The subjects were individually seated in front of a computer screen. On average, each session lasted for approximately 1 h and 15 min, including the post-experiment questionnaire and final payment of the subjects. Each participant in this study earned 2140 yen (on average).
3. Results
3.1. Descriptive Statistics
Of the 360 subjects in our experiment, we excluded eight subjects who switched back more than twice and four subjects who chose the safe option (Option A) among the 10 decisions in the risk attitude task (Task 1).9 As for the rest of the subjects, 320 did not switch back at all, while 28 subjects switched back once. For the subjects who switched back once, we followed the procedure in Lusk and Coble (2005), Harrison et al. (2007), and Anderson and Mellor (2008) [48,49,50] to calculate the range of relative risk attitude. Thus, the final sample size consisted of 348 subjects (59.77% males and 40.23% females).10
Table 2 provides the definitions of the variables used in this study. Table 3 and Table 4 present the descriptive statistics for the group-choice and individual-choice sub-samples, respectively (For each sub-sample, we compared the median rule condition and the random rule condition to determine if there was a population effect between the two conditions since the sessions of the median rule condition occurred at the Kochi University of Technology (87 subjects; 64.37% males) and Kyoto Sangyo University (90 subjects; 77.78% males). However, the random rule condition took place at Kansai University (171 subjects; 47.95% males). Based on our comparison, there was no significant difference between the conditions, except for the proportion of “Male” (the group-choice sub-sample: 78.26% males vs. 47.67% males, p < 0.01; and the individual-choice sub-sample: 63.53% males vs. 48.24% males, p < 0.01, using the chi-square test of independence).
3.2. Group Effect
3.2.1. Risk Attitude
To extract the effect of being assigned to groups, we conducted a regression model, controlling for several other factors. Since our dependent variable was left- and right-censored variables (values from 0 to 200), we ran a Tobit model, which is widely used in economic models. We estimated the coefficients in the investment regression, in which the independent variables include: the individual attitudes measured in Task 1; the “group-choice” dummy variables (whether assigned to the group-choice tasks); an interaction term between “group-choice” and “random rule”; the university dummy variables; and the gender dummy variables. Model 2 includes the independent variable of the contributions in the PGG (Task 2), for robustness checks in the regression. We also presented the marginal effects on the expected value of the censored outcome estimated after the Tobit model.
Table 5 presents the estimation results of the regression on investment, in which robust standard errors were utilized. Of primary interest is the estimated marginal effects of the “group-choice” variable. Based on the findings, we can confirm that it is negative and significant at the 0.05 level, which indicates that the subjects in the group were generally more risk-averse than individuals. According to the estimated marginal effects, the subjects were more likely to decrease their investment by approximately 20.3 yen (on average) in Model 1, and 19.9 yen in Model 2 (in which the subjects were asked to invest in their options, ranging from 0 yen to 200 yen in Task 3). Note that the estimated coefficients of the interaction term between “group-choice” and “random rule” were not significant in both models. These results indicate that the effects of being assigned to groups have the same impact, regardless of whether collective decision rules are adopted in investments.
As for the other independent variables, the marginal effects of risk attitude assessed by the CRRA were negative and significant at the 0.01 level, which indicates that the more risk-averse subjects tended to decrease their amount of investment. With regard to the gender effect, the males generally invested more than the females by approximately 20 yen (on average) in both models, at a significance level of 0.01.
3.2.2. Altruistic Preferences
In the previous section, we confirmed that the subjects who made decisions in a group tended to decrease their investment in both collective decision rules. As for the regression results of donation in Table 6,11 the subjects in the group-choice tasks significantly decreased their donation, compared to those in the individual-choice tasks, at a significance level of 0.05. For the regression results, the subjects in the group were more self-interested than individuals. On average, they decreased their donation by approximately 23.8 yen in Model 1 and 23.3 yen in Model 2 (the range of the donation choice was 0 yen to 200 yen in Task 4). We also found that the coefficients of the interaction term between “group-choice” and “random rule” were not statistically significant in the donation regression. These results indicate that the group effects were robust in both collective decision rules. Moreover, after comparing the estimated marginal effects of the “group-choice” variable and the mean of the two dependent variables, i.e., investment (mean = 113.89 yen) and donation (mean = 48.12 yen),12 the effects of being assigned to the groups on altruism were greater than those on risk attitudes (marginal effects; 20.3 yen on risk attitudes vs. 23.8 yen on altruism in Model 1).
For the other independent variables, the amount of contribution in the PGG was positively associated with the amount of donation, at a significance level of 0.01. To check the robustness of the donation regression, we controlled the subjects’ prosocial orientation in both models, measured by the SVO developed by Van Lange et al. (1997, 2007) [52,53]. In this case, the dummy variable of “Prosocial” equals 1 if the subjects were defined as “prosocial” in the SVO method, or 0 otherwise.13 The coefficients for both the “Contributions” and “Prosocial” variables were positive and statistically significant at the 0.01 level. Hence, we can capture and control the other aspects of altruism by introducing the “Prosocial” dummy variable, as defined in the SVO method.
3.3. Effect of the Collective Decision Rule
3.3.1. Risk Attitude
Based on the aforementioned result that the coefficients for the interaction term between “group-choice” and “random rule” were not significant in both investment and donation, it indicates that the group effects are robust and have the same impact on both collective decision rules. However, to determine more precisely whether there is no difference between the median and random rule on group decision-making, we extracted the “group-choice” sub-sample (N = 178) and ran a regression model by adding “random rule” dummy variables and “random rule” interaction terms to our model.14 In Table 7, Model 1 reports the regression results of investment, while Models 2 and 3 of donation regression for the “group-choice” sub-sample (Model 3 controls for individuals’ risk preferences).
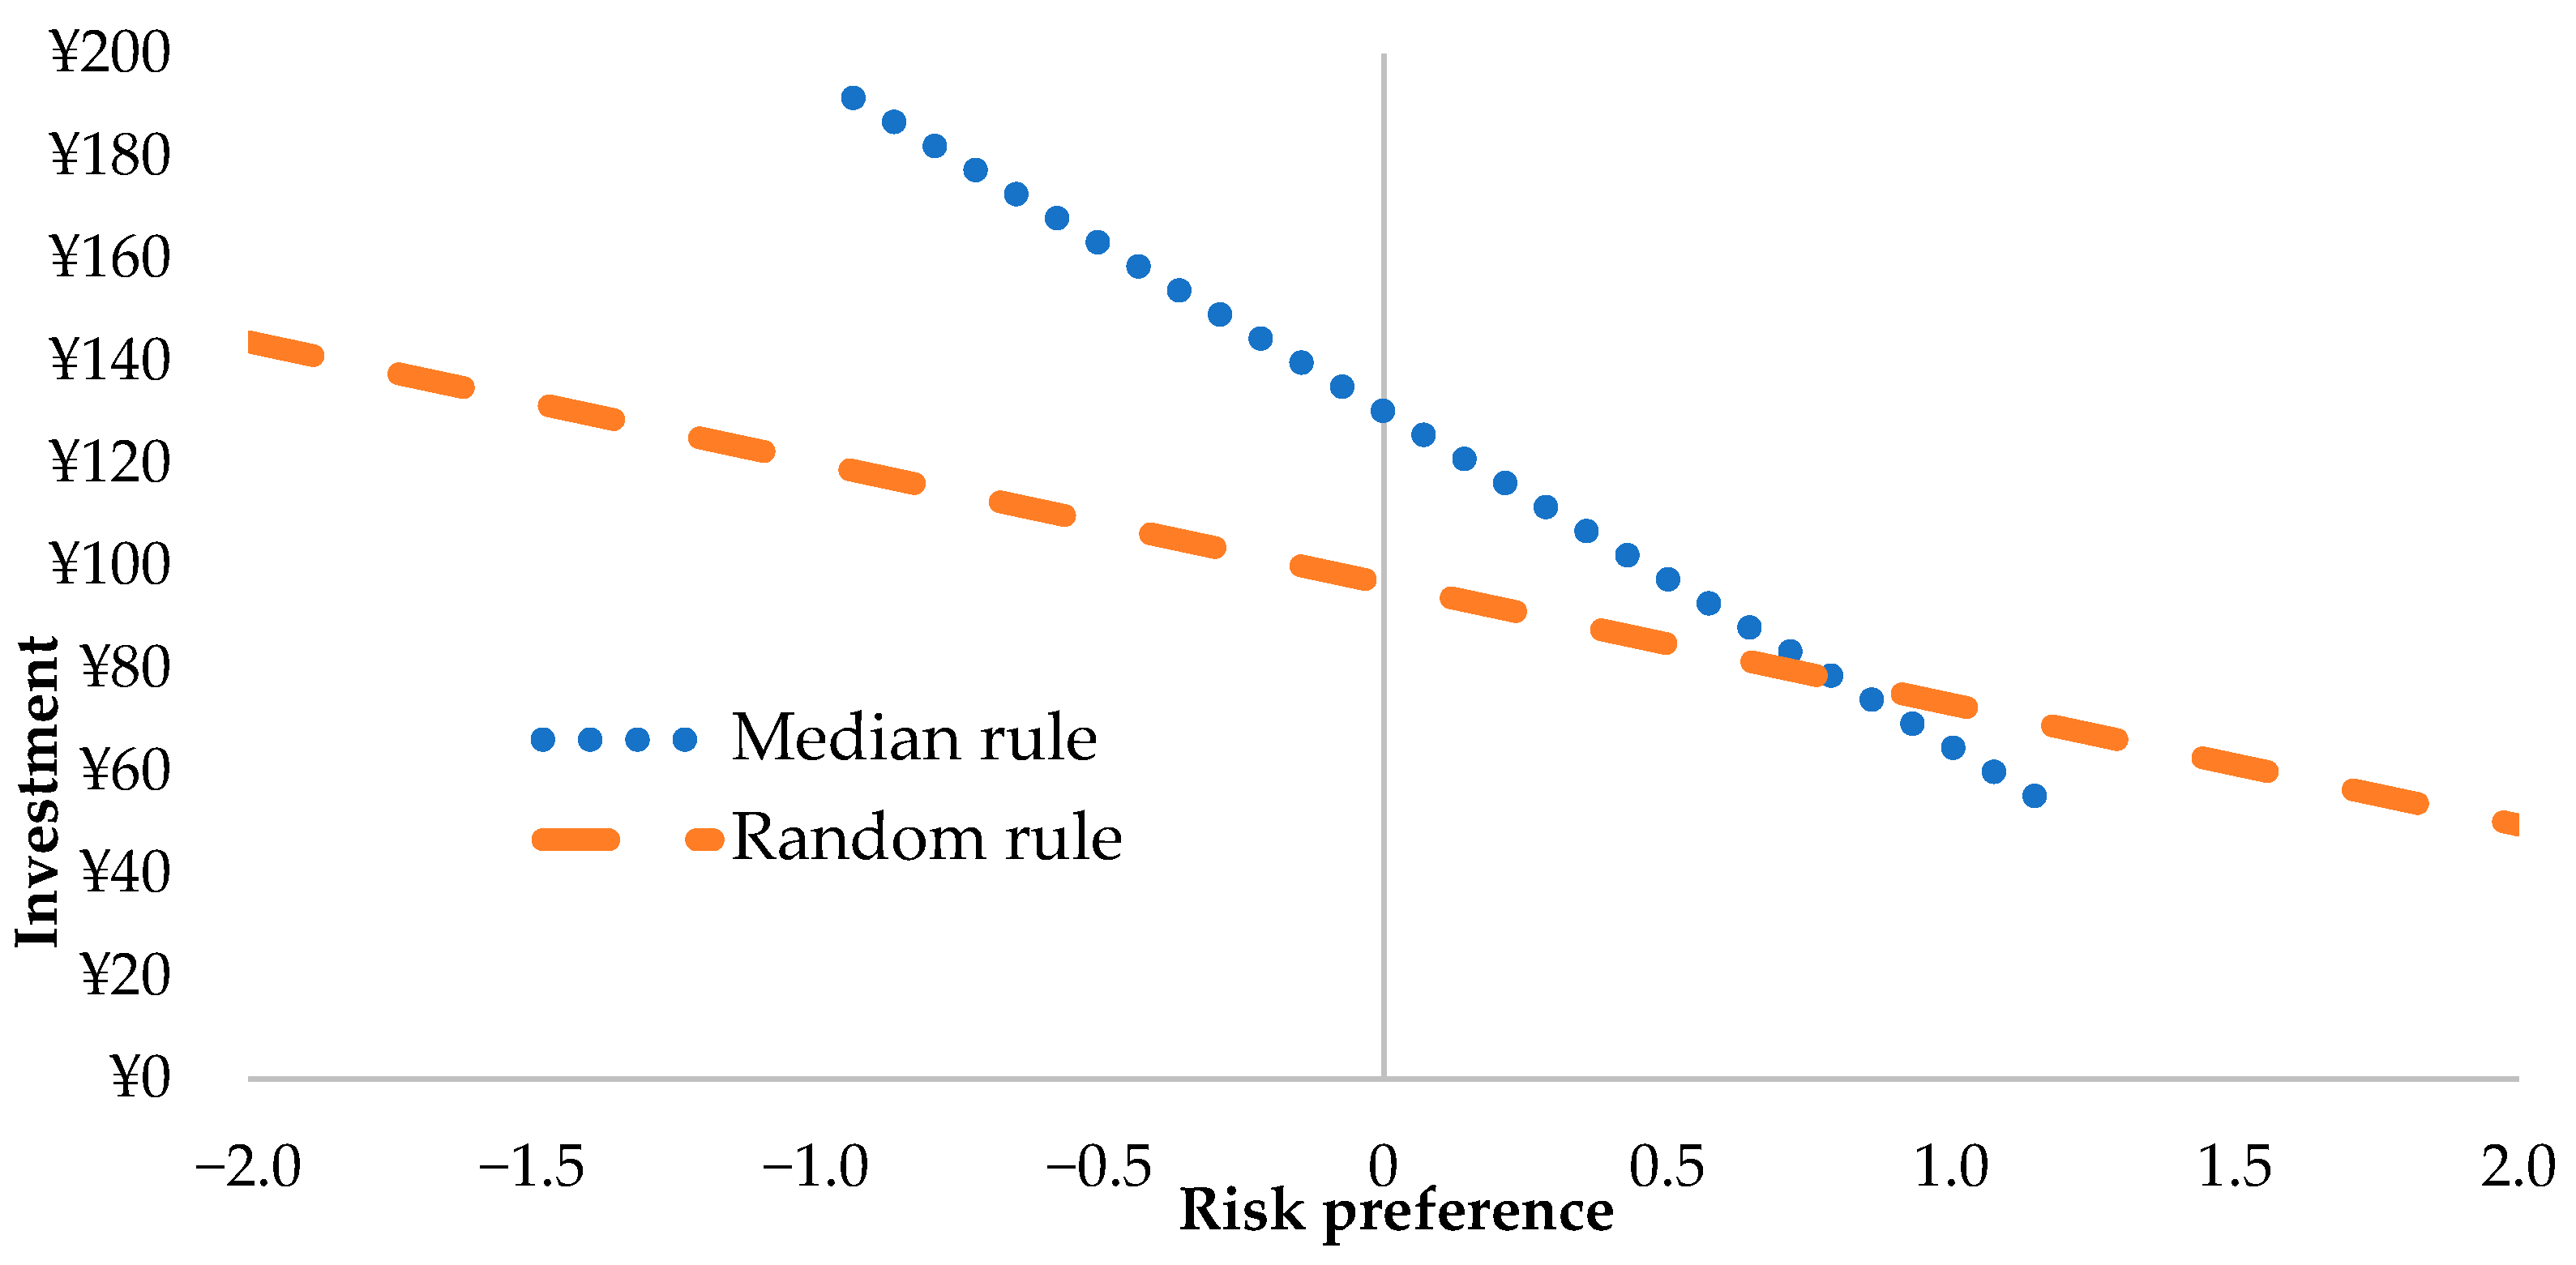
According to the results of investment (Model 1), the marginal effect of the “random rule” dummy variable was negative and significant at the 0.05 level. This indicates that the subjects were more likely to decrease their investment by approximately 30.7 yen (on average) when the random rule was adopted. In addition, the coefficients for the interaction term between “Random rule” and “Risk preference” were positive and significant at the 0.05 level. Regarding Figure 2,15 to aid the discussion, the risk-seeking subjects tended to decrease their investment more than the risk-averse subjects. In seeking a possible explanation for these results, we assumed that whereas the probability (one-third) that his/her choices were selected is obvious in the random rule, the probability of the selection is ambiguous in the median rule (MR). Hence, the group effects (the risk-averse shift in the groups) had a greater impact on the random rule than those on the MR, since the subjects realized that their choices may be selected for the group decisions. Furthermore, the risk-seeking subjects were more affected by the group effects than the risk-averse subjects, since the former probably understood that their preferences were relatively higher than those of the other subjects. Consequently, they decreased their investment to a large extent, i.e., they refrained from risk-taking behavior by considering the group decisions.
3.3.2. Altruistic Preferences
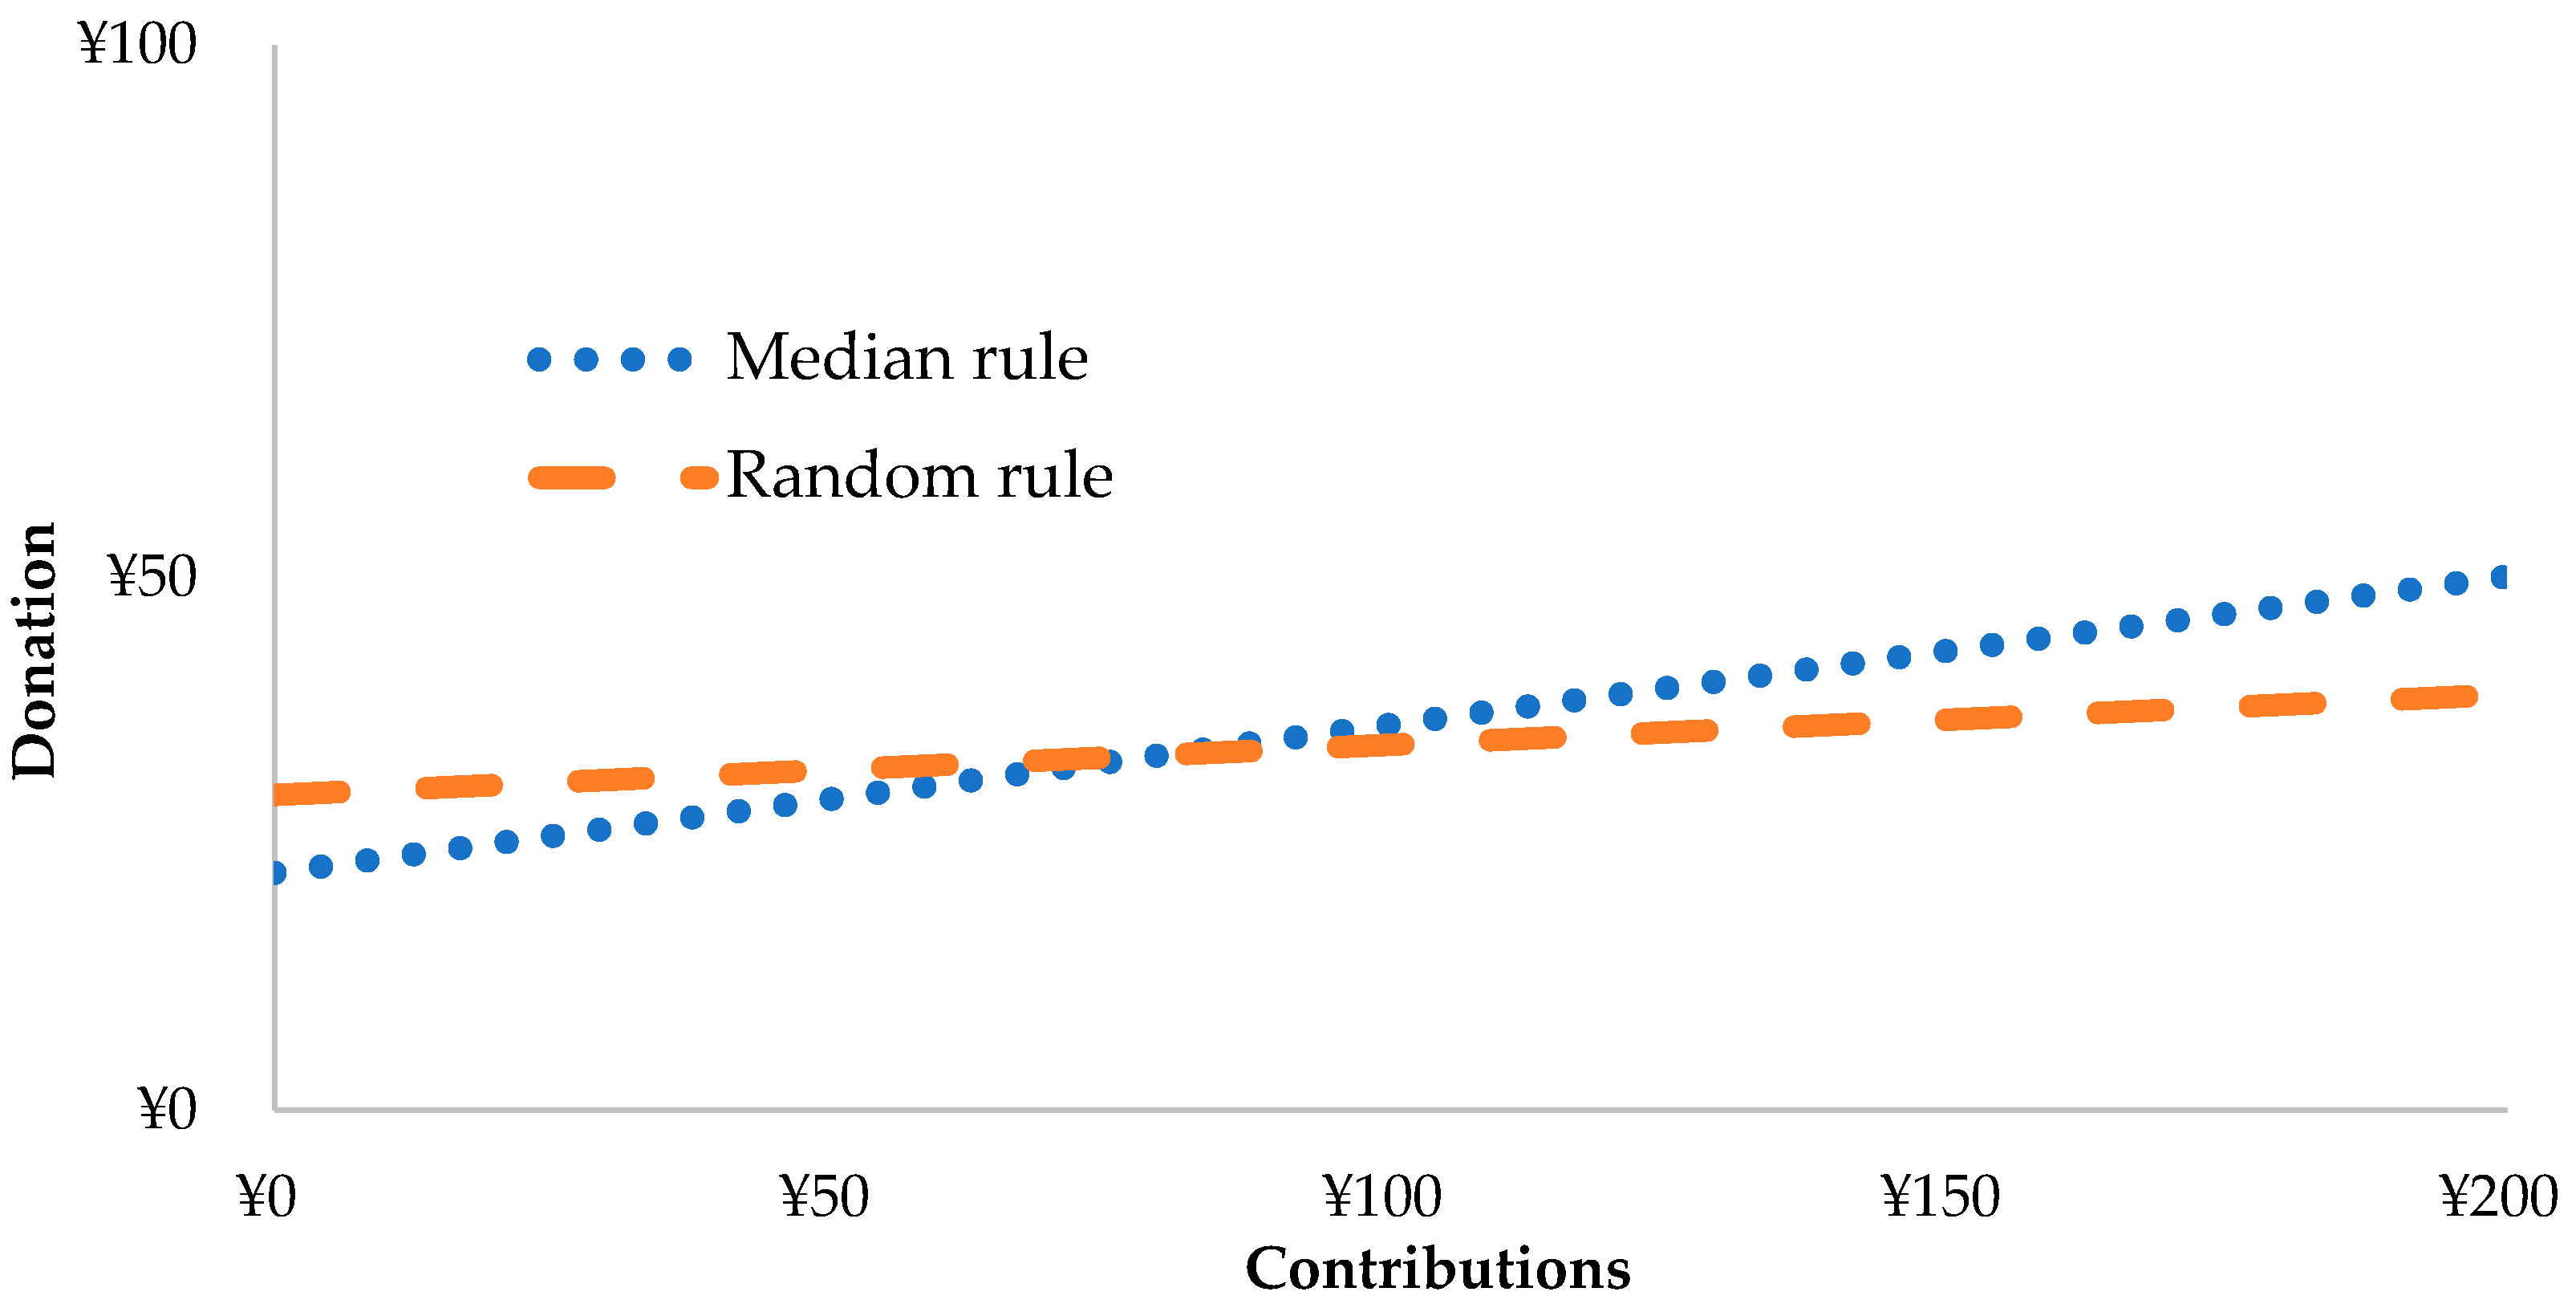
For the altruistic task, although Figure 3 suggests that the other-regarding subjects tended to decrease their level of donation more than the self-interested subjects in the random rule, the coefficients of the “random rule” dummy variables and the “random rule” interaction terms were not significant in all of the models in Table 7. Thus, we concluded that the significant difference between both rules that were previously captured was not observed in the donation task. We also conducted the same regression model for the individual-choice sub-sample (N = 170) in Table 8. We found that announcing the collective decision rule, i.e., the MR or the random rule, did not create a significant difference in the individual-choice tasks.
4. Conclusions
This study determined whether attitudes toward risk and altruism are affected by being in a group or being alone. Our experiment was designed to exclude the effects of informal discussions in a group by forbidding communication between the members of the group and adopting two collective decision rules, i.e., the median rule and the random rule, both of which enhanced the truth-telling mechanism at the time of group decision-making. Our results showed that the subjects who made decisions in a group tended to decrease their amount of investment and donation (on average) in both rules. These results are in line with previous economic literature (see Shupp & Williams, 2008; Luhan et al., 2009; Masclet et al., 2009 [34,35,41], as cited in the Introduction). However, the prior literature only discussed the communication effects and different “collective decision rules” to reach an agreement in group decision-making (e.g., majority rule, unanimity, dictator rule, etc.). In the present study, we found that the subjects’ were more risk-averse and self-interested when they were assigned to a group in which the members had a common interest in both the median and the random rule. In addition, upon comparing both rules, we found that the group effects (the risk-averse shift in investment) had a greater impact on the random rule than those on the MR and that the risk-seeking subjects were more affected by the group effects than the risk-averse subjects, i.e., they decreased their level of investment at a higher rate.
Overall, our results shed light on the “black box” of group decision-making, as mentioned in the Introduction. Ambrus et al. (2015) [56] found that median group members had a significant influence on group decisions via free discussions in the trust game and risk-tasking game of Holt and Laury (2002) [44], while Luhan et al. (2009) [41] reported that most self-interested group members had the greatest impact on group decisions via electronic chat in the dictator game. While the median group members in the prior works might have caused preference shifts when assigned to a group, these works only focused on how individual preferences were aggregated to the group attitude (i.e., preference aggregation). However, preference shifts might have also occurred by the existence of other group members. Therefore, we suggest that these two effects (i.e., preference shifts and aggregation) were most likely mixed up in prior research.
Author Contributions
Conceptualization, Y.K.; Methodology, Y.K.; Writing—review and editing, Y.K.; Funding acquisition, Y.K.; Investigation, T.T.; Formal analysis, T.T.; Writing—Original draft preparation, T.T.. All authors have read and agreed to the published version of the manuscript.
Funding
This research was funded by the Japan Society for the Promotion of Science (grant number 26285047).
Institutional Review Board Statement
This study was approved by the appropriate ethics review board of Kochi University of Technology (C12-13).
Informed Consent Statement
Informed consent was obtained from all subjects involved in the study.
Data Availability Statement
All of the data is available upon request.
Acknowledgments
We are grateful to the Kochi University of Technology, Kyoto Sangyo University (the Kyoto Experimental Economics Laboratory), and Kansai University (the Research Institute for Socio-network Strategies) for providing us with the opportunity to conduct our experiment.
Conflicts of Interest
The authors declare no conflict of interest.
Appendix A. Experiment Instructions (in English for the Median Rule)
Appendix A.1. Introduction
Thank you for participating in our experiment. I will now explain our experimental procedure. If you have any questions, then please raise your hand. Additionally, please do not communicate in any way with the other subjects and turn off your cell phones during the experiment. To start, ensure that the following materials are on your table:
- Instructions
- Experimental agreement form
- Receipt
- Ballpoint pen
Appendix A.2. Experimental Description
In this experiment, you will individually make four different types of decisions by using the computer in front of you. You will earn different amounts, depending on your decisions. At the end of the experiment, you will be paid in cash based on your decisions, as well as 1100 yen for participating in this experiment. Please make your decision to earn as much money as possible.
Now, the first experiment will begin. In the remainder of these instructions, “Player” indicates the subjects who make decisions in the experiment, and “Experimenter” indicates the non-players who are experimenting. You can stop participating in the experiment at any time.
Appendix A.3. Experimental Tasks
Appendix A.3.1. Task 1
In this task, the Player chooses between Option A and Option B in Figure A1 as follows:
Figure A1.
Choosing between Options A and B for Task 1.

For example, in Question 1, both options are as follows: there is a 10% possibility of earning 200 yen or a 90% possibility of earning 160 yen (Option A). On the contrary, there is a 10% possibility of earning 380 yen or a 90% possibility of earning 10 yen (Option B). After making the decisions from Questions 1 to 10, one question will be randomly chosen by the computer for payment at the end of the experiment. Specifically, if the computer were to choose Question 5, then the Player who preferred Option A would have a 50% possibility of earning 200 yen or a 50% possibility of earning 160 yen. Similarly, the Player who preferred Option B would have a 50% possibility of earning 380 yen or a 50% possibility of earning 10 yen.
If you have any questions about this task, then please simply raise your hand. You now have 1 min to consider Task 1.
After this instruction, all 10 questions and options will appear on your computer, as shown in Figure A2. Please make all of your decisions and click the OK button on the bottom right of your screen after inputting your decisions.
Figure A2.
Computer screen for Task 1.

Appendix A.3.2. Task 2
Each Player has a 200-yen endowment and will be randomly assigned to a group of three people. The Player will decide how much of the 200-yen endowment to keep or invest in the group project. The payment will be determined by the contributions of each member being doubled and evenly divided between the members of the group as follows:
Your earnings = (All contributions in your group × 2 ÷ 3) + (200 − Your investment)
For example, if each member were to invest the same amount of 200 yen in the group project, then each member will earn 400 yen. For another example, if no members were to invest in the group project, then each member will earn 200 yen.
Exercise 1
In a certain group, if one member were to invest 120 yen and two members were to invest 60 yen in their group project, then how much money will each group member earn in Task 2?
- ○
- Member investing 120 yen: yen
- ○
- Member investing 60 yen: yen
Exercise 2
In a given group, if two members were to invest 180 yen and one member were to invest nothing in his/her group project, then how much money will each group member earn in Task 2?
- ○
- Member investing 180 yen: yen
- ○
- Member investing nothing at all: yen
If you have any questions, then please simply raise your hand. You now have 1 min to consider Task 2.
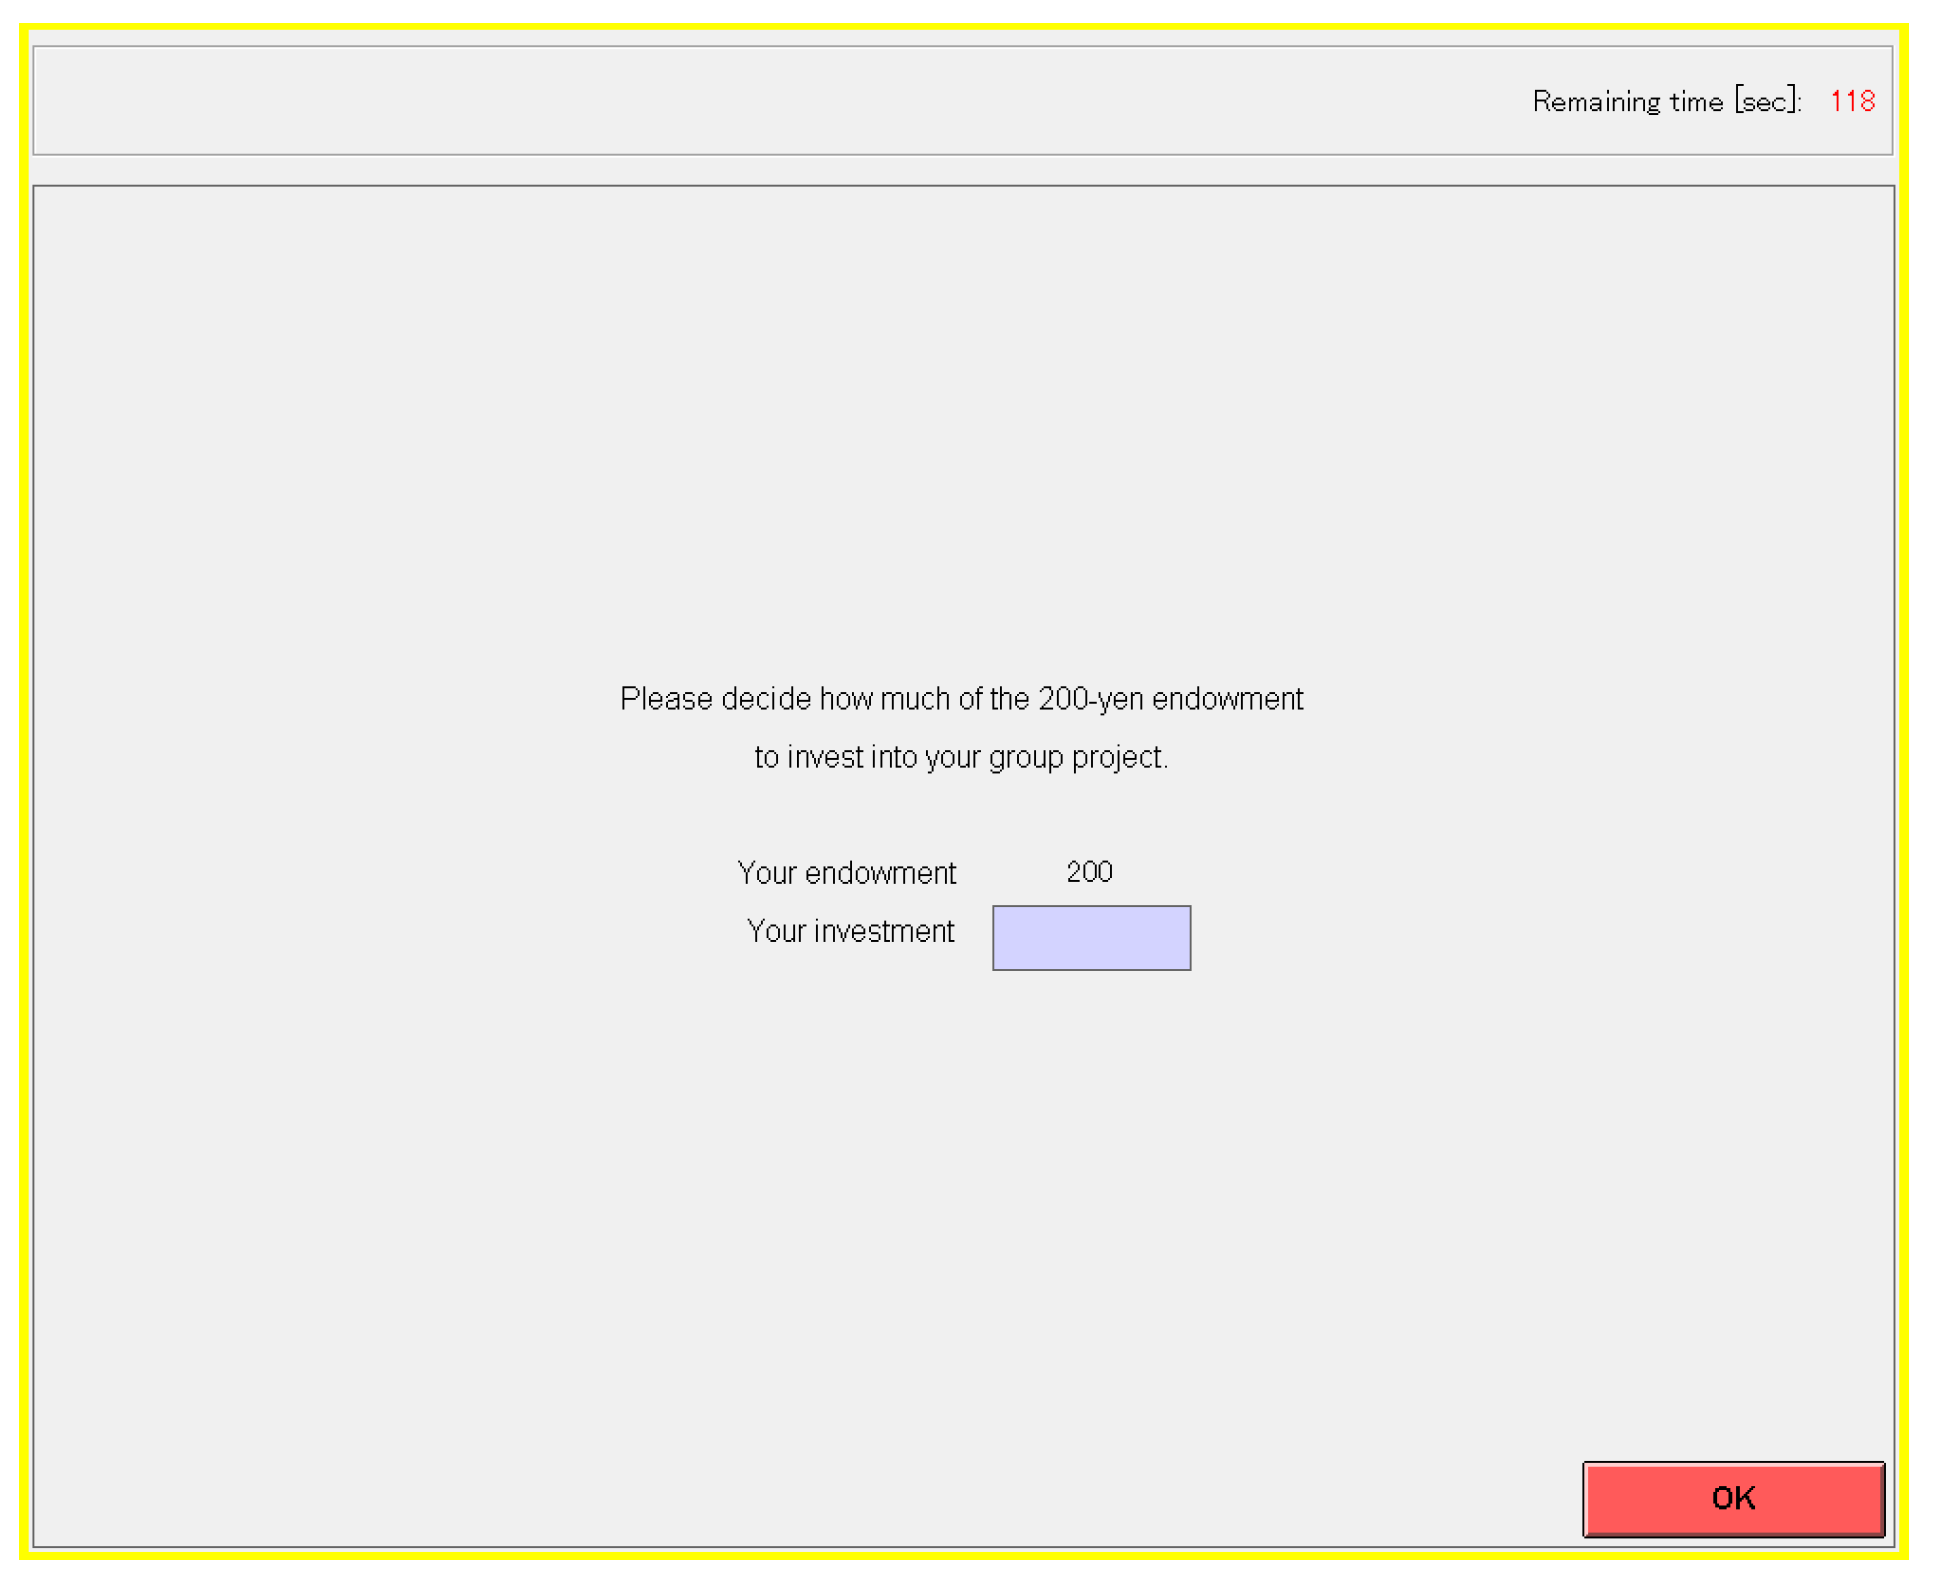
After this instruction, the screen will change on your computer, as shown in Figure A3. Please decide how much money to invest in your group project, ranging from 0 yen to 200 yen (in intervals of 10 yen). Click the OK button on the bottom right of your screen after inputting your decision.
Figure A3.
Computer screen for Task 2.

In Tasks 3 and 4, the subjects will be randomly divided into two groups: individual-choice and group-choice tasks. The subjects who are assigned to the individual-choice task will make decisions alone until the end of the experiment, whereas the subjects assigned to the group-choice task will make decisions in a group until the end of the experiment.
Individual-Choice Task
The subjects assigned to the individual-choice task will decide by themselves for each task, according to their preferences.
Group-Choice Task
The subjects will be randomly assigned to groups, each comprising three people. The group members will remain the same until the end of the experiment. The subjects in the group-choice task will make decisions according to their preferences and share common interests with the other group members for each task. The group decision will be based on the median rule by the group members, after which each team member will receive the same payoff. We now introduce the members of each group to one another. Please stand up and show your face to the other members when your number is called. Meanwhile, please do not communicate with the other members and subjects during the experiment.
Appendix A.3.3. Task 3
Individual-Choice Task
The Player has a 200-yen endowment and will decide how much of this endowment to invest in the Option as follows. There is a 50% possibility of winning 2.5 times your invested amount or a 50% possibility of losing your entire investment.
Your earnings = 200 − Your investment + Profit from the Option
Group-Choice Task
The Player and the other members of the group each have a 200-yen endowment. You will decide how much of this endowment to invest in the Option, as mentioned below. The group decision is based on the median rule by the group members, after which each group member will receive the same payoff. For example, if the three group members were to decide to invest 0 yen, 50 yen, and 100 yen, respectively, then the group investment decision in the Option will be 50 yen.
Please decide according to your desired level of investment in this Option.
Your earnings = 200 − The amount of group decision of investment + Profit from the Option
Note: About the median value.
The median value is the middle value in the sorted order of values. For example, when the observed number in the sorted order is {0, 30, 80, 100, 200}, then the median value is 80.
If you have any questions, then please simply raise your hand. We now have 1 min to consider Task 3.
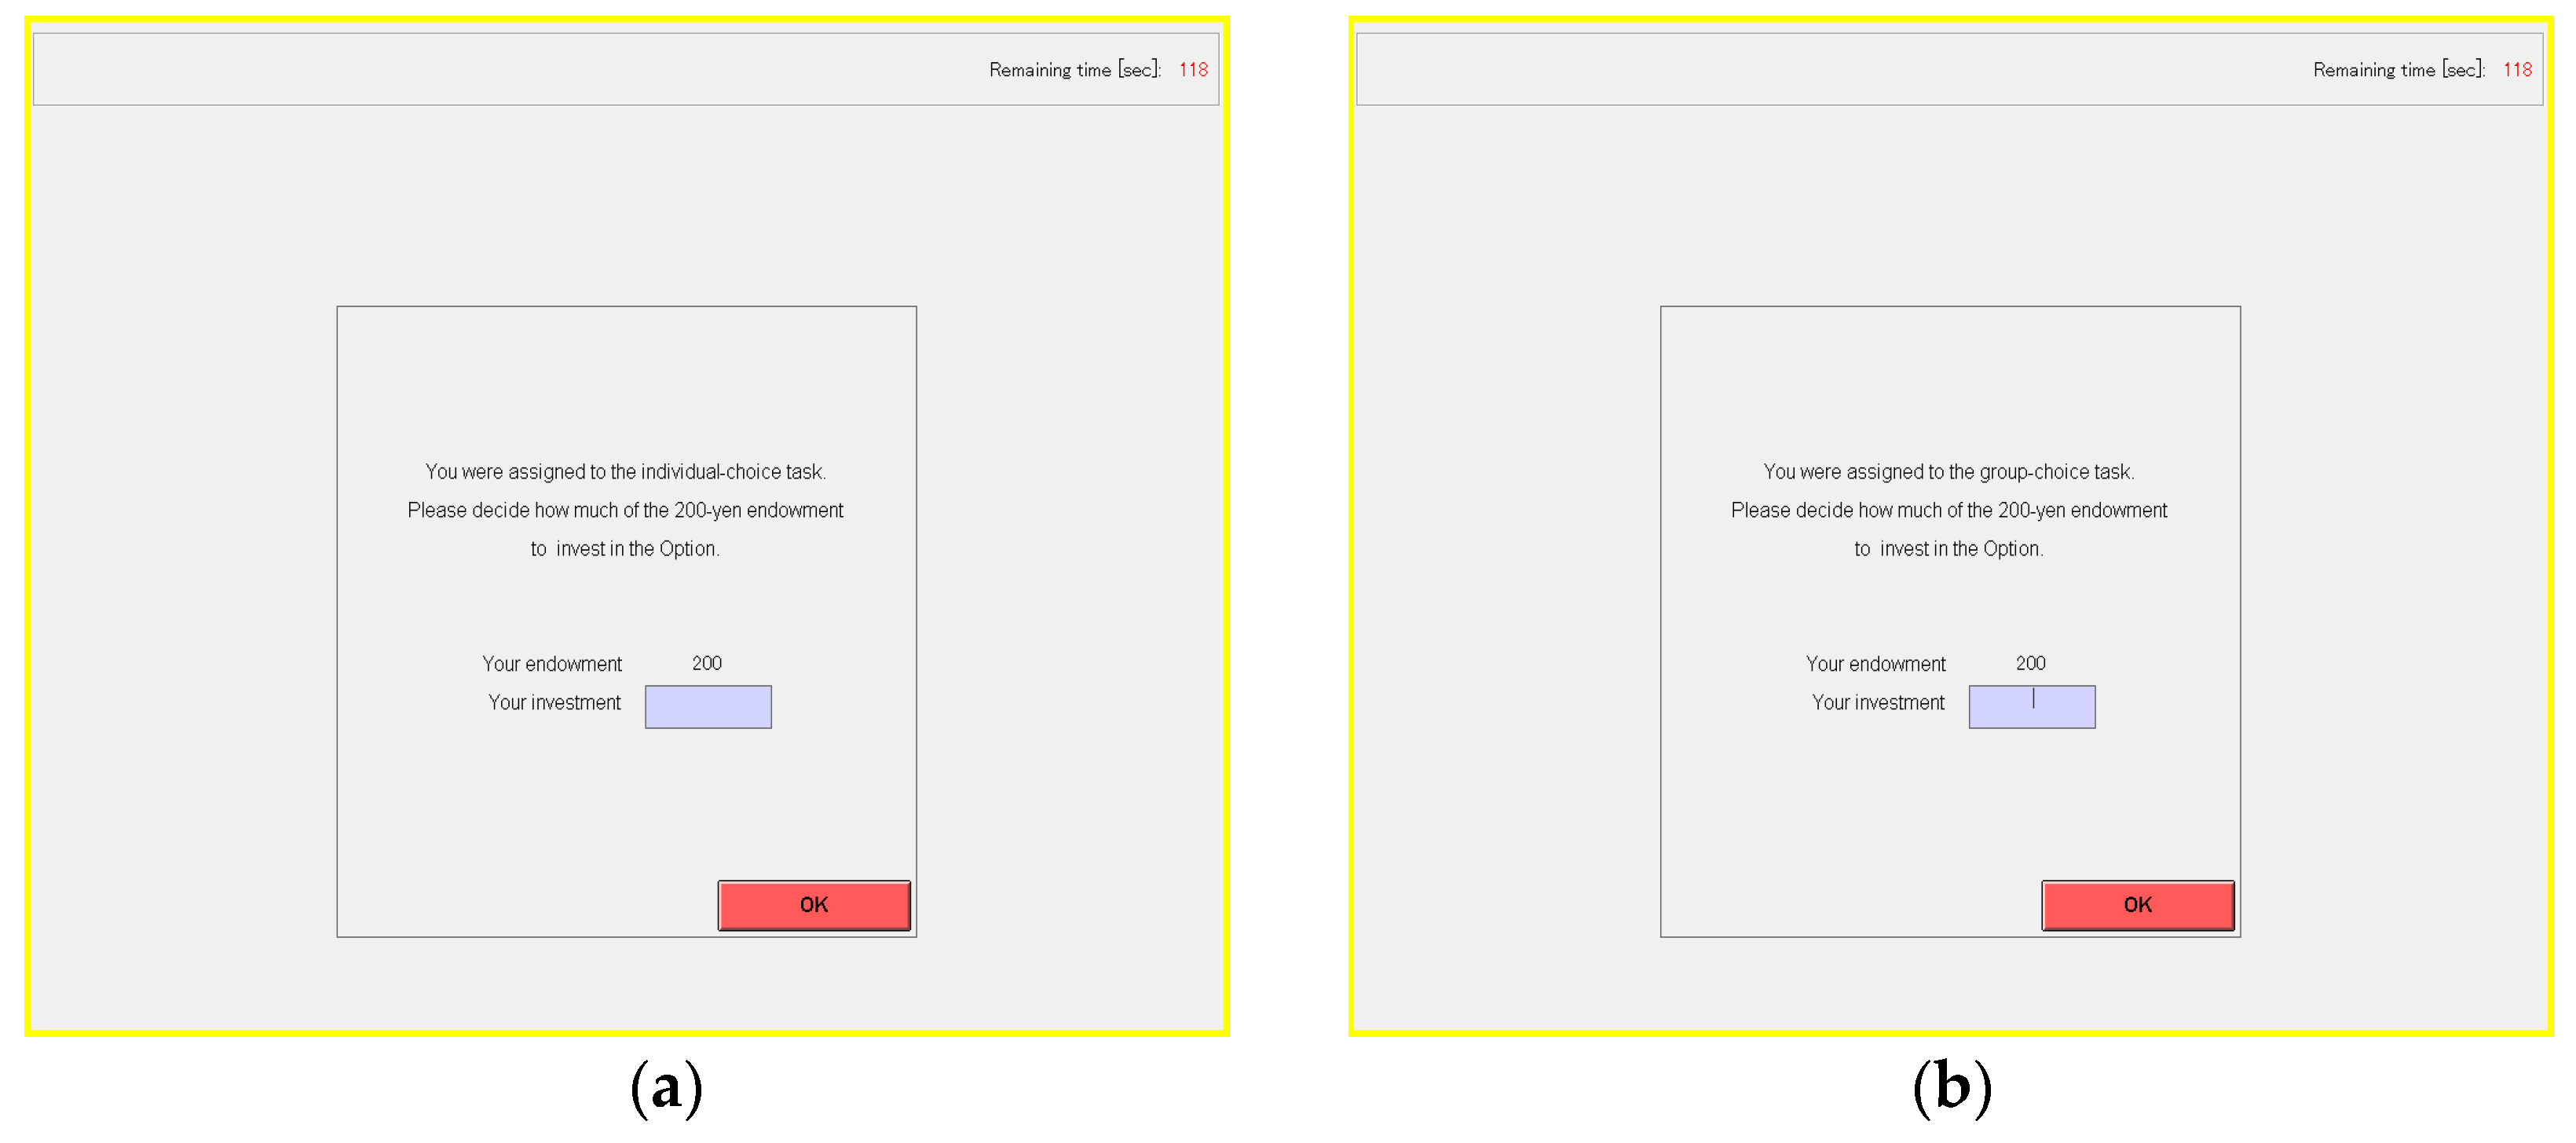
After this instruction, the screen will change on your computer, as shown in Figure A4. Please decide how much money to invest in this Option, ranging from 0 yen to 200 yen (in intervals of 10 yen). Click the OK button on the bottom right of your screen after inputting your decision.
Figure A4.
Computer screen for Task 3: (a) For the individual-choice task; (b) For the group-choice task.
Figure A4.
Computer screen for Task 3: (a) For the individual-choice task; (b) For the group-choice task.

Appendix A.3.4. Task 4
Individual-Choice Task
The Player has a 200-yen endowment and will decide how much of this endowment to donate to the Japanese Red Cross Society. The Experimenter will donate the amount of the contribution that was decided in this task to the Japanese Red Cross Society.
Your earnings = 200 − Your Donation
Group-Choice Task
The Player and other members of the group each have a 200-yen endowment. You will decide how much of this endowment to donate to the Japanese Red Cross Society. The group decision will be based on the median rule by the group members, after which each group member will receive the same payoff. For example, if the three group members were to decide to denote 0 yen, 50 yen, and 100 yen, respectively, then the group’s donation decision will be 50 yen. Please decide according to your desired level of donation to the Japanese Red Cross Society.
Your earnings = 200 − The donation amount decided by the group
Note: About the Japanese Red Cross Society (a direct quote from the website).
The Japanese Red Cross Society provides protection and assistance to those suffering from conflicts, disasters, and diseases. We would appreciate your donation, blood donation, or volunteering with us.
If you have any questions, then please simply raise your hand. We now have 1 min to consider Task 4.
After this instruction, the screen will change on your computer, as shown in Figure A5. Please decide how much money to donate to the Japanese Red Cross Society, ranging from 0 yen to 200 yen (in intervals of 10 yen). Click the OK button on the bottom right of your screen after inputting your decision.
Figure A5.
Computer screen for Task 4: (a) For individual-choice task; (b) For group-choice task.

Appendix B. Experiment Instructions (in English for the Random Rule)
Appendix B.1. Introduction
Thank you for participating in our experiment. I will now explain our experimental procedure. If you have any questions, then please raise your hand. Additionally, please do not communicate in any way with the other subjects and turn off your cell phones during the experiment. To start, ensure that the following materials are on your table:
- Instructions
- Experimental agreement form
- Receipt
- Ballpoint pen
Appendix B.2. Experimental Description
In this experiment, you will individually make four different types of decisions by using the computer in front of you. You will earn different amounts, depending on your decisions. At the end of the experiment, you will be paid in cash based on your decisions, as well as 1100 yen for participating in this experiment. Please make your decision to earn as much money as possible.
Now, the first experiment will begin. In the remainder of these instructions, “Player” indicates the subjects who make decisions in the experiment, and “Experimenter” indicates the non-players who are experimenting. You can stop participating in the experiment at any time.
Appendix B.3. Experimental Tasks
Appendix B.3.1. Task 1
In this task, the Player chooses between Option A and Option B as Figure A1.
For example, in Question 1, both options are as follows: there is a 10% possibility of earning 200 yen or a 90% possibility of earning 160 yen (Option A). On the contrary, there is a 10% possibility of earning 380 yen or a 90% possibility of earning 10 yen (Option B). After making the decisions from Questions 1 to 10, one question will be randomly chosen by the computer for payment at the end of the experiment. Specifically, if the computer were to choose Question 5, then the Player who preferred Option A would have a 50% possibility of earning 200 yen or a 50% possibility of earning 160 yen. Similarly, the Player who preferred Option B would have a 50% possibility of earning 380 yen or a 50% possibility of earning 10 yen.
If you have any questions about this task, then please simply raise your hand. You now have 1 min to consider Task 1.
After this instruction, all 10 questions and options will appear on your computer, as shown in Figure A2. Please make all of your decisions and click the OK button on the bottom right of your screen after inputting your decisions.
Appendix B.3.2. Task 2
Each Player has a 200-yen endowment and will be randomly assigned to a group of three people. The Player will decide how much of the 200-yen endowment to keep or invest in the group project. The payment will be determined by the contributions of each member being doubled and evenly divided between the members of the group as follows:
Your earnings = (All contributions in your group × 2 ÷ 3) + (200 − Your investment)
For example, if each member were to invest the same amount of 200 yen in the group project, then each member will earn 400 yen. For another example, if no members were to invest in the group project, then each member will earn 200 yen.
Exercise 1
In a certain group, if one member were to invest 120 yen and two members were to invest 60 yen in their group project, then how much money will each group member earn in Task 2?
- ○
- Member investing 120 yen: yen
- ○
- Member investing 60 yen: yen
Exercise 2
In a given group, if two members were to invest 180 yen and one member were to invest nothing in his/her group project, then how much money will each group member earn in Task 2?
- ○
- Member investing 180 yen: yen
- ○
- Member investing nothing at all: yen
If you have any questions, then please simply raise your hand. You now have 1 min to consider Task 2.
After this instruction, the screen will change on your computer, as shown in Figure A3. Please decide how much money to invest in your group project, ranging from 0 yen to 200 yen (in intervals of 10 yen). Click the OK button on the bottom right of your screen after inputting your decision.
In Tasks 3 and 4, the subjects will be randomly divided into two groups: individual-choice and group-choice tasks. The subjects who are assigned to the individual-choice task will make decisions alone until the end of the experiment, whereas the subjects assigned to the group-choice task will make decisions in a group until the end of the experiment.
Individual-Choice task
The subjects assigned to the individual-choice task will decide by themselves for each task, according to their preferences.
Group-Choice Task
The subjects will be randomly assigned to groups, each comprising three people. The group members will remain the same until the end of the experiment. The subjects in the group-choice task will make decisions according to their preferences and share common interests with the other group members for each task. The group decision will be determined based on the choice of group members, randomly selected with a one-third chance, and each team member receives the same payoff in the group-decision tasks. We now introduce the members of each group to one another. Please stand up and show your face to the other members when your number is called. Meanwhile, please do not communicate with the other members and subjects during the experiment.
Appendix B.3.3. Task 3
Individual-Choice Task
The Player has a 200-yen endowment and will decide how much of this endowment to invest in the Option as follows: There is a 50% possibility of winning 2.5 times your invested amount or a 50% possibility of losing your entire investment.
Your earnings = 200 − Your investment + Profit from the Option
Group-Choice Task
The Player and the other members of the group each have a 200-yen endowment. You will decide how much of this endowment to invest in the Option, as mentioned below. The group decision is determined based on the choice of group members, randomly selected with a one-third chance and each group member will receive the same payoff. Please decide according to your desired level of investment in this Option.
Your earnings = 200 − The amount of group decision of investment + Profit from the Option
If you have any questions, then please simply raise your hand. We now have 1 min to consider Task 3.
After this instruction, the screen will change on your computer, as shown in Figure A4. Please decide how much money to invest in this Option, ranging from 0 yen to 200 yen (in intervals of 10 yen). Click the OK button on the bottom right of your screen after inputting your decision.
Appendix B.3.4. Task 4
Individual-Choice Task
The Player has a 200-yen endowment and will decide how much of this endowment to donate to the Japanese Red Cross Society. The Experimenter will donate the amount of the contribution that was decided in this task to the Japanese Red Cross Society.
Your earnings = 200 − Your Donation
Group-Choice Task
The Player and other members of the group each have a 200-yen endowment. You will decide how much of this endowment to donate to the Japanese Red Cross Society. The group decision is determined based on the choice of group members, randomly selected with a one-third chance and each group member will receive the same payoff. Please decide according to your desired level of donation to the Japanese Red Cross Society.
Your earnings = 200 − The amount of group decision of donation
Note: About the Japanese Red Cross Society (a direct quote from the website).
The Japanese Red Cross Society provides protection and assistance to those suffering from conflicts, disasters, and diseases. We would appreciate your donation, blood donation, or volunteering with us.
If you have any questions, then please simply raise your hand. We now have 1 min to consider Task 4.
After this instruction, the screen will change on your computer, as shown in Figure A5. Please decide how much money to donate to the Japanese Red Cross Society, ranging from 0 yen to 200 yen (in intervals of 10 yen). Click the OK button on the bottom right of your screen after inputting your decision.
| 1 | In social psychology, the two main explanations for these shifts are social comparison theory (Levinger & Schneider, 1969) [3] and persuasive argument theory (Burnstein et al., 1973; Brown, 1974) [4,5]. Social comparison theory states that people are motivated to perceive and present themselves in a socially desirable way. According to persuasive argument theory, group decisions lead to a particular direction because once certain novel arguments are shared during group discussions, these arguments persuade other group members on the issue. |
| 2 | |
| 3 | In line with peer effects research, the presence of peers influences group decision-making related to risk via group discussions and interactions (Gardner & Steinberg, 2005; Blakemore et al., 2012; Albert et al., 2011; Bougheas et al., 2013; Pincham et al., 2015; Gioia, 2017; Van Hoorn et al., 2017; Haller et al., 2018; Zhang & Zhu, 2021; Zhang et al., 2022) [10,11,12,13,14,15,16,17,18,19]. Additionally, Braams et al. (2019) and Osmont et. al (2020) [20,21] showed that peers’ perceived choices affect the decisions of others. Moreover, altruistic preferences are influenced by peer effects via group interactions (Guroglu et al., 2015; Burnett-Heyes et al., 2015; Van Hoorn et al., 2016; Xiong et al., 2020; Bourlès, et al., 2021; Chennells et al., 2022) [22,23,24,25,26,27]. |
| 4 | Another perspective in economic studies of group decision-making is determining whether groups are more rational than individuals (Bornstein & Yaniv, 1998; Cox & Hayne, 2006; Kocher & Sutter, 2005; Song, 2008) [28,29,30,31]. Charness and Sutter (2012) [32] concluded that group decision-making is more likely close to standard game-theoretic predictions; groups are more cognitively sophisticated and productive (due to peer effects) while having more self-interested preferences. |
| 5 | The individual and group choice tasks were conducted in the same session while the instruction sheets the subjects received were identical (see Appendix A and Appendix B). |
| 6 | Regarding group decision-making without anonymity, Shupp and Williams (2008), Baker et al. (2008), Rockenbach et al. (2007), and Cason and Mui (1997) [33,34,37,40] used face-to-face discussions with group members to examine the preferential differences toward risk or altruism between the individuals and groups as mentioned in the Introduction. |
| 7 | He and Villeval (2014) [46] reported that, in groups, people tend to make very different choices between first and final choices, especially after observing the other member’s choices in an ultimatum game and a modified dictator game. While the authors investigated how individual preferences were aggregated in groups, the present study aimed to examine the subjects’ preferential differences in deciding whether to be alone or in a group. Thus, we focused on their choices in each one-shot decision. |
| 8 | Our subjects were from various disciplines (economics, management, law, literature, science, etc.), and they had native-level Japanese language skills (almost all of our subjects were Japanese undergraduate students). |
| 9 | As choosing a safe option in the tenth decision means preferring a certain 200 yen over a certain 380 yen, we interpreted this as a sign that the subject did not understand the instructions (Anderson & Mellor, 2008 p. 1265) [48]. |
| 10 | We determined the lower bound of the range by the first choice of the risky option and the upper bound by the last choice of the safe option (Anderson & Mellor, 2008, p. 1265) [48]. |
| 11 | |
| 12 | The mean values of the investment and donation variables for individual choice are 113.89 yen and 48.12 yen, respectively, while those for group choice are 93.48 yen and 31.52 yen, respectively. |
| 13 | In our sample, approximately 45.1% of the subjects were defined as “prosocial.” This ratio is consistent with Au and Kwong (2004) [54], who reported that roughly 45% were categorized as “prosocial” (on average) in various studies. |
| 14 | Our study excluded the university dummy variables from the model as the random rule conditions were only performed at Kansai University. |
| 15 | We take values of −2 and 2 for choosing the risky option in Decision 1 and the safe option in Decision 10, respectively, as the midpoints of the CRRA interval, following Reynaud and Couture (2012) [55]. |
References
- Stoner, J.A.F. A Comparison of Individuals and Group Decisions Involving Risk. Unpublished. Master’s Thesis, Massachusetts Institute of Technology, Cambridge, MA, USA, 1961. [Google Scholar]
- Moscovici, S.; Zavalloni, M. The group as a polarizer of attitudes. J. Pers. Soc. Psychol. 1969, 12, 125–135. [Google Scholar] [CrossRef]
- Levinger, G.; Schneider, D.J. Test of the “risk is value” hypothesis. J. Pers. Soc. Psychol. 1969, 11, 165–169. [Google Scholar] [CrossRef]
- Burnstein, E.; Vinokur, A.; Trope, Y. Interpersonal comparisons versus persuasive argument: A more direct test of alternative explanations for group-induced shifts in individual choices. J. Exp. Soc. Psychol. 1973, 9, 236–245. [Google Scholar] [CrossRef]
- Brown, R. Further comment on the risky shift. Am. Psychol. 1974, 29, 468–470. [Google Scholar] [CrossRef]
- Kerr, L.N.; MacCoun, R.J.; Kramer, G.P. Bias in judgment: Comparing individuals and groups. Psychol. Rev. 1996, 103, 687–719. [Google Scholar] [CrossRef]
- Sunstein, C.R. Deliberative trouble? Why groups go to extremes. Yale Law J. 2000, 110, 71–119. [Google Scholar] [CrossRef]
- Sunstein, C.R. The law of group polarization. J. Political Philos. 2002, 10, 175–195. [Google Scholar] [CrossRef]
- Manin, B. Deliberation: Why We Should Focus on Debate Rather than Discussion; Paper delivered at the Program in Ethics and Public Affairs Seminar; Princeton University: Princeton, NJ, USA, 2005. [Google Scholar]
- Gardner, M.; Steinberg, L. Peer influence on risk taking, risk preference, and risky decision making in adolescence and adulthood: An experimental study. Dev. Psychol. 2005, 41, 625–635. [Google Scholar] [CrossRef]
- Albert, D.; Steinberg, L. Judgment and decision making in adolescence. J. Res. Adolesc. 2011, 21, 211–224. [Google Scholar] [CrossRef]
- Blakemore, S.; Robbins, T.W. Decision-making in the adolescent brain. Nat. Neurosci. 2012, 15, 1184–1191. [Google Scholar] [CrossRef]
- Bougheas, S.; Nieboer, J.; Sefton, M. Risk-taking in social settings: Group and peer effects. J. Econ. Behav. Organ. 2013, 92, 273–283. [Google Scholar] [CrossRef] [PubMed]
- Pincham, H.L.; Wu, C.; Killikelly, C.; Vuillier, L.; Fearon, R.M. Social provocation modulates decision making and feedback processing: Examining the trajectory of development in adolescent participants. Dev. Cogn. Neurosci. 2015, 15, 58–66. [Google Scholar] [CrossRef] [PubMed]
- Gioia, F. Peer effects on risk behaviour: The importance of group identity. Exp. Econ. 2017, 20, 100–129. [Google Scholar] [CrossRef]
- Van Hoorn, J.; Crone, E.A.; Van Leijenhorst, L. Hanging out with the right crowd: Peer influence on risk-taking behavior in adolescence”. J. Res. Adolesc. 2017, 27, 189–200. [Google Scholar] [CrossRef]
- Haller, S.P.W.; Bang, D.; Bahrami, B.; Lau, J.Y.F. Group decision-making is optimal in adolescence. Sci. Rep. 2018, 8, 15565. [Google Scholar] [CrossRef]
- Zhang, W.; Zhu, L. The influence of peers on adolescents’ risk-taking behavior and its mechanism. Adv. Psychol. Sci. 2021, 29, 1462–1471. [Google Scholar] [CrossRef]
- Zhang, W.; Jiang, Y.; Wang, C.; Zhu, L. Group decision-making on risky choice in adolescents and young adults. Curr. Psychol. 2022, 1–10. [Google Scholar] [CrossRef]
- Braams, B.R.; Davidow, J.Y.; Somerville, L.H. Developmental patterns of change in the influence of safe and risky peer choices on risky decision-making”. Dev. Sci. 2019, 22, e12717. [Google Scholar] [CrossRef]
- Osmont, A.; Camarda, A.; Habib, M.; Cassotti, M. Peers’ choices influence adolescent risk-taking especially when explicit risk information is lacking. J. Res. Adolesc. 2021, 31, 402–416. [Google Scholar] [CrossRef]
- Guroglu, B.; van den Bos, W.; Crone, E.A. Fairness considerations: Increasing understanding of intentionality during adolescence. J. Exp. Child Psychol. 2009, 104, 398–409. [Google Scholar] [CrossRef]
- Burnett Heyes, S.; Jih, Y.R.; Block, P.; Hiu, C.F.; Holmes, E.A.; Lau, J.Y. Relationship reciprocation modulates resource allocation in adolescent social networks: Developmental effects. Child Dev. 2015, 86, 1489–1506. [Google Scholar] [CrossRef] [PubMed]
- Van Hoorn, J.; van Dijk, E.; Meuwese, R.; Rieffe, C.; Crone, E.A. Peer Influence on Prosocial Behavior in Adolescence. J. Res. Adolesc. 2016, 26, 90–100. [Google Scholar] [CrossRef]
- Bourlès, R.; Bramoullé, Y.; Perez-Richet, E. Altruism and Risk Sharing in Networks. J. Eur. Econ. Assoc. 2021, 19, 1488–1521. [Google Scholar] [CrossRef]
- Chennells, M.; Wozniak, M.; Butterfill, S.; Michael, J. Coordinated decision-making boosts altruistic motivation-But not trust. PLoS ONE 2022, 17, e0272453. [Google Scholar] [CrossRef] [PubMed]
- Xiong, W.; Gao, X.; He, Z.; Yu, H.; Liu, H.; Zhou, X. Affective evaluation of others’ altruistic decisions under risk and ambiguity. Neuroimage 2020, 218, 116996. [Google Scholar] [CrossRef]
- Bornstein, G.; Yaniv, I. Individual and group behavior in the ultimatum game: Are groups more “rational” players? Exp. Econ. 1998, 1, 101–108. [Google Scholar] [CrossRef]
- Cox, J.C.; Hayne, S.C. Barking up the right tree: Are small groups rational agents? Exp. Econ. 2006, 93, 209–222. [Google Scholar] [CrossRef]
- Kocher, M.; Sutter, M. The decision maker matters: Individuals versus group behaviour in experimental beauty-contest games. Econ. J. 2005, 115, 200–223. [Google Scholar] [CrossRef]
- Song, F. Trust and reciprocity behavior and behavioral forecasts: Individuals versus group-representatives. Games Econ. Behav. 2008, 622, 675–696. [Google Scholar] [CrossRef]
- Charness, G.; Sutter, M. Groups make better self-interested decisions. J. Econ. Perspect. 2012, 263, 157–176. [Google Scholar] [CrossRef] [Green Version]
- Baker, R.; Laury, S.; Williams, A. Comparing small-group and individual behavior in lottery-choice experiments. South. Econ. J. 2008, 752, 367–382. [Google Scholar] [CrossRef]
- Shupp, R.S.; Williams, A.W. Risk preference differentials of small groups and individuals. Econ. J. 2008, 118, 258–283. [Google Scholar] [CrossRef]
- Masclet, D.; Loheac, Y.; Denant-Boemont, L.; Colombier, N. Group and individual risk preferences: A lottery-choice experiment. J. Econ. Behav. Organ. 2009, 703, 470–484. [Google Scholar] [CrossRef]
- Mifune, N.; Hizen, Y.; Kamijo, Y.; Okano, Y. Preemptive striking in individual and group conflict. PLoS ONE 2016, 115, e0154859. [Google Scholar] [CrossRef]
- Rockenbach, B.; Sadrieh, A.; Mathauschek, B. Teams take the better risks. J. Econ. Behav. Organ. 2007, 633, 412–422. [Google Scholar] [CrossRef]
- Zhang, J.; Casari, M. How groups reach agreement in risky choices: An experiment. Econ. Inq. 2012, 502, 502–515. [Google Scholar] [CrossRef]
- Harrison, G.W.; Lau, M.I.; Rutstrom, E.E.; Tarazona-Gomez, M. Preferences over social risk. Oxf. Econ. Pap. 2012, 651, 25–46. [Google Scholar]
- Cason, T.N.; Mui, V.L. A laboratory study of group polarisation in the team dictator game. Econ. J. 1997, 107, 1465–1483. [Google Scholar] [CrossRef]
- Luhan, W.J.; Kocher, M.G.; Sutter, M. Group polarization in the team dictator game reconsidered. Exp. Econ. 2009, 12, 26–41. [Google Scholar] [CrossRef]
- Gillet, J.; Schram, A.; Sonnemans, J. The tragedy of the commons revisited: The importance of group decision-making. J. Public Econ. 2009, 93, 785–797. [Google Scholar] [CrossRef]
- Cason, T.N.; Saijo, T.; Sjostrom, T.; Yamato, T. Secure implementation experiments: Do strategy-proof mechanisms really work? Games Econ. Behav. 2006, 572, 206–235. [Google Scholar] [CrossRef] [Green Version]
- Holt, C.A.; Laury, S.K. Risk aversion and incentive effects. Am. Econ. Rev. 2002, 925, 1644–1655. [Google Scholar] [CrossRef]
- Bohnet, I.; Frey, B. The sound of silence in prisoner’s dilemma and dictator games. J. Econ. Behav. Organ. 1999, 381, 43–57. [Google Scholar] [CrossRef]
- He, H.; Villeval, M.C. Are Teams Less Inequality Averse than Individuals? IZA Discussion Paper 2014, No. 8217; Institute of Labor Economics (IZA): Bonn, Germany, 2014. [Google Scholar]
- Fischbacher, U. z-Tree: Zurich toolbox for ready-made economic experiments. Exp. Econ. 2007, 102, 171–178. [Google Scholar] [CrossRef]
- Anderson, L.R.; Mellor, J.M. Predicting health behaviors with an experimental measure of risk preference. J. Health Econ. 2008, 275, 1260–1274. [Google Scholar] [CrossRef] [PubMed]
- Lusk, J.L.; Coble, K.H. Risk perceptions, risk preference, and acceptance of risky food. Am. J. Agric. Econ. 2005, 872, 393–405. [Google Scholar] [CrossRef]
- Harrison, G.W.; Lau, M.I.; Rutstrom, E.E. Estimating risk attitudes in Denmark: A field experiment. Scand. J. Econ. 2007, 1092, 341–368. [Google Scholar] [CrossRef]
- Kamas, L.; Preston, A.; Baum, S. Altruism in individual and joint-giving decisions: What’s gender got to do with it? Fem. Econ. 2008, 14, 23–50. [Google Scholar] [CrossRef]
- Van Lange, P.A.; De Bruin, E.M.N.; Otten, W.; Joireman, J.A. Development of prosocial, individualistic, and competitive orientations: Theory and preliminary evidence. J. Pers. Soc. Psychol. 1997, 734, 733–746. [Google Scholar] [CrossRef]
- Van Lange, P.A.; Bekkers, R.; Shuyt, T.N.; Vugt, M.V. From games to giving: Social value orientation predicts donation to noble causes. Basic Appl. Soc. Psychol. 2007, 29, 375–384. [Google Scholar] [CrossRef]
- Au, W.T.; Kwong, Y.Y. Measurements and effects of social-value orientation in social dilemmas: A review. In Contemporary Research on Social Dilemmas; Suleiman, R., Budescu, D.V., Fischer, I., Messick, D.M., Eds.; Cambridge University Press: New York, NY, USA, 2004; pp. 71–98. [Google Scholar]
- Reynaud, A.; Couture, S. Stability of risk preference measures: Results from a field experiment on French farmers. Theory Decis. 2012, 732, 203–221. [Google Scholar] [CrossRef] [Green Version]
- Ambrus, A.; Greiner, B.; Pathak, P.A. How individual preferences are aggregated in groups: An experimental study. J. Public Econ. 2015, 129, 1–13. [Google Scholar] [CrossRef]
Figure 1.
Our experimental design.

Figure 2.
Scatter plots with a regression line: Investment (Group-choice sub-sample).

Figure 3.
Scatter plots with a regression line: Donation (Group-choice sub-sample).


Table 1.
Lottery choice experiment (Holt and Laury 2002 [44]).
Table 1.
Lottery choice experiment (Holt and Laury 2002 [44]).
| Decision | Option A | Option B | Proportion of Subjects | ||||||
|---|---|---|---|---|---|---|---|---|---|
| Probability | Payoff | Probability | Payoff | Probability | Payoff | Probability | Payoff | ||
| 1 | 10% | ¥200 | 90% | ¥160 | 10% | ¥380 | 90% | ¥10 | 0.6 |
| 2 | 20% | ¥200 | 80% | ¥160 | 20% | ¥380 | 80% | ¥10 | 0.3 |
| 3 | 30% | ¥200 | 70% | ¥160 | 30% | ¥380 | 70% | ¥10 | 0.6 |
| 4 | 40% | ¥200 | 60% | ¥160 | 40% | ¥380 | 60% | ¥10 | 5.2 |
| 5 | 50% | ¥200 | 50% | ¥160 | 50% | ¥380 | 50% | ¥10 | 13.9 |
| 6 | 60% | ¥200 | 40% | ¥160 | 60% | ¥380 | 40% | ¥10 | 12.5 |
| 7 | 70% | ¥200 | 30% | ¥160 | 70% | ¥380 | 30% | ¥10 | 28.4 |
| 8 | 80% | ¥200 | 20% | ¥160 | 80% | ¥380 | 20% | ¥10 | 27.0 |
| 9 | 90% | ¥200 | 10% | ¥160 | 90% | ¥380 | 10% | ¥10 | 8.7 |
| 10 | 100% | ¥200 | 0% | ¥160 | 100% | ¥380 | 0% | ¥10 | 2.9 |
Note: The last column provides the proportion of the subjects who chose the risky option (Option B) for the first time out of the 10 decisions. To calculate the proportions, we used the data from the subjects who did not switch back to this task. These two columns were not displayed to the subjects.
Table 2.
Variable definitions.
| Variables | Definition |
|---|---|
| Investment | The amount of investment (Task 3), from 0 to 200 |
| Donation | The amount of donation (Task 4), from 0 to 200 |
| Risk preference | The level of “Risk preference” (Task 1) |
| Contributions | The amount of contribution in the PGG (Task 2) |
| Group dummy | Dummy variable for the subjects assigned to the group-choice tasks |
| Prosocial | Dummy variable for the subjects defined as “Prosocial” in the SVO method |
| Male | The gender dummy variable (1 if male, 0 otherwise) |
| University | The university dummy variable (the baseline variable is Kansai University) |
Table 3.
Descriptive statistics for the group-choice sub-sample: Median rule (MR) vs. Random rule (RR).
Table 3.
Descriptive statistics for the group-choice sub-sample: Median rule (MR) vs. Random rule (RR).
| Group-Choice Sub-Sample | Median Rule | Random Rule | MR—RR | ||
|---|---|---|---|---|---|
| Mean | Std. Dev. | Mean | Std. Dev. | p-Value | |
| Investment | 101.74 | 67.41 | 84.65 | 56.50 | 0.12 |
| Donation | 31.20 | 54.39 | 31.86 | 50.61 | 0.19 |
| Risk preference | 0.44 | 0.41 | 0.51 | 0.60 | 0.30 |
| Contributions | 63.91 | 74.83 | 47.56 | 59.98 | 0.36 |
| Prosocial | 0.42 | 0.50 | 0.43 | 0.50 | 0.93 |
| Male | 0.78 | 0.41 | 0.48 | 0.50 | 0.000 *** |
Note: Median rule (N = 92), Random rule (N = 86). Except for the proportion of “Male,” there was no significant difference between the median rule and random rule sub-samples regarding the amount of donation and investment, the level of “Risk preference” (Task 1) and “Contributions” (Task 2) (by the non-parametric Mann-Whitney U-test), and the proportion of the subjects who were defined as “Prosocial” in the SVO method (by the chi-square test of independence). Only the proportion of “Male” was significantly different between the median rule and random rule sub-samples (78.26% vs. 47.67%; *** p < 0.01; using the chi-square test of independence).
Table 4.
Descriptive statistics for the individual-choice sub-sample: Median rule (MR) vs. Random rule (RR).
Table 4.
Descriptive statistics for the individual-choice sub-sample: Median rule (MR) vs. Random rule (RR).
| Individual-Choice Sub-Sample | Median Rule | Random Rule | MR—RR | ||
|---|---|---|---|---|---|
| Mean | Std. Dev. | Mean | Std. Dev. | p-Value | |
| Investment | 116.24 | 62.45 | 111.53 | 68.11 | 0.64 |
| Donation | 52.59 | 66.92 | 43.65 | 61.81 | 0.42 |
| Risk preference | 0.52 | 0.53 | 0.53 | 0.50 | 0.89 |
| Contributions | 67.29 | 69.03 | 58.59 | 64.87 | 0.50 |
| Prosocial | 0.45 | 0.50 | 0.51 | 0.50 | 0.44 |
| Male | 0.64 | 0.48 | 0.48 | 0.50 | 0.045 ** |
Note: Median rule (N = 85), Random rule (N = 85). Only the proportion of “Male” was significantly different between the median rule and random rule sub-samples (63.53% vs. 48.24%; ** p < 0.05; using the chi-square test of independence).
Table 5.
Estimation results: Investment (Tobit model).
| Investment | Model 1 | Marginal | Model 2 | Marginal |
|---|---|---|---|---|
| Effects | Effects | |||
| Risk preference | −47.36 *** | −34.29 *** | −46.51 *** | −33.66 *** |
| (10.92) | (7.60) | (10.76) | (7.49) | |
| Group dummy | −28.38 ** | −20.32 ** | −27.74 ** | −19.87 ** |
| (13.15) | (9.14) | (13.10) | (9.12) | |
| Interaction term | −12.84 | −9.33 | −11.74 | −8.52 |
| (group × random rule) | (18.74) | (13.61) | (18.57) | (13.48) |
| Contributions | - | - | 0.16 ** | 0.11 ** |
| - | - | (0.08) | (0.06) | |
| Male | 28.36 *** | 20.82 *** | 27.70 *** | 20.32 *** |
| (9.25) | (6.78) | (9.16) | (6.71) | |
| Kochi University of Technology | −5.33 | −3.86 | −7.09 | −5.13 |
| (14.80) | (10.68) | (14.61) | (10.53) | |
| Kyoto Sangyo University | 7.82 | 5.68 | 7.09 | 5.15 |
| (16.65) | (12.14) | (16.51) | (12.03) | |
| Constant | 133.9 *** | - | 124.4 *** | - |
| (12.29) | - | (12.98) | - | |
| Observations | 348 | 348 | ||
| Log pseudolikelihood | −1493.9 | −1491.4 |
Note: Significance levels: *** p < 0.01, ** p < 0.05, * p < 0.1. Robust standard errors are in parentheses.
Table 6.
Estimation results: Donation (Tobit model).
| Donation | Model 1 | Marginal | Model 2 | Marginal |
|---|---|---|---|---|
| Effects | Effects | |||
| Contributions | 0.32 *** | 0.15 *** | 0.32 *** | 0.15 *** |
| (0.10) | (0.05) | (0.10) | (0.05) | |
| Group dummy | −43.28 ** | −23.78 ** | −42.46 ** | −23.27 ** |
| (17.68) | (10.59) | (17.66) | (10.55) | |
| Interaction term | 34.70 | 15.82 | 34.20 | 15.60 |
| (group × random rule) | (23.64) | (10.07) | (23.50) | (10.02) |
| Prosocial | 45.92 *** | 19.32 *** | 45.70 *** | 19.22 *** |
| (12.33) | (4.30) | (12.38) | (4.33) | |
| Risk preference | - | - | 8.55 | 4.14 |
| - | - | (12.24) | (5.92) | |
| Male | −23.83 * | −12.54 * | −22.98 * | −12.04 * |
| (12.16) | (6.82) | (12.31) | (6.87) | |
| Kochi University of Technology | 23.06 | 10.77 | 22.96 | 10.72 |
| (19.22) | (8.68) | (19.24) | (8.68) | |
| Kyoto Sangyo University | 13.49 | 6.38 | 13.37 | 6.32 |
| (18.69) | (8.62) | (18.67) | (8.61) | |
| Constant | −15.98 | - | −21.20 | - |
| (14.65) | - | (17.13) | - | |
| Observations | 348 | 348 | ||
| Log pseudolikelihood | −1139.5 | −1139.2 |
Note: Significance levels: *** p < 0.01, ** p < 0.05, * p < 0.1. Robust standard errors are in parentheses.
Table 7.
Estimation results for the group-choice sub-sample (Tobit Model).
| Group-Choice Sub-Sample | Model 1 | Marginal | Model 2 | Marginal | Model 3 | Marginal |
|---|---|---|---|---|---|---|
| Investment | Effects | Donation | Effects | Donation | Effects | |
| Risk preference | −88.19 *** | −66.76 *** | - | - | −19.73 | −8.96 |
| (21.85) | (15.57) | - | - | (27.24) | (12.35) | |
| Interaction term | 57.88 ** | 40.50 ** | - | - | 35.22 | 14.86 |
| (random rule × risk preference) | (25.10) | (15.63) | - | - | (32.24) | (12.58) |
| Random rule | −40.68 ** | −30.66 ** | 30.19 | 12.01 | −2.67 | −1.23 |
| (16.77) | (11.94) | (22.22) | (7.55) | (21.49) | (9.97) | |
| Contributions | - | - | 0.28 | 0.12 | 0.15 | 0.07 |
| - | - | (0.19) | (0.08) | (0.13) | (0.06) | |
| Interaction term | - | - | −0.29 | −0.13 | - | - |
| (random rule × contributions) | - | - | (0.25) | (0.12) | - | - |
| Prosocial | - | - | 43.14 *** | 16.56 *** | 42.33 *** | 16.35 *** |
| - | - | (15.89) | (5.05) | (15.76) | (5.04) | |
| Male | 25.04 ** | 18.83 ** | −16.13 | −7.90 | −15.90 | −7.81 |
| (11.21) | (8.32) | (15.89) | (8.35) | (15.99) | (8.42) | |
| Constant | 126.6 *** | - | −39.13 * | - | −21.59 | - |
| (14.65) | - | (23.41) | - | (23.33) | - | |
| Observations | 178 | 178 | 178 | |||
| Log pseudolikelihood | −780.1 | −549.2 | −549.4 |
Note: Significance levels: *** p < 0.01, ** p < 0.05, * p < 0.1. Robust standard errors are in parentheses.
Table 8.
Estimation results for the individual-choice sub-sample (Tobit model).
| Individual-Choice Sub-Sample | Model 1 | Marginal | Model 2 | Marginal | Model 3 | Marginal |
|---|---|---|---|---|---|---|
| Investment | Effects | Donation | Effects | Donation | Effects | |
| Risk preference | −64.18 *** | −44.37 *** | - | - | −1.42 | −0.72 |
| (24.16) | (16.07) | - | - | (28.52) | (14.55) | |
| Interaction term | 41.05 | 28.18 | - | - | 21.39 | 10.59 |
| (random rule × risk preference) | (36.61) | (24.58) | - | - | (39.29) | (18.75) |
| Random rule | −22.22 | −14.90 | −29.55 | −16.10 | −30.83 | −16.83 |
| (24.56) | (15.79) | (24.23) | (13.88) | (29.92) | (17.21) | |
| Contributions | - | - | 0.42 ** | 0.21 ** | 0.49 *** | 0.25 *** |
| - | - | (0.20) | (0.10) | (0.16) | (0.08) | |
| Interaction term | - | - | 0.16 | 0.08 | - | - |
| (random rule × contributions) | - | - | (0.30) | (0.15) | - | - |
| Prosocial | - | - | 47.73 ** | 21.70 *** | 49.74 ** | 22.42 *** |
| - | - | (19.73) | (7.56) | (19.85) | (7.45) | |
| Male | 34.57 ** | 24.82 ** | −35.53 * | −19.74 * | −34.20 * | −18.92 * |
| (14.61) | (10.64) | (18.16) | (10.63) | (18.44) | (10.73) | |
| Constant | 141.2 *** | - | 0.21 | - | −6.04 | - |
| (18.77) | - | (20.58) | - | (23.95) | - | |
| Observations | 170 | 170 | 170 | |||
| Log pseudolikelihood | −709.9 | −587.4 | −587.3 |
Note: Significance levels: *** p < 0.01, ** p < 0.05, * p < 0.1. Robust standard errors are in parentheses.
Disclaimer/Publisher’s Note: The statements, opinions and data contained in all publications are solely those of the individual author(s) and contributor(s) and not of MDPI and/or the editor(s). MDPI and/or the editor(s) disclaim responsibility for any injury to people or property resulting from any ideas, methods, instructions or products referred to in the content. |
© 2023 by the authors. Licensee MDPI, Basel, Switzerland. This article is an open access article distributed under the terms and conditions of the Creative Commons Attribution (CC BY) license (https://creativecommons.org/licenses/by/4.0/).
Share and Cite
MDPI and ACS Style
Kamijo, Y.; Tamura, T. Risk-Averse and Self-Interested Shifts in Groups in Both Median and Random Rules. Games 2023, 14, 16. https://doi.org/10.3390/g14010016
AMA Style
Kamijo Y, Tamura T. Risk-Averse and Self-Interested Shifts in Groups in Both Median and Random Rules. Games. 2023; 14(1):16. https://doi.org/10.3390/g14010016
Chicago/Turabian StyleKamijo, Yoshio, and Teruyuki Tamura. 2023. "Risk-Averse and Self-Interested Shifts in Groups in Both Median and Random Rules" Games 14, no. 1: 16. https://doi.org/10.3390/g14010016
Note that from the first issue of 2016, this journal uses article numbers instead of page numbers. See further details here.