Article

Detecting COVID-19 from Chest X-rays Using Convolutional Neural Network Ensembles

1
Bytedance FZ LLC, Dubai 503045, United Arab Emirates
2
Department of Computer Science, University of York, Deramore Lane, York YO10 5GH, UK
3
Department of Engineering, Manchester Metropolitan University, John Dalton Building, Chester Street, Manchester M1 5GD, UK
*
Author to whom correspondence should be addressed.
Computers 2023, 12(5), 105; https://doi.org/10.3390/computers12050105
Submission received: 24 April 2023 / Revised: 14 May 2023 / Accepted: 15 May 2023 / Published: 16 May 2023
(This article belongs to the Special Issue Uncertainty-Aware Artificial Intelligence)

Abstract

:
Starting in late 2019, the coronavirus SARS-CoV-2 began spreading around the world and causing disruption in both daily life and healthcare systems. The disease is estimated to have caused more than 6 million deaths worldwide [WHO]. The pandemic and the global reaction to it severely affected the world economy, causing a significant increase in global inflation rates, unemployment, and the cost of energy commodities. To stop the spread of the virus and dampen its global effect, it is imperative to detect infected patients early on. Convolutional neural networks (CNNs) can effectively diagnose a patient’s chest X-ray (CXR) to assess whether they have been infected. Previous medical image classification studies have shown exceptional accuracies, and the trained algorithms can be shared and deployed using a computer or a mobile device. CNN-based COVID-19 detection can be employed as a supplement to reverse transcription-polymerase chain reaction (RT-PCR). In this research work, 11 ensemble networks consisting of 6 CNN architectures and a classifier layer are evaluated on their ability to differentiate the CXRs of patients with COVID-19 from those of patients that have not been infected. The performance of ensemble models is then compared to the performance of individual CNN architectures. The best ensemble model COVID-19 detection accuracy was achieved using the logistic regression ensemble model, with an accuracy of 96.29%, which is 1.13% higher than the top-performing individual model. The highest F1-score was achieved by the standard vector classifier ensemble model, with a value of 88.6%, which was 2.06% better than the score achieved by the best-performing individual model. This work demonstrates that combining a set of top-performing COVID-19 detection models could lead to better results if the models are integrated together into an ensemble. The model can be deployed in overworked or remote health centers as an accurate and rapid supplement or back-up method for detecting COVID-19.

1. Introduction

COVID-19 is a disease caused by the SARS-CoV-2 virus that infects cells in human airways and leads to critical respiratory infections [1]. The virus mainly spreads from infected people through droplets of different sizes when speaking, coughing or growling [2]. This allows the virus to be ejected and become airborne. Risk of infection increases in crowded spaces and indoor environments with inadequate ventilation [3]. In the early stages of the infection, COVID-19 quickly invades the cells of the respiratory system. People who become infected may be asymptomatic or experience symptoms such as coughing and fever. However, severe illness from the virus could lead to complications such as pneumonia, cardiac disease, and organ failure in extreme cases [4]. Since it started spreading in December 2019, the containment of COVID-19 has proved to be a challenge for national healthcare systems worldwide [5]. As of November 2022, more than 6.5 million confirmed deaths and 628 million confirmed cases of the disease have been diagnosed by the World Health Organization (WHO) with most confirmed deaths coming from America and Europe. Several countries have developed vaccines, with the Oxford-AstraZeneca and Pfizer-BioNTech being the most widespread worldwide, with 185 and 165 countries using the vaccines, respectively [6]. Nevertheless, mass vaccination worldwide remains a challenge, with some countries still having vaccination rates in the single digits, such as Burundi, Papua New Guinea, and Haiti, or in the low double digits, such as Niger, Syria, and Mali [7].
A key tool in containing the virus is early detection, as this allows for the containment of the disease by putting sick individuals in quarantine and beginning treatment [8]. This would also stem the further spread of the disease by limiting interaction between sick and healthy individuals. The need for early detection has led to the mass adoption of reverse transcriptase-polymerase chain reactions (RT-PCR) as a tool for identifying the pathogen. Nevertheless, this method has drawbacks, such as lengthy test times [9] and up to 54% false negatives [10]. An alternative proposal to RT-PCR is analyzing a radiologist’s chest X-rays (CXRs) to determine whether a patient has been infected [11]. This method benefits from the wide availability of radiography equipment which can cheaply and rapidly produce CXRs. However, a bottleneck could be created where there is a lack of experienced radiologists and radiology equipment [12].
Convolutional neural networks (CNNs) have proved to be effective in a variety of medical image classification tasks such as the detection of diabetic retinopathy [13], the detection of tumors [14] and the diagnosis of Alzheimer’s disease [15]. Medical image classification has benefited from the growing availability of medical image datasets from medical facilities worldwide. This has allowed researchers to develop innovative and more accurate detection methods [16]. As CNNs proved themselves proficient in pathology classification from radiographs [17,18], there has been a growth in studies evaluating the use of CNN models to detect COVID-19-positive patients from CXRs [19,20,21,22,23,24]. These models could be used to further verify the results of RT-PCR COVID-19 detection, or be used as a viable alternative in heavily congested or remote health facilities. These models can then potentially provide healthcare workers with a wider toolkit of possible COVID-19 detection solutions in the face of environmental constraints.
Ensemble CNN models combine multiple CNN architectures to yield better results than individual methods [25]. Ensemble models reduce the susceptibility to overfitting that individual models suffer from, as multiple models override the results of a single biased model. While there have been recent papers covering the performance of ensemble models on CNNs [26], there are numerous ways to configure ensemble CNN models. A comparison of the performance of different configurations has not been well covered in the literature.
In this work, 6 CNN models were compared on their ability to differentiate between X-rays of patients with COVID-19, healthy patients, and patients with pneumonia. The models used for comparison include models that have performed well on the ImageNet dataset, a well-known dataset used to benchmark image comparison [27]. The architectures used in this study are VGG16, Inception, ResNet, MobileNet, EfficientNet, and DenseNet. All model weights were pre-trained on the ImageNet dataset and then trained on the same training chest X-ray dataset. The dataset has been aggregated from X-rays provided by the Valencian Region Medical Image Bank (BIMCV) [28]. The CNN models were then employed to construct ensemble models that used the models’ predictions as output. To build the ensemble models, the models’ training predictions were passed as inputs to train 11 different classification models. The individual CNNs and the ensemble models were then evaluated on accuracy and F1-score.
The paper provides a comparison of different ensemble deep learning CNN architectures, drawing from a variety of classification and deep learning algorithms on the tasks of COVID-19 detection and differentiation between COVID-19, pneumonia, and non-infected lungs. Furthermore, it provides a comparison of the accuracy of deep learning ensemble models, with different cadences and permutations to CNN-based models. The proposed research work introduces an SVC and logistic regression deep learning ensemble model that is easy to deploy and achieves accuracy on par with other work in the field. The study demonstrates that using an ensemble model will achieve more accurate results in diagnosing patient CXRs for COVID-19 when compared to the performance of individual CNN models, when these models are integrated into the ensemble. Finally, the paper demonstrates the limitation of this strategy; it is dependent on the quality and number of CNNs used in the ensemble.
The rest of the sections are organized as follows. Section 2 covers related work on COVID-19 detection from CXRs using CNNs. Section 3 describes the methodology, the dataset, the pre-processing and labeling, and the individual CNN and CNN ensemble architectures. The performances of the individual CNN models are compared with each other, the performances of the CNN ensemble models are compared with each other and the base models, and comparisons of the results to previous work are depicted in Section 4. Finally, conclusions are drawn in Section 5.

2. Literature Review
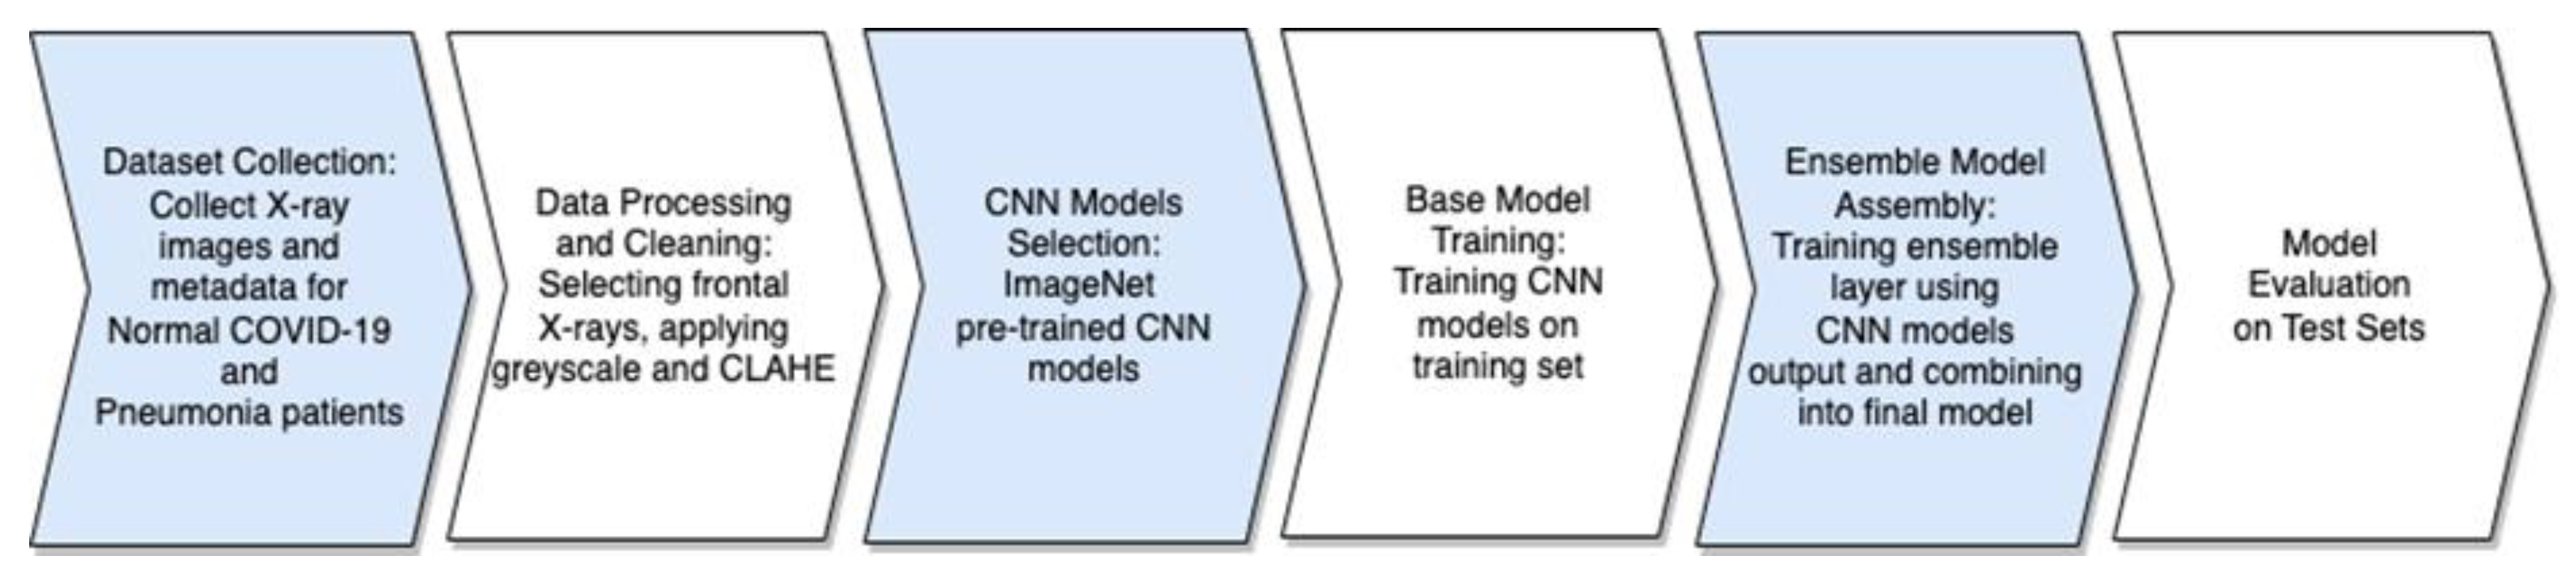
CNNs have proven to be highly effective models for image classification and pattern recognition tasks. Their success in image recognition has led to investigations into using CNNs for disease classification from medical images [17,18]. There has been an increase in investigations into using deep learning to detect COVID-19. Research has focused primarily on detection from CXR images and computer tomography (CT) scans [29]. Deep bidirectional classification models have been used to detect COVID-19 from CT scans, achieving an accuracy of 96.19% [30]. Fuzzy ensemble-based CNNs were able to achieve an accuracy of 98% on publicly available CT-Scans [31]. Deep CT-Net, a pixel-wise attention model, achieved an accuracy of 81% and an area under the curve of 92% [32]. Pulmonary parenchyma has been automatically extracted from CT scans to assist a proposed SP-V-Net architecture to diagnose COVID-19. The model achieved a sensitivity of 0.98, and a specificity of 0.99 [33]. A two-stage framework was proposed which used CNNs to extract features from CT scans, followed by feature selection using a meta-heuristic optimization algorithm, Harmony Search [34]. The final model yielded an accuracy of 98.7%. Furthermore, approaches that did not rely on deep learning have also been proposed, such as a texture-based approach using XGboost that yielded 99.93% on a dataset composed of three different sources [35]. Nevertheless, using CT scans for COVID-19 detection has its challenges, due to the limited number of available datasets and the expensive nature of CT equipment, making it less likely to be available for diagnosis in remote or impoverished areas [32].
Research papers have proposed using a wide range of CNN architectures to detect COVID-19 from X-ray images. These papers primarily focused on comparing the proposed architectures to other CNNs. A capsule network that used 20 times fewer trainable parameters than other networks achieved an accuracy of 91% and an area under the curve (AUC) of 90% [36]. Custom filter learning was applied to CNNs to better differentiate between COVID-19 and different pneumonia classes [37]. The proposed model achieved a near-perfect accuracy of 99.8%. Narin et al. [38] achieved an accuracy of 99.4% on COVID-19 binary classification using pre-trained ResNet-50 and ResNet-100 models. The dataset contained CVRs of 341 COVID-19 patients, 2800 healthy patients, and 4265 patients with pneumonia. The models relied on deep transfer learning using ImageNet to compensate for the limited dataset and to cut down training time. Ozturk et al. [24] used a DarkNet model to provide an automatic detection system to diagnose COVID-19, pneumonia, and healthy patients. The model achieved 98.08% accuracy in the binary classification of patients with COVID-19, and 87.02% accuracy for multi-class classification. Hira et al. [39] used ResNet, DenseNet, AlexNet, Inception, and GoogleNet architectures. Se-ResNeXt, a variation of the ResNet model, achieved an accuracy of 99.23% on a dataset of 8830 images. Haidari et al. [40] focused on preprocessing algorithms to yield better results using the VGG16 architecture. They yielded an accuracy of 94.5% on a dataset consisting of 8474 CXR images. Jain et al. [41] trained an Xception model using 5467 X-rays and achieved an accuracy of 97.97% on a validation set of 965 X-rays. The Xception model performed better than ResNeXt or Inception V3 in the task. Gouda et al. [42] proposed an architecture based on the ResNet model and trained it on two well-known Kaggle datasets, COVID-19 Image Data Collection (IDC) and CXR Images (Pneumonia). The model yielded a perfect AUC and 99.63% accuracy. Finally, Elhanashi et al. [43] explored using multiple CNN models (ResNet50, ResNet101, VGG-19, and U-Net architectures) to yield an accuracy of 99.42% in COVID-19 classification.
Recently, models were developed using multi-step processes that created high-performing pipelines. Bhattacharyya et al. [44] proposed a model that uses conditional generational adversarial networks and VGG-19s to create a pipeline that yields an accuracy of 96.6%. A two-step model using CNNs to extract features and a Bayesian-based optimizer was used to yield an accuracy of 96% on a dataset with 3616 COVID-19 patients, and an equal number of normal and pneumonia patients [45]. The model yielded a 96% accuracy on the balanced dataset. Ieracitano et al. [46] proposed CovNNet, which extracted relevant features and combined them with fuzzy images using an accompanying algorithm. The model achieved an accuracy of 81%. A Gabor filter was used to extract features from 4560 X-rays, and a DenseNet was then applied to the dataset to yield an accuracy of 98.5% [47]. Additional data outside of X-rays were also integrated into deep learning models. Clinical data and X-ray features passed through an EfficientNet were combined into a joint-fusion deep learning model, yielding an accuracy of 97% [48].
As more X-ray datasets have surfaced, even larger datasets have been produced. Chhikara et al. [49] trained an InceptionV3 model and applied it to three different datasets with 14,486, 11,244, and 8246 CXR images, respectively. The model achieved 97.03%, 97.7%, and 84.95% accuracy, respectively. Khan et al. [50] used EfficientNet combined with regularization techniques were able to yield an accuracy of 96.13% on a dataset of 21,165 images. Wang et al. [12] developed a CNN architecture called COVID-Net on a dataset of 13,975 CXR images, and yielded an accuracy of 92.4%. The architecture utilized selected long-range connectivity and a projection–expansion–projection design. The model was trained on a dataset consisting of 13,975 CXR images from 13,870 patients. Muralidharan et al. [51] proposed a multiscale deep convolutional neural network, and the model yielded an accuracy of 96% on two datasets containing 10225 X-ray images in total. The CheXNet model, a pneumonia detection CNN, was retrained on a dataset with 11,000 CXRs, producing the COVID-19-detecting COVID-CXNet [52]. The model achieved 87.88% accuracy on three-class classification.
There have been a handful of papers that have compared the performance of ensemble models to individual CNN models. Fabricio Aprecido Breve reached an accuracy of 98.75% using ensemble CNN models including DenseNet, ResNet, and Exception on a dataset of 16,352 CXR images [53]. EDL-COVID combined AlexNet, GoogleNet, and ResNet and used majority voting to differentiate CT images of COVID-19 patients from healthy patients [54]. The model achieved an F1 score of 98.59% on a dataset of 7500 images that included COVID-19 patient lungs, lungs with tumors, and normal lungs. Jin et al. [55] proposed a hybrid ensemble model consisting of feature extractors, feature selectors, and two AlexNets. The ensemble model obtained an accuracy of 98.64% on a dataset containing 1220 images of patients with COVID-19, patients with viral pneumonia, and healthy patients. Dey et al. [56] proposed CovidConvLSTM, which relied on a Sugeno fuzzy integral-based ensemble method and a long short-term memory layer for spatial encoding. The model achieved 98.63% accuracy and a 98.67% F1-score. A DenseNet169 was used to extract features of chest X-rays which were then passed on to an XGBoost algorithm for classification [57]. The model yielded an accuracy of 89.7% on 1125 images. Most of the surveyed papers on COVID-19 classification either focused on comparing the performance of individual CNN models against each other [12,24,39,40] or comparing the performance of individual models against ensemble models [53,54,55]. However, no papers have compared how the different permutations of ensemble models would perform against each other in classifying COVID-19 CXRs, and what combination would produce the best results. While the above research has provided evidence that ensemble models are less likely to produce unbalanced models that outperform on one metric while sacrificing another, they are yet to explore how the number of models or the selection of a particular stacking model could maximize accuracy. Furthermore, the extent of model performance improvement that is achievable through maximizing the number of models or the exemption or addition of weak learners for COVID-19 detection has yet to be explored. This paper attempts to address this gap.

3. Methodology

Both machine learning and deep learning methods have been applied to effectively classify COVID-19, pneumonia, and other diseases using medical images. This study attempts to correctly differentiate the CXRs of healthy patients from those infected with COVID-19 and those that have pneumonia by incorporating both machine learning and deep learning algorithms. First, the images were collected and resized to 512 × 512. They were then converted to grayscale and enhanced using CLAHE. Images were then rescaled between the 0 and 256 range. Six deep learning architectures were then selected and trained on a subset of the data. The outputs of the trained models were then used as input to train nine machine learning model architectures. The ensemble models, consisting of the deep learning models as the first layer and the machine learning models as the second layer, were then evaluated on a withheld test set to evaluate the overall performance of different permutations of the models. Figure 1 exhibits a flowchart of the proposed methodology.

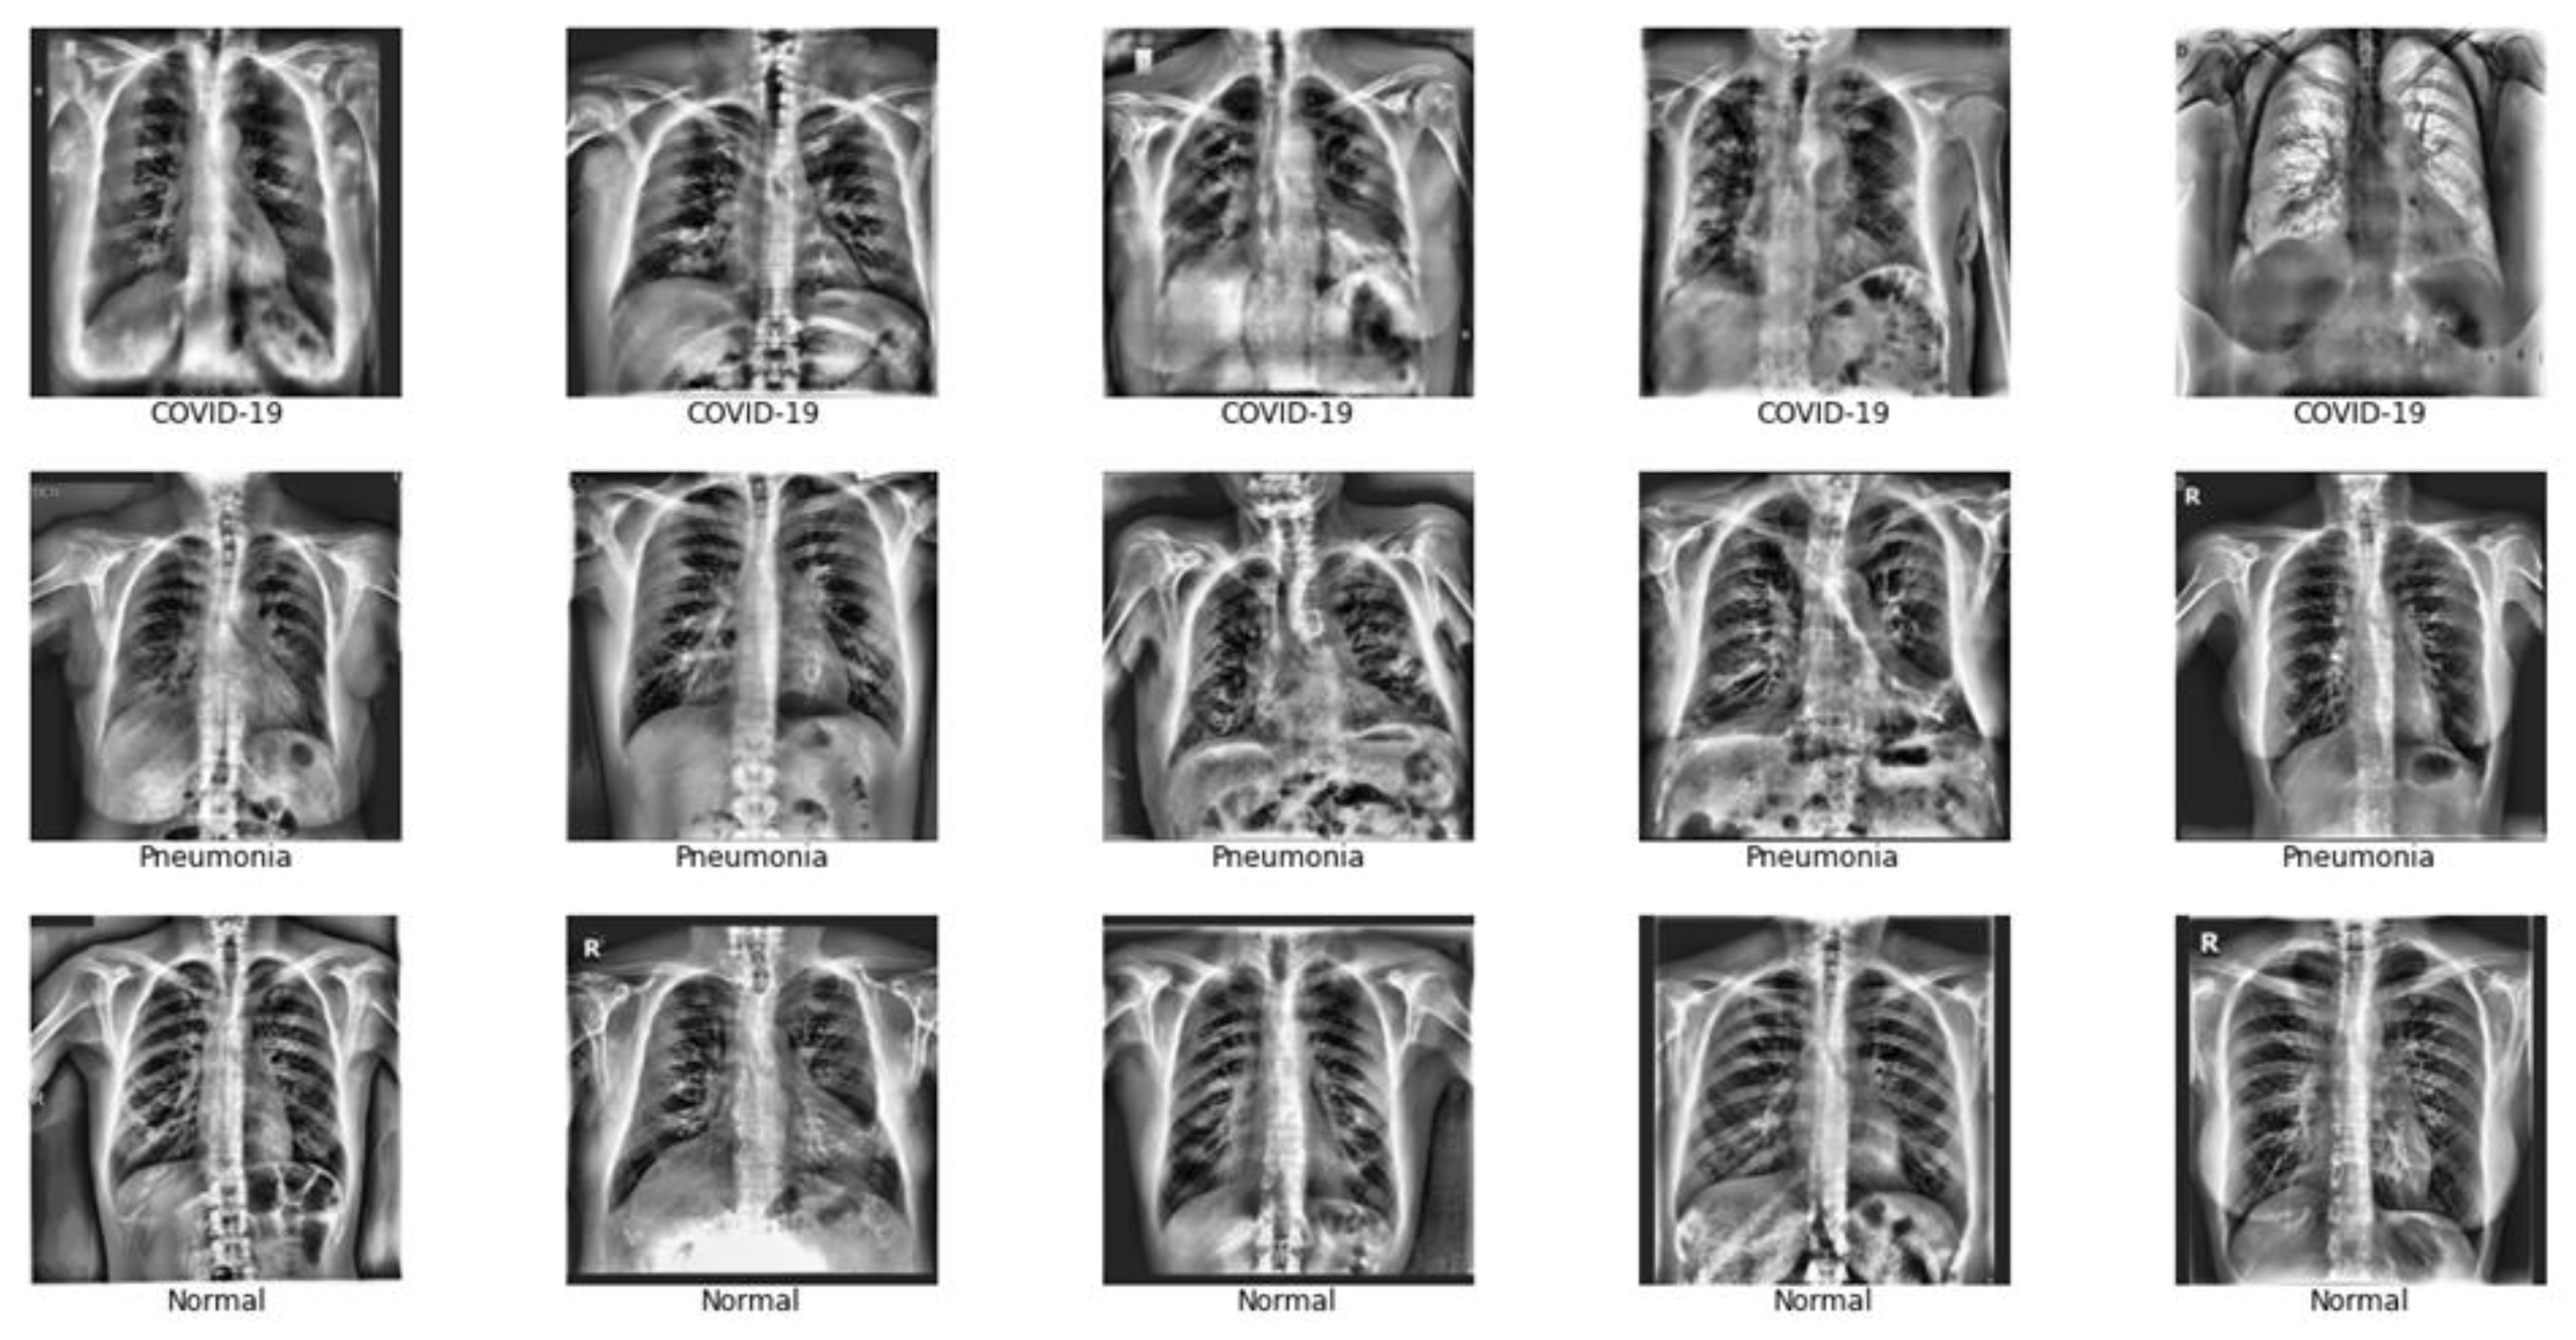
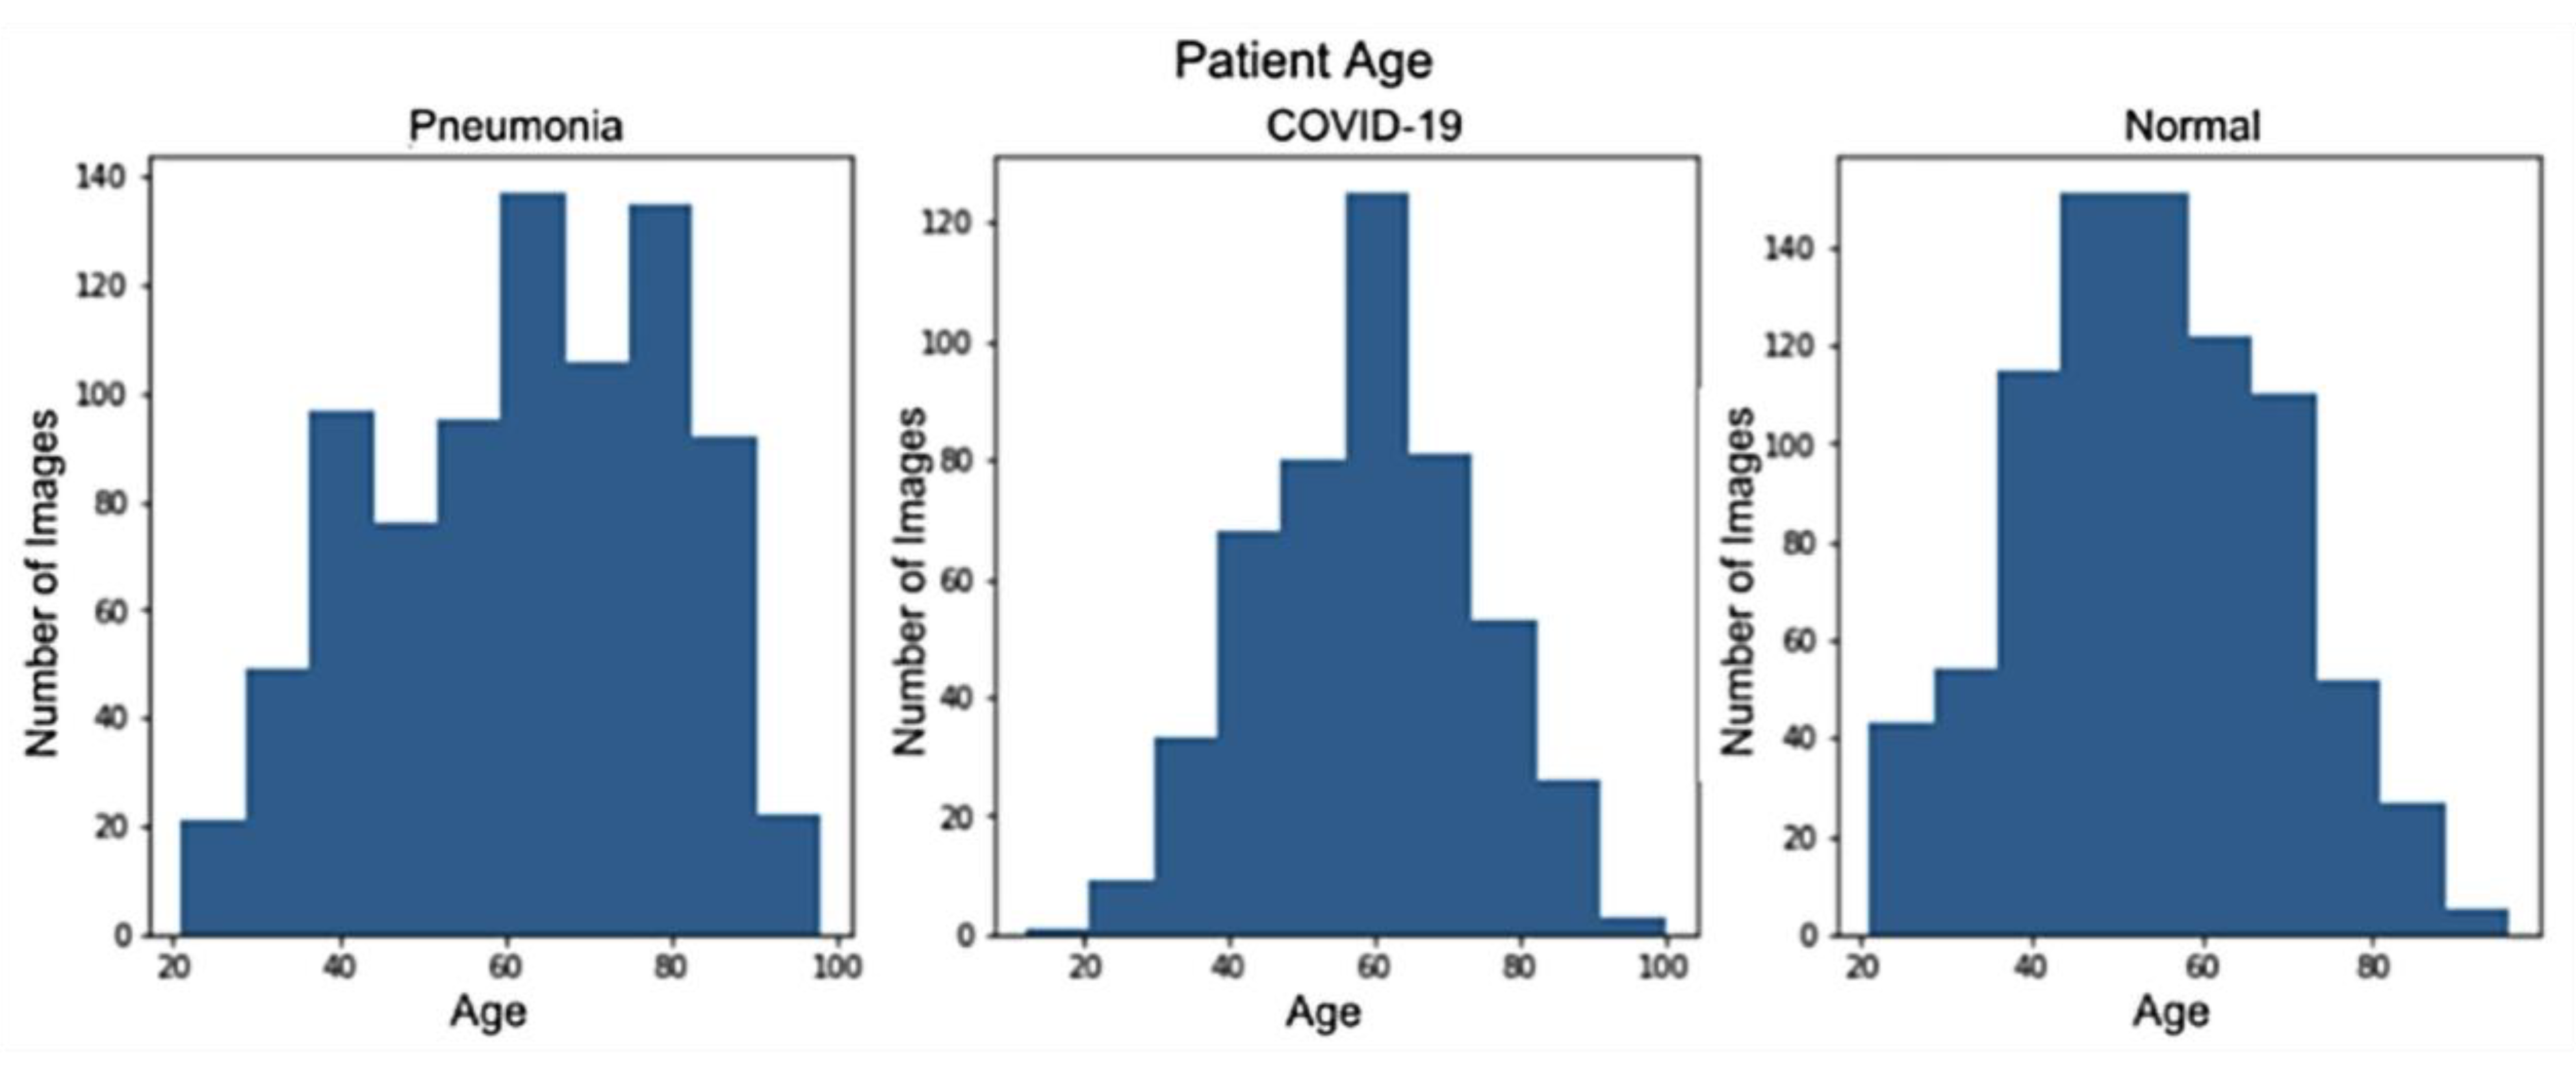
3.1. Data Description
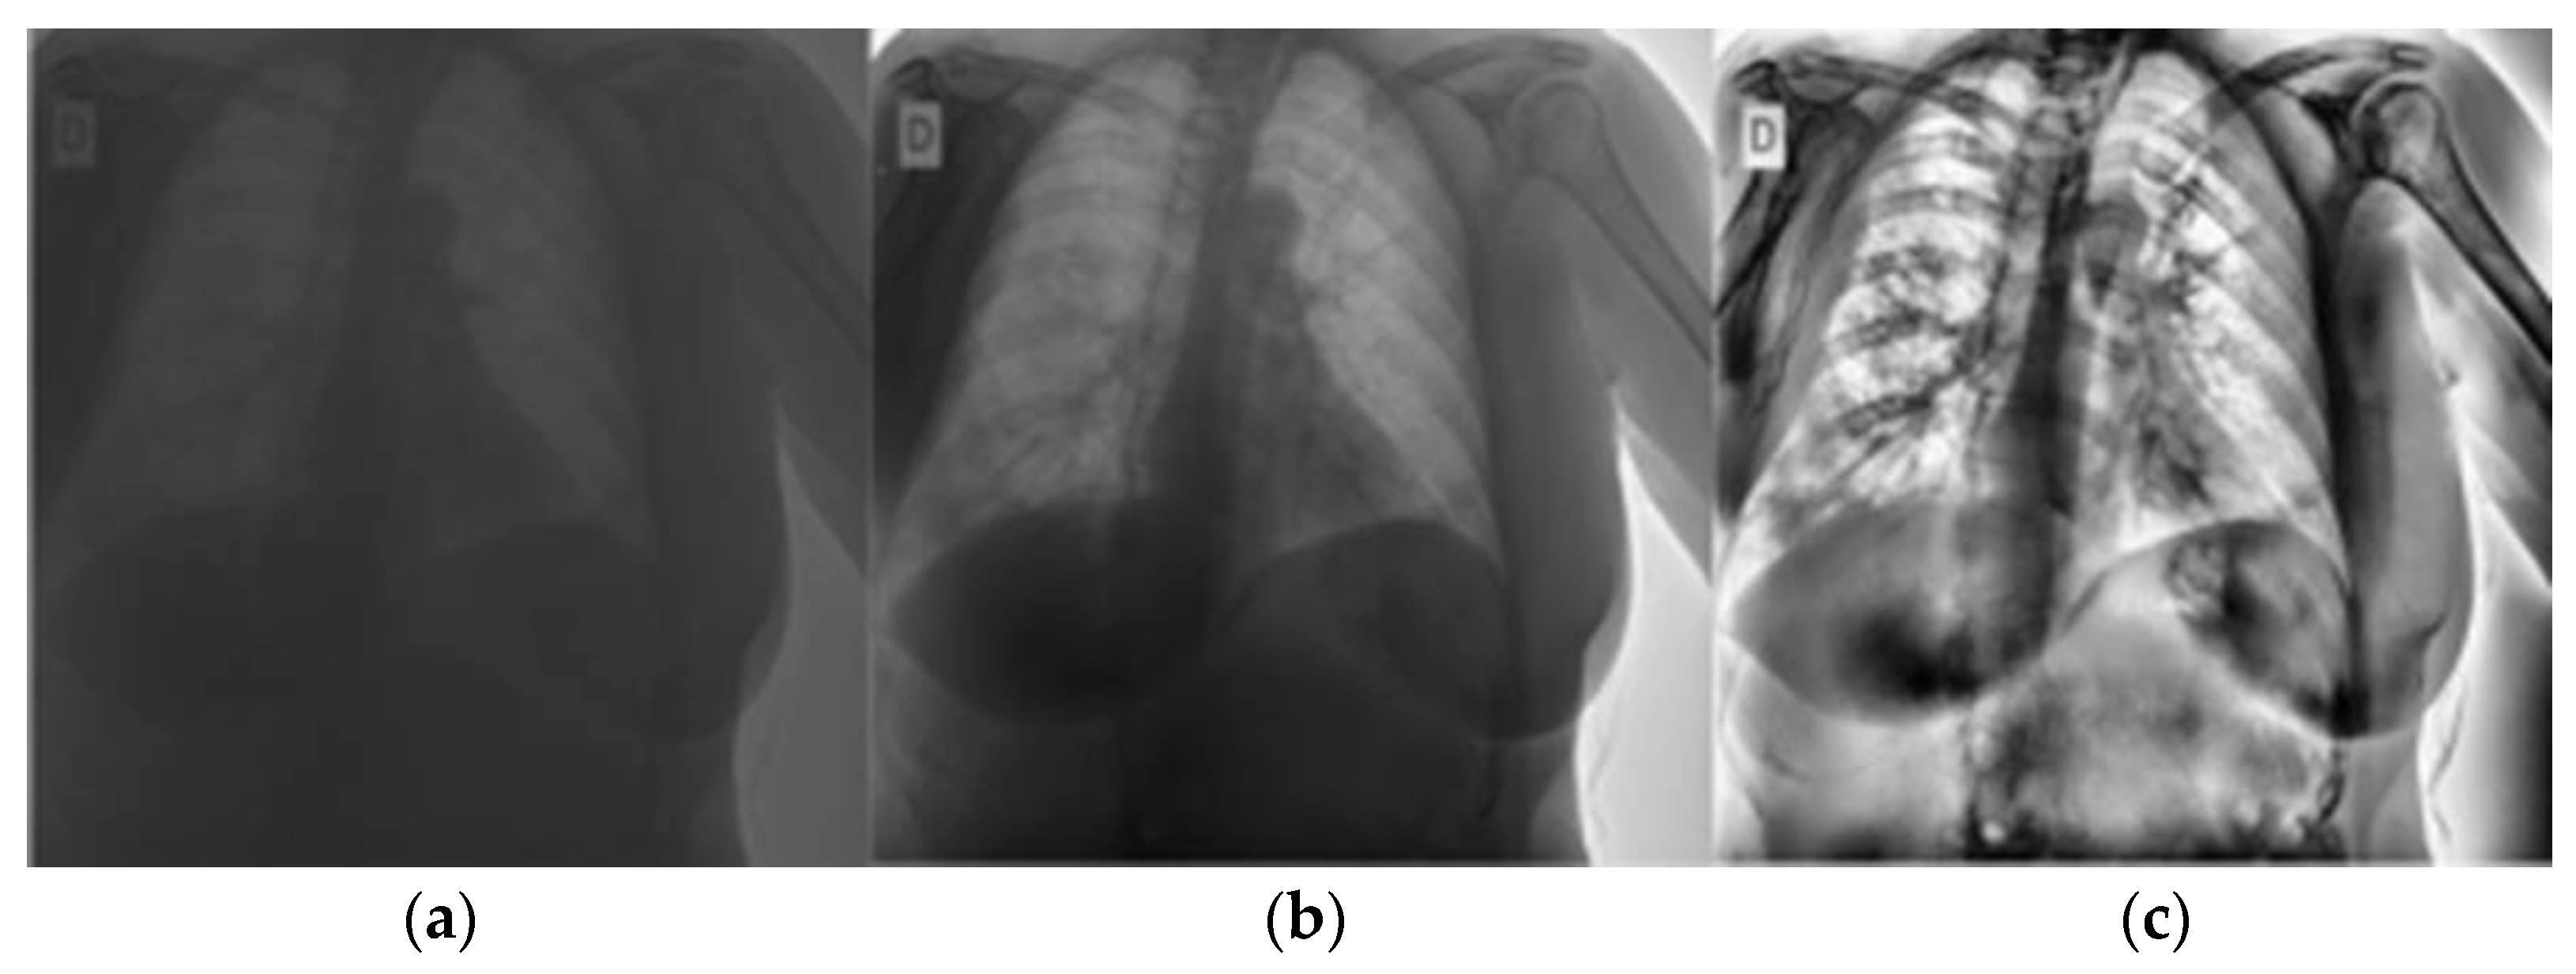
Chest X-rays were collected for COVID-19-positive patients and COVID-19-negative patients. The negative patients included patients with non-COVID-19 pneumonia and healthy patients. Differentiating between non-COVID-19 pneumonia patients and pneumonia caused by COVID-19 patients poses a bigger challenge for CNNs than healthy and COVID-19-infected patients [53]. The pneumonia data were added to build more robust models that were likely to be exposed to pneumonia-infected patients. The data were collected from two datasets published by the Medical Imaging Databank of the Valencia Region (BIMCV) [28]. The BIMCV COVID-19+ was used to collect CXRs of patients with COVID-19 and healthy patients, while Padchest-pneumonia was used for patients with pneumonia and healthy patients. The COVID-19+ dataset consisted of CXR and CT scans taken from 11 hospitals in the Valencia region of Spain. Clinical reports for patients at the time of diagnosis were used to assign labels to the CXRs and to differentiate between COVID-19 and pneumonia patients. The patient records used in the dataset had diagnostic tests (including PCRs and IgG antibody tests conducted on the patients) as well as the results of these tests. The chest X-rays of patients that had a COVID-19 positive diagnosis at the time of the chest X-ray were labelled as COVID-19 patients. In addition to the X-ray images, the records contained associated radiological reports. The labels included findings such as various thoracic diseases including pneumonia. Chest X-rays that were labelled with pneumonia and did not include a positive COVID-19 test were then labelled as patients with pneumonia.
A total of 3330 CXRs were used to train and test the CNN models. Each CXR corresponded to a unique patient. The training and testing dataset contains 632 images of COVID-19+ patients, 1592 images of healthy patients, and 1106 images of patients with non-COVID-19 pneumonia. Considering that normal images significantly outnumbered both pneumonia and COVID-19 images, the 1592 normal images were chosen at random from all images that could have been included. An additional 836 images were kept for validating the ensemble model, of which 160 were COVID-19 images, 406 were of healthy patients and 269 belonged to patients with pneumonia. The count of CXRs is shown in Table 1. The three classes of images will be referred to as COVID-19, normal, and pneumonia, respectively for the rest of the paper. Example CXRs are shown in Figure 2.

3.2. Pre-Processing

All CT scans in the two datasets were excluded from the final datasets due to the difference between CT and X-rays. X-rays and CT scans have different image properties and appearances, since X-rays are two-dimensional and CT scans provide three-dimensional structures. By excluding CT scans, the model can focus on learning the difference between the three labels for one image modality and yield more accurate results. Since all COVID-19 patients were over 20 years old, all children’s X-ray images were removed so that the model would not over-perform by learning to detect children’s images. The three classes then had an average patient age of 62 for pneumonia patients, 58 for COVID-19 patients, and 53 for healthy patients. Figure 3 displays the age distribution of patients used in the study. Some 42% of patients in the COVID-19 database were women, while the other two classes had gender more evenly split. However, it is unlikely that the model would learn gender-related anatomical particularities and associate them with a class, given such splits [58]. Posterior-anterior (frontal) X-rays were used, while anterior–posterior X-rays were removed, since the former is more likely to be used if a patient is not in a severe state [59]. This is desirable, since the models are expected to detect the early onset of COVID-19. Finally, all images were manually inspected to remove blurry, mislabeled, or cropped images.
All images were resized to 512 × 512 pixels. A center crop was applied to focus on the lungs and to exclude any labels etched on the corners of the X-ray images [58]. All images were then converted to greyscale, since there is evidence that CNNs are better at detecting greyscale images when compared to RGB ones. This allows for more computational efficiency, as image size is reduced three-fold [60]. All grayscale pixel values were rescaled between 0 and 256. Images were then randomly rotated and translated to increase the diversity of the images to help the models learn more general features and avoid overfitting.
Local contrast and edges were made more visible using computer limited adaptive histogram equalization (CLAHE). This allowed COVID-19 symptoms to be visible in the lungs [61]. CLAHE is a version of adaptive histogram equalization (AHE). In AHE, the image is divided into tiles, and each tile has its contrast enhanced by considering the pixels in the tile. However, AHE tends to over-amplify noise in nearly uniform image regions. CLAHE overcomes this by limiting amplification [62]. The transformation of images using CLAHE is shown in Figure 4.

3.3. CNN and CNN Ensemble Models

The proposed ensemble model consisted of two layers. The first layer was composed of a set of CNNs that were used to output a score corresponding to each class. The scores would then be used as input for the second layer, which would consist of a classifier model that would output the final class of each image. Figure 5 shows the architecture of the proposed ensemble model with three deep-learning models. To understand which permutation of CNNs and classifiers would perform best, the models were first trained on a training set, and the training set predictions were used to train the second layer classifiers, thus creating two layers of trained models. The training set consisted of 70% CXRs, and 10% was used to validate the CNN’s performance to determine early stoppage. The output of the models on the training and validation set was used to train the ML algorithms that made up the top layer of the ensemble models. The remaining 20% of the data were used to evaluate the performance of both the base models and the ensembles.
There were six CNN architectures explored in this paper for the first layer. CNN models were selected due to their ability to automatically extract features from the X-ray images. This allows models to discover complex features and representations that would have been difficult to identify using traditional hand-crafted methods. Furthermore, CNN models have shown state-of-the-art performance in COVID-19 detection from CXRs previously, and deep learning can be incrementally improved upon in the future as more CXR datasets become available [53,55]. For the architectures of the six models, the final layer was replaced by a drop-out layer, with a 50% dropout rate and a linear layer. Table 2 lists the architectures, the number of trainable parameters, and references to the papers in which they were introduced. In addition to their performance on ImageNet, the models were chosen due to their wide range of depths and variance of parameters. InceptionV3 had the largest number of parameters at 22.29 million, while MobileNetV3 had the smallest architecturem with 5 million parameters. All models were loaded from the PyTorch library and were pre-trained on ImageNet. The models were also selected due to the diversity of their architectures. MobileNet uses a lightweight streamlined architecture with depth-wise separable convolutions [63]. Inception V3 has a deep architecture consisting of 42 layers that makes use of an auxiliary classifier to move class label information lower down the network [64]. VGG16 consists of 16 layers and has a uniform architecture that utilizes 3 × 3 filters throughout the entire architecture [65]. EfficientNet was designed using compound model scaling which balances the scaling depth, width, and image resolution of CNNs [66]. DenseNet allows for a deeper architecture by having each layer connect to layers deeper in the network [67]. ResNeXt uses a homogenous architecture consisting of repeated blocks with transformation functions [68].
The models were trained with early stoppage built-in to stop training if there were no improvements in the cross-entropy loss for 100 epochs after the best-performing epoch. This allowed for a shorter training time, but also provided the opportunity for the model to try to improve if no improvement was observed for a few epochs. Figure 6 demonstrates when model training is stopped. The configuration with the lowest cross-entropy loss on the validation set for each model was then selected as a part of the ensemble model. The models’ other hyperparameters include a learning rate of 0.000001, gradient clipping with a maximum value of 1, a weight decay of 0.01 for L2 regularization, and the use of the Adam optimization algorithm for weight updates. The learning rate was selected to be 10−6 after trying different learning rates to train the model. Values at lower magnitudes than 10−6 did not converge after 100 epochs, while learning rates of higher magnitudes were prone to overshooting, which led to validation accuracy oscillation after every epoch. L2 regularization, which adds the sum of squares of the model’s weight vector to the loss function, was used to incentivize the model to use smaller weights, which in turn helped to prevent overfitting and assisted the model in generalizing to unseen data.
In the second layer of the ensemble model, nine classical and tree-based classification algorithms were explored, such as standard vector classifier (SVC), random forest, logistic regression, K-nearest neighbors, extra tree classifier, Gaussian naive Bayes, AdaBoost classifier, bagging classifier, and decision trees. In addition, majority voting and unweighted average were also explored. In majority voting, the CNN base models ‘vote’ using their highest valued classification output as the preferred class. In unweighted average, the average of all CNN outputs was taken, and the highest scoring class was selected as the final output.

4. Results and Discussion

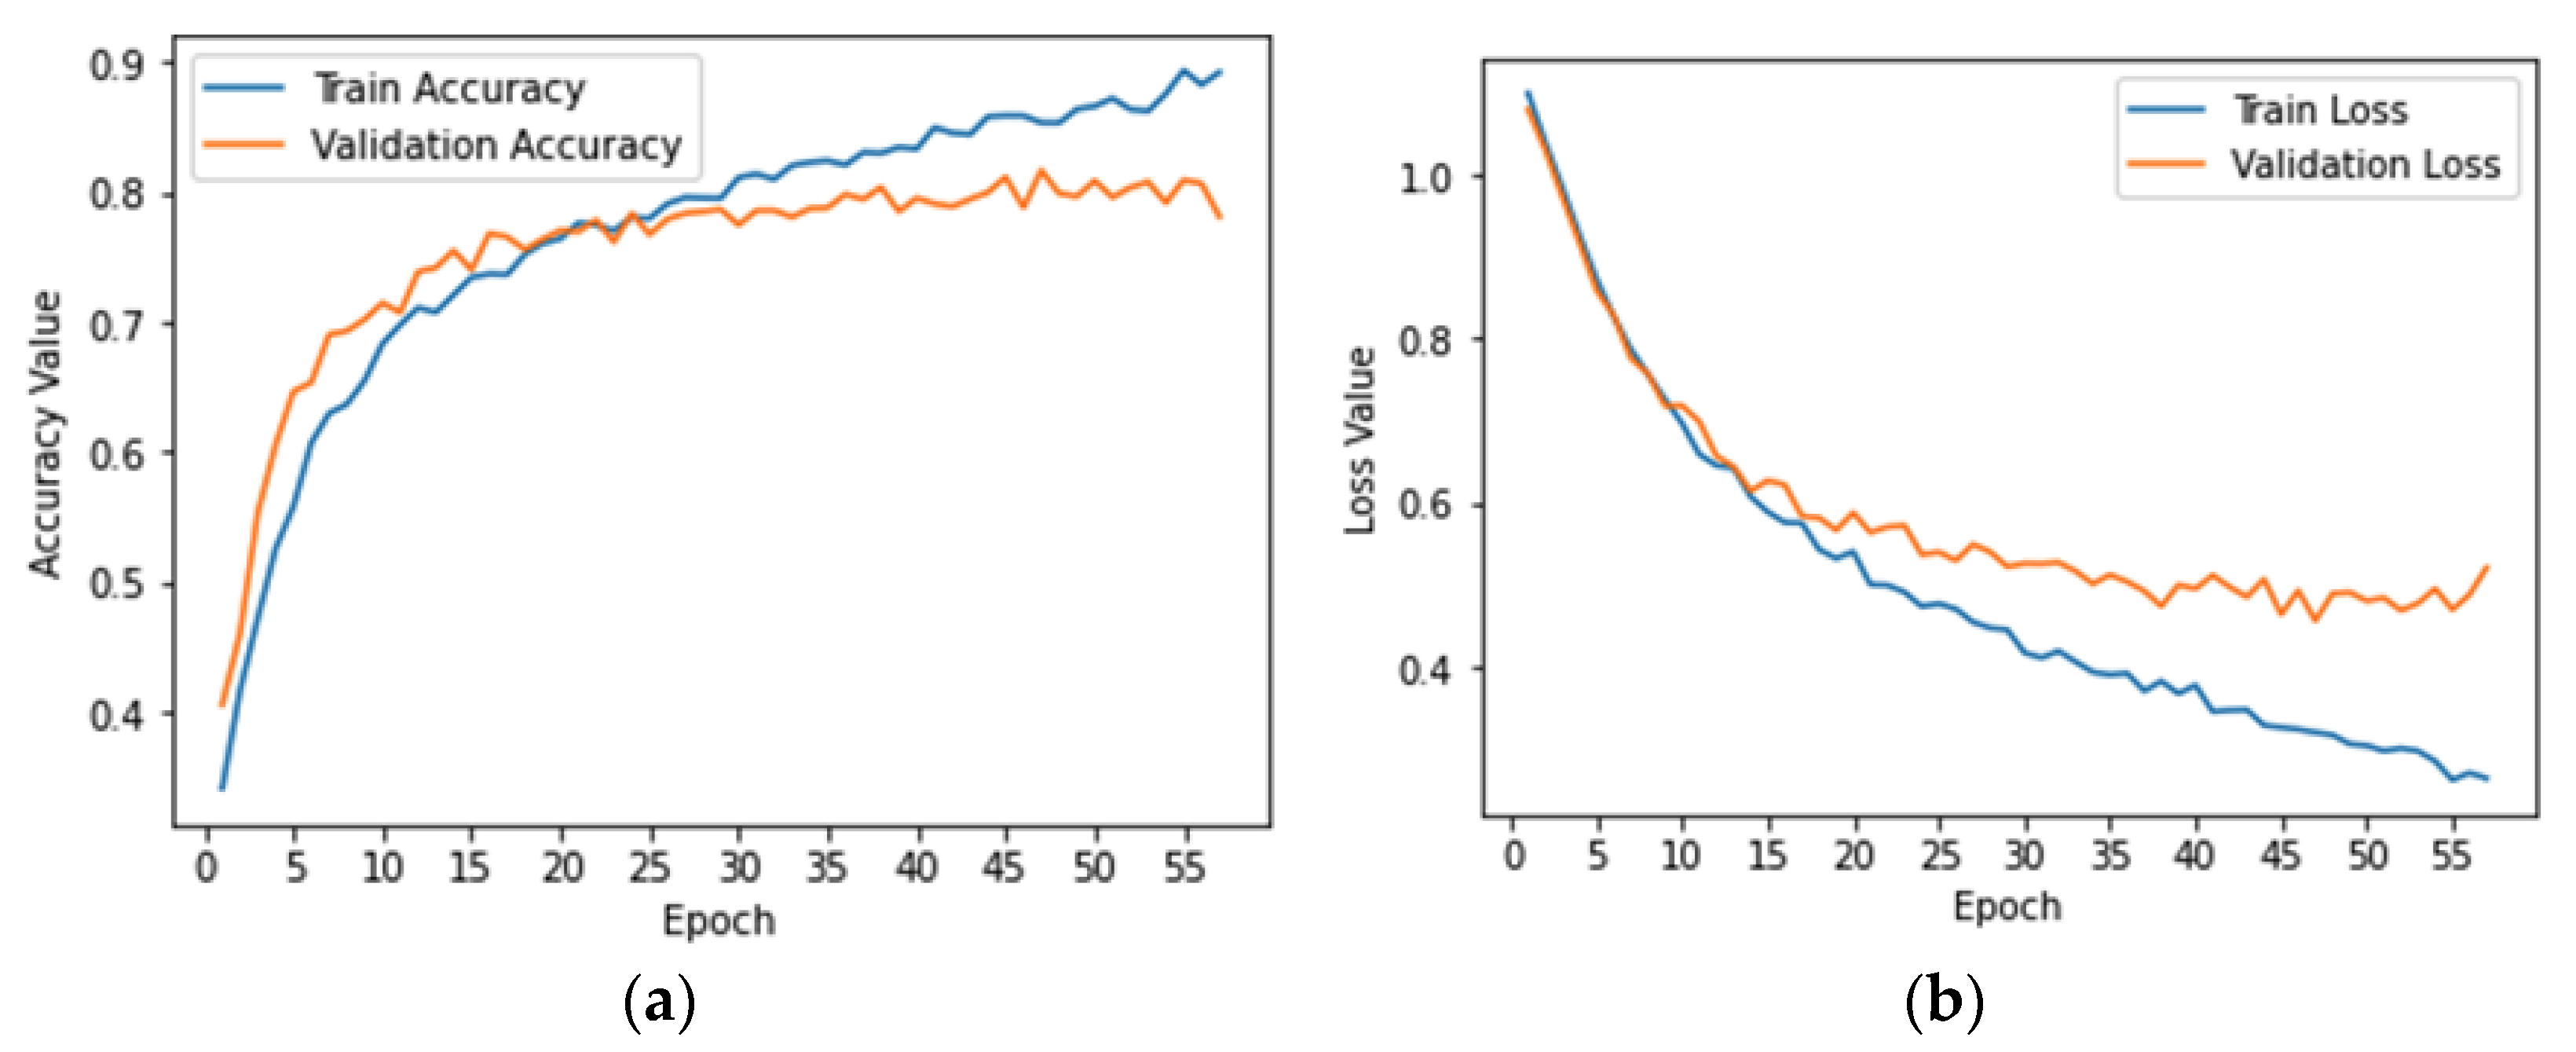
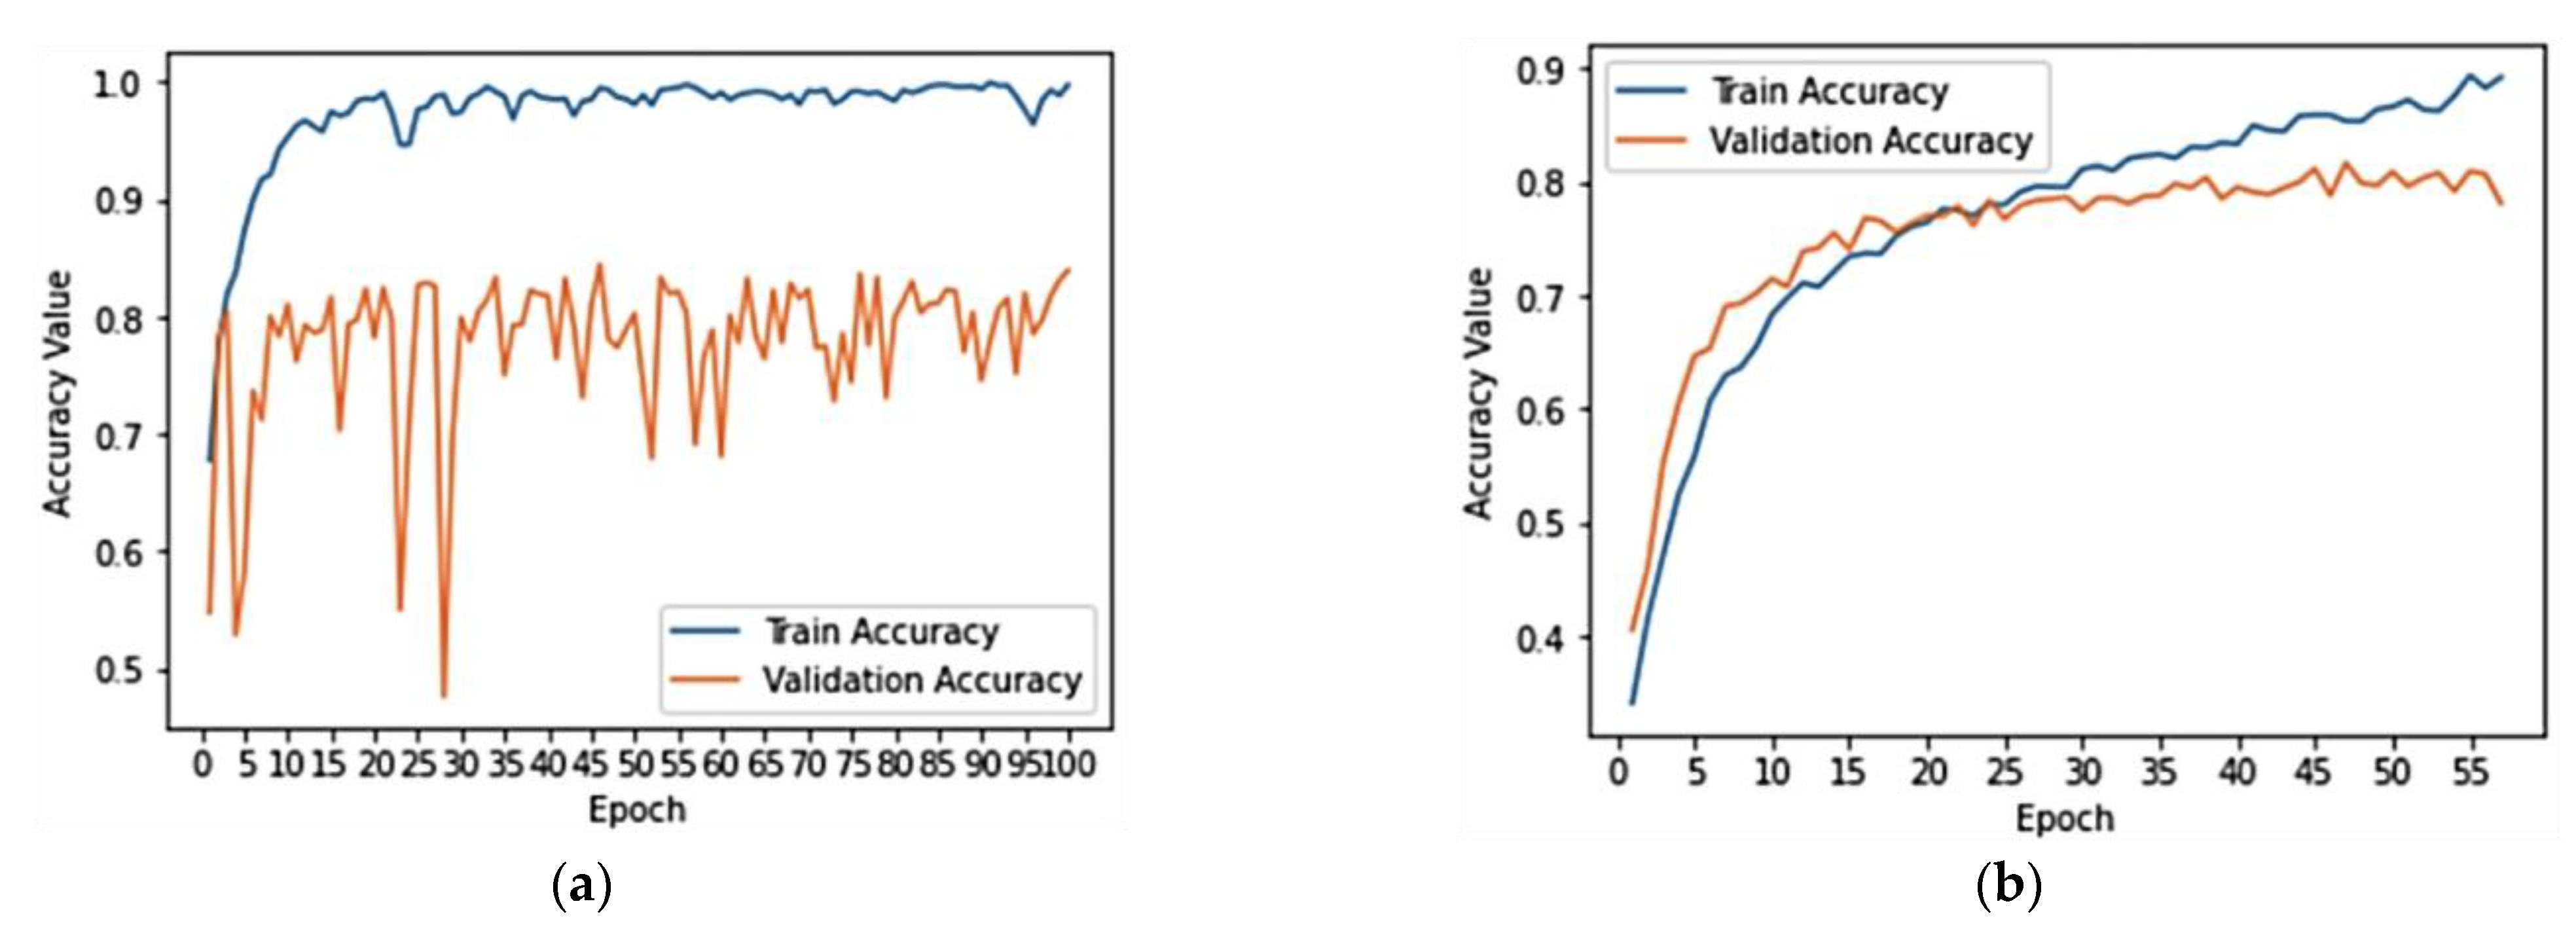
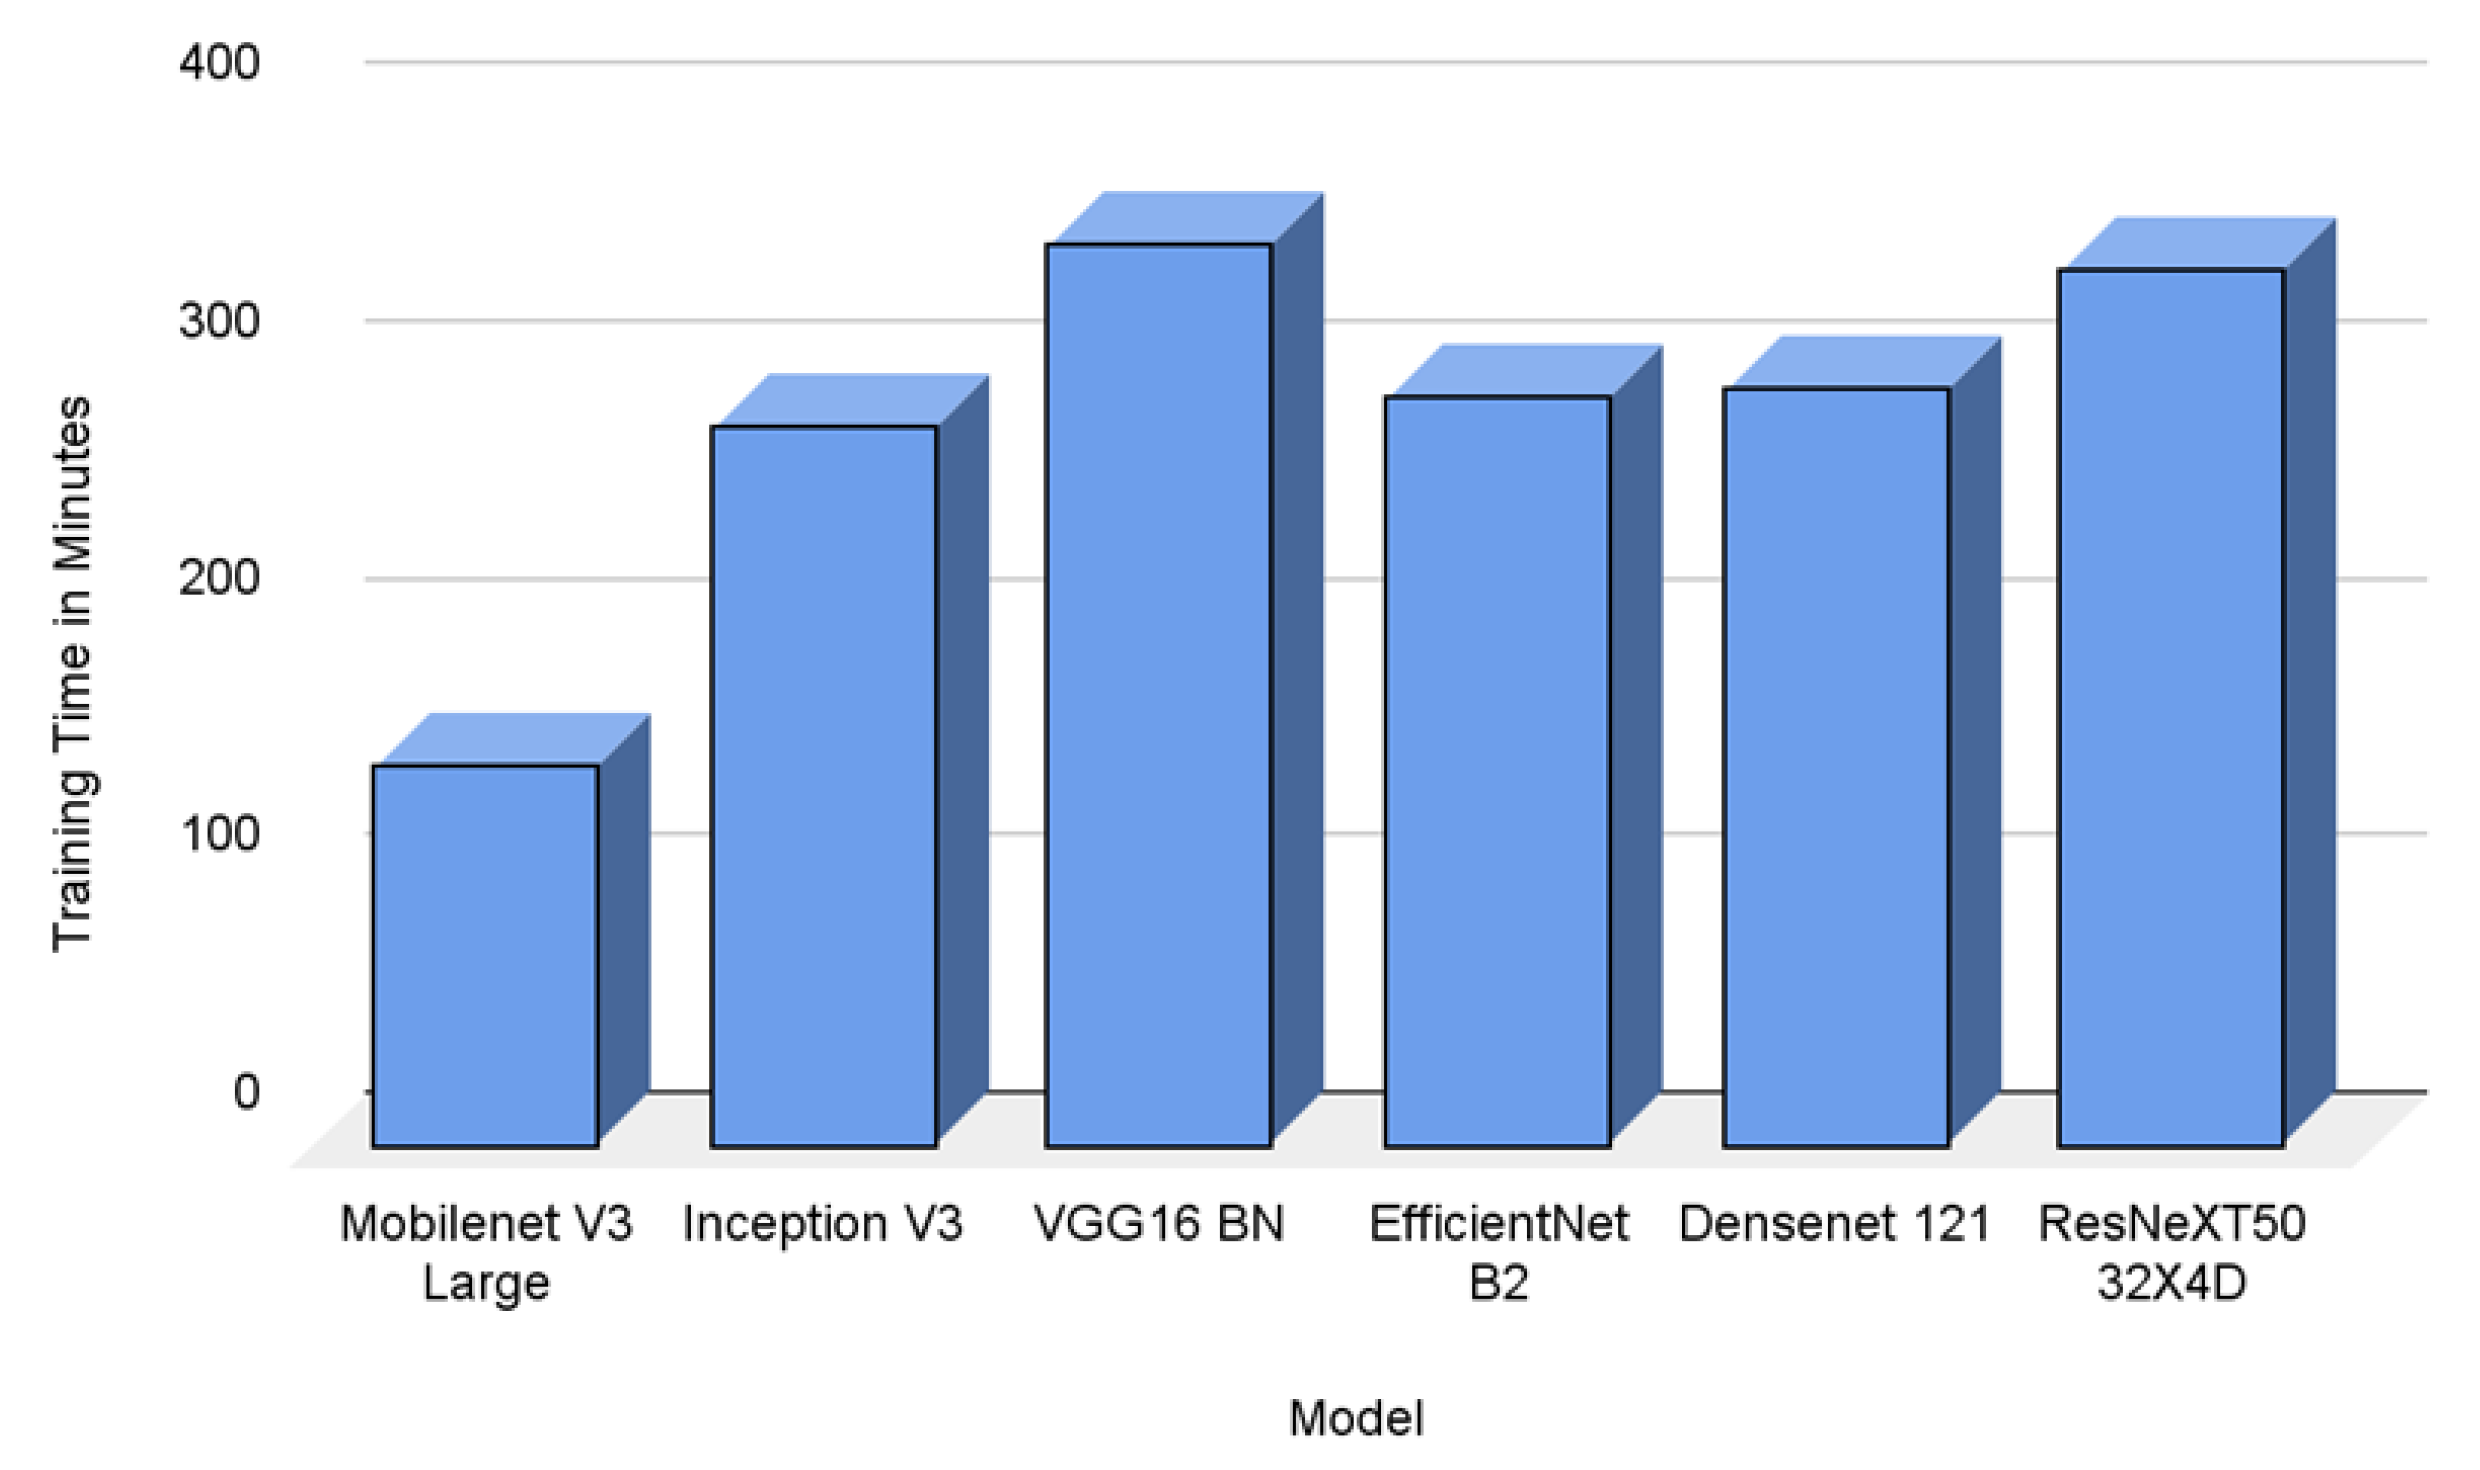
4.1. CNN Model Training and Results

A learning rate of 10−6 was appropriate in training all CNN models, since larger learning rates did not converge to a minimum cross-entropy loss and would vary widely between different epochs. Figure 7 shows the difference between a 10 × 10−4 and a 10 × 10−6 learning rate. The number of epochs to reach the best performance varied between models. VGG16 only ran for 40 epochs, while MobileNet and EfficientNet took 250 epochs to converge to the best validation set loss.
All CNN models were trained using NVidia Tesla P100 GPUs. Figure 8 shows the training time for each model. MobileNet, which had the smallest number of parameters, took the least amount of time to be trained, while VGG16, which had the largest number of parameters, took the longest time to be trained, at 350 min, which is 2.36 times longer than MobileNet. On average, it took 283 min (4.71 h) to train each model. Given that each model was trained independently, if enough resources are provided, the training time of the ensemble is constrained by the longest training time model, as each model could be trained in parallel.
The accuracy and F1-scores of the models on COVID-19, normal, and pneumonia detection are presented in Table 3. The models were evaluated on three-class classification, the ability to differentiate between COVID-19, normal, and pneumonia, and on two-class classification, the ability to classify a CXR as either belonging or not belonging to one of the three classes. MobileNetV3 and InceptionV3 yielded the highest accuracy in differentiating COVID-19 CXRs from non-COVID-19 CXRs, at 95.2%. This was in line with other studies including individual models [53]. While they had similar accuracies, MobileNetV3 had a higher F1-score when compared to InceptionV3, due to having higher a recall score (97.5% vs. 96.2%), indicating that the model was less likely to falsely misidentify COVID-19 patients as not being infected with the virus. ResNeXT was the poorest performing model in COVID-19 classification, yielding a 94.37% accuracy (vs. MobileNet and Inception’s 95.21%) and an F1-score of 85.17%, which was 4% lower than MobileNet. ResNeXT had the lowest recall from the CNN models, indicating that it was highly susceptible to mislabeling COVID-19 CXRs as non-COVID-19.
All CNN models performed worse at the pneumonia two-class classification when compared to the COVID-19 two-class classification. MobileNet’s pneumonia F1-score was 77.22%, while maintaining a COVID-19 F1-score of 88.64%. In the case of MobileNet it was observed that while precision for pneumonia was slightly lower than COVID-19 (80.32% vs. 81.25%), the model had a significantly lower recall for pneumonia vs. COVID-19 (74.34% vs. 97.5%). Similar trends could be seen in the rest of the models. DenseNet had the highest pneumonia F1-score, at 77.31%. The CNN models had better F1-scores compared to pneumonia when classifying normal. The mean F1-score for the normal classification was 83.57% vs. a mean F1-score of 75.5% for pneumonia. However, the average F1-Score for the normal classification was lower than the 87.24% F1-score for COVID-19 classification, with the mean recall being lower for normal vs. COVID-19, which meant the models were more likely to misclassify a normal image than a COVID-19 image.
MobileNetV3 yielded the highest overall accuracy at three-class classification, at 83.11%, which was reflected in its ability in two-class classification for all the labels. This also aligns with previous studies in which multi-class and two-class CXR classification were compared [24]. The poorest performer on the three-class classification was ResNext, yielding an 80.6% accuracy versus MobileNet’s 83.11%. All models performed better at differentiating between two classes (COVID-19 and non-COVID-19) than differentiating between three. This indicates that models found it more challenging to differentiate between pneumonia and normal patients than between COVID-19 and non-COVID-19 patients. MobileNetV3, despite being a top performer, mislabeled 46 of 406 normal CXRs as pneumonia, while only mislabeling 3 out of 160 as COVID-19 CXRs as pneumonia. MobileNetV3 had the smallest number of parameters, while InceptionV3 had the highest, indicating that increasing the number of parameters did not necessarily yield better results.

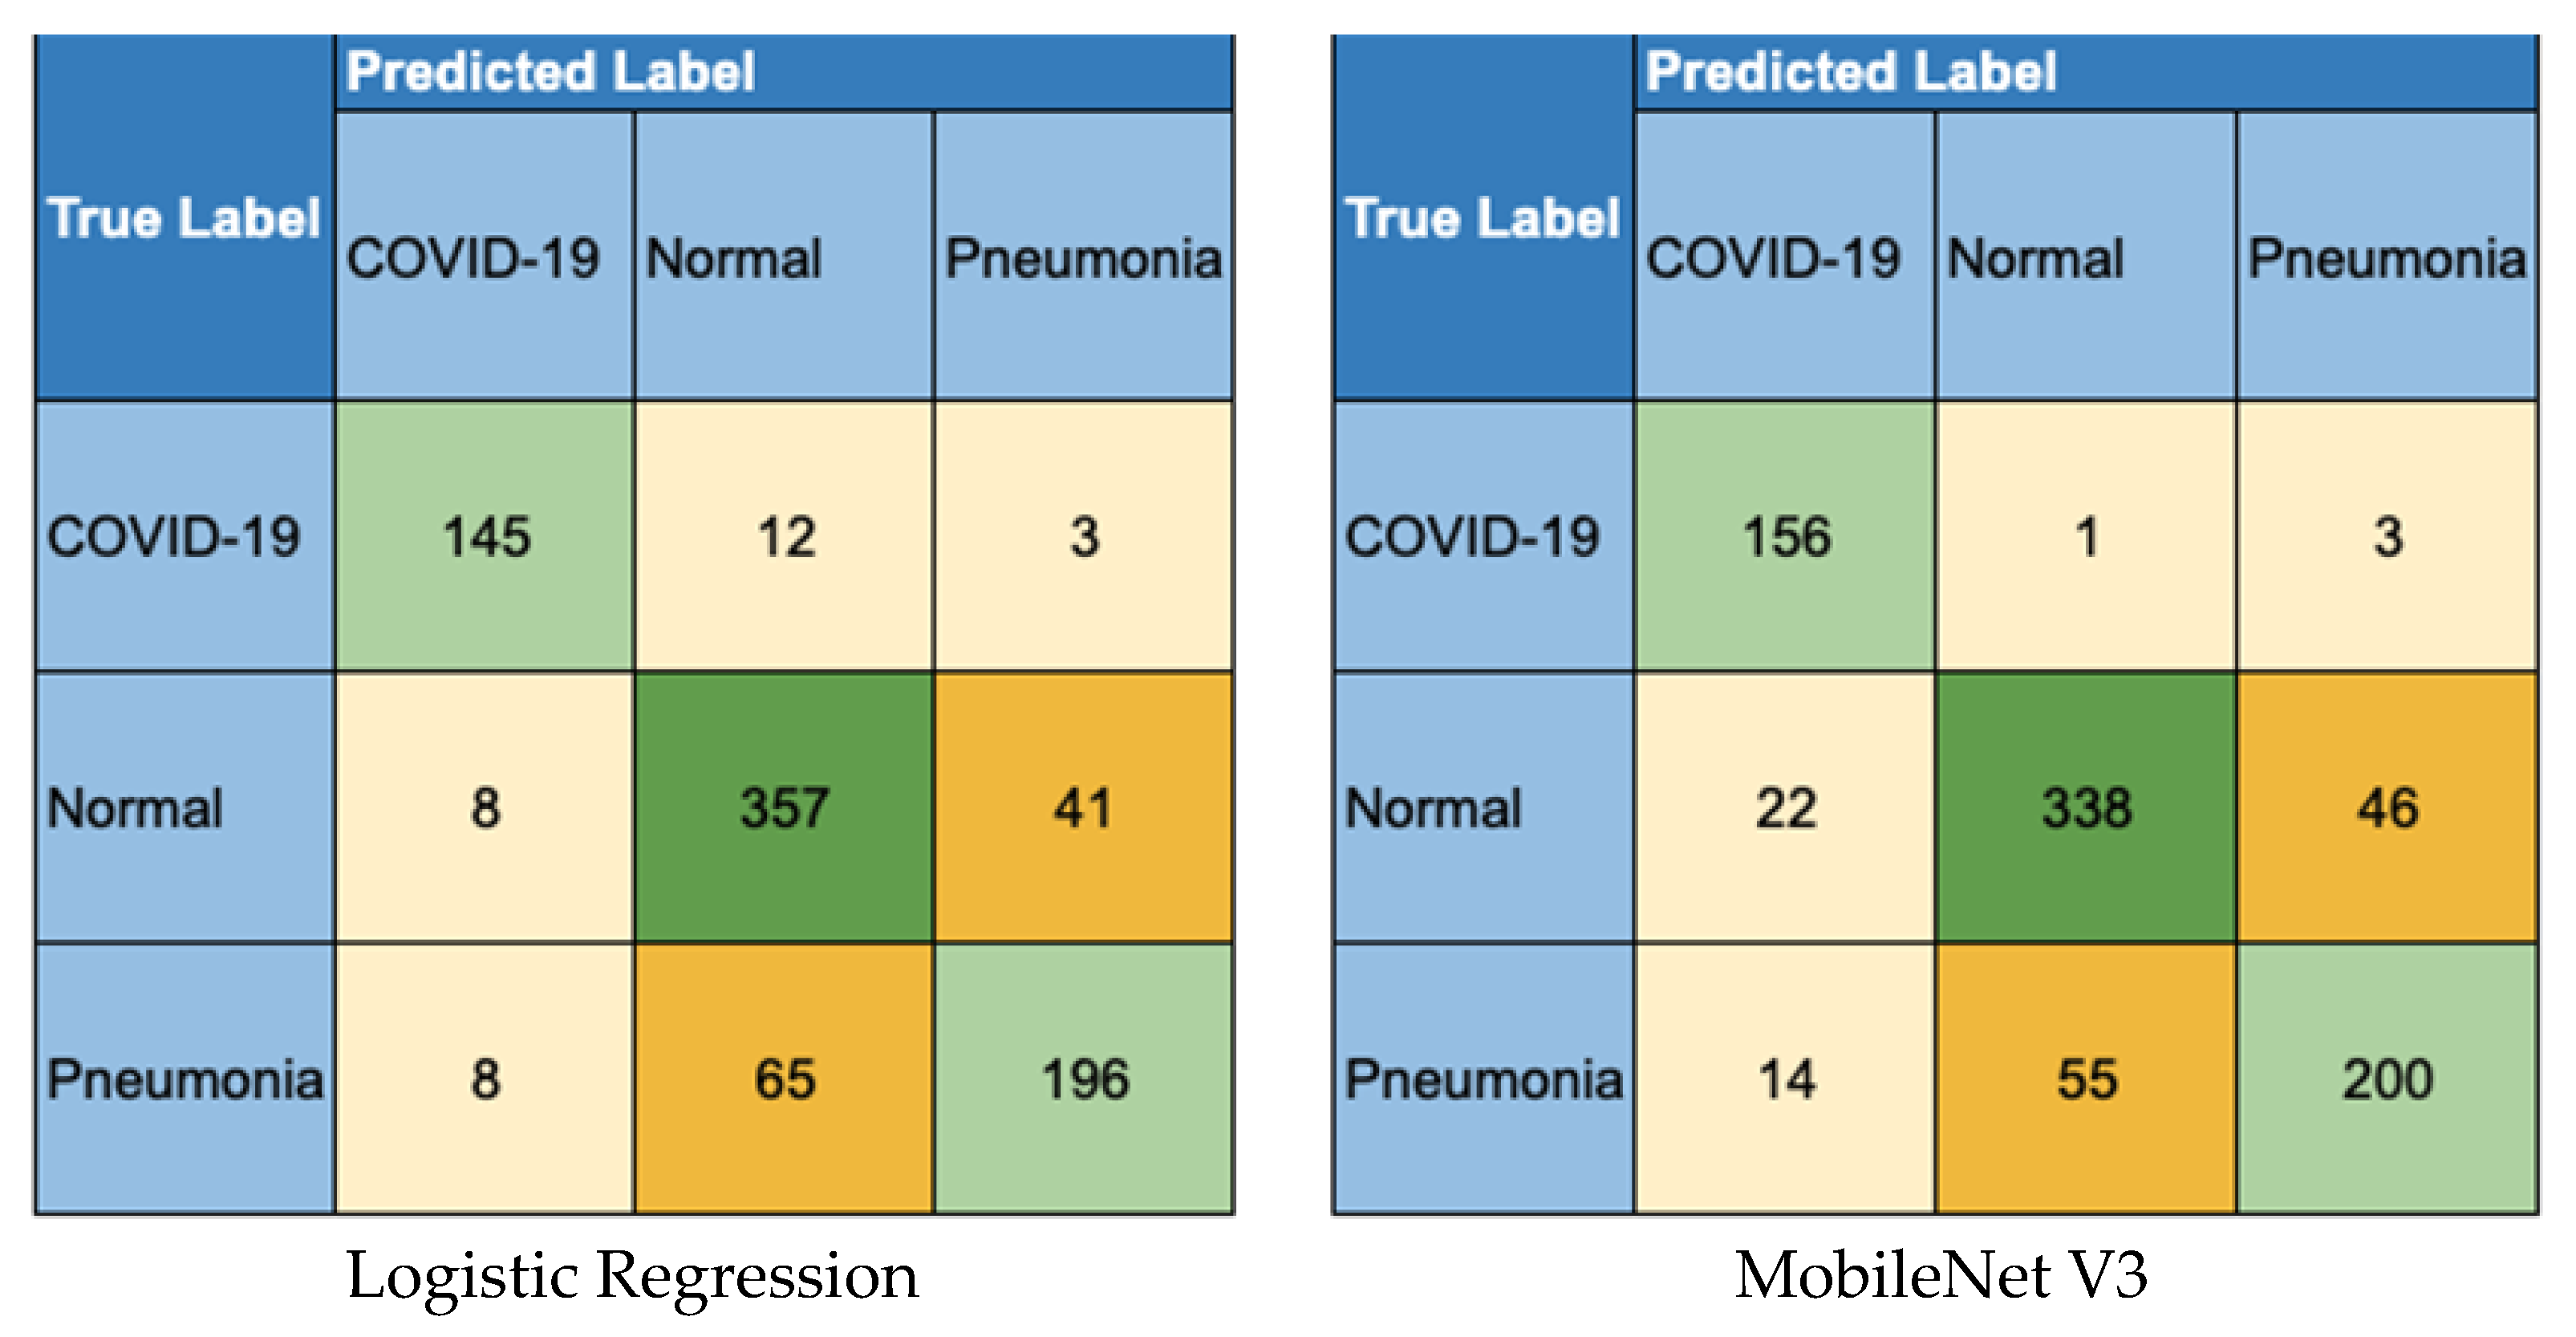
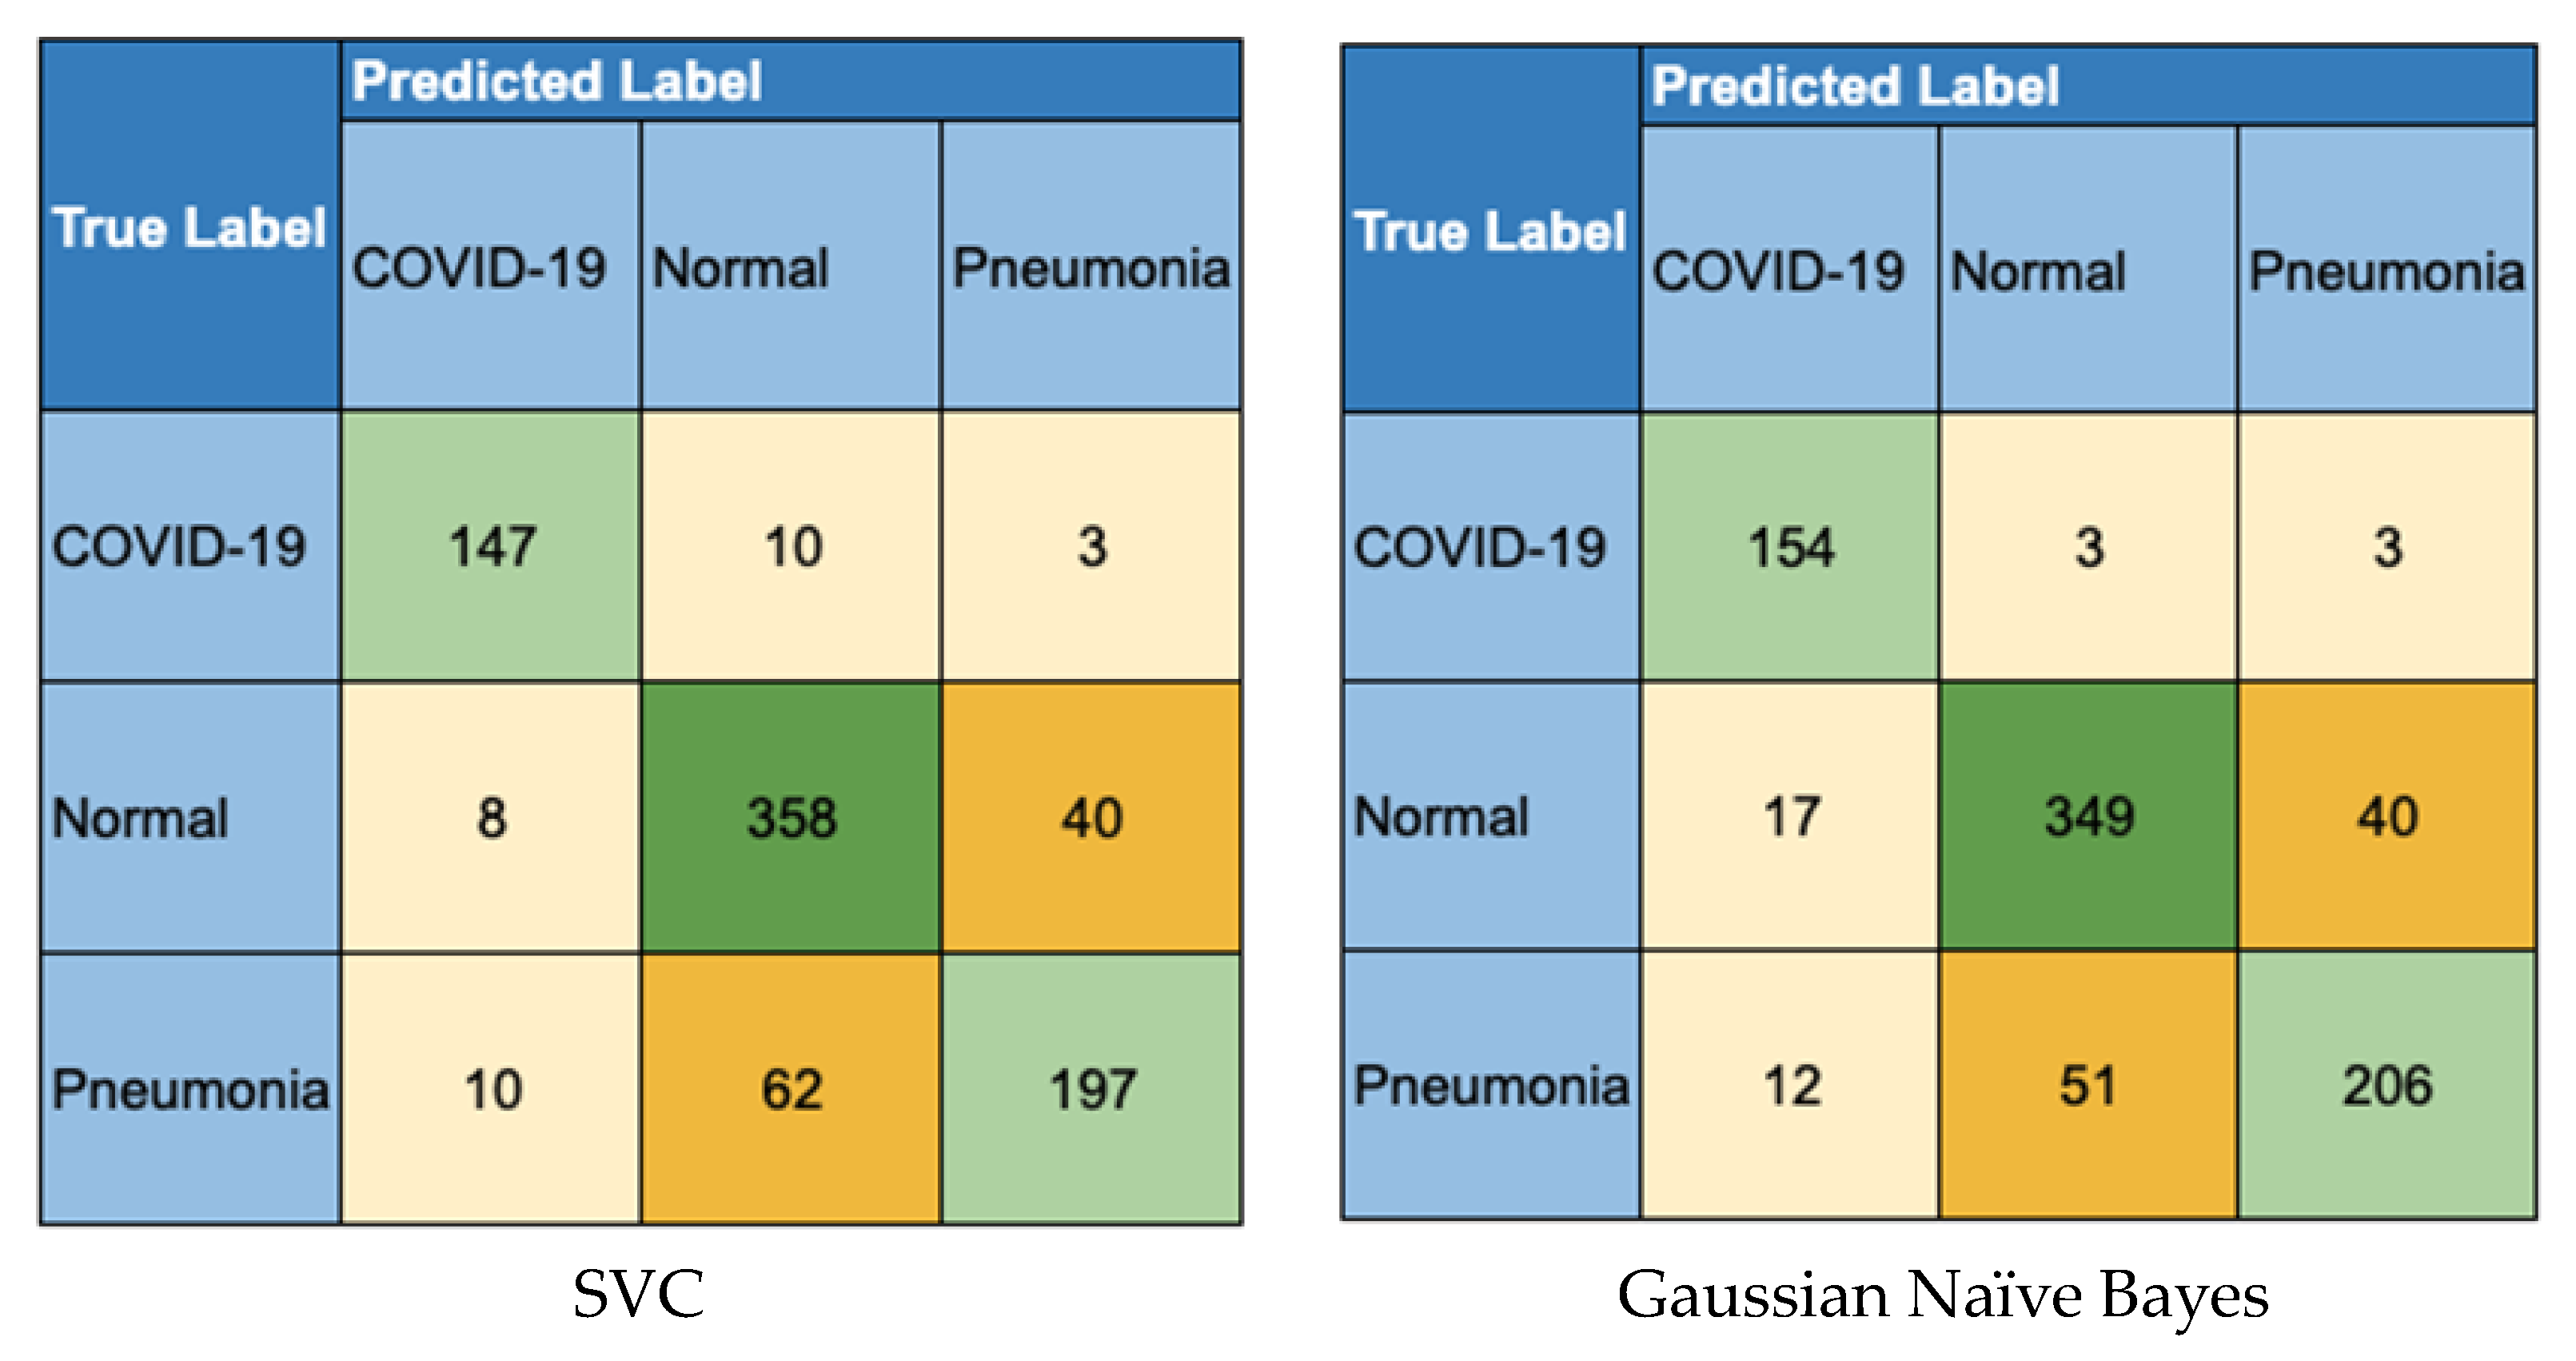
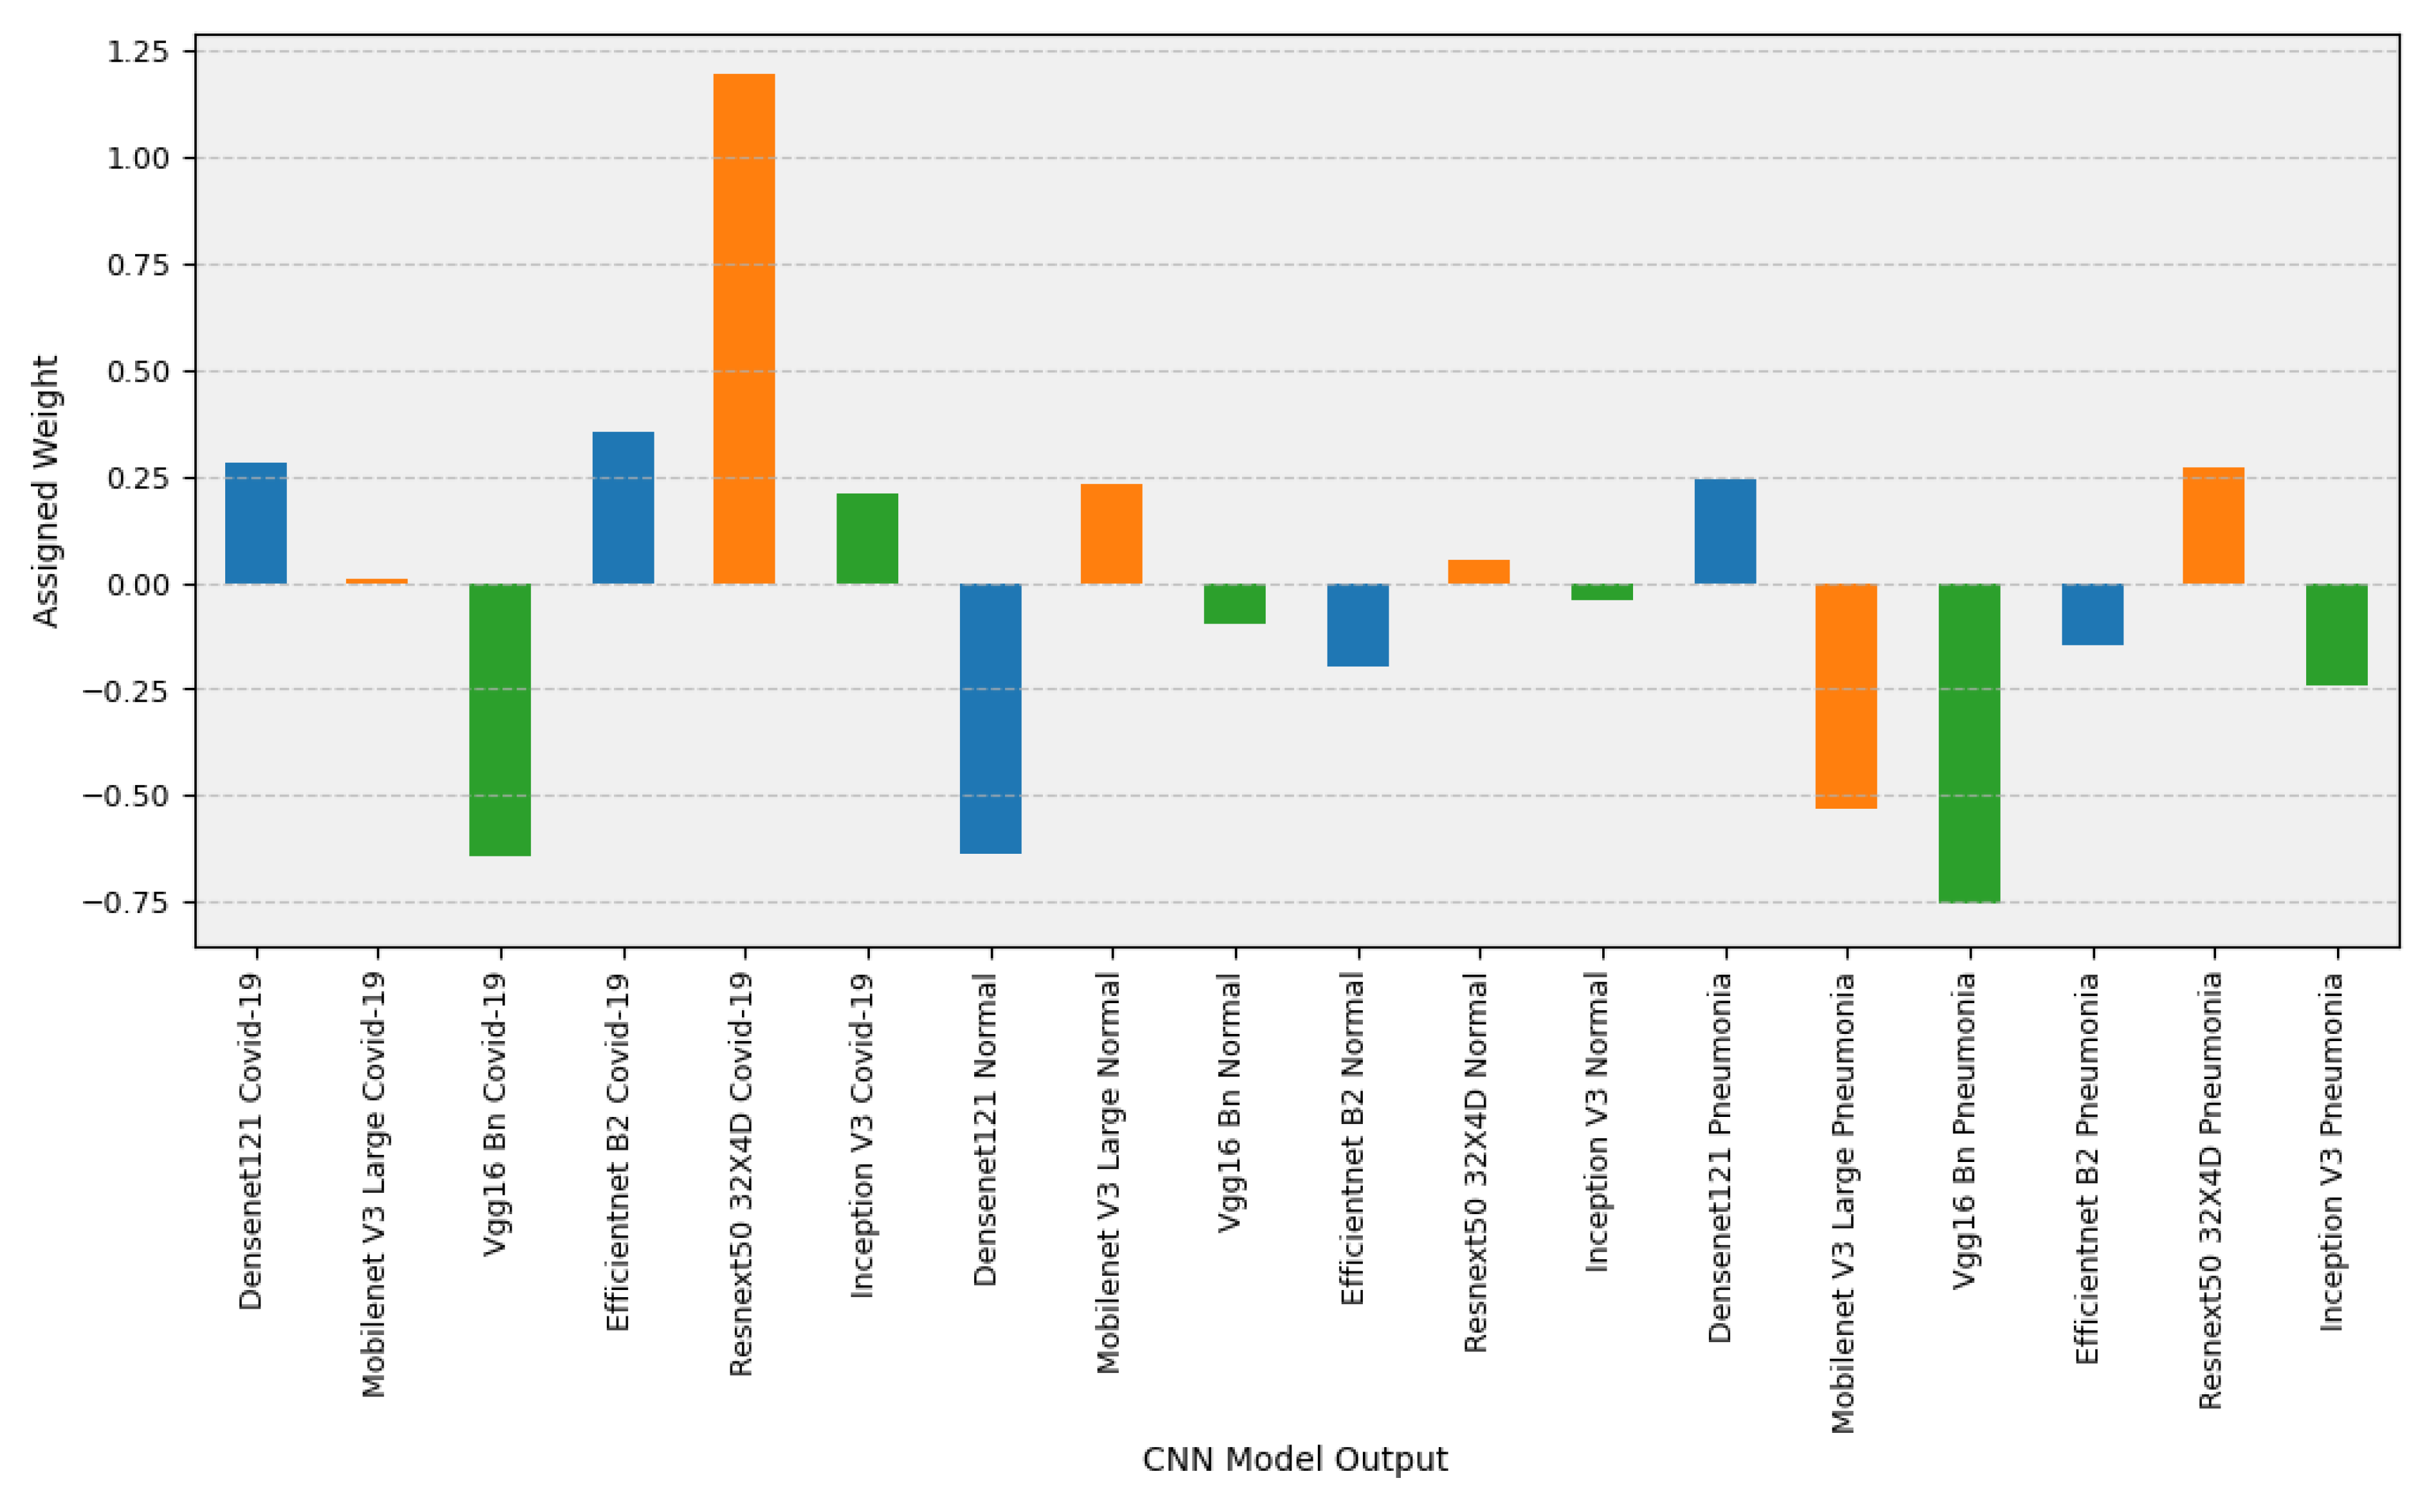
4.2. Ensemble Model Results

The prediction results of the CNN models of all classes in the training CXR test were used to train the second layer of classification models. Once the second layer was trained, the predictions of the CNN model base layer were passed into the second layer, and the outputs were assessed. Table 4 shows the results of the 11 ensemble models on each of the following: accuracy in differentiating between COVID-19, normal, and pneumonia, accuracy in differentiating between COVID-19 and non-COVID-19, accuracy in differentiating between normal and non-normal X-rays, and accuracy differentiating between pneumonia and non-pneumonia X-rays. The table also presents the F1-scores for classifying COVID-19, normal, or pneumonia X-rays in two-class classification to indicate the balance between the precision and recall of the models. Models that performed well in three-class accuracy were not necessarily better than other models in two-class classification. While Gaussian naive Bayes yielded the highest three-class accuracy score, it underperformed the other models in all two-class classification tests. In fact, there was no model that showed superiority in all classification metrics. The models had a higher COVID-19 accuracy on average (95.81%), when compared to three model accuracy (83.28%), normal accuracy (85.04%), or pneumonia (82.7%). For F1-scores, the models were able to achieve a better score on average for COVID-19 classification (89.33%), when compared to normal (84.92%) and pneumonia (76.8%). The F1-score standard deviation was 0.0126 for COVID-19, 0.0172 for normal classification, and 0.025 for pneumonia. This shows that not only were the models more accurate at COVID-19 classification than the other classes, but their results were also more homogenous with respect to the other classes. Pneumonia classification, in contrast, saw its accuracy reach as high as 79.84% with the unweighted prediction model, and as low as 71% with the AdaBoost classifier.
Table 5 shows the top-performing ensemble models for each class and compares their results to the top-performing base model. The table indicates the percentage improvement over the base model; if no improvement was noted, the ensemble model was omitted. While the ensemble models performed better in accuracy and F1-scores at all classes compared to the base models, there were cases in which some models had higher recall or precision. However, the base models that tended to excel at either recall or precision would perform relatively poorly in the other metrics. DenseNet 121 yielded the highest normal precision; however, this came at the cost of yielding the second-lowest normal recall. The ensemble models were 1.73% more accurate on average than the top-performing base model at two-class classification, with accuracy seeing the biggest improvement for pneumonia classification (+2.09%). Three-class classification saw a 2.16% increase from the top-performing MobileNet V3 algorithm. F1-scores saw a higher gain of 2.56% on average, with the highest gain for the pneumonia F1-score improving by 3.28% over the top-performing DenseNet model.
The confusion matrices for the top-performing ensemble models Logistic Regression, SVC and Gaussian SVC and a top-performing individual CNN, MobileNet V3 are shown in Figure 9. The confusion matrices show the overall performance of the models on the validation set. The logistic regression ensemble identified 145 COVID-19 X-rays correctly, while mislabeling 12 as normal and 3 as pneumonia. MobileNet V3 correctly labeled 156 COVID-19 images and mislabeled 4. However, MobileNet wrongly classified 36 images as COVID-19, while logistic regression mislabeled only 16 images as COVID-19, half of which were really pneumonia images, and the other half were normal. SVC behaved similarly to logistic regression, and mislabeled 18 images as COVID-19.
It can be seen in all the model confusion matrices that significant numbers of pneumonia X-rays were being mislabeled primarily as normal X-rays. Looking at MobileNet V3 gives an indication of how mislabeling pneumonia as normal was a trait inherited by the ensemble models from the base models. MobileNet v3 mislabeled 69 pneumonia X-rays as either COVID-19 or normal, while SVC mislabeled 72 and logistic regression mislabeled 73. However, Gaussian naive Bayes improved over MobileNet and mislabeled 63, i.e., 6 less than the latter. Normal X-rays were also more likely to be mislabeled as pneumonia than COVID-19. With logistic regression, it could be seen that 41 normal images (10.1%) of the total were mislabeled as pneumonia, while only 8 normal images were mislabeled as COVID-19. A similar trend can be seen for SVC, with which 40 normal images were mislabeled as pneumonia, while only 8 were mislabeled as COVID-19. Nevertheless, all three models outperformed MobileNet V3 at normal classification. Logistic regression correctly labeled 357, SVC correctly labeled 358 and Gaussian naive Bayes correctly labeled 349, while MobileNetV3 only managed 338 normal true positives.
Since the base CNNs did not yield similar results in the classification tasks, the ensemble models assigned different weights to each base model in order to yield the best possible results. Figure 10 exhibits the weights that the top-performing logistic regression model assigned to the outputs of each CNN base model for the three classes. The logistic regression model uses these weights to predict the COVID-19 class. The ResNext CNN model, which had the highest COVID-19 precision out of all models, was given the biggest weight for its COVID-19 prediction. Conversely, VGG16 had the highest negative value for COVID-19 prediction, meaning that an increase in the VGG16 prediction would lead to a decrease in the predicted probability of COVID-19 by the ensemble model.

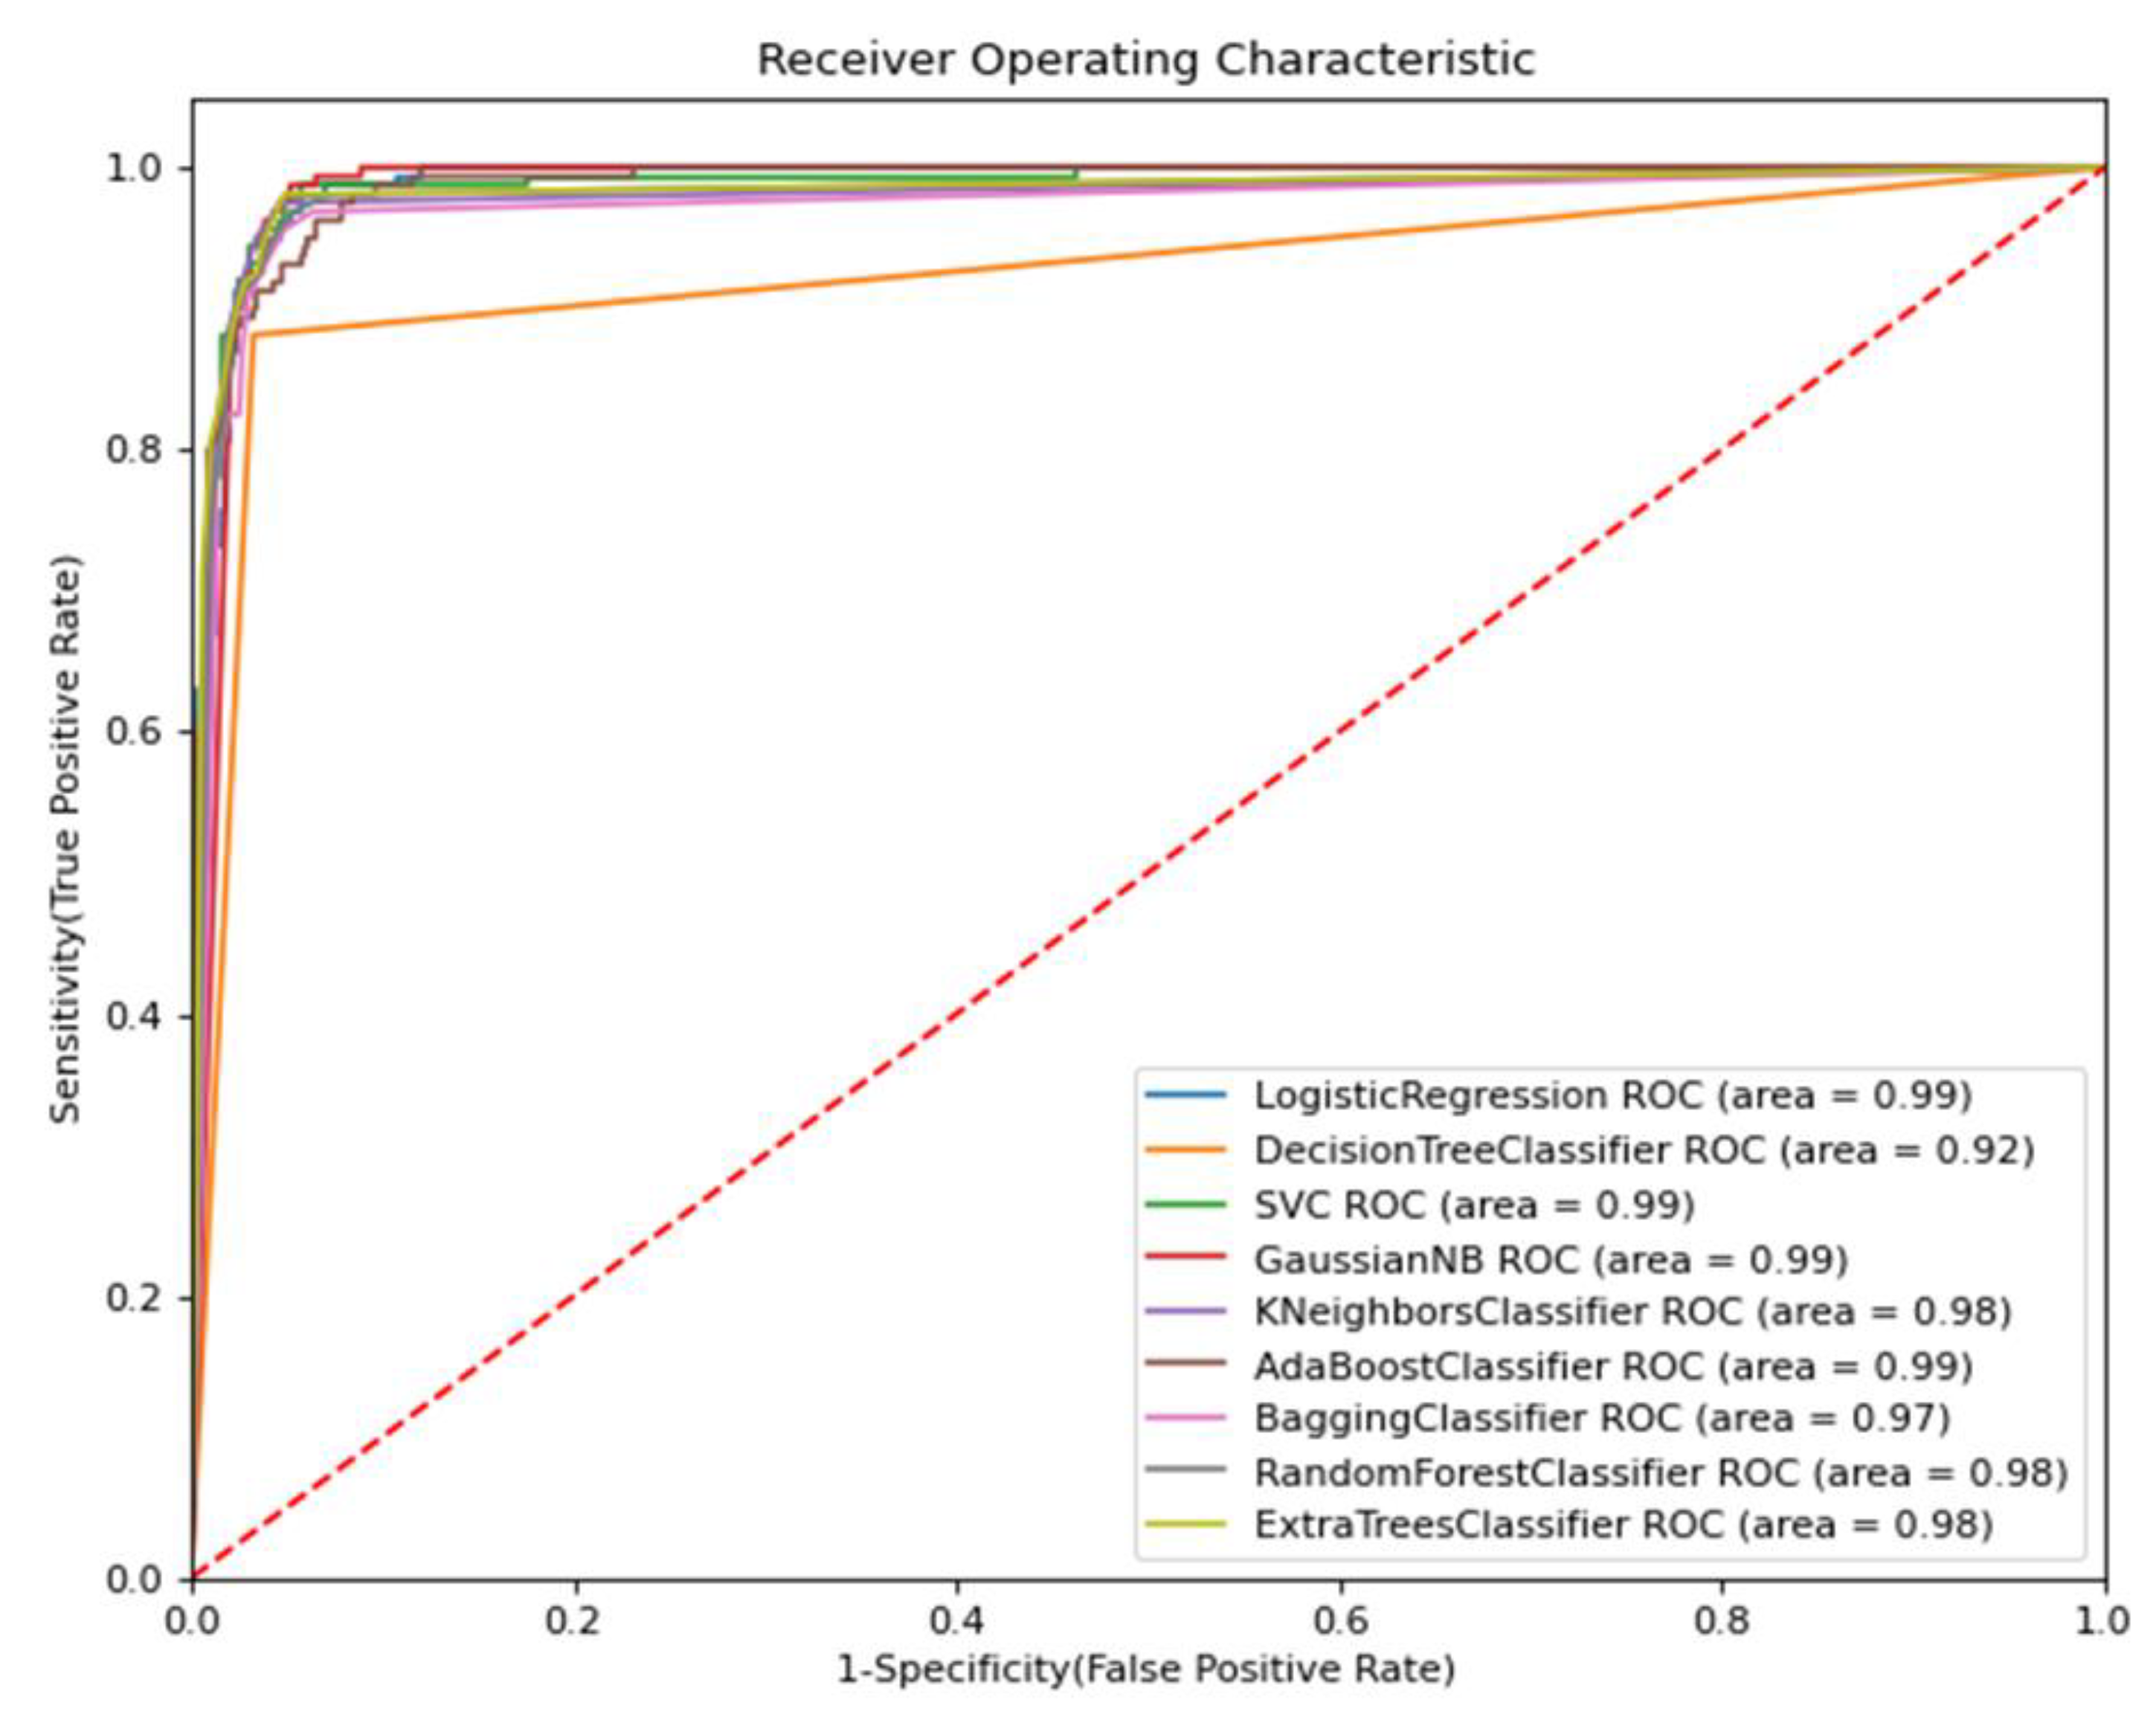
4.3. Performance Comparison Analysis

9 out of 11 ensemble models obtained better accuracy in detecting COVID-19 than any of the individual models. The logistic regression ensemble model yielded the highest accuracy in COVID-19 detection, at 96.29%, outperforming MobileNetV3 by 1.13%. The logistic regression ensemble model was less likely to mislabel normal and pneumonia CXRs as COVID-19, yielding a higher precision of 90% vs. MobileNetV3’s precision of 81%. While MobileNetV3 had the highest recall of any model, at 97.5%, it did so by having the second lowest precision of 81.2%, indicating that the model was willing to allow a higher number of false positives. Logistic regression brought a significant gain of 10.8% to precision and produced a higher F1-score of 90.3% vs. MobileNetV3’s 88.6%, at the cost of reducing recall by −7%. This suggests that ensemble models are better at balancing out the results of models with varying precision and recall, which allows the production of models that do not sacrifice one for the other and yield overall higher F1-scores than base models. If the main priority of healthcare workers is to minimize false negatives, then the MobileNet V3 or Gaussian naive Bayes ensemble model would be a better choice than the logistic regression ensemble model. However, if resource constraints are an issue and false positives will create additional pressure on the facility, the logistic regression ensemble model provides the best balance between lowering false positives without adding too many false negatives. The ROC curve for COVID-19 classification is shown in Figure 11 with logistic regression, SVC, Gaussian naive Bayes, and AdaBoost classifier reaching a ROC curve of 0.99.
Gaussian naive Bayes yielded the highest overall three-class accuracy of 84.91%, which was 2.16% higher than MobileNet V3. Gaussian naive Bayes was better at differentiating between normal and pneumonia CXRs when compared to MobileNet V3, while slightly underperforming in differentiating between COVID-19 and non-COVID-19 CXRs. Gaussian naive Bayes’s COVID-19 recall was 96.2%, while MobileNet V3’s COVID-19 recall was 97.5%. Unweighted average voting had the highest normal and pneumonia label accuracies at 86.83% and 87.66%, respectively. It outperformed MobileNet V3 in the two classes by 1.97% and 2.09%. Unweighted average voting’s superior performance in these two classes exhibits how ensembles can smooth over the poor performance of individual models. Since it takes the votes of all the models, it diminished the effects of low normal precision and high normal recall of the ResNext base model, and contrasted the high normal precision and low normal recall models such as EfficientNet and DenseNet, and yielded F1-scores 3pp higher than those models.
All ensemble models had lower F1-scores in pneumonia classification when compared to COVID-19 and normal classification. For logistic regression, the F1-score for pneumonia was 0.77, while COVID-19 and normal classifications were 0.9 and 0.85, respectively. All models performed poorly on pneumonia recall, with normal CXRs frequently being mislabeled as pneumonia. While the top ensemble model outperformed the top base model in pneumonia classification, the low-performance ensemble models indicate that they cannot substantially improve the performance of a class if the base models performed poorly in its identification.
Unweighted average and majority voting, while maintaining simple policies and not learning from previous data, performed well on overall accuracy. The unweighted average ensemble model reached 84.91% accuracy, similar to the Gaussian naive Bayes model, while majority voting had an accuracy of 84.43%. The models excelled in pneumonia classification accuracy, maintaining the highest precision for the class amongst ensemble models, while not sacrificing as much recall. The top-performing unweighted average model had a pneumonia accuracy of 87.66% vs. an average performance of 85.22%. Nevertheless, majority voting and unweighted average performed below average for COVID-19 accuracy, due to lower-than-average precision in COVID-19 classification.
Table 6 shows the performance of ensemble models based on different numbers of CNN models as base models. Models were ranked from best to worst performers at COVID-19 accuracy, and each set would use the highest-performing models. Using two base models and a classifier yielded a higher accuracy and F1-score than using the top-performing base model individually. The highest accuracy and F1-score are achieved with four models and a support vector classifier, which yields an accuracy of 96.53%, 1.3% higher than MobileNetV3. After four models, performance improvement plateaus and starts to decrease at six models, indicating that adding additional models with poorer performance starts to drag down the ensemble model performance.

4.4. Performance Comparison with Previous Works

The performance comparisons between the proposed logistic regression ensemble model in COVID-19 detection accuracy and the similar works presented by other researchers in the state of the art have been shown in Table 7. Hira et al.’s [39] Se-ResNeXt achieved 99.23% accuracy using a dataset consisting of 6674 images. Ozturk [24] used DarkNet to achieve a 98.08% two-class accuracy with 127 COVID-19 CXRs, 500 normal CXRs, and 500 pneumonia CXRs. Narin et al. [38] achieved 98% accuracy using ResNet-50 and a dataset containing 341 COVID-19 CXRs, 2800 normal CXRs, and 4265 pneumonia CXRs. Chhikara et al. [49] used a dataset containing 2245 COVID-19 CXRs, 2313 normal CXRs, and 2313 pneumonia CXRs. Their proposed Inception V3 included additional node dropping, normalization, and dense layers, achieving an accuracy of 97.7%. The proposed ensemble model accuracy was 2.7% lower than the top-performing model, but the performance was still in the top ten of those listed in Table 7. The study reinforces the notion that CNN models are effective in differentiating COVID-19 CXRs from the CXRs of patients with pneumonia and healthy patients. The presence of a variety of architectures in the list including ResNets, VGG, and Inception indicates that these models are effective in COVID-19 detection and reinforces the importance of their inclusion in the ensemble model. Furthermore, the success of these models encourages the usage of different architectures of these models as the basis for future ensemble models.
Table 8 compares the model to other models that have used the BIMCV COVID-19+ dataset for training and evaluation. P. de Sousa et al. [69] proposed a custom deep learning architecture and used the BIMCV COVID-19+ dataset. Their model achieved an accuracy of 98.84%. Arias-Garzon et al. [70] used a pre-processing technique on the BIMCV dataset for lung segmentation and to remove lung backgrounds. They then used VGG-19 with lung segmentation to yield an accuracy of 96.30%. The usage of VGG19 to yield slightly lower results on the same dataset reinforces the usefulness of integrating VGG architecture into the proposed ensemble. Mizuho et al. [71] used EfficientNet on the same dataset to achieve 94.60%. VGG’s outperformance of EfficientNet reflects the results seen in the proposed model’s individual model evaluation stage prior to the ensemble stage. Duran-Lopez et al. [61] proposed a novel model, COVID-XNet, trained and evaluated using the BIMCV and PadChest datasets. The model yielded an accuracy of 94.43%. The proposed SVC model outperformed all models except the custom model by de Sousa et al. [69].

4.5. Strengths

The proposed ensemble model demonstrates how a group of deep learning models can outperform individual models in COVID-19 classification by harnessing their strengths, smoothing over their biases, and producing higher overall accuracies. In addition, the ensemble model had higher F1-scores than individual models, indicating that it was able to balance the requirements of precision and recall and not decrease COVID-19 false positives at the expense of increasing COVID-19 false negatives. The model can be modified by adding or replacing one of the base ensemble models with a high-performing CNN or a CNN with a different architecture in the future. This could possibly allow for even more accurate models by leveraging more accurate models and triangulating the results with the other CNNs that make up the ensemble. Furthermore, the model can be easily deployed in the field once trained, and only requires a computer on which the X-ray images can be uploaded. This would allow quick analysis after the X-ray has been taken, and allows immediate action if the algorithm finds the X-ray COVID-19+. Finally, even in environments in which PCR tests are available, the algorithm allows a secondary complementary analysis that could assist doctors. The only additional resources to factor in are access to X-rays and a computer.

4.6. Limitations

From the comparisons to other models, it can be stated that the ensemble model is a robust method for COVID-19 classification; however, the model has yet to reach the state of the art, and could be improved upon. The proposed ensemble model was trained on an imbalanced dataset, with normal and pneumonia CXRs outnumbering COVID-19 CXRs by 2.52:1 and 1.73:1 respectively. While models trained on balanced datasets have been presented [72,73], there were many examples of models that were built using imbalance datasets that were able to achieve high accuracies [24,38,39]. Nevertheless, better performance could have been achieved if the dataset had a higher ratio of COVID-19 X-rays, and this can be considered in future work by aggregating different vetted open-source datasets together.
Another factor that can be considered is the distribution of the dataset, with patients coming from the region of Valencia in Spain, which means there is a high likelihood that the ethnicity of patients is skewed towards the ethnic makeup of Valencia. Future work could include datasets from different countries to be more representative of the distribution of COVID-19 cases worldwide. Integrating datasets aggregated from multiple sources such as the COVID-QU-Ex dataset [74], which is an aggregated dataset in itself, could be considered; however, care should be taken to ensure consistent selection criteria are applied across all the datasets, avoiding patient duplication, ensuring adherence to patient privacy and excluding X-rays of different distributions from the ones that will be used for evaluation (e.g., X-rays taken from different angles).

5. Conclusions

In this paper, an ensemble model of six CNN architectures was assembled to detect COVID-19 from CXR images. A dataset of COVID-19, normal, and pneumonia class images was assembled and used to train the CNN architectures. Some 11 ensemble models were then evaluated. The ensemble models used the CNN architectures’ predictions as inputs for a classification algorithm. Most of the ensemble models were able to produce more accurate COVID-19 detection than individual architectures. The ensemble models also produced higher F1-score classification, suggesting they were better at balancing precision and recall than individual models that excelled at one metric or another. The paper also demonstrates that there is a limit to performance improvement, as the number of base CNN models in the ensemble model increases as poor-performing CNN models start to drag down the performance of the ensemble.
The logistic regression, support vector classifier, and random forest classifier ensemble models produced the highest accuracies of 96.28% in COVID-19 detection, while the support vector classifier model yielded the highest F1-score of 90.46%. The results were further improved by only using the top four performing CNNs and a support vector classifier, with accuracy increasing to 96.53% and F1-score improving to 91.34%. These results are on par with other studies in COVID-19 detection from CXRs. The results of the paper add more evidence that CNNs are adept at detecting COVID-19 from CXRs, and CNNs could be used to assist in the quick diagnosis of patients to determine if they have been infected. COVID-19 diagnostics using X-rays and CNNs would allow cheap and fast detection of COVID-19 in rural areas equipped with radiology equipment. Furthermore, the proposed ensemble model has shown that combining multiple CNN models into an ensemble yields better results than individual models, and this concept can be integrated into future COVID-19 detection model designs by leveraging different sets of top-performing models. This would allow for the design of models that are more accurate, as the individual weaknesses of any set of models would be smoothed over to produce a more resilient overall performance.
Future directions for improving the model and addressing the current study’s limitations will include adding more pneumonia images to improve performance in the class, and adding more CXRs of patients from other geographic regions to include a wider demographic variety of patients. Future work may also include integrating successful pre-processing methods and CNN models from other studies into the ensemble model, and using GRAD-CAM to make the model more explainable.

Author Contributions

All authors have equal contributions to prepare and finalize the manuscript. Conceptualization, T.E.L. and M.A.; methodology, T.E.L. and M.A.; validation, T.E.L., M.A. and J.H.; formal analysis, M.A. and J.H.; investigation, T.E.L. and M.A.; resources, T.E.L.; data curation, T.E.L.; writing—original draft preparation, T.E.L.; writing—review and editing, T.E.L., M.A. and J.H.; visualization, M.A. and J.H.; supervision, M.A. and J.H.; project administration, M.A. All authors have read and agreed to the published version of the manuscript.

Funding

This research received no external funding.

Institutional Review Board Statement

Not applicable.

Informed Consent Statement

Not applicable.

Data Availability Statement

The data presented in this study are available in the article.

Conflicts of Interest

The authors declare no conflict of interest.

References

  1. Sharma, R.; Agarwal, M.; Gupta, M.; Somendra, S.; Saxena, S.K. Clinical Characteristics and Differential Clinical Diagnosis of Novel Coronavirus Disease 2019 (COVID-19). Coronavirus Dis. 2019 COVID-19 2020, 2020, 55–70. [Google Scholar]
  2. Jayaweera, M.; Perera, H.; Gunawardana, B.; Manatungea, J. Transmission of COVID-19 virus by droplets and aerosols: A critical review on the unresolved dichotomy. Environ. Ress. 2020, 188, 109819. [Google Scholar] [CrossRef] [PubMed]
  3. Vilella, A. The COVID-19 Pandemic-an Epidemiological Perspective. Curr. Allergy Asthma Rep. 2021, 21, 29. [Google Scholar] [CrossRef] [PubMed]
  4. Wang, T.; Du, Z.; Zhu, F.; Cao, Z.; An, Y.; Gao, Y.; Jiang, B. Comorbidities and multi-organ injuries in the treatment of COVID-19. Lancet 2020, 395, e52. [Google Scholar] [CrossRef] [PubMed]
  5. Merkur, S.; Maresso, A.; Cylus, J.; Ginneken, E.; Lessof, S. Lessons from the First Wave: The COVID-19 Health System Response Monitor an Evidence Resource and a Source of Analysis. Eurohealth 2020, 26, 5–9. [Google Scholar]
  6. Burki, T. Global COVID-19 Vaccine Inequity. Lancet Infect. Dis. 2021, 21, 922–923. [Google Scholar] [CrossRef]
  7. Kwon, R.; Rahmati, M. Global, regional, and national COVID-19 vaccination rate in 237 countries and territories, March 2022: A systematic analysis for World Health Organization COVID-19 Dashboard, Release 2. Life Cycle 2022, 2, e15. [Google Scholar] [CrossRef]
  8. Qjidaa, M.; Ben-Fares, A.; Mechbal, Y.; Amakdouf, H.; Maaroufi, M.; Alami, B.; Qjidaa, H. Development of a clinical decision support system for the early detection of COVID-19 using deep learning based on chest radiographic images. In Proceedings of the 2020 International Conference on Intelligent Systems and Computer Vision (ISCV), Fez, Morocco, 9–11 June 2020; pp. 1–6. [Google Scholar]
  9. Mayer, F.J.; Ratzinger, F.; Schmidt, R.L.J.; Greiner, G.; Landt, O.; Ende, A.A.; Corman, V.M.; Perkmann-Nagele, N.; Watkins-Riedel, T.; Petermann, D.; et al. Development of a fully automated high throughput PCR for the detection of SARS-CoV-2: The need for speed. Virulence 2020, 11, 964–967. [Google Scholar] [CrossRef]
  10. Mayer, F.J.; Ratzinger, F.; Schmidt, R.L.J.; Greiner, G.; Landt, O.; Ende, A.A.; Corman, V.M.; Perkmann-Nagele, N.; Watkins-Riedel, T.; Petermann, D.; et al. False-negative results of initial RT-PCR assays for COVID-19: A systematic review. PLoS ONE 2020, 15, e0242958. [Google Scholar]
  11. Ai, T.; Yang, Z.; Hou, H.; Zhan, C.; Chen, C.; Lv, W.; Tao, Q.; Sun, Z.; Xia, L. Correlation of chest CT and RT-PCR testing for coronavirus disease 2019 (COVID-19) in China: A report of 1014 cases. Radiology 2020, 296, E32–E40. [Google Scholar] [CrossRef] [PubMed]
  12. Wang, L.; Lin, Z.Q.; Wong, A. COVID-Net: A tailored deep convolutional neural network design for detection of COVID-19 cases from chest X-ray images. Sci. Rep. 2020, 10, 19549. [Google Scholar] [CrossRef]
  13. Pratt, H.; Coenen, F.; Broadbent, D.M.; Harding, S.P.; Zheng, Y. Convolutional neural networks for diabetic retinopathy. Procedia. Comput. Sci. 2016, 90, 200–205. [Google Scholar] [CrossRef]
  14. Pereira, S.; Pinto, A.; Alves, V.; Silva, C.A. Brain tumor segmentation using convolutional neural networks in MRI images. IEEE Trans. Med. Imag. 2016, 35, 1240–1251. [Google Scholar] [CrossRef] [PubMed]
  15. Ghazal, M.; Asl, E.H.; Mahmoud, A.; Aslantas, A.; Shalaby, A.; Casanova, M.; Barnes, G.; Gimel’farb, G.; Keynton, R.; El Baz, A. Alzheimer’s disease diagnostics by a 3D deeply supervised adaptable convolutional network. Front Biosci. 2018, 23, 584–596. [Google Scholar] [CrossRef] [PubMed]
  16. Klang, E. Deep Learning and Medical Imaging. J. Thorac. Dis. 2018, 10, 657–668. [Google Scholar] [CrossRef]
  17. Cha, D.; Pae, C.; Seong, S.-B.; Choi, J.Y.; Park, H.J. Automated diagnosis of ear disease using ensemble deep learning with a with a big otoendoscopy image database. EBioMedicine 2019, 45, 606–614. [Google Scholar] [CrossRef]
  18. Pham, H.H.; Le, T.T.; Tran, D.Q.; Ngo, D.T.; Nguyen, H.Q. Interpreting Chest X-rays Via CNNS That Exploit Hierarchical Disease Dependencies and Uncertainty Labels. Neurocomputing 2021, 437, 186–194. [Google Scholar] [CrossRef]
  19. Khan, A.I.; Shah, J.L.; Bhat, M.M. CoroNet: A deep neural network for detection and diagnosis of COVID-19 from chest X-ray images. Comput. Methods Programs Biomed. 2020, 196, 105581. [Google Scholar] [CrossRef]
  20. Afifi, A.E.; Hafsa, N.; Ali, M.A.S.; Alhumam, A.; Alsalman, S. An Ensemble of Global and Local-Attention Based Convolutional Neural Networks for COVID-19 Diagnosis on Chest X-ray Images. Symmetry 2021, 13, 113. [Google Scholar] [CrossRef]
  21. Apostolopoulos, I.; Pesiana, T. COVID-19: Automatic detection from X-ray images utilizing transfer learning with convolutional neural networks. Phys. Eng. Sci. Med. 2020, 43, 635–640. [Google Scholar] [CrossRef]
  22. Sethy, P.; Behera, S. Detection of Coronavirus Disease (COVID-19) Based on Deep Features. 2020. Available online: https://www.preprints.org/manuscript/202003.0300/v1 (accessed on 20 May 2022).
  23. Hemdan, E.; Shouman, M.A.; Karar, M.E. COVIDX-Net: A Framework of Deep Learning Classifiers to Diagnose COVID-19 in X-ray Images. 2020. Available online: https://arxiv.org/pdf/2003.11055.pdf (accessed on 25 April 2022).
  24. Ozturk, T.; Talo, M.; Yildirim, E.A.; Baloglu, U.B.; Yildirim, O.; Acharya, U.R. Automated detection of COVID-19 cases using deep neural networks with X-ray images. Comput. Biol. Med. 2020, 121, 103792. [Google Scholar] [CrossRef] [PubMed]
  25. Haralabopoulos, G.; Anagnostopoulos, I.; McAuley, D. Ensemble Deep Learning for Multilabel Binary Classification of User-Generated Content. Algorithms 2020, 13, 83. [Google Scholar] [CrossRef]
  26. Ahmad, F.; Farooq, A.; Ghani, M.U. Deep Ensemble Model for Classification of Novel Coronavirus in Chest X-ray Images. Comput. Intell. Neurosci. 2021, 2021, 8890226. [Google Scholar] [CrossRef] [PubMed]
  27. Deng, J.; Dong, W.; Socher, R.; Li, L.J.; Li, K.; Li, F.-F. ImageNet: A large-scale hierarchical image database. In Proceedings of the IEEE Conference on Computer Vision and Pattern Recognition, Miami, FL, USA, 20–25 June 2009; IEEE: New York, NY, USA; pp. 248–255. [Google Scholar]
  28. Vayá, M.D.L.I.; Saborit, J.M.; Montell, J.A.; Pertusa, A.; Bustos, A.; Cazorla, M.; Galant, J.; Barber, X.; Orozco-Beltrán, D.; García-García, F.; et al. BIMCV COVID-19+: A Large Annotated Dataset of RX and CT Images from COVID-19 Patients. Available online: https://arxiv.org/abs/2006.01174 (accessed on 21 July 2022).
  29. Zhao, W.; Jiang, W.; Qiu, X. Deep learning for COVID-19 detection based on CT images. Sci. Rep. 2021, 11, 14353. [Google Scholar] [CrossRef] [PubMed]
  30. Pathak, Y.; Shukla, P.K.; Arya, K.V. Deep Bidirectional Classification Model for COVID-19 Disease Infected Patients. IEEE/ACM Trans. Comput. Biol. Bioinform. 2021, 18, 1234–1241. [Google Scholar] [CrossRef]
  31. Sahoo, P.; Saha, S.; Mondal, S.; Chowdhury, S.; Gowda, S. Computer-Aided COVID-19 Screening from Chest CT-Scan using a Fuzzy Ensemble-based Technique. In Proceedings of the 2022 International Joint Conference on Neural Networks (IJCNN), Shenzhen, China, 18–23 June 2022; pp. 1–8. [Google Scholar]
  32. Dialameh, M.; Hamzeh, A.; Rahmani, H.; Radmard, A.R.; Dialameh, S. Proposing a novel deep network for detecting COVID-19 based on chest images. Sci. Rep. 2022, 12, 3116. [Google Scholar] [CrossRef]
  33. Zhao, C.; Xu, Y.; He, Z.; Tang, J.; Zhang, Y.; Han, J.; Shi, Y.; Zhou, W. Lung segmentation and automatic detection of COVID-19 using radiomic features from chest CT images. Pattern Recognit. 2021, 119, 108071. [Google Scholar] [CrossRef]
  34. Basu, A.; Sheikh, K.H.; Cuevas, E.; Sarkar, R. COVID-19 detection from CT scans using a two-stage framework. Expert Syst. Appl. 2022, 193, 116377. [Google Scholar] [CrossRef]
  35. Brito, V.C.; Santos, P.R.S.; Sales Carvalho, N.R.; Carvalho Filho, A.O. COVID-index: A texture-based approach to classifying lung lesions based on CT images. Pattern Recognit. 2021, 119, 108083. [Google Scholar] [CrossRef]
  36. Gupta, P.K.; Siddiqui, M.K.; Huang, X.; Morales-Menendez, R.; Pawar, H.; Terashima-Marin, H.; Wajid, M.S. COVID-WideNet-A capsule network for COVID-19 detection. Appl. Soft Comput. 2022, 122, 108780. [Google Scholar] [CrossRef]
  37. Karthik, R.; Menaka, R.M.H. Learning distinctive filters for COVID-19 detection from chest X-ray using shuffled residual CNN. Appl. Soft Comput. J. 2021, 99, 106744. [Google Scholar] [CrossRef] [PubMed]
  38. Narin, A.; Kaya, C.; Pamuk, Z. Automatic Detection of Coronavirus Disease (COVID-19) Using X-ray Images and Deep Convolutional Neural Networks. Pattern Anal. Appl. 2021, 24, 1207–1220. [Google Scholar] [CrossRef] [PubMed]
  39. Hira, S.; Bai, A.; Hira, S. An automatic approach based on CNN architecture to detect Covid-19 disease from chest X-ray images. Appl. Intell. 2021, 51, 2864–2889. [Google Scholar] [CrossRef] [PubMed]
  40. Heidari, M.; Mirniaharikandehei, S.; Khuzani, A.Z.; Danala, G.; Qiu, Y.; Zheng, B. Improving the performance of CNN to predict the likelihood of COVID-19 using chest X-ray images with preprocessing algorithms. Int. J. Med. Inform. 2020, 144, 104284. [Google Scholar] [CrossRef]
  41. Jain, R.; Gupta, M.; Taneja, S.; Thakur, P.; Sharma, R.; Pachori, R.B. Deep learning-based detection and analysis of COVID-19 on chest X-ray images. Appl. Intell. 2001, 51, 1690–1700. [Google Scholar] [CrossRef]
  42. Gouda, W.; Almurafeh, M.; Humayun, M.; Jhanjhi, N.Z. Detection of COVID-19 Based on Chest X-rays Using Deep Learning. Healthcare 2022, 10, 343. [Google Scholar] [CrossRef] [PubMed]
  43. Elhanashi, A.; Lowe, D.; Saponara, S.; Moshfeghi, Y. Deep learning techniques to identify and classify COVID-19 abnormalities on chest x-ray images. In Proceedings of the Real-Time Image Processing and Deep Learning 2022, Orlando, FL, USA, 27 May 2022; Volume 12102. [Google Scholar] [CrossRef]
  44. Bhattacharyya, A.; Bhaik, D.; Kumar, S.; Thakur, P.; Sharma, R.; Pachori, R.B. A deep learning based approach for automatic detection of COVID-19 cases using chest X-ray images. Biomed. Signal Process Control. 2022, 71, 103182. [Google Scholar] [CrossRef]
  45. Loey, M.; El-Sappagh, S.; Mirjalili, S. Bayesian-based optimized deep learning model to detect COVID-19 patients using chest X-ray image data. Comput. Biol. Med. 2022, 142, 105213. [Google Scholar] [CrossRef]
  46. Ieracitano, C.; Mammone, N.; Versaci, M.; Varone, G.; Ali, A.R.; Armentano, A.; Calabrese, G.; Ferrarelli, A.; Turano, L.; Tebala, C.; et al. A fuzzy-enhanced deep learning approach for early detection of Covid-19 pneumonia from portable chest X-ray images. Neurocomputing 2022, 481, 202–215. [Google Scholar] [CrossRef]
  47. Barshooi, A.; Amirkhani, A. A novel data augmentation based on Gabor filter and convolutional deep learning for improving the classification of COVID-19 chest X-ray images. Biomed. Signal Process Control. 2022, 72, 103326. [Google Scholar] [CrossRef]
  48. Ullah Khan, I.; Aslam, N.; Anwar, T.; Alsaif, H.S.; Chrouf, S.M.B.; Alzahrani, N.A.; Alamoudi, F.A.; Kamaleldin, M.M.A.; Awary, K.B. Using a Deep Learning Model to Explore the Impact of Clinical Data on COVID-19 Diagnosis Using Chest X-ray. Sensors 2022, 22, 669. [Google Scholar] [CrossRef] [PubMed]
  49. Chhikara, P.; Gupta, P.; Singh, P.; Bhatia, T. A deep transfer learning based model for automatic detection of COVID-19 from chest X-rays. Turk. J. Electr. Eng. Comput. Sci. 2021, 29, 2663–2679. [Google Scholar] [CrossRef]
  50. Khan, E.; Rehman, M.Z.U.; Ahmed, F.; Alfouzan, F.A.; Alzahrani, N.M.; Ahmad, J. Chest X-ray Classification for the Detection of COVID-19 Using Deep Learning Techniques. Sensors 2022, 22, 1211. [Google Scholar] [CrossRef] [PubMed]
  51. Muralidharan, N.; Gupta, S.; Prusty, M.R.; Tripathy, R.K. Detection of COVID19 from X-ray images using multiscale Deep Convolutional Neural Network. Appl. Soft Comput. Appl. Soft Comput. 2022, 119, 108610. [Google Scholar] [CrossRef]
  52. Muralidharan, N.; Gupta, S.; Prusty, M.R.; Tripathy, R.K. COVID-CXNet: Detecting COVID-19 in frontal chest X-ray images using deep learning. Multimed. Tools Appl. 2022, 81, 30615–30645. [Google Scholar]
  53. Breve, F. COVID-19 detection on Chest X-ray images: A comparison of CNN architectures and ensembles. Expert Syst. Appl. 2022, 204, 117549. [Google Scholar] [CrossRef]
  54. Zhou, T. The Ensemble Deep Learning Model for Novel COVID-19 on CT Images. Appiedl. Soft Comput. 2021, 98, 106885. [Google Scholar] [CrossRef]
  55. Jin, W.; Dong, S.; Dong, C.; Ye, X. Hybrid ensemble model for differential diagnosis between COVID-19 and common viral pneumonia by chest X-ray radiograph. Comput. Biol. Med. 2021, 131, 104252. [Google Scholar] [CrossRef]
  56. Dey, S.; Bhattacharya, R.; Malakar, S.; Schwenker, F.; Sarkar, R. CovidConvLSTM: A fuzzy ensemble model for COVID-19 detection from chest X-rays. Expert Syst. Appl. 2022, 206, 117812. [Google Scholar] [CrossRef]
  57. Nasiri, H.; Nasiri, S. Automated detection of COVID-19 cases from chest X-ray images using deep neural network and XGBoost. Radiography 2022, 28, 732–738. [Google Scholar] [CrossRef]
  58. Hryniewska, W.; Bombiński, P.; Szatkowski, P.; Tomaszewska, P.; Przelaskowski, A.; Biecek, P. Checklist for responsible deep learning modeling of medical images based on COVID-19 detection studies. Pattern Recognit. 2021, 118, 108035. [Google Scholar] [CrossRef] [PubMed]
  59. Roberts, M.; Driggs, D.; Thorpe, M.; Gilbey, J.; Yeung, M.; Ursprung, S.; Aviles-Rivero, A.I.; Etmann, C.; McCague, C.; Beer, L.; et al. Common pitfalls and recommendations for using machine learning to detect and prognosticate for COVID-19 using chest radiographs and CT scans. Nat. Mach. Intell. 2021, 3, 197–217. [Google Scholar] [CrossRef]
  60. Bui, H.M.; Lech, M.; Cheng, E.; Neville, K.; Burnett, I.S. Using grayscale images for object recognition with convolutional-recursive neural network. In Proceedings of the IEEE Sixth International Conference on Communications and Electronics (ICCE), Ha-Long, Vietnam, 27–29 July 2016; pp. 311–325. [Google Scholar]
  61. Duran-Lopez, L.; Dominguez-Morales, J. COVID-XNet: A Custom Deep Learning System to Diagnose and Locate COVID-19 in Chest X-ray Images. Appl. Sci. 2020, 10, 5683. [Google Scholar] [CrossRef]
  62. Nahiduzzaman; Goni, O.F.; Anower, S.; Islam, R.; Ahsan, M.; Haider, J.; Gurusamy, S.; Hassan, R.; Islam, R. A Novel Method for Multivariant Pneumonia Classification Based on Hybrid CNN-PCA Based Feature Extraction Using Extreme Learning Machine with CXR Images. IEEE Access 2021, 9, 147512–147526. [Google Scholar] [CrossRef]
  63. Howard, A.G.; Zhu, M.; Chen, B.; Kalenichenko, D.; Wang, W.; Weyand, T.; Andreetto, M.; Adam, H. MobileNets: Efficient Convolutional Neural Networks for Mobile Vision Applications. arXiv 2017, arXiv:1704.04861. [Google Scholar]
  64. Szegedy, C.; Liu, W.; Jia, Y.; Sermanet, P.; Reed, S.; Anguelov, D.; Erhan, D.; Vanhoucke, V.; Rabinovich, A.; Liu, W.; et al. Going Deeper with Convolutions. arXiv 2014, arXiv:1409.4842. [Google Scholar]
  65. Simonyan, K.; Zisserman, A. Very deep convolutional networks for large-scale image recognition. arXiv 2014, arXiv:1409.1556. [Google Scholar]
  66. Tan, M.; Le, Q. Efficientnet: Rethinking model scaling for convolutional neural networks. In Proceedings of the International Conference on Machine Learning, Long Beach, CA, USA, 29 May 2019. [Google Scholar]
  67. Huang, G.; Liu, Z.; Van Der Maaten, L.; Weinberger, K.Q. Densely Connected Convolutional Networks. In Proceedings of the IEEE Conference on Computer Vision and Pattern Recognition, Honolulu, HI, USA, 21–26 July 2017; pp. 4700–4708. [Google Scholar]
  68. He, K.; Zhang, X.; Ren, S.; Sun, J. Identity Mappings in Deep Residual networks. In Proceedings of the European Conference on Computer Vision, Online. 17 September 2016. [Google Scholar]
  69. Sousa, P.M.; Carneiro, P.C.; Oliveira, M.M.; Pereira, G.M.; Junior, C.A.C.; Moura, L.V.; Mattjie, C.; Silva, A.M.M.; Patrocinio, A.C. COVID-19 classification in X-ray chest images using a new convolutional neural network: CNN-COVID. Res. Biomed. Eng. 2022, 38, 87–97. [Google Scholar] [CrossRef]
  70. Arias-Garzón, D.; Alzate-Grisales, J.A.; Orozco-Arias, S.; Arteaga-Arteaga, H.B.; Bravo-Ortiz, M.A.; Mora-Rubio, A.; Saborit-Torres, J.M.; Serrano, J.M.; Tabares-Soto, R.; Vayá, M.D.L.I. COVID-19 detection in X-ray images using convolutional neural networks. Mach. Learn. Appl. 2021, 6, 100138. [Google Scholar] [CrossRef]
  71. Nishio, M.; Kobayashi, D.; Nishioka, E.; Matsuo, H.; Urase, Y.; Onoue, K.; Ishikura, K.; Kitamura, Y.; Sakai, E.; Tomita, E.; et al. Deep learning model for the automatic classification of COVID-19 pneumonia, non-COVID-19 pneumonia, and the healthy: A multi-center retrospective study. Sci. Rep. 2022, 12, 8214. [Google Scholar] [CrossRef]
  72. Panwar, H.; Gupta, P.; Siddiqui, M.K.; Morales-Menendez, R.; Singh, V. Application of deep learning for fast detection of COVID-19 in X-rays using nCOVnet. Chaos Solitons Fractals 2020, 138, 109944. [Google Scholar] [CrossRef] [PubMed]
  73. Mahmud, T. CovXNet: A multidilation convolutional neural network for automatic COVID-19 and other pneumonia detection from chest X-ray images with transferable multi-receptive feature optimization. Comput. Biol. Med. 2020, 122, 103869. [Google Scholar] [CrossRef] [PubMed]
  74. Chowdhury, M.E.H.; Rahman, T.; Khandakar, A.; Mazhar, R.; Kadir, M.A.; Mahbub, Z.B. Can AI help in screening Viral and COVID-19 pneumonia? IEEE Access 2020, 8, 132665–132676. [Google Scholar] [CrossRef]
Figure 1. Research workflow for gathering data, training the CNNs and ensemble models, and evaluating their results.
Computers 12 00105 g001
Figure 2. Sample of COVID-19, pneumonia and normal CXRs used in training and testing the model.
Computers 12 00105 g002
Figure 3. Age distribution of patients used in the final dataset, split by category.
Computers 12 00105 g003
Figure 4. Pre-processing applied to CXRs. (a) Original image, (b) Pixel re-scaled image (c) Image after CLAHE.
Computers 12 00105 g004
Figure 5. Example of the ensemble deep learning architecture with three CNN models.
Computers 12 00105 g005
Figure 6. (a) Early stoppage during VGG16 training (b) After the validation set loss stopped improving after the 44th epoch for 10 epochs, the model training stopped, and the model configuration during the 44th epoch was selected for the ensemble.
Computers 12 00105 g006
Figure 7. Training ResNet using (a) a learning rate of 10 × 10−4, and (b) a learning rate of 10 × 10−6.
Computers 12 00105 g007
Figure 8. Training time for each CNN architecture.
Computers 12 00105 g008
Figure 9. Confusion matrices showing the performance of three ensemble models and the top-performing CNN model performance in classifying COVID-19, normal, and pneumonia-labeled CXRs.
Computers 12 00105 g009aComputers 12 00105 g009b
Figure 10. Logistic regression ensemble model’s weights for the outputs of the CNN models for each of the image classes. The weights are used for predicting the COVID-19 class.
Computers 12 00105 g010
Figure 11. ROC for COVID-19 binary classification by the ensemble models.
Computers 12 00105 g011
Table 1. Details of the dataset used for training and testing.
TypeNo. of X-ray Images
COVID-19632
Normal1592
Pneumonia1106
Total3330
Table 2. CNN architectures, their trainable parameters and their references.
ModelTrainable ParametersReferences
MobileNet V3 Large5.5 M[60]
Inception V327.2 M[61]
VGG16 BN138.4 M[62]
EfficientNet B29.1 M[63]
Densenet 1218.0 M[64]
ResNeXT50 32X4D25.0 M[65]
Table 3. Performance of CNN architectures on three-class and two-class classification.
Model3-Class
Accuracy
COVID-19 AccuracyCOVID-19 F1-ScoreNormal AccuracyNormal F1-ScorePneumonia AccuracyPneumonia F1-Score
MobileNet V3 Large83.11%95.21%88.64%85.15%84.50%85.87%77.22%
Inception V382.16%95.21%88.51%84.79%84.14%84.31%74.86%
VGG16 BN80.84%94.85%87.32%83.11%82.83%83.71%73.33%
EfficientNet B282.04%94.49%87.15%84.43%83.20%85.15%76.95%
DenseNet 12182.04%94.73%86.67%84.67%83.51%84.67%77.31%
ResNeXT50 32X4D80.60%94.37%85.17%83.11%83.27%83.71%73.33%
Table 4. Performance of ensemble models on three-class and two-class classification.
Ensemble Model3-Class AccuracyCOVID-19 AccuracyCOVID-19 F1-ScoreNormal AccuracyNormal F1-ScorePneumonia AccuracyPneumonia F1-Score
SVC84.07%96.29%90.46%85.63%85.65%86.23%77.41%
Random Forest Classifier84.07%96.29%90.46%85.63%85.54%86.23%77.67%
Logistic Regression83.59%96.29%90.34%84.91%85.00%85.99%77.01%
K-Neighbors Classifier84.07%96.17%90.30%85.51%85.37%86.47%77.97%
Extra Trees Classifier83.47%96.29%90.28%85.27%85.34%85.39%76.17%
Gaussian Naive Bayes84.91%95.81%89.80%86.71%86.28%87.31%79.54%
Majority Voting84.43%95.33%88.83%86.59%86.37%86.95%78.16%
AdaBoost Classifier79.16%95.81%88.82%81.20%80.83%81.32%71.00%
Unweighted Average Predictions84.91%95.33%88.70%86.83%86.49%87.66%79.84%
Bagging Classifier82.63%95.45%88.13%84.43%84.60%85.39%75.89%
Decision Tree Classifier80.72%94.85%86.52%82.75%82.65%83.83%74.09%
Table 5. Comparison between the top-performing ensemble model and the top-performing CNN architecture.
MetricTop Ensemble ModelEnsemble Model PerformanceTop CNN ModelCNN Model PerformanceEnsemble Improvement over CNN Model
3-Class AccuracyGaussian Naive Bayes84.91%MobileNet V3 Large83.07%2.16%
COVID-19 AccuracyLogistic Regression96.29%MobileNet V3 Large95.20%1.13%
COVID-19 PrecisionAdaBoost Classifier90.85%ResNeXT50 32X4D85.71%5.65%
COVID-19 Recall--MobileNet V3 Large97.50%0.00%
COVID-19 F1-ScoreSVC90.46%MobileNet V3 Large88.60%2.06%
Normal AccuracyUnweighted Average Predictor86.83%MobileNet V3 Large85.12%1.97%
Normal Precision--Densenet 12187.57%0.00%
Normal RecallSVC88.18%ResNeXT50 32X4D86.42%1.99%
Normal F1-ScoreUnweighted Average Predictor86.49%MobileNet V3 Large84.45%2.35%
Pneumonia AccuracyUnweighted Average Predictor87.66%MobileNet V3 Large85.83%2.09%
Pneumonia PrecisionMajority Voting Predictor84.78%MobileNet V3 Large80.07%5.55%
Pneumonia RecallDenseNet 12181.04%Densenet 12181.04%0.00%
Pneumonia F1-ScoreUnweighted Average Predictor79.84%Densenet 12177.22%3.28%
Table 6. Comparison between the top-performing ensemble model and the top-performing CNN architecture.
Number of CNN
Models
Top
Ensemble
COVID-19
Accuracy
F1-Score
Top CNN Model-95.20%88.60%
Top 2 CNN ModelsK Neighbors Classifier96.53%91.19%
Top 3 CNN ModelsRandom Forest Classifier96.41%90.80%
Top 4 CNN ModelsSupport Vector Classifier96.53%91.34%
Top 5 CNN ModelsLogistic Regression96.53%91.24%
Top 6 ModelsSupport Vector Classifier96.29%90.46%
Table 7. Comparison between the proposed model and other models applied to a variety of COVID-19 datasets.
ReferencesArchitectureCOVID-19 Accuracy
Hira et al. [39]Se-ResNeXt99.23%
Jin et al. [55]AlexNet98.64%
S. Dey et al. [56]CovidConvLSTM98.63%
A. Barshooi & A. Amirkhani [47]DenseNet98.50%
Ozturk [24]DarkNet98.08%
Narin et al. [38]ResNet-5098.00%
Chhikara et al. [49]InceptionV397.70%
Khan et al. [48]EfficientNet97.00%
Bhattacharyya [44]VGG-1996.60%
Proposed ModelSupport Vector Classifier96.53%
Khan et al. [50]EfficientNet96.13%
P. Sethy & E. Behara [22]ResNet-5095.38%
Haidari et al. [40]VGG1694.50%
Wang et al. [12]COVID-Net92.40%
E. Hemdan et al. [23]VGG1990.00%
H. Nasiri & E. Nasiri [57]DenseNet + XGBoost89.70%
I.D. Apostolopoulos et al. [21]Xception85.57%
Table 8. Comparison between the proposed model and other models on the BIMCV+ dataset.
ReferencesArchitectureCOVID-19 Accuracy
P. de Sousa et al. [69]Custom CNN98.84%
Proposed ModelSupport Vector Classifier96.53%
Arias-Garzon [70]VGG-1996.30%
Mizuho et al. [71]EfficientNet94.60%
Duran-Lopez et al. [61]COVID-XNet94.43%
Disclaimer/Publisher’s Note: The statements, opinions and data contained in all publications are solely those of the individual author(s) and contributor(s) and not of MDPI and/or the editor(s). MDPI and/or the editor(s) disclaim responsibility for any injury to people or property resulting from any ideas, methods, instructions or products referred to in the content.

