Article

IoT-Enabled Soil Nutrient Analysis and Crop Recommendation Model for Precision Agriculture

by
Murali Krishna Senapaty
1,
Abhishek Ray
1 and
Neelamadhab Padhy
2,*
1
School of Computer Engineering, Kalinga Institute of Industrial Technology, Bhubaneswar 751024, India
2
School of Engineering, GIET University, Gunupur 765022, India
*
Author to whom correspondence should be addressed.
Computers 2023, 12(3), 61; https://doi.org/10.3390/computers12030061
Submission received: 13 February 2023 / Revised: 6 March 2023 / Accepted: 8 March 2023 / Published: 12 March 2023
(This article belongs to the Special Issue Survey in Deep Learning for IoT Applications)

Abstract

:
Healthy and sufficient crop and food production are very much essential for everyone as the population is increasing globally. The production of crops affects the economy of a country to a great extent. In agriculture, observing the soil, weather, and water availability and, based on these factors, selecting an appropriate crop, finding the availability of seeds, analysing crop demand in the market, and having knowledge of crop cultivation are important. At present, many advancements have been made in recent times, starting from crop selection to crop cutting. Mainly, the roles of the Internet of Things, cloud computing, and machine learning tools help a farmer to analyse and make better decisions in each stage of cultivation. Once suitable crop seeds are chosen, the farmer shall proceed with seeding, monitoring crop growth, disease detection, finding the ripening stage of the crop, and then crop cutting. The main objective is to provide a continuous support system to a farmer so that he can obtain regular inputs about his field and crop. Additionally, he should be able to make proper decisions at each stage of farming. Artificial intelligence, machine learning, the cloud, sensors, and other automated devices shall be included in the decision support system so that it will provide the right information within a short time span. By using the support system, a farmer will be able to take decisive measures without fully depending on the local agriculture offices. We have proposed an IoT-enabled soil nutrient classification and crop recommendation (IoTSNA-CR) model to recommend crops. The model helps to minimise the use of fertilisers in soil so as to maximise productivity. The proposed model consists of phases, such as data collection using IoT sensors from cultivation lands, storing this real-time data into cloud memory services, accessing this cloud data using an Android application, and then pre-processing and periodic analysis of it using different learning techniques. A sensory system was prepared with optimised cost that contains different sensors, such as a soil temperature sensor, a soil moisture sensor, a water level indicator, a pH sensor, a GPS sensor, and a colour sensor, along with an Arduino UNO board. This sensory system allowed us to collect moisture, temperature, water level, soil NPK colour values, date, time, longitude, and latitude. The studies have revealed that the Agrinex NPK soil testing tablets should be applied to a soil sample, and then the soil colour can be sensed using an LDR colour sensor to predict the phosphorus (P), nitrogen (N), and potassium (K) values. These collected data together were stored in Firebase cloud storage media. Then, an Android application was developed to fetch and analyse the data from the Firebase cloud service from time to time by a farmer. In this study, a novel approach was identified via the hybridisation of algorithms. We have developed an algorithm using a multi-class support vector machine with a directed acyclic graph and optimised it using the fruit fly optimisation method (MSVM-DAG-FFO). The highest accuracy rate of this algorithm is 0.973, compared to 0.932 for SVM, 0.922 for SVM kernel, and 0.914 for decision tree. It has been observed that the overall performance of the proposed algorithm in terms of accuracy, recall, precision, and F-Score is high compared to other methods. The IoTSNA-CR device allows the farmer to maintain his field soil information easily in the cloud service using his own mobile with minimum knowledge. Additionally, it reduces the expenditure to balance the soil minerals and increases productivity.

1. Introduction

The agricultural sector plays a significant role in the development of the whole economy of any country. The global rapid increase in population makes food and crop production important. So, a lot of technological changes have been observed in this sector. There are many ways that crop production and its storage are carried out. We see the IoT, smart technologies, artificial intelligence, and automated devices as being available in smart farming. Sometimes, implementing these technologies requires expertise and is also costly. Precision agriculture is a significant part of agriculture, in which data transmission technology is also vital. The soil minerals can be determined via soil testing, either in a lab or by using sensors. The use of various sensors allows for the collection of real-time data.
We must find recommended crops for a particular field for better cropping. In order to have better crop prediction and production, the factors influencing it are soil properties, weather conditions, availability of water, soil temperature, sunlight, wind, pollution level, etc. Therefore, by using sensors, area-wise soil properties are to be collected for phosphorus (P), nitrogen (N), and potassium (K), pH value, temperature, moisture, water level, water pollution, etc. These data allow for the recommendation of crops based on their ideal requirements. However, for these sensors, we need much investment and expertise to handle them, and periodic maintenance is also required.
In the present day, the proper integration of IoT sensors, mobile devices, and cloud and data analysis is essential in the field of precision agriculture. Additionally, the technologies must fit with the farmers’ knowledge and experience so as to contribute toward increasing sustainability in agriculture. The soil’s characteristics and its mineral availability vary to some extent many times. So, the real-time data will give better accuracy in predictions for the specific fields compared to the offline dataset as per geographical locations. So, an approach to making studies of real-time data much more important is required. Periodic real-time data shall be maintained in the cloud in a systematic manner. The cloud service is the best option for storing the collected data over time using the IoT device’s Wi-Fi module. In the present day, smartphones are available to most people. The common mobile operating system supports the development of an application through which accessing cloud data is easier.
In this context, a timely decision is the prime goal, as it can save time and resources and give us an accurate decision. So, a support system for pre-processing the cloud data and then analysing it for predictions is required. The different classification and regression tools are used for data analysis so that the prediction is more accurate.
The major contributions of this paper are:
  • Proposing an IoTSNA-CR model.
  • Sensors to collect data on soil properties.
  • Proposing an MSVM-DAG-FFO algorithm.
This paper proposes an IoT-enabled soil nutrient analysis and crop recommendation (IoTSNA-CR) model for precision agriculture.
It primarily allows the IoT sensors to collect data related to soil moisture, temperature, NPK, and pH value. In addition, the IoTSNA-CR technique involves the design of the MSVM model for the appropriate classification of soil nutrients and crop recommendations. Furthermore, the kernel function of the MSVM model must be optimally chosen using the fruit fly optimisation (FFO) algorithm. The benchmark dataset was used for detailed experimental validation of the IoTSNA-CR model. This crop recommendation system helps the farmers to not only acquire data from the sensors but also to maintain them and analyse them suitably using this hybrid approach. We have analysed the soil for classification using linear SVM and kernel SVM, as well as decision tree. We have datasets based on different types of crops and their mineral needs. So, it is observed that the performance of SVM is better suited for us in multiple classes. It increases the accuracy rate if we can choose a suitable kernel function for it. The FFO algorithm can help us to select optimised kernels. So, a hybridisation of MSVM and FFO was used to improve the accuracy rate for classification.
The rest of this paper is organised as follows: Section 2 includes reviews on different models proposed and algorithms applied in precision farming; Section 3 shows the proposed model that contains data acquisition, data storage in the cloud, and data analysis using a novel MSVM-DAG-FFO algorithm; Section 4 presents the proposed method’s experimental results; and finally, Section 5 contains the overall conclusion and future extensions of the paper.

2. Literature Review

It has been observed that the use of many kinds of automated devices, sensors, wireless connectivity, drones, and satellite images has increased in precision farming for the optimum use of fertilisers, labour resources, and time.
The importance of machine learning and IoT is high in the field of smart farming. However, the farmer faces several challenges while implementing them, of which crop disease prediction is one. The most common disease for apple crop is apple scab. One author proposed a framework consisting of IoT nodes with WSN scattered in the orchards of apples to collect real-time data and early prediction of the disease. Additionally, he discussed several challenges faced by farmers while handling the hardware units and sensors as they were affected due to outside environmental factors [1]. The implementation of precision farming consists of automated devices, IoT sensors, real-time data collection, storage in cloud memory, and data analysis. One author proposed a framework that provides smart control over irrigation systems and greenhouse facilities. It allows for the storage, management, and analysis of data based on nutrition, climate, and irrigation [2]. The characteristics of the soil play an important role in maintaining its fertility; as year by year the soil nutrition level will be decreased due to cultivation, this is a suitable method to be followed for optimally increasing soil fertility so as to improve crop production [3]. The role of big data is increasing day by day along with the use of IoT sensors and smart tools. One author focused on the large volume of data generated by sensors, the available cloud storage medium, and the challenges with cloud storage, analysing real-time data, and data visualisation [4]. Sensors are used in almost every phase of precision farming. So, the author elaborated on different sensors for measuring humidity, water level, soil moisture, pH value, and also on finding mineral deficiencies in the soil. So, to increase the production level of agricultural products, we can implement sensor technology. It in turn improves soil quality, food safety, and crop profitability. Here, one author suggests an overall model that shows implementing sensors and machine learning in every stage, such as water management, crop selection, nutrient management, crop health management, yield management, and post-harvest management [5]. The smartphone applications are recognised for their integration with the aggregation of data, the speed of the process, and IoT ideals. These data can be shared with farmers for making decisions on weeding, watering, seeding, and fertilising. This application gathers information from weather stations and remote sensors and assists in an in-depth analysis of the data [6]. The financial condition of India is mostly dependent on cultivation. So, the data related to it have to be maintained in the cloud regularly which allows one to analyse them from time to time for the benefit of the farmers. The machine learning algorithms can be used to recommend suitable crops by performing soil tests. Depending on this, the farmer could make decisions about their fields [7]. In soil testing, the soil nutrients, fertiliser requirement, irrigation level, and soil type can be examined. Floods cause agricultural disasters; so, the sensor technology helps to measure the water flow, water level, soil moisture, and geographical locations of floods so that the farmer can take precautionary measures to protect crops [8]. Different sensors are available, such as spectra-radiometers used to analyse soil content for nitrogen, carbon, and organic matter. The soil salinity can also be measured using low-cost capacitance resistance. Here, one author discussed different sensors and tools used in soil analysis and forests for taste and odour detection, soil water content, soil density, pest control, and seedlings [9]. A crop recommendation scheme that employs ensemble techniques of the machine learning method is proposed. The ensemble techniques were applied for building a system that integrates the prediction of several machine learning methods to suggest the right crop according to the soil types and features with higher performance. The ensemble models include random forest, naive Bayes, and Lagrangian SVM [10]. The machine learning techniques were used for finding the relationship between N-K, N-P, and P-K. It has been identified that the N value in soil affects the p value significantly. The p value also affects the K value, whereas the N value does not have a strong relation with K. One author suggested a model for checking the inter-dependency of primary nutrients, i.e., nitrogen (N), phosphorus (P), and potassium (K), called the most important nutrients of the soil, as well as for estimating the effect of N contents on another main soil nutrient [11]. The soil test report value was employed for classifying many important soil characteristics of available potassium (K), available phosphorus (P), boron (B), parameter soil reaction (pH), and organic carbon (OC). The prediction and classification of soil parameters help in decreasing waste expenditures on fertiliser, saving the time of experts for chemical soil analyses, and improving environmental quality. These classification issues are resolved via the extreme learning machine using distinct activation functions [12]. The data of Taiwan’s enterprises related to financial distress were collected, and during the implementation of the general regression neural network, the FFO was implemented to optimise and improve its classification [13]. The usage of a kernel-based C-mean clustering algorithm was employed to classify the data in which the FFO is applied for optimisation, and it has been observed that this improves the performance of clustering [14]. The prediction of scour characteristics in ski jump spillways is important for hydraulic researchers. One author proposed a hybrid model in which the support vector regression along with the FFO are implemented, and it was observed that its performance is better than other methods [15]. A system has been proposed that consists of sensors and an Arduino board connected to an Amazon Web Service. A mobile application can be developed to interact with the cloud for data analysis and visualisation. This system allows for the measurement of soil mineral availability and the recommendation of fertiliser needs based on it [16]. A study on Brazilian fields for the prediction of soybean yield has been conducted. Based on the market demand, a focus has been given to the early prediction of the crop by using satellite images and weather data. The author suggested a novel model by implementing the algorithms long–short-term memory neural network, random forest, and multi variate ordinary least squares linear regression, and compared their performance. It has been found that the long–short-term memory neural network method has better performance in prediction [17]. Wheat is an essential crop in Indian foods. Some authors used a time series dataset on weather parameters from the Gujurat area of years 1990–1991 and 2016–2017 for analysis. The author applied many activation functions of the neural network such as sigmoid, ReLU, Softmax, Cloglog, Sech, Wave, Rootsig, RadialBasis, etc. For improving the accuracy in wheat yield prediction, the author proposed the multi perception neural network technique along with new activation functions DharaSig, DharaSigm, and SHBSig [18].
We have conducted a brief study on the research conducted and on the tools and technologies used in precision farming. We have identified different pros and cons in using these tools.
For precision agriculture and monitoring irrigation, a decision support system along with WSN and IoT was proposed. It has been observed that fully sensor-based agriculture will have certain limitations, such as the cost of installation and maintenance and common farmers’ lack of knowledge. So, undated information was provided to farmers so that an appropriate decision could be made [19]. One author focused on predicting a suitable crop for a particular field by analysing its soil sample. The author used an Arduino board, ESP 8266 WiFi module, and other sensors for collecting soil temperature, moisture, and mineral values and then storing them in the cloud. The algorithms naive Bayes, logistic, and C 4.5 were used on the rainfall dataset, and it was observed that C 4.5 had the highest accuracy of 85.07% [20]. In precision farming, the role of big data applications is discussed. The different devices and software used are discussed here. One author suggested a model for precision agriculture that includes data acquisition, data analysis, decision marking, and data storage. He proposed a decision support system to maintain the data on weather, crop yield, consumers, the supply chain, food processing industries, and pesticides [21]. The author proposed a framework that suggests crops based on temperature using machine learning techniques. He analysed the data for rice, cotton, wheat, and sugar cane. He analysed the production of crops based on temperature and found that the maximum cotton production was in the range of 250 °C–350 °C, the maximum wheat production was in the range from 120 °C to 220 °C, the maximum sugar cane production was in the range from 200 °C to 320 °C, and the maximum rice production was in the range from 300 °C to 450 °C [22]. An IoT- and machine-learning-enabled soil testing system was proposed to maintain soil and crop health. A model has been proposed by an author for feature extraction using naive Bayes, random forest, SVM, decision tree, logistic regression, and XGBoost. It has been seen that naive Bayes, random forest, and XGBoost have the highest accuracy of 99% in prediction [23]. The author suggested an IoT- and machine-learning-based agriculture system to assist farmers using meteorological data. The system aims to collect the sensors’ data for a period of 6 months. He proposed a flow of events to be conducted using them. A database was used to collect the sensor data and physical lab test data. These data were analysed using machine learning algorithms, which generate output in a front-end application. Based on the output obtained again, the IoT sensors can be controlled [24]. The crop recommendation is suggested by the author based on geographical location and climatic conditions obtained from agriculture portals. The author proposed a model that hybridised both naive Bayes and J48 with association rules. The performance of both algorithms was measured, and it was stated that the accuracy of J48 is 95.9% [25]. The crop prediction was based not only on parameters such as soil, weather, and water but also on crop price, import and export plans, and the cost of crop losses. The author suggested using the linear discriminant analysis algorithm for feature extraction. Furthermore, he applied the particle swarm optimisation-support vector machine (PSO-SVM), random forest (RF), and KNN algorithms for classification, and out of which PSO-SVM had better accuracy in prediction [26]. The author proposed a smart paddy rice farming system that consisted of big data, machine learning, and IoT technologies. The framework can be used for capturing data, analysing them, estimating the rice yield, and monitoring growth, the quality of rice, rice classes, and diseases [27]. The prediction for estimating the organic potato crops based on the soil properties was performed using ANN and multiple linear regression. The performance of ANN was found to be better and its correlation coefficient value was 0.975 [28]. In the farm lands of Batangas City of the Philippines, the author gathered bitter melon plant images and analysed them for their fruit-bearing capabilities using the CNN method. It has been found that the CNN method is able to predict the crop effectively [29]. The soil parameters classifications are obtained by using different machine learning algorithms which help to recommend fertiliser needs and the preferable crop. They allow one to save the time that would be wasted by conducting chemical analyses of the soil. The Weka tool was used for the analysis and classification [30]. The crop yield was predicted by implementing a deep neural network based on genotype data, soil data, and weather data. Here, it has been observed that DNN outperformed the other methods such as the shallow neural network, lasso, and regression tree [31]. In Brazil, soil nutrient management is studied for balancing the fertiliser needs for a garlic yield. The need for NPK values in the field is analysed using random forest, Adaboost, KNN, and linear regression. Out of these methods, prediction using random forest is more accurate with R2 = 0.882 [32].
Furthermore, we have observed that many researchers have suggested different decision support systems to provide support to the farmer in making the right decision at the right time. The researcher implemented different machine and deep learning algorithms for improving the accuracy in implementing classification and regression.
The excessive use of chemical fertilisers imbalances the availability of soil nutrients, which are collected, classified, and can be analysed using an extreme machine learning decision system. Hence, we should avoid a deficiency in NPK fertiliser in plants, as it might lead to bad results. An excess usage of fertiliser imbalances ecosystems. Precision agriculture assists with the appropriate usage of NPK fertiliser through IoT, WSN, and machine learning techniques [33]. An IoT-based system which is made up of a soil moisture sensor, pH sensor, NPK probe, and temperature and humidity sensors with cloud storage and WiFi allows one to measure the exact soil characteristics and to utilise resources precisely. The sensors calculate the equivalent features and transfer the time-stamped live data to the cloud servers. For the recommendation scheme, the decision tree and SVM algorithm were presented to predict appropriate crops as per the soil data [34]. The soil fertility levels were forecasted by exploring the Virudhunagar District’s soil information. Crop recommendations were provided to aid with the crop selection and sowing through the C5.0: ADT classifier model. With this approach, an Android mobile application called Design of Smart Information System was introduced [35]. The author suggested an ontology-based knowledge base be made to store the details of soil compositions with distinct minerals. For the quality growth of crops, the proper composition of minerals is important, which can be known by experienced farmers. This knowledge was designed to help new farmers in their decision making. The ontology-based model provides structured and formalised knowledge for better soil and crop recommendations [36]. An ANN-based model was suggested to classify and recognise nutrient deficiency in tomatoes by exploring the characteristics of leaves. This would assist farmers in adapting the nutrients supplied to the plants. When the soil lacks certain nutrients, it shows in the physical features of a leaf. The shape and colour of leaves are the two main characteristics employed to identify nutrient deficiency [37]. The FFO algorithm can be used for solving complex analyses via images. So, it can be applied for soil image analysis to find the nutrient values along with IoT sensors. This algorithm can be used for analysing image segmentation [38]. The SVM and naive Bayes are mostly used for soil crop classification. The author implemented ensemble methods such as AdaBoost + SVM and AdaBoost + naive Bayes on time series data and found that they give better accuracy compared to independent methods [39]. The agriculture data were collected from Talab, Tillo, and Jammu to find the suitability of mustard crops in these areas using machine learning techniques, ANN, random forest, multinomial logistic regression, naive Bayes, and K-nearest neighbour [40]. The soil’s fertility was predicted using random forest based on inputs such as soil nutrient electric conductivity, pH value, and organic carbon. Here, it has been observed that RF has better accuracy of 72.74% compared to SVM and Gaussian naive Bayes methods [41]. An analysis on monitoring and predicting crops using the ANN, CNN, DNN, and RNN hybrid network has been conducted. It has been found that the reinforcement neural network and the hybrid network offer 90% accuracy in predicting crop yield [42]. Rice crop nutrient analysis was performed by the author by capturing rice canopy RGB images and by applying regression analysis on them. The regression analysis methods, simple non-linear regression, backpropagation neural network, and random forest were applied to the images and it was observed that RF had the highest accuracy in prediction [43]. For wheat yield prediction, a collection of physicochemical soil parameters was obtained using a spectroscopy sensor. The satellite images were also used along with these data and then unsupervised learning methods were applied to them such as counter-propagation ANN, XY-fused networks, and supervised Kohonen networks. It was observed by the author that supervised Kohonen networks had the highest accuracy of 81.65% for prediction [44]. The degradation of the soil was found to be due to the poor crop management and improper use of fertilisers. The author applied machine learning algorithms, SVM, multi-layer perceptron, and decision tree to soil data collected from local village fields for predicting the soil mineral needs of crops. It was found that the multi-layer perceptron algorithm had the highest accuracy of 94% compared to other algorithms [45]. The deficiencies of nitrogen, phosphorous, and potassium of a paddy crop were predicted by analysing the crop image dataset using the k-mean clustering algorithm. Here, the harvest was estimated via image processing and statistical analysis [46]. The deep learning algorithms multi-layer perceptron, random forest, and CNN were applied to satellite images to classify land cover and crop type. The predictions of crop wheat, sunflower, soybean, maize, and sugar beet were made using an ensemble of CNN with more than 85% accuracy [47]. The rainfall, temperature, and geographical location, along with soil characteristics, were used for analysis. The author suggested a model for analysing these data using machine learning algorithms such as decision tree, naive Bayes, KNN, SVM, and the linear regression model to predict the best crop and its profit analysis. It was found that the accuracy of the neural network was the highest at 89.88% compared to the other methods [48]. Maize crop yield prediction has been conducted in the south and eastern regions of Africa using the linear discriminant algorithm, logistic regression, KNN, SVM, and NB. It was observed by the author that the LDA was the best tool in prediction compared to the others [49].
The crop productivity rate is greatly influenced by the rate of photosynthesis in crops. It allows for increased chemical energy in crops and allows for improved growth. The author discussed the oxygen sensors used on plants to measure the oxygen consumption of plant cells [50], and measured the photosynthesis of plants and its impact on plant development. The author discussed the different techniques used for it, such as the electrochemical sensor method, the gas exchange method, the photosynthesis measuring method, and estimation methods. It was observed that photosynthesis is very important for governing all life [51]. The author discussed the importance of nitrogen for crops. The deficiency in nitrogen in the soil decreases plant growth, and the leaves turn lemony yellow. Additionally, nitrogen fertilisers lead to environmental pollution and health issues [52]. The author identified the improper use of irrigation techniques and the non-use of arable land as being the main causes of low crop production. So, an intelligent irrigation support system using IoT sensors was suggested by the author to improve the rate of crop production. The proposed system monitors the water needs and allows for on/off operation of the water motors [53]. The author suggested an intelligent data collection system consisting of sensors, supporting hardware, and Wi-Fi to store the data in the ThinkSpeak cloud. He suggested that the available soil data in the cloud be used for monitoring the field to reduce human effort [54].
Food production, food storage, and better supply chain management are important factors today. As the population is increasing, to increase crop production, the latest technologies such as artificial intelligence and machine learning are used. The author discussed the implementation of machine learning in various stages such as crop selection, irrigation, crop disease detection, and weather data analysis [55]. The image analysis of crop leaves, stems, and fruits will allow us to quickly analyse and predict the disease. Regular monitoring of plant health is important for better crop production. The author discussed finding grape leaf diseases by using image analysis via the support vector machine [56]. The IoT is used globally in many sectors to improve efficiency, such as farming, fitness centres, homes, government offices, medical facilities, vehicles, etc. IoT sensors, drones, and automated devices play an important role in various situations of farming, from crop seeding to crop cutting and delivery. The author mainly focused on security and privacy issues in agriculture when IoT devices were used [57].
We have identified different models proposed for supporting the farmer in improving crop production. Mostly, the suggested models focused on classifying the soil and finding out the crop’s nutrient needs. Table 1 is representative of this.
Many research observations found that implementing different regression, classification, and ensemble methods in different sectors helped with better crop production. The implementation of different algorithms such as linear regression, the extreme learning machine with different activation functions, edge and cloud computing planes, an improved genetic algorithm, Map-Reduce functionality, SVM, RF, naive Bayes, ANN, FFO, advanced decision tree (ADT) classifier, Ada, and AdaBoost has been observed, as shown in Table 2.
It has been observed in smart farming that the soil analysis of different parameters, such as nutrients, pH value, and water availability, plays a vital role in crop recommendation and cultivation. Based on a brief study of the literature review it has been observed that a simple, low-cost, and optimised approach is required for improving crop production.

3. Research Questions

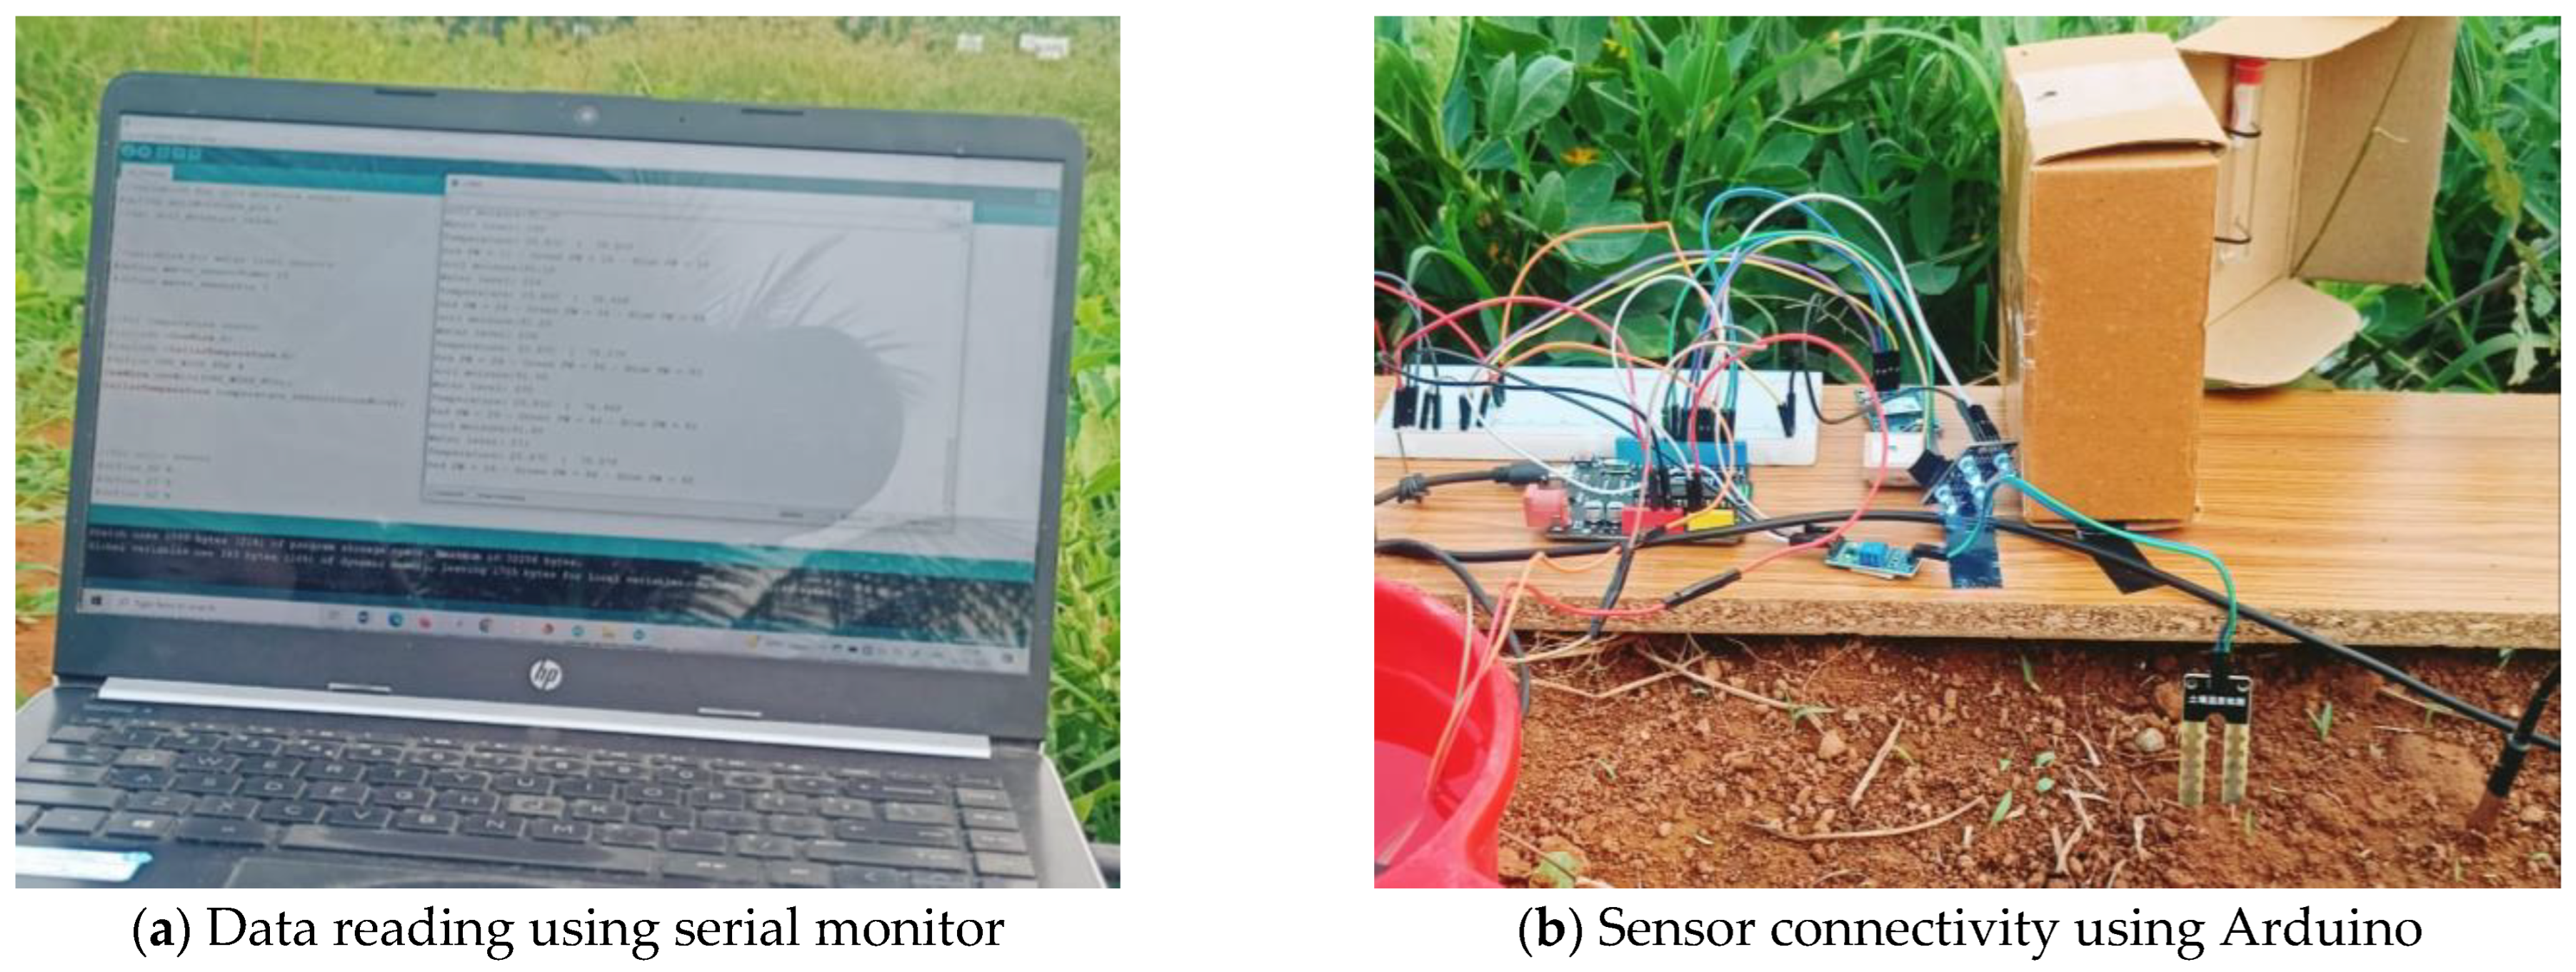
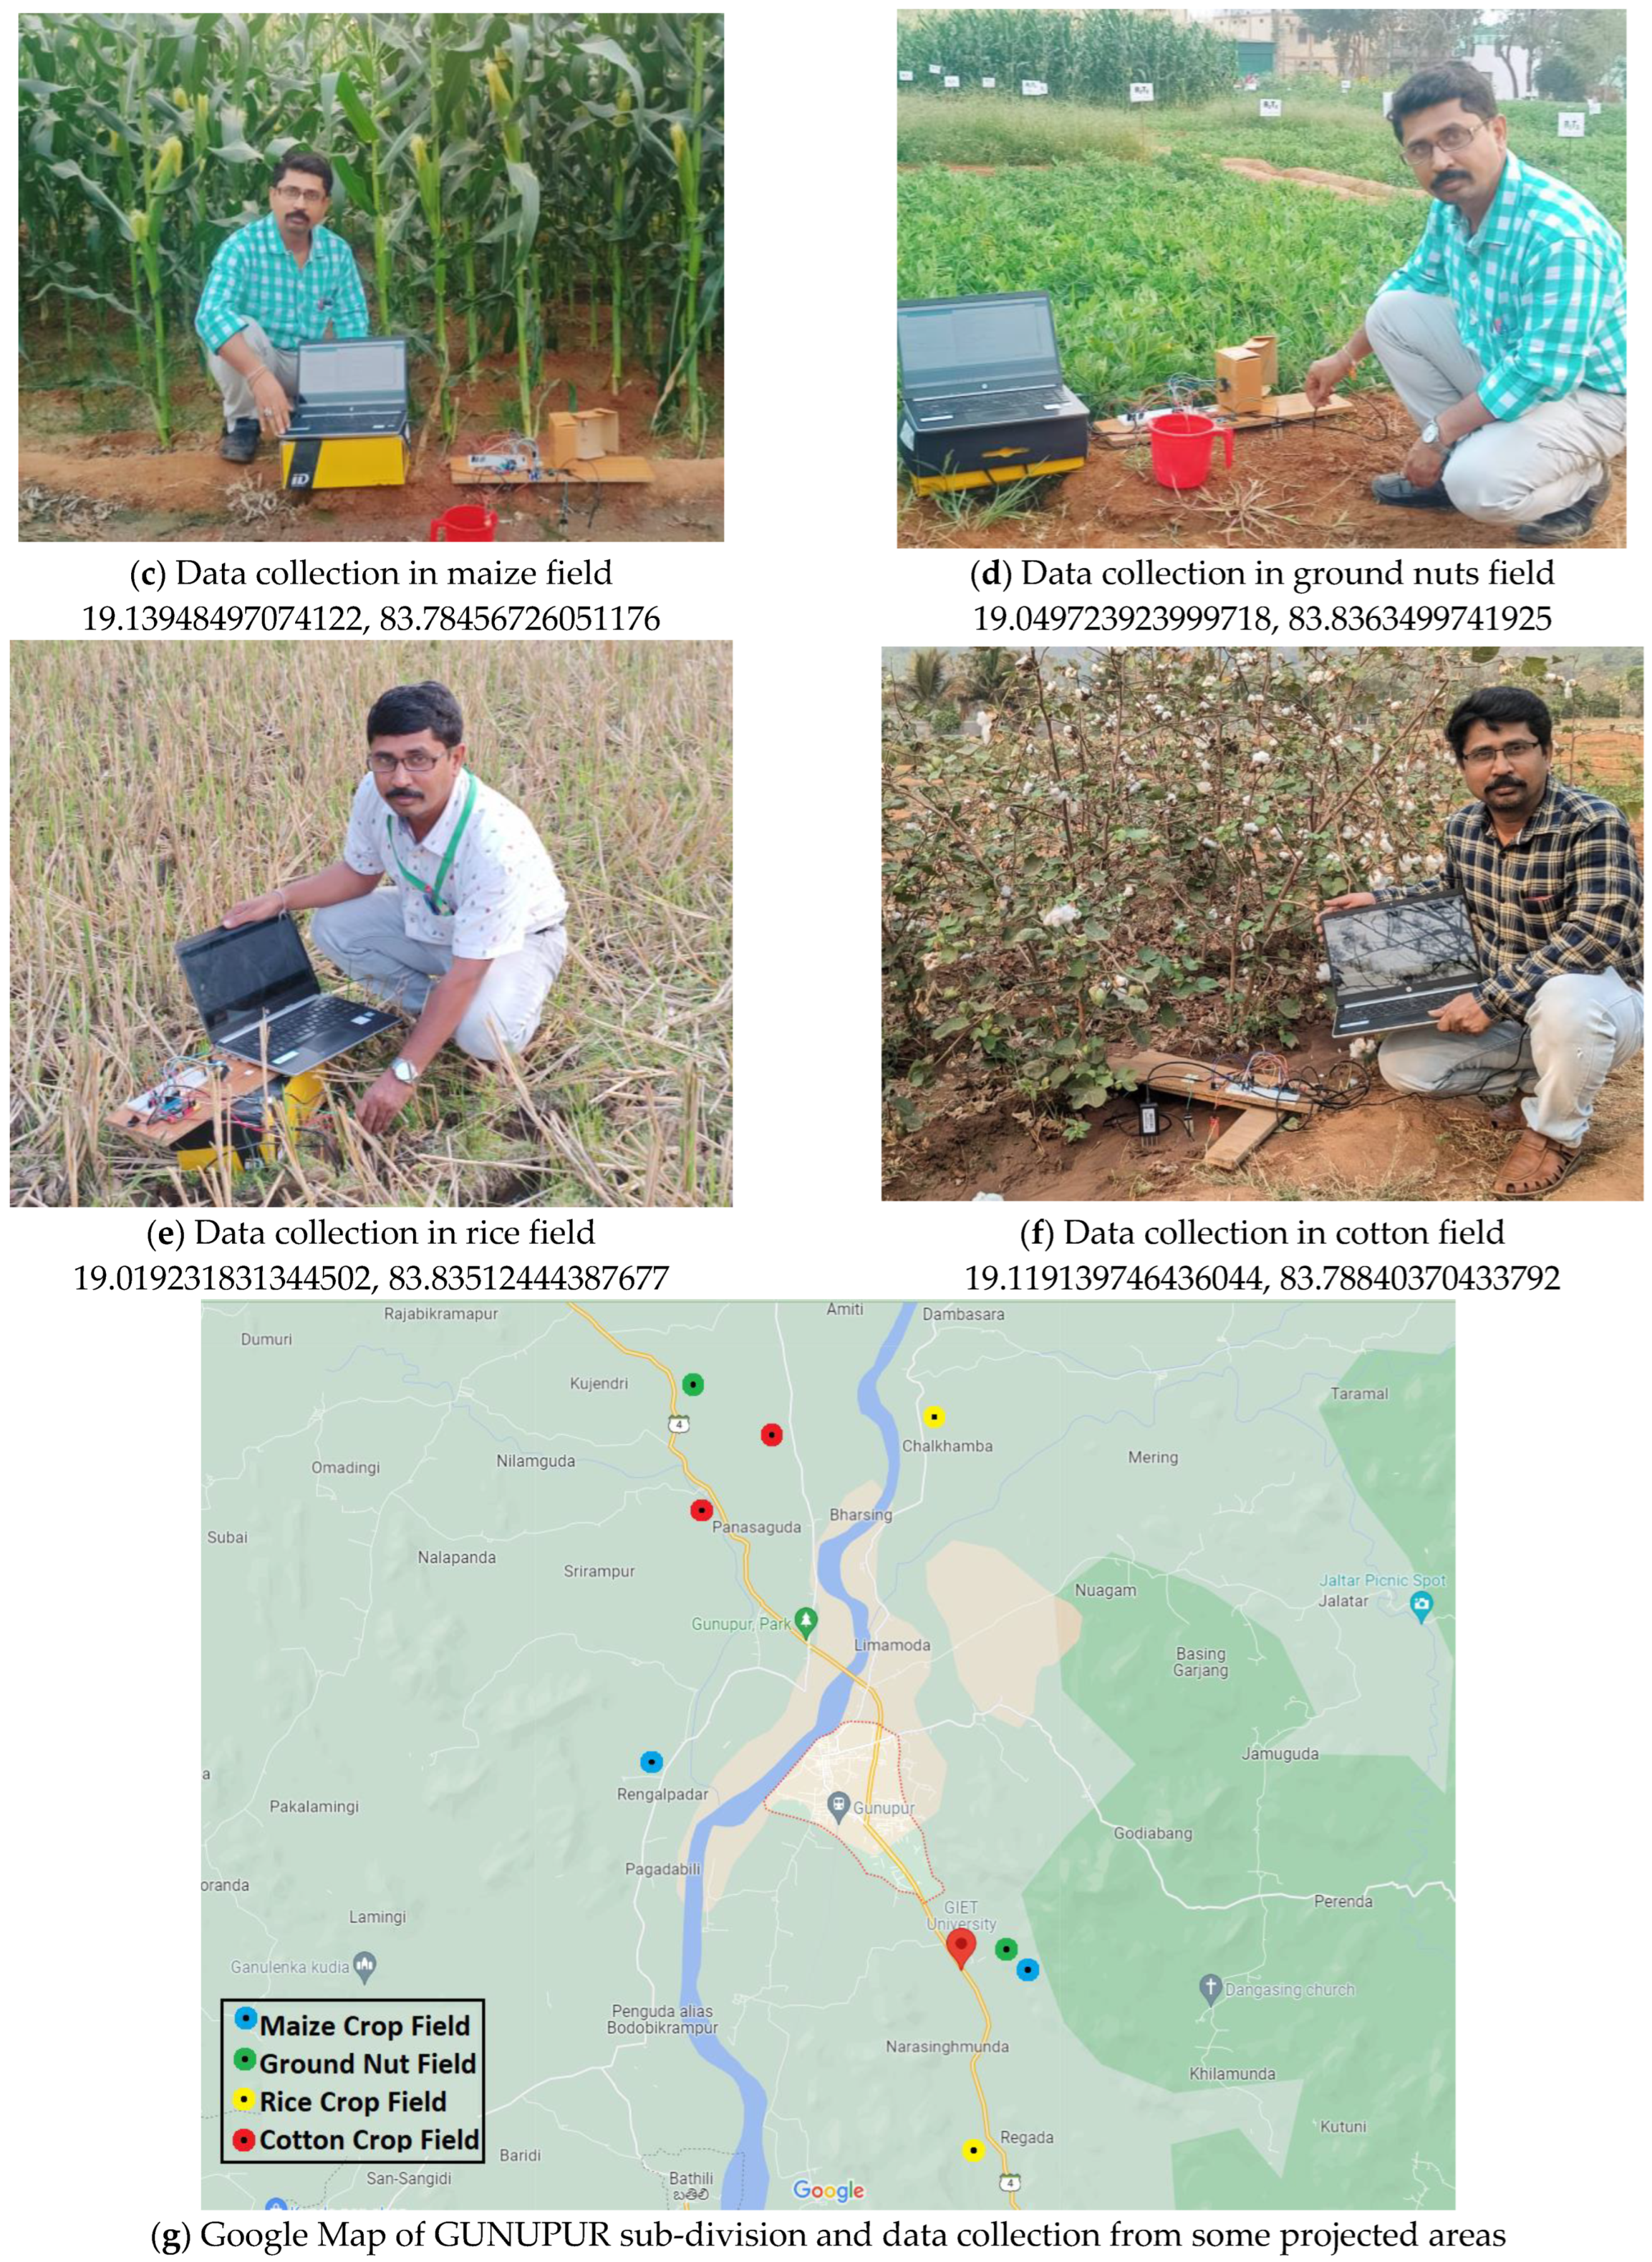
3.1. RQ1: How Can We Collect Real-Time Data on Soil Temperature, Minerals, Moisture, and Water Level Availability in Different Crop Fields via an Optimised Use of Sensors?

3.2. RQ2: How Can We Store Real-Time Data from Sensors into Cloud Memory and How Can the Farmers Visualise the Data?

3.3. RQ3: Can We Analyse and Predict Crops with Higher Accuracy by Applying Machizne Learning Algorithms to the Available Soil Mineral Cloud Dataset?
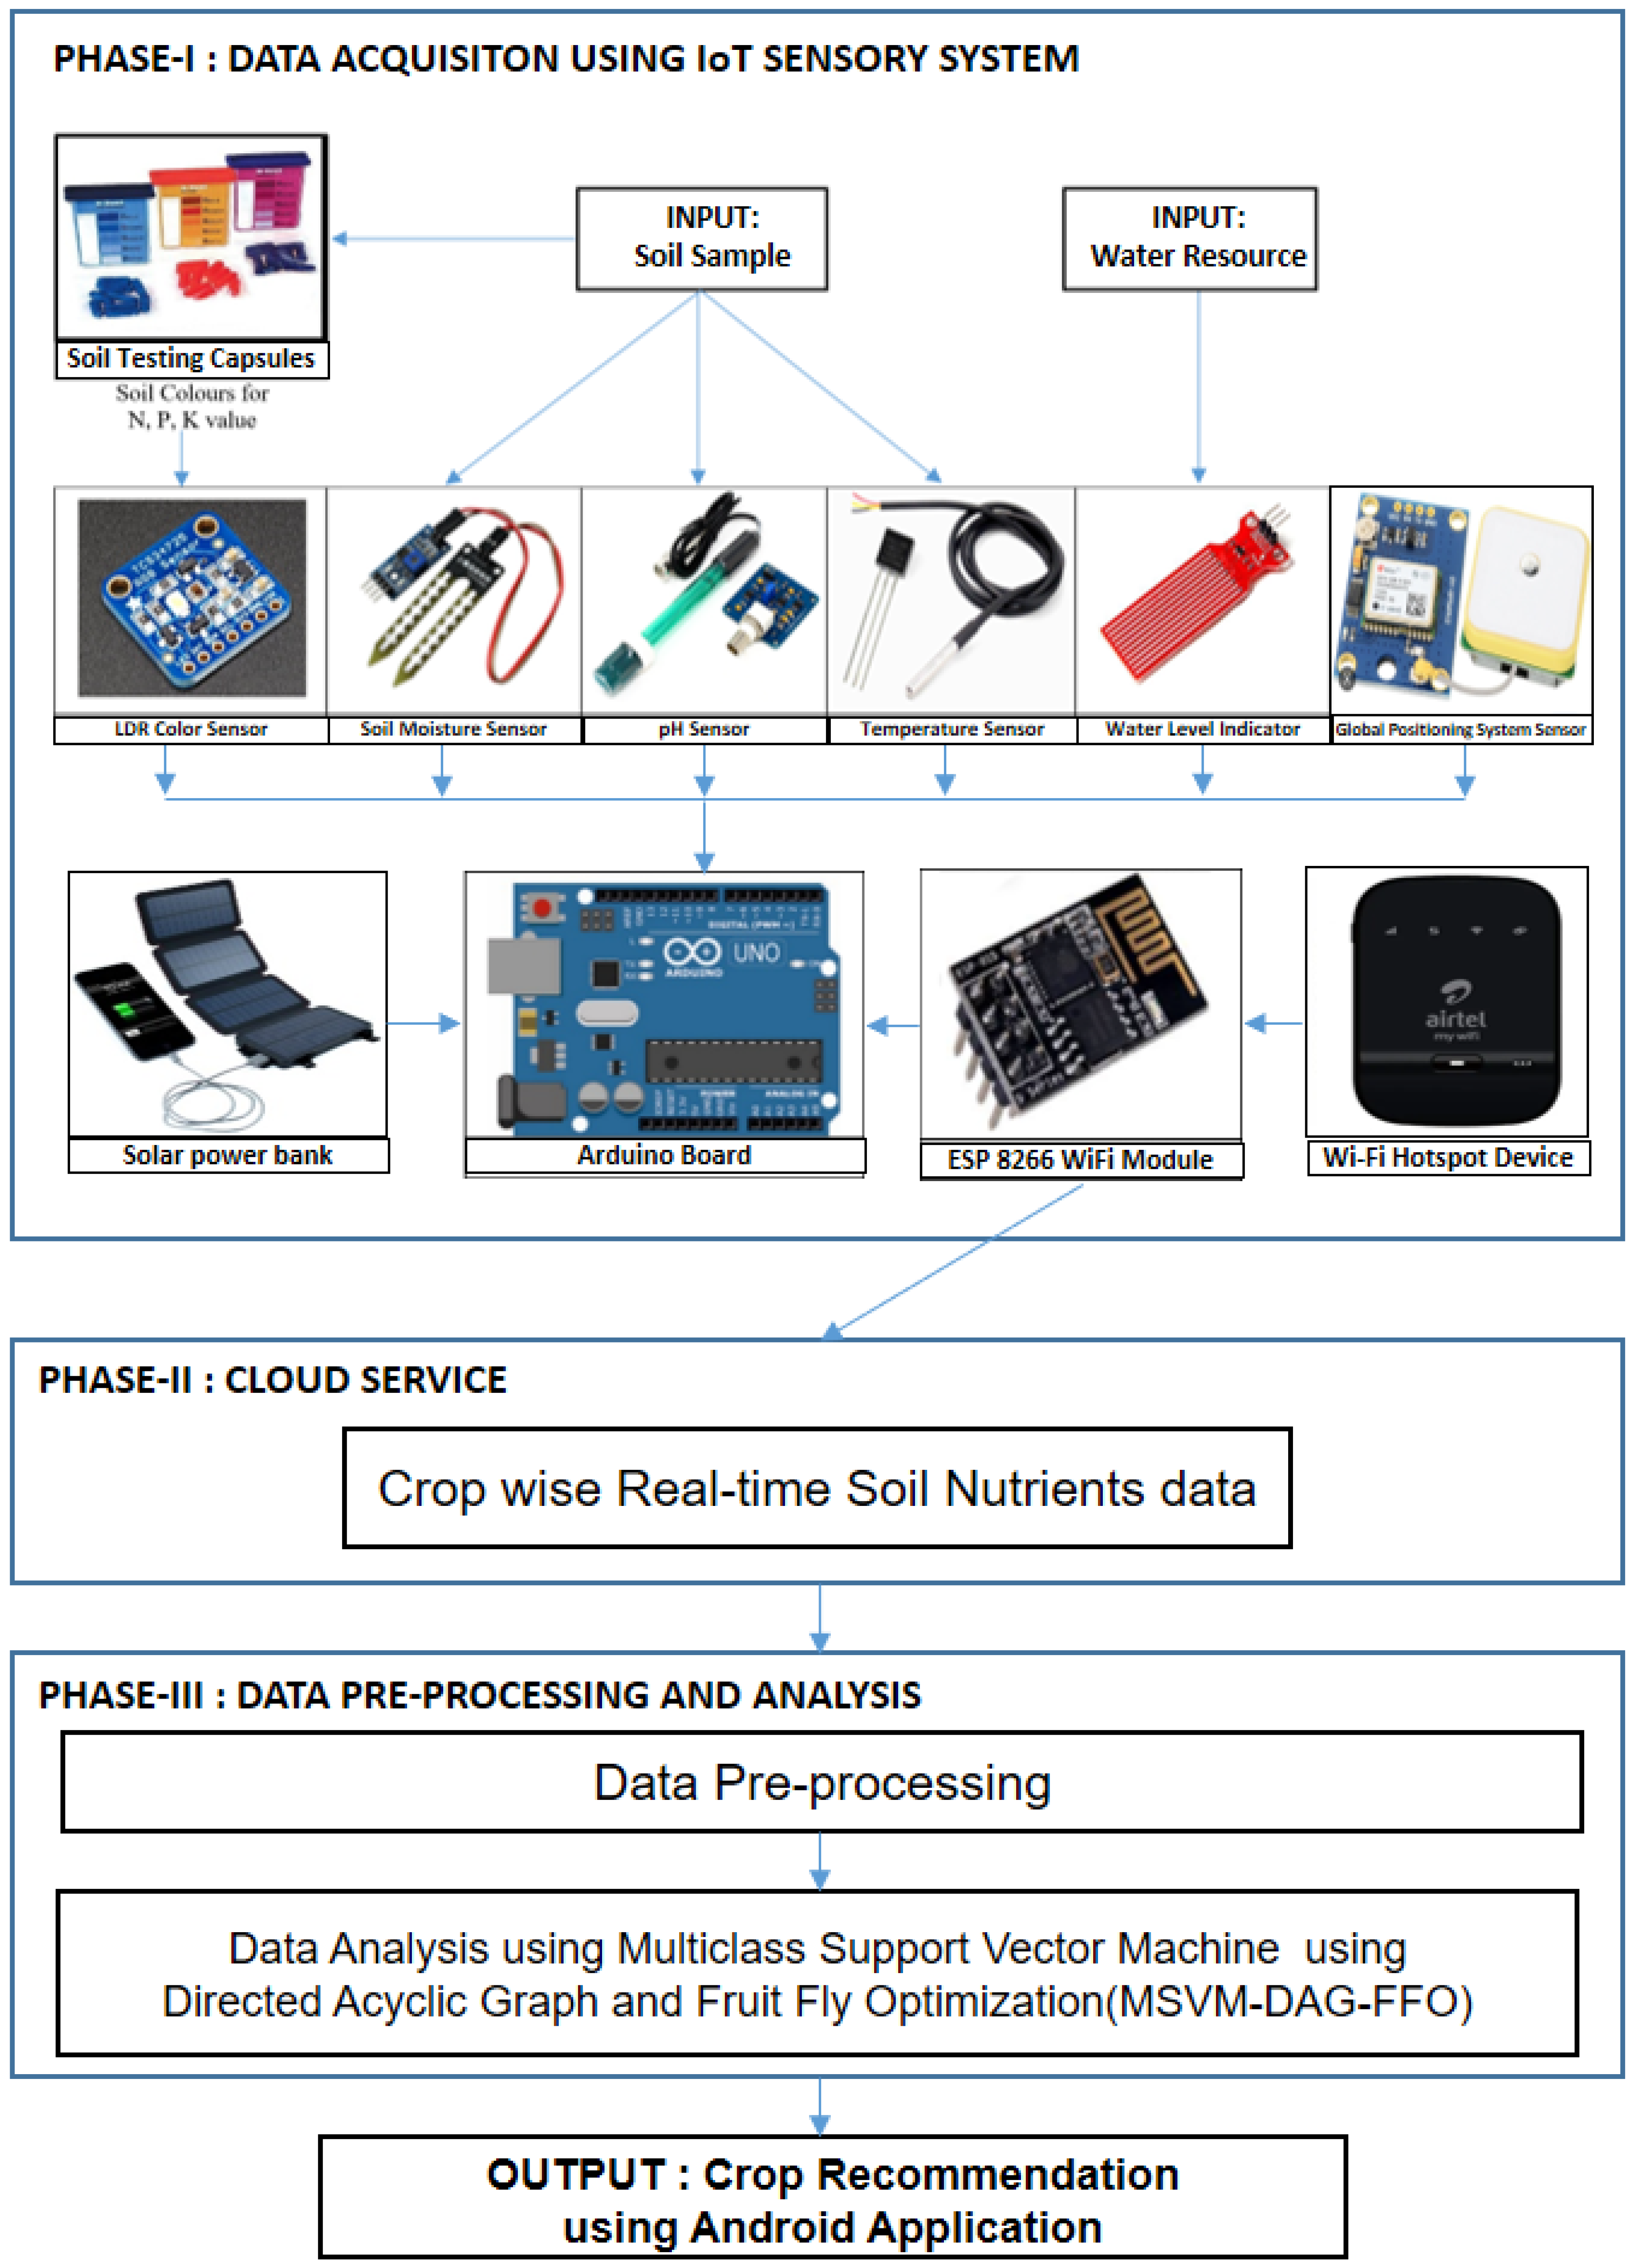
4. Proposed Work

In this paper, we propose a new IoT-enabled soil nutrient classification and crop recommendation (IoTSNA-CR) model to classify soil nutrients and recommend crops for precision agriculture. The IoTSNA-CR model involves different processes, namely data acquisition using sensors, storage in the cloud, MSVM-based classification with FFO-based parameter optimisation, and crop recommendation. Figure 1 presents the block diagram of the IoTSNA-CR model. The detailed working process is given in the succeeding sections.

4.1. Solution for RQ1

  • PHASE-I: Data Acquisition Using IoT Sensory System
The model was employed with a device consisting of different sensors, such as a moisture sensor, a temperature sensor, a GPS sensor, an LDR soil colour sensor, and a pH sensor. We used this device for data acquisition from fields. Sensor nodes were linked by the (Edge Services Platform) ESP8266 Wi-Fi module and Arduino micro-controller. The node MCU (micro controller unit) was linked with the Rx pins and Arduino via Tx pins for receiving and transmitting sensor information. The Amazon Web Services IoT provided a device software development kit to transmit the sensor information. The wireless sensor network included an embedded device that was linked for empowering several facilities to take measurements with minimised effort and low power. The soil moisture sensor (FC28) was used to evaluate the volumetric water contents in the soil. The soil properties such as dielectric constant/electrical resistance were defined according to the calculated soil moisture. The soil moisture sensors contained two probes. The moisture value was attained by implanting the probes into the soil. The data attained from the sensors acted as a support scheme to the farmer for handling the irrigation scheme efficiently. A soil temperature sensor (DS18B20) was used to calculate the temperature of the soil. The voltage reading through the diode displayed the functioning base of the sensors. The sensor transmitted an electric signal that was transformed into different units of measurement such as Fahrenheit, Celsius, and Kelvin. The voltage difference was amplified, and analogue signals were produced using the device that were directly proportionate to the temperature. The soil pH sensor was used for finding the pH values in the soil that define whether the soil is basic/acidic. The pH values of soil influence the accessibility of microorganisms and nutrients. The pH values are in the range of 0–14, in which 7 represents neutral. pH values less than 5.5 indicate stronger acidity, pH values less than 6.5 indicate moderate acidity, pH values in the range of 6.5–7.5 indicate neutral, above 7.5 pH values indicate alkalinity, and above 8.5 pH values indicate stronger alkalinity. The LDR soil colour sensor (TCS3200 TCS230) was used to detect the RGB colour values. Here, we applied an easy way to find the NPK values of soil. We used Agrinex Soil NPK and pH testing capsules to test soil samples and then using LDR sensors we read the RGB values of the samples. These RGB values were used to find the NPK and pH values of soil in comparison with the available NPK and pH colour chart. This was an alternative way of finding the NPK values without using the NPK sensor. It is used to reduce the investment cost of the NPK sensor. The GPS sensor (NEO-6M) was connected with Arduino and was used to detect the longitude and latitude of the present location. With this sensor, we were able to collect the soil data along with the present location information from time to time for storage. The ESP8266 Wi-Fi module was connected with Arduino to enable the internet connectivity by using the transmission control protocol (TCP) and the user datagram protocol (UDP). This enables the Wi-Fi connectivity for Arduino. The Arduino micro-controller (Arduino UNO R3) board was connected with different sensors and then by executing the required programs in its IDE we collected the sensor data.
The sensory model was built, and we conducted experiments for collecting data from different crop fields in RAYAGADA districts per the geographical information. We took the guidance of the local agriculture office to identify the crop-wise geographical locations and of a soil science expert to validate the crop fields and to validate the collected data from the crop fields using sensors.
The data collection process was carried out in different crop fields of the Rayagada district in consultation with agriculture experts and experienced farmers. Additionally, we took as a reference the geographical map of the district to identify the water availability. By considering these parameters, the data collection was performed and stored in the cloud Firebase. Table 3 below presents the data collection conducted from different GPA locations and crop fields:
The pictures in Figure 2 present the sample pictures during the data collection from fields of cotton, maize, ground nuts, and rice grains, along with their longitude and latitude from different geographical locations. We collected the soil moisture values, soil temperature, water level availability, pH value, longitude, latitude, and NPK value using the Arduino Serial Monitor. Then, by processing soil with soil testing capsules, we collected the soil colours using the LDR colour sensor. These soil colour values were used for finding the values of phosphorous, potassium, and nitrogen. The real-time data were collected multiple times in different time intervals from the crop areas of Rayagada district, and so this will be useful for further analysis. These data were further stored into low-cost cloud storage in terms of CSV files. We developed an Android application that is connected to this low-cost cloud storage to fetch the real-time dataset and it was used for processing (https://github.com/muraliksenapaty/Soil-Nutrient-Data-Collection, access date: 10 November 2022).

4.2. Solution for RQ2

  • PHASE-II: Cloud Service
A cloud memory service gives users location independence and resource availability, and it can be shared by multiple users. So, we connected our sensory device to cloud memory. An ESP8266 Wi-Fi module was connected to the Arduino board. The Arduino code communicated with the Wi-Fi module, and then the data were stored in the Firebase cloud service. We created an Android application, and we interacted with cloud data using this application. We used the data streamer feature of Excel to collect the live data and store them in CSV format.
We used the Firebase cloud service, which is a NoSQL database that allowed us to store and synchronise real-time data. It has an easy integration approach for Android. Figure 3 represents the data storage area in the Firebase service and the Android application configured within it. It is a Google-backed web application development environment in which we could easily store the data along with images, video, etc. The public cloud can also be used because it is cost-effective. Additionally, we can share our cloud data with other farmers for reading and analysis purposes for their benefit. The analysed output data can be stored back into the cloud. Challenges may arise related to storage when more real-time data collection is performed for various cultivation lands and their crops. A challenge may also arise for prediction for a particular crop if sufficient real-time data are not available. Additionally, data cleaning is necessary and should be conducted periodically. Authentic access shall be there for updating the real-time data in the cloud. For data analysis, we executed machine learning models using an Android application. For this, at first we picked the machine learning model using Flask API, produced the output in JSON universal format, and using the Java Android application we converted this JSON format into Android format.

4.3. Solution for RQ3

  • PHASE-III: Data Pre-processing and Analysis for Crop Recommendation

4.3.1. Data Pre-Processing

We conducted data pre-processing, which helped to increase the efficiency of the machine learning model. We collected the data with variables such as longitude, latitude, date, time, temperature, moisture, water level, pH value, and nitrogen, phosphorous, and potassium values using a sensory device. These data are stored in a Firebase cloud service. We pre-processed these collected data. During the data pre-processing, we performed data cleaning and the transforming and normalising of the data to prepare them for analysis.
This step included dropping the missing values, removing null values, outlier detection, and normalising the data to put the values on a common scale. The statistical measure using the mean function was applied to normalisation here. Then, the feature selection was performed before choosing a machine learning model for training. The dataset was taken for training and testing with a ratio of 80% and 20%. We trained the MSVM-DAG-FFO classifier model on the dataset. Then, the classifier was trained to recognise patterns in the soil data and to categorise the data into different classes. Then, we implemented a real-time monitoring system to continuously collect and analyse soil nutrient data from the IoT sensors and update the predictions based on the latest data.

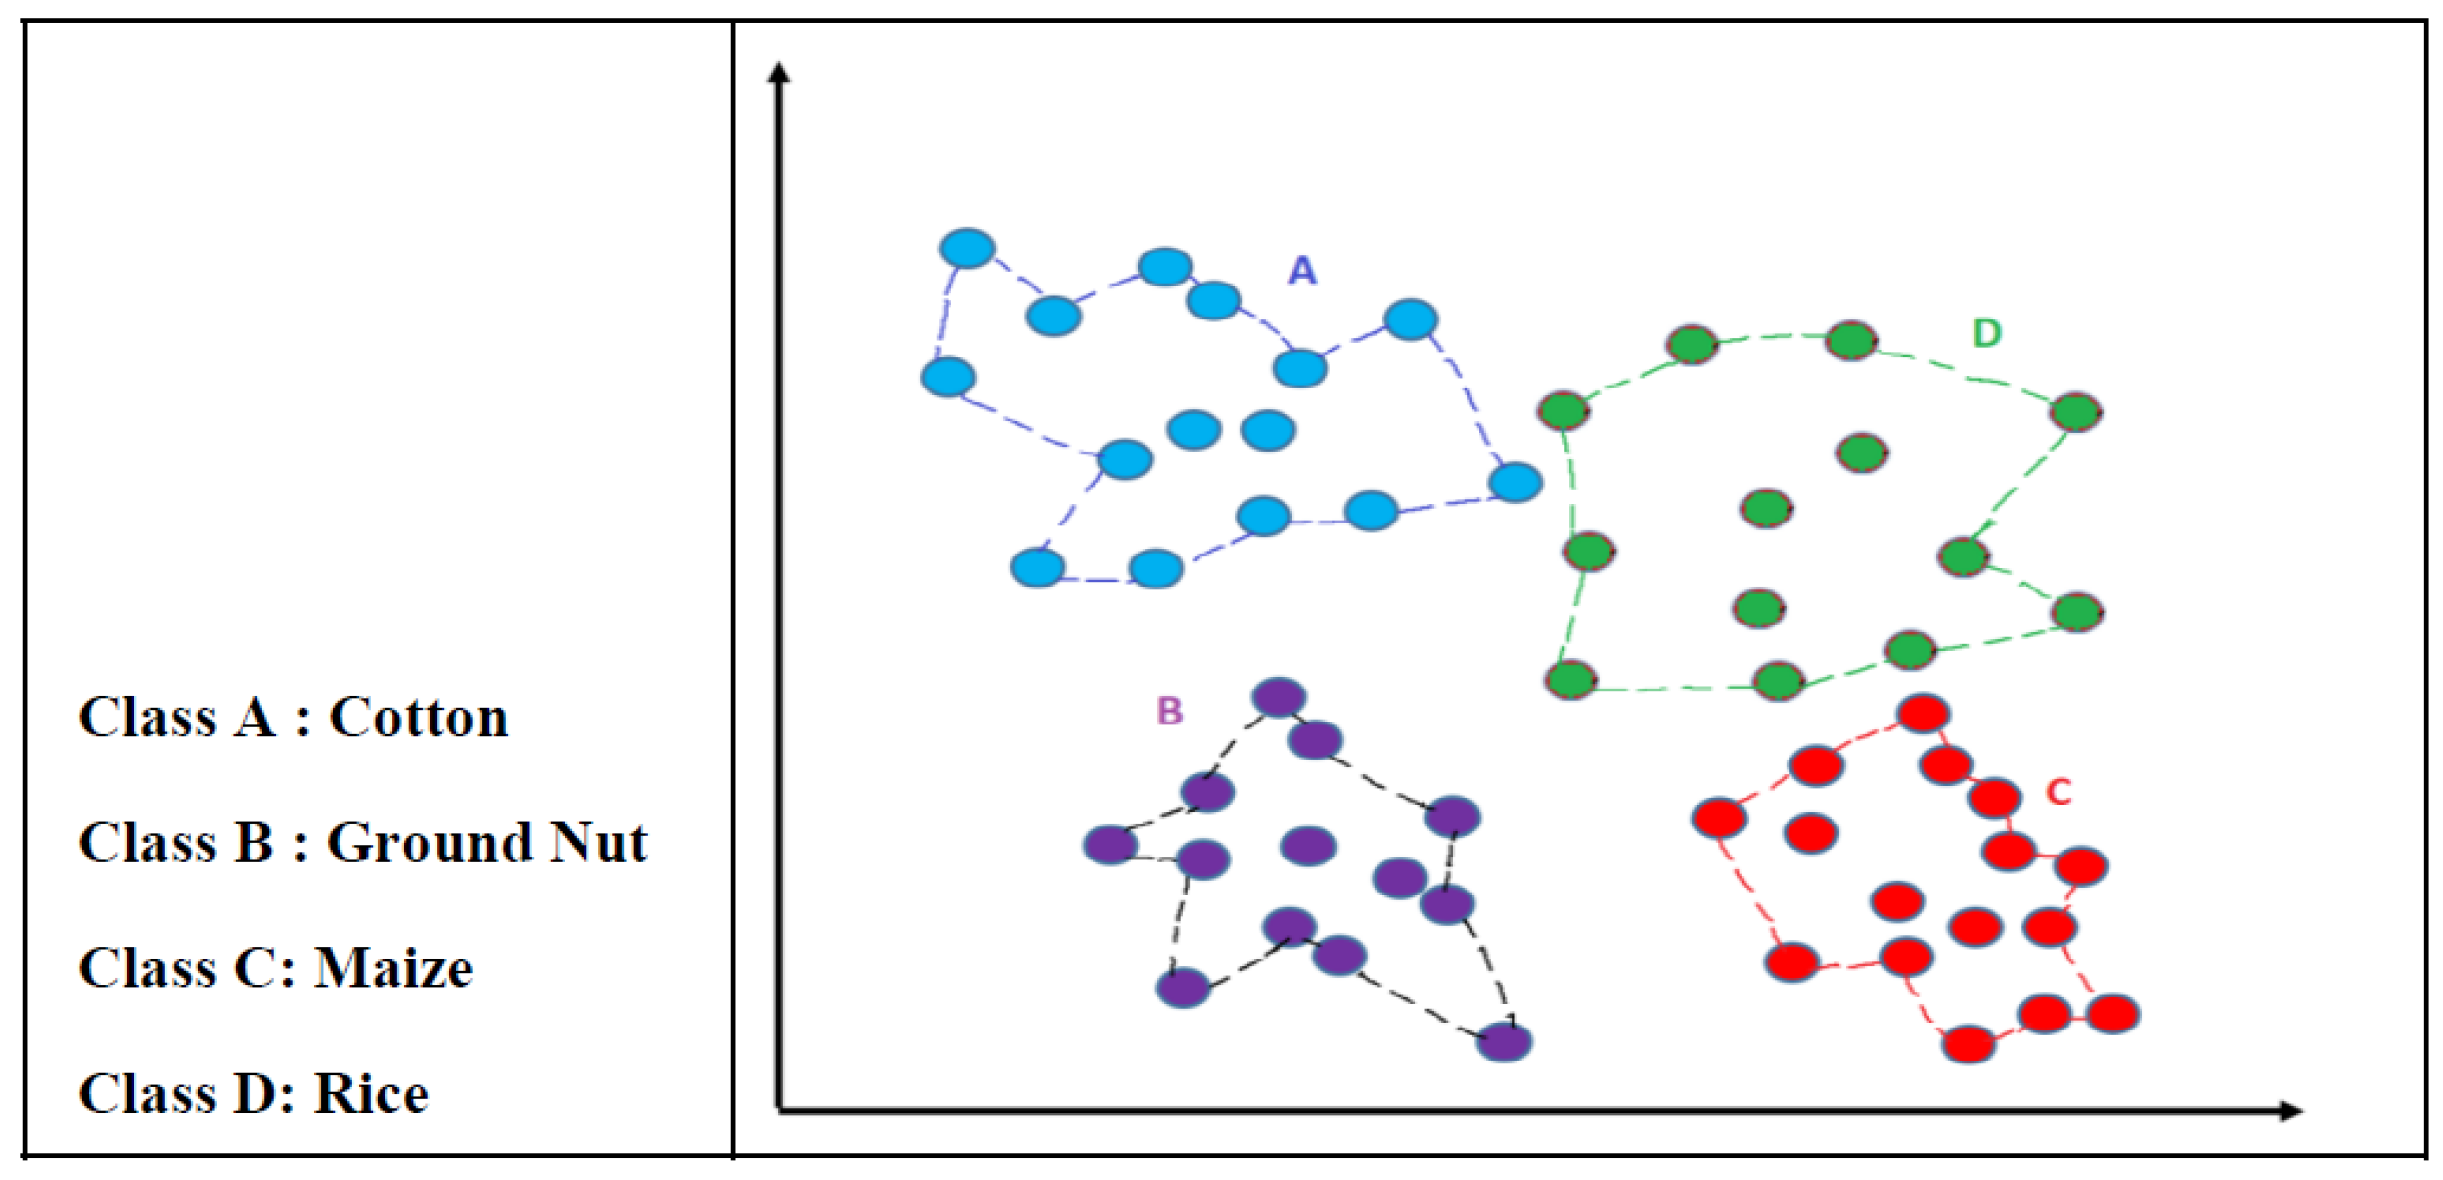
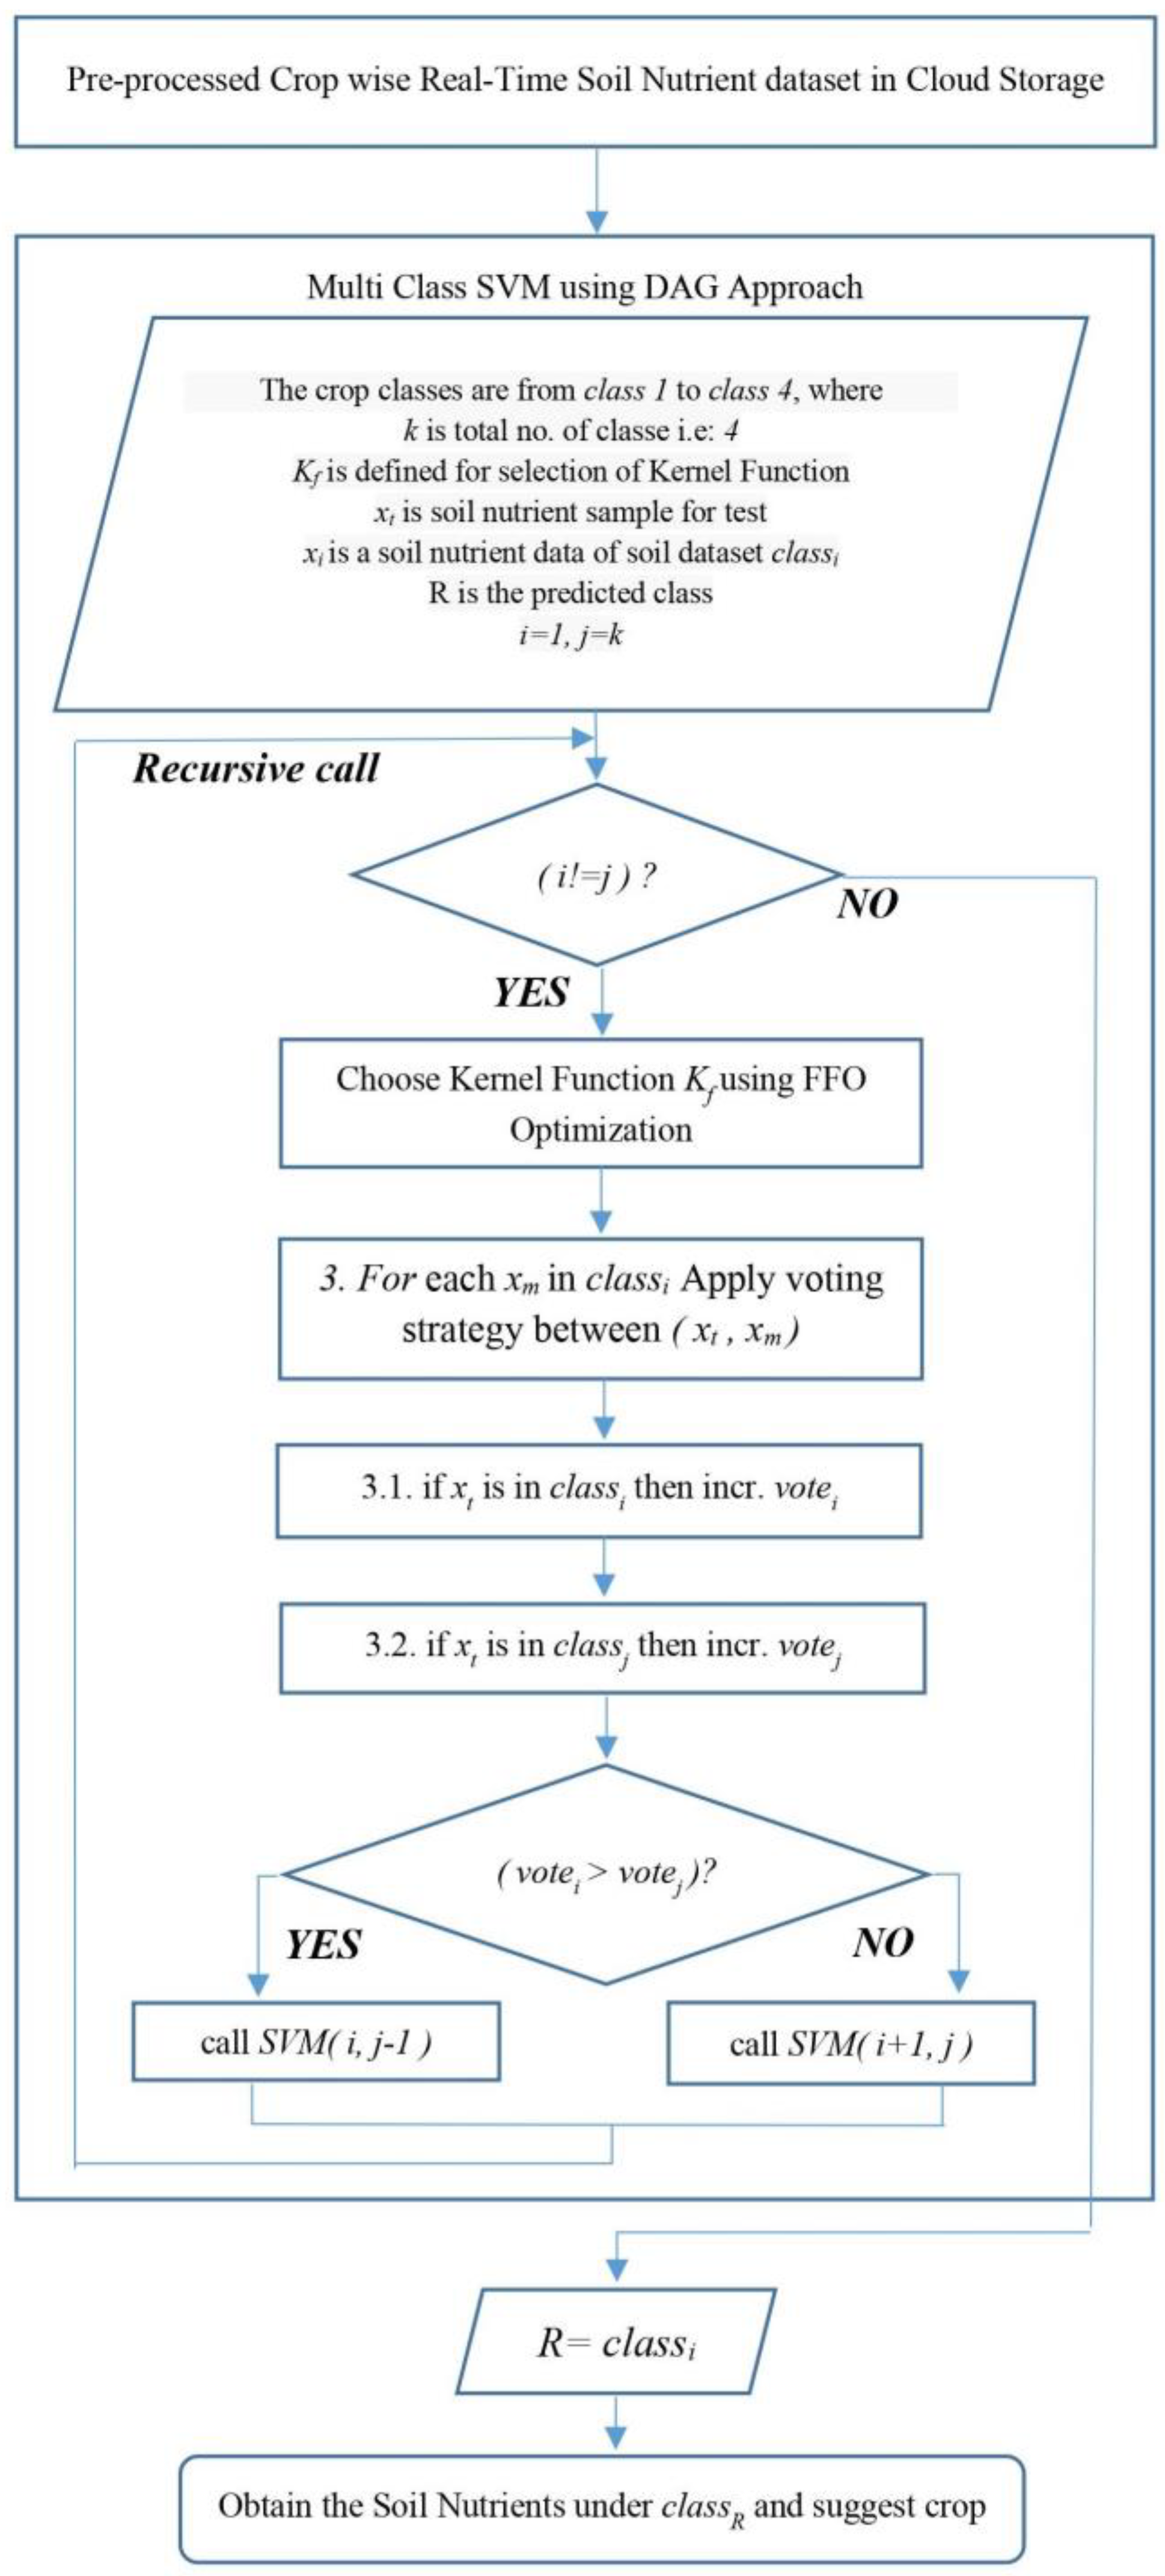
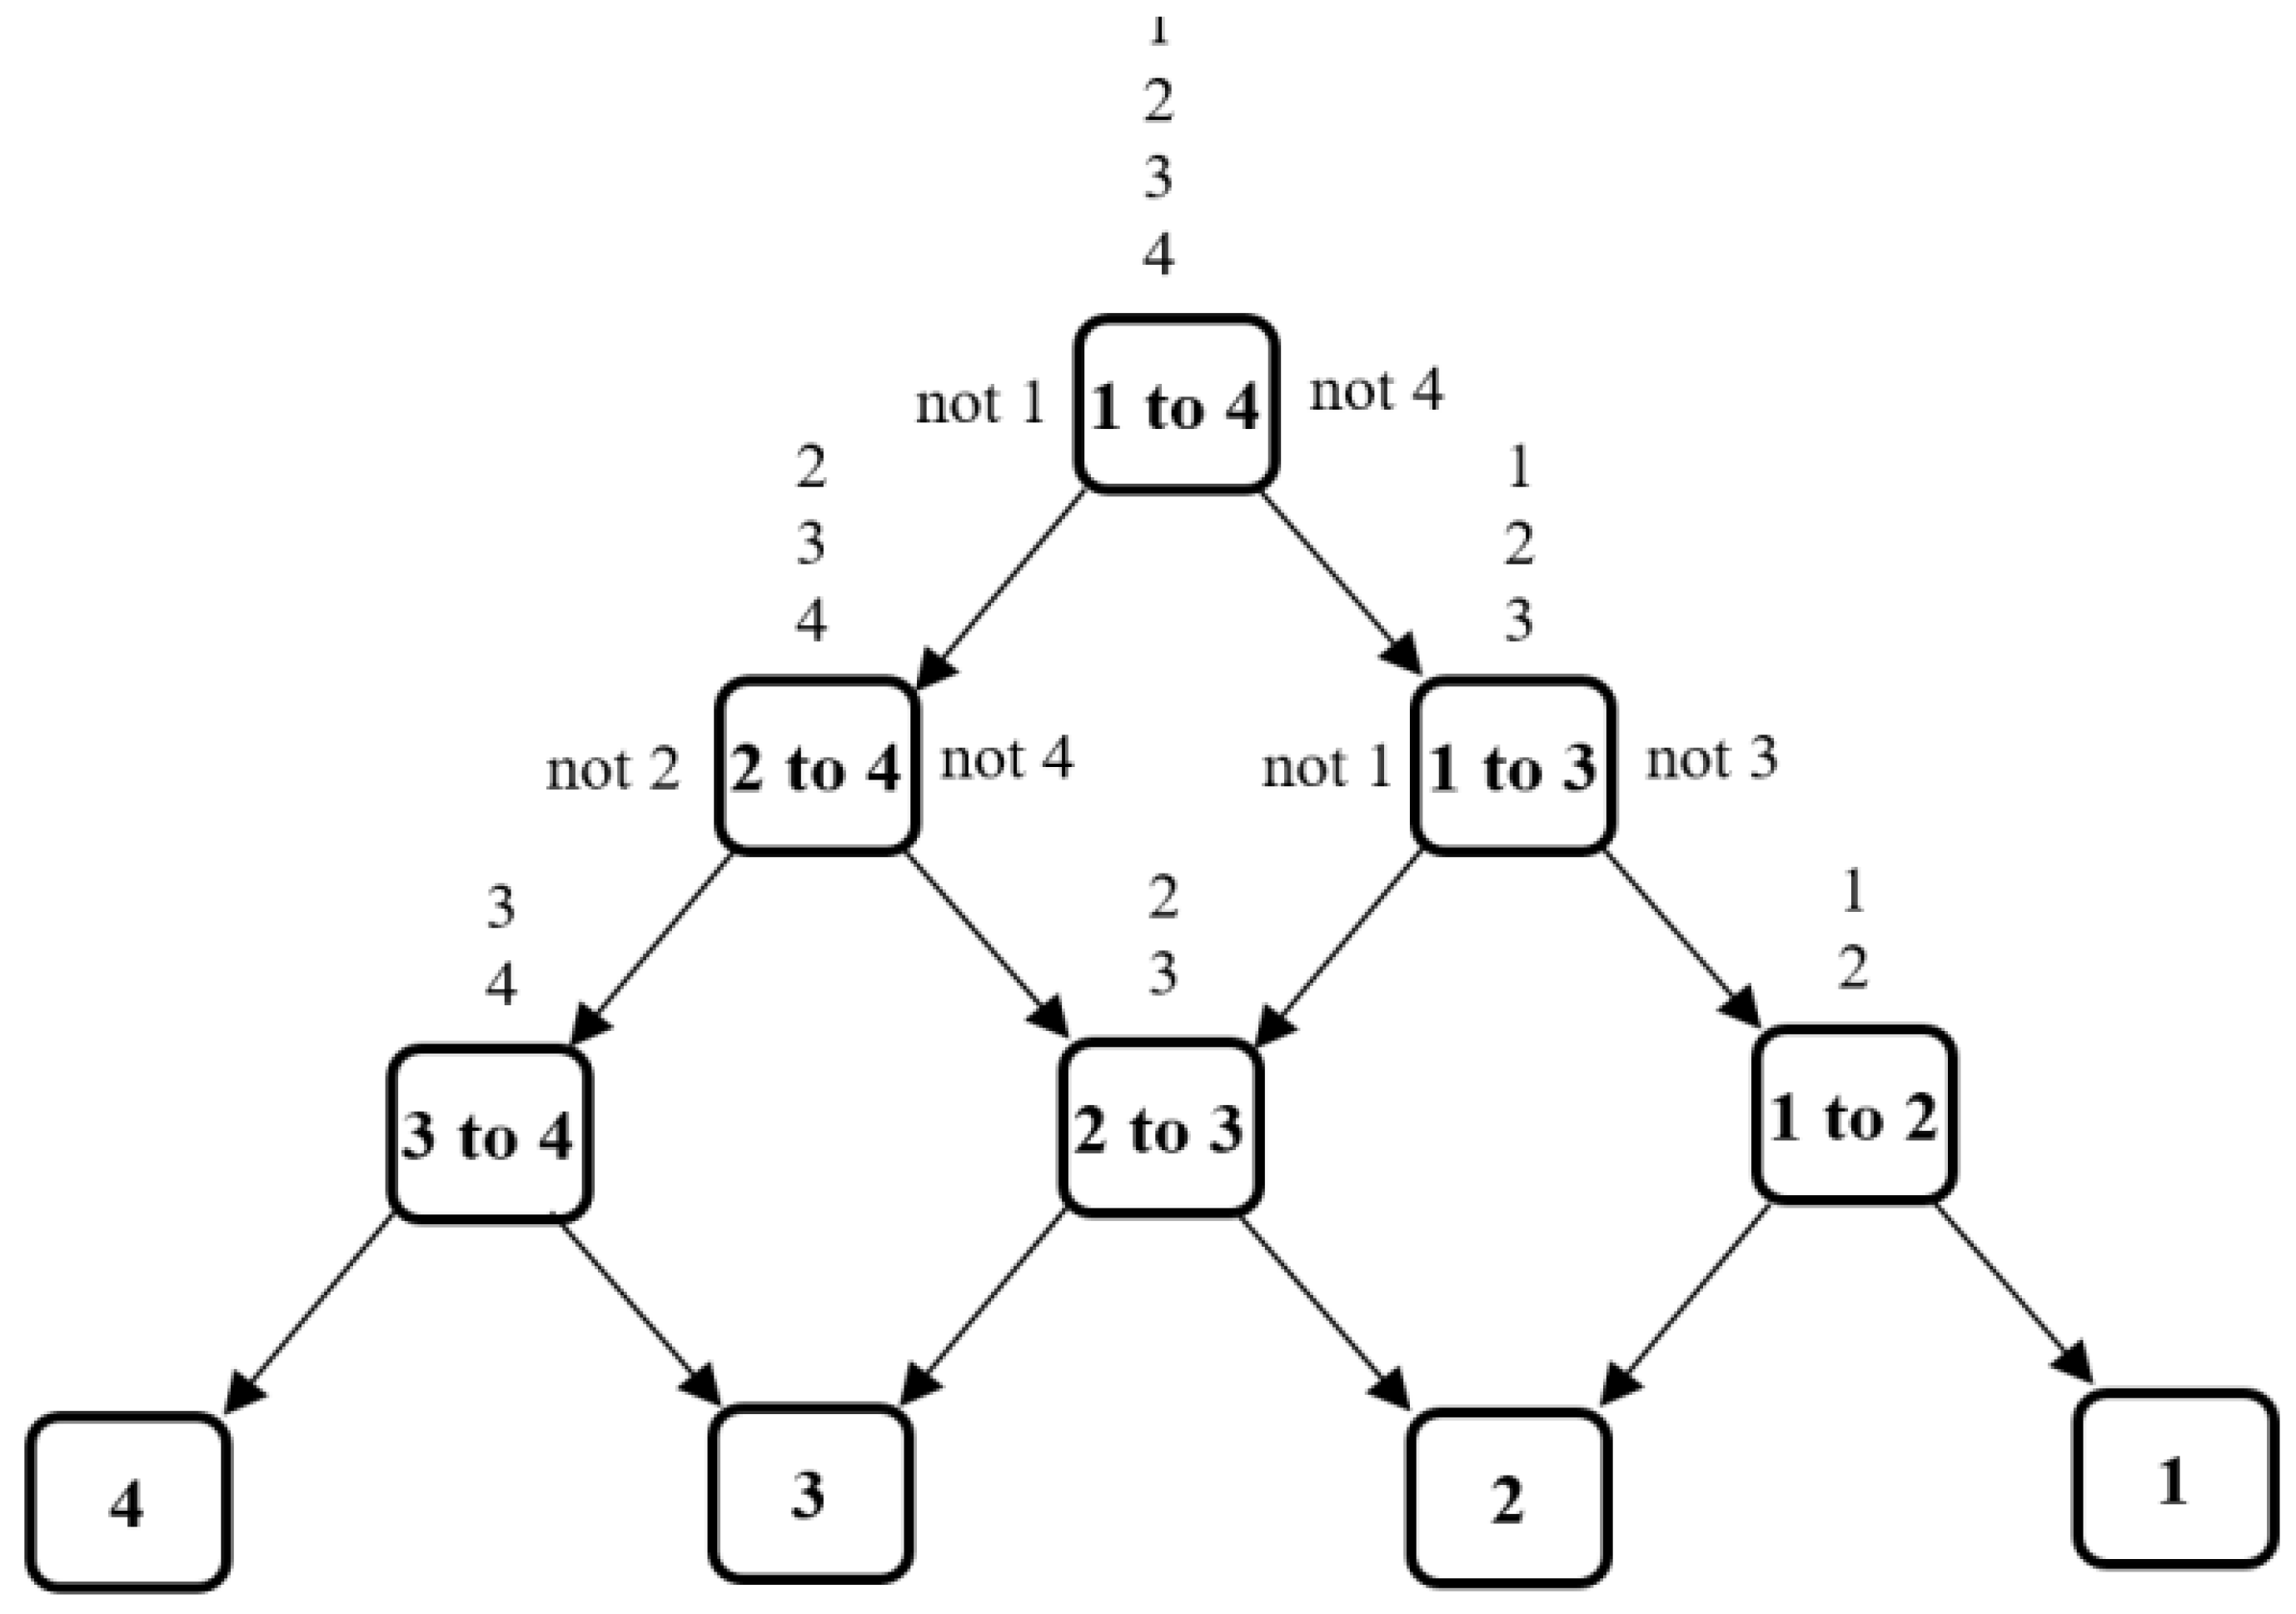
4.3.2. Multi-Class Support-Vector-Machine-Based Classification Model

The MSVM classifiers depend on VC dimensions of structural risk minimisation and statistical learning concepts. The primary goal was to map the pre-processed, non-linear, inseparable agricultural data to a linear high dimension manifold θ with the help of transformation :   R N θ , to later obtain an optimum hyperplane Ψ : ψ ( x ) = ( ω · ϕ ( x ) + b ) by resolving the succeeding optimisation convex problems (the soft margin problems):
min ( ω ,   ξ ) = 1 2 ω 2 + β i = 1 n ξ i
subjected to
y i ( ω · ϕ ( x ) + b ) 1 ξ i , f o r   a l l   1 i n
where ω represents a coefficient vector of the hyperplane in the manifold or feature space, b denotes the threshold values of the hyperplanes, ξ i indicates a slack factor presented to the classification error, and β signifies penalty factors for the error shown in Equations (1) and (2). The variable β controls the penalty of misclassification and the values are generally defined by cross-validation. A large value of β generally leads to a smaller margin that minimises the classification error when a small value of β might generate a wide margin resulting in several misclassifications.
The feature space θ is extremely dimensional; hence, its direct computations could lead to “dimensional disaster”. However, ω = i = 1 n δ i y i ( x i ) , and every operation of MSVM in the feature space θ is a dot product. Additionally, the kernel function, ( x i ,   x i ) = ( x i ) · ( x i ) , is effective in managing dot products; they were presented to the SVM. Therefore, the election of the kernel and its coefficient is significant in the computation efficacy and precision of an MSVM classifier method.
The standard kernel function was used continuously as a predictor that included linear kernel, polynomial kernel, and Gaussian kernel functions defined in Equations (4)–(6).
These MSVM kernel functions could be widely classified into global and local kernel functions. Sample distance has a greater effect on the global kernel value when samples that are closer to one another highly impact the local kernel value. The polynomial kernel and linear kernel are examples of global kernels, whereas the Gaussian radial basis function (RBF) and the Gaussian are the local kernels. Generally, the linear kernel functions have an improved extraction of global features from the sample, the polynomial kernels have a better generalising capability, and the Gaussian kernel (the commonly employed kernel) has a better learning capability amongst each single kernel function.
Therefore, it is obvious that using single-kernel-function-based MSVM classifiers in a provided application such as gene expression data might achieve either better learning capability, appropriate global feature extraction capability, or good generalisation ability.

4.3.3. Fruit Fly Optimisation

The kernel function of the MSVM model implements the FFO algorithm and thereby improves classification performance. The FFO technique is a novel swarm-based evolutionary method stimulated by the food-finding behaviours of the fruit fly (FF). Once the food is found, it smells the food source from the air via the olfactory organ and flies toward the directions initially; after getting closer to the food position, the FF can employ its sharp vision for finding food and another FFS flocking position and fly toward these directions. The fundamental FFO algorithm was developed based on the FF swarm’s food-finding characteristics [12,13].
The starting position of fruit fly swarms ( X a x i s , Y a x i s ) are randomly distributed using Equation (7). Then, it finds the distance and direction for the ith fruit fly using Equation (8). In Equation (9), it evaluates the distance from the origin to the food position and in Equation (10) it evaluates the smell concentration judgement. Finally, in Equation (11), the fitness function is identified and later the present maximal smell concentrated value is compared with the historical optimal value to find the optimal smell.
Definition 1.
To find N, P, and K values from a soil sample, the below Equation (3) can be applied, where Nm implies the measured nitrogen (in ppm), Av denotes the analogue voltage, Ncurr_low refers to the lower edge of the current range, Ncurr_upp implies the upper limit of the current range, and Ntgt_low and Ntgt_upp denote the lower and upper limits of the target ranges.
N m = ( A v N c u r r _ l o w ) × ( N t g t _ u p p N t g t _ l o w ) ( N c u r r _ u p N c u r r _ l o w ) + N t g t _ l o w
Definition 2.
Equation (4) presents the linear kernel function which is used when the data of a dataset can be separated using a single line. When higher number of features are present in a dataset then the linear kernel is preferred. In Equation (4), x i ,   x i are independent variables and G() is the kernel function.
G ( x i ,   x i ) = x i · x i
Definition 3.
Equation (5) represents the polynomial kernel method which is commonly used in SVM and which presents the similarity of vectors. It is suitable when all training data are normalised.
In Equation (5), d is the degree of the polynomial constant term δ   and the slope η
G ( x i ,   x i ) = ( η ( x i · x i ) + δ ) d ,
Definition 4.
Equation (6) defines the Gaussian kernel method in which the kernel function value depends on the starting point. Here, we calculate the similarity of x i and x i where   σ > 0 .
G ( x i ,   x i ) = exp ( x i x i 2 2 σ 2 ) ,  
Definition 5.
In the FFO algorithm, Equation (7) generates the initial position of the fruit fly from where the food searching begins [12,13].
X _ a x i s j = L B j + ( U B j L B j ) r a n d o m ( ) Y _ a x i s j = L B j + ( U B j L B j ) r a n d o m ( )
Definition 6.
In the fruit fly optimisation algorithm, Equation (8) finds the direction and distance randomly using the sense of each fruit fly.
X i , j = X a x i s j + R a n d o m V a l u e Y i , j = Y a x i s j + R a n d o m V a l u e
Definition 7.
In the FFO algorithm, the fly senses the scent of fruit from a long distance. Equation (9) allows one to find the distance from the origin to the food position.
D i s t i , j = ( X i j 2 + Y i j 2 )
Definition 8.
The smell concentration judgment Si,j is evaluated when the distance from the origin is fed as an input. as shown in Equation (10).
Such   that   S i , j = 1 D i s t i , j
Definition 9.
Equation (11) represents the fitness function which accepts the smell concentration judgement as the input and finds the smell concentration of each fruit fly position.
S m e l l i = S F u n c t i o n ( S i , j )

4.3.4. MSVM-DAG-FFO Algorithm

A novel approach is used for MSVM-based classification using a directed acyclic graph and fruit-fly-optimisation-based parameter optimisation. The main objective of this approach is to maximise the separation between the data points by identifying the minimum distance towards the hyperplane.
Here, we break down the multiclass SVM into multiple one-vs-rest binary classifications. These binary SVM methods are executed using a direct acyclic graph. Here, the FFO algorithm was used to tune the MSVM model. We made a comparative analysis between this novel method and other methods such as the linear support vector machine (SVM), the SVM kernel model, and decision tree. It was observed that the FFO algorithm could be used in many applications of classification for selecting the optimised kernel function. The MSVM with FFO allowed us to classify the soil minerals and the recommendation of suitable crops more accurately in comparison with other methods.
Figure 4 presents a graph on the optimised classification of soil minerals based on four crop categories using the MSVM-DAG-FFO method. Here, the classes A, B, C, and D identified the crops of cotton, ground nut, maize, and rice, respectively. For each execution of SVM, a suitable function was selected out of the five kernel functions: linear, non-linear, polynomial, the radial bias function, and the sigmoid function. The fruit fly optimisation algorithm was used to choose a suitable kernel function while minimising the range of soil minerals per crop.
Multi-class support vector machine using directed acyclic graph and fruit fly optimisation (Algorithm 1, MSVM-DAG-FFO).
Algorithm 1: Multi-class support vector machine using directed acyclic graph and fruit fly optimisation (MSVM-DAG-FFO).
Input: Soil mineral samples from IoT sensors
Pre-requisite:
Recursive function to implement support vector machine
Classes to be in directed acyclic binary graph
Implementing one-vs-one SVM called recursively from root node to leaf nodes
Initialisation:
The crop classes are from class 1 to class 4, where k = total no. of classes.
Kf is defined for selection of kernel function
  • xt is soil nutrient sample for test
  • xi is soil nutrient data of soil dataset classi
  • R is predicted class
Process: classification of soil sample based on soil nutrient dataset.
Output: recommended crops

[Use multi-class SVM using DAG approach]
Begin
    Step 1: i = 1, j = k
    Step 2: R = SVM(i,j)
    Step 3: Obtain the soil nutrients under class R and suggested crop
End

SVM(i,j)
    Step 1: if(i! = j) then
        Step 1.1: Choose optimised kernel function Kf
                        using   d i s t i = ( X ( i ) m 2 + Y ( i ) m 2 )   of FFO
        Step 1.2: For each xm in classi apply voting strategy between (xt, xm)
                        1.2.1: if xt is in classi then increment votei
                        1.2.2: if xt is in classj then increment votej 
                        [end for]
        Step 1.3: if votei > votej then
                        call SVM(i,j − 1)
        Step 1.4: else
                        call SVM(i + 1,j)
                    [end if]
                  [end if]
    Step 2: return i
Step 3: Exit
In Figure 5, the flowchart is briefly elaborated upon about the implementation of the proposed algorithm MSVM-DAG-FFO into the pre-processed crop-wise real-time soil nutrient dataset from cloud storage. Here, we considered the dataset based on four crop classes and applied multi-class SVM via a recursive class of one-vs-rest SVM as per the no. of classes. For each call of SVM on a subset, the fruit fly optimisation method is invoked which allows one to choose the best kernel function by finding the optimal value of the kernel using the distance function d i s t i = ( X ( i ) m 2 + Y ( i ) m 2 ) in which X and Y are the initial values and m is the iteration number. Once the kernel function Kf is identified, it is applied in SVM, thereby following the voting strategy between all of the xm data and sample xt. Based on the voting, the SVM is called recursively either to the left subset or to the right subset. This recursive process continues until it reaches a single class which is verified using condition i = j. Once i = j, the SVM returns the class R for the sample data xt.
Figure 6 shows a group of four classes represented in a binary graph to understand the flow of execution. The SVM starts execution from the first node, and it calls itself recursively for both of its subset nodes in the binary graph. The recursive execution continues until it reaches the leaf node, i.e., identifies a unique class, so the total set of classes is divided into two subsets each time.

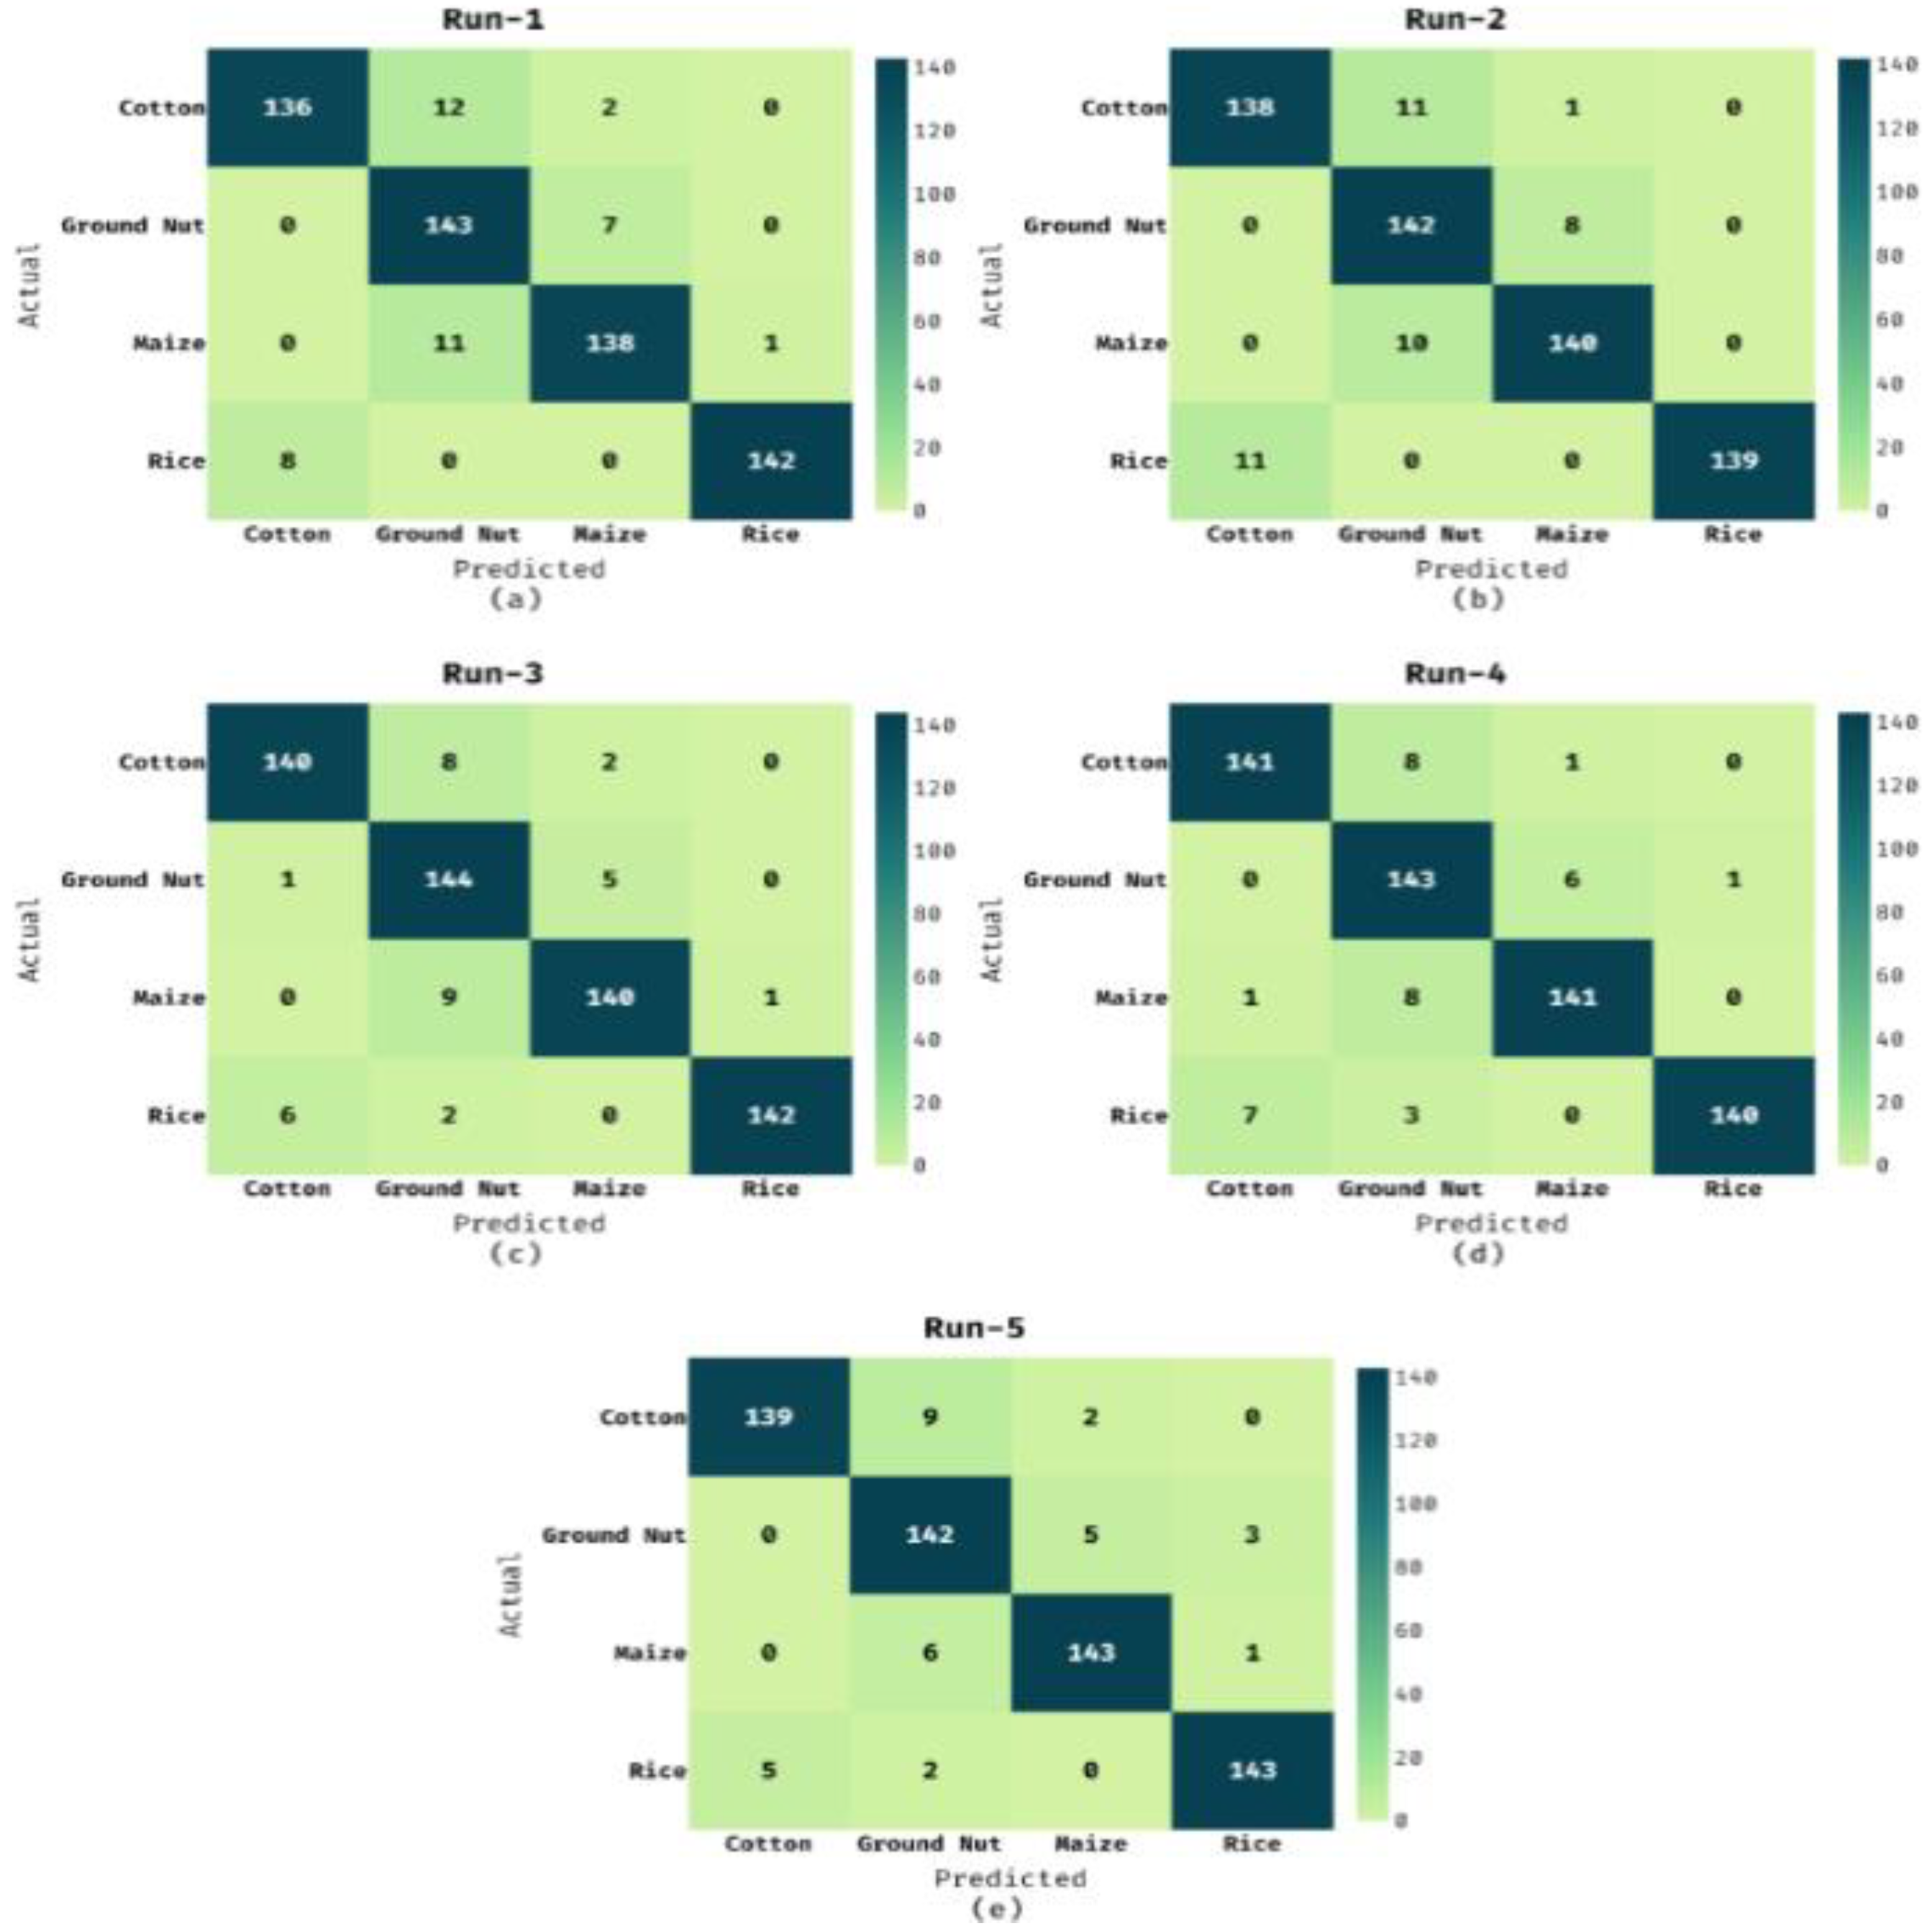
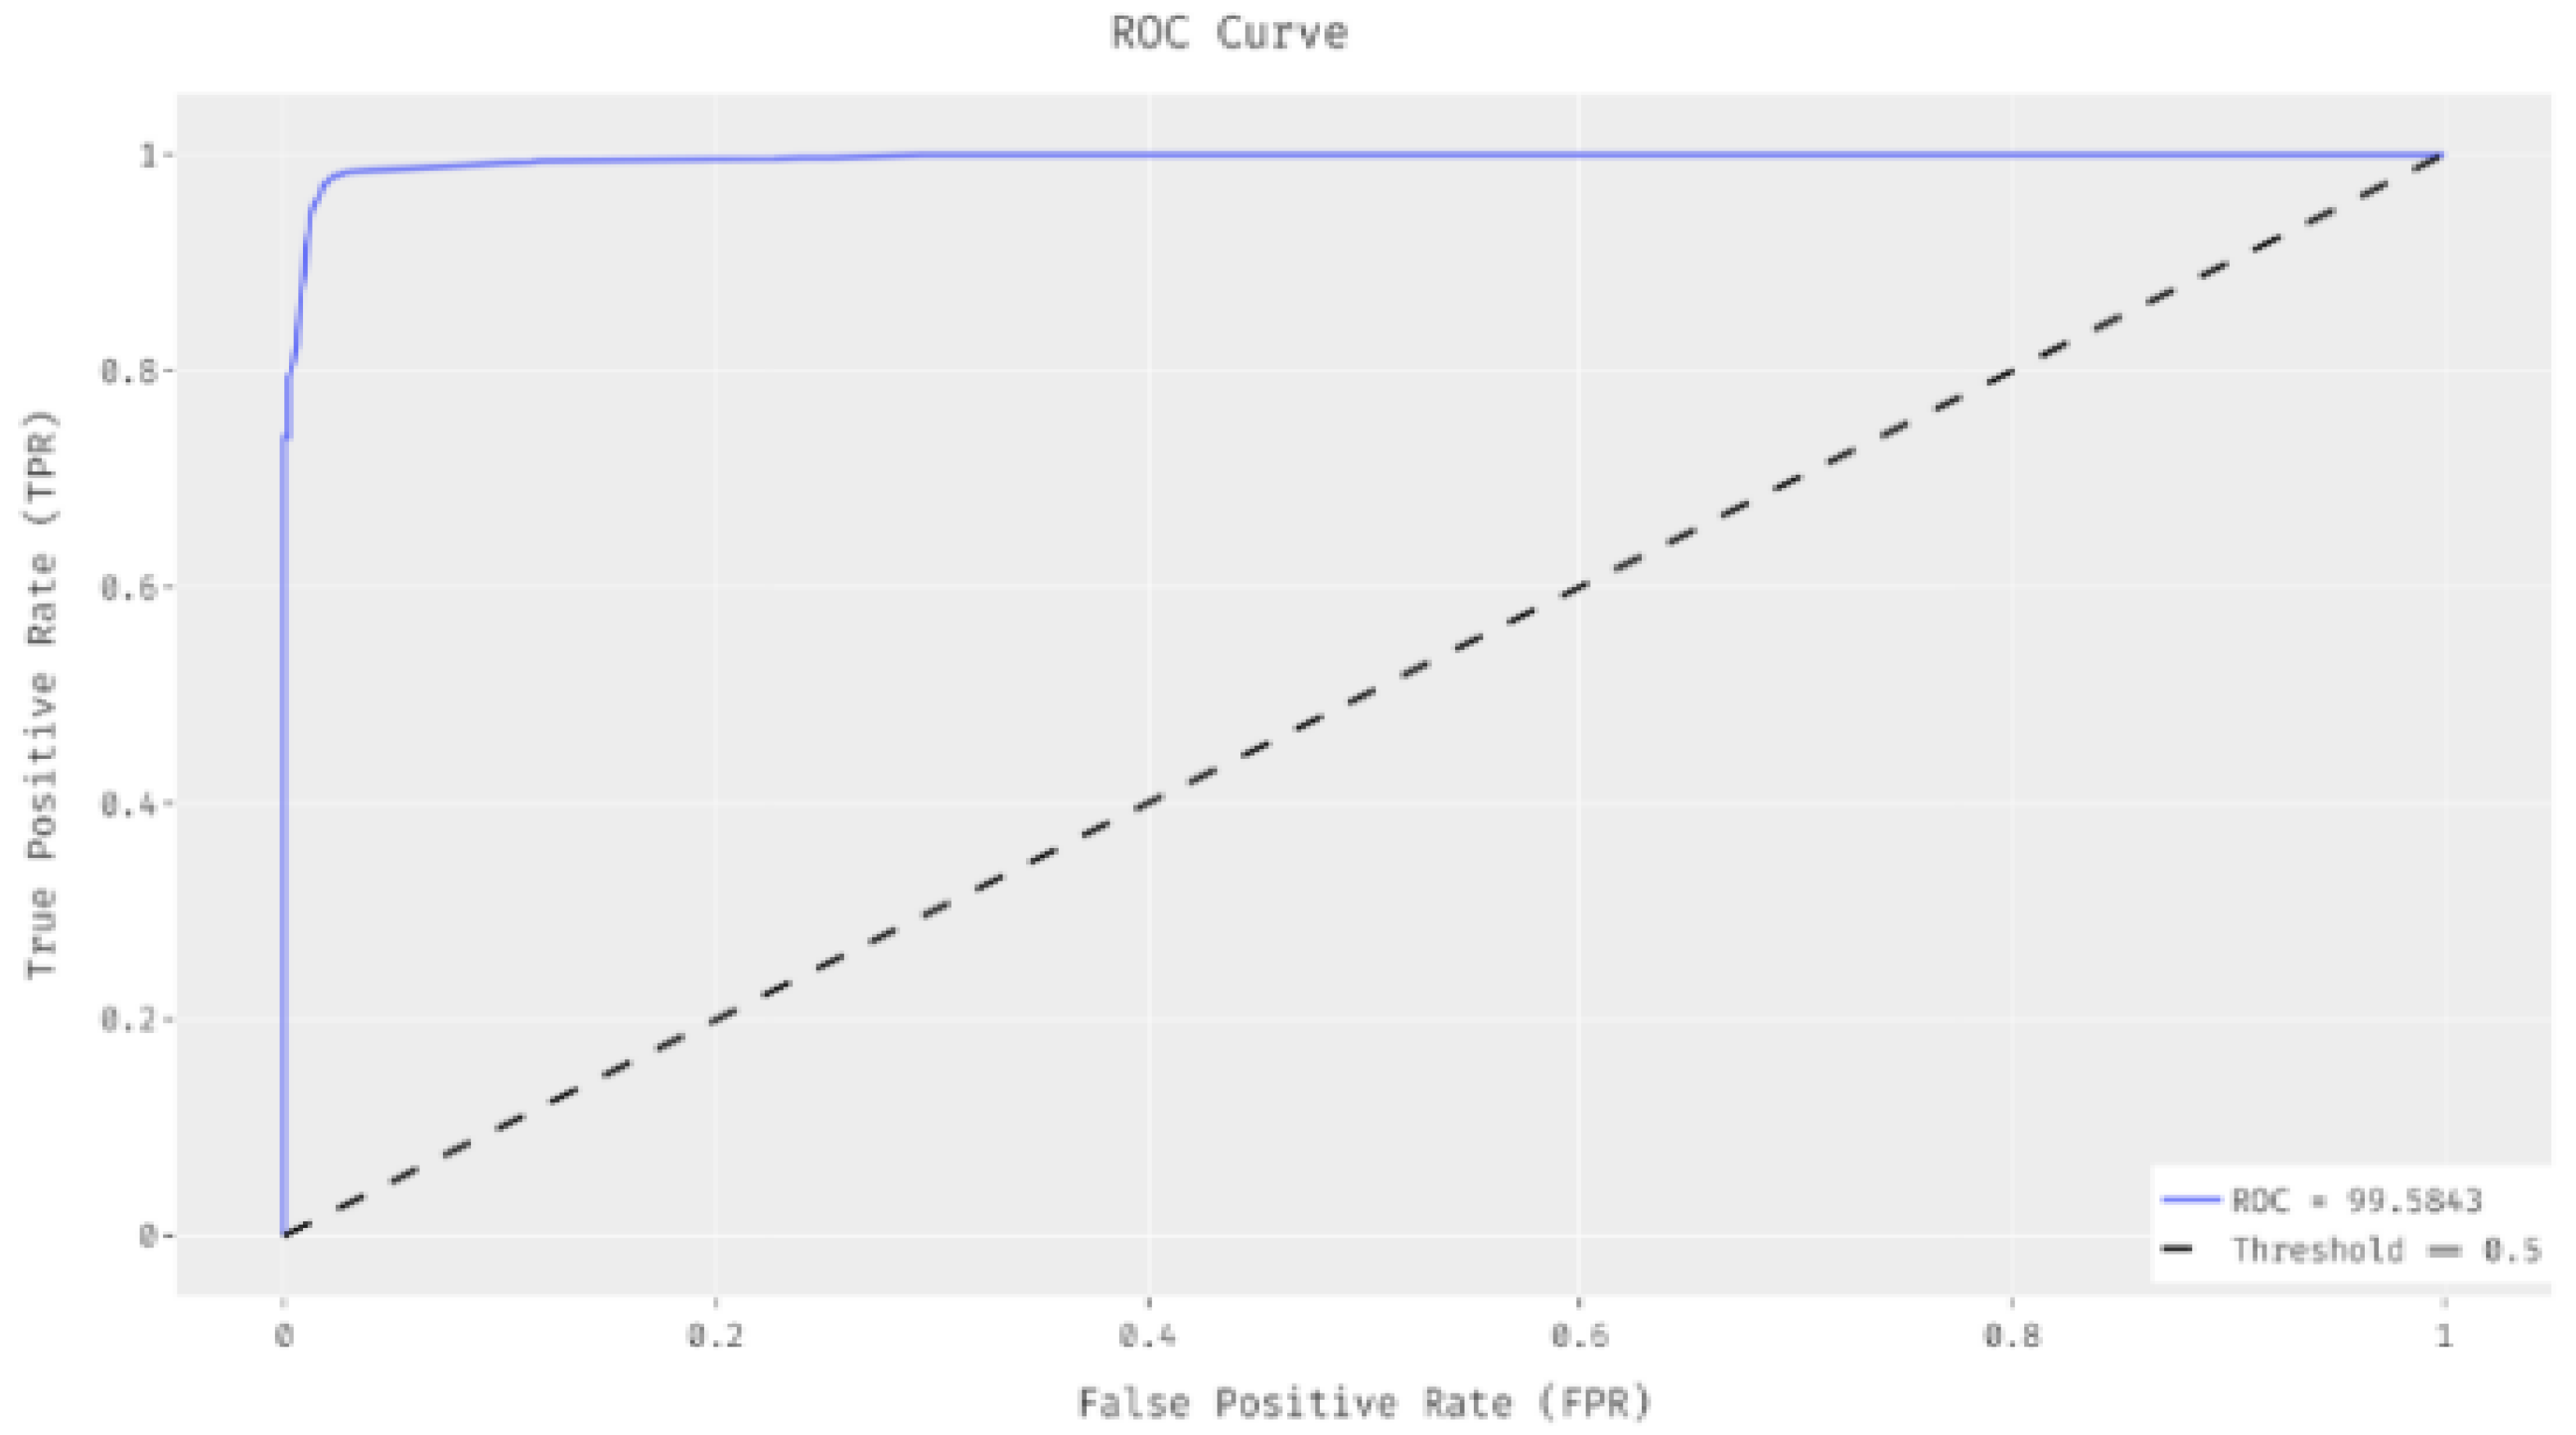
5. Experimental Analysis

The performance of the MSVM-DAG-FFO method was validated using agricultural data collected from farmland by implementing the IoTSNA-CR model. The maximum and minimum ranges of phosphorous, nitrogen, and potassium values found in the test data from the field for four different crops are shown below in Table 4.
The crops were classified into four classes, namely cotton, ground nut, maize, and rice, based on their NPK values. Figure 7 illustrates the set of confusion matrices produced by the MSVM-DAG-FFO method under five distinct runs.
In the applied run 1, the MSVM-DAG-FFO method categorised 136 tests into cotton, 143 tests into ground nut, 138 tests into maize, and 142 tests into rice. Simultaneously, in the applied run 3, the MSVM-DAG-FFO methodology classified 140 tests into cotton, 144 tests into ground nut, 140 tests into maize, and 142 tests into rice. Concurrently, in the applied run 5, the MSVM-DAG-FFO approach ordered 139 tests into cotton, 142 tests into ground nut, 143 tests into maize, and 143 tests into rice. Table 5 provides the detailed classification results of the MSVM-DAG-FFO technique on the applied dataset with distinct runs. The table values denote that the MSVM-DAG-FFO technique accomplished maximum classification performance.
For instance, with run 1, the MSVM-DAG-FFO technique attained an average precision value of 0.9344, whereby recall was 0.9317, accuracy was 0.9658, and F-score was 0.9322. Additionally, with run 2, the MSVM-DAG-FFO manner found an average precision of 0.9342, whereby recall was 0.9317, accuracy was 0.9658, and F-score was 0.9322. Likewise, with run 3, the MSVM-DAG-FFO IoTSNA-CR algorithm gained an average precision of 0.9453, whereby recall was 0.9433, accuracy was 0.9717, and the F-score was 0.9421. Similarly, with run 4, the MSVM-DAG-FFO system obtained an average precision of 0.9437, whereby recall was 0.9417, accuracy was 0.9708, and the F-score was 0.9421. Finally, with run 5, the MSVM-DAG-FFO method achieved an average precision of 0.9461, whereby recall was 0.9450, accuracy was 0.9725, and the F-score was 0.9452.
An ROC analysis of the MSVM-DAG-FFO method on the dataset applied is demonstrated in Figure 8. The figure showcases that the MSVM-DAG-FFO method achieved the maximum result with an ROC of 99.5843.
Finally, a comparative analysis of the MSVM-DAG-FFO method was made with the other methods in Figure 9, Figure 10, Figure 11 and Figure 12. The results demonstrated that the MSVM-DAG-FFO method surpassed the existing techniques in terms of various measures. Upon examination of the results in terms of precision, the MSVM-DAG-FFO method resulted in a higher precision of 0.946, whereas the SVM, SVM-kernel, and DT models attained lower precisions of 0.932, 0.921, and 0.909, respectively, as shown in Figure 10. In the meantime, upon investigating the outcomes for recall, the MSVM-DAG-FFO approach resulted in an enhanced recall of 0.945 whereas the SVM, SVM-kernel, and DT methods gained a minimal recall of 0.927, 0.941, and 0.926, respectively, as shown in Figure 11.
Eventually, upon inspection of the results in terms of their accuracy, the MSVM-DAG-FFO algorithm produced an increased accuracy of 0.973, whereas the SVM, SVM-kernel, and DT manners obtained minimal accuracies of 0.932, 0.922, and 0.914, as correspondingly shown in Figure 9. Lastly, upon observing the results in terms of the F-score, the MSVM-DAG-FFO methodology gave a maximum F-score of 0.945, whereas the SVM, SVM-kernel, and DT approaches achieved lower F scores of 0.938, 0.931, and 0.926, respectively, as shown in Figure 12. From the above result analysis, it is found that the MSVM-DAG-FFO method is found to be an efficient tool for soil nutrient classification and crop recommendation.
A comparative analysis has been conducted on the performance of the proposed algorithm with the other algorithms. It has been observed that the proposed model is the most suitable for predicting crops based on soil. Table 6 presents the state of the art for a comparison on the usage of the dataset, the use of sensors, and the different algorithms used and their accuracy, along with the proposed algorithm and the other algorithms implemented in precision farming. It has been observed that many different algorithms are implemented by researchers in different contexts and on different datasets such as image datasets, soil datasets collected from agricultural departments and real-time data collections. We have implemented analysis on real-time data collection using the MSVM-DAG-FFO algorithm and achieved a better accuracy of 97.3% compared to the others.

6. Conclusions and Future Work

This real-time data collection and its analysis brought us closer to enabling effective predictions. The IoTSNA-CR model allows us to acquire soil nutrient data along with GPS location, moisture, temperature, and water level using its sensors. A common farmer can maintain his own field soil information using this device and can maintain the soil information in a low-cost cloud service. This helps a farmer to have updates about his soil’s health to know the suggested crops. The proposed MSVM-DAG-FFO algorithm allows farmers to access and analyse the pre-processed soil data. An Android application was developed to access this cloud data, analyse it, and predict the most suitable crops. The role of the FFO algorithm is to tune the MSVM model through the selection of kernel functions. A detailed experimental validation was carried out in five different time intervals on the real-time data of four different crops using SVM, SVM kernel, decision tree, and MSVM-DAG-FFO. It was observed that there was a significant improvement in the accuracy rate compared to other methods. The average accuracy rate of the proposed model overall over the five runs is 0.969. This is a more appropriate approach for predicting the suitable crops for a particular cultivation area. Additionally, it allows one to maintain the periodic soil health details in a low-cost cloud, which not only guides the farmer in choosing a crop but also allows them to give appropriate input regarding the usage of minerals.
Furthermore, an extensive survey of crop fields and the collection of real-time data from different geographical locations suggested for crops by the department of agriculture of a governmental body is required. Additionally, the collection of datasets can be improved for more crops, such as sugar cane, potatoes, tomatoes, cauliflowers, mustard, ragi, soybeans, bananas, oil seeds, onions, ginger, etc., as suggested by the agricultural department. Additionally, if the application is used regularly by a farmer to maintain his own field information, it will allow the farmer to analyse his own field data with a more detailed approach for making better decisions regarding crops and maintaining soil health. The farmer can take the necessary steps to enhance the soil quality with limited investment in minerals.

Author Contributions

M.K.S., A.R. and N.P. conceived the idea, designed and performed the experiments, analysed the results, investigated the results, drafted the initial manuscript, and revised the final manuscript. N.P. and A.R.: visualisation; N.P.: supervision. All authors have read and agreed to the published version of the manuscript.

Funding

This research received no external funding.

Informed Consent Statement

Not applicable.

Acknowledgments

I would like to express my special thanks to the Agriculture Department of GIET University for permitting us to conduct testing on soils of maize and ground nuts. Additionally, I express my sincere gratitude to Rajeswari Dash, Soil Science Expert, GIET University, for extending support in verifying and validating the data during collection.

Conflicts of Interest

The authors declare no conflict of interest.

References

  1. Akhter, R.; Sofi, S.A. Precision agriculture using IoT data analytics and machine learning. J. King Saud Univ.-Comput. Inf. Sci. 2021, 34, 5602–5618. [Google Scholar] [CrossRef]
  2. Zamora-Izquierdo, M.A.; Santa, J.; Martínez, J.A.; Martínez, V.; Skarmeta, A.F. Smart farming IoT platform based on edge and cloud computing. Biosyst. Eng. 2019, 177, 4–17. [Google Scholar] [CrossRef]
  3. Ahmed, U.; Lin, J.C.W.; Srivastava, G.; Djenouri, Y. A nutrient recommendation system for soil fertilization based on evolutionary computation. Comput. Electron. Agric. 2021, 189, 106407. [Google Scholar] [CrossRef]
  4. Ahmed, E.; Yaqoob, I.; Hashem, I.A.T.; Khan, I.; Ahmed, A.I.A.; Imran, M.; Vasilakos, A.V. The role of big data analytics in Internet of Things. Comput. Netw. 2017, 129, 459–471. [Google Scholar] [CrossRef]
  5. Sivakumar, R.; Prabadevi, B.; Velvizhi, G.; Muthuraja, S.; Kathiravan, S.; Biswajita, M.; Madhumathi, A. Internet of Things and Machine Learning Applications for Smart Precision Agriculture. In IoT Applications Computing; IntechOpen: London, UK, 2022; p. 135. [Google Scholar] [CrossRef]
  6. Dagar, R.; Som, S.; Khatri, S.K. Smart farming–IoT in agriculture. In Proceedings of the 2018 International Conference on Inventive Research in Computing Applications (ICIRCA), Coimbatore, India, 11–12 July 2018. [Google Scholar]
  7. Priya, R.; Ramesh, D.; Khosla, E. Crop Prediction on the Region Belts of India: A Naïve Bayes MapReduce Precision Agricultural Model. In Proceedings of the 2018 International Conference on Advances in Computing, Communications and Informatics (ICACCI), Bangalore, India, 19–22 September 2018; pp. 99–104. [Google Scholar] [CrossRef]
  8. Hu, C.; Zhong, X.; Xu, J. Study on integrated discovery system of sensors for agriculture observation application. In Proceedings of the 2014 The Third International Conference on Agro-Geoinformatics, Beijing, China, 11–14 August 2014; pp. 1–5. [Google Scholar] [CrossRef]
  9. Pajares, G.; Peruzzi, A.; Gonzalez-De-Santos, P. Sensors in Agriculture and Forestry. Sensors 2013, 13, 12132–12139. [Google Scholar] [CrossRef] [Green Version]
  10. Kulkarni, N.H.; Srinivasan, G.N.; Sagar, B.M.; Cauvery, N.K. Improving crop productivity through a crop recommendation system using ensembling technique. In Proceedings of the 2018 3rd International Conference on Computational Systems and Information Technology for Sustainable Solutions (CSITSS), Bengaluru, India, 20–22 December 2018. [Google Scholar]
  11. Kaur, S.; Malik, K. Predicting and Estimating the Major Nutrients of Soil Using Machine Learning Techniques. In Soft Computing for Intelligent Systems; Springer: Singapore, 2021; pp. 539–546. [Google Scholar]
  12. Ding, G.; Dong, F.; Zou, H. Fruit fly optimization algorithm based on a hybrid adaptive-cooperative learning and its application in multilevel image thresholding. Appl. Soft Comput. 2019, 84, 105704. [Google Scholar] [CrossRef]
  13. Pan, W.-T. A new fruit fly optimization algorithm: Taking the financial distress model as an example. Knowl.-Based Syst. 2012, 26, 69–74. [Google Scholar] [CrossRef]
  14. Wang, Q.; Zhang, Y.; Xiao, Y.; Li, J. Kernel-based fuzzy C-means clustering based on fruit fly optimization algorithm. In Proceedings of the 2017 International Conference on Grey Systems and Intelligent Services (GSIS), Stockholm, Sweden, 8–11 August 2017; pp. 251–256. [Google Scholar] [CrossRef]
  15. Sun, X.; Bi, Y.; Karami, H.; Naini, S.; Band, S.S.; Mosavi, A. Hybrid model of support vector regression and fruitfly optimization algorithm for predicting ski-jump spillway scour geometry. Eng. Appl. Comput. Fluid Mech. 2021, 15, 272–291. [Google Scholar] [CrossRef]
  16. Madhumathi, R.; Arumuganathan, T.; Shruthi, R. Soil NPK and Moisture analysis using Wireless Sensor Networks. In Proceedings of the 2020 11th International Conference on Computing, Communication and Networking Technologies (ICCCNT), Kharagpur, India, 1–3 July 2020. [Google Scholar] [CrossRef]
  17. Schwalbert, R.A.; Amado, T.; Corassa, G.; Pott, L.P.; Prasad, P.; Ciampitti, I.A. Satellite-based soybean yield forecast: Integrating machine learning and weather data for improving crop yield prediction in southern Brazil. Agric. For. Meteorol. 2020, 284, 107886. [Google Scholar] [CrossRef]
  18. Bhojani, S.H.; Bhatt, N. Wheat crop yield prediction using new activation functions in neural network. Neural Comput. Appl. 2020, 32, 13941–13951. [Google Scholar] [CrossRef]
  19. Sangeetha, A.; Sarah Prisella, P.; Poovarasi, G.; Subramani, K. IoT based hybrid system for precision agriculture monitoring using WSN into modern information and communication technology(ICT). IJARIIE 2018, 4, 2395–4396. [Google Scholar]
  20. Prabhu, S.; Revandekar, P.; Shirdhankar, S.; Paygude, S. Soil analysis and crop prediction. Int. J. Sci. Res. Sci. Technol. 2020, 7, 117–123. [Google Scholar] [CrossRef]
  21. Bhat, S.A.; Huang, N.-F. Big Data and AI Revolution in Precision Agriculture: Survey and Challenges. IEEE Access 2021, 9, 110209–110222. [Google Scholar] [CrossRef]
  22. Ali, S.M.; Das, B.; Kumar, D. Machine Learning based Crop Recommendation System for Local Farmers of Pakistan. Rev. Geintec-Gest. Inov. Tecnol. 2021, 11, 5735–5746. [Google Scholar] [CrossRef]
  23. Gosai, D.; Raval, C.; Nayak, R.; Jayswal, H.; Patel, A. Crop Recommendation System using Machine Learning. Int. J. Sci. Res. Comput. Sci. Eng. Inf. Technol. 2021, 7, 554–557. [Google Scholar] [CrossRef]
  24. Mulge, M.; Sharnappa, M.; Sultanpure, A.; Sajjan, D.; Kamani, M. Agricultural crop recommendation system using IoT and ML. Int. J. Anal. Exp. Modal Anal. 2020, 12, 1112–1117. [Google Scholar]
  25. Viviliya, B.; Vaidhehi, V. The Design of Hybrid Crop Recommendation System using Machine Learning Algorithms. Int. J. Innov. Technol. Explor. Eng. (IJITEE) 2019, 9, 4305–4311. [Google Scholar] [CrossRef]
  26. Gupta, S.; Geetha, A.; Sankaran, K.S.; Zamani, A.S.; Ritonga, M.; Raj, R.; Ray, S.; Mohammed, H.S. Machine Learning- and Feature Selection-Enabled Framework for Accurate Crop Yield Prediction. J. Food Qual. 2022, 2022, 6293985. [Google Scholar] [CrossRef]
  27. Alfred, R.; Obit, J.H.; Chin, C.P.-Y.; Haviluddin, H.; Lim, Y. Towards Paddy Rice Smart Farming: A Review on Big Data, Machine Learning, and Rice Production Tasks. IEEE Access 2021, 9, 50358–50380. [Google Scholar] [CrossRef]
  28. Abrougui, K.; Gabsi, K.; Mercatoris, B.; Khemis, C.; Amami, R.; Chehaibi, S. Prediction of organic potato yield using tillage systems and soil properties by artificial neural network (ANN) and multiple linear regressions (MLR). Soil Tillage Res. 2019, 190, 202–208. [Google Scholar] [CrossRef]
  29. Villanueva, M.B.; Salenga, M.L.M. Bitter melon crop yield prediction using machine learning algorithm. Int. J. Adv. Comput. Sci. Appl. 2018, 9, 1–6. [Google Scholar]
  30. Sirsat, M.; Cernadas, E.; Fernández-Delgado, M.; Khan, R. Classification of agricultural soil parameters in India. Comput. Electron. Agric. 2017, 135, 269–279. [Google Scholar] [CrossRef]
  31. Khaki, S.; Wang, L. Crop Yield Prediction Using Deep Neural Networks. Front. Plant Sci. 2019, 10, 621. [Google Scholar] [CrossRef] [Green Version]
  32. Hahn, L.; Parent, L.; Paviani, A.C.; Feltrim, A.L.; Wamser, A.F.; Rozane, D.E.; Ender, M.M.; Grando, D.L.; Moura-Bueno, J.M.; Brunetto, G. Garlic (Allium sativum) feature-specific nutrient dosage based on using machine learning models. PLoS ONE 2022, 17, e0268516. [Google Scholar] [CrossRef]
  33. Suchithra, M.; Pai, M.L. Improving the prediction accuracy of soil nutrient classification by optimizing extreme learning machine parameters. Inf. Process. Agric. 2020, 7, 72–82. [Google Scholar] [CrossRef]
  34. Reshma, R.; Sathiyavathi, V.; Sindhu, T.; Selvakumar, K.; SaiRamesh, L. IoT based Classification Techniques for Soil Content Analysis and Crop Yield Prediction. In Proceedings of the 2020 Fourth International Conference on I-SMAC (IoT in Social, Mobile, Analytics and Cloud) (I-SMAC), Palladam, India, 7–9 October 2020; pp. 156–160. [Google Scholar] [CrossRef]
  35. Rajeswari, S.; Suthendran, K. C5.0: Advanced Decision Tree (ADT) classification model for agricultural data analysis on cloud. Comput. Electron. Agric. 2019, 156, 530–539. [Google Scholar] [CrossRef]
  36. Elumalai, M.; Anouncia, S.M. Development of soil mineral classification using ontology mining. Arab. J. Geosci. 2021, 14, 1371. [Google Scholar] [CrossRef]
  37. Jose, A.; Nandagopalan, S.; Ubalanka, V.; Viswanath, D. Detection and classification of nutrient deficiencies in plants using machine learning. J. Phys. Conf. Ser. 2021, 1850, 012050. [Google Scholar] [CrossRef]
  38. Dash, R.; Dash, D.K.; Biswal, G. Classification of crop based on macronutrients and weather data using machine learning techniques. Results Eng. 2021, 9, 100203. [Google Scholar] [CrossRef]
  39. Balakrishnan, N.; Muthukumarasamy, G. Crop production-ensemble machine learning model for prediction. Int. J. Comput. Sci. Softw. Eng. 2016, 5, 148. [Google Scholar]
  40. Pandith, V.; Kour, H.; Singh, S.; Manhas, J.; Sharma, V. Performance Evaluation of Machine Learning Techniques for Mustard Crop Yield Prediction from Soil Analysis. J. Sci. Res. 2020, 64, 394–398. [Google Scholar] [CrossRef]
  41. Keerthan Kumar, T.G.; Shubha, C.; Sushma, S.A. Random forest algorithm for soil fertility prediction and grading using machine learning. Int. J. Innov. Technol. Explor. Eng. 2019, 9, 1301–1304. [Google Scholar]
  42. Dharani, M.K.; Thamilselvan, R.; Natesan, P.; Kalaivaani, P.; Santhoshkumar, S. Review on Crop Prediction Using Deep Learning Techniques. J. Phys. Conf. Ser. 2021, 1767, 012026. [Google Scholar] [CrossRef]
  43. Shi, P.; Wang, Y.; Xu, J.; Zhao, Y.; Yang, B.; Yuan, Z.; Sun, Q. Rice nitrogen nutrition estimation with RGB images and machine learning methods. Comput. Electron. Agric. 2021, 180, 105860. [Google Scholar] [CrossRef]
  44. Pantazi, X.; Moshou, D.; Alexandridis, T.; Whetton, R.; Mouazen, A. Wheat yield prediction using machine learning and advanced sensing techniques. Comput. Electron. Agric. 2016, 121, 57–65. [Google Scholar] [CrossRef]
  45. Reshma, S.J.; Aravindhar, D.J. A Systematic Approach of Classifying Soil & Crop Nutrient Using Machine Learning Algorithms. Int. J. Intell. Syst. Appl. Eng. 2022, 10, 174–179. [Google Scholar]
  46. Shidnal, S.; Latte, M.V.; Kapoor, A. Crop yield prediction: Two-tiered machine learning model approach. Int. J. Inf. Technol. 2021, 13, 1983–1991. [Google Scholar] [CrossRef]
  47. Kussul, N.; Lavreniuk, M.; Skakun, S.; Shelestov, A. Deep Learning Classification of Land Cover and Crop Types Using Remote Sensing Data. IEEE Geosci. Remote Sens. Lett. 2017, 14, 778–782. [Google Scholar] [CrossRef]
  48. Priyadharshini, A.; Chakraborty, S.; Kumar, A.; Pooniwala, O.R. Intelligent Crop Recommendation System using Machine Learning. In Proceedings of the 2021 5th International Conference on Computing Methodologies and Communication (ICCMC), Erode, India, 8–10 April 2021; pp. 843–848. [Google Scholar]
  49. Mupangwa, W.; Chipindu, L.; Nyagumbo, I.; Mkuhlani, S.; Sisito, G. Evaluating machine learning algorithms for predicting maize yield under conservation agriculture in Eastern and Southern Africa. SN Appl. Sci. 2020, 2, 952. [Google Scholar] [CrossRef]
  50. Ast, C.; Schmälzlin, E.; Löhmannsröben, H.G.; Van Dongen, J.T. Optical oxygen micro-and nanosensors for plant applications. Sensors 2012, 12, 7015–7032. [Google Scholar] [CrossRef] [PubMed] [Green Version]
  51. Millan-Almaraz, J.R.; Guevara-Gonzalez, R.G.; Romero-Troncoso, R.; Osornio-Rios, R.A.; Torres-Pacheco, I. Advantages and disadvantages on photosynthesis measurement techniques: A review. Afr. J. Biotechnol. 2009, 8, 7340–7349. [Google Scholar]
  52. Choudhury, A.T.M.A.; Kennedy, I.R. Nitrogen fertilizer losses from rice soils and control of environmental pollution problems. Commun. Soil Sci. Plant Anal. 2005, 36, 1625–1639. [Google Scholar] [CrossRef]
  53. Nawandar, N.K.; Satpute, V. IoT based intelligent irrigation support system for smart farming applications. ADCAIJ Adv. Distrib. Comput. Artif. Intell. J. 2019, 8, 75–85. [Google Scholar]
  54. AshifuddinMondal, M.; Rehena, Z. IoT based intelligent agriculture field monitoring system. In Proceedings of the 2018 8th International Conference on Cloud Computing, Data Science & Engineering (Confluence), Noida, India, 11–12 January 2018; pp. 625–629. [Google Scholar]
  55. Pallathadka, H.; Jawarneh, M.; Sammy, F.; Garchar, V.; Sanchez, T.; Naved, M. A Review of Using Artificial Intelligence and Machine Learning in Food and Agriculture Industry. In Proceedings of the 2022 2nd International Conference on Advance Computing and Innovative Technologies in Engineering (ICACITE), Greater Noida, India, 28–29 April 2022; pp. 2215–2218. [Google Scholar]
  56. Ansari, A.S.; Jawarneh, M.; Ritonga, M.; Jamwal, P.; Mohammadi, M.S.; Veluri, R.K.; Kumar, V.; Shah, M.A. Improved Support Vector Machine and Image Processing Enabled Methodology for Detection and Classification of Grape Leaf Disease. J. Food Qual. 2022, 2022, 9502475. [Google Scholar] [CrossRef]
  57. Kuthadi, V.M.; Selvaraj, R.; Rao, Y.V.; Kumar, P.S.; Mustafa, M.; Phasinam, K.; Okoronkwo, E. Towards security and privacy concerns in the internet of things in the agriculture sector. Turk. J. Physiother. Rehabil. 2023, 32, 10086–10089. [Google Scholar]
Figure 1. Proposed model for IoT-enabled soil nutrient analysis and crop recommendation.
Computers 12 00061 g001
Figure 2. Data collection in some areas of GUNUPUR, Rayagada District, Odisha, India.
Computers 12 00061 g002aComputers 12 00061 g002b
Figure 3. Firebase real-time cloud database connected with Android application.
Computers 12 00061 g003
Figure 4. MSVM-DAG-FFO.
Computers 12 00061 g004
Figure 5. Flowchart of MSVM using DAG and FFO.
Computers 12 00061 g005
Figure 6. Recursive call of SVM using DAG.
Computers 12 00061 g006
Figure 7. Confusion matrix analysis of MSVM-DAG-FFO with distinct runs.
Computers 12 00061 g007
Figure 8. ROC analysis of MSVM-DAG-FFO method.
Computers 12 00061 g008
Figure 9. Comparison of MSVM-FFO algorithms with others according to accuracy rate.
Computers 12 00061 g009
Figure 10. Comparison of MSVM-FFO algorithms with others according to precision.
Computers 12 00061 g010
Figure 11. Comparison of MSVM-FFO algorithms with others according to recall.
Computers 12 00061 g011
Figure 12. Comparison of MSVM-FFO algorithms with others according to F-Score.
Computers 12 00061 g012
Table 1. Literature review on soil analyses based on different proposed models.
Ref. NoAuthorModel/FrameworkDiscussion
[1]Akhter et al. (2021) [1]Model for predicting apple scab diseaseData collected from Kasmir Valley apple crop soil using sensors. Here, the challenges faced were while incorporating wireless NW and MC learning.
[2]Zamora-Izquierdo et al.
(2019) [2]
Experimental greenhouseUse of different sensors in greenhouse for implementing water cycle and irrigation.
[3]Ahmed et al.
(2021) [3]
A designed framework for information and communication technology (ICT)Optimal nutrition recommendation to increase yield.
[4]Ahmed et al.
(2017) [4]
An IoT environment is the prime requirement for managing big data and enabling analytics.Real-time data collection with IoT, regular storage in cloud, their maintenance, and challenges.
[5]Sivakumar, R et al. (2021) [5]Smart-sensor-based approachesUsage of different sensors, advantages and challenges faced, and machine learning tools used for analysis.
[6]Dagar et al.
(2018) [6]
Simple architecture of IoT sensors using WiFiLatest technologies in farming such as polyhouse, Wi-Fi network, IoT, and smartphone.
[7]Priya et al.
(2018) [7]
A model for crop predictionRecommending crops based on field condition.
[8]Hu et al.
(2014) [8]
A discovery system by integrating query methods for space sensors and ground-based sensors Collaborative earth observation using ground-based sensors and space-based sensors.
[9]Pajares et al.
(2013) [9]
REVIEW sensors in agriculture and forestrySoil analysis, classification of crops, fruits, taste, and odour detection.
[10]Kulkarni et al.
(2018) [10]
Extensible crop yield prediction framework Crop selection using ensemble of different techniques.
[11]Kaur et al. (2021) [11]
Chapter 43
Regression model for analysing relation between NP, NK, and PKUsing regression models and estimating the relationship between N, P, and K.
[12]Ding et al.
(2019) [12]
Hybrid adaptive cooperative learning strategyFFO algorithm in crop image analysis.
[13]Pan et al. (2012) [13]Fruit fly optimisationSearching optimal route using FFO method.
[14]Wang et al.
(2017) [14]
Kernel-based fuzzy c-means clustering algorithm based on FFO algorithmOvercomes the defects of this fuzzy c-means approach and improves clustering.
[15]Sun et al.
(2021) [15]
For forecasting power load, a hybrid model is suggested using generalised regression neural networks.In comparison with simple SVM, the SVM with FFO has an improvement of 8% in precision level observed in scour depth prediction.
[16]Madhumathi, R. et al.
(2020) [16]
A model with sensors, Arduino board, and AWS serverUse of sensors will give real-time data, but they will also increase the cost and need maintenance.
[17]Schwalbert, R. A et al.
(2020) [17]
A model for implementing machine learning algorithms in weather and satellite images for furcating crop yieldCNN and ANN cloud are used along with different kernel functions for verifying the improvement in accuracy.
[18]Bhojani, S. H. et al.
(2020) [18]
Implementing MLP algorithm along with many kernel functions for forecasting the crop yield Three year-long (1990–1991, 2015–2016, and 2016–2017) datasets are used for analysis. The use of more datasets shall give better accuracy in prediction.
[33]Suchithra, M. S. et al.
(2020) [33]
Workflow for soil parameter classification and predictionIn Kerala state, a study on village-wise soil classification was conducted based on the available soil nutrients so that the fertiliser expenditure could be controlled. Here, the extreme machine learning algorithm with different activation functions was used for classification.
[34]R. Reshma et al.
(2020) [34]
Soil behaviour analysis and crop recommendationThe IoT sensors and cloud storage for collecting soil characteristics and then implementing the SVM and decision tree for finding the suitable crops are discussed.
[35]Rajeswari et al.
(2019) [35]
Prediction of soil fertility level and a smart information system app using AndroidA block-level fertiliser estimation was conducted in the Virudhunagar District of Tamil Nadu. The C5.0 ADT classifier was used along with a mobile application for classification.
[36]Elumalai et al.
(2021) [36]
onto_mine framework for soil classificationA design model for maintaining knowledge of soil minerals was represented so that it would give consistent support to novice farmers in cultivation.
[37]Jose et al.
(2021) [37]
ANN-based classification model on crop leaves for detecting mineral deficiencyA study on tomato leaves’ examination based on their colour and shape to know the nutrient deficiency in the crop was performed.
[38]Dash et al.
(2021) [38]
An Android architecture with IoT in smart agriculture Research on three crops’ (rice, wheat, and sugar cane) suitability was conducted based on the soil micronutrients and weather parameters.
[39]Balakrishnan et al.
(2016) [39]
Ensemble models (AdaBoost + SVM and AdaBoost + naive)Historical crop production data of different regions collected from faostat3.fao.org were used for analysis and classification. The SVM, naive Bayes, and ensemble methods were applied to them.
[40]Pandith, V et al.
(2020) [40]
A model for analysing the soil nutrient dataset and predicting mustard crop yieldThe soil data were collected from the Agriculture Departments of Jammu, Talab, and Tillo. The prediction of mustard crop was performed using KNN, ANN, naive Bayes, RF, and multinomial logistic regression via soil analysis.
[41]Keerthan Kumar, T. G. et al. (2019) [41]Model for soil grading and crop recommendation using random forestThe dataset on soil properties was preprocessed, and regression was applied by identifying the rank of the soil and recommending crops.
[42]Dharani, M. K. et al.
(2021) [42]
Prediction of crop yield using deep learning techniquesA brief study was conducted on crop prediction using deep learning algorithms ANN, DNN, and RNN.
[43]Shi, P. et al.
(2021) [43]
Estimating nitrogen for rice cropRice canopy RGB images were collected for 2 years. These datasets were analysed using regression algorithms SNR, BPNN, and RF to predict the nutrient deficiency in crops.
[44]Pantazi, X. E. (2016) [44]Predicting wheat yield based on satellite image and sensor dataThe online multi-layer soil characteristics and satellite images from the wheat fields of Bedfordshire, UK, were collected and analysed for predicting crop growth.
[45]Reshma, S. J. et al. (2022) [45]Model for classifying soil and crops using SVM, DT, and MLPThe research work was conducted on the soil parameters collected from three districts: Kanyakumari, Tirunelvelli, and Thoothiukudi of Tamil Nadu. Crop fields of rice, maize, and ragi were taken into consideration for analysing NPK values.
[46]Shidnal, S. et al.
(2021) [46]
Multi-tier machine learning architecture based on quantitative and qualitative analysisPaddy crop images were taken to predict the nutrient deficiency. The CNN and K-mean clustering were used for prediction.
[47]Kussul, N. et al.
(2017) [47]
Four-level hierarchical DL model for classification of satellite land imageSatellite images were collected from multiple sources in Ukraine and analysed, classifying the areas based on crops using neural network algorithms.
[48]Priyadharshini, A et al.
(2021) [48]
Crop recommendation system using classification and regression Rain fall, temperature, and geolocation were used to predict suitable crops using machine learning algorithms.
[49]Mupangwa, W et al.
(2020) [49]
Model for predicting maize yield using machine learning toolsMaize yield field data were collected belonging to different countries and the machine learning method was applied to predict the yield in eastern and southern Africa.
Table 2. Literature review on different algorithms applied in precision farming.
Ref. NoMethods
(Classification
/Regression)
Algorithms UsedInput Data
Parameters
Output
Prediction Type
[1]RegressionLinear regressionReal-time data collected Apple scab prediction
[2]RegressionEdge and cloud computing using IoT sensorsSensors used for analysing water cycle and irrigationSoil and water data collection
[3]RegressionExploration and exploitation method and improved genetic algorithmSoil nutrient dataOptimal nutrition recommendation
[7]ClassificationMap-Reduce functionality and NB classifier model for crop predictionSatellite images, sensor data, irrigation report, and crop and weather dataRecommending crops
[9]ClassificationArtificial neural network and principal component analysisSoil analysisClassification of crops, fruits, taste, and odour detection
[10]ClassificationRandom forest, linear SVM, and naive Bayes Soil, rainfall, and surface temperature parametersCrop selection
[33]ClassificationExtreme learning machine (ELM) along with different activation functions such as radial basis, Gaussian sine-squared, triangular basis, hyperbolic tangent, and hard limitSoil nutrientsSoil fertility and pH value in rating of high/low/medium
[34]ClassificationSVM and decision tree methodsSoil type, water levelRecommended crop
[35]ClassificationC 4.5 decision treeFeature of soil datasetRecommend Crop
[36]ClassificationRule-based classifierSoil nutrientsSoil composition suitable for crop
[37]ClassificationArtificial neural network,
fuzzy c-means method, and
support vector machine
The colour and
shape of a tomato leaf are the two major features
Nutrient deficiency
[38]ClassificationSVM, SVM with kernel, and decision treeMicronutrients and the
weather parameters
Suitable crop
[39]ClassificationAdaBoost + SVM, and AdaBoost + naiveHistorical crop production and the environmental climate dataSuitable crop out of rice, sugar cane, ground nut, cotton, and black gram
[40]ClassificationKNN, naive Bayes, multinomial logistic regression, ANN, and random forestSoil nutrient pH value, electrical conductivity, organic carbon, P, N, K, sulphur, copper, iron, zinc, manganeseMustard yield
[41]Linear regression and RMSERandom forest, Gaussian naive Bayes and support vector machineSoil sampleSoil grade, predicted crops
[42]Regression, classification,
two-layered approach
Recurrent
neural network, ANN, and deep neural network
Crop imagesCrop prediction
[43]RegressionSimple non-linear regression, random forest, backpropagation neural network, and
regression
Crop imagesNitrogen needs
[44]ClassificationCP-ANNs, XY-fused networks (XY-Fs), and supervised Kohonen networks (SKNs)Satellite imagery and multi-layer soil data Wheat yield prediction
[45]ClassificationSupport vector machine, decision tree, multi-layer perception (MLP)Soil parameters N,P,KSoil and crop nutrient
[46]Clusteringk mean clustering algorithmCrop imagesNPK values and deficiency identification
[47]Unsupervised neural networkCNN and MLPSatellite imagesPredict crop type (wheat, maize, sunflower, soybeans, and sugar beet)
[48]ClassificationDecision tree, KNN,
linear regression, KNN with cross validation, naive Bayes,
neural network, and SVM
Soil, season, geographical locationCrop selection
[49]RegressionLinear algorithms:
linear discriminant analysis (LDA), logistic regression (LR), and predicted maize yield were closer to the observed yields compared with non-linear tools (KNN, NB, CART, and SVM)
Conventional and CA-based cropping systems Maize yield prediction
Table 3. The data collection from different GPS locations.
Sl. No.Crop FieldLongitudeLatitude
1Rice19.0197943831724483.83367378452479
2Cotton19.12026791673535483.79737929760799
3Rice19.13199323192744683.82571241313724
4Rice19.15389300567318683.82711736101244
5Rice19.03409050916044683.81985812937597
6Cotton19.1431809098853783.77053423826487
7Cotton19.1995796897641183.81315098959948
8Rice19.31168997632113783.79038888001347
9Cotton19.20391036130566, 83.83906791114363
10Cotton19.243039905554685, 83.67781726274391
11Ground Nut19.183372074271134, 83.67778906665868
12Ground Nut19.12229596117156, 83.40884453177296
13Cotton19.19129593761809, 83.6998360113169
14Ground Nut19.201211003276704, 83.763592486272
15Maize19.130544274204112, 83.8304902190576
16Ground Nut19.014452114119926, 83.77777140899494
17Maize19.07788826595366, 83.76562479599976
18Maize19.09682829341866, 83.8591537106543
19Maize19.23175510046014, 83.49582454063922
20Maize19.329410878579964, 83.61866194709863
Table 4. Soil nutrient data summery.
CropsNutrientsMin. ValueMax. Value
CottonNitrogen (N)180350
Phosphorous (P)60110
Potassium (K)1530
Ground NutNitrogen (N)4090
Phosphorous (P)60110
Potassium (K)1535
MaizeNitrogen (N)90275
Phosphorous (P)3070
Potassium (K)2090
RiceNitrogen (N)7080
Phosphorous (P)2038
Potassium (K)1025
Table 5. Result analysis of MSVM-DAG-FFO method with distinct runs.
No. of RunsCropsPrecisionF-ScoreRecallAccuracy
Run 1Cotton0.944 0.925 0.907 0.963
Ground Nut0.861 0.905 0.953 0.950
Maize0.939 0.929 0.920 0.965
Rice0.993 0.969 0.947 0.985
Average0.934 0.932 0.932 0.966
Run 2Cotton0.926 0.923 0.920 0.962
Ground Nut0.871 0.907 0.947 0.952
Maize0.940 0.937 0.933 0.968
Rice1.000 0.962 0.927 0.982
Average0.934 0.932 0.932 0.966
Run 3Cotton0.952 0.943 0.933 0.972
Ground Nut0.883 0.920 0.960 0.958
Maize0.952 0.943 0.933 0.972
Rice0.993 0.969 0.947 0.985
Average0.945 0.944 0.943 0.972
Run 4Cotton0.946 0.943 0.940 0.972
Ground Nut0.883 0.917 0.953 0.957
Maize0.953 0.946 0.940 0.973
Rice0.993 0.962 0.933 0.982
Average0.944 0.942 0.942 0.971
Run 5Cotton0.965 0.946 0.927 0.973
Ground Nut0.893 0.919 0.947 0.958
Maize0.953 0.953 0.953 0.977
Rice0.973 0.963 0.953 0.982
Average0.946 0.945 0.945 0.973
Table 6. Comparison between the proposed algorithm along with other implemented algorithms.
Ref. No.Algorithm AppliedBest AlgorithmAccuracy
Rate
Dataset SourceSensors UsedCrops Used/
Accuracy Rate on Variables
[33]Extreme learning machine (ELM) along with the following activation functions: sine-squared, Gaussian radial basis, hyperbolic tangent, and triangular basisExtreme learning machine
(average accuracy rate obtained for all minerals)
90%North–central Laterite region
datasets and Marathwada region datasets
No90% accuracy in soil pH classification
[34]Support vector machine and decision tree methodsDecision tree94%Real-time dataset collection conductedSensors for measuring pH, humidity, moisture, NPK value, andmicrocontroller equipped with the cloud87% accuracy in SVM for crop prediction, 90% accuracy in decision tree in crop prediction
[35]C 4.5 decision treeC 5.0 ADT classifier for soil fertility prediction92%Soil data for Virudhunagar District, Tamil Nadu, from
http://soilhealth.dac.gov.in for 2015–2016. It contains soil testing report of 11 blocks of Virudhunagar District
No92% accuracy in
soil fertility level and
95% accuracy in predicting crops such as gingelly, cotton, onion,
sunflower, block
gram, paddy, ground nut,
sugar cane, etc.
C 5.0 ADT classifier for crop prediction95%
[36]Rule-based classifierRule-based classifier91%An ontology-based knowledge base was created for storing the details of soil composition with different mineralsNoAccuracy of 91% obtained
by analysing the 21 rules which allowed for classifying the soil composition
[37]Artificial neural network,
fuzzy C-means method,
support vector machine
Artificial neural network88.27%A dataset of 4049 leaf and fruit images collected from https://growabundant.com/nutrient-deficiencies/NoAccuracy of 77% in thresholding scheme and 88.27% in hue-based scheme on leaf image analysis of crops for finding nutrient deficiency
[38]SVM, SVM with kernel, decision treeSVM with kernel92%1700 samples for soil NPK, pH, temperature, humidity, etc.
collected from different parts of Chhattisgarh state.
YesRice, wheat, and sugar cane
using micronutrients along with weather data
[39]AdaSVM, SVM, AdaNaive, and naive BayesAdaNaive96.52% for rice, 93.45% for cotton, 96.10% for sugar cane, 92.6% for black gramClimate data obtained from indianwaterportal.org
and crop production data obtained from
faostat3.fao.org
NoRice paddy, cotton, sugar cane, ground nut, and black gram
[40]KNN, ANN, naive Bayes, multinomial logistic regression, and random forestRandom forest94.13%Real-time data were collected from Department of Agriculture, Talab, Tillo, JammuYesMustard crop
[17]Random forest (RF), Gaussian naive Bayes, and SVMRandom forest72.74%Historical municipality-level soybean yield data (2003–2016) was obtained from IBGE (https://sidra.ibge.gov.br/pesquisa/pam/tabelas)NoSoybean yield:
study was conducted in the northern region of the Rio Grande
do Sul (RS) state, Brazil
[18]Artificial neural network, recurrent neural network, and deep neural networkHybrid network with re-enforcement learning multiple network = 90%90%Yield datasets were gathered from the Directorate of Agriculture, Gandhinagar.
Weather datasets were collected from the Agro-meteorology
Department, Gujarat
NoWheat crop
[43]Simple non-linear regression, SNR; backpropagation neural network, BPNN; and random forest regression, RFRandom forest (average accuracy rate)80.47%Soil image dataset NoRice crop
[44]CP-ANNs, supervised Kohonen networks, and XY-fused networks (XY-Fs)Supervised Kohonen networks 81.65%The study site was a 22 ha field at Duck End Farm,
Wilstead, Bedfordshire, U.K. (Latitude 52°05′51″ N, Longitude 0°27′19″ W)
Spectroscopy sensorWheat yield
[45]SVM, DT,
multi-layer perception (MLP)
Multi-layer perception (MLP) (average accuracy rate of NPK nutrients)94%Data were collected from Department of Soil
Science, Agricultural University, located in Tiruchendur and from
Soil Science Laboratory, Kanyakumari district
NoBanana, varieties of rice, varieties of maize, and Ragi
[46]K mean clustering algorithmK mean clustering 77%Paddy crop imagesNoDifferent crops
[47]CNN, MLPConvolution neural network (average score of wheat, maize, sunflower, soybeans, and sugar beet)85%Kyiv region of Ukraine using multi-temporal
multisource images
Landsat-8 and Sentinel-1A
satellites
Wheat, maize, sunflower, soybeans, and
sugar beet
[48]DT, KNN,
KNN with cross validation,
linear regression, naive Bayes,
neural network, SVM
Neural network89.80%Various datasets from government website: https://data.gov.in/
and Kaggle: https://www.kaggle.com/notebook
No16 major crops grown such as rice, maize, ragi, wheat, ground nut, soyabean, cotton, jute, etc. across the Andhra Pradesh state, India
[49]Linear algorithms: logistic regression, linear discriminant analysis (LDA), and non-linear tools NB, KNN, CART, and SVMLinear discriminant analysis algorithm (LDA) 61%Collected for seven years in five countries of the ESA region, namely Ethiopia, Kenya, Tanzania, Malawi, and MozambiqueNoMaize grain
PROPOSED ALGORITHM:
multi-class support vector machine using directed acyclic graph and
fruit fly optimisation
(MSVM-DAG-FFO)
97.3%Real-time dataset collected using IoTSNA-CR modelSensors for temperature, moisture, GPA, water level, NPK, and pH along with node MCU, Arduino, and Wi-Fi hotspotCrops: rice, cotton, maize, ground nuts
Disclaimer/Publisher’s Note: The statements, opinions and data contained in all publications are solely those of the individual author(s) and contributor(s) and not of MDPI and/or the editor(s). MDPI and/or the editor(s) disclaim responsibility for any injury to people or property resulting from any ideas, methods, instructions or products referred to in the content.

