

Deep Learning for Parkinson’s Disease Diagnosis: A Short Survey

Electrical and Computer Engineering, University of South Alabama, Mobile, AL 36688, USA
Computers 2023, 12(3), 58; https://doi.org/10.3390/computers12030058
Submission received: 2 February 2023
/
Revised: 4 March 2023
/
Accepted: 6 March 2023
/
Published: 7 March 2023
(This article belongs to the Special Issue Future Systems Based on Healthcare 5.0 for Pandemic Preparedness)
Abstract
:Parkinson’s disease (PD) is a serious movement disorder that may eventually progress to mild cognitive dysfunction (MCI) and dementia. According to the Parkinson’s foundation, one million Americans were diagnosed with PD and almost 10 million individuals suffer from the disease worldwide. An early and precise clinical diagnosis of PD will ensure an early initiation of effective therapeutic treatments, which will potentially slow down the progression of the disease and improve the quality of life for patients and their caregivers. Machine and deep learning are promising technologies that may assist and support clinicians in providing an objective and reliable diagnosis of the disease based upon significant and unique features identified from relevant medical data. In this paper, the author provides a comprehensive review of the artificial intelligence techniques that were recently proposed during the period from 2016 to 2022 for the screening and staging of PD as well as the identification of the biomarkers of the disease based on Electroencephalography (EEG), Magnetic Resonance Imaging (MRI), speech tests, handwriting exams, and sensory data. In addition, the author highlights the current and future trends for PD diagnosis based machine and deep learning and discusses the limitations, challenges, potential future solutions, and recommendations for a reliable application of machine and deep learning for PD detection and screening.
1. Introduction
Parkinson’s disease (PD) is a neurodegenerative disorder that affects dopaminergic neurons (i.e., neurotransmitters essential for movement) in the substantia nigra region of the brain [1]. People with PD may experience several symptoms including bradykinesia (i.e., slowness of movement), dysarthria (i.e., speech difficulty), anxiety, depression, sleep behavior disorders, and cognitive impairment. By the time the symptoms arise, 60% to 80% of the dopamine-producing cells in the substantia nigra have been depleted [1]. Therefore, an early diagnosis of PD is critical in order to better assess the disease and eventually ensure a better quality of life for the patients and their caregivers. PD is evaluated by medical specialists using the Unified Parkinson’s Disease Rating Scale (UPDRS) [2] which consists of 42 items in four subscales. It was also shown that the accuracy of the clinical diagnosis of PD performed by movement disorders experts was limited (i.e., 79.6% during the initial assessment stage and 83.9% during the follow-up assessment stage) [3].
Machine and deep learning [4,5,6,7,8,9,10,11,12,13,14,15,16] approaches have been recently introduced for the automated detection and classification of PD [17,18,19] based upon Electroencephalography (EEG) [20,21,22,23,24,25,26,27,28,29,30,31,32], Magnetic Resonance Imaging (MRI) [33,34,35], speech patterns [36,37,38,39,40,41], handwriting exams, and dynamics, and sensory data [42,43,44,45,46,47,48,49,50,51,52,53,54,55,56]. Although there are multiple modalities that have been recently experimented with for the application of deep learning and the potential detection of Parkinson’s disease, until now, the observation of motor system abnormalities is the current means of clinical diagnosis despite being subjective and prone to human error. Further, there are currently no unique or established clinical biomarkers of the disease or its complications.
Generally, this study is not meant to be a systemic review. However, it is considered a technical and focused survey that mainly highlights the current and future trends in the area of machine and deep learning in PD diagnosis, staging, and biomarkers detection within the period from 2016 to 2022 [20,21,22,23,24,25,26,27,28,29,30,31,32,33,34,35,36,37,38,39,40,41,42,43,44,45,46,47,48,49,50,51,52,53,54,55,56] as well as the challenges, limitations, and solutions to improve the generalizability, reliability, and scope of these techniques. The remainder of this paper is organized as follows. Section 2 presents an overview on the standard machine and deep learning approaches followed with a literature review of the aforementioned techniques in the area of PD diagnosis, screening, staging, and biomarker identification in Section 3. A discussion of the current trends and limitations in the area of PD diagnosis based machine and deep learning is provided in Section 4. Section 5 presents a brief overview on the future trends and potential solutions. Finally, the summary and conclusions are provided in Section 6.
2. Machine and Deep Learning
Machine and deep learning methods aim at producing complex mathematical models that are capable of extracting unique features from photographs or instrumentation data and further classify, segment, reconstruct, or detect targets based on the identified features. These models have proven to be very promising and can potentially outperform human graders. Machine and deep learning techniques are generally classified into supervised and unsupervised techniques. Supervised techniques require human supervision during the training process of the models via providing adequate labelled data. Examples of supervised learning are support vector machine (SVM) [4], decision tree [5], artificial neural networks (ANNs) [6], convolutional neural networks (CNNs) [7], and recurrent neural networks (RNNs) [12].
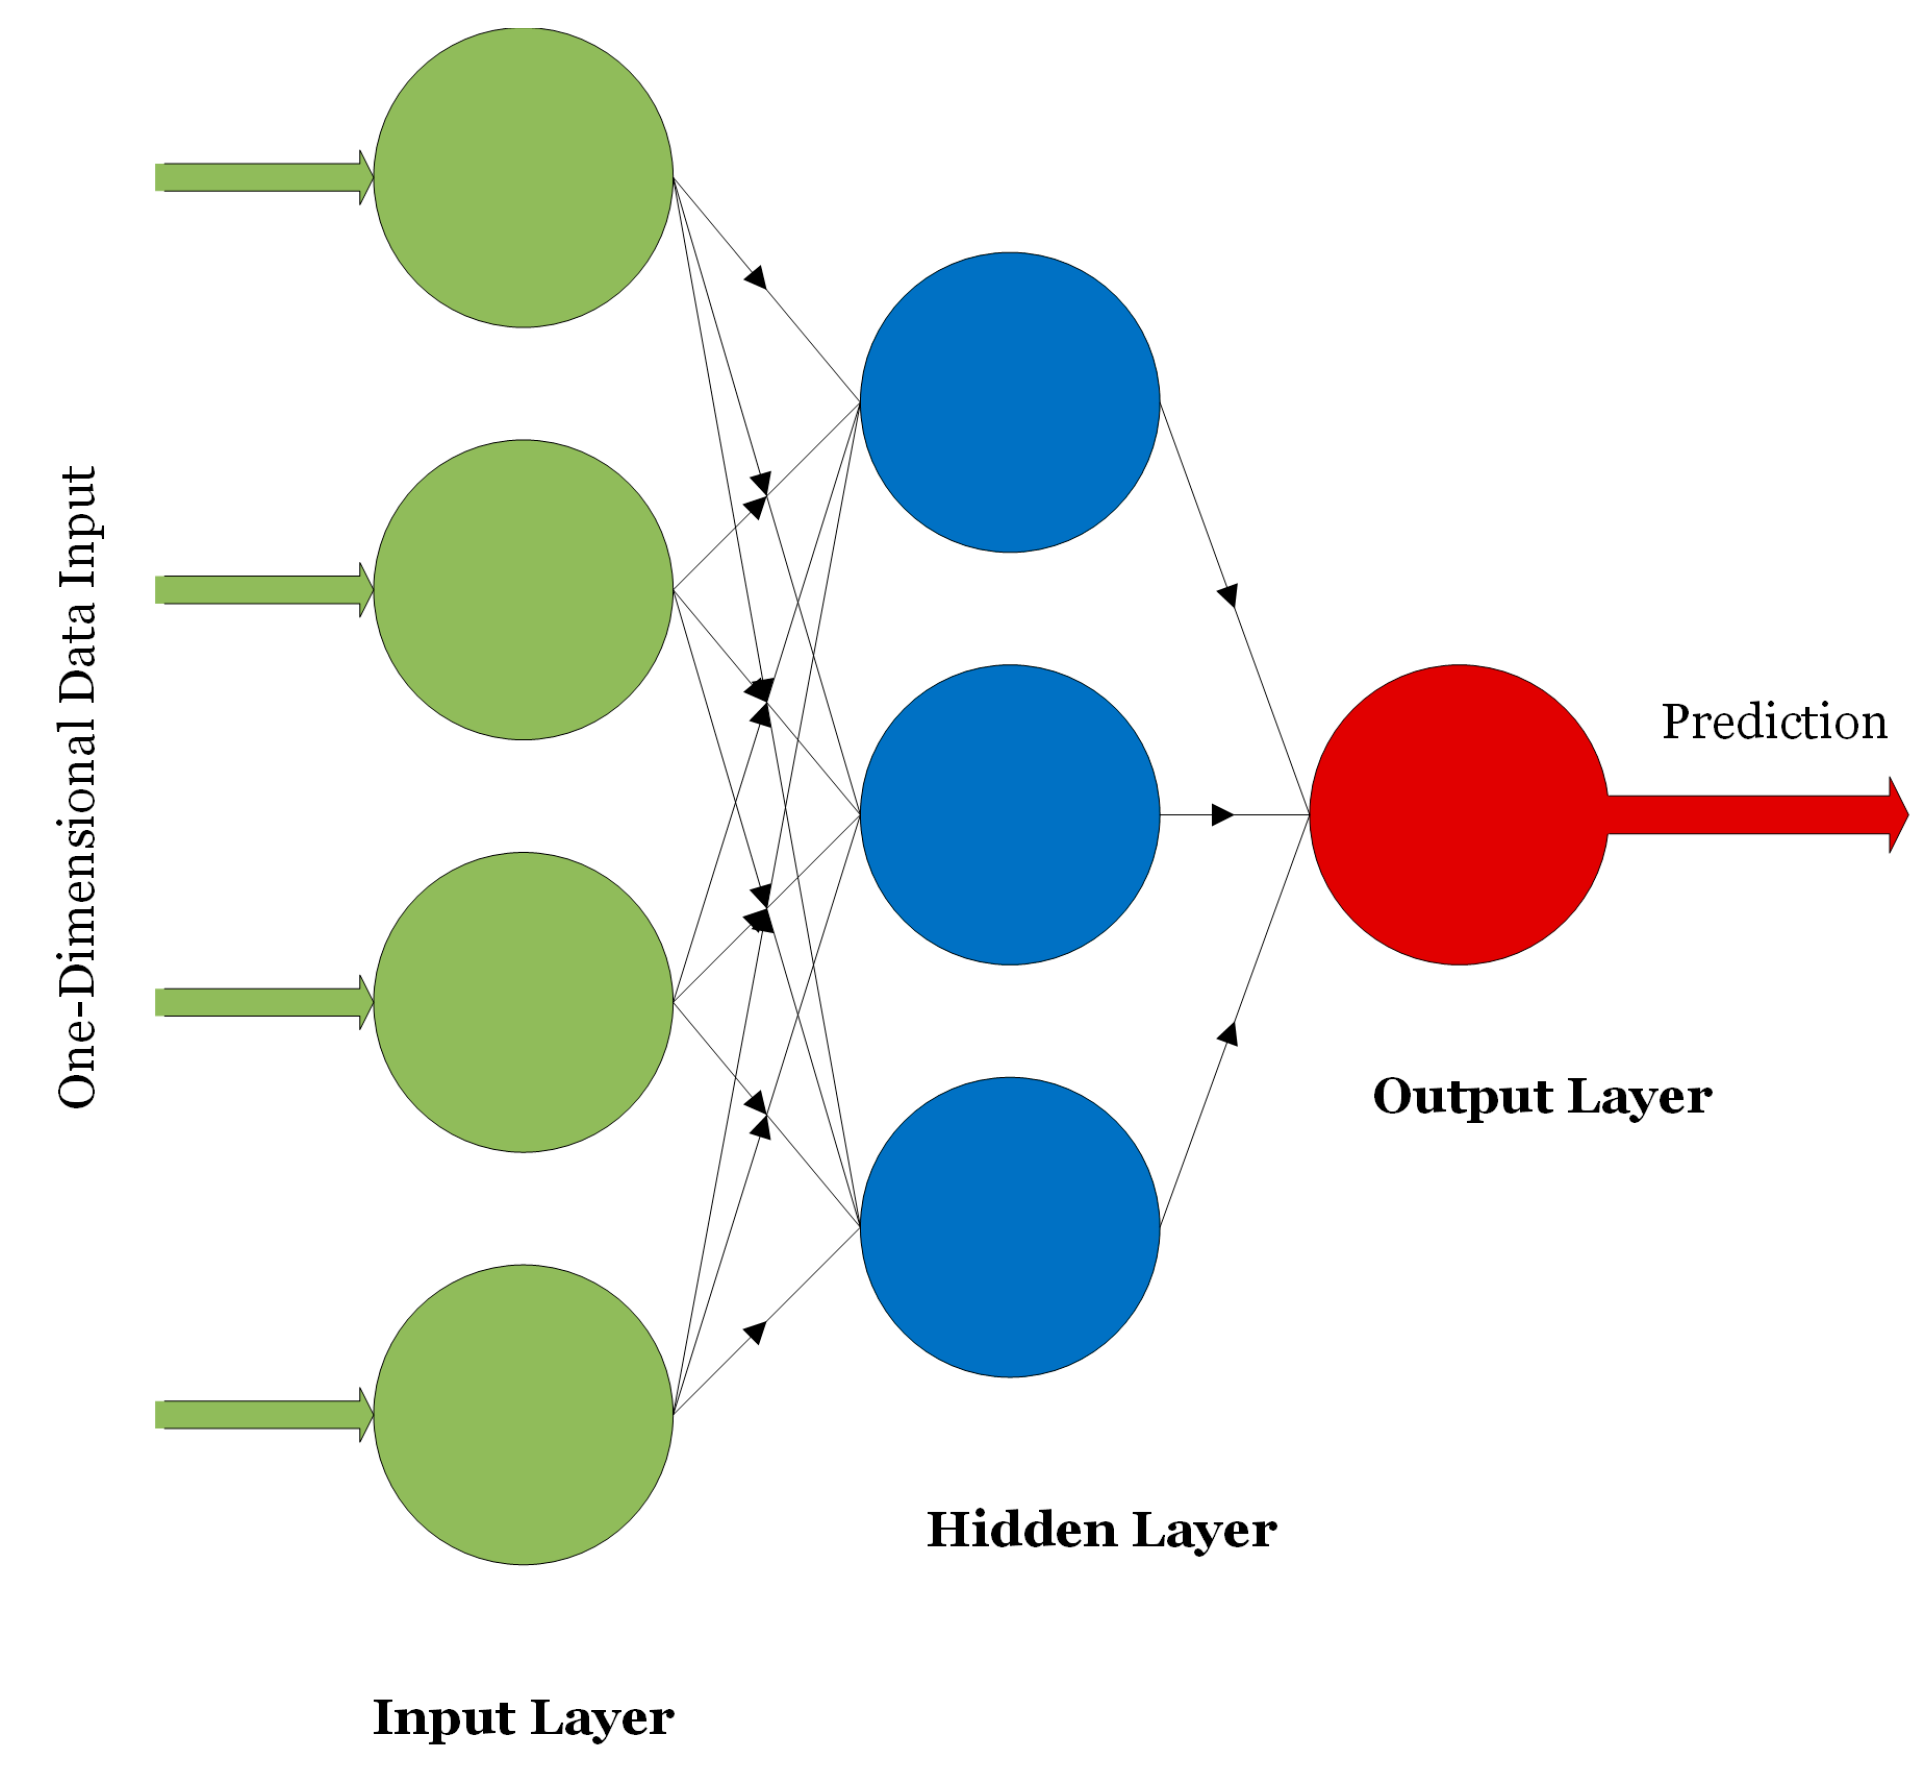
On the other hand, unsupervised methods aim at clustering data into groups or creating association rules that better describe the underlying data structures without the need of expert-level labels during the training process of the models. Examples include K-Means clustering [13], autoencoders [14], deep belief networks [15], and self-organizing maps [16]. ANNs, CNNs, RNNs, and autoencoders are widely used in medical applications. ANNs were first introduced in 1958. The network, as shown in Figure 1, consists of an input layer, one or several hidden layers, and an output layer providing a prediction [6].
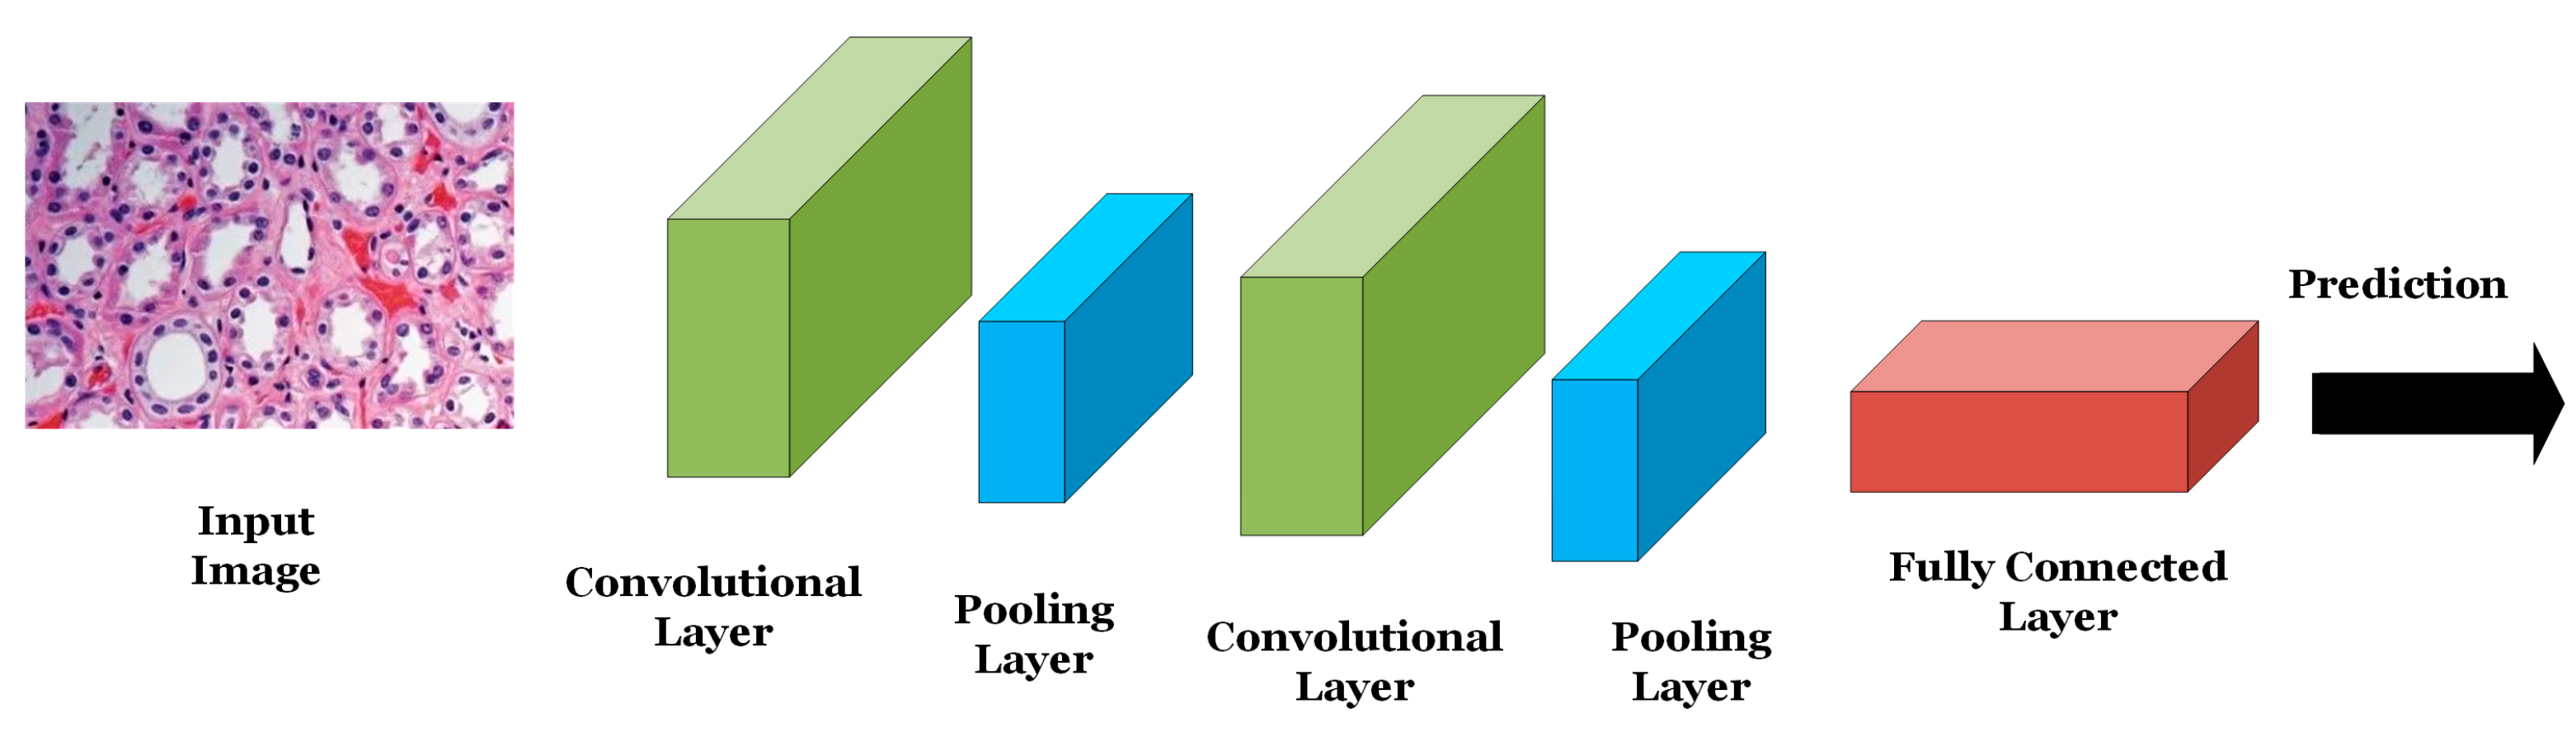
ANNs are used for classifying or analyzing one-dimensional signals such as speech or EEG signals. The nodes of the network are fully connected and the connections between the nodes are strengthened or weakened using weights updated via the backpropagation algorithm. CNNs are other forms of neural networks that are useful for handling two-dimensional as well as multi-dimensional signals such as digital images and videos. The main advantage of CNNs over ANNs is that CNNs are scalable where the number of learning parameters is independent on the input data size. As shown in Figure 2, CNNs consist mainly of convolutional layers that extract low- or high-level features from different regions of the image. Pooling layers are used to reduce the dimensionality of the extracted features by the convolutional layers and hence reduce the computational complexity of the network. Fully connected layers are deployed at the end of the network for the purpose of classifying the input based on the features generated by the convolutional and pooling layers.
LeNet was the first successful CNN introduced by LeCun et al. in 1989 to classify and identify handwritten numbers in 28 × 28 images of the MINIST dataset [7]. LeNet consists of two convolutional layers, where each is succeeded by a pooling layer and three fully connected layers. Following the success of the LeNet, AlexNet was introduced in 2012 by Krizhevsky et al. [8] to classify a subset of the ImageNet dataset consisting of almost 1.2 million images belonging to 1000 different classes at a top-5 error of 15.3%. AlexNet consists mainly of five convolutional layers and three fully connected layers. Due to the relatively large size of the network, data augmentation as well as drop out operations (i.e., dropping or turning off a certain number of neurons in the network during the training process of the model) were adopted to reduce model overfitting. In 2014, Google researchers introduced the GoogleNet/Inception network consisting of 22 layers including convolutional, pooling, and fully connected layers and achieving a top-5 error of 6.67% in classifying the ImageNet dataset (i.e., 8.63% improvement over the accuracy achieved by AlexNet with the same dataset) [9].
In the same year, the Visual Geometry Group Network (VGGNet) consisting of 16 convolutional layers was introduced and achieved a top-5 error of 7.3% using the same ImageNet dataset [10]. In 2015, the Residual Neural Network (ResNet) with 152 layers was introduced by He et al. achieving a top-5 error of 3.57% with the ImageNet dataset [11]. This network introduced the concept of skip connections where the output of one layer can be connected to latter layers of the network bypassing several layers. Due to the relatively high accuracy of the VGGNet and ResNet networks, the models have been widely adopted in many medical applications including PD screening and staging where the models that have been pre-trained on the ImageNet dataset were then fine-tuned on the PD datasets. This transfer of knowledge from a computer vision application (i.e., ImageNet dataset) to a medical application is called transfer learning.
RNNs are variations of CNNs and ANNs that are beneficial in analyzing sequential or time-series data such as EEGs and genomic sequences [12]. RNNs are composed of several CNN/ANN units where the decision of a certain unit depends on the internal state of a previous unit offering a “short memory” feature of the data context as shown in Figure 3. Since exploding or vanishing gradients may occur during the training process of RNNs, LSTMs were introduced to keep track of long-term dependencies among sequential data and address the exploding and vanishing gradients dilemma.
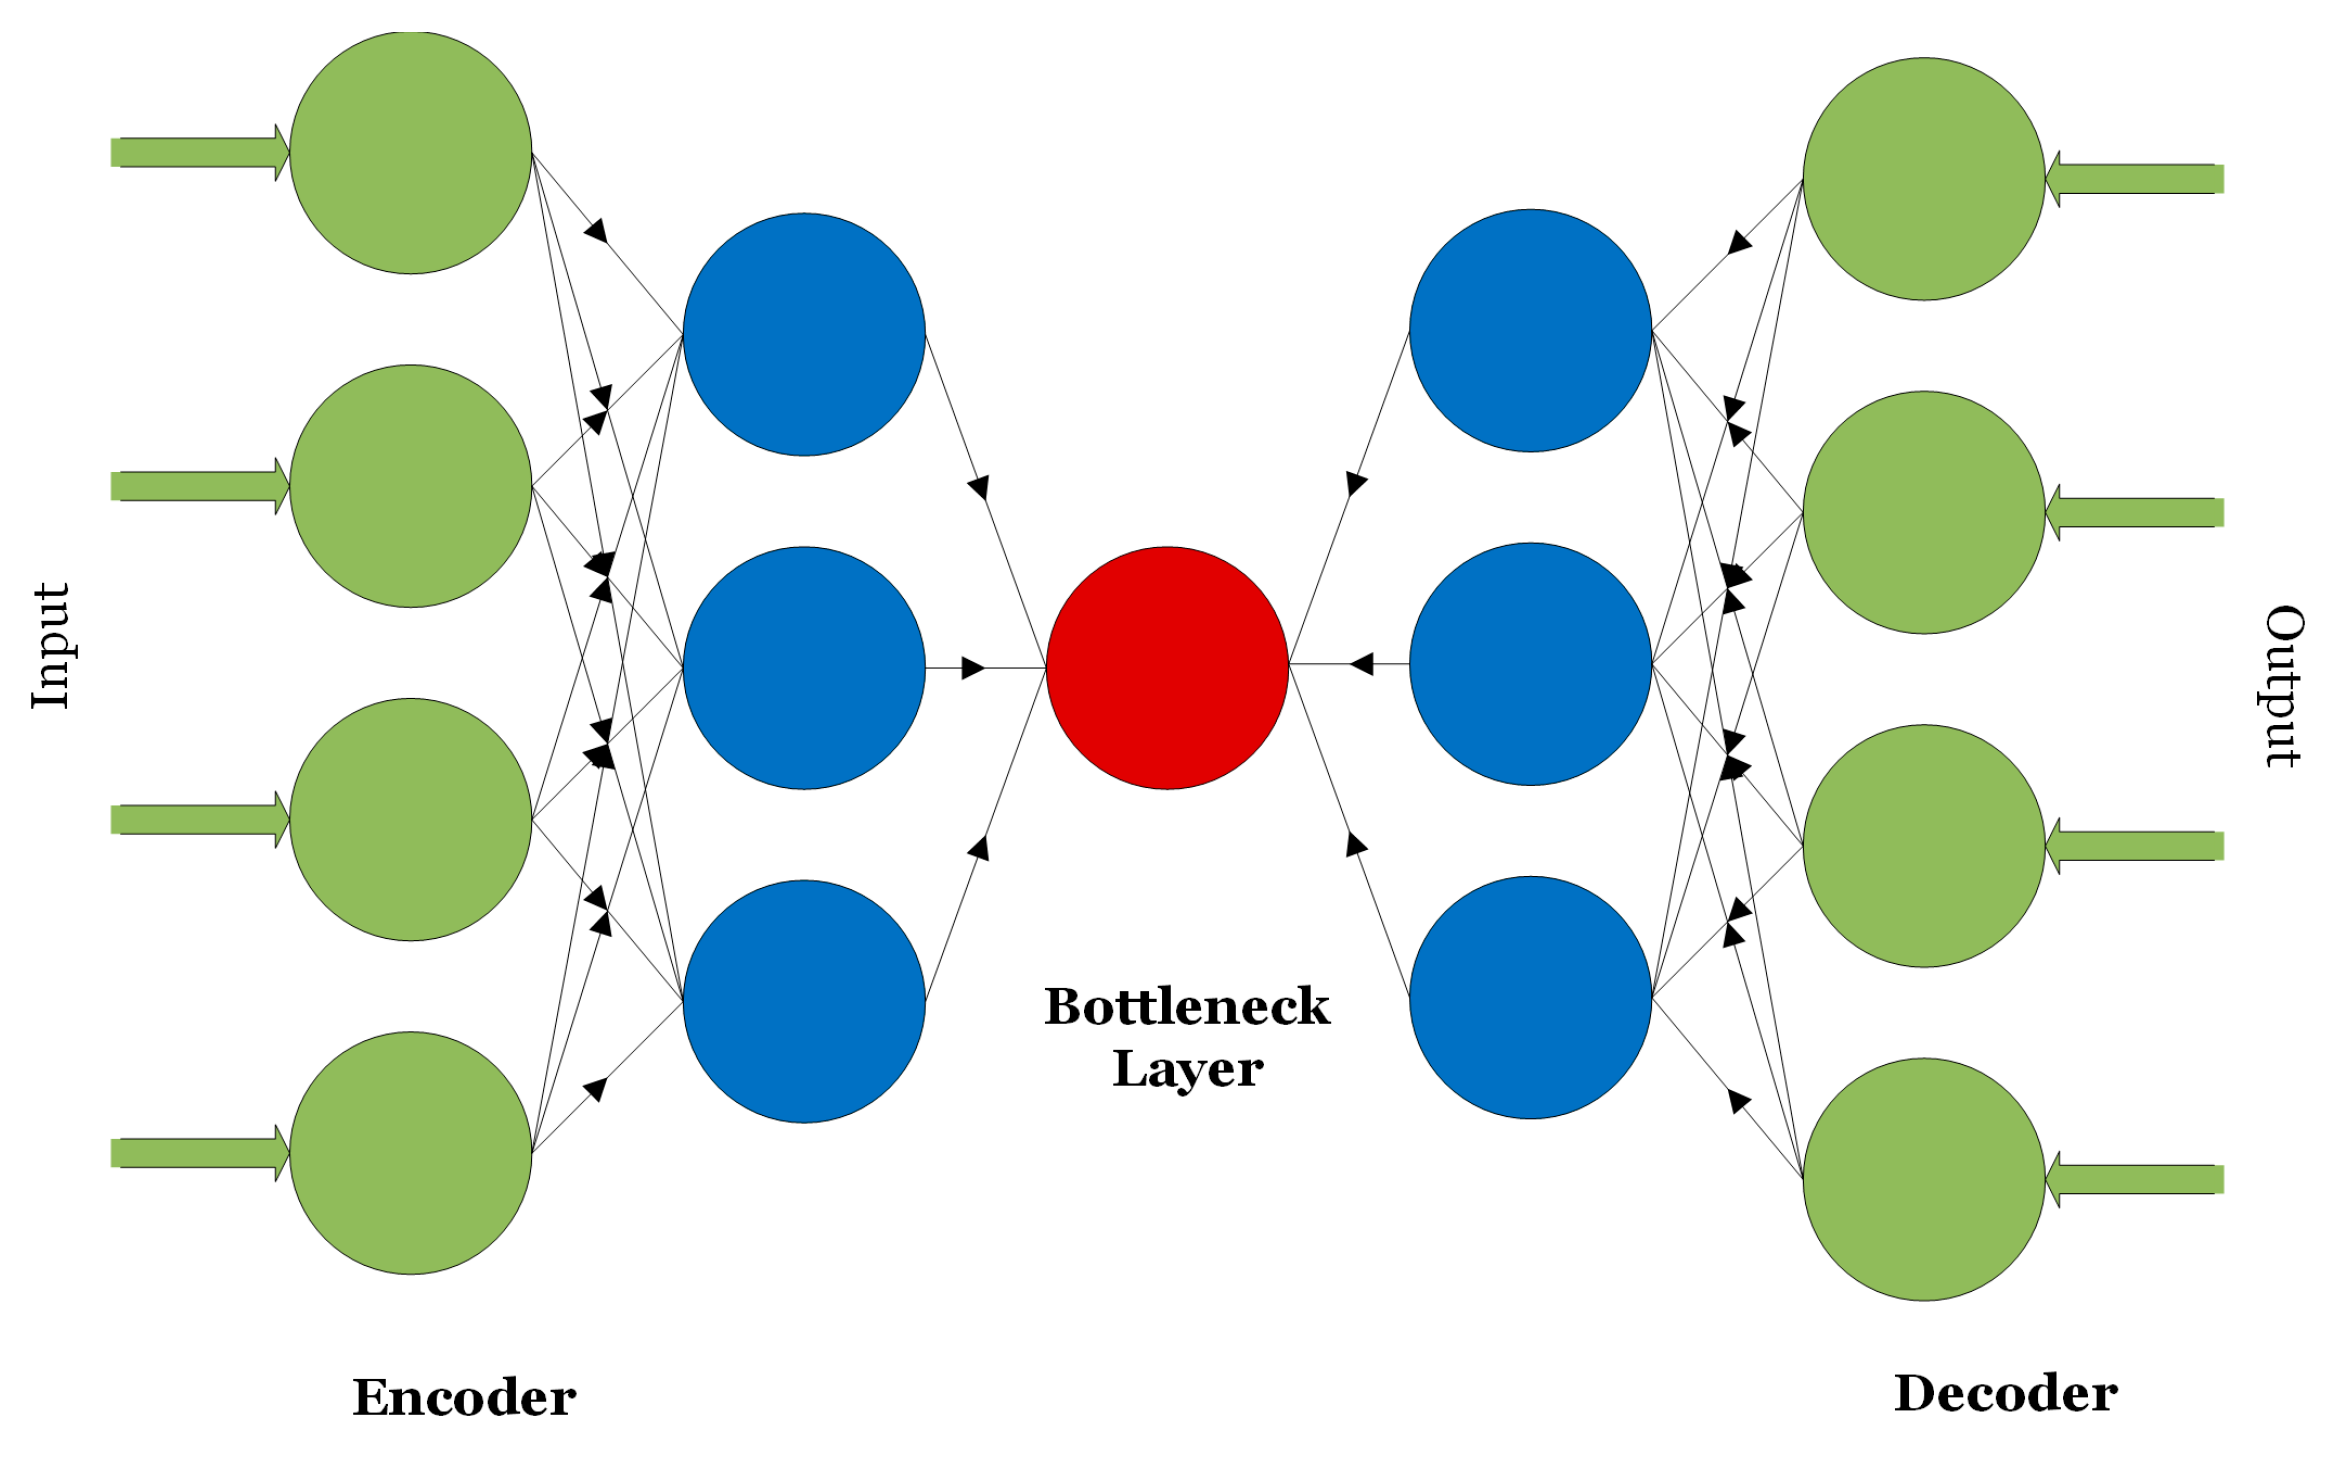
Autoencoders are unsupervised learning techniques consisting of a pair of encoder and decoder units as shown in Figure 4 [14]. Generally, autoencoders are used to compress or transform high-dimensional data into low-dimensional signatures.
Inputs to autoencoders can be one-dimensional data that is partially corrupted with noise as in de-noising autoencoders or multi-dimensional data as in convolutional autoencoders.
3. Literature Review
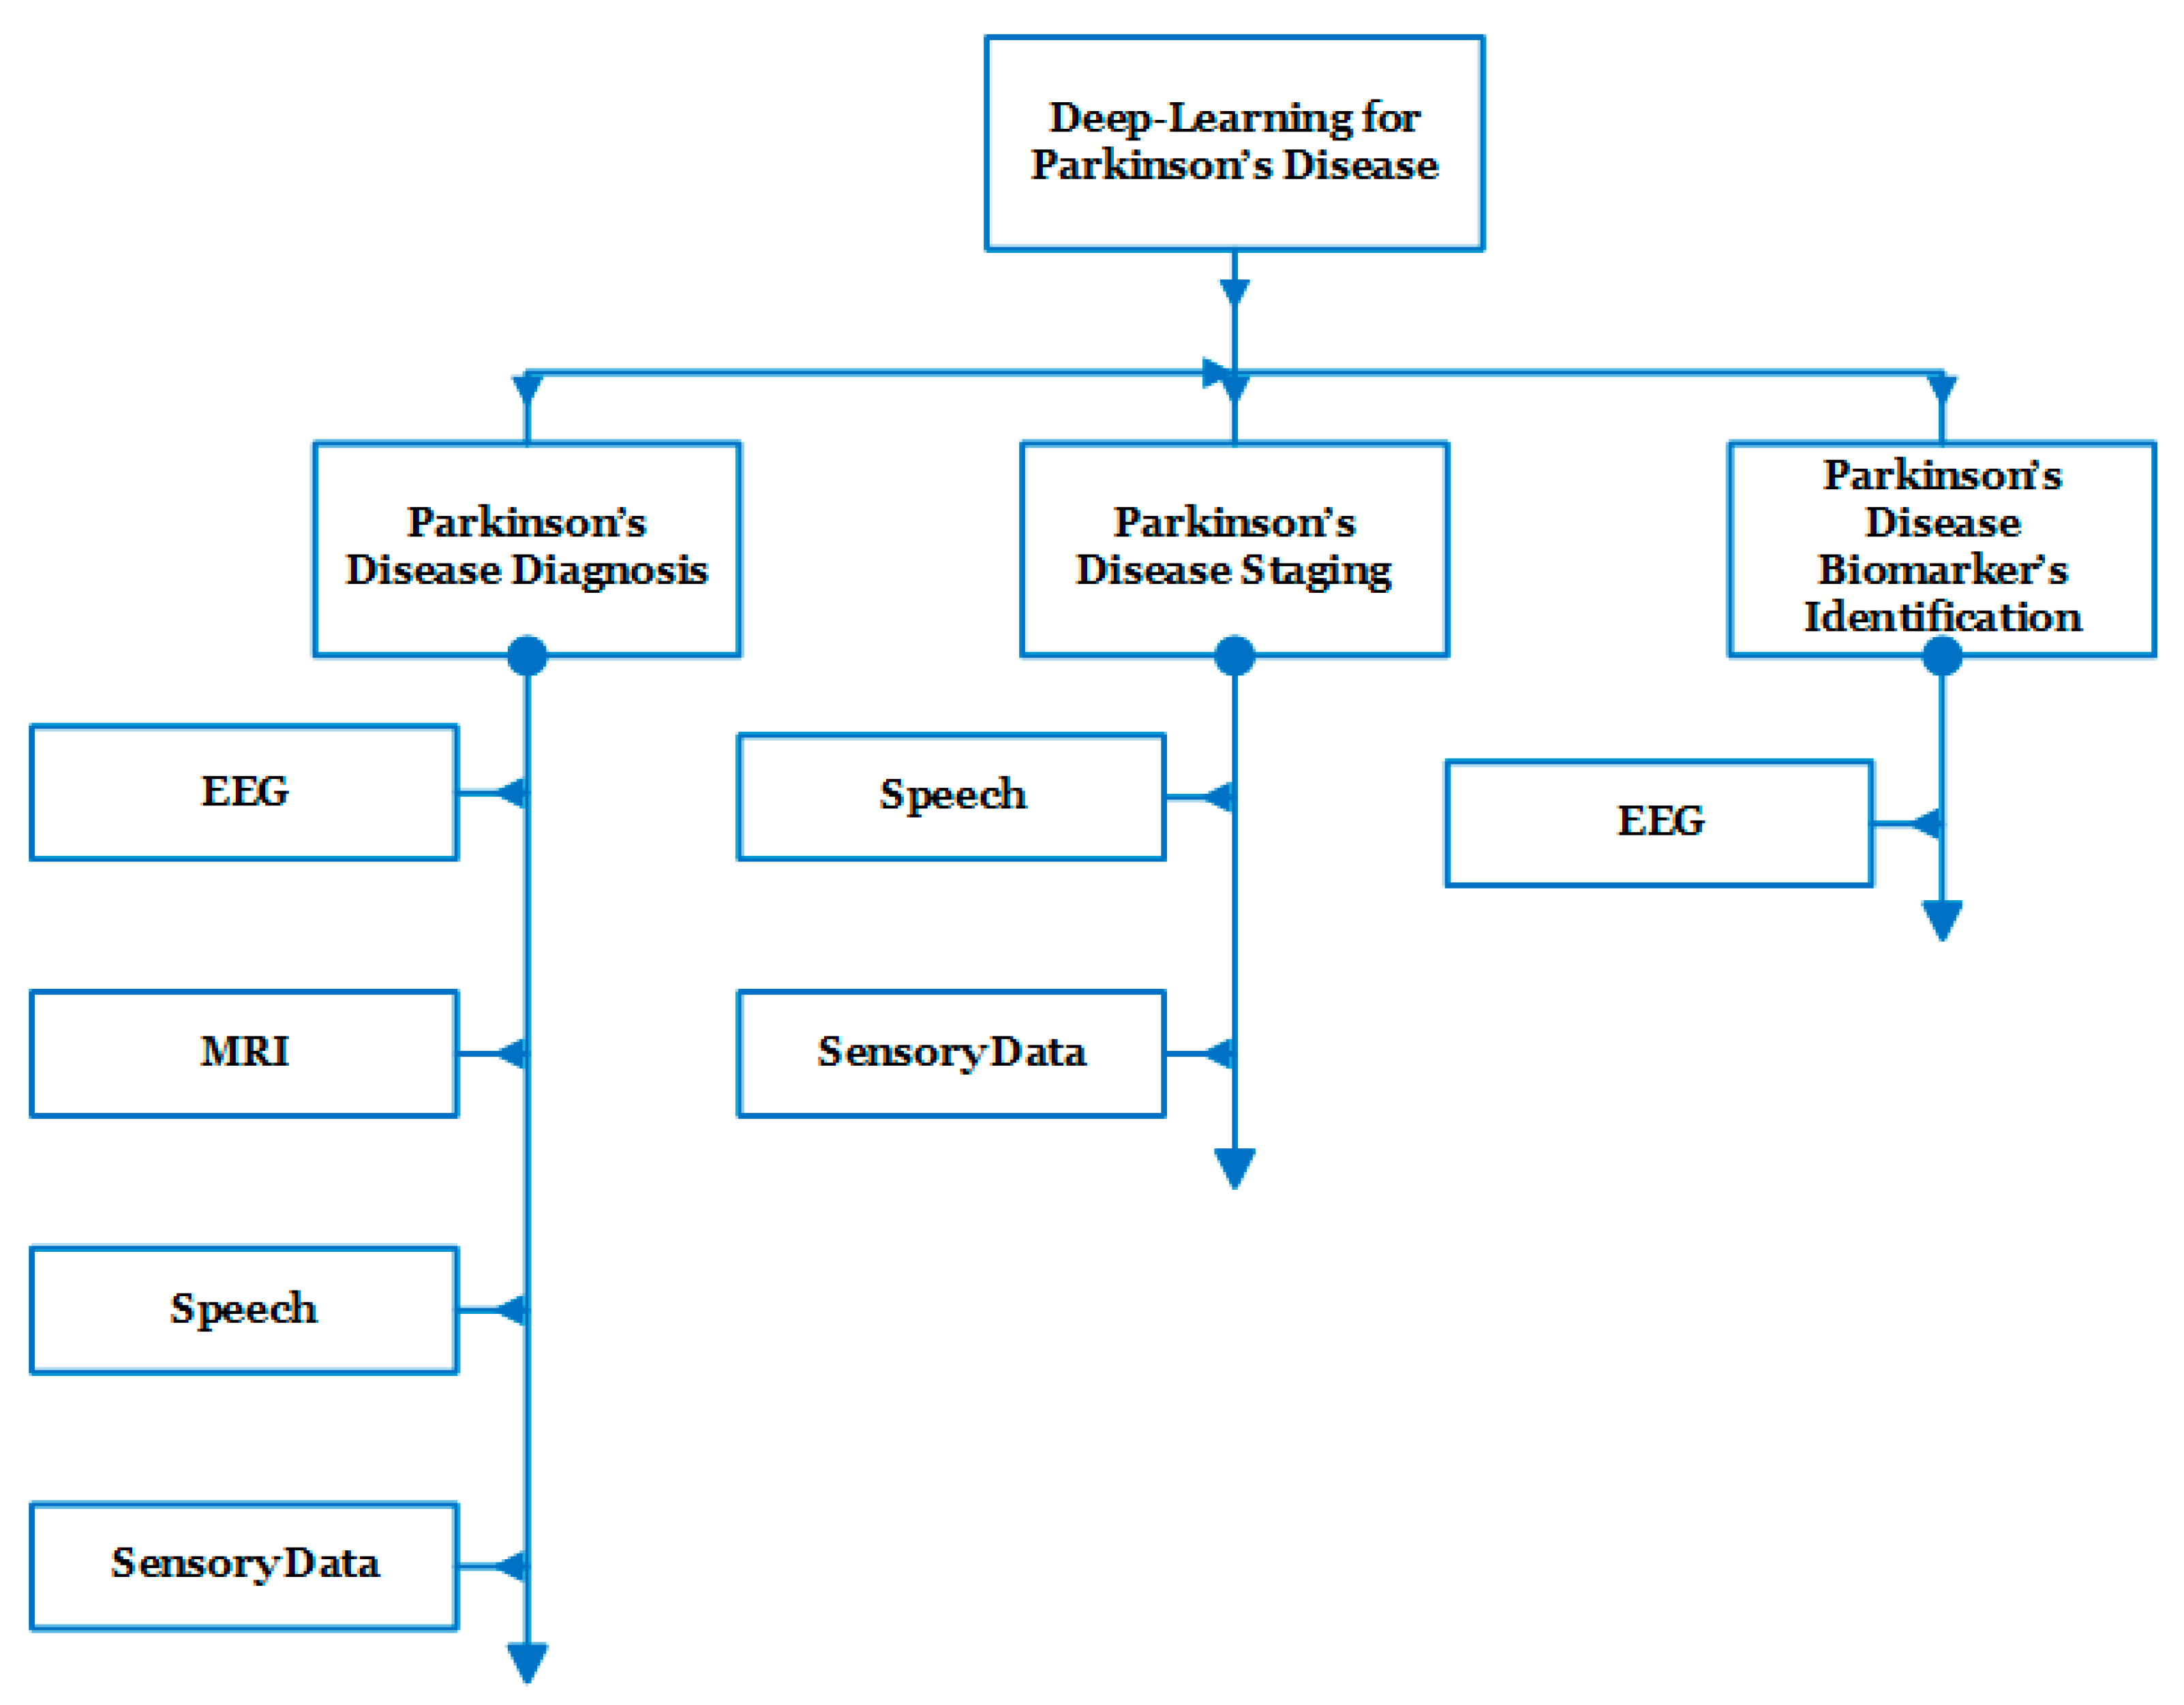
In recent studies, several dataset modalities have been exploited by efficient deep learning methods for the diagnosis of PD, staging of the disease, and the identification of biomarkers. Figure 5 shows the taxonomy of the related work that has been recently introduced during the period from 2016 to 2022 [20,21,22,23,24,25,26,27,28,29,30,31,32,33,34,35,36,37,38,39,40,41,42,43,44,45,46,47,48,49,50,51,52,53,54,55,56].
3.1. EEG for PD Detection
Using EEG data to diagnosis and monitor PD has grown in popularity over the last several years. This modality has gained traction as a non-invasive way to reveal significant information about the brain. Current literature points to the promising intersection of EEG with machine and deep learning techniques.
Vanegas et al. proposed three machine learning frameworks to identify the EEG biomarkers of PD. The first model (i.e., extra tree classifier) achieved a 99.4% Area Under Curve (AUC) of the Receiver Operative Characteristic (ROC) curve based on the EEG spectral amplitudes of the posterior occipital area of the brain during visual stimulation of 29 PD subjects and 30 controls [20]. The other two models (i.e., logistic regression and decision tree) achieved 94.9% and 86.2% AUC of ROC, respectively. The weights of the logistic regression along with the decision nodes of the decision tree pinpointed the frequency bins that have the strongest influence on the differentiation between PD subjects and controls. It was also found that the most influential frequency bins span from the theta, alpha, to beta range.
Oh et al. proposed a 13-layer CNN to classify subjects into PD and controls based on resting-state EEGs acquired from 20 PD subjects and 20 controls [21]. The model achieved an accuracy of 88.3%, a sensitivity of 84.7%, and a specificity of 92%. In [22], Wagh et al. proposed an 8-layer graph CNN applied on 8 × 6 feature matrices extracted from 10 s EEG segments from 1,385 patients with neurological diseases including PD and 208 healthy subjects. Each feature matrix represents the total power of each of the six wave bands (i.e., delta, theta, alpha, lower beta, higher beta and gamma) at eight different spatial channels of the EEGs. The model achieved an AUC of ROC of 85% in detecting neurological diseases.
In [23], Koch et al. used a random forest model to classify PD subjects into patients with good or poor cognition. The model was trained and tested on sets of clinical and automated features extracted from EEG data and related to 20 PD subjects with good cognition and 20 patients with poor cognition. The model achieved the best AUC of ROC of 91% when both the clinical and automated features were provided to the model. Shi et al. and Lee et al. proposed hybrid CNN–RNN models to detect PD from EEG data [24,25]. In [24], the authors proposed two hybrid models, 2D-CNN-RNN and 3D-CNN-RNN, to classify subjects into PD patients and controls based on an EEG dataset for 40 PD and 30 healthy individuals with the 3D-CNN–RNN model achieving the best accuracy of 82.89%. In [25], the proposed hybrid model consisting of a CNN and LSTM was able to classify subjects into PD and controls at an accuracy of 96.9%. The model was also shown to learn features closely related to the clinical features of PD such as disease severity and dopaminergic levels.
Khare et al. used different machine learning methods including the Least Squares Support Vector Machine (LSSVM) on five different features extracted from the tunable Q-factor wavelet transform (TQWT) of a resting-state EEG dataset related to 15 PD subjects and 16 controls in order to discriminate healthy controls (HC) from PD subjects with and without medications at an accuracy of 96% and 97.7%, respectively [26]. In [27], Khare et al. have also applied a 10-layer CNN on the smoothed pseudo-Wigner Ville distribution (SPWVD) transformation of two EEG datasets representing 35 PD subjects and 36 controls achieving a validation accuracy of 99.9% and 100%, respectively. Loh et al. further applied a 2D-CNN on the Gabor transform of a resting-state EEG dataset of 15 PD subjects and 16 controls in order to classify subjects into HC and PD with and without medications at an accuracy of 99.5% [28].
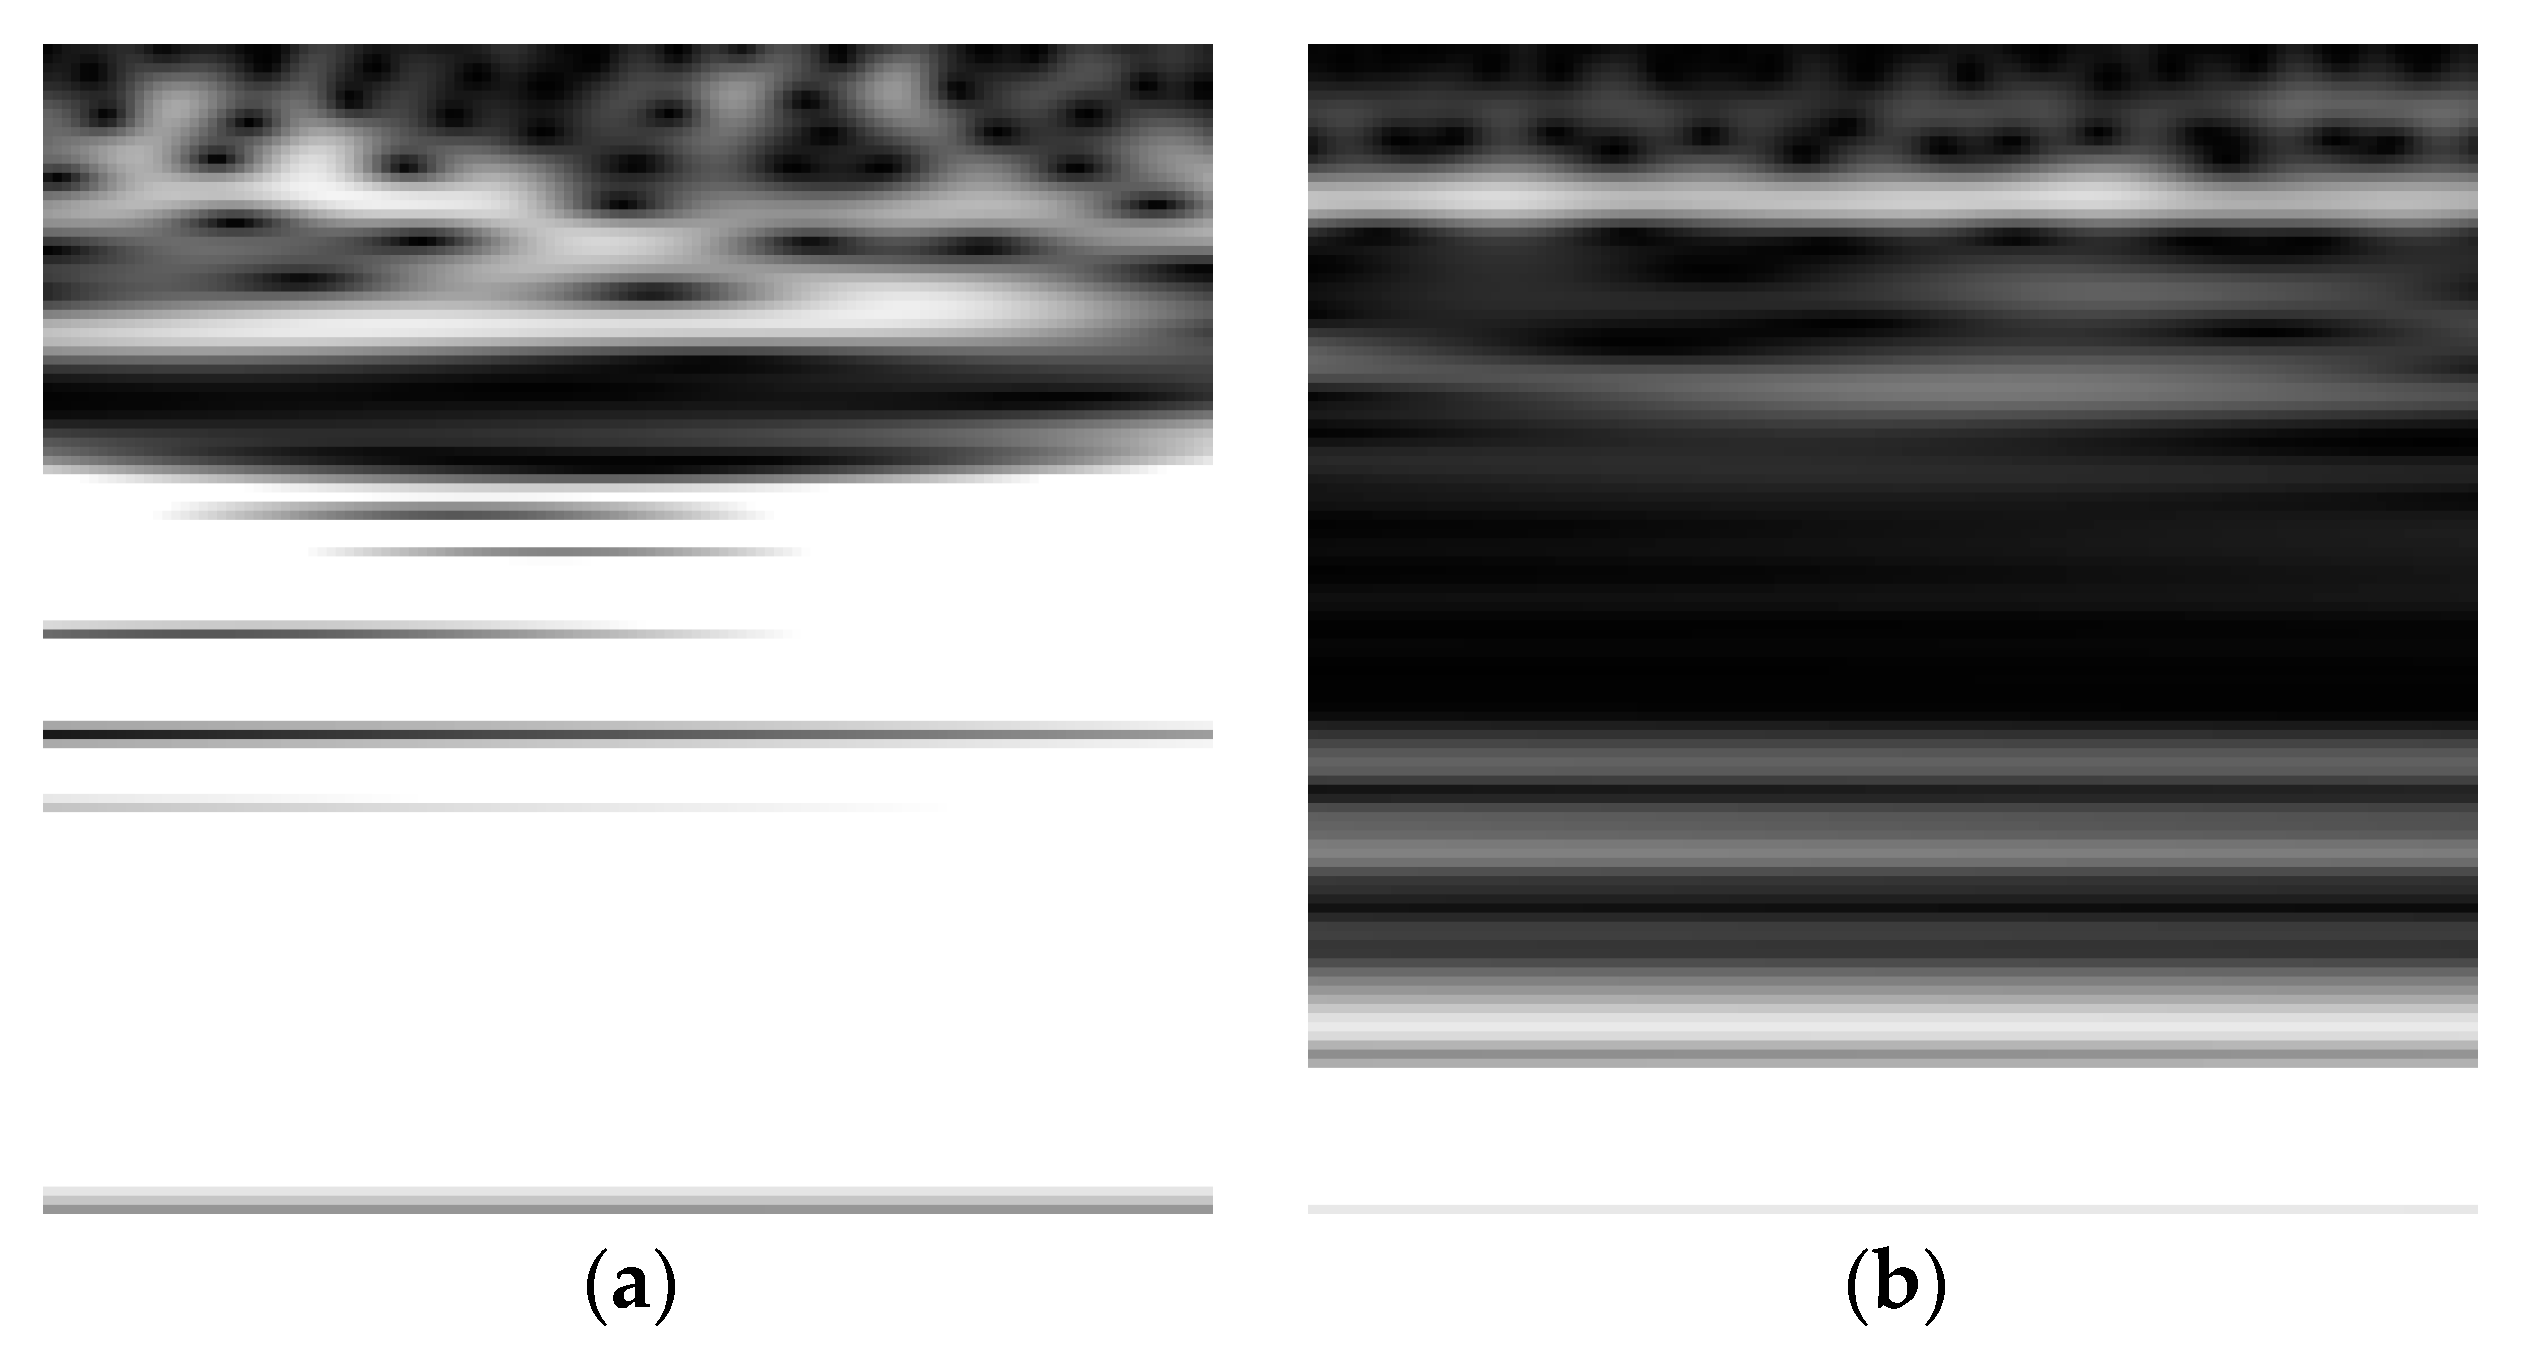
Shaban has also developed a deep learning framework based on three 13-layer ANN models applied on the Oz, P8, and FC2 channels of a 32-channel resting state EEG dataset for 15 PD subjects and 16 controls [29]. The framework achieved a testing accuracy, sensitivity, and specificity of 98%, 97%, and 100%, respectively, for distinguishing subjects with PD from HC when a majority voting scheme was applied on the prediction of the models. In addition, Shaban et al. have recently used a Wavelet-based CNN approach where a 20-layer CNN structure was applied directly to the Morlet wavelet transform [30,31] and the second-order derivative of the wavelet transform [32] of a resting-state EEG time-series with an accuracy, sensitivity, and specificity of up to 99.9% achieved at CP5 in order to classify subjects into PD patients or controls. Figure 6 shows an example of the Scalogram for a resting-state EEG signal captured for a healthy control and PD subject where the horizontal dimension represents time and the vertical dimension represent scale (i.e., reciprocal of Fourier frequency).
As shown in Figure 6, the values of the scalogram for the EEG related to PD exhibits relatively lower intensities as compared with the health controls’ EEG scalogram especially at the mid and high scales [30,31]. Table 1 presents a summary of the machine and deep learning techniques used to exploit the EEG dataset modality for PD along with the objective and the aim, performance, and limitations of the methods.
It is clear from Table 1 that the machine and deep learning methods [26,27,28,29,30,31,32] exhibit the best performance among the-state-of-the-art methods applied on the EEG dataset modality; however, this is at the expense of the increased computational complexity where a time–-frequency transformation stage precedes the application of machine and deep learning. Further, another drawback of these methods is related to the small and limited size of the datasets used in training and testing the models which may restrict their generalizability.
3.2. MRI for PD Identification
MRI data are often used in the diagnosis of neurological diseases. Several researchers have explored the possibility of using machine and deep learning techniques with MRI to detect PD which cannot be seen on an MRI by the naked eye.
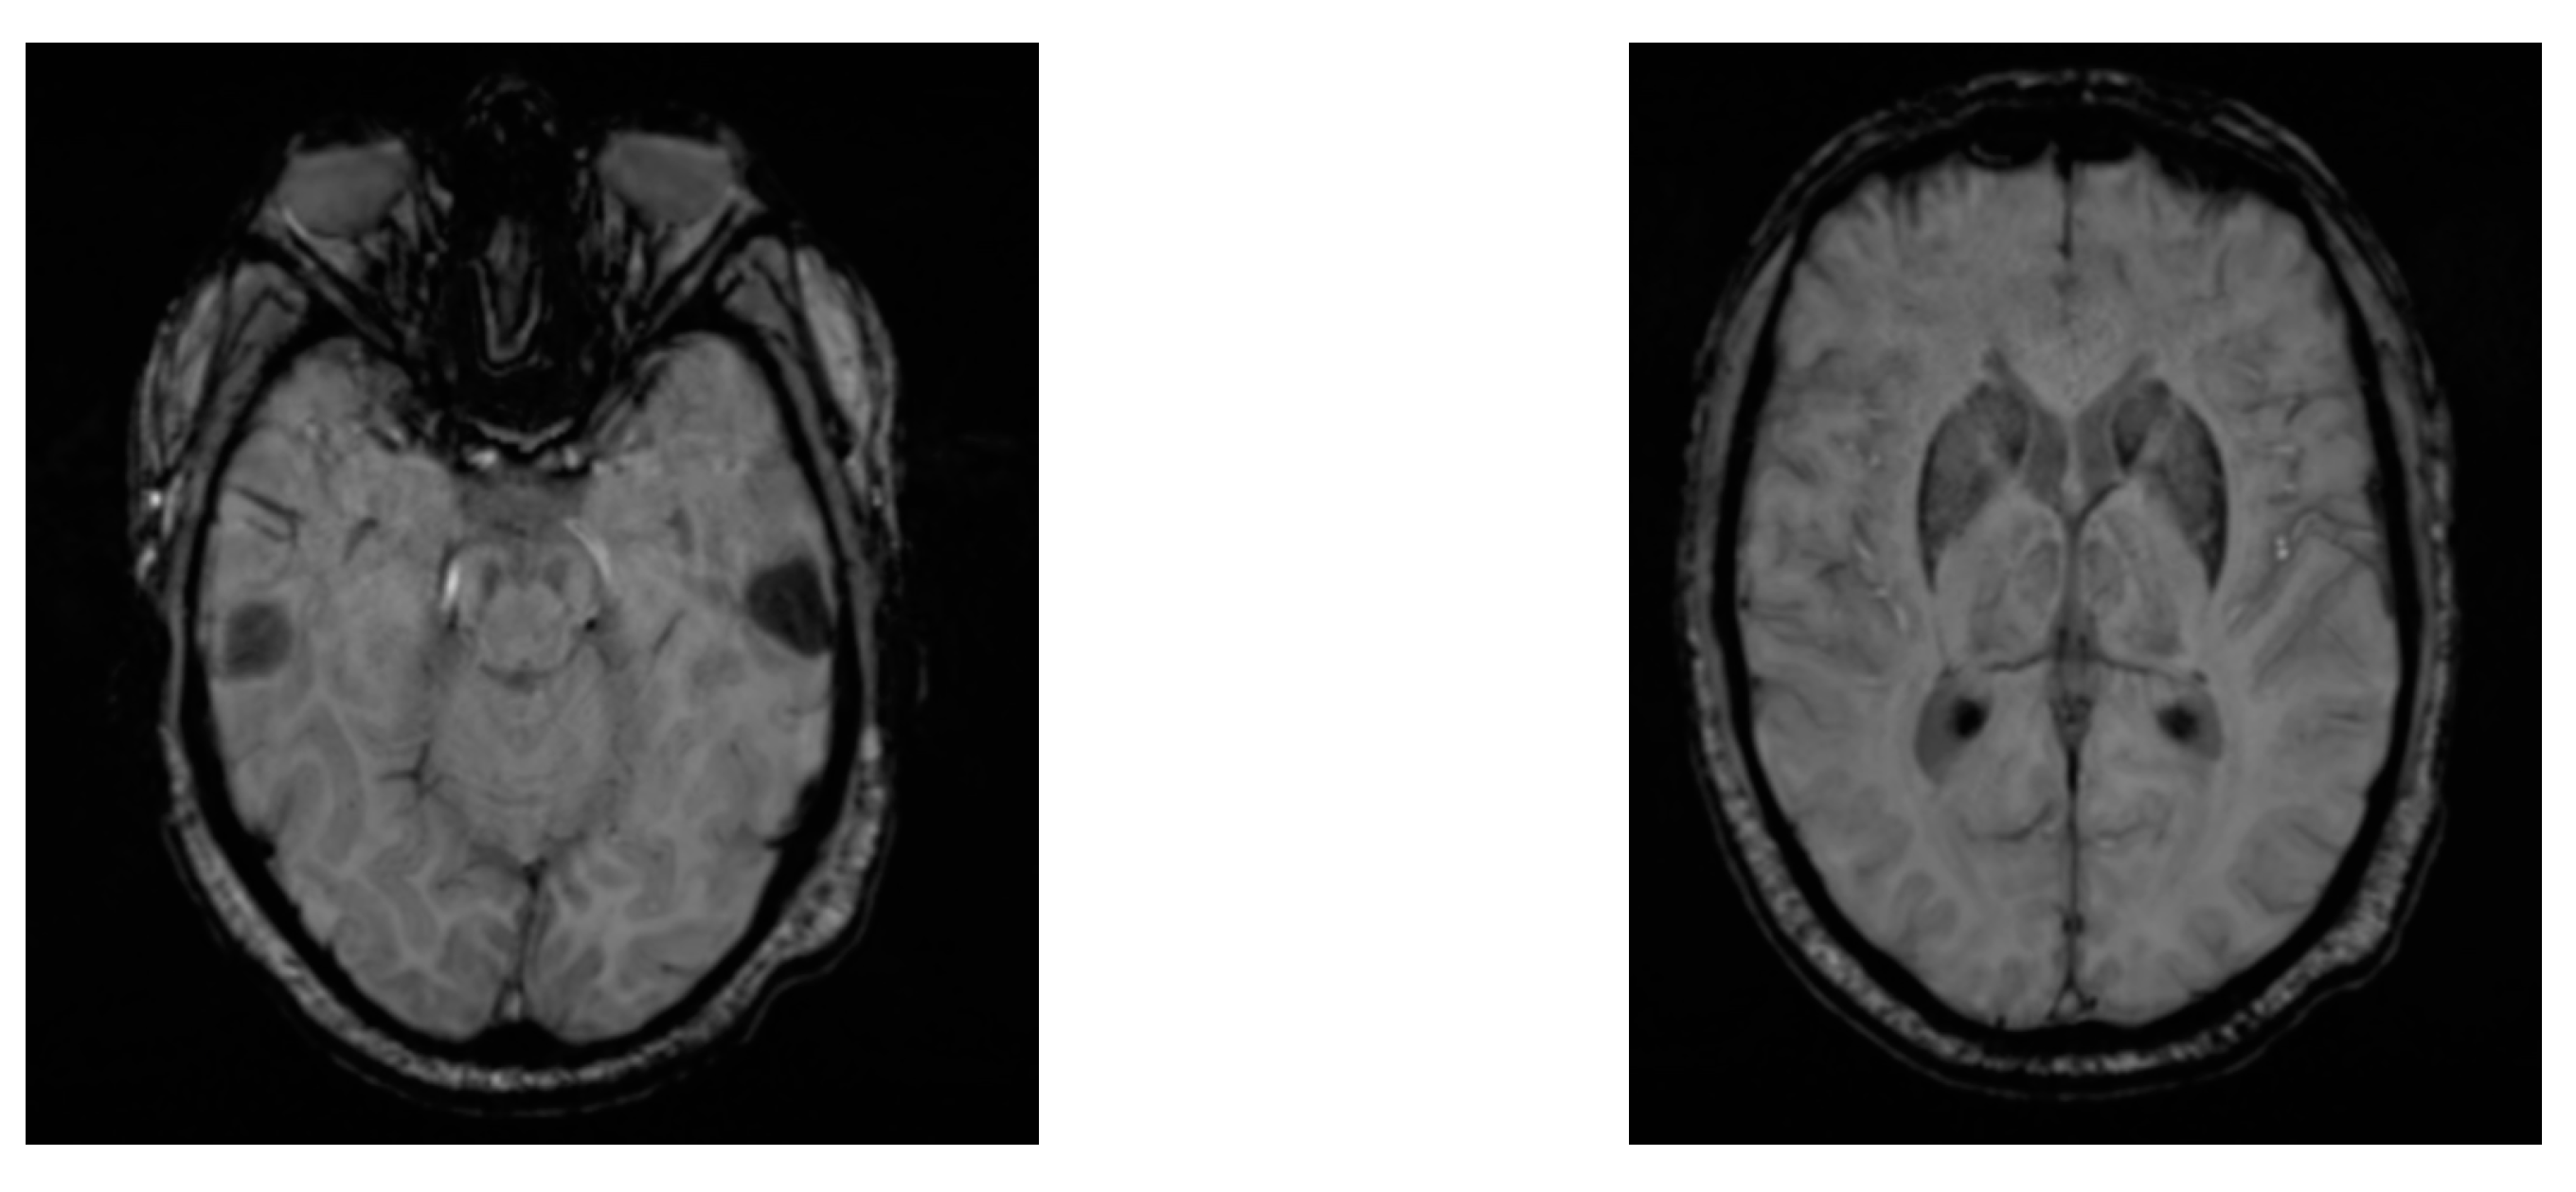
Zhang et al. proposed a novel approach for screening de novo PD patients at an accuracy of 76.46% using deep neural networks applied on 102 two-view MRI data: AXI and SAG data [33]. The two-view data were preprocessed using image augmentation techniques based on Wasserstein Generative Adversarial Networks (WGANs). Further, two ResNeXt networks were applied to the two-view data jointly, and the hidden layer outputs from the two ResNeXt networks were conjugated in a vector and fed into a Softmax classification layer. Figure 7 shows two views of the axial susceptibility weighted imaging (SWI) MRI images for a PD patient (age: 60 years, gender: male).
Ramirez et al. proposed spatial, spatial variational, and dense variational autoencoder models to detect de novo PD subjects based on Diffusion Tensor Imaging (DTI) MRI data for 129 PD subjects and 57 controls [34]. Two clinical features including the mean diffusivity and the fractional anisotropy were used and the authors hypothesized that the reconstruction error would be significantly higher for PD subjects with respect to healthy controls. The spatial autoencoder achieved the best AUC of ROC of 83%.
Prasuhn et al. used a binary Support Vector Machine (bSVM) and Multiple-Kernal Learning (MKL) to detect PD based on DTI MRI [35]. The approach included the preprocessing of a DTI MRI dataset related to 162 PD subjects and 57 controls in order to select clinical diffusion metrics as well as to calculate additional diffusion metrics. The bSVM was applied to each of the five selected diffusion metrics and the MKL to various concatenations of the diffusion metrics. The results showed no more than 60% AUC of ROC and overall, the authors suggested that DTI-based analysis is not useful for correctly classifying PD patients. Table 2 presents a summary of the MRI-based machine and deep learning techniques for PD diagnosis and screening.
It is obvious that all the machine and deep learning methods that have been proposed to exploit the MRI dataset modality for PD detection exhibit relatively low performance compared with the EEG-based machine and deep learning techniques [20,21,22,23,24,25,26,27,28,29,30,31,32]. Further, the models have been validated on small MRI datasets limiting their generalizability.
3.3. Speech as a Modality for PD Screening
Frid et al. developed a 4-layer CNN to classify raw speech related to 43 PD subjects and 9 controls [36]. The proposed model proved to be able to distinguish between various stages of PD with a high accuracy up to 85%. In [37], Tsanas et al. deployed both support vector machine and random forest models in order to classify speech signals of 33 PD patients and 10 controls based on 132 dysphonia measures. A classification accuracy of 99% was achieved using only 10 dysphonia features to detect PD. However, this method was based on speech data of patients whose disease was graded based upon a subjective UPDRS.
Rasheed et al. proposed a Back Propagation Algorithm with Variable Adaptive Momentum (BPVAM) for the detection of de novo PD using vocal data for 23 PD subjects and 8 controls [38]. The voice data were first preprocessed using the principal component analysis (PCA) method in order to select the best features for classification. Using the 15 most discriminative features, an accuracy of 97.5% was achieved. However, due to the use of PCA and BPVAM, the time delay taken to classify speech took almost 7 s on a CPU workstation.
In [39], Gunduz et al. introduced two deep learning frameworks in order to classify speech data for 188 PD subjects and 64 controls. In the first framework, different features extracted from voice data were concatenated before being fed to a 9-layer CNN. For the second framework, feature sets of speech data were provided in parallel with each set going through two convolutional layers before entering a merging layer. The merged features were then classified using a 10-layer CNN consisting of four successive convolutional layers with each two convolutional layers followed with a max pooling layer, one fully connected layer, and a final output layer. The first and second frameworks achieved an accuracy of 84.5% and 86.8%, respectively.
In [40], Karabayir et al. used both the Light Gradient Boosting (GB) and the Extreme GB to detect PD from 256 features of vocal data related to 40 PD subjects and 40 Controls. Further, the seven most relevant features were determined using feature analysis techniques. The classification accuracy based on the seven most relevant features was almost 82%. In [41], Zhang et al. introduced a machine learning system consisting of a stacked autoencoder and k-nearest neighbors (KNN) algorithm applied on the time–frequency features of vocal data. The model achieved an accuracy ranging from 94% to 98% for detecting PD based on Oxford and Istanbul datasets. Table 3 presents a summary of the speech test-based machine and deep learning techniques for PD diagnosis and staging.
As shown in Table 3, most of the speech data-based machine and deep learning techniques were used for PD detection with the exception of the method proposed by Frid et al. [36] for distinguishing the stages of PD. Further, the methods were fully trained and tested on small datasets with the exception of the dataset of 252 subjects used by Gunduz et al. [39]. The best performing methods were SVM and random forest used by Tsanas et al. and the worst performing methods were the GB and Extreme GB introduced by Karabayir et al. [40].
3.4. Sensory and Handwriting Data for PD Classification
Wearable sensors have become popular for collecting data related to movement disorders such as PD. The following researchers have used this modality to assess or diagnose PD. Moon et al. used several machine learning methods including ANNs, SVM, KNN, decision tree, random forest, and gradient boosting to differentiate between essential tremor (ET) and PD where both diseases have similarities in their clinical characteristics including movement and gait [42]. The authors used Synthetic Minority Oversampling Technique (SMOTE) to mitigate the effect of their highly unbalanced dataset. In addition, the Mobility Lab software was used to automatically compute gait and balance features. Using the selected features, it was shown that neural networks would be useful for classification but a larger and more balanced dataset was needed to confirm findings.
In [43], el Maachi et al. proposed a deep learning framework to extract relevant information in diagnosing PD using gait classification. The first part of the network consists of 18 parallel 1D-CNNs, each composed of four convolutional layers, two max-pooling layers and one fully connected layer. The second part of the proposed framework is a fully connected network that connects the concatenated outputs of the 1D-CNNs to obtain a final classification. The fully connected network consists of two fully connected layers and an output layer with one neuron for classifying data into PD and controls or five neurons to classify the PD data into five different stages. The proposed framework was able to achieve 98.7% accuracy for differentiating PD from controls and an accuracy of 85.3% to predict the UPDRS severity of subjects. In [44], Zeng et al. proposed to model the gait dynamics of 93 PD subjects and 73 controls via a Radial Basis Function (RBF) neural network. The proposed method achieved an overall accuracy of 96.7%.
Muniz et al. proposed the use of the performance of logistic regression, probabilistic neural network (PNN), and SVM in diagnosing PD when ground reaction force (GRF) was considered as the input and the effectiveness of PD treatments were compared [45]. The authors gathered data from 30 healthy controls and 15 PD patients using DBS-STN implants. Further, the authors observed that DBS-STM alone performed better than medication alone, with both used together providing the closest to normal gait. Further, SVM provided the best accuracy in discriminating PD subjects from controls (i.e., 94.6%).
Pfister et al. proposed a CNN to classify PD into three motor states (i.e., ON, OFF, Dyskinesia) using data collected from 30 patients from wearable sensors [46]. The data were gathered while the patients did day-to-day activities, and a movement disorder expert shadowed each patient to create annotations for the dataset (OFF, ON, DYS motor states). The CNN achieved a three-class accuracy of 0.654. Drotar et al. proposed the use of feature selection and SVM methods to distinguish between 37 PD patients and 38 controls based on handwriting movements [47]. It was demonstrated that the classification of in-air trajectories when the hand moves in air from one stroke to another outperforms the on-surface movements classification where computed accuracies were found to be 84% and 78%, respectively.
Eskofier et al. experimented with the use of state-of-the-art machine learning methods and CNN to classify inertial measurement unit data for 10 idiopathic PD patients in order to detect bradykinesia. The data were acquired using wearable sensors (i.e., accelerometers) attached to the right and left limbs of the patients [48]. It was shown that a 7-layer CNN outperformed the machine learning algorithms including SVM and KNN by at least 4.6% in terms of classification accuracy.
Ricci et al. used three machine learning frameworks including Naïve Bayes, SVM, and KNN to detect de novo PD based on wearable sensor data [49]. Data were collected by having participants perform various tasks while connected to the sensors. To identify statistically relevant motor features from the data, a t-test was performed to investigate the differences between PD and HC participants’ motor features. Spearman’s rank correlation coefficient was then computed to determine the correlation between clinical scores and the statistical features. A subset of 35 motor features was provided to the three machine learning methods. The best accuracy of 95% was achieved by the SVM method.
Talitckii et al. used several machine learning approaches including random forest, logistic regression, SVM, light GBM, and a stacked ensemble model to differentiate PD from other neurological disorders characterized by motor differences using wearable sensors [50]. The features were provided to the models in two sets: the tremor features alone, and the tremor and bradykinesia features. The best accuracy of 85% was achieved using both feature sets with accuracy dropping to 80% when the tremor features alone were used as an input to the machine learning models.
Pereira et al. created a data set called “HandPD” based on handwriting exams for 74 PD subjects and 18 controls [51]. Approximately 90% of the dataset was used for training Naive Bayes, Optimum-Path Forest, and SVM while 10% was used for testing the models in order to classify the subjects into PD or controls. Further, the authors developed a CNN architecture to classify the “HandPD” dataset into one of two categories (i.e., PD or Controls) [52] and meta-heuristic optimization techniques were used to fine tune the hyper-parameters. Classification accuracy was relatively improved (i.e., 90%) compared with their past work [51]. Moreover, Pereira et al. introduced several CNN architectures for classifying handwriting dynamics obtained from a smart pen equipped with a series of sensors for 224 PD patients and 84 controls [53]. The results obtained from the CNN architectures were compared with the raw data classified by baseline classification methods and showed to be very promising as the accuracy reached 95%.
In [54], Shaban investigated the use of a fine-tuned pre-trained VGG-19 to distinguish between PD and controls based on wave and spiral handwriting datasets. The proposed model achieved an elevated accuracy and sensitivity of over 88% and 86%, respectively. Figure 8 shows the spiral drawing created by a healthy control and a PD subject.
It is clear from Figure 8 that the spiral drawing made by a PD subject shows the motor symptom manifestation of the disease (i.e., tremor, muscle stiffness, and slowness of movement).
In [55], Naseer et al. proposed a deep learning approach based upon AlexNet deploying transfer learning, data augmentation, and freeze and fine-tuning to identify PD subjects based on handwriting data. This approach achieved an accuracy of 98.28% when applied on the PaHaW dataset collected from 36 PD subjects and 36 controls. In [56], Kamran et al. introduced a deep learning framework based upon fine-tuned pre-trained networks including AlexNet, GoogleNet, VGG-16, VGG-19, ResNet-50, and ResNet-101 along with the same models trained from scratch in order to classify subjects into controls and patients with PD. Multiple datasets including PaHaW, HandPD, NewHandPD, and Parkinson’s drawings were used in this study. Further, multiple data augmentation strategies were used such as flipping, rotation, illumination, contrast, and thresholding. The highest accuracy of 99.2% was achieved using the fine-tuned AlexNet on three different handwriting datasets. This represents an enhancement over the state-of-the-art methods.
Table 4 presents a summary of the machine and deep learning techniques used to exploit the handwriting and sensory data modality for PD diagnosis and staging.
From Table 4, we observe that almost the majority of the methods use deep learning techniques directly on sensory or handwriting data. The best performing technique with the highest accuracy of 99.2% was achieved by Kamran et al. and that may be justified due to the use of four different datasets and the adoption of various data augmentation techniques that have improved the convergence and accuracy of the fine-tuned CNN methods.
4. Current Trends and Limitations
In this paper, we have surveyed the state-of-the-art machine and deep learning techniques that have been proposed for PD diagnosis and screening, PD staging and grading, as well as biomarkers for disease identification.
As shown in Figure 9, it is clear that most of the related work invested in the detection of PD or classification of subjects into PD and healthy controls. Few works have addressed the identification of PD biomarkers as well as classification of PD into one of the five stages which have significant clinical implications and help further support the clinical diagnosis and progression monitoring of the disease.
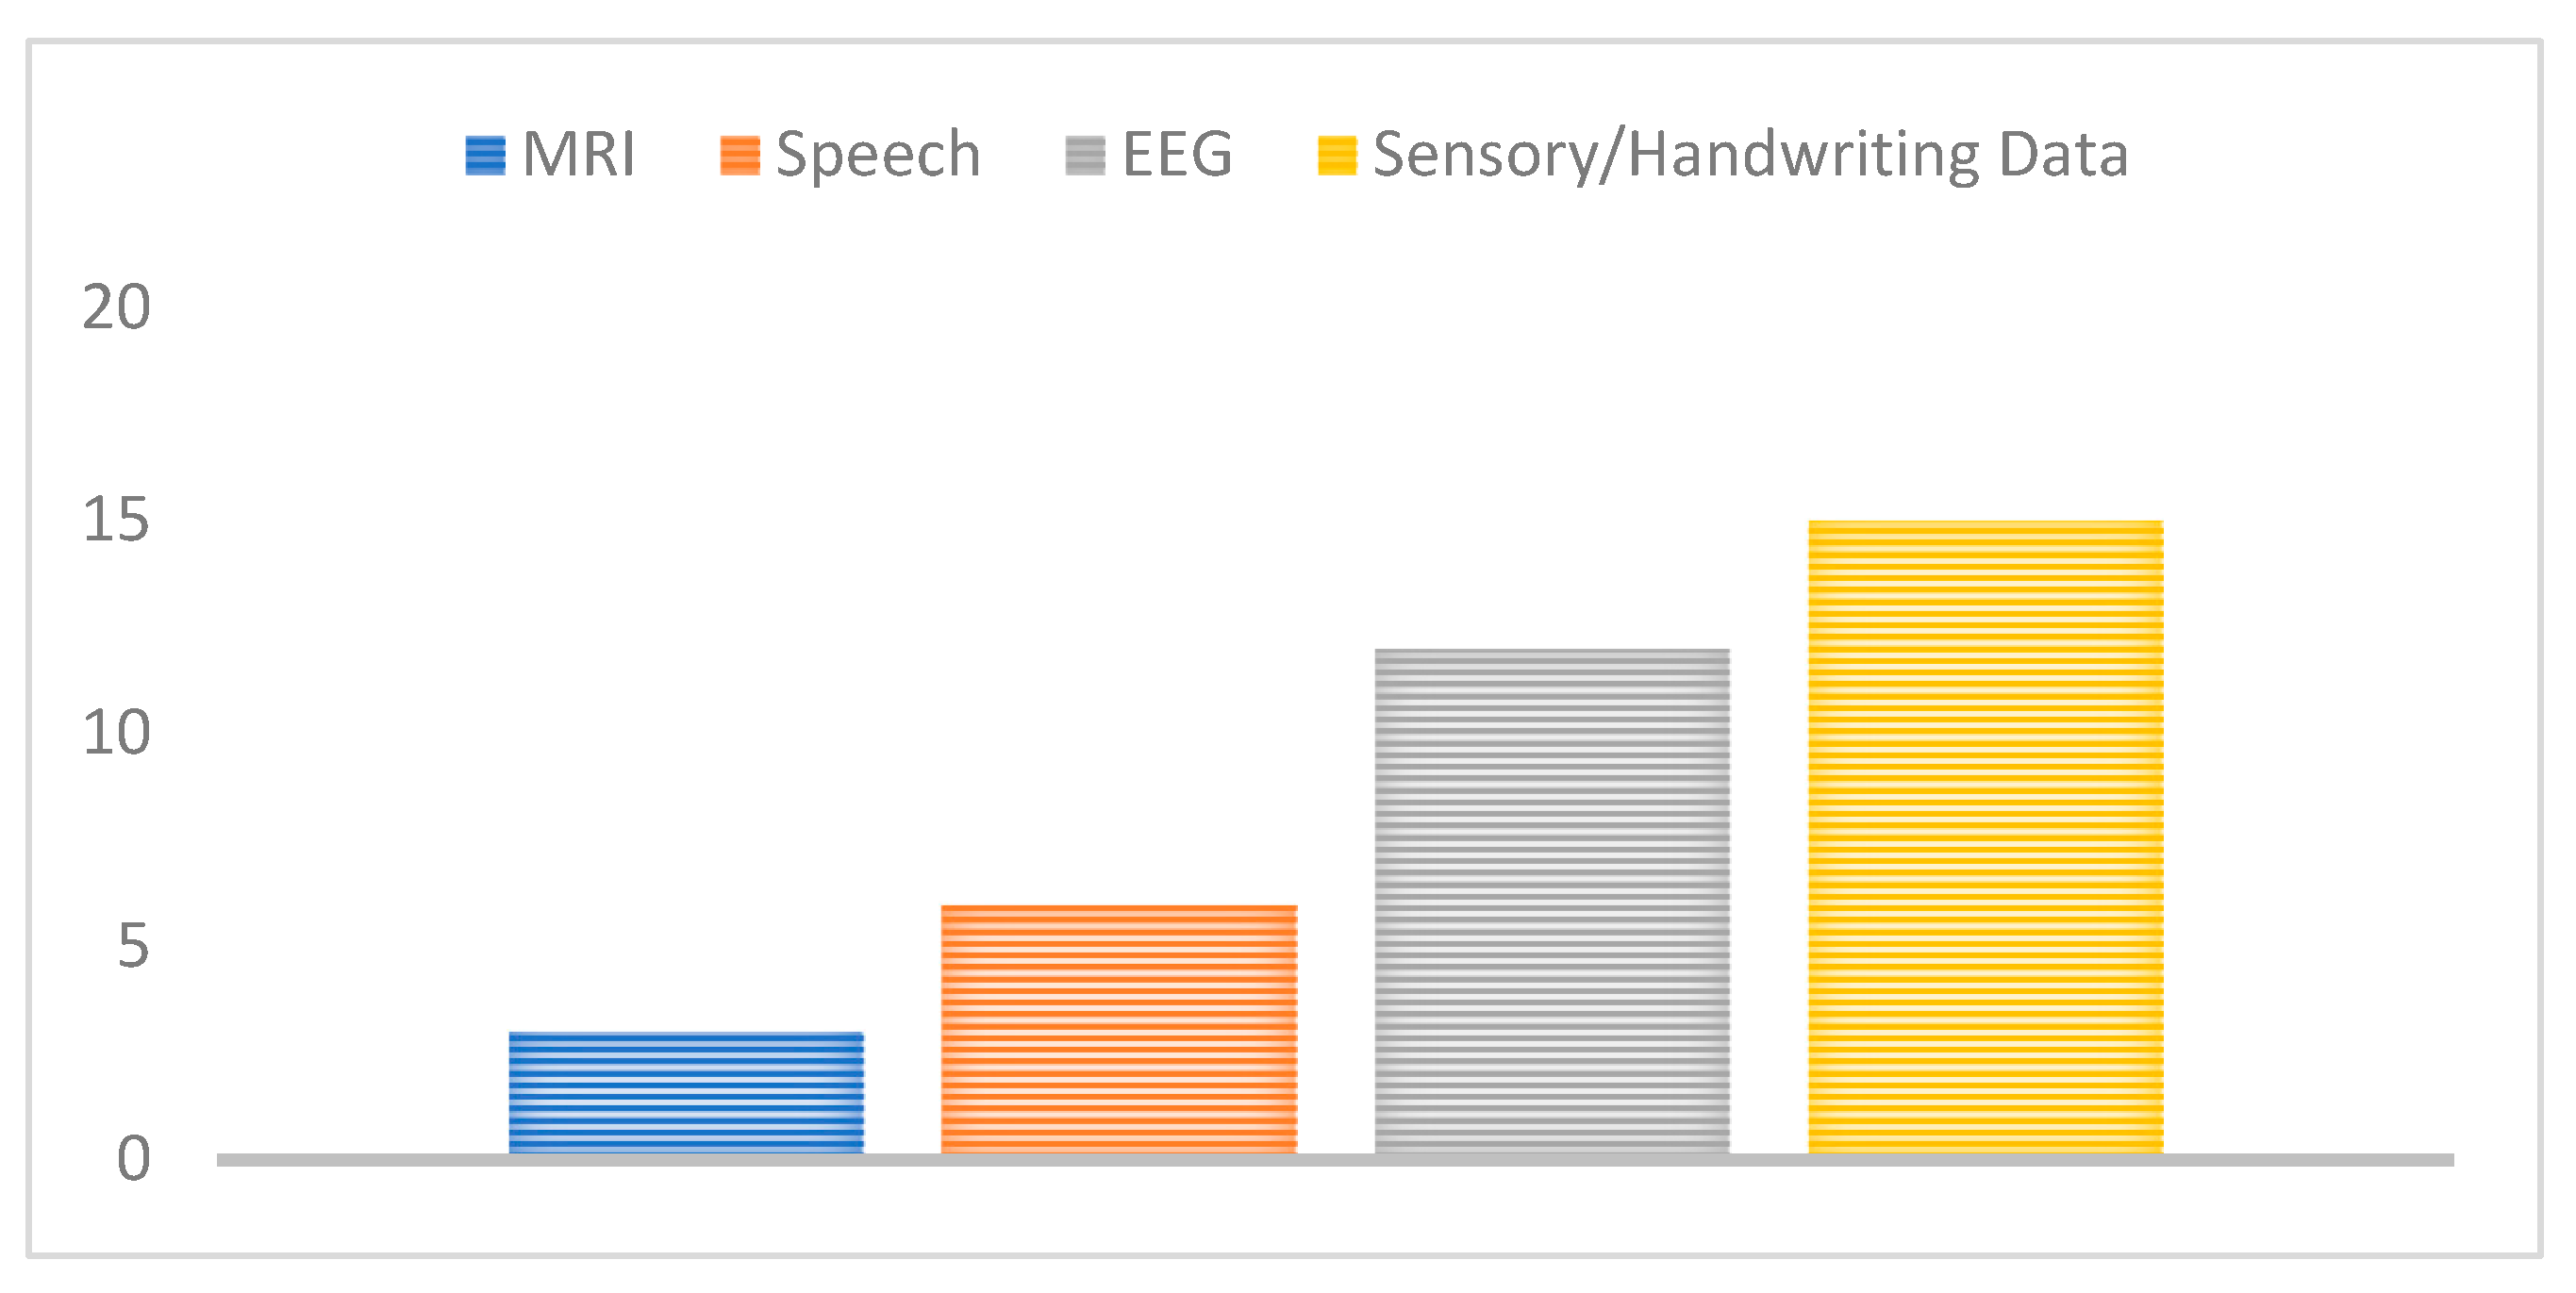
Further, datasets used for the detection and classification of PD have ranged from the EEG voltage signals to MRI scan images, handwriting images, and speech signals. We have therefore mapped the related work proposed to the used data type or modality in Figure 10, the majority of these studies have extensively used either EEG, or motion/sensory data to screen and diagnose PD. This may show a promising potential benefit for EEG and handwriting/sensory data to detect PD features and biomarkers, although they have not been clinically proven for disease diagnosis.
In addition, the majority of the adopted machine and deep learning techniques proposed in the literature were based on neural networks such as ANNs, CNNs, as well as typical machine learning methods including SVM and KNN as shown in Figure 11. This also shows the widespread and superior performance benefits of neural network technologies compared with traditional feature extraction and classification techniques where features are automatically extracted without any human intervention.
Although the state-of-the-art methods [20,21,22,23,24,25,26,27,28,29,30,31,32,33,34,35,36,37,38,39,40,41,42,43,44,45,46,47,48,49,50,51,52,53,54,55,56] are considered promising and have the potential to offer an objective and accurate diagnosis and staging of PD using machine and deep learning, the aforementioned techniques suffer several limitations as follows:
- The size and availability of Parkinson’s disease datasets are crucial for training generalized machine and deep learning models with minimal overfitting. EEG, MRI, handwriting, and speech datasets may include potential features and biomarkers of the disease. However, most of the aforementioned dataset modalities are limited in size restricting the generalizability and depth of the machine learning network required to avoid overfitting and guarantee regularization.
- Further, most of the dataset modalities that have been used for testing deep and machine learning approaches are not used by clinicians for appropriate clinical diagnosis and disease staging. It is known that the observation of the motor symptoms of the disease, the use of UPDRS scales, and DatScan imaging are the adopted tools to confirm the diagnosis of PD.
- The task of classifying subjects into PD and healthy controls or classifying PD into one of the five stages is important and useful to support clinicians and provide an objective diagnosis based on a huge number of samples that have been graded by a large pool of experts. However, it is also crucial to visualize, interpret, and explain the different features captured by the different layers of the machine or deep learning models. Further, understanding which samples or batches of samples are significant in the diagnosis and the model classification decision helps in understanding the nature of the disease. Providing a prediction along with an explanation will be more convincing to the medical community and provides more confidence in the tools.
- The availability and accuracy of the annotations provided by medical experts based on different datasets and modalities is an important factor for the successful training of supervised deep learning models. However, this may not be feasible and cost inefficient especially for large and diverse datasets.
- Merging and fusing the decisions and predictions created by different deep learning methods applied on different dataset modalities has promise and may provide further accurate and sensitive diagnostic recommendations compared with human graders. Clinicians usually use different diagnostic biomarkers to come up with a medical opinion. Further, PD is a complex disease that affects different patient activities such as sleep, speech, motion, and mood. Therefore, the use of machine or deep learning techniques on a single modality may not be sufficient to support the clinician’s diagnosis and may not be medically acceptable and convincing.
- PD is a neurodegenerative disorder where symptoms arise when most of the nerve cells in the brain are damaged; at this point the use of therapeutic treatments may not be effective and the quality of life for patients may be severely lowered. Yet, most of the available online datasets were captured from clinically diagnosed patients with symptoms, hence the use of the recently proposed works may not be helpful. The search for new data modalities and tools that may reveal early biomarkers for the disease will be promising and beneficial. This will require coordination between artificial intelligence researchers and medical professionals to find and test new models on prospective dataset types that have been shown to reveal early biomarkers of the disease.
5. Future Trends
Patients with PD frequently experience sleep disorders, including insomnia, rapid eye movement (REM) sleep behavior disorder (RBD), and excessive daytime sleepiness [57,58]. In addition, PD is characterized by alterations in sleep architecture, including reductions in REM sleep [58] which plays a vital role in consolidating procedural memory and motor skills [59]. Recent studies have shown that both REM and non-REM (NREM) sleep exhibit unique features in PD and PD with dementia compared to healthy controls (HC), including lower stability, higher slowing ratio, an increase in spectral power in the δ (1–4 Hz) and θ (4–8 Hz) bands during REM, as well as lower baseline power in σ waves (12–15 Hz) within the parietal regions during the NREM sleep stages [60,61,62,63,64]. Since patients with PD have both cognitive and motor dysfunction, alterations in sleep stages have potential clinical implications. Mild Cognitive Impairment (MCI), which is a non-motor complication of PD, can involve visual or spatial dysfunction, executive dysfunction, or other neurological disorders that may occur with or without memory loss. In addition, cognitive impairment has been related to disease morbidity, significant burden on caregivers, social and working impairment, placement at long-term care facilities, and mortality [65]. There are currently no established biomarkers or effective treatments for cognitive impairment, but earlier identification of impairment may allow earlier intervention which is urgently needed to improve the prognosis of the disease. Further, few rigorous studies have been conducted to address the challenges of identifying cognitive dysfunction biomarkers for PD from sleep EEGs [61]. However, the use of machine and deep learning for the detection of PD-MCI or the prediction of the risk of progression to MCI and the identification of the disease biomarkers in sleep EEGs have not been previously addressed and would support the early diagnosis of the disease or at least assist clinicians in monitoring the disease progression.
Although the progress in machine and deep learning-based PD diagnosis is promising, the exploitation of other clinical based modalities including DaTscan and sleep EEGs will provide more insights on the disease as well as its biomarkers which can be identified using artificial intelligence techniques including class activation mapping (CAM) [66], gradient-weighted class activation mapping (Grad-CAM) [67], integrated gradients [68], and explainable AI through regions (XRAI) [69].
Using innovative data augmentation techniques as well as the use and generation of synthetic data may reduce the costs related to the acquisition and collection of the medical data related to PD including speech signals, EEG voltage signals, and sensory data for the patients, ensuring further privacy and expediting the use and deployment of machine and deep learning for PD image analysis and applications.
Finally, we believe that machine and deep learning models need to be tested in a clinical setting. Additionally, AI researchers should seek feedback and scientific opinion from clinicians regarding the features and patterns identified by the models and their relevance to the biology of the disease. AI can not only be useful for classification and segmentation purposes, but also can provide new knowledge related to PD biomarkers, its progression risk factors, and therapeutic treatment response and efficacy.
6. Conclusions
In this paper, we have presented the state-of-the-art machine and deep learning techniques that were proposed during the period from 2016 to 2022. The main focus of this study was to highlight the main trends, the major machine and deep learning methods adopted, the PD data modalities used, as well as the objectives and the aims of the state-of-the-art works. It is clear from this survey that the most widely used machine and deep learning techniques were neural networks and that is mainly due to their improved performance (defined by the accuracy or the AUC of the ROC curve) with respect to other standard machine learning methods as well as their ability to extract features in an automated fashion. In addition, we have also found that sensory, handwriting, and EEG data have been the most exploited data modalities for the identification of unique and discriminative features of PD. Most of the presented studies addressed a binary problem aiming at the screening and classification of subjects into controls and PD. Few works have addressed the categorical problem of the staging of PD or the more useful and challenging problem being sought after by clinicians and scientists which is the identification of the features and early biomarkers of PD.
We have further presented the limitations of those studies including the limited size of the datasets used for training and testing the models. This is usually because the number of recruited subjects in clinical and experimental trials for PD is relatively low. In addition, the inter-reader variability and the disagreements among clinicians in the diagnosis of PD may influence the accuracy of the machine and deep learning frameworks. Further, most of the available dataset modalities have not yet been used for the clinical diagnosis of the disease or are useful for the early diagnosis of PD as the datasets were usually collected for patients with confirmed diagnoses when the disease has almost progressed and the motor symptoms have arisen. It would be beneficial to identify the current clinical datasets that are currently adopted in and may support the clinical diagnosis of the disease such as DaTscan or to exploit dataset modalities including sleep EEGs that may assist in a potential early identification of the biomarkers of PD and its complications including MCI and dementia.
Funding
This research received no external funding.
Institutional Review Board Statement
Not applicable.
Informed Consent Statement
Not applicable.
Data Availability Statement
All data were presented in main text.
Conflicts of Interest
The authors declare no conflict of interest.
References
- Dauer, W.; Przedborski, S. Parkinson’s Disease: Mechanisms and Models. Neuron 2003, 39, 889–909. [Google Scholar] [CrossRef] [PubMed] [Green Version]
- Perlmutter, J.S. Assessment of Parkinson Disease Manifestations. Curr. Protoc. Neurosci. 2009, 49, 10.1.1–10.1.14. [Google Scholar] [CrossRef] [Green Version]
- Rizzo, G.; Copetti, M.; Arcuti, S.; Martino, D.; Fontana, A.; Logroscino, G. Accuracy of clinical diagnosis of Parkinson disease. Neurology 2016, 86, 566–576. [Google Scholar] [CrossRef] [PubMed]
- Cortes, C.; Vapnik, V. Support-vector networks. Mach. Learn. 1995, 20, 273–297. [Google Scholar] [CrossRef]
- Safavian, S.; Landgrebe, D. A survey of decision tree classifier methodology. IEEE Trans. Syst. Man Cybern. 1991, 21, 660–674. [Google Scholar] [CrossRef] [Green Version]
- Hassoun, M. Fundamentals of Artificial Neural Networks. Proc. IEEE 1996, 84, 906. [Google Scholar] [CrossRef]
- LeCun, Y.; Boser, B.; Denker, J.S.; Henderson, D.; Howard, R.E.; Hubbard, W.; Jackel, L.D. Backpropagation Applied to Handwritten Zip Code Recognition. Neural Comput. 1989, 1, 541–551. [Google Scholar] [CrossRef]
- Krizhevsky, A.; Sutskever, I.; Hinton, G.E. ImageNet Classification with Deep Convolutional Neural Net-works. Adv. Neural Inf. Process. Syst. 2012, 25, 1097–1105. Available online: https://papers.nips.cc/paper/2012/hash/c399862d3b9d6b76c8436e924a68c45b-Abstract.html (accessed on 12 February 2021).
- Szegedy, C.; Liu, W.; Jia, Y.; Sermanet, P.; Reed, S.; Anguelov, D.; Erhan, D.; Vanhoucke, V.; Rabinovich, A.; Liu, W.; et al. Going deeper with convolutions. arXiv 2014, arXiv:1409.4842. [Google Scholar] [CrossRef] [Green Version]
- Simonyan, K.; Zisserman, A. Very Deep Convolutional Networks for Large-Scale Image Recognition. arXiv 2014, arXiv:1409.1556. [Google Scholar]
- He, K.; Zhang, X.; Ren, S.; Sun, J. Deep residual learning for image recognition. arXiv 2015, arXiv:1512.03385. [Google Scholar] [CrossRef] [Green Version]
- Rumelhart, D.E.; Hinton, G.E.; Williams, R.J. Learning representations by back-propagating errors. Nature 1986, 323, 533–536. [Google Scholar] [CrossRef]
- Likas, A.; Vlassis, N.; Verbeek, J.J. The global k-means clustering algorithm. Pattern Recognit. 2003, 36, 451–461. [Google Scholar] [CrossRef] [Green Version]
- Vincent, P.; LaRochelle, H.; Bengio, Y.; Manzagol, P.-A. Extracting and composing robust features with denoising autoencoders. In Proceedings of the 25th International Conference on Machine Learning, Helsinki, Finland, 5–9 July 2008; pp. 1096–1103. [Google Scholar]
- Larochelle, H.; Erhan, D.; Courville, A.; Bergstra, J.; Bengio, Y. An empirical evaluation of deep architectures on problems with many factors of variation. In Proceedings of the 24th International Conference on Machine Learning, Corvalis, OR, USA, 20–24 June 2007; pp. 473–480. [Google Scholar]
- Kohonen, T. The self-organizing map. Neurocomputing 1998, 21, 1–6. [Google Scholar] [CrossRef]
- Loh, H.W.; Hong, W.; Ooi, C.P.; Chakraborty, S.; Barua, P.D.; Deo, R.C.; Soar, J.; Palmer, E.E.; Acharya, U.R. Application of Deep Learning Models for Automated Identification of Parkinson’s Disease: A Review (2011–2021). Sensors 2021, 21, 7034. [Google Scholar] [CrossRef]
- Maitín, A.; García-Tejedor, A.; Muñoz, J. Machine Learning Approaches for Detecting Parkinson’s Disease from EEG Analysis: A Systematic Review. Appl. Sci. 2020, 10, 8662. [Google Scholar] [CrossRef]
- Mei, J.; Desrosiers, C.; Frasnelli, J. Machine Learning for the Diagnosis of Parkinson’s Disease: A Review of Literature. Front. Aging Neurosci. 2021, 13, 633752. [Google Scholar] [CrossRef]
- Vanegas, M.I.; Ghilardi, M.F.; Kelly, S.P.; Blangero, A. Machine learning for EEG-based biomarkers in Parkinson’s disease. In Proceedings of the 2018 IEEE International Conference on Bioinformatics and Biomedicine (BIBM), Madrid, Spain, 3–6 December 2018; pp. 2661–2665. [Google Scholar] [CrossRef]
- Oh, S.L.; Hagiwara, Y.; Raghavendra, U.; Yuvaraj, R.; Arunkumar, N.; Murugappan, M.; Acharya, U.R. A deep learning approach for Parkinson’s disease diagnosis from EEG signals. Neural Comput. Appl. 2018, 32, 10927–10933. [Google Scholar] [CrossRef]
- Wagh, N.; Varatharajah, Y. EEG-GCNN: Augmenting Electroencephalogram-Based Neurological Disease Diagnosis Using a Domain-Guided Graph Convolutional Neural Network. Proc. Mach. Learn. Res. 2020, 136, 367–378. [Google Scholar]
- Koch, M.; Geraedts, V.; Wang, H.; Tannemaat, M.; Back, T. Automated Machine Learning for EEG-Based Classification of Parkinson’s Disease Patients. In Proceedings of the 2019 IEEE International Conference on Big Data (Big Data), Los Angeles, CA, USA, 9–12 December 2019; pp. 4845–4852. [Google Scholar]
- Shi, X.; Wang, T.; Wang, L.; Liu, H.; Yan, N. Hybrid Convolutional Recurrent Neural Networks Outperform CNN and RNN in Task-state EEG Detection for Parkinson’s Disease. In Proceedings of the 2019 Asia-Pacific Signal and Information Processing Association Annual Summit and Conference (APSIPA ASC), Lanzhou, China, 18–21 November 2019. [Google Scholar]
- Lee, S.; Hussein, R.; McKeown, M.J. A Deep Convolutional-Recurrent Neural Network Architecture for Parkinson’s Disease EEG Classification. In Proceedings of the 2019 IEEE Global Conference on Signal and Information Processing (GlobalSIP), Ottawa, ONT, Canada, 11–14 November 2019. [Google Scholar]
- Khare, S.K.; Bajaj, V.; Acharya, U.R. Detection of Parkinson’s disease using automated tunable Q wavelet transform technique with EEG signals. Biocybern. Biomed. Eng. 2021, 41, 679–689. [Google Scholar] [CrossRef]
- Khare, S.K.; Bajaj, V.; Acharya, U.R. PDCNNet: An Automatic Framework for the Detection of Parkinson’s Disease Using EEG Signals. IEEE Sens. J. 2021, 21, 17017–17024. [Google Scholar] [CrossRef]
- Loh, H.; Ooi, C.; Palmer, E.; Barua, P.; Dogan, S.; Tuncer, T.; Baygin, M.; Acharya, U. GaborPDNet: Gabor Transformation and Deep Neural Network for Parkinson’s Disease Detection Using EEG Signals. Electronics 2021, 10, 1740. [Google Scholar] [CrossRef]
- Shaban, M. Automated Screening of Parkinson’s Disease Using Deep Learning Based Electroencephalography. In Proceedings of the 2021 10th International IEEE/EMBS Conference on Neural Engineering (NER), Virtual Event, Italy, 4–6 May 2021. [Google Scholar] [CrossRef]
- Cahoon, S.; Khan, F.; Polk, M.; Shaban, M. Wavelet-Based Convolutional Neural Network for Parkinson’s Disease Detection in Resting-State Electroencephalography. In Proceedings of the 2021 IEEE Signal Processing in Medicine and Biology Symposium (SPMB), Philadelphia, PA, USA, 4 December 2021. [Google Scholar] [CrossRef]
- Shaban, M.; Amara, A.W. Resting-state electroencephalography based deep-learning for the detection of Parkinson’s disease. PLoS ONE 2022, 17, e0263159. [Google Scholar] [CrossRef]
- Shaban, M.; Cahoon, S.; Khan, F.; Polk, M. Exploiting the Differential Wavelet Domain of Resting-State EEG Using a Deep-CNN for Screening Parkinson’s Disease. In Proceedings of the 2021 IEEE Symposium Series on Computational Intelligence (SSCI), Orlando, FL, USA, 5–7 December 2021. [Google Scholar] [CrossRef]
- Zhang, X.; Yang, Y.; Wang, H.; Ning, S.; Wang, H. Deep Neural Networks with Broad Views for Parkinson’s Disease Screening. In Proceedings of the 2019 IEEE International Conference on Bioinformatics and Biomedicine (BIBM), San Diego, CA, USA, 18–21 November 2019. [Google Scholar]
- Ramirez, V.M.; Kmetzsch, V.; Forbes, F.; Dojat, M. Deep Learning Models to Study the Early Stages of Parkinson’s Disease. In Proceedings of the 2020 IEEE 17th International Symposium on Biomedical Imaging (ISBI), Iowa City, IA, USA, 3–7 April 2020. [Google Scholar]
- Prasuhn, J.; Heldmann, M.; Münte, T.F.; Brüggemann, N. A machine learning-based classification approach on Parkinson’s disease diffusion tensor imaging datasets. Neurol. Res. Pract. 2020, 2, 46. [Google Scholar] [CrossRef]
- Frid, A.; Kantor, A.; Svechin, D.; Manevitz, L.M. Diagnosis of Parkinson’s disease from continuous speech using deep convolutional networks without manual selection of features. In Proceedings of the 2016 IEEE International Conference on the Science of Electrical Engineering (ICSEE), Eilat, Israel, 16–18 November 2016. [Google Scholar] [CrossRef]
- Tsanas, A.; Little, M.A.; McSharry, P.E.; Ramig, L.O. Accurate telemonitoring of Parkinson’s disease progression by non-invasive speech tests. Nat. Preced. 2009, 57, 884–893. [Google Scholar] [CrossRef]
- Rasheed, J.; Hameed, A.A.; Ajlouni, N.; Jamil, A.; Ozyavas, A.; Orman, Z. Application of Adaptive Back-Propagation Neural Networks for Parkinson’s Disease Prediction. In Proceedings of the 2020 International Conference on Data Analytics for Business and Industry: Way Towards a Sustainable Economy (ICDABI), Sakhir, Bahrain, 26–27 October 2020. [Google Scholar] [CrossRef]
- Gunduz, H. Deep Learning-Based Parkinson’s Disease Classification Using Vocal Feature Sets. IEEE Access 2019, 7, 115540–115551. [Google Scholar] [CrossRef]
- Karabayir, I.; Goldman, S.M.; Pappu, S.; Akbilgic, O. Gradient boosting for Parkinson’s disease diagnosis from voice recordings. BMC Med. Inform. Decis. Mak. 2020, 20, 228. [Google Scholar] [CrossRef]
- Zhang, Y.N. Can a Smartphone Diagnose Parkinson Disease? A Deep Neural Network Method and Telediagnosis System Implementation. Park. Dis. 2017, 2017, 6209703. [Google Scholar] [CrossRef] [PubMed] [Green Version]
- Moon, S.; Song, H.-J.; Sharma, V.D.; Lyons, K.E.; Pahwa, R.; Akinwuntan, A.E.; Devos, H. Classification of Parkinson’s disease and essential tremor based on balance and gait characteristics from wearable motion sensors via machine learning techniques: A data-driven approach. J. Neuroeng. Rehabil. 2020, 17, 125. [Google Scholar] [CrossRef] [PubMed]
- El Maachi, I.; Bilodeau, G.-A.; Bouachir, W. Deep 1D-Convnet for accurate Parkinson disease detection and severity prediction from gait. Expert Syst. Appl. 2019, 143, 113075. [Google Scholar] [CrossRef]
- Zeng, W.; Liu, F.; Wang, Q.; Wang, Y.; Ma, L.; Zhang, Y. Parkinson’s disease classification using gait analysis via deterministic learning. Neurosci. Lett. 2016, 633, 268–278. [Google Scholar] [CrossRef] [PubMed]
- Muniz, A.; Liu, H.; Lyons, K.; Pahwa, R.; Liu, W.; Nobre, F.; Nadal, J. Comparison among probabilistic neural network, support vector machine and logistic regression for evaluating the effect of subthalamic stimulation in Parkinson disease on ground reaction force during gait. J. Biomech. 2010, 43, 720–726. [Google Scholar] [CrossRef]
- Pfister, F.M.J.; Um, T.T.; Pichler, D.C.; Goschenhofer, J.; Abedinpour, K.; Lang, M.; Endo, S.; Ceballos-Baumann, A.O.; Hirche, S.; Bischl, B.; et al. High-Resolution Motor State Detection in Parkinson’s Disease Using Convolutional Neural Networks. Sci. Rep. 2020, 10, 5860. [Google Scholar] [CrossRef] [PubMed] [Green Version]
- Drotár, P.; Mekyska, J.; Rektorová, I.; Masarová, L.; Smékal, Z.; Faundez-Zanuy, M. Analysis of in-air movement in handwriting: A novel marker for Parkinson’s disease. Comput. Methods Programs Biomed. 2014, 117, 405–411. [Google Scholar] [CrossRef]
- Eskofier, B.M.; Lee, S.I.; Daneault, J.-F.; Golabchi, F.N.; Ferreira-Carvalho, G.; Vergara-Diaz, G.; Sapienza, S.; Costante, G.; Klucken, J.; Kautz, T.; et al. Recent machine learning advancements in sensor-based mobility analysis: Deep learning for Parkinson’s disease assessment. In Proceedings of the 2016 38th Annual International Conference of the IEEE Engineering in Medicine and Biology Society (EMBC), Orlando, FL, USA, 16–20 August 2016. [Google Scholar] [CrossRef]
- Ricci, M.; Di Lazzaro, G.; Pisani, A.; Mercuri, N.B.; Giannini, F.; Saggio, G. Assessment of Motor Impairments in Early Untreated Parkinson’s Disease Patients: The Wearable Electronics Impact. IEEE J. Biomed. Health Inform. 2019, 24, 120–130. [Google Scholar] [CrossRef] [PubMed]
- Talitckii, A.; Kovalenko, E.; Anikina, A.; Zimniakova, O.; Semenov, M.; Bril, E.; Shcherbak, A.; Dylov, D.V.; Somov, A. Avoiding Misdiagnosis of Parkinson’s Disease with the Use of Wearable Sensors and Artificial Intelligence. IEEE Sens. J. 2020, 21, 3738–3747. [Google Scholar] [CrossRef]
- Pereira, C.R.; Pereira, D.R.; da Silva, F.A.; Hook, C.; Weber, S.A.; Pereira, L.A.; Papa, J.P. A Step Towards the Automated Diagnosis of Parkinson’s Disease: Analyzing Handwriting Movements. In Proceedings of the 2015 IEEE 28th International Symposium on Computer-Based Medical Systems, Sao Carlos, Brazil, 22–25 June 2015. [Google Scholar] [CrossRef]
- Pereira, C.R.; Pereira, D.R.; Papa, J.P.; Rosa, G.H.; Yang, X.-S. Convolutional Neural Networks Applied for Parkinson’s Disease Identification. Lect. Notes Comput. Sci. 2016, 9605, 377–390. [Google Scholar] [CrossRef]
- Pereira, C.R.; Pereira, D.R.; Rosa, G.H.; Albuquerque, V.H.; Weber, S.A.; Hook, C.; Papa, J.P. Handwritten dynamics assessment through convolutional neural networks: An application to Parkinson’s disease identification. Artif. Intell. Med. 2018, 87, 67–77. [Google Scholar] [CrossRef] [Green Version]
- Shaban, M. Deep Convolutional Neural Network for Parkinson’s Disease Based Handwriting Screening. In Proceedings of the 2020 IEEE 17th International Symposium on Biomedical Imaging Workshops (ISBI Workshops), Iowa City, IA, USA, 4 April 2020. [Google Scholar]
- Naseer, A.; Rani, M.; Naz, S.; Razzak, M.I.; Imran, M.; Xu, G. Refining Parkinson’s neurological disorder identification through deep transfer learning. Neural Comput. Appl. 2020, 32, 839–854. [Google Scholar] [CrossRef] [Green Version]
- Kamran, I.; Naz, S.; Razzak, I.; Imran, M. Handwriting dynamics assessment using deep neural network for early identification of Parkinson’s disease. Futur. Gener. Comput. Syst. 2021, 117, 234–244. [Google Scholar] [CrossRef]
- Chahine, L.M.; Amara, A.W.; Videnovic, A. A systematic review of the literature on disorders of sleep and wakefulness in Parkinson’s disease from 2005 to 2015. Sleep Med. Rev. 2017, 35, 33–50. [Google Scholar] [CrossRef] [PubMed]
- Aygun, D. Sleep Disorders in Parkinson’s Disease in Parkinson’s Disease—Understanding Pathophysiology and Developing Therapeutic Strategies; Intechopen: London, UK, 2018. [Google Scholar]
- Sara, S. Sleep to Remember. J. Neurosci. 2017, 37, 457–463. [Google Scholar] [CrossRef] [PubMed] [Green Version]
- Wetter, T.C.; Brunner, H.; Högl, B.; Yassouridis, A.; Trenkwalder, C.; Friess, E. Increased alpha activity in REM sleep in de novo patients with Parkinson’s disease. Mov. Disord. 2001, 16, 928–933. [Google Scholar] [CrossRef] [PubMed]
- Latreille, V.; Carrier, J.; Gaudet-Fex, B.; Rodrigues-Brazete, J.; Panisset, M.; Chouinard, S.; Postuma, R.B.; Gagnon, J.F. Electroencephalo-graphic prodromal markers of dementia across conscious states in Parkinson’s disease. Brain 2016, 139, 1189–1199. [Google Scholar] [CrossRef] [Green Version]
- Christensen, J.A.; Kempfner, J.; Zoetmulder, M.; Leonthin, H.L.; Arvastson, L.; Christensen, S.R.; Sorensen, H.B.; Jennum, P. Decreased sleep spindle density in patients with idiopathic REM sleep behavior disorder and patients with Parkinson’s disease. Clin. Neurophysiol. 2014, 125, 512–519. [Google Scholar] [CrossRef] [PubMed]
- Latreille, V.; Carrier, J.; Lafortune, M.; Postuma, R.B.; Bertrand, J.A.; Panisset, M.; Chouinard, S.; Gagnon, J.F. Sleep spindles in Parkinson’s disease may predict the development of dementia. Neurobiol. Aging 2015, 36, 1083–1090. [Google Scholar] [CrossRef]
- Christensen, J.A.E.; Jennum, P.; Koch, H.; Frandsen, R.; Zoetmulder, M.; Arvastson, L.; Christensen, S.R.; Sorensen, H.B.D. Sleep stability and transitions in patients with idiopathic REM sleep behavior disorder and patients with Parkinson’s disease. Clin. Neurophysiol. 2016, 127, 537–543. [Google Scholar] [CrossRef] [Green Version]
- Watson, G.S.; Leverenz, J.B. Profile of Cognitive Impairment in Parkinson’s Disease. Brain Pathol. 2010, 20, 640–645. [Google Scholar] [CrossRef] [Green Version]
- Zhou, B.; Khosla, A.; Lapedriza, A.; Oliva, A.; Torralba, A. Learning deep features for discriminative localization. arXiv 2015, arXiv:1512.04150. [Google Scholar]
- Selvaraju, R.R.; Cogswell, M.; Das, A.; Vedantam, R.; Parikh, D.; Batra, D. Grad-CAM: Visual Explanations from Deep Networks via Gradient-Based Localization. Int. J. Comput. Vis. 2020, 128, 336–359. [Google Scholar] [CrossRef] [Green Version]
- Sundararajan, M.; Taly, A.; Yan, Q. Axiomatic Attribution for Deep Networks. arXiv 2017, arXiv:1703.01365. [Google Scholar]
- Kapishnikov, A.; Bolukbasi, T.; Viegas, F.; Terry, M. XRAI: Better Attributions Through Regions. arXiv 2019, arXiv:1906.02825. [Google Scholar] [CrossRef] [Green Version]
Figure 1.
An example of an ANN.

Figure 2.
An example of a CNN.

Figure 3.
An RNN where the decision of the nodes in the output layer depends on the internal state of the hidden nodes.
Figure 3.
An RNN where the decision of the nodes in the output layer depends on the internal state of the hidden nodes.

Figure 4.
The encoder–decoder structure of an autoencoder.

Figure 5.
Taxonomy of the related work representing the main applications as well as the main modalities used for each application.
Figure 5.
Taxonomy of the related work representing the main applications as well as the main modalities used for each application.

Figure 6.
Scalogram for an EEG signal captured for (a) a healthy control (b) a PD subject.

Figure 7.
Two views of AXI SWI MRI images for a male PD patient.

Figure 8.
Spiral drawings from (a) a healthy control (b) a PD subject.

Figure 9.
Number of studies for each PD challenge considered.

Figure 10.
Number of studies for each data type used.

Figure 11.
Number of studies for each deep learning technique adopted.


Table 1.
A summary of the state-of-the-art machine and deep learning methods applied on the EEG dataset modality for PD diagnosis and biomarker identification.
Table 1.
A summary of the state-of-the-art machine and deep learning methods applied on the EEG dataset modality for PD diagnosis and biomarker identification.
| Method | Main Objective | Dataset | Machine/Deep Learning | Performance | Limitations |
|---|---|---|---|---|---|
| Vanegas et al. [20] | PD Biomarkers Identification | EEG (29 PD and 30 Controls) | Extra Tree, Logistic Regression, Decision Tree | AUC: 99.4%, 94.9%, 86.2% | Small dataset, need for visual stimulation for subjects to achieve best results |
| Oh et al. [21] | PD Detection | EEG (20 PD and 20 Controls) | 13-Layer CNN | Accuracy: 88.25% | Small dataset, limited performance |
| Wagh et al. [22] | Detection of Neurological Diseases including PD | EEG (1385 Diseased and 208 Healthy Subjects) | 8-Layer Graph CNN | AUC: 90% | Not specific to PD detection, dataset recorded using different systems and under different conditions |
| Koch et al. [23] | PD Cognition Level Detection | EEG (20 Good Cognition and 20 Poor Cognition) | Random Forest | AUC: 91% | Small dataset, need for manual feature extraction |
| Shi et al. [24] | PD Detection | EEG (40 PD and 30 Controls) | Two- and Three-Dimensional CNN–RNN | Accuracy: 81%, 83% | Model complexity, limited performance |
| Lee et al. [25] | PD Detection | EEG (20 PD and 22 Controls) | CNN–LSTM | Accuracy: 97% | Model complexity, small dataset |
| Khare et al. [26,27] | PD Detection | EEG (35 PD and 36 Controls) | Tunable Q-factor Based LSSVM, SPWVD-Based CNN | Accuracy: 97.7%, 99.5% | Model complexity, small dataset |
| Loh et al. [28] | PD Detection | EEG (15 PD and 16 Controls) | Gabor-Transform-Based 8-Layer CNN | Accuracy: 99.5% | Model complexity, small dataset |
| Shaban et al. [29,30,31,32] | PD Detection | EEG (15 PD and 16 Controls) | 13-Layer ANN, Wavelet-Based 12-Layer CNN | Accuracy: 98%, 99.9%, 99.9% | Model complexity, small dataset |
Table 2.
A summary of the-state-of-the-art machine and deep learning methods applied on MRI dataset modality for PD diagnosis and identification.
Table 2.
A summary of the-state-of-the-art machine and deep learning methods applied on MRI dataset modality for PD diagnosis and identification.
| Method | Main Objective | Dataset | Machine/Deep Learning | Performance | Limitations |
|---|---|---|---|---|---|
| Zhang et al. [33] | Prodromal PD Detection | 102 AXI/SAG MRI | WGAN/ResNeXt | Accuracy: 76.5% | Limited performance, complexity of approach |
| Ramirez et al. [34] | De Novo PD Detection | DTI MRI (129 de novo PD and 57 Controls) | Convolutional Autoencoder | AUC: 83% | Limited performance, small dataset |
| Prasuhn et al. [35] | PD Detection | DTI MRI (162 PD and 70 Controls) | bSVM, MKL | AUC: 58%, 60% | Low performance |
Table 3.
A summary of the state-of-the-art machine and deep learning methods applied on speech dataset modality for PD diagnosis and staging.
Table 3.
A summary of the state-of-the-art machine and deep learning methods applied on speech dataset modality for PD diagnosis and staging.
| Method | Main Objective | Dataset | Machine/Deep Learning | Performance | Limitations |
|---|---|---|---|---|---|
| Frid et al. [36] | PD Detection and Staging | Speech data (43 PD and 9 Controls) | 4-Layer CNN | Maximum Accuracy: 85% | Small dataset |
| Tsanas et al. [37] | PD Detection | Tele-monitoring Data (33 PD, 10 Controls) | SVM, Random Forest | Accuracy: 99% | Small dataset, subjective UPDRS staging |
| Rasheed et al. [38] | De Novo PD Detection | Voice data (23 PD, 8 Controls) | BPVAM | Accuracy: 97.5% | Small dataset, classification delay |
| Gunduz et al. [39] | PD Detection | Speech data (188 PD, 64 Controls) | 9-Layer CNN, 2 Conv Layer–1 Merge Layer–10 Layer CNN | Accuracy: 84.5%, 86.8% | Limited performance, computationally complex |
| Karabayir et al. [40] | PD Detection | Speech data (40 PD, 40 Controls) | GB, Extreme GB | Accuracy: 82% | Limited performance, small dataset |
| Zhang et al. [41] | PD Diagnosis | Speech Data (Oxford: 23 PD, 8 Controls), (Istanbul: 20 PD, 20 Controls) | Stacked Autoencoder, KNN | Accuracy: 94–98% | Small datasets |
Table 4.
A summary of the-state-of-the-art machine and deep learning methods applied on handwriting and sensory datasets for PD diagnosis and staging.
Table 4.
A summary of the-state-of-the-art machine and deep learning methods applied on handwriting and sensory datasets for PD diagnosis and staging.
| Method | Main Objective | Dataset | Machine/Deep Learning | Performance | Limitations |
|---|---|---|---|---|---|
| Moon et al. [42] | ET Versus PD | 48 Balance and Gait Features (524 PD, 43 ET) | ANN, SVM, KNN, Decision Tree, Random Forest, Gradient Boosting | Best F-1 Score (ANN): 61% | Low performance, unbalanced dataset |
| el Maachi et al. [43] | PD Detection and Staging | Sensory Data (93 PD, 73 Controls) | 18 parallel 1D-CNNs, Fully Connected Network | Accuracy: 98.7%, 85.3% | Small dataset, subjective UPDRS staging |
| Zeng et al. [44] | PD Detection | Gait Features (93 PD, 73 Controls) | RBF Neural Networks | Accuracy: 96.4% | Small dataset |
| Muniz et al. [45] | PD Detection | Gait Features (15 PD, 30 Controls) | Logistic Regression, PNN, SVM | Maximum Accuracy (SVM): 94.6% | Small dataset |
| Pfister et al. [46] | PD Diagnosis | Sensory Data (30 PD) | CNN | Accuracy: 65.4% | Limited performance, small dataset |
| Drotar et al. [47] | PD Detection | Handwriting Movements (37 PD, 38 Controls) | SVM | Maximum Accuracy (In-Air Trajectories): 84% | Limited performance, small dataset |
| Eskofier et al. [48] | Bradykinesia Detection | Sensory Data (10 PD) | SVM, KNN, 7-Layer CNN | Maximum Accuracy (CNN): 91% | Small dataset |
| Ricci et al. [49] | De Novo PD Detection | 35 Motor Features (30 De Novo PD, 30 Controls) | Naïve Bayes, SVM, KNN | Maximum Accuracy (SVM): 95% | Small dataset |
| Talitckii et al. [50] | PD Versus Neurological Disorders | Sensory Data (56 Patients) | Random Forest, Logistic Regression, SVM, Light GBM, Stacked Ensemble Model | Maximum Accuracy (Tremor and Bradykinesia Features): 85% | Limited performance, small dataset |
| Pereira et al. [51,52,53] | PD Detection | Handwriting Data: (HandPD: 74 PD, 18 Controls), Handwriting Dynamics Data (224 PD, 84 Controls) | Naive Bayes, Optimum-Path Forest, SVM, | Maximum Accuracy (CNN): 95% | Small dataset |
| Shaban [54] | PD Detection | 102 Spiral/Wave Handwriting Data (55 PD, 55 Controls) | VGG-19 | Maximum Accuracy (Wave Patterns): 88% | Small dataset |
| Naseer et al. [55] | PD Detection | Handwriting Data (36 PD, 36 Controls) | AlexNet (Freeze/Fine-Tuning) | Accuracy: 98.3% | Small dataset, complex training process |
| Kamran et al. [56] | PD Detection | Handwriting Data (PaHaw: 37 PD, 38 Controls), (HandPD: 74 PD, 18 Controls), (NewHandPD: 31 PD, 35 Controls) | AlexNet, GoogleNet, VGG-16, VGG-19, ResNet-50, ResNet-101 | Maximum Accuracy (AlexNet): 99.2% | Model training complexity |
Disclaimer/Publisher’s Note: The statements, opinions and data contained in all publications are solely those of the individual author(s) and contributor(s) and not of MDPI and/or the editor(s). MDPI and/or the editor(s) disclaim responsibility for any injury to people or property resulting from any ideas, methods, instructions or products referred to in the content. |
© 2023 by the author. Licensee MDPI, Basel, Switzerland. This article is an open access article distributed under the terms and conditions of the Creative Commons Attribution (CC BY) license (https://creativecommons.org/licenses/by/4.0/).
Share and Cite
MDPI and ACS Style
Shaban, M. Deep Learning for Parkinson’s Disease Diagnosis: A Short Survey. Computers 2023, 12, 58. https://doi.org/10.3390/computers12030058
AMA Style
Shaban M. Deep Learning for Parkinson’s Disease Diagnosis: A Short Survey. Computers. 2023; 12(3):58. https://doi.org/10.3390/computers12030058
Chicago/Turabian StyleShaban, Mohamed. 2023. "Deep Learning for Parkinson’s Disease Diagnosis: A Short Survey" Computers 12, no. 3: 58. https://doi.org/10.3390/computers12030058
Note that from the first issue of 2016, this journal uses article numbers instead of page numbers. See further details here.