

How to Find Orchestrated Trolls? A Case Study on Identifying Polarized Twitter Echo Chambers


Department for Electrical Engineering and Computer Science, Lübeck University of Applied Sciences, Mönkhofer Weg 239, 23562 Lübeck, Germany
Computers 2023, 12(3), 57; https://doi.org/10.3390/computers12030057
Submission received: 1 February 2023
/
Revised: 24 February 2023
/
Accepted: 1 March 2023
/
Published: 3 March 2023
(This article belongs to the Special Issue Artificial Intelligence Models, Tools and Applications with A Social and Semantic Impact)
Abstract
:Background: This study presents a graph-based, macro-scale, polarity-based, echo chamber detection approach for Twitter. Echo chambers are a concern as they can spread misinformation, and reinforce harmful stereotypes and biases in social networks. Methods: This study recorded the German-language Twitter stream over two months, recording about 6.7M accounts and their 75.5M interactions (33M retweets). This study focuses on retweet interaction patterns in the German-speaking Twitter stream and found that the greedy modularity maximization and HITS metric are the most effective methods for identifying echo chambers. Results: The purely structural detection approach identified an echo chamber (red community, 66K accounts) focused on a few topics with a triad of anti-Covid, right-wing populism and pro-Russian positions (very likely reinforced by Kremlin-orchestrated troll accounts). In contrast, a blue community (113K accounts) was much more heterogeneous and showed “normal” communication interaction patterns. Conclusions: The study highlights the effects of echo chambers as they can make political discourse dysfunctional and foster polarization in open societies. The presented results contribute to identifying problematic interaction patterns in social networks often involved in the spread of disinformation by problematic actors. It is important to note that not the content but only the interaction patterns would be used as a decision criterion, thus avoiding problematic content censorship.
1. Introduction
Echo chamber detection in social networks refers to identifying and analyzing the formation and reinforcement of homogeneous groups in online communities, where individuals with similar beliefs and attitudes tend to congregate and reinforce each other’s views. This phenomenon is a concern as it can lead to the spread of misinformation and the reinforcement of harmful stereotypes and biases. Echo chambers are particularly likely in areas where right-wing populist content is disseminated via social media [1,2]. The awareness of echo chambers and their effects has increasing importance in democratic and free societies, as echo chambers can partly make the necessary political discourse dysfunctional [3,4] and can foster polarization [5,6] in open societies. Many studies indicate that echo chambers in social networks might affect democratic elections [7,8,9]. Particularly in the case of very close election outcomes, such as Brexit [10,11,12], these communication patterns can be decisive and exploited by non-democratically-legitimized actors (even foreign powers with manipulative tendencies) to pursue their interests, which benefit from divided societies or exploit them for their own purposes [13]. Kremlin-orchestrated troll accounts, in particular, have gained sad notoriety here, exploiting these mechanisms to shape opinion in democratic societies [14,15,16].
Thus, there are significant reasons for free societies to understand and manage these mechanisms so that free speech can continue to unfold its constructive power and not be abused to hatch “manipulative cuckoo eggs” of foreign powers or non-democratically-legitimized actors. In particular, the spread of disinformation works very well in echo chambers. To recognize echo chambers is, therefore, of considerable interest. However, there are several challenges in detecting echo chambers in social networks. One major challenge is the lack of clear definitions and criteria for identifying echo chambers and the difficulty in quantifying the extent to which an online community is homogeneous. Additionally, echo chambers can occur at different granular levels, such as individual users, groups, or entire platforms. The state-of-the-art methods for echo chamber detection in social networks involve using computational techniques to analyze the structure and content of online communities, such as network analysis, natural language processing, and machine learning. These methods have been applied to various platforms, such as Twitter, Facebook, and Reddit [5,17,18].
While content-based identification is more reliable, it is also more laborious and dependent on a large amount of labelled training data which often does not exist or has to be recorded and labelled elaborately. So, content-considering methods work very well for past events with sufficient data but have problems adapting to new circumstances (such as the Russia–Ukraine war). The automated detection of orchestrated troll accounts is especially difficult in the details and usually does not lead to reliable results [19,20,21,22].
This paper, therefore, investigates whether purely structural analysis of communication and interaction patterns can be used to identify echo chambers. Because social networks like Twitter provide samples of their data streams for free, the study was also interested in whether this could be done with a sample of network interactions. For example, the public Twitter event stream API provides a 1% sample of the actual event data stream. Furthermore, studies like [23] show that the provided samples are representative.
Research Question 1: Can echo chamber detection be accurately performed using graph-based analysis of a sample of network interactions without the need for additional information, such as the content of the interactions or characteristics of the individuals involved?
The object of investigation was the public sample of events of Twitter retweets (German language). Users can post short messages on Twitter, called “tweets”, including text, images, and links. These tweets can be seen by their followers.
- A “status post” is a tweet that a user composes and shares on their own profile. It can include text, images, and links and can be seen by their followers. Status posts are the starting point of information distribution on social networks like Twitter. Their content can only be captured and processed using complex natural language processing (NLP) methods.
- A “reply” is a tweet a user composes in response to another user’s tweet. When a user replies to a tweet, the original tweet is linked within the reply so that others can see the context of the conversation. Replies can also be seen by the followers of the user who wrote the original tweet. Replies can be confirming, questioning, contradicting, referring, and, of course, any other form. Consequently, these interactions also require complex NLP methods to classify the interaction’s character.
- A “retweet” is when a user shares another user’s tweet on their profile. Retweets allow users to share content from other users with their followers. The analytical advantage of retweets is that content is shared without additional remarks or annotations. Although this cannot be said with certainty, it is predominantly safe to assume that a retweeter will have no significant issues with the original opinion of a tweet. Due to the accumulation of retweet interactions between the same accounts, it can be assumed that the content of these accounts is close to each other without having to analyze the actual content.
- A “quote” is similar to a retweet, but instead of simply sharing the original tweet, the user includes it as a quote in their tweet, along with their commentary. This allows users to share and comment on tweets in a way that allows the context of the original tweet to remain visible. Unlike a retweet, the original content is accompanied by comments that can change the meaning of the original tweet from case to case. This possible change in meaning can be sarcasm, corrections, annotations, etc., which usually require complex content-based analysis using NLP methods.
Retweets in particular are a powerful tool for identifying communities on Twitter because they indicate that a user is interested in and endorsing the content of another user’s tweet. When users retweet a tweet, they share it with their followers and endorse it as something they find valuable or interesting. Analyzing retweeting patterns among users makes it possible to identify groups of users with similar interests and share similar content. Retweets can also be used to identify the most influential members of a community. Users frequently retweeted by others are likely to be seen as leaders or experts within a community, and their tweets are likely to be more widely seen and shared. Identifying these influential users is possibly better for understanding a particular community’s dynamics and interests.
Additionally, retweets can be used to trace the spread of information and ideas within a community. When a tweet is retweeted, it is exposed to a new group of users who may be interested in the same topic. Analyzing retweet patterns makes it possible to see how information and ideas spread within a community and how different groups of users influence the conversation. In summary, focusing on retweets is a viable approach to detecting communities on Twitter because it allows the identification of groups of users with similar interests and the detection of influential members, and traces the spread of information and ideas within a community. Therefore, this study focuses on retweet interactions because of the analysis’s simplicity. However, this leads to a second research question:
Research Question 2: How much of the available information is used for echo chamber detection if only retweet interactions from a representative sample are taken?
2. Materials and Methods
Structural analysis of echo chambers involves analyzing the network structure of online communities to identify patterns of homogeneity and homophily (the tendency for individuals to associate with similar others). This typically includes techniques like community detection, centrality measures, and network visualization.
- One popular method for community detection is the use of modularity optimization algorithms [24], which aim to identify groups of nodes (representing individuals or groups) that are more densely connected than the rest of the network. This can reveal the existence of echo chambers within a larger online community.
- Network visualization techniques [27], such as graph layouts [28] and node coloring, can also be used to reveal patterns in the structure of echo chambers (see Section 2.2.2 for an example).
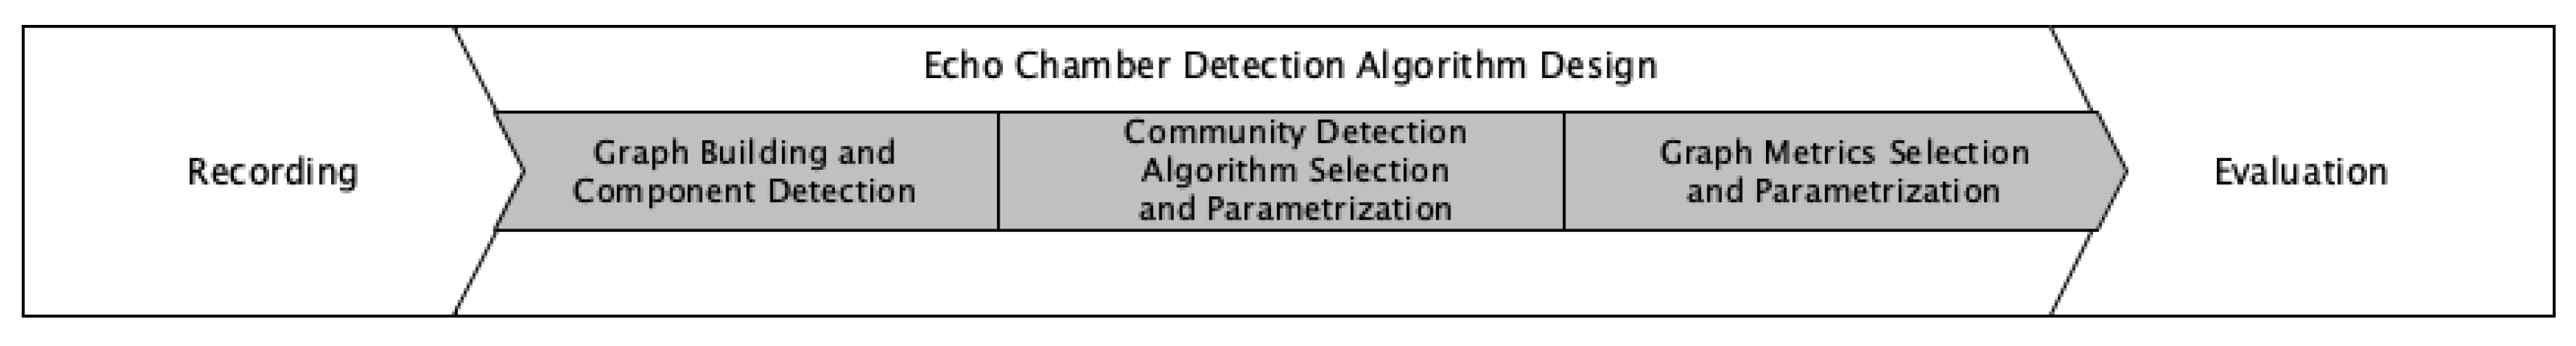
The benefits of using structural analysis to detect echo chambers include identifying homogeneous groups within a larger community and identifying critical actors within those groups. Additionally, network analysis can be applied to various platforms and at different levels of granularity. However, there are also drawbacks to this approach. One limitation is that structural analysis alone may not provide insight into the content or dynamics of echo chambers, so other methods, such as natural language processing or sentiment analysis, may also be needed. The choice of community detection algorithm or centrality measure can also affect the results obtained. To systematically get a handle on all these degrees of analytical freedom, the process shown in Figure 1 was followed.
2.1. Recording
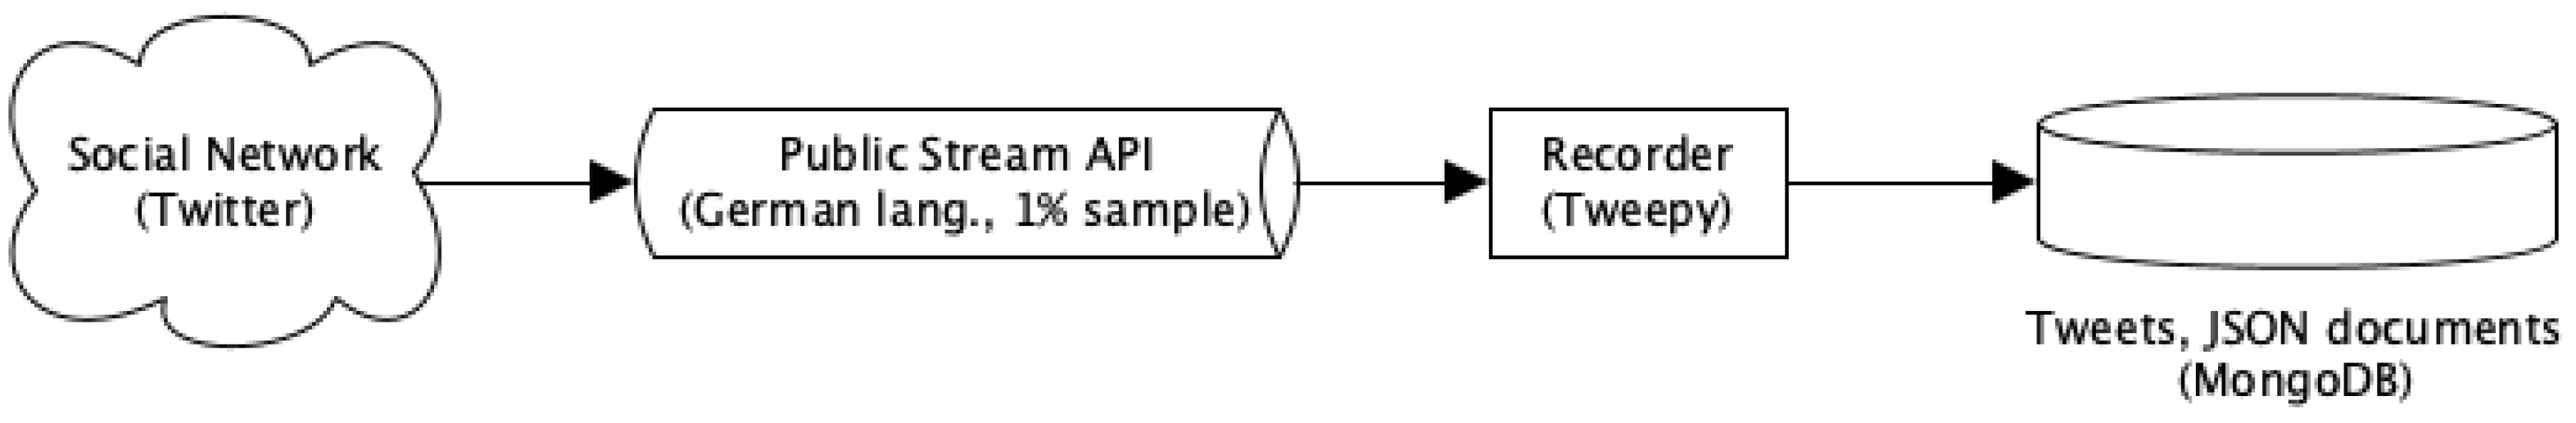
This study recorded a Twitter event stream (see Figure 2) using the public Twitter streaming API using the Python library Tweepy [29] and the document store database MongoDB [30]. This approach has been successfully used in previous studies [31] of the author.
In this study, tweets were recorded in a Kubernetes cluster over several months. The recorder and the database were run in containers. Kubernetes [32] ensured that the corresponding components were automatically restarted if the recorder or the database failed. However, the components can also be operated non-containerized in other environments. The following resources have been assigned to the recorder and the database.
- Recorder: 250 m CPU, 250 MB Memory
- MongoDB: 8000 m CPU, 60 GB Memory
Interested readers can follow both the recording solution and the Kubernetes deployment in the following repository [33].
2.2. Echo Chamber Detection Algorithm
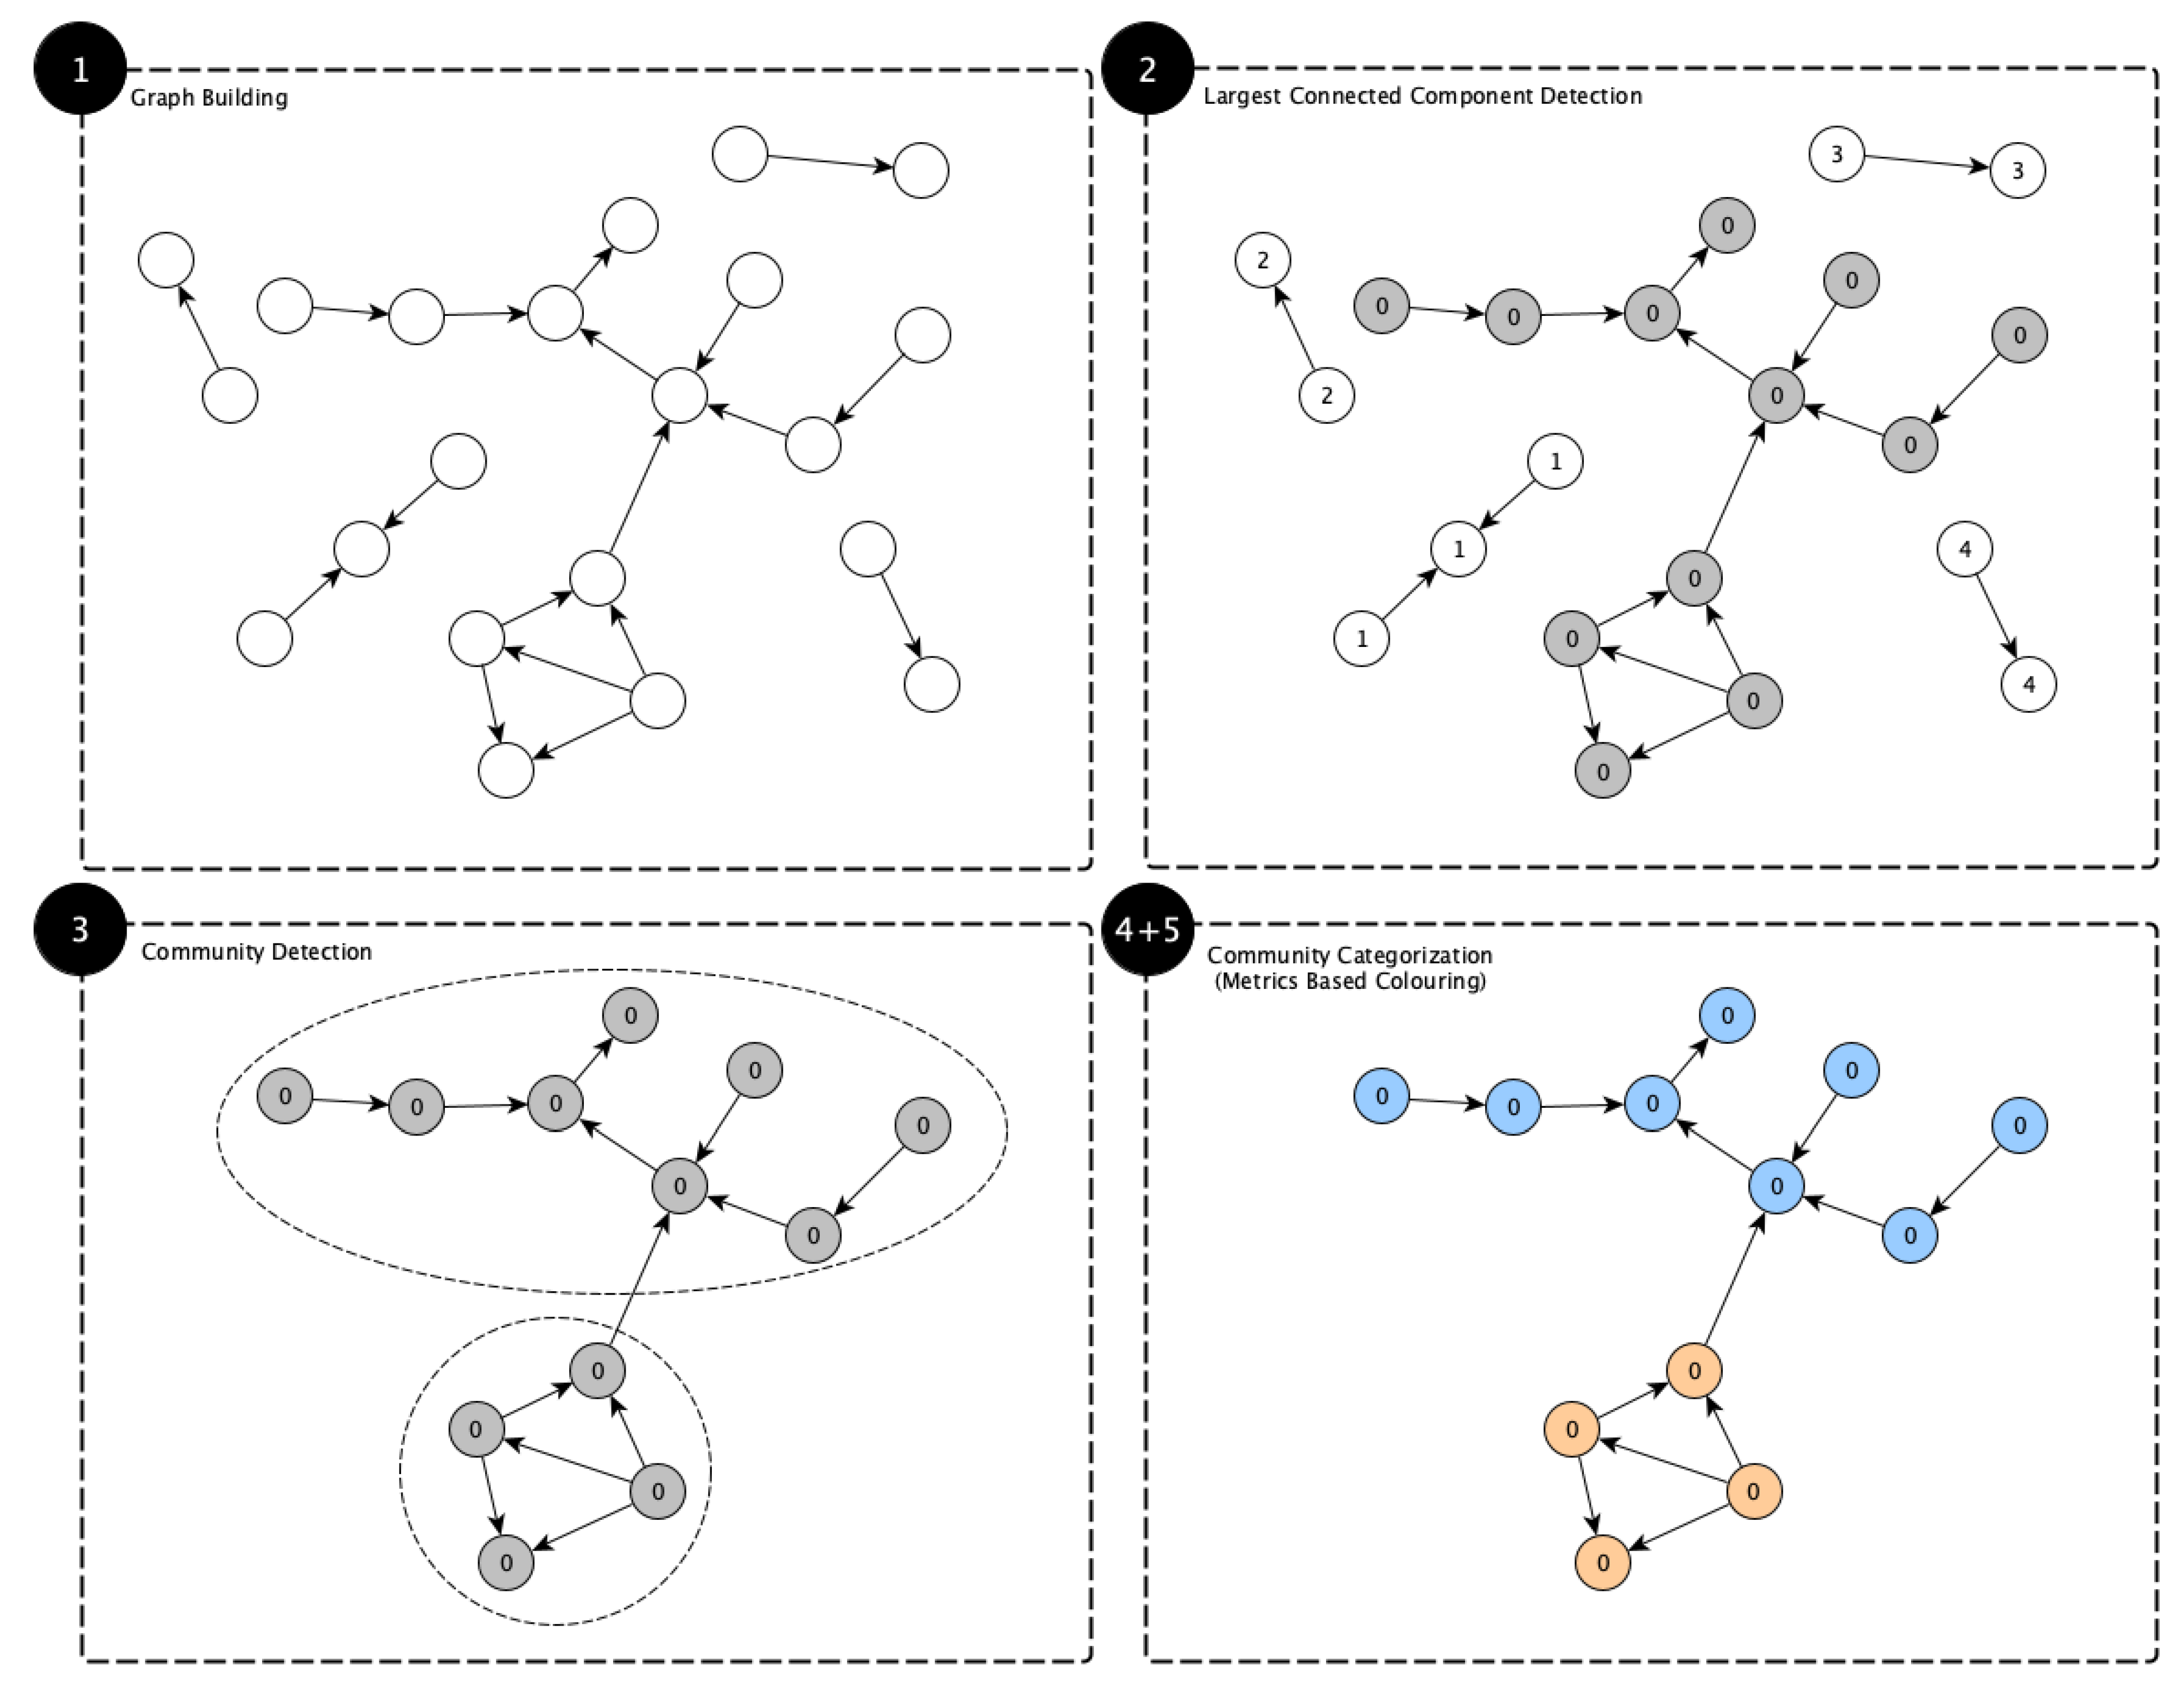
The basic workflow of detecting echo chambers by analyzing Twitter retweets followed the procedure shown in Figure 3 using an example graph for illustrative purposes. The reader should consider that millions of interactions were captured in the context of this study, and the graphs become correspondingly complex. The algorithm was inspired by approaches like [34,35,36,37].
Algorithm 1 shows the details of the echo chamber detection algorithm. Experiments have shown that the proposed algorithm could reliably and stably determine an echo chamber. This algorithm builds a directed graph based on retweet interactions. In this graph, the largest connected component is determined. Within this subgraph, two communities are determined using greedy modularity. The colors red and blue are assigned to the communities based on authority values (HITS metric). The community with the higher average authority values is assigned red and the other community is blue. The red nodes form the echo chamber.
| Algorithm 1: The Echo Chamber Detection Algorithm builds a directed graph based on retweet interactions observed in a given timeframe. In this graph, the largest connected component is determined, and the colors blue and red are assigned to the nodes based on authority values (HITS metric). The red nodes form the echo chamber. |
 |
In the algorithm design for the detection of echo chambers, community detection and community classification are crucial. Therefore, the design considerations for these two points are reported in the following paragraphs.
2.2.1. Community Detection (see Figure 3 Step ➌)
There are many algorithms for community detection in graphs, all of which come with different advantages and disadvantages [24]. It has been found that bipartitions (which can be applied recursively if necessary to identify more than two communities) are particularly suitable for detecting echo chambers in polarized scenarios. In the present study case, detecting two well-separable communities is sufficient. In consequence, algorithms that cannot be parameterized to derive a specific number of communities in a graph (in our case, ) are unsuitable for this use case. Therefore, and according to the literature, the following algorithms can primarily be considered:
- The Kernighan–Lin bisection algorithm [38] partitions a network into two sets by iteratively swapping pairs of nodes to reduce the edge cut between the two sets.
- The asynchronous fluid communities algorithm [39] is based on the idea of fluids interacting in an environment, expanding and pushing each other. Its initialization is random, so found communities may vary on different executions.
- The Clauset–Newman–Moore greedy modularity maximization algorithm [40] finds a community partition with the largest modularity. Greedy modularity maximization begins with each node in its own community and repeatedly joins the pair of communities that lead to the largest modularity until no further increase in modularity is possible (a maximum). To obtain precisely n communities, the and parameters can be set to n (in our case, ).
This study used the greedy modularity maximization approach. However, other community detection methods might also work but might show slightly different results. Investigations carried out during this study have not shown any significant differences in the present use case, so it is probably irrelevant which of these algorithms is used.
2.2.2. Community Classification (see Figure 3 Step ➍)
In the proposed algorithm, the community classification is based firstly on a measurement of the graph using common graph metrics and, in a second step, on assigning a label based on this descriptive metric. However, the question is which metric is suitable for reliably distinguishing the communication behavior of echo chambers. In principle, various metrics come into question here.
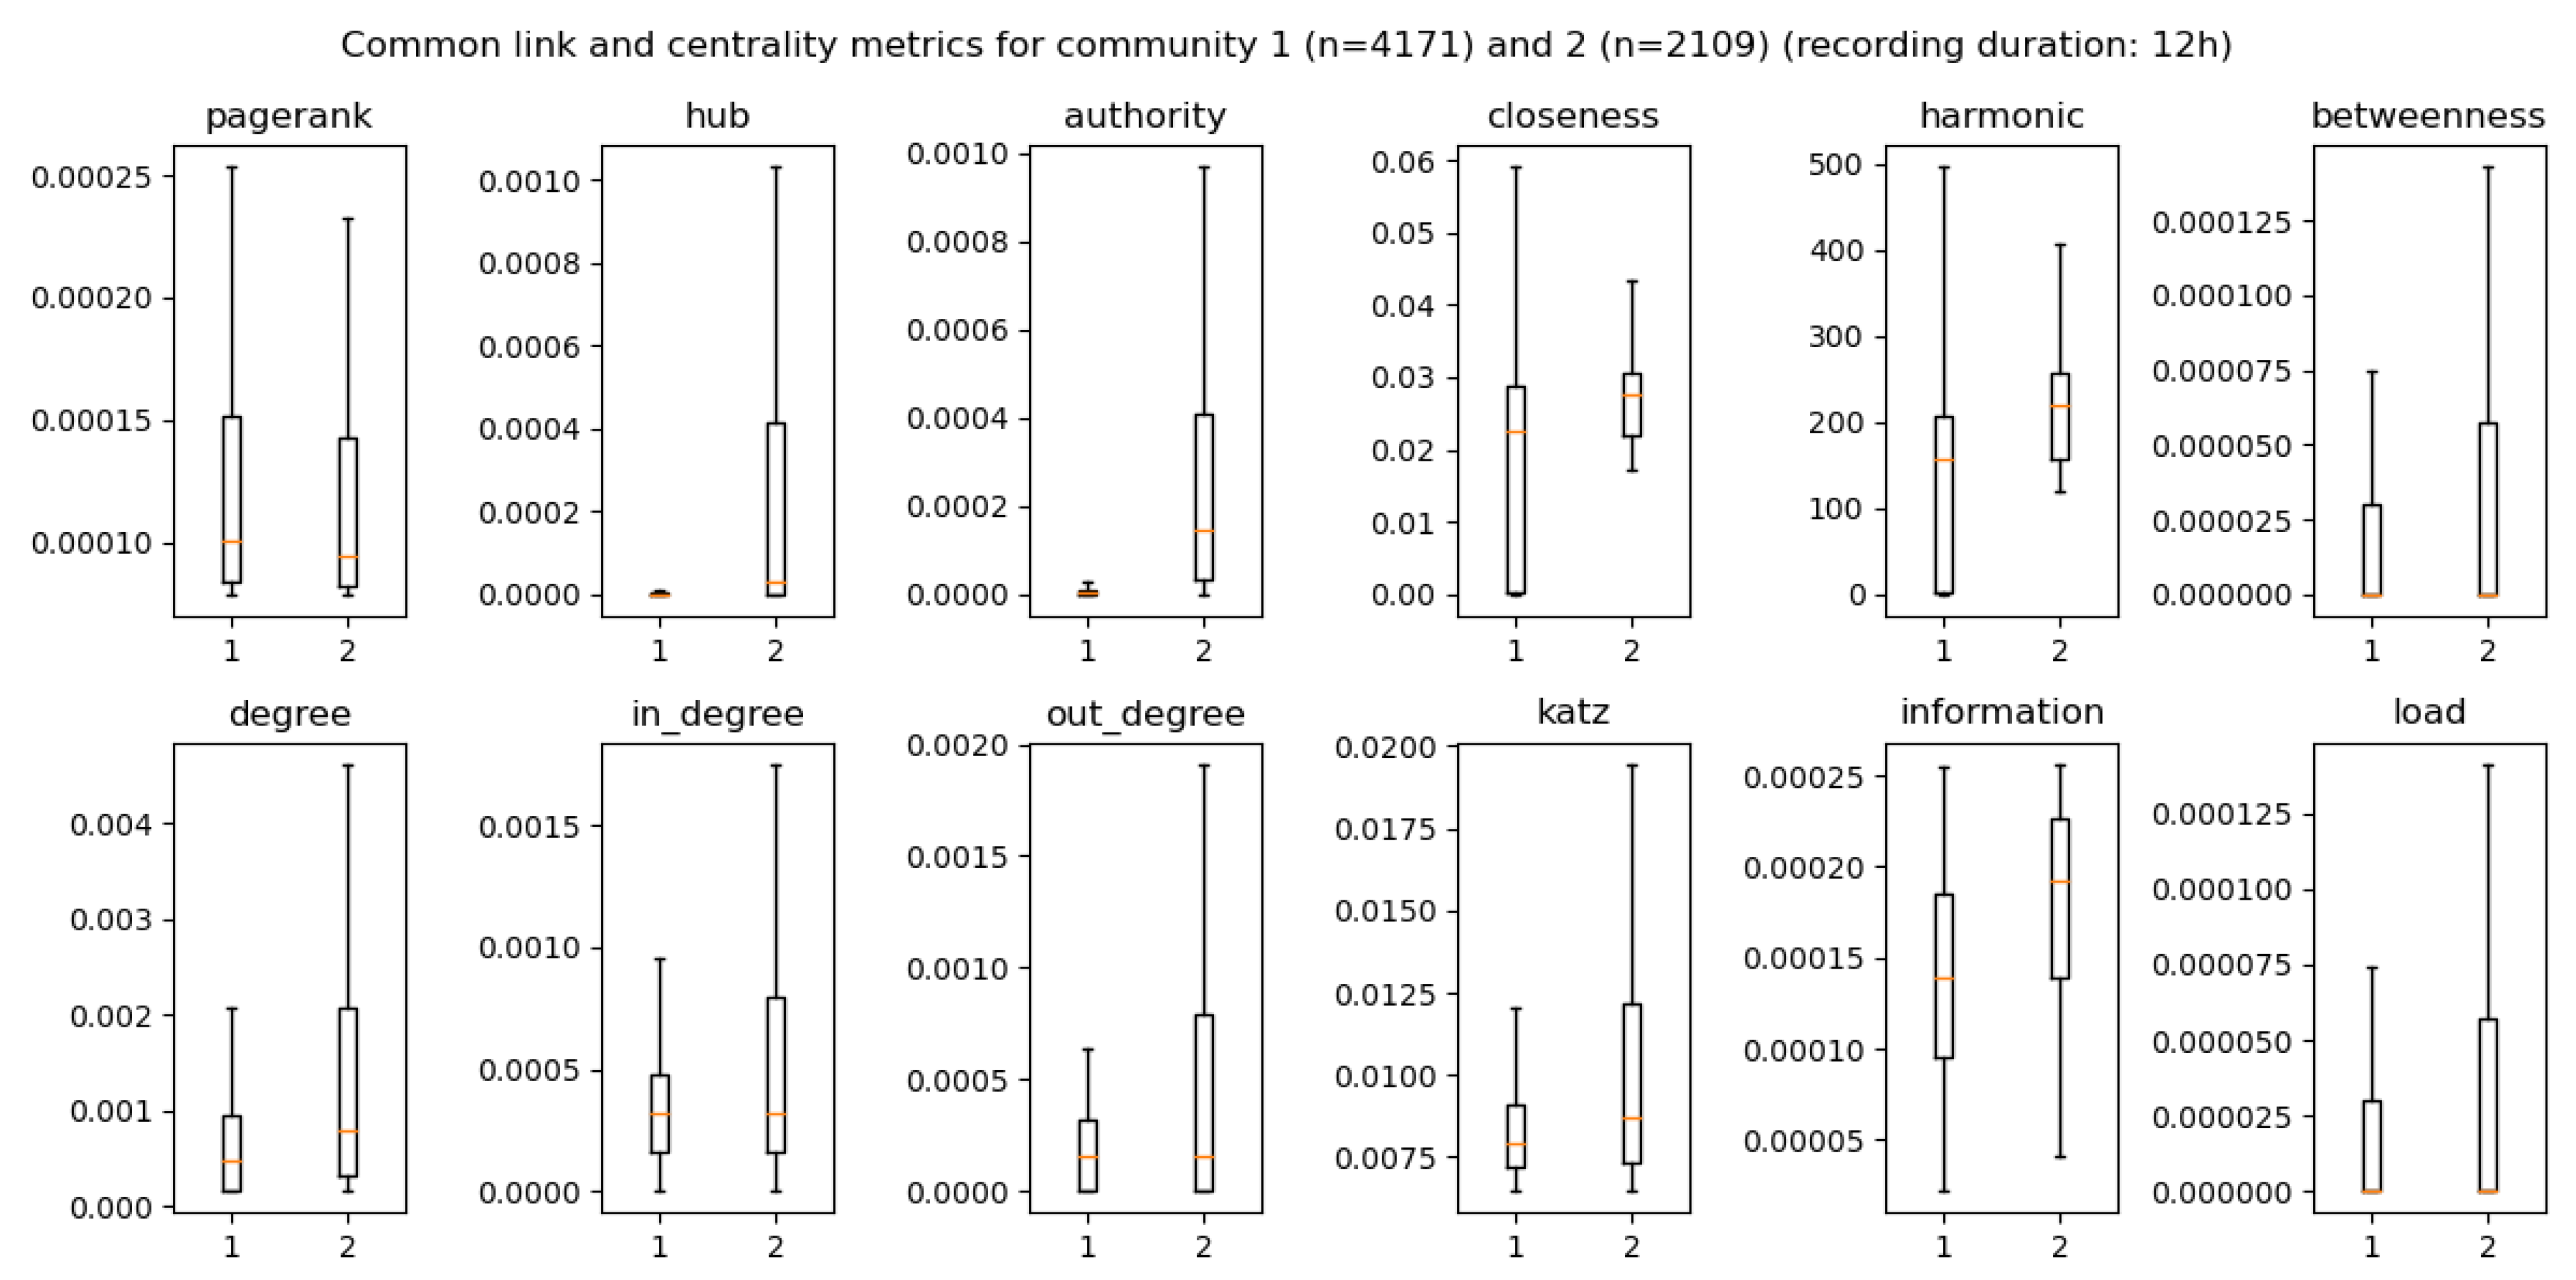
There are countless metrics to measure graphs [41]. The NetworkX library provides Pagerank, and HITS for link analysis and several centrality measures such as closeness, harmonic, betweenness, degree, Katz, information, or load centrality. This paper will not go into detail on all of these metrics. Still, these metrics were examined to determine which are particularly useful in reliably distinguishing the characteristics of two communities. The reader can find these results in Figure 4.
Figure 4 compares different centrality measures in the two communities identified using the greedy modularity maximization algorithm. It is striking that the boxes of the boxplots overlap for almost all metrics, which can be problematic for clear assignments. However, the HITS metric (hub + authority) shows almost no deflection for one community and significant deflections for the other. The HITS metrics (especially the authority values) are an excellent discriminator in differentiating the communities. HITS (Hyperlink-Induced Topic Search, [42]) is a link analysis algorithm used to measure the importance of web pages (the Google PageRank algorithm pursues similar goals but shows similar values for both communities and is, therefore, more unsuitable for echo chamber detection). The HITS algorithm was initially developed to sort hits in search engines according to relevance. The algorithm assigns two values to each node, a hub score and an authority score.
- A hub is a node that links to many other nodes. It is a central information point and is used to connect different topics. In this study, context, a hub is an account that mainly retweets other accounts. So, a hub is a content disseminator.
- An authority is a node that is linked to many other nodes. It can be seen as an authoritative source of a community used to get information on a particular topic. In this study, an authority is an account mainly retweeted by other accounts. So, an authority is a content provider.
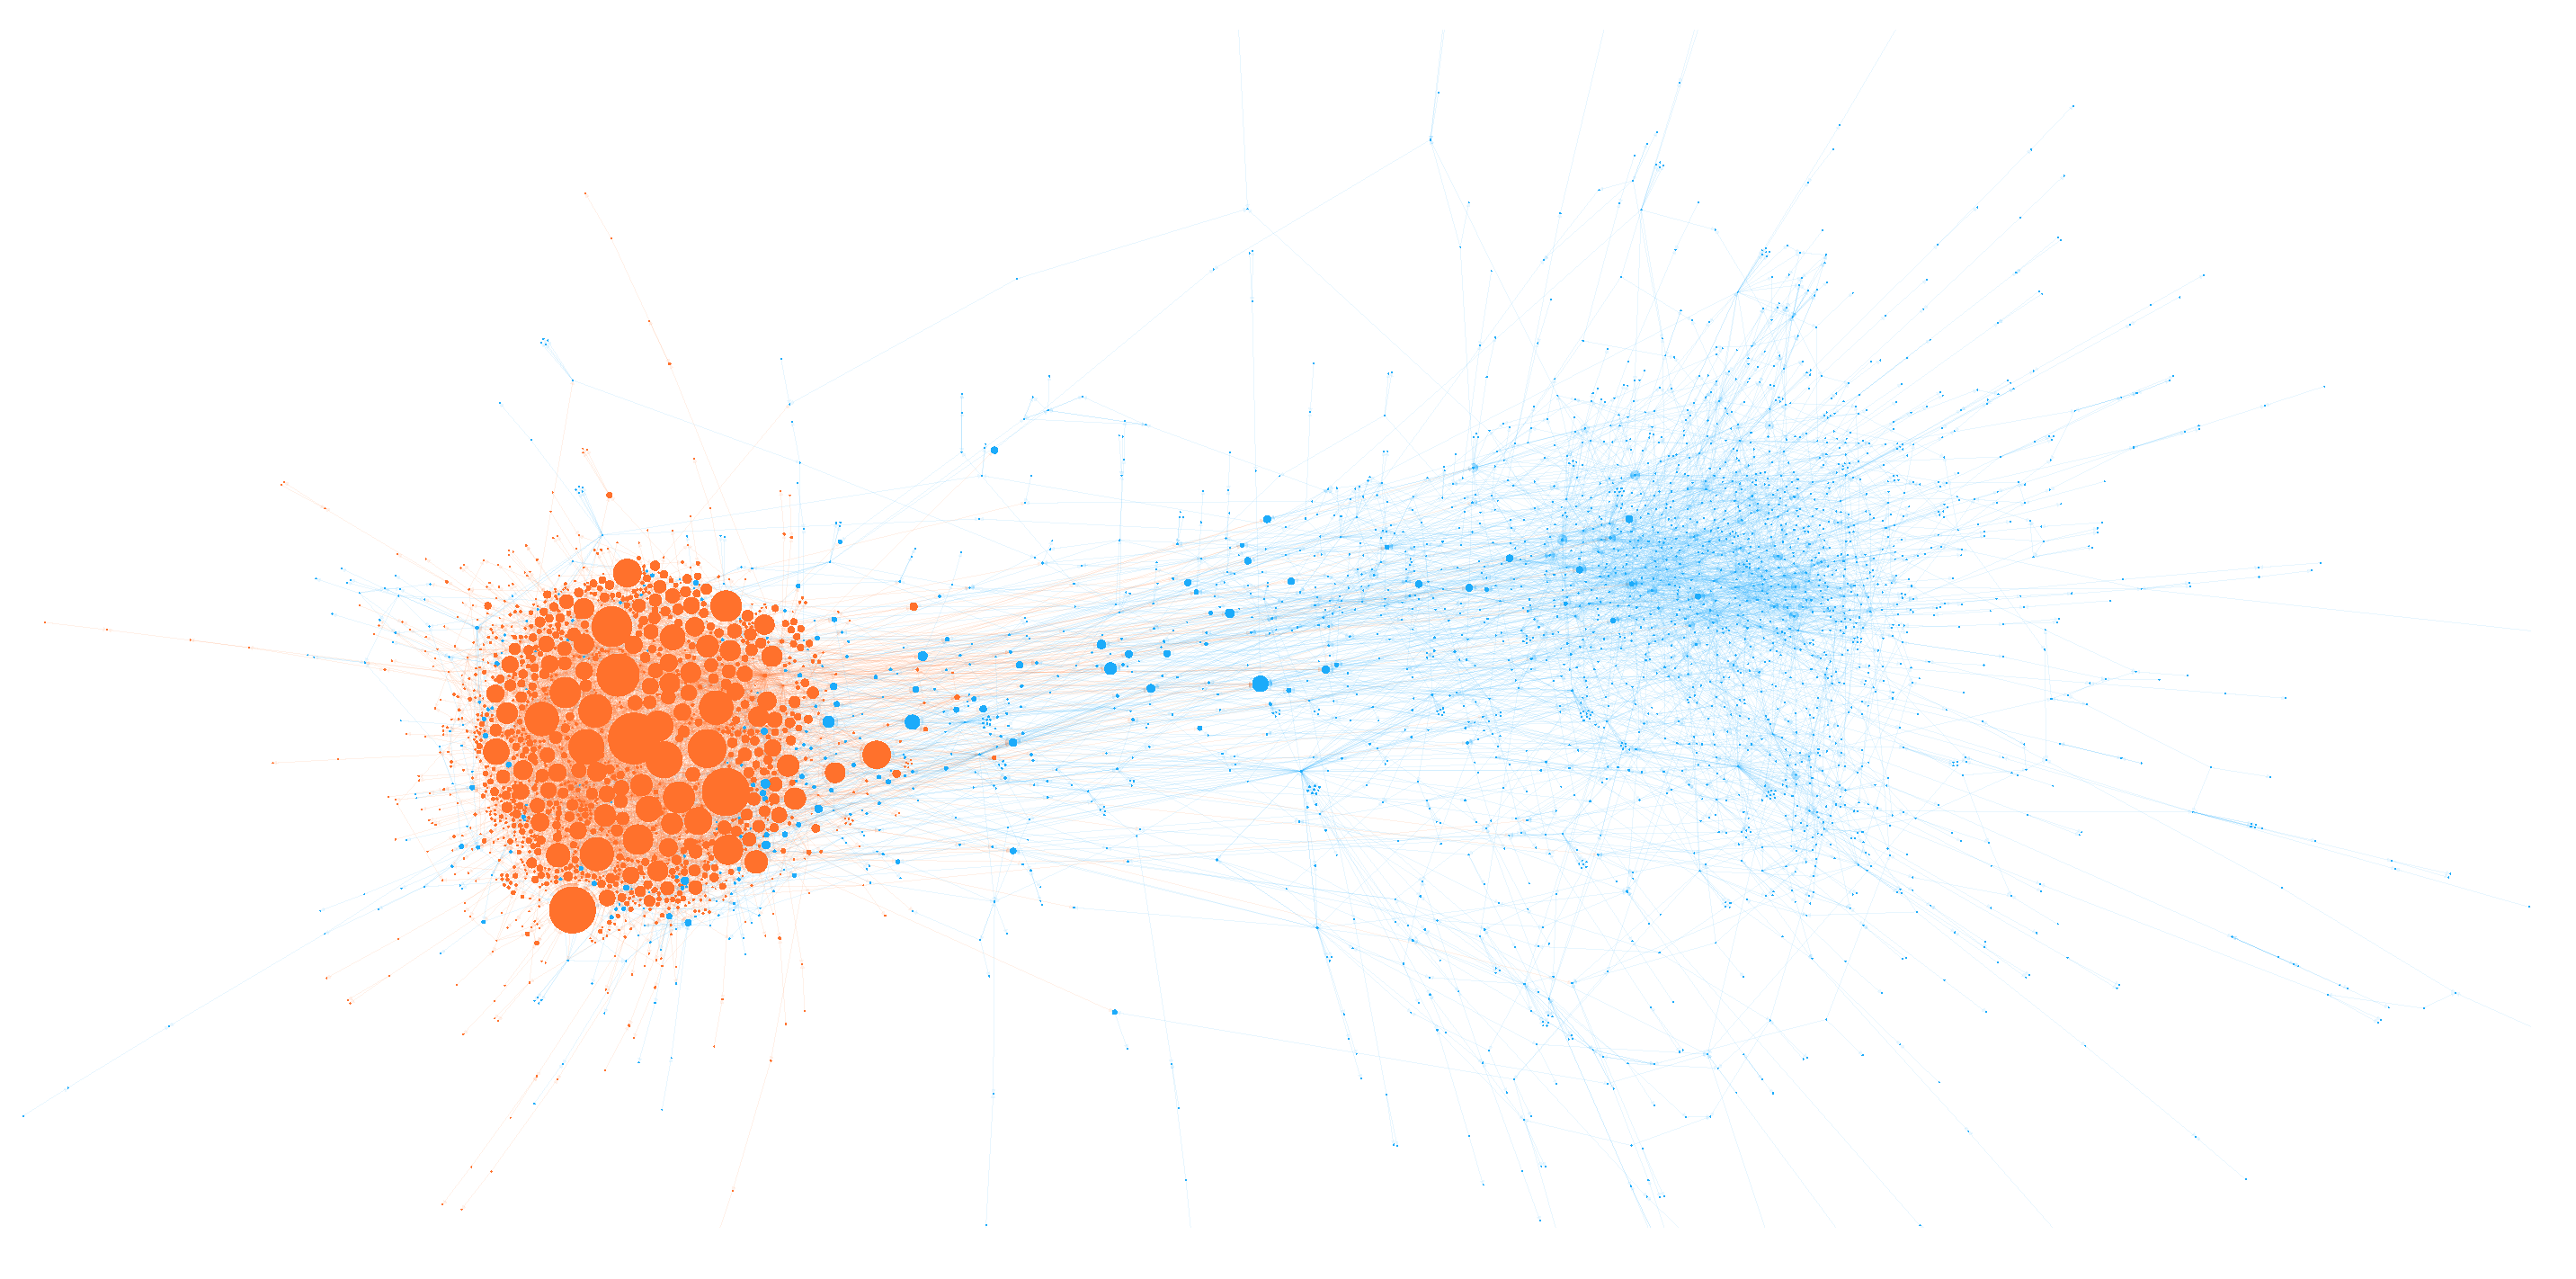
The community with higher HITS authority values is referred to as the red community and the other as the blue community. Therefore, both communities clearly show different behavior in how the content of accounts is retweeted. This is much more pronounced in the red community than in the blue community. This becomes even clearer when the retweet graph is plotted using an Atlas Force algorithm [28] and the node size is set proportional to the HITS authority values. Figure 5 clearly shows that the blue community looks “normal” and the red community has exceptionally many “authorities”. These “authorities” fuel the red echo chamber.
2.3. Evaluation
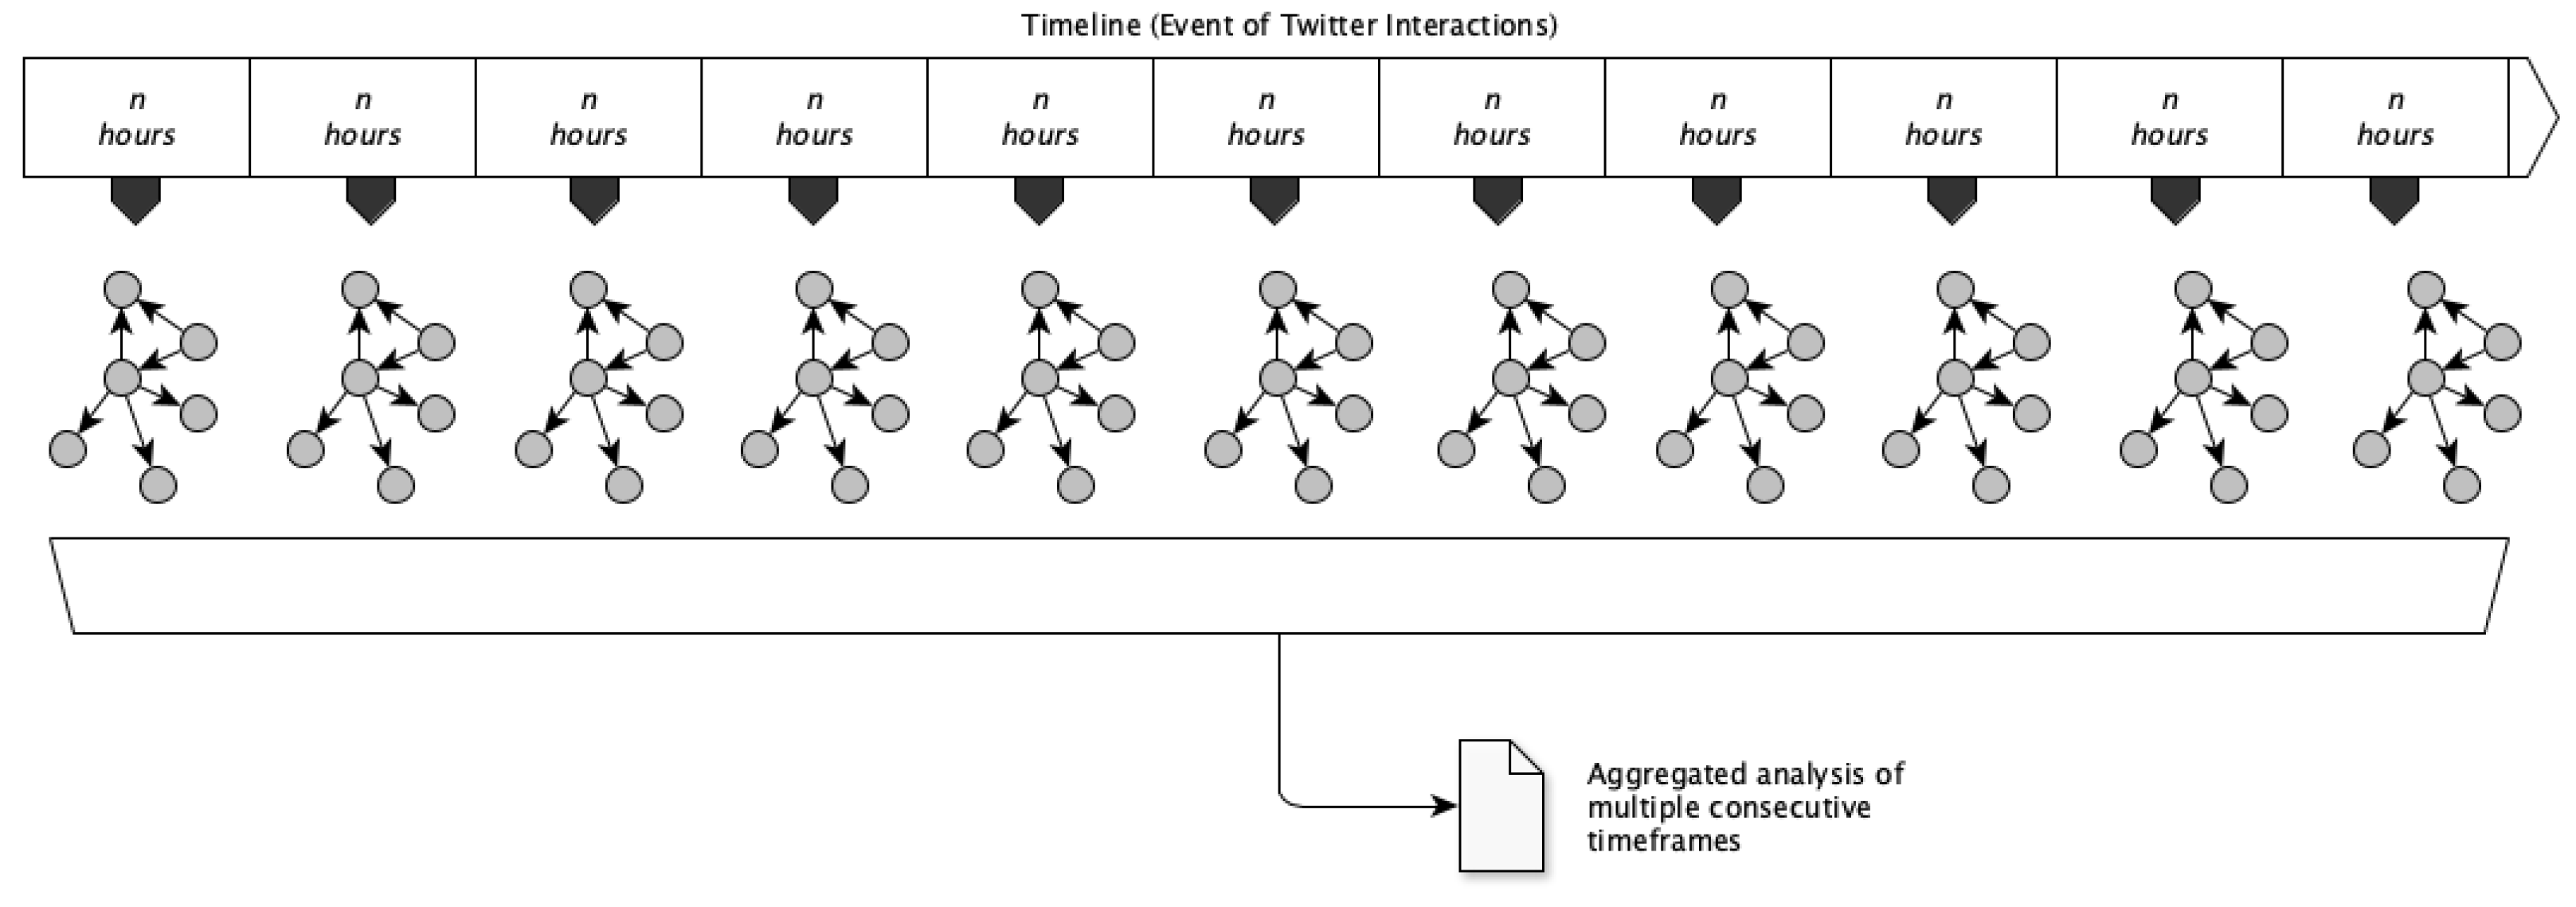
As part of the evaluation, the extent to which the proposed method for detecting echo chambers would work in practice had to be investigated. As there is no common definition of an echo chamber in the literature [43], there are hardly any reference data sets with which the presented method can be compared. Therefore, individual accounts’ red/blue allocation was examined over time. The evaluation, therefore, focuses more on how stable an account’s red/blue classifications are over time. This was done as shown in Figure 6.
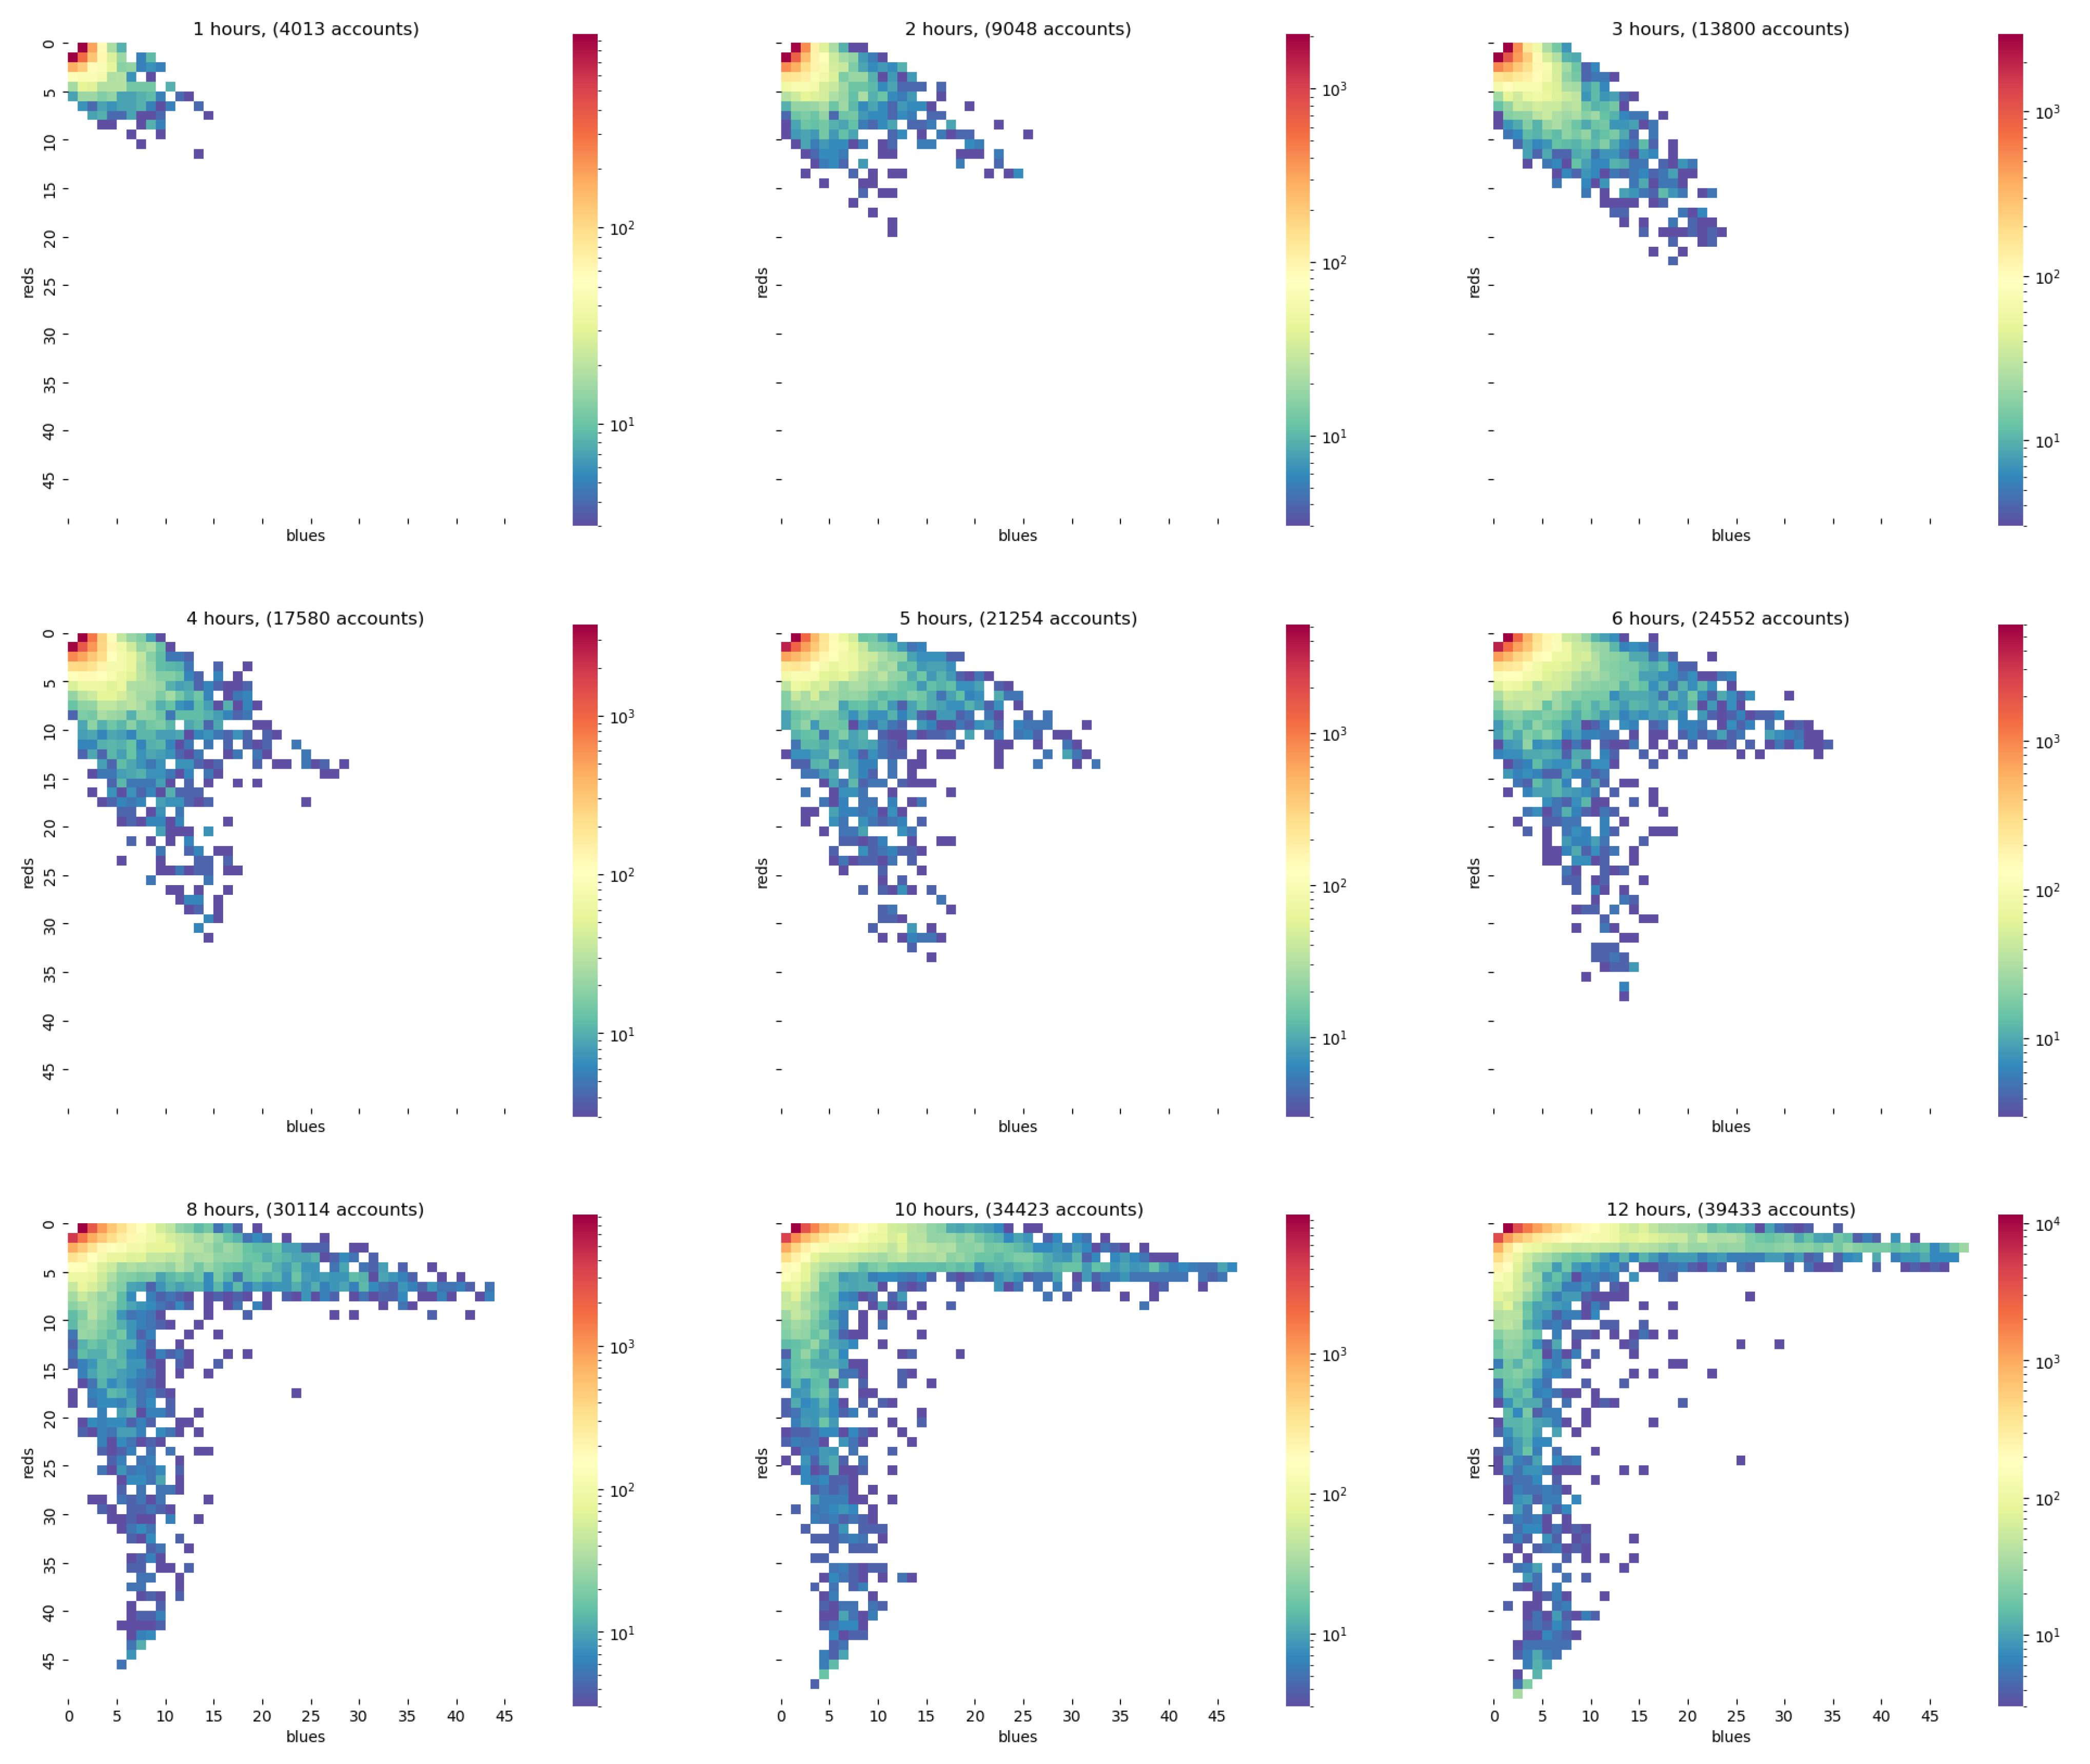
A retweet graph was created for n hours, and the red and blue communities were determined as shown in Section 2.2.1 and Section 2.2.2. This graph was compared to the graph of further m previous consecutive periods of n hours to determine how stable the red and blue assignments were for individual accounts. The evaluation examined 45 time periods between 1 and 24 h. Of course, it is unlikely that individual accounts can be unambiguously assigned to only one of the two communities (some accounts can share the positions of both communities). For stable echo chamber detection, it is necessary to recognize clear red and blue domains, which statistically indicate that predominantly red or blue content is shared. The result of this analysis can be found in Figure 7, which shows that the duration of a period plays a significant role. The distributions for one hour to three hours (first row of Figure 7) have a more circular or oval character and are formed along the main diagonals, from 4 to 6 h of recording time (second row of Figure 7); the reader observes how two fingers are formed to the left and right of the main diagonal, which correspond to a red and a blue community.
For 8 to 12 h, these fingers start to nestle against the axes (third row of Figure 7). The central area is hardly populated. Thus, observing a sufficiently long interval can record enough interactions to reliably identify a red and a blue community. However, the time interval must not be too short. This period also depends on how many interactions are generated in the first place (in Spanish and English, for example, one will be able to capture much more retweets in 12 h than in German, simply because there are more English- and Spanish-language tweets).
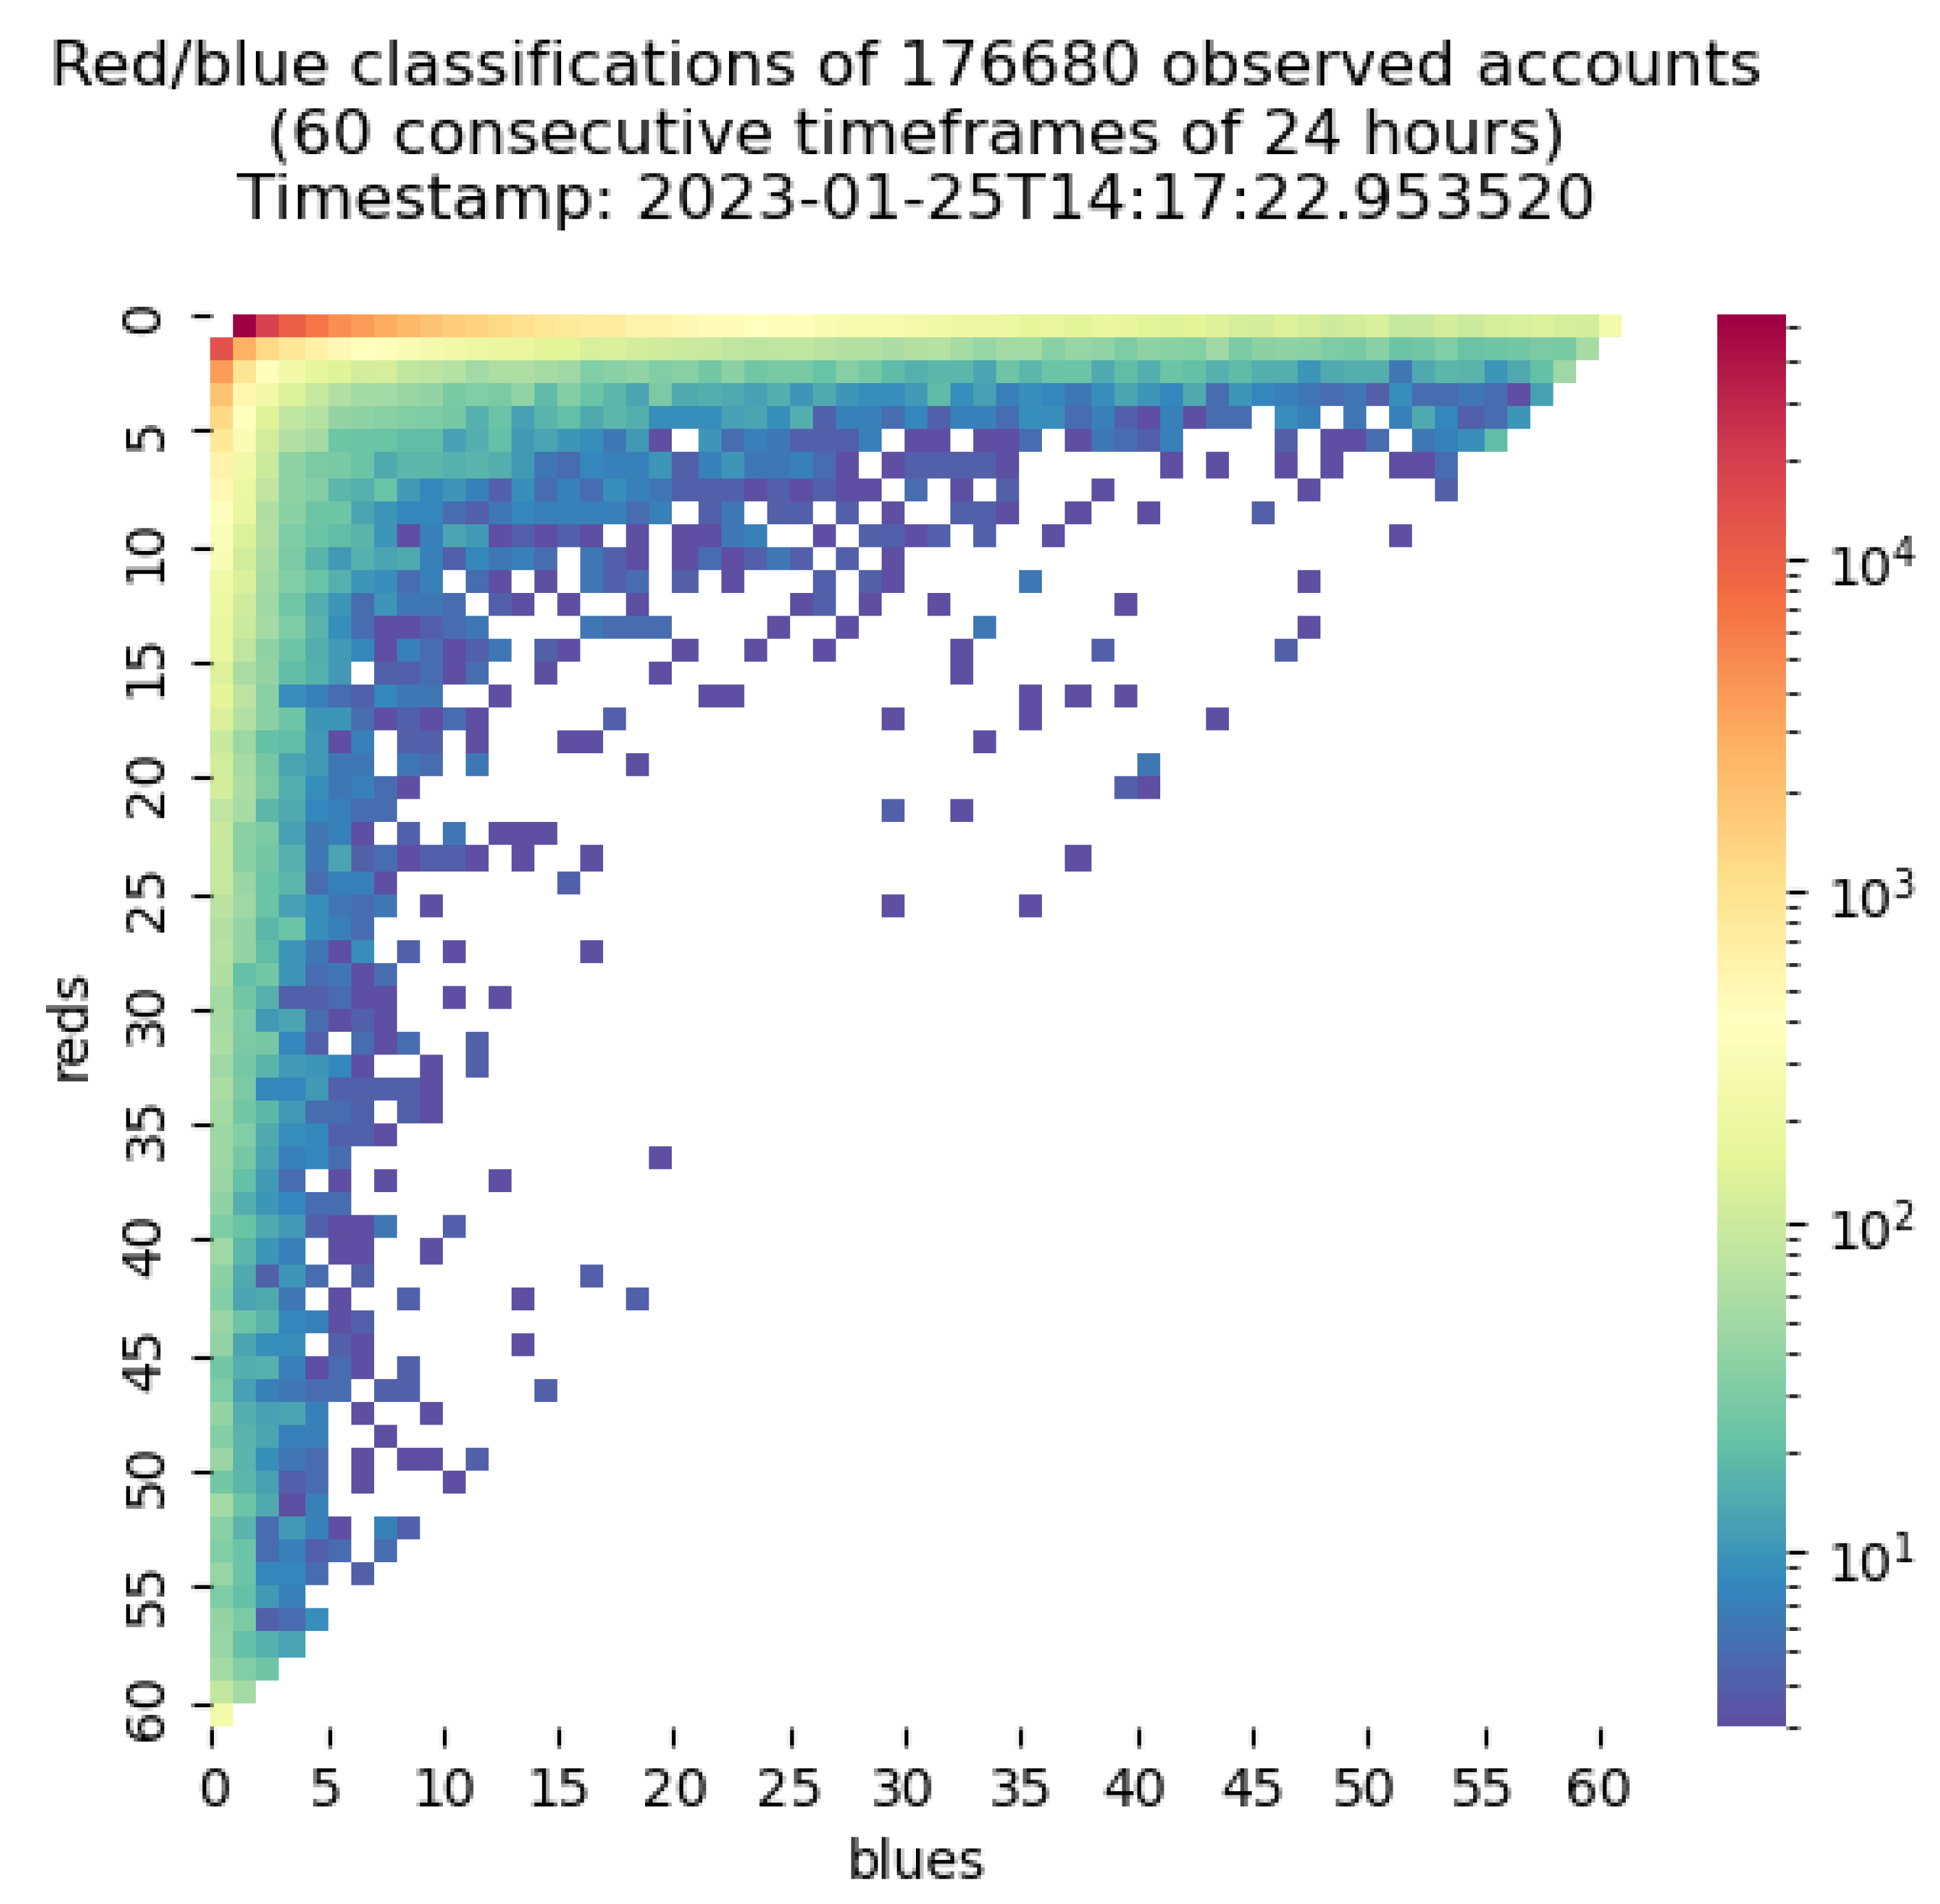
In particular, since the classification into red and blue areas is based solely on interactions and not content, little can be said about the nature of the red and blue communities, except that the red community shows strikingly different retweet behavior than the blue community. Why this is so, and what content is distributed in such a strikingly different way, was based on a preliminary content analysis of the accounts that achieved the highest authority metric scores overall observed periods. Based on the observed interaction patterns, these accounts are retweeted most frequently and are considered “trusted sources” or opinion leaders for the respective communities, thus setting the “tone in the community”. Therefore, for this study it was decided to work with a period of 24 h and 60 consecutive time frames which leads to a stable classification for plenty of accounts (see Figure 8).
3. Results
The evaluation lasted 60 days and ended on 25 January 2023. During this time, the public stream of all German-language tweets, which Twitter and [23] claim comprises a 1% representative sample of the complete traffic, was stored in a database for further analysis according to Section 2.1.
- Observation period: 60 days in total ending on 25 January 2023;
- Tweets: 75.46 Mio. (thereof 33.10 Mio. retweets);
- Observed unique accounts: 6.75 Mio. (thereof 4.26 Mio. unique retweeting accounts);
- Data repo: [44] (gzipped jsonl raw data export of Mongo database, approx. 35 GB);
- Analyzed consecutive time frames: 60 (each covering 24 h).
About 180,000 accounts and their observed retweet interaction patterns are considered in the largest connected components of the retweet graph. These accounts became active in the blue or red community and retweeted red or blue content. This dataset [44] is used to answer the two research questions formulated.
3.1. Research Question 1: Classification Results
The primary question of this study was whether it is possible to perform echo chamber detection using graph-based analysis based on a sample of network interactions without the need for content analysis. This could be answered positively but one must have sufficient interactions for evaluation. In the case of the German language area, it has been shown that one must record at least 12 h of Twitter retweet interactions for this (see Figure 6).
Figure 8 shows the evaluation for the German-speaking area for 60 consecutive 24-h periods, i.e., about two months. One can see that the majority of accounts appear only a few times. This is a common phenomenon in scale-free social networks. Nevertheless, there is an accumulation along the red and blue axes. Therefore, the distribution of retweets is not equally distributed between the two communities. If this were the case, there would be an accumulation along the main diagonal.
Therefore, the proposed approach is suitable for echo chamber detection. Nevertheless, the classification does not tell us much more than that the red community differs from the blue community by a significantly different distribution of authority indicators (HITS metric). Since no content-related evaluation of the shared content was carried out, little can be said about the content of both communities. The content could include anything, e.g., Mickey Mouse films, make-up tips, sports news, political content, health tips, or completely other content. It was impossible to carry out a comprehensive and detailed analysis of all 180,000 Twitter accounts covered. Nevertheless, an assessment of the content of the red and blue communities is of course, of interest. Therefore, we determined the accounts with the highest authority values in each of the 60 24-h periods and counted how often they appeared in the TOP-50 accounts. The higher an account appears, the more regularly it is retweeted and the more content-related influence it has on the respective community.
Figure 9 shows the result of this analysis for the blue and red communities. Table A1 and Table A2 in Appendix A list further information per account, such as the description, the verification status (Twitter blue tick), or content categories. A verified account on Twitter is an account with a blue badge next to the account name, indicating that Twitter has confirmed that the account is of public interest and is the authentic account of the person or entity it represents. Following the Twitter acquisition by Elon Musk, the criteria have changed as follows. To receive or retain a blue checkmark, an account must meet the following criteria: it must be subscribed to the Twitter Blue program (paid accounts), have a display name and profile photo, be an active account with a confirmed phone number, show no signs of being deceptive or engaging in platform manipulation, and have no spam activity. This verification helps users differentiate between authentic accounts and impostor accounts.
Readers who regularly follow the media in the German-speaking world will recognize at first glance that the red accounts are strongly right-wing populist or critical of Covid measures. In contrast, the blue accounts are more influenced by classic TV or print media. This gives a first impression of the method of communication in both communities. A closer look at the red accounts further reveals that some of these accounts spread notable Russian narratives up to the cheapest Russian propaganda in the context of the Russian war of aggression on Ukraine launched on 24 February 2022.
Figure 10 shows quite different types of accounts in the highest-ranked authority accounts; while only about 25% verified accounts characterize the red community, the blue community has 55%. A similar picture emerges for journalistic accounts. Here, too, only about 20% of the accounts in the red community have a journalistic background, half as many as in the blue community. Accounts of politicians, on the other hand, are equally strong (or weak) in both communities, at only 5%. On the other hand, troll-like accounts do not occur in the blue community but form the majority of opinion-shaping accounts in the red community. Such troll-like accounts are false online identities often controlled by Russian government agencies or their supported organizations [45]. They are used to influence online discussions and spread certain political narratives. Since the annexation of Crimea in 2014, these troll accounts have been increasingly used as part of the Russian information war to influence and destabilize public opinion in Western countries. It can therefore be stated that verified and often journalistic accounts characterize the blue community. On the other hand, the red community is characterized by accounts with a solid troll-like character (even if this cannot be proven beyond doubt in the context of this study).
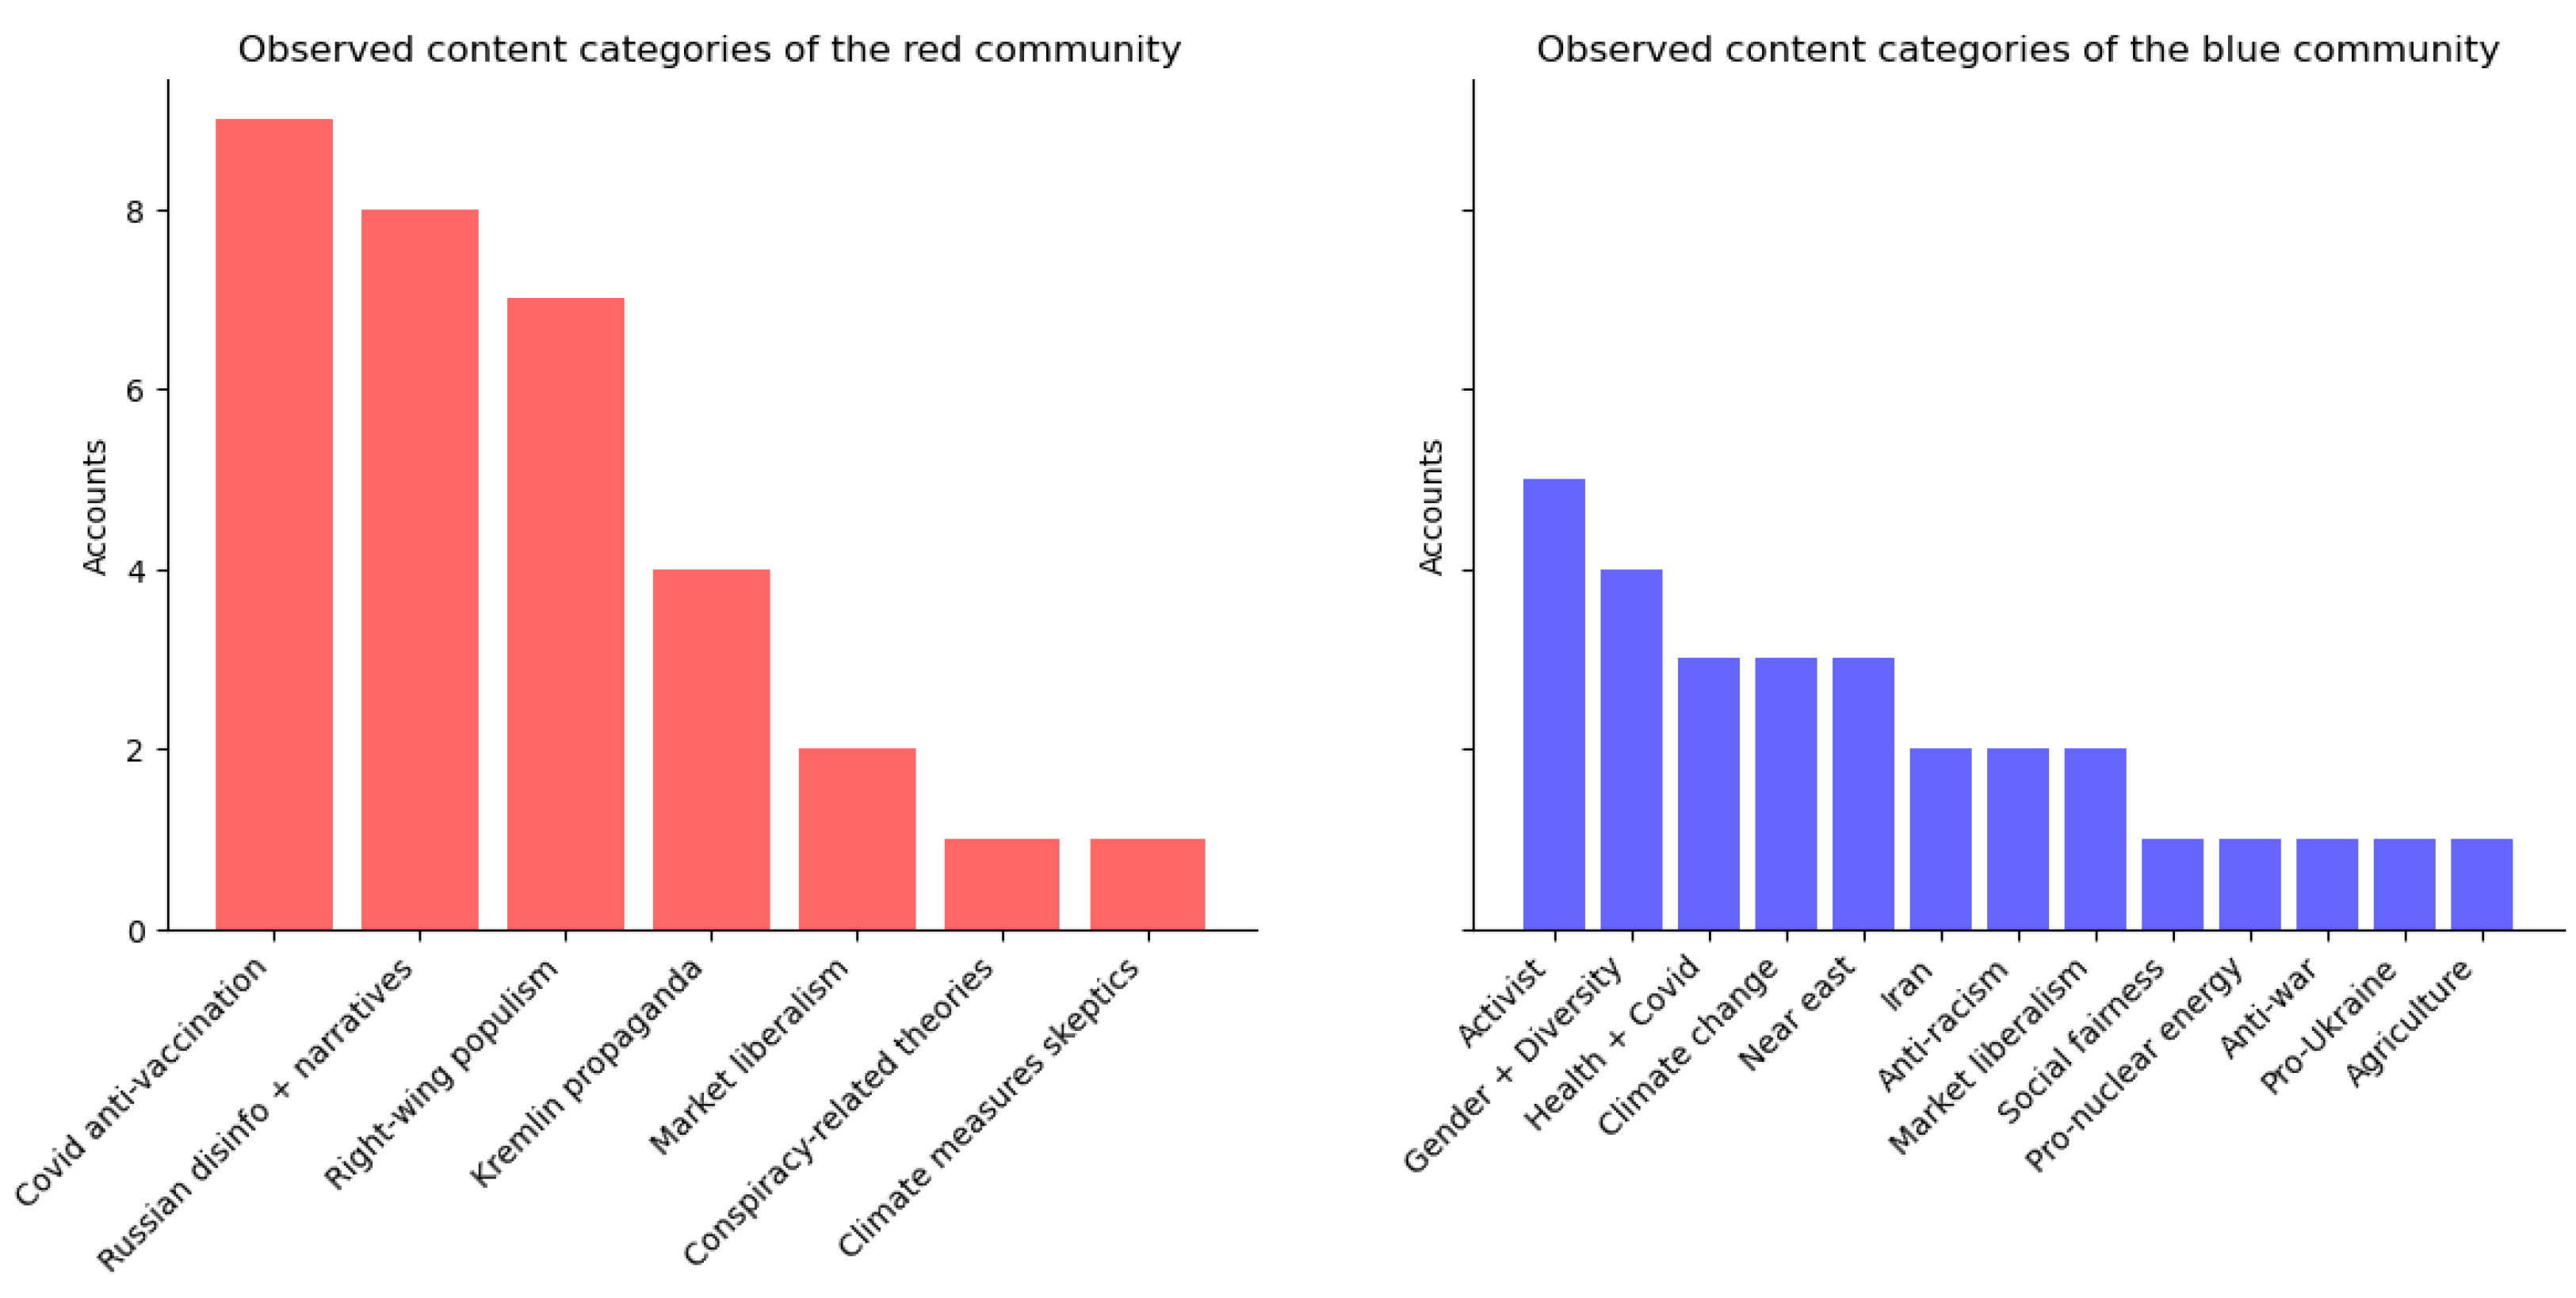
Figure 11 shows the content analysis for the months December 2022 and January 2023. It can be seen that the content of the red community is focused on fewer topics. The content dissemination is dominated by accounts that oppose Covid vaccination, often share right-wing populist content, and share Russian narratives (e.g., Russia was forced into war) and disinformation (e.g., Ukraine oppresses its Russian-speaking population). This triad of anti-Covid, right-wing populism, and pro-Russian positions seems particularly pronounced in the red community. In contrast, the blue community is thematically much more heterogeneous, although several activist accounts also characterize it. Here, the topics range from Iran, gender and diversity, Covid, climate change, anti-racism, and social fairness to pro-nuclear energy and agriculture. Only in the case of market liberalism is there a slight overlap between the two communities.
3.2. Research Question 2: Scope and Quantity Considerations
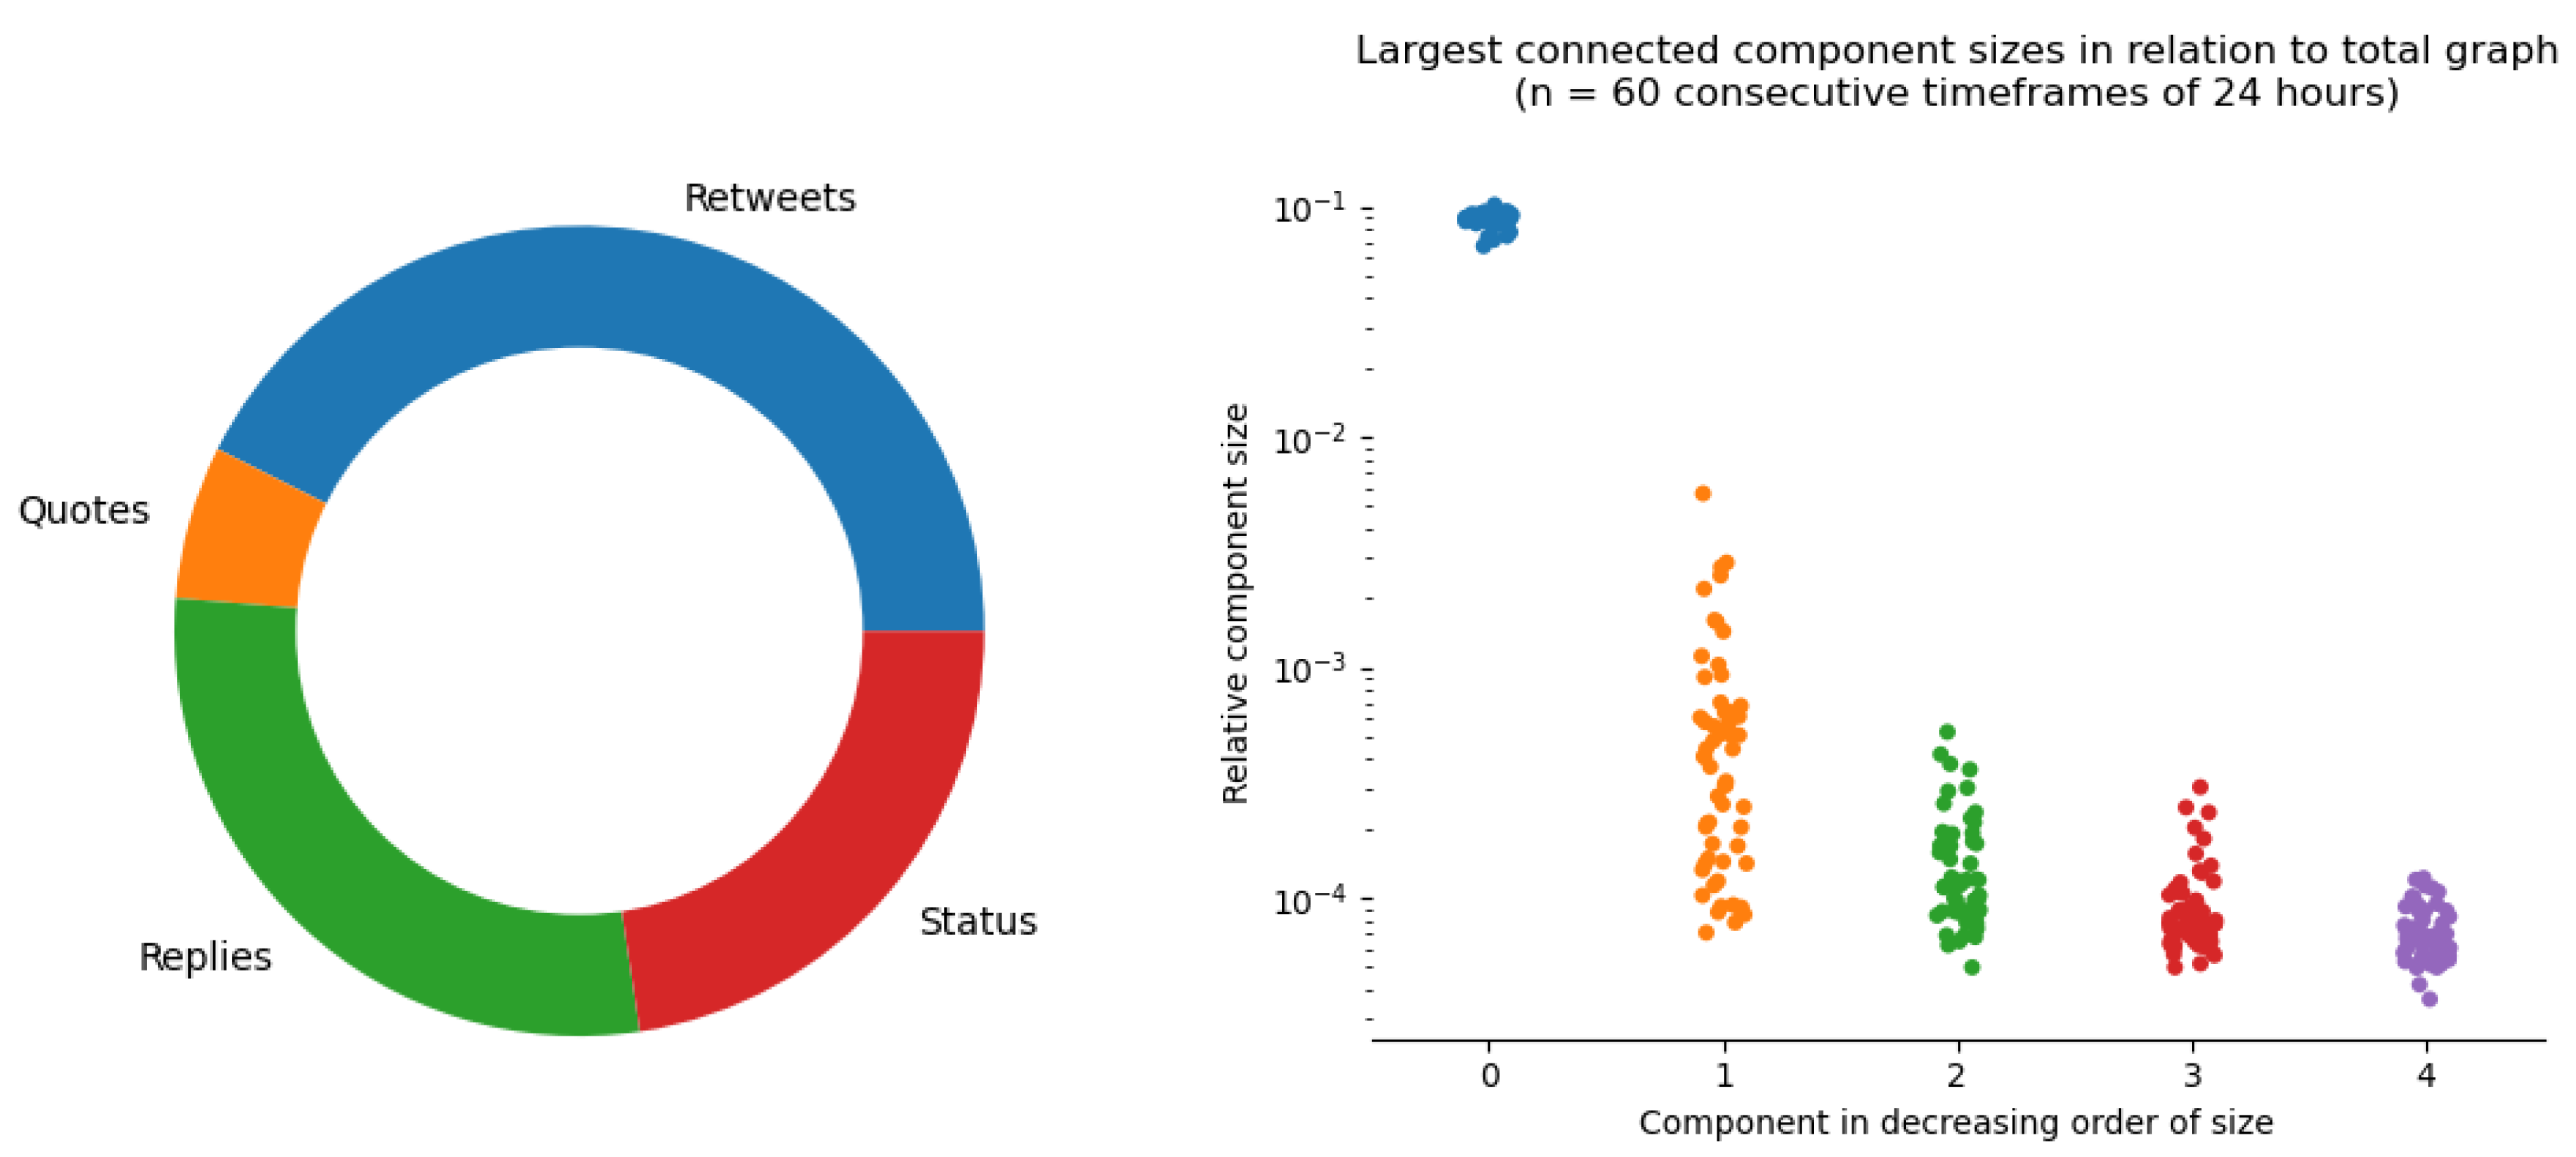
The second research question focuses on how much data is taken into account and for this scopes of the interaction graph can be reliably used to make conclusions. Figure 12 shows the observed ratio of retweets, quotes, replies, and status posts on the left. Retweets account for just over a third of all interactions. This third of the traffic has the advantage that it can be processed without computational intensive content analysis, i.e., complex NLP procedures.
The second question is how large the proportion of the largest connected component is within the overall retweet graph. Figure 12 (right side) shows this ratio for all 60 24 h graphs of the observation period. According to this, the largest connected component makes up about 10% of the full retweet graph. The second largest connected component only accounts for a maximum of 1%, and so on. The reader should consider that only accounts retweeted at least once were counted as part of the largest connected component. If we also include accounts that have not been retweeted once, the largest connected component would make up about 80% of the total graph (not shown in Figure 12). However, most of these accounts would be “dead and inactive” endpoints.
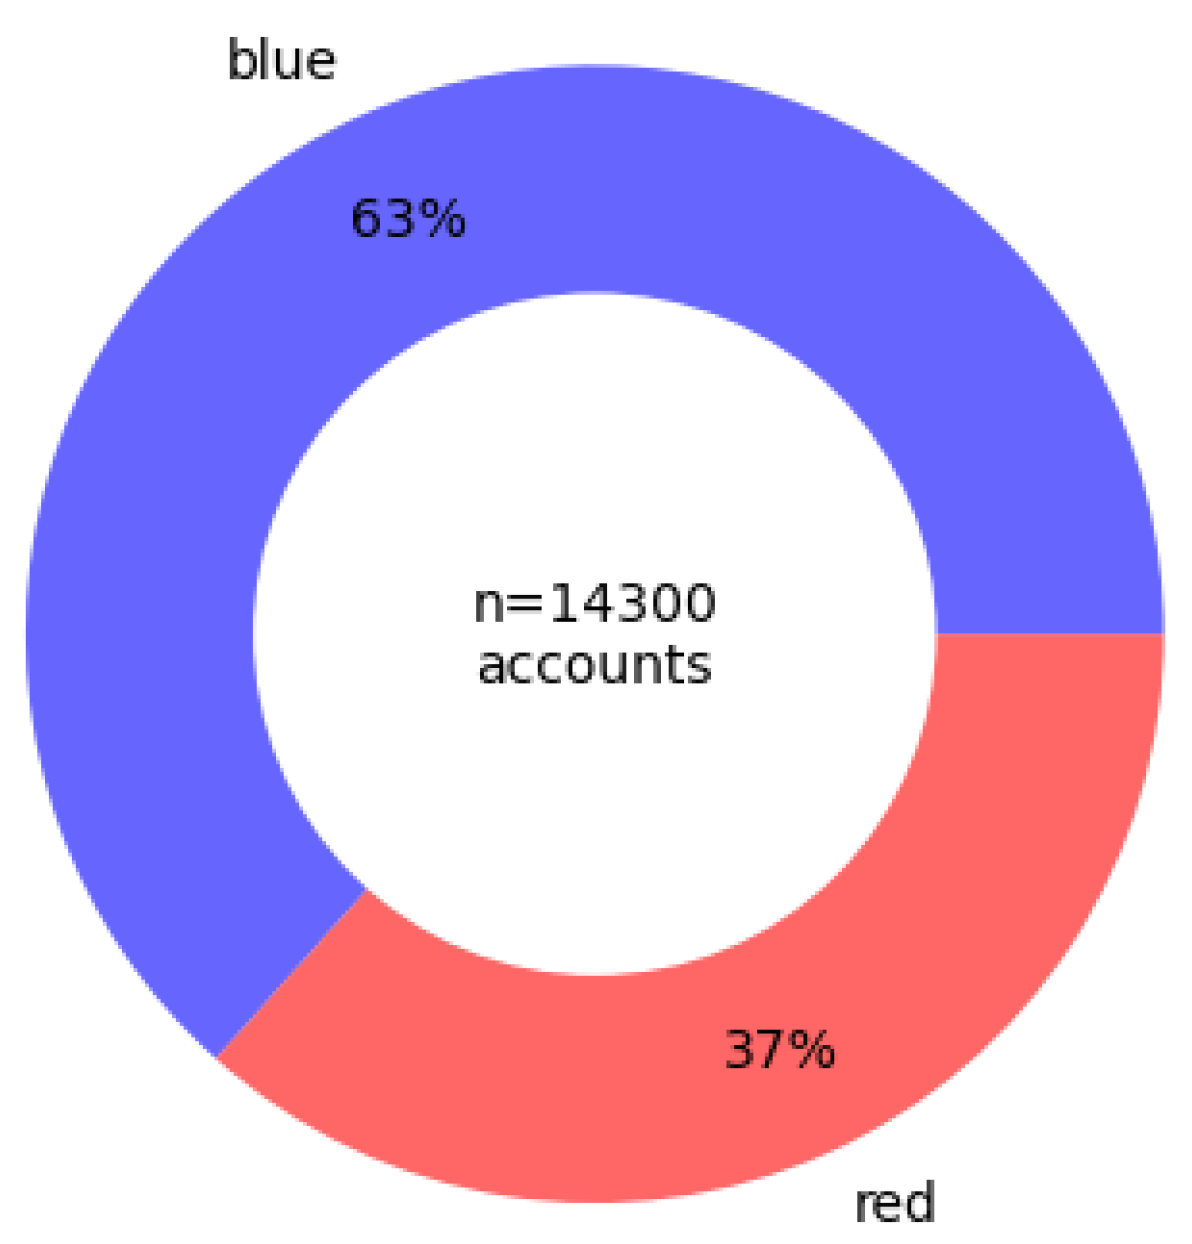
The reader should be aware that the presented approach derives insights into only about a third of the available data (retweets only), enabling categorizations of about 10% of the observed retweet network. Therefore, few conclusions about the bulk of the network’s interactions and accounts can be drawn. Estimates refer to only about 10% of the total network, of which about a third show “unusual” communication patterns. A typical ratio between the red and blue portions in the largest connected component is shown in Figure 13.
4. Discussion
So, the reader sees that there are also drawbacks to the presented structural analysis approach. One limitation is that structural analysis alone may not provide insight into the content or dynamics of echo chambers, so other methods, such as natural language processing, automatic sentiment, or even manual content analysis, may also be needed. The choice of community detection algorithm or centrality measure can also affect the results obtained.
4.1. Limitations
Graph-based analysis methods enabled the red and blue groups to be distinguished from each other in this study. However, which content is primarily exchanged in these echo chambers remains fundamentally unclear. In this study, we did not examine this content in detail, only for the most significant accounts with the highest authority values in the red and blue groups. Yet, it appears that the blue group makes up the majority with the usual political-content differences. Based on the authorities, the red group is more likely to share Covid-denying, alt-right theory, xenophobia and strongly right-wing populism content. In addition, pro-Russian narratives seem to be spread more and more, and some accounts give the impression of being run by Russian troll factories. However, the reader should be aware that this content analysis is somewhat preliminary and has not been carried out according to recognized scientific standards. However, the differences in content between the two groups seem astonishingly clear. Furthermore, only the German-language Twitter datastream was examined. Further studies should also study whether the presented approach can be applied to other language areas.
Most likely, the author assumes, the method loses its power when applied to several language areas simultaneously because connected components are then likely to form along the language areas. The polarity approach should thus reach its limits. Large and international language spaces such as English or Spanish could also become problematic, as these languages are used in different countries, different time zones, and very different social contexts (e.g., in Puerto Rico, Argentina, and Spain). English, the leading world language, is used internationally and is no longer oriented towards clearly definable language spaces.
However, the approach can derive a blue and a red group. Both groups are deduced exclusively based on a HITS metric. The fact that the red group mainly contains content that can be assigned to the alt-right spectrum may be pure coincidence or may only apply to the German language area. It could also be that these communities are systematically undermined by Russian troll activities and do not provide an accurate picture. This is up for further investigation.
4.2. Threats to Validity
The results of this study may be affected by internal and external threats to validity. Validity is an essential concept in data science studies as it determines the accuracy of the results obtained from the study. Validity refers to the extent to which a study measures what it is intended to measure. Internal and external threats to validity can affect the accuracy of a study’s results. Internal threats arise within the study, such as selection or instrumentation bias. External threats, such as media topics and political or other events, arise outside the study and are not entirely under the experimenter’s control. The following sections, therefore, address how the aspects and effects of both threats to validity were considered and minimized.
Selection Bias: Selection bias occurs when participants are not randomly selected for a study, resulting in a sample that does not accurately represent the studied population. This study deliberately worked with a sample of the complete German-speaking area. Studies have shown that the public Twitter streaming API provides representative data [23], so it can be assumed that this study has largely eliminated this bias.
History Bias: History bias occurs when events occurring before or during a study influence its results. The reader should be aware that the content analysis of Section 3.1, in particular, should be viewed against the background of events in December 2022 and January 2023. The study makes no claims that the procedure can identify right-wing populist themes, for example. The fact that these themes appear in the analysis has to do with the historical circumstances of the analysis period.
Maturation Bias: Maturation bias occurs when changes in participants’ behavior over time influence results obtained from a longitudinal study. This bias should not have occurred because the study’s findings were not used to influence any behavior. In other words, the analyzed accounts did not know that they were part of the study and, therefore, could not adjust their behavior.
Construct Validity: Construct validity refers to whether a measure accurately reflects what it is intended to measure (i.e., its construct). Within the framework of this study, it was possible to identify accounts in the right-wing populist community. Accounts that have a strong troll-like character and are presumably Kremlin-orchestrated also appear. This is undoubtedly an effect of the historical context (the Russia–Ukraine war) and the general political mood in Germany, which is characterized by increasing right-wing populist divisive movements. The study does not state that these effects exist to the same extent in other language areas. Nor is it possible to make any statement about how the process would behave if these effects no longer existed.
External Validity: External validity refers to whether findings from one sample can be generalized across other samples. This study examined the results in the context of a study lasting several months in German-speaking countries. Whether the results are transferable to shorter or longer periods and other language areas must be investigated in further studies.
5. Related Work
Although a significant increase in research on detecting and characterizing the echo chamber phenomenon in online social networks is observable, there is no standard definition of echo chamber or methodology to assess its existence, leading to different strategies for detection [43]. First, there is the question of whether there are approaches that can discover echo chambers in one or even several social networks. This study (like most other studies) focuses on a specific network, in this case, Twitter. Echo chamber detection approaches can be distinguished in terms of considering interaction structures or content [43].
- Content-based approaches focus on the leaning of content shared or consumed by users and their sentiment on controversy. For example, [46] investigate the political discourse on Facebook and Twitter between Liberals and Conservatives by identifying users sharing news articles aligning with their political beliefs. The authors of [47] adopt a comparable approach on Facebook but additionally take into account users’ exposure to diverse content from their news feed or friends.
- Network-based approaches focus on finding clustered topologies in users’ interactions. The authors of [35,36] explored online communication resembling an echo chamber by inferring users’ ideology through follow and retweet, and media slant shared and consumed. The authors of [37] tackled this task on Reddit, focusing on the 2016 Republican and Democrat election debate.
Furthermore, echo chamber detection approaches can be distinguished regarding their scale [43].
- Macro-scale echo chambers look at the users’ interaction network on an aggregated level, not taking into account differences within certain areas of the network. As an example, [17,37] examine whether the entire network is distinctly marked by two separated user groups, representing the two opposing sides of the controversy. Similarly, [34] employ a community detection method to look for a comparable outcome, but with the algorithm compelled to identify exactly two communities (polarity).
- Meso-scale echo chambers are a subset of nodes in the overall network that resembles an echo chamber and multiple echo chambers with the same ideological leaning can be identified. As an illustration [7] uses the modularity function to identify numerous compact clusters on Facebook pages.
6. Conclusions
This study investigated the use of purely structural analysis of communication and interaction patterns to identify echo chambers in a sample of the German-speaking Twitter network. The results suggest that the greedy modularity maximization and HITS metric are the most effective methods for identifying echo chambers. The analysis covers 60 consecutive 24-h periods and considers 180,000 accounts and their observed retweet interaction patterns. The results show that a red community (the echo chamber) is focused on fewer topics with a triad of anti-Covid, right-wing populism, and pro-Russian positions. In contrast, the blue community is more heterogeneous. However, it should be noted that the approach provides insights on only about a third of the available data (retweets only) and categorizations of about 10% of the observed retweet network, limiting the conclusions that can be drawn about the bulk of the network’s interactions and accounts. Therefore, few conclusions can be made about most of the network’s interactions and accounts.
Nevertheless, these analyses help to identify “problematic interaction patterns” in social networks with little effort. Social networks could, for example, give such echo chamber accounts less weight in their content recommender algorithms, as these accounts often only repeat the same content again and again. This could also minimize the misuse of social networks to spread disinformation by problematic actors (such as Russian disinformation bot networks). It is essential to understand that not the content but only the interaction patterns would be used as a decision criterion. This is, therefore, not censorship of content, which would also be problematic from the author’s point of view.
Funding
This research received no external funding.
Institutional Review Board Statement
Not applicable.
Data Availability Statement
The data used in this study is provided as dataset repository [44]. It has been recorded using this solution [33]. A continuously updated Zenodo repository can be used as well [48,49]. Due to data protection requirements and Twitter usage agreements, the data can only be requested and released for members of scientific institutions and scientific research questions. Data users must consider restrictions on the use of the data.
Acknowledgments
The author would like to thank the reviewers for their valuable feedback and time in reviewing the manuscript. Their insights have helped improve the quality. The author is grateful for their contributions to the scientific community.
Conflicts of Interest
The author declares no conflict of interest.
Appendix A

Table A1.
List of 20 accounts with the highest authority scores (HITS metric) recorded in the TOP-50 accounts of the red community in 60 consecutive time frames, sorted in descending order by frequency. These accounts are retweeted particularly frequently.
Table A1.
List of 20 accounts with the highest authority scores (HITS metric) recorded in the TOP-50 accounts of the red community in 60 consecutive time frames, sorted in descending order by frequency. These accounts are retweeted particularly frequently.
| Account | Verified | Description | Color | Topics |
|---|---|---|---|---|
| SHomburg | No | Professor, @UniHannover, Autor “Corona-Getwitter”, Leseprobe: http://bit.ly/3H9JIil (accessed on 1 February 2023) Bildung statt Haltung, Like ≠ Zustimmung | red | Covid anti-vaccination |
| george_orwell3 | No | Mit fast tödlicher Sicherheit bewegen wir uns auf ein Zeitalter totalitärer Diktaturen zu. | red | Russian misinfo, Kremlin propaganda, Covid anti-vaccination |
| Georg_Pazderski | Yes | Oberst i.G. (a.D.), Ehemaliger AfD-Fraktionsvorsitzender im Abgeordnetenhaus von Berlin (Follow und RT sind keine Zustimmung) | red | Politician, right-wing populism |
| rosenbusch_ | No | Independent Journalist/photographer, committed to the truth to the best of my knowledge and belief since 2001. | red | Russian misinfo, Covid anti-vaccination |
| reitschuster | Yes | In 16 Jahren als Korrespondent in Moskau allergisch geworden gegen Ideologen, Sozialismus-Nostalgiker und Journalisten-Kollegen, die die Regierung loben. | red | Covid anti-vaccination |
| RolandTichy | Yes | Roland Tichy, Gründer TichysEinblick; Das Leben ist kein Ponyhof | Impressum: https://tichyseinblick.de/impressum/ (accessed on 1 February 2023) | red | Journalist, market liberalism |
| Eddie_1412 | No | Was Lucky Luke im Wilden Westen bin ich auf Twitter. Ich blockiere schneller als mein Schatten... | red | Kremlin propaganda, right-wing populism, Russian misinfo |
| jreichelt | Yes | I’m back! | red | Online journalist, right-wing populism |
| ZentraleV | No | Zentrale Ermittlungsstelle fremde Medien Ost | red | Russian disinfo, Kremlin propaganda |
| MrJonasDanner | No | Der Account, vor dem euch die Tagesschau immer gewarnt hat. | red | Russian misinfo, Covid anti-vaccination |
| nikitheblogger | No | YouTuber mit 300,000 Abonnenten, freier Journalist und politischer Blogger | red | Online journalist, right-wing populism |
| ElliotStabler92 | No | Marcel | red | Conspiracy-related theories, Russian misinfo |
| DrPuerner | No | Facharzt für Öffentliches Gesundheitswesen, Epidemiologe, Impfstatus: privat | red | Medical, Covid anti-vaccination |
| RZitelmann | No | ILOVECAPITALISM Kapitalismus ist nicht das Problem, sondern die Lösung. Official German profile | red | Market liberalism, climate measures skeptics |
| OERRBlog | Yes | Kritische Beobachter des deutschen Öffentlich-rechtlichen Rundfunks. Für eine Verkleinerung und Kostenreduzierung. ReformOerr | red | Media blog |
| kripp_m | No | Eine Investition in Wissen bringt immer noch die besten Zinsen. (Benjamin Franklin) | red | Russian misinfo, Covid anti-vaccination |
| SILVERF26971227 | No | VOX POPULI-VOX DEI | red | Russian disinfo, Kremlin propaganda |
| FreifrauvonF | No | Natürlich Patriotin! Für ein Europa der Vaterländer! Du kannst alles verkaufen, nur nicht deine Leute und nicht dein Land. Pronomen: Mom/Milf | red | Right-wing populism |
| haintz_markus | No | Rechtsanwalt und Journalist FreeAssange | red | Right-wing populism, Russian misinfo, Covid anti-vaccination |
| MGGA2021h | No | Für ein starkes Europa mit eigenen Nationen. Für glückliche+ungeimpfte Kinder. Keine Islamisierung. “Journalist”. Master o.t.U. | red | Right-wing populism, Russian misinfo, Covid anti-vaccination |
Table A2.
List of 20 accounts with the highest authority scores (HITS metric) recorded in the TOP-50 accounts of the blue community in 60 consecutive time frames, sorted in descending order by frequency. These accounts are retweeted particularly frequently.
Table A2.
List of 20 accounts with the highest authority scores (HITS metric) recorded in the TOP-50 accounts of the blue community in 60 consecutive time frames, sorted in descending order by frequency. These accounts are retweeted particularly frequently.
| Account | Verified | Description | Color | Topics |
|---|---|---|---|---|
| tagesschau | Yes | Schlagzeilen von https://tagesschau.de (accessed on 1 February 2023) | blue | TV news, public service |
| derspiegel | Yes | Nachrichten, Analysen, Kommentare, Videos, Podcasts: Mehr als 500 SPIEGEL-Journalistinnen und Journalisten decken auf, setzen Themen und sorgen für Kontext. | blue | Print media |
| ShouraHashemi | No | Bitte googelt mich nicht. she/her | blue | Iran, activist |
| ZDFheute | No | Hier twittert die ZDFheute-Redaktion Nachrichten, Videos und Hintergründe. | blue | TV news, public service |
| BR24 | Yes | Hier ist Bayern. | blue | TV station, public service |
| Karl_Lauterbach | Yes | SPD Bundestagsabgeordneter, Bundesgesundheitsminister, der hier selbst und privat tweetet. | blue | Politician, health, Covid |
| NurderK | No | Skills can be taught. Character you either have or you do not have. | blue | Climate change, social fairness |
| GildaSahebi | Yes | Journalistin/Ärztin/Politikwissenschaftlerin, @tazgezwitscher, Antisemitismus, Rassismus, Naher Osten, Wissenschaft, Medizin. | blue | Activist, health, anti-racism, Near East |
| faznet | Yes | Die wichtigsten Nachrichten des Tages, die besten Faz.net-Artikel und Empfehlungen der Redaktion. | blue | Print media |
| ntvde | Yes | NTV Nachrichten: FürAlledieFragenhaben, Mehr von ntv: @ntv_EIL, @ntvde_politik, @teleboerse, @ntvde_Sport, @ntvde_Auto, @ntvpodcast | blue | TV news, private broadcaster |
| AufstandLastGen | No | Wir sind die LetzteGeneration, die den völligen Klimakollaps noch aufhalten kann! | blue | Activist, climate change |
| zeitonline | Yes | Ja, das ist unser offizieller Twitter-Account. Hier bekommen Sie die wichtigsten Geschichten und aktuelle News. | blue | Print media |
| VeroWendland | No | Energoblogger. Ecomodernist. Science, Technology, Society Studies. Eastern Europe. Status: Reaktorversteherin. | blue | Climate change, energy transition, pro-nuclear energy |
| Anonymous9775 | No | Hier twittert Anonymous gegen Faschismus, Rassismus, Ungerechtigkeit, Unterdrückung, Zensur, Kriege, Diktatoren, Sekten | blue | Activist, anti-racism, anti-war |
| LyllithB | No | nix mit Medien, Orwell, Psychedelic, Coffee, Tea, Seventies, HippieGoth, Sea, Regen, Pfalz, Yellow, Cohen, Dylan, Reed, Wader | blue | Influencer, diversity, gender |
| Gert_Woellmann | Yes | Landesvorstand der @fdphh, Kreisvorstand FDP Alstertal-Walddörfer | blue | Politician, liberalism, pro-Ukraine |
| NatalieAmiri | Yes | Int. Correspondent - 2015-20 Iran/Tehran ARD, @DasErste, German Television bureau chief-Anchorwoman @Weltspiegel_ARD, Autorin: “Zwischen den Welten” | blue | Journalist, Iran, Near East |
| AxelSchaumburg | No | Dezidiert liberal, Gegen Rechts- und Linksextremismus und alles Totalitäre, My only “phobias” are Naziphobia und Wokophobia, Following ≠ endorsement | blue | Entrepreneur, agriculture, forestry, liberalism |
| missdelein2 | No | Madeleine | blue | Activist, gender, diversity |
| RND_de | Yes | Exklusive News, interessante Hintergründe und fundierte Meinungen. Hier twittert das RedaktionsNetzwerk Deutschland (RND). | blue | Print media |
References
- KhosraviNik, M. Right wing populism in the west: Social media discourse and echo chambers. Insight Turk. 2017, 19, 53–68. [Google Scholar] [CrossRef]
- Boulianne, S.; Koc-Michalska, K.; Bimber, B. Right-wing populism, social media and echo chambers in Western democracies. New Media Soc. 2020, 22, 683–699. [Google Scholar] [CrossRef]
- Margetts, H. Rethinking democracy with social media. Political Q. 2018, 90, 107–123. [Google Scholar] [CrossRef]
- Persily, N.; Tucker, J.A. Social Media and Democracy: The State of the Field, Prospects for Reform; Cambridge University Press: Cambridge, UK, 2020. [Google Scholar]
- Barberá, P. Social Media, Echo Chambers, and Political Polarization; Cambridge University Press: Cambridge, UK, 2020; Volume 34. [Google Scholar]
- Ross Arguedas, A.; Robertson, C.; Fletcher, R.; Nielsen, R. Echo Chambers, Filter Bubbles, and Polarisation: A Literature Review; University of Oxford: Oxford, UK, 2022. [Google Scholar]
- Grömping, M. ‘Echo chambers’ partisan facebook groups during the 2014 Thai election. Asia Pac. Media Educ. 2014, 24, 39–59. [Google Scholar]
- Hayat, T.; Samuel-Azran, T. “You too, second screeners?” Second screeners’ echo chambers during the 2016 US elections primaries. J. Broadcast. Electron. Media 2017, 61, 291–308. [Google Scholar] [CrossRef]
- Guo, L.; Rohde, J.A.; Wu, H.D. Who is responsible for Twitter’s echo chamber problem? Evidence from 2016 US election networks. Inf. Commun. Soc. 2020, 23, 234–251. [Google Scholar] [CrossRef]
- Hänska, M.; Bauchowitz, S. Tweeting for Brexit: How social media influenced the referendum. In Brexit, Trump and the Media; Abramis Academic Publishing: Bury St Edmunds, UK, 2017; pp. 31–35. [Google Scholar]
- Bastos, M.; Mercea, D.; Baronchelli, A. The geographic embedding of online echo chambers: Evidence from the Brexit campaign. PLoS ONE 2018, 13, e0206841. [Google Scholar] [CrossRef]
- Gorodnichenko, Y.; Pham, T.; Talavera, O. Social media, sentiment and public opinions: Evidence from #Brexit and #USElection. Eur. Econ. Rev. 2021, 136, 103772. [Google Scholar]
- Badawy, A.; Ferrara, E.; Lerman, K. Analyzing the digital traces of political manipulation: The 2016 Russian interference Twitter campaign. In Proceedings of the 2018 IEEE/ACM International Conference on Advances in Social Networks Analysis and Mining (ASONAM), Barcelona, Spain, 28–31 August 2018; pp. 258–265. [Google Scholar]
- Zannettou, S.; Caulfield, T.; De Cristofaro, E.; Sirivianos, M.; Stringhini, G.; Blackburn, J. Disinformation warfare: Understanding state-sponsored trolls on Twitter and their influence on the web. In Proceedings of the Companion Proceedings of the 2019 World Wide Web Conference, San Francisco, CA, USA, 13–17 May 2019; pp. 218–226. [Google Scholar]
- Golovchenko, Y.; Buntain, C.; Eady, G.; Brown, M.A.; Tucker, J.A. Cross-platform state propaganda: Russian trolls on Twitter and YouTube during the 2016 US presidential election. Int. J. Press. 2020, 25, 357–389. [Google Scholar] [CrossRef] [Green Version]
- Karami, A.; Lundy, M.; Webb, F.; Turner-McGrievy, G.; McKeever, B.W.; McKeever, R. Identifying and analyzing health-related themes in disinformation shared by conservative and liberal Russian trolls on twitter. Int. J. Environ. Res. Public Health 2021, 18, 2159. [Google Scholar] [CrossRef]
- Cinelli, M.; Morales, G.D.F.; Galeazzi, A.; Quattrociocchi, W.; Starnini, M. The echo chamber effect on social media. Proc. Natl. Acad. Sci. USA 2021, 118, e2023301118. [Google Scholar] [CrossRef]
- Donkers, T.; Ziegler, J. The Dual Echo Chamber: Modeling Social Media Polarization for Interventional Recommending. In Proceedings of the 15th ACM Conference on Recommender Systems, RecSys ’21, Amsterdam, The Netherlands, 27 September–1 October 2021; Association for Computing Machinery: New York, NY, USA, 2021; pp. 12–22. [Google Scholar] [CrossRef]
- Ghanem, B.; Buscaldi, D.; Rosso, P. TexTrolls: Identifying Russian trolls on Twitter from a textual perspective. arXiv 2019, arXiv:1910.01340. [Google Scholar]
- Kim, D.; Graham, T.; Wan, Z.; Rizoiu, M.A. Analysing user identity via time-sensitive semantic edit distance (t-SED): A case study of Russian trolls on Twitter. J. Comput. Soc. Sci. 2019, 2, 331–351. [Google Scholar] [CrossRef] [Green Version]
- Im, J.; Chandrasekharan, E.; Sargent, J.; Lighthammer, P.; Denby, T.; Bhargava, A.; Hemphill, L.; Jurgens, D.; Gilbert, E. Still out there: Modeling and identifying russian troll accounts on twitter. In Proceedings of the 12th ACM Conference on Web Science, Southampton, UK, 6–10 July 2020; pp. 1–10. [Google Scholar]
- Zannettou, S.; Caulfield, T.; Bradlyn, B.; De Cristofaro, E.; Stringhini, G.; Blackburn, J. Characterizing the use of images in state-sponsored information warfare operations by russian trolls on twitter. In Proceedings of the International AAAI Conference on Web and Social Media, Dublin, Ireland, 4–7 June 2020; Volume 14, pp. 774–785. [Google Scholar]
- Wang, Y.; Callan, J.; Zheng, B. Should we use the sample? Analyzing datasets sampled from Twitter’s stream API. ACM Trans. Web TWEB 2015, 9, 1–23. [Google Scholar] [CrossRef]
- Bedi, P.; Sharma, C. Community detection in social networks. Wiley Interdiscip. Rev. Data Min. Knowl. Discov. 2016, 6, 115–135. [Google Scholar] [CrossRef]
- Landherr, A.; Friedl, B.; Heidemann, J. A critical review of centrality measures in social networks. Wirtschaftsinformatik 2010, 52, 367–382. [Google Scholar] [CrossRef]
- Das, K.; Samanta, S.; Pal, M. Study on centrality measures in social networks: A survey. Soc. Netw. Anal. Min. 2018, 8, 1–11. [Google Scholar] [CrossRef]
- Moody, J.; McFarland, D.; Bender-deMoll, S. Dynamic network visualization. Am. J. Sociol. 2005, 110, 1206–1241. [Google Scholar] [CrossRef] [Green Version]
- Jacomy, M.; Venturini, T.; Heymann, S.; Bastian, M. ForceAtlas2, a continuous graph layout algorithm for handy network visualization designed for the Gephi software. PLoS ONE 2014, 9, e98679. [Google Scholar] [CrossRef]
- Roesslein, J. Tweepy: Twitter for Python! 2020. Available online: https://github.com/tweepy/tweepy (accessed on 2 March 2023).
- Chodorow, K.; Dirolf, M. MongoDB-The Definitive Guide: Powerful and Scalable Data Storage; O’Reilly: Sebastopol, CA, USA, 2010; pp. I–XVII, 1–193. [Google Scholar]
- Kratzke, N. The #BTW17 Twitter Dataset - Recorded Tweets of the Federal Election Campaigns of 2017 for the 19th German Bundestag. Data 2017, 2, 34. [Google Scholar] [CrossRef] [Green Version]
- Kim, E.; Lee, K.; Yoo, C. On the Resource Management of Kubernetes. In Proceedings of the 2021 International Conference on Information Networking (ICOIN), Jeju Island, Republic of Korea, 13–16 January 2021; pp. 154–158. [Google Scholar] [CrossRef]
- Kratzke, N. Twista-Twitter Stream Recording and Analysis. GitLab Repository, 2023. Available online: https://git.mylab.th-luebeck.de/nane.kratzke/twista (accessed on 2 March 2023).
- Conover, M.; Ratkiewicz, J.; Francisco, M.; Gonçalves, B.; Menczer, F.; Flammini, A. Political polarization on twitter. In Proceedings of the International AAAI Conference on Web and Social Media, Barcelona, Spain, 17–21 July 2011; Volume 5, pp. 138–141. [Google Scholar]
- Barberá, P.; Jost, J.T.; Nagler, J.; Tucker, J.A.; Bonneau, R. Tweeting from left to right: Is online political communication more than an echo chamber? Psychol. Sci. 2015, 26, 1531–1542. [Google Scholar] [CrossRef] [PubMed]
- Garimella, K.; De Francisci Morales, G.; Gionis, A.; Mathioudakis, M. Political discourse on social media: Echo chambers, gatekeepers, and the price of bipartisanship. In Proceedings of the 2018 World Wide Web Conference, Lyon, France, 23–27 April 2018; pp. 913–922. [Google Scholar]
- Morales, G.D.F.; Monti, C.; Starnini, M. No echo in the chambers of political interactions on Reddit. Sci. Rep. 2021, 11, 1–12. [Google Scholar]
- Kernighan, B.W.; Lin, S. An Efficient Heuristic Procedure for Partitioning Graphs. Bell Syst. Tech. J. 1970, 49, 291–307. [Google Scholar] [CrossRef]
- Parés, F.; Garcia-Gasulla, D.; Vilalta, A.; Moreno, J.; Ayguadé, E.; Labarta, J.; Cortés, U.; Suzumura, T. Fluid Communities: A Competitive, Scalable and Diverse Community Detection Algorithm. arXiv 2017, arXiv:1703.09307. [Google Scholar]
- Clauset, A.; Newman, M.E.J.; Moore, C. Finding community structure in very large networks. Phys. Rev. Stat. Nonlinear Soft Matter Phys. 2004, 70 Pt 2, 066111. [Google Scholar] [CrossRef] [PubMed] [Green Version]
- Langville, A.N.; Meyer, C.D. A Survey of Eigenvector Methods for Web Information Retrieval. SIAM Rev. 2005, 47, 135–161. [Google Scholar] [CrossRef] [Green Version]
- Kleinberg, J.M. Authoritative Sources in a Hyperlinked Environment. J. ACM 1999, 46, 604–632. [Google Scholar] [CrossRef] [Green Version]
- Morini, V.; Pollacci, L.; Rossetti, G. Toward a Standard Approach for Echo Chamber Detection: Reddit Case Study. Appl. Sci. 2021, 11, 5390. [Google Scholar] [CrossRef]
- Kratzke, N. A One Percent Sample of German Twitter Retweet Traffic over Two Months. 2023. Available online: https://zenodo.org/record/7669923#.Y_8plB9ByUk (accessed on 2 March 2023).
- Aro, J. Putin’s Trolls: On the Frontlines of Russia’s Information War against the World; Blackstone Publishing: Ashland, OR, USA, 2022. [Google Scholar]
- An, J.; Quercia, D.; Crowcroft, J. Partisan sharing: Facebook evidence and societal consequences. In Proceedings of the 2nd ACM Conference on Online Social Networks, Dublin, Ireland, 1–2 October 2014; pp. 13–24. [Google Scholar]
- Bakshy, E.; Messing, S.; Adamic, L. Exposure to ideologically diverse news and opinion on Facebook. Science 2015, 348, 1130–1132. [Google Scholar] [CrossRef]
- Kratzke, N. Monthly Samples of German Tweets (2019–2022). 2022. Available online: https://zenodo.org/record/7528718#.Y_8p_R9ByUk (accessed on 2 March 2023).
- Kratzke, N. Monthly Samples of German Tweets. 2023. Available online: https://zenodo.org/record/7670098#.Y_8qEB9ByUk (accessed on 2 March 2023).
Figure 1.
The methodology followed in this study.

Figure 2.
Archtitecture used to record German-language Twitter traffic via the public streaming API. The public streaming API provides a representative sample of about 1% of the total traffic.
Figure 2.
Archtitecture used to record German-language Twitter traffic via the public streaming API. The public streaming API provides a representative sample of about 1% of the total traffic.

Figure 3.
Visualization of graph-based determination of echo chambers. An echo chamber is determined in multiple steps. Within the graph, the largest component is identified; within the largest component there are two polarized communities. The labeling of the communities in red and blue is carried out by a metric-based property analysis of both communities.

Figure 4.
Comparison of different centrality metrics.

Figure 5.
The visualization of an echo chamber in a graph recorded over 6 h. The node size of each observed account is set according to the authority metric of the observed accounts. It can be seen that accounts with high authority values are predominantly located in the red community (the echo chamber).

Figure 6.
Principle of how the echo chamber evaluation was conducted. Consecutive timespans were taken in each case. For each of these periods, a graph was formed and evaluated. The totality of the results of all graphs was evaluated within the framework of the evaluation as well to be able to collect statistical fluctuation ranges.

Figure 7.
Visualization of 45 consecutive time frames of different lengths (1 to 12 h). It can be clearly seen that, the longer a recording time frame is, the more clearly accounts can be assigned to red and blue communities (poorly classifiable accounts are shown in the middle of the diagrams).
Figure 7.
Visualization of 45 consecutive time frames of different lengths (1 to 12 h). It can be clearly seen that, the longer a recording time frame is, the more clearly accounts can be assigned to red and blue communities (poorly classifiable accounts are shown in the middle of the diagrams).

Figure 8.
Visualization of the frequency of blue/red classifications of about 180,000 Twitter accounts in two months. A 24 h time window was always used to classify an account as red or blue.
Figure 8.
Visualization of the frequency of blue/red classifications of about 180,000 Twitter accounts in two months. A 24 h time window was always used to classify an account as red or blue.

Figure 9.
Most top-ranked observed accounts of the red and blue communities. Hub (non-professional) accounts are displayed anonymously to protect personal rights. Important: the accounts’ categorizations were derived from retweeting behavior only. The red/blue categorization may therefore be debatable in individual cases.

Figure 10.
Content analysis of the accounts with the highest authority values in the blue and red communities. These accounts are frequently retweeted and therefore have a formative influence on the community. Accounts can be assigned to multiple categories (e.g., verified journalistic accounts). Other uncategorized accounts may exist if the totals do not add up to 100%.

Figure 11.
Content analysis of the accounts with the highest authority values in the blue and red communities. These accounts are frequently retweeted and therefore have a formative influence on the community.
Figure 11.
Content analysis of the accounts with the highest authority values in the blue and red communities. These accounts are frequently retweeted and therefore have a formative influence on the community.

Figure 12.
Visualization of connected component sizes. On the left side, one can see the observed share of Twitter interactions (retweet, quote, reply, status post). Only retweet interactions have been used in this study. On the right side, one can see the size differences of the largest (n = 0), second largest (n = 1), and so on connected components of the retweet graph.

Figure 13.
Exemplary evaluation of a largest connected component of the serial examination. Typically, the ratio of red to blue accounts is about 1 to 3, so red nodes make up only about 1/3 of the accounts, but share a disproportionate amount of content and therefore dominate the attention of many content recommender algorithms.

Disclaimer/Publisher’s Note: The statements, opinions and data contained in all publications are solely those of the individual author(s) and contributor(s) and not of MDPI and/or the editor(s). MDPI and/or the editor(s) disclaim responsibility for any injury to people or property resulting from any ideas, methods, instructions or products referred to in the content. |
© 2023 by the author. Licensee MDPI, Basel, Switzerland. This article is an open access article distributed under the terms and conditions of the Creative Commons Attribution (CC BY) license (https://creativecommons.org/licenses/by/4.0/).
Share and Cite
MDPI and ACS Style
Kratzke, N. How to Find Orchestrated Trolls? A Case Study on Identifying Polarized Twitter Echo Chambers. Computers 2023, 12, 57. https://doi.org/10.3390/computers12030057
AMA Style
Kratzke N. How to Find Orchestrated Trolls? A Case Study on Identifying Polarized Twitter Echo Chambers. Computers. 2023; 12(3):57. https://doi.org/10.3390/computers12030057
Chicago/Turabian StyleKratzke, Nane. 2023. "How to Find Orchestrated Trolls? A Case Study on Identifying Polarized Twitter Echo Chambers" Computers 12, no. 3: 57. https://doi.org/10.3390/computers12030057
Note that from the first issue of 2016, this journal uses article numbers instead of page numbers. See further details here.