
A Tumor Microenvironment-Driven Network Regulated by STAT3 and p65 Negatively Controls the Enrichment of Cancer Stem Cells in Human HR+/HER2− Breast Cancer
 and
and 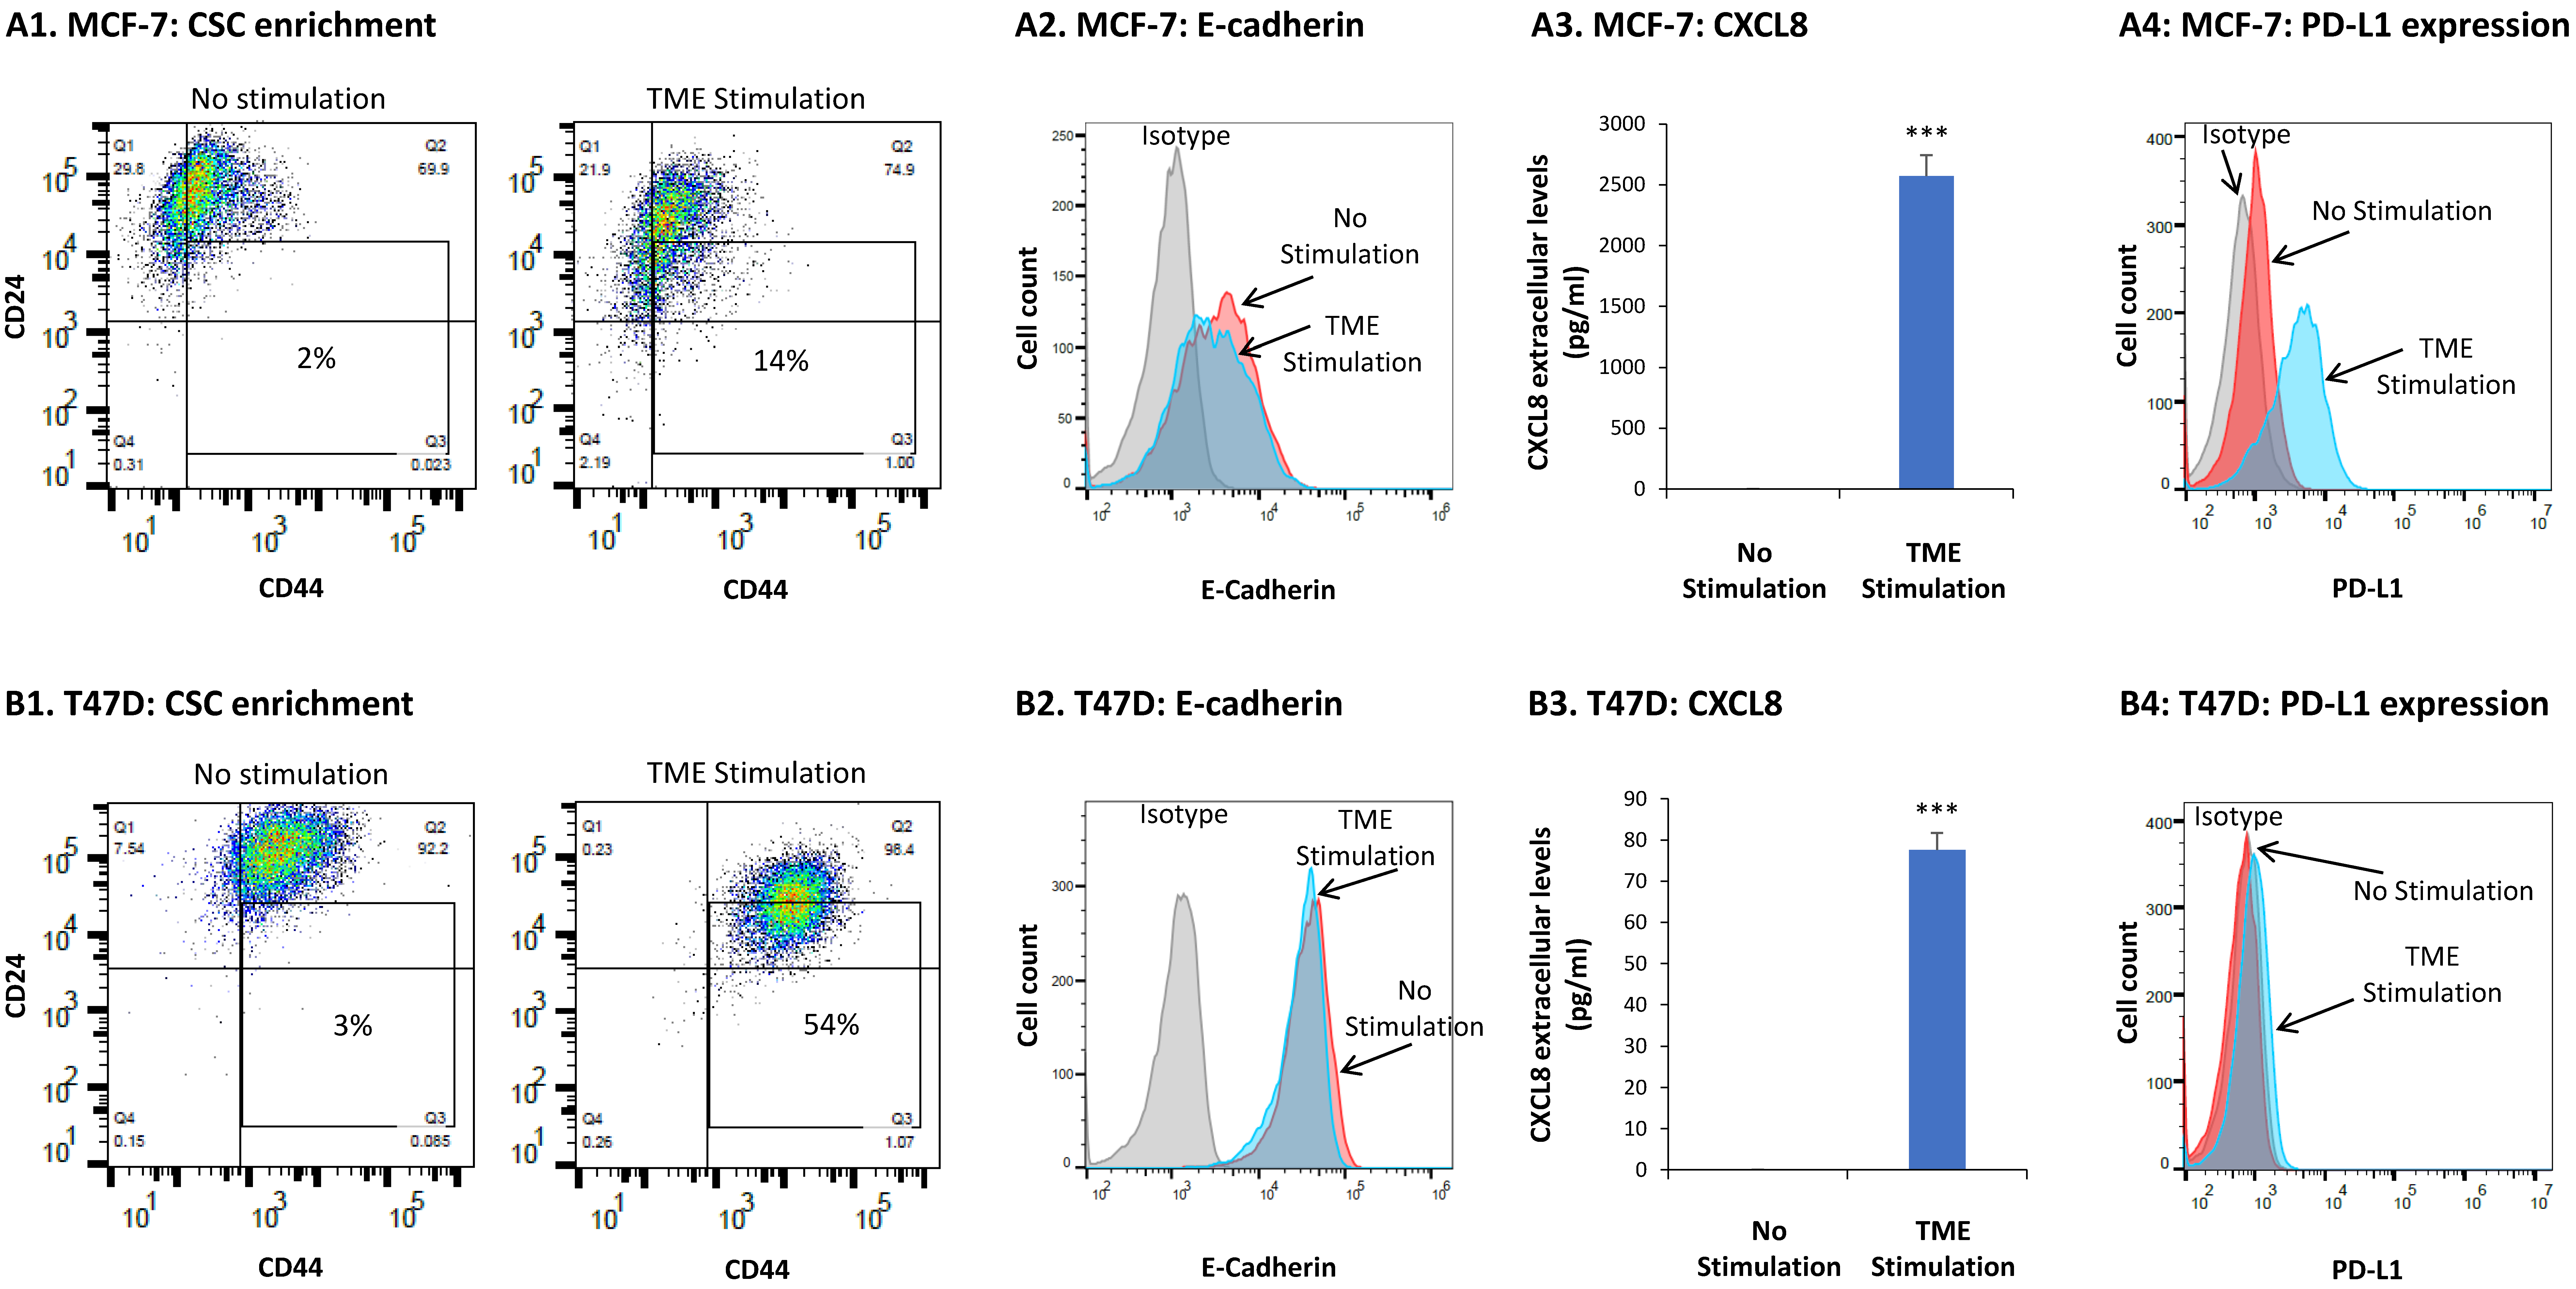
Abstract
:Simple Summary
Abstract
1. Introduction
2. Materials and Methods
2.1. Cell Cultures
2.2. Cell Exposure to TME Stimulation
2.3. Flow Cytometry Analyses
2.4. ELISA Analyses
2.5. Transcriptome RNAseq Analyses
2.6. Western Blot Analyses
2.7. Knock-Down of Target Genes
2.8. Generation of Cells Over-Expressing Wild Type STAT3 or Mutant STAT3
2.9. Analyses of Patient Databases
2.10. Data Presentation and Statistical Analyses
3. Results
3.1. TME Stimulation Promotes Multiple Tumor-Supporting Characteristics and Functions in HR+/HER2− Breast Cancer Cells
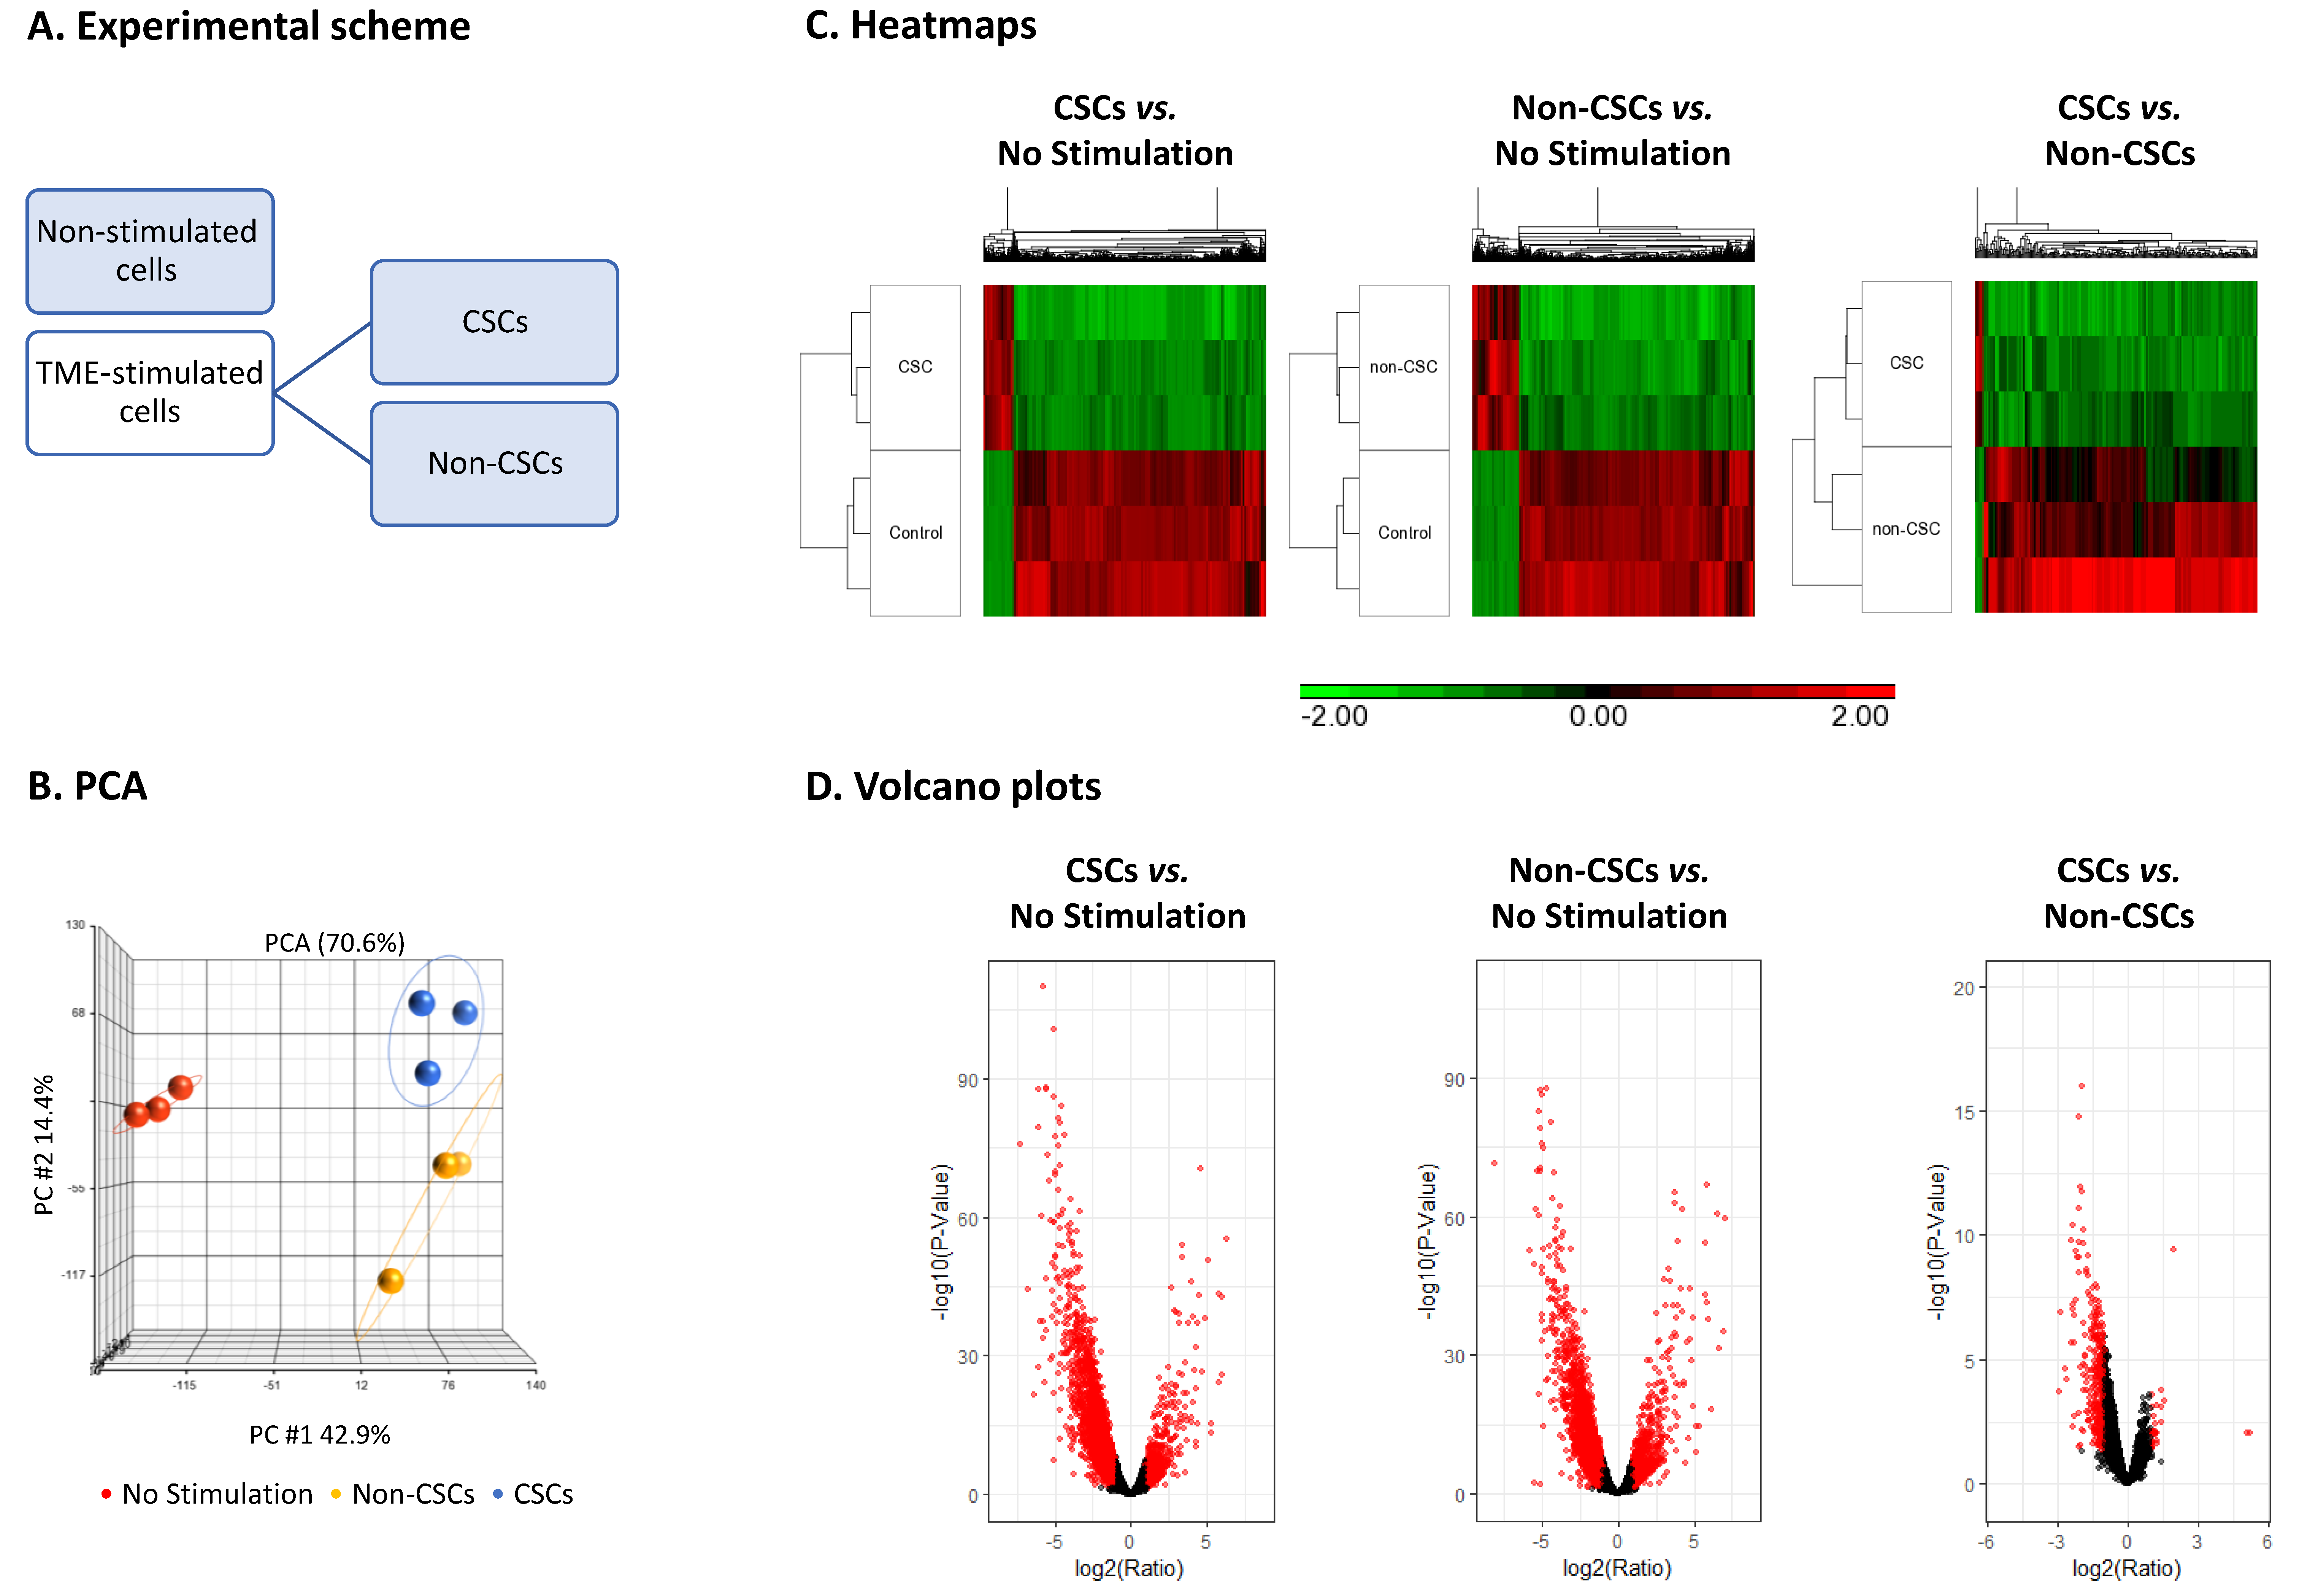
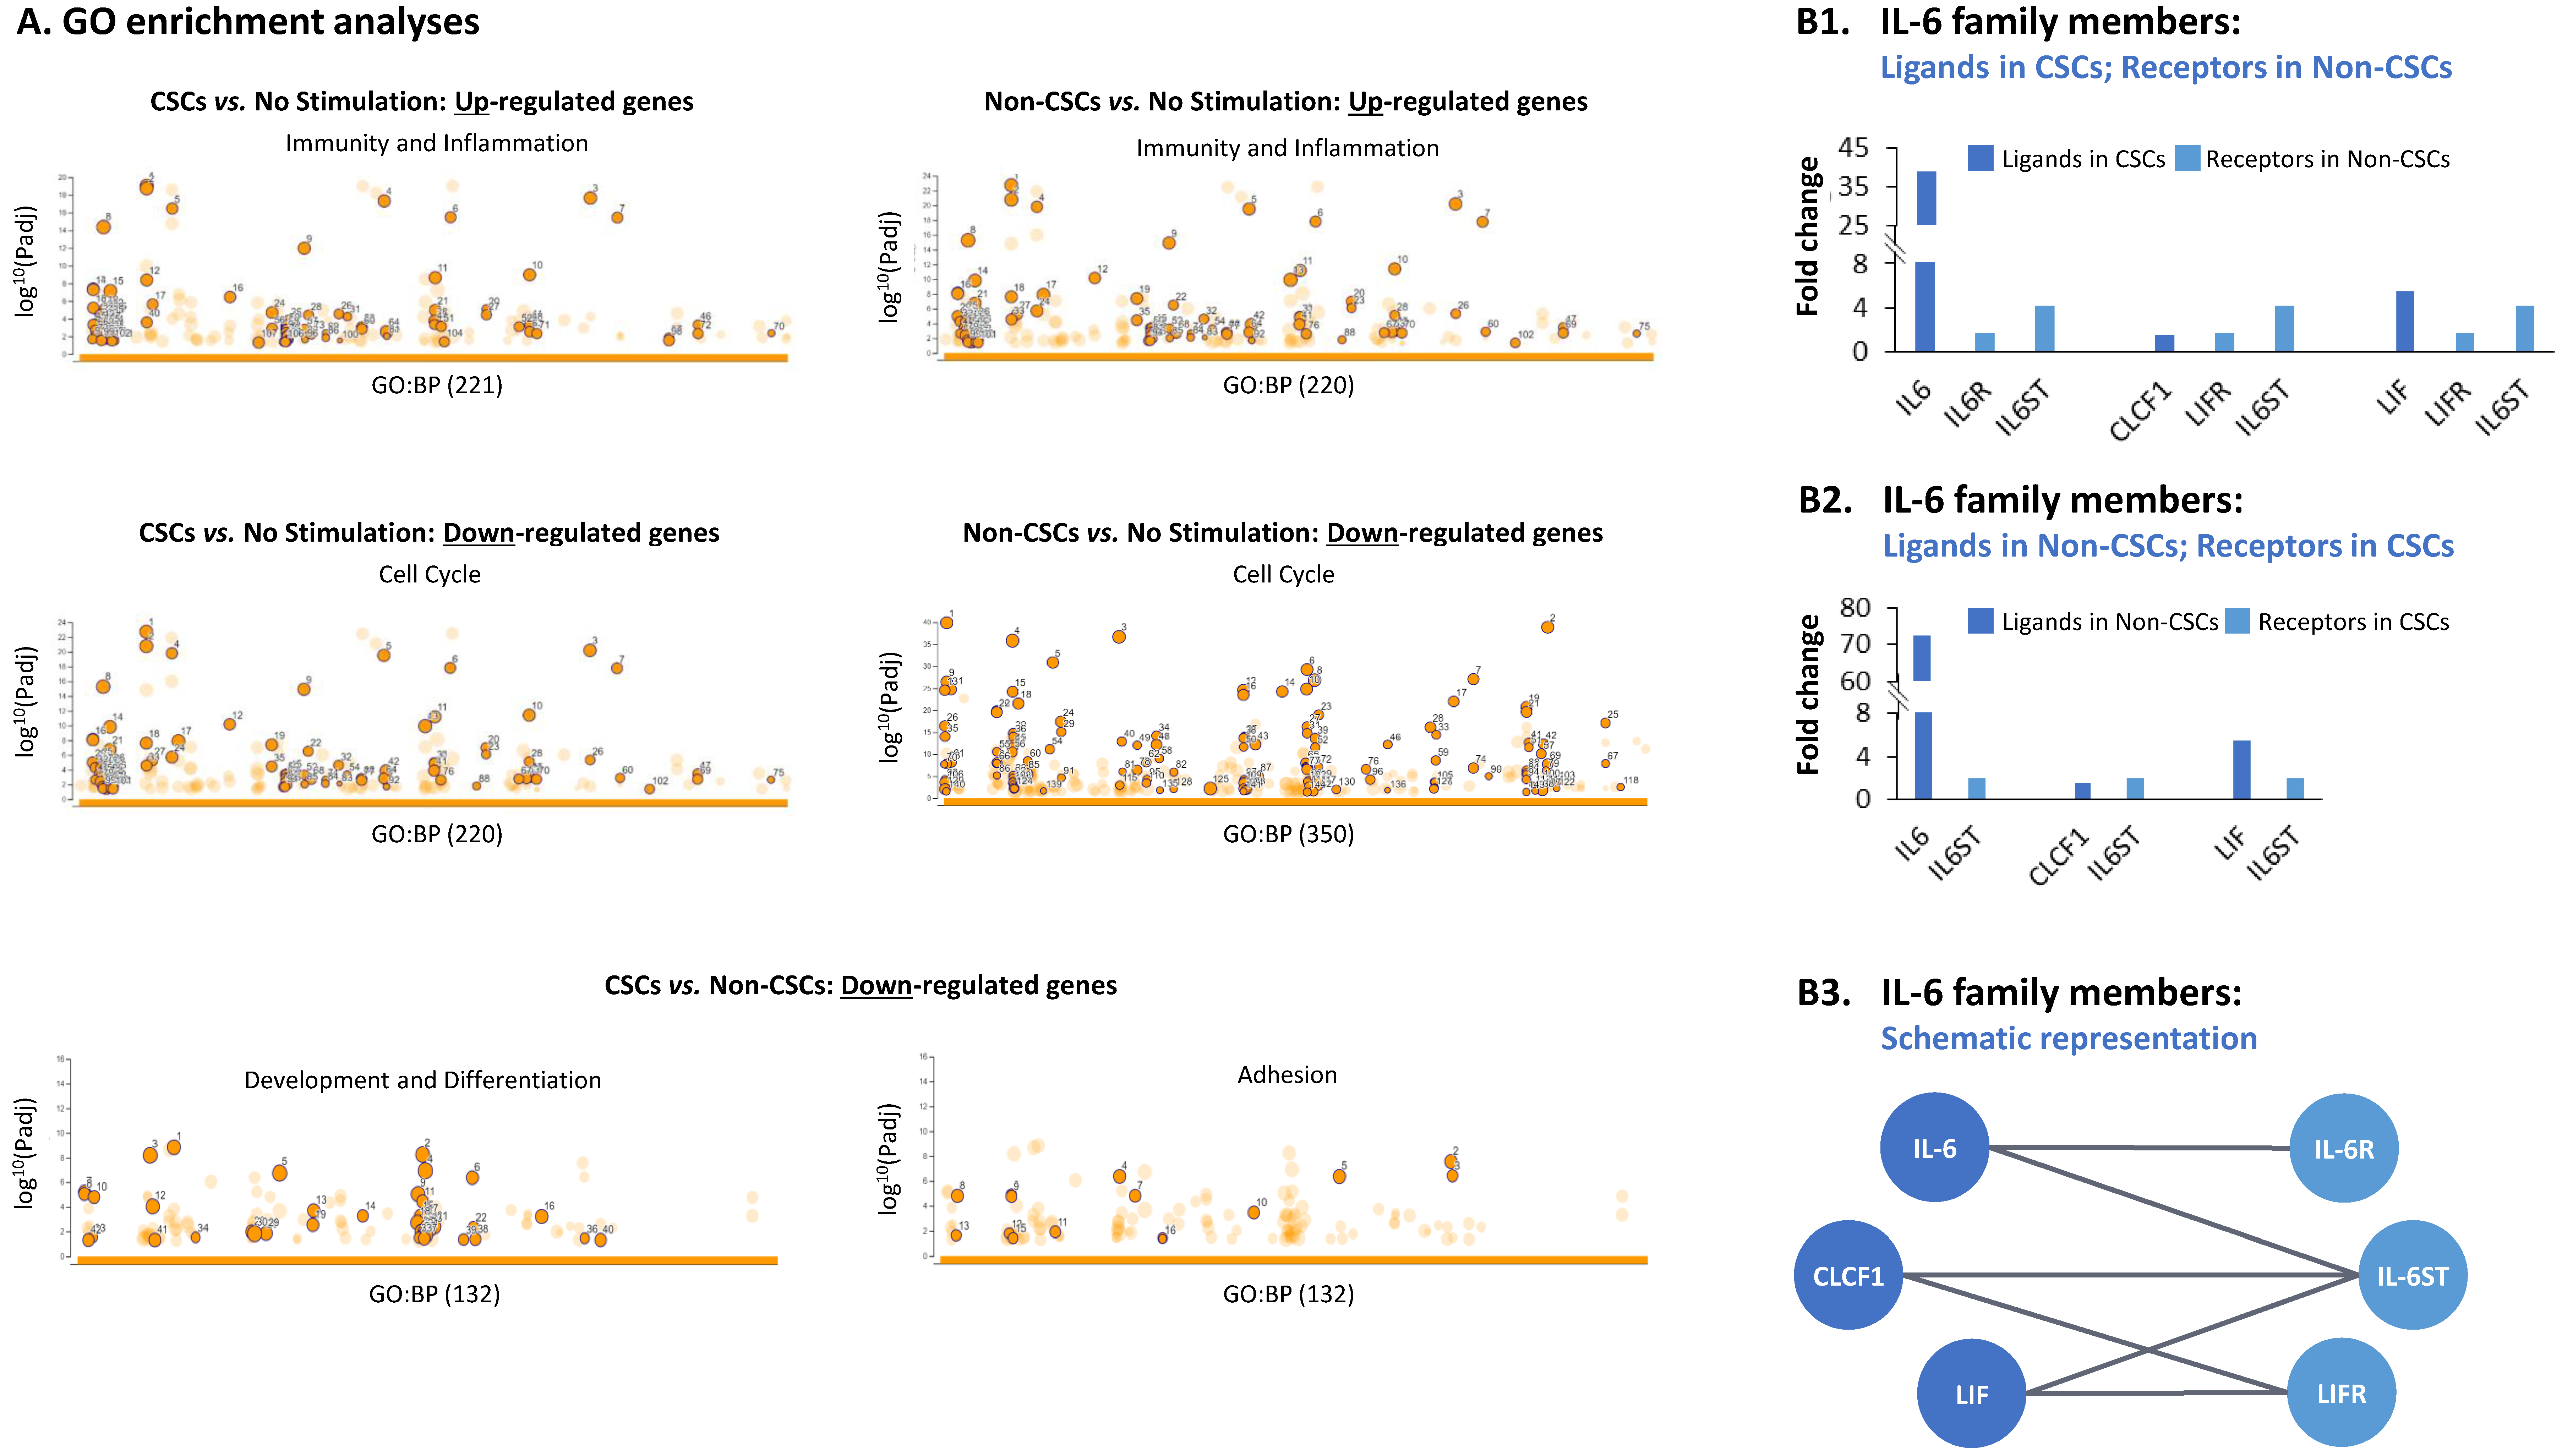
3.2. TME Stimulation Leads to Pronounced Alterations in Gene Signatures of HR+/HER2− Breast Cancer Cells
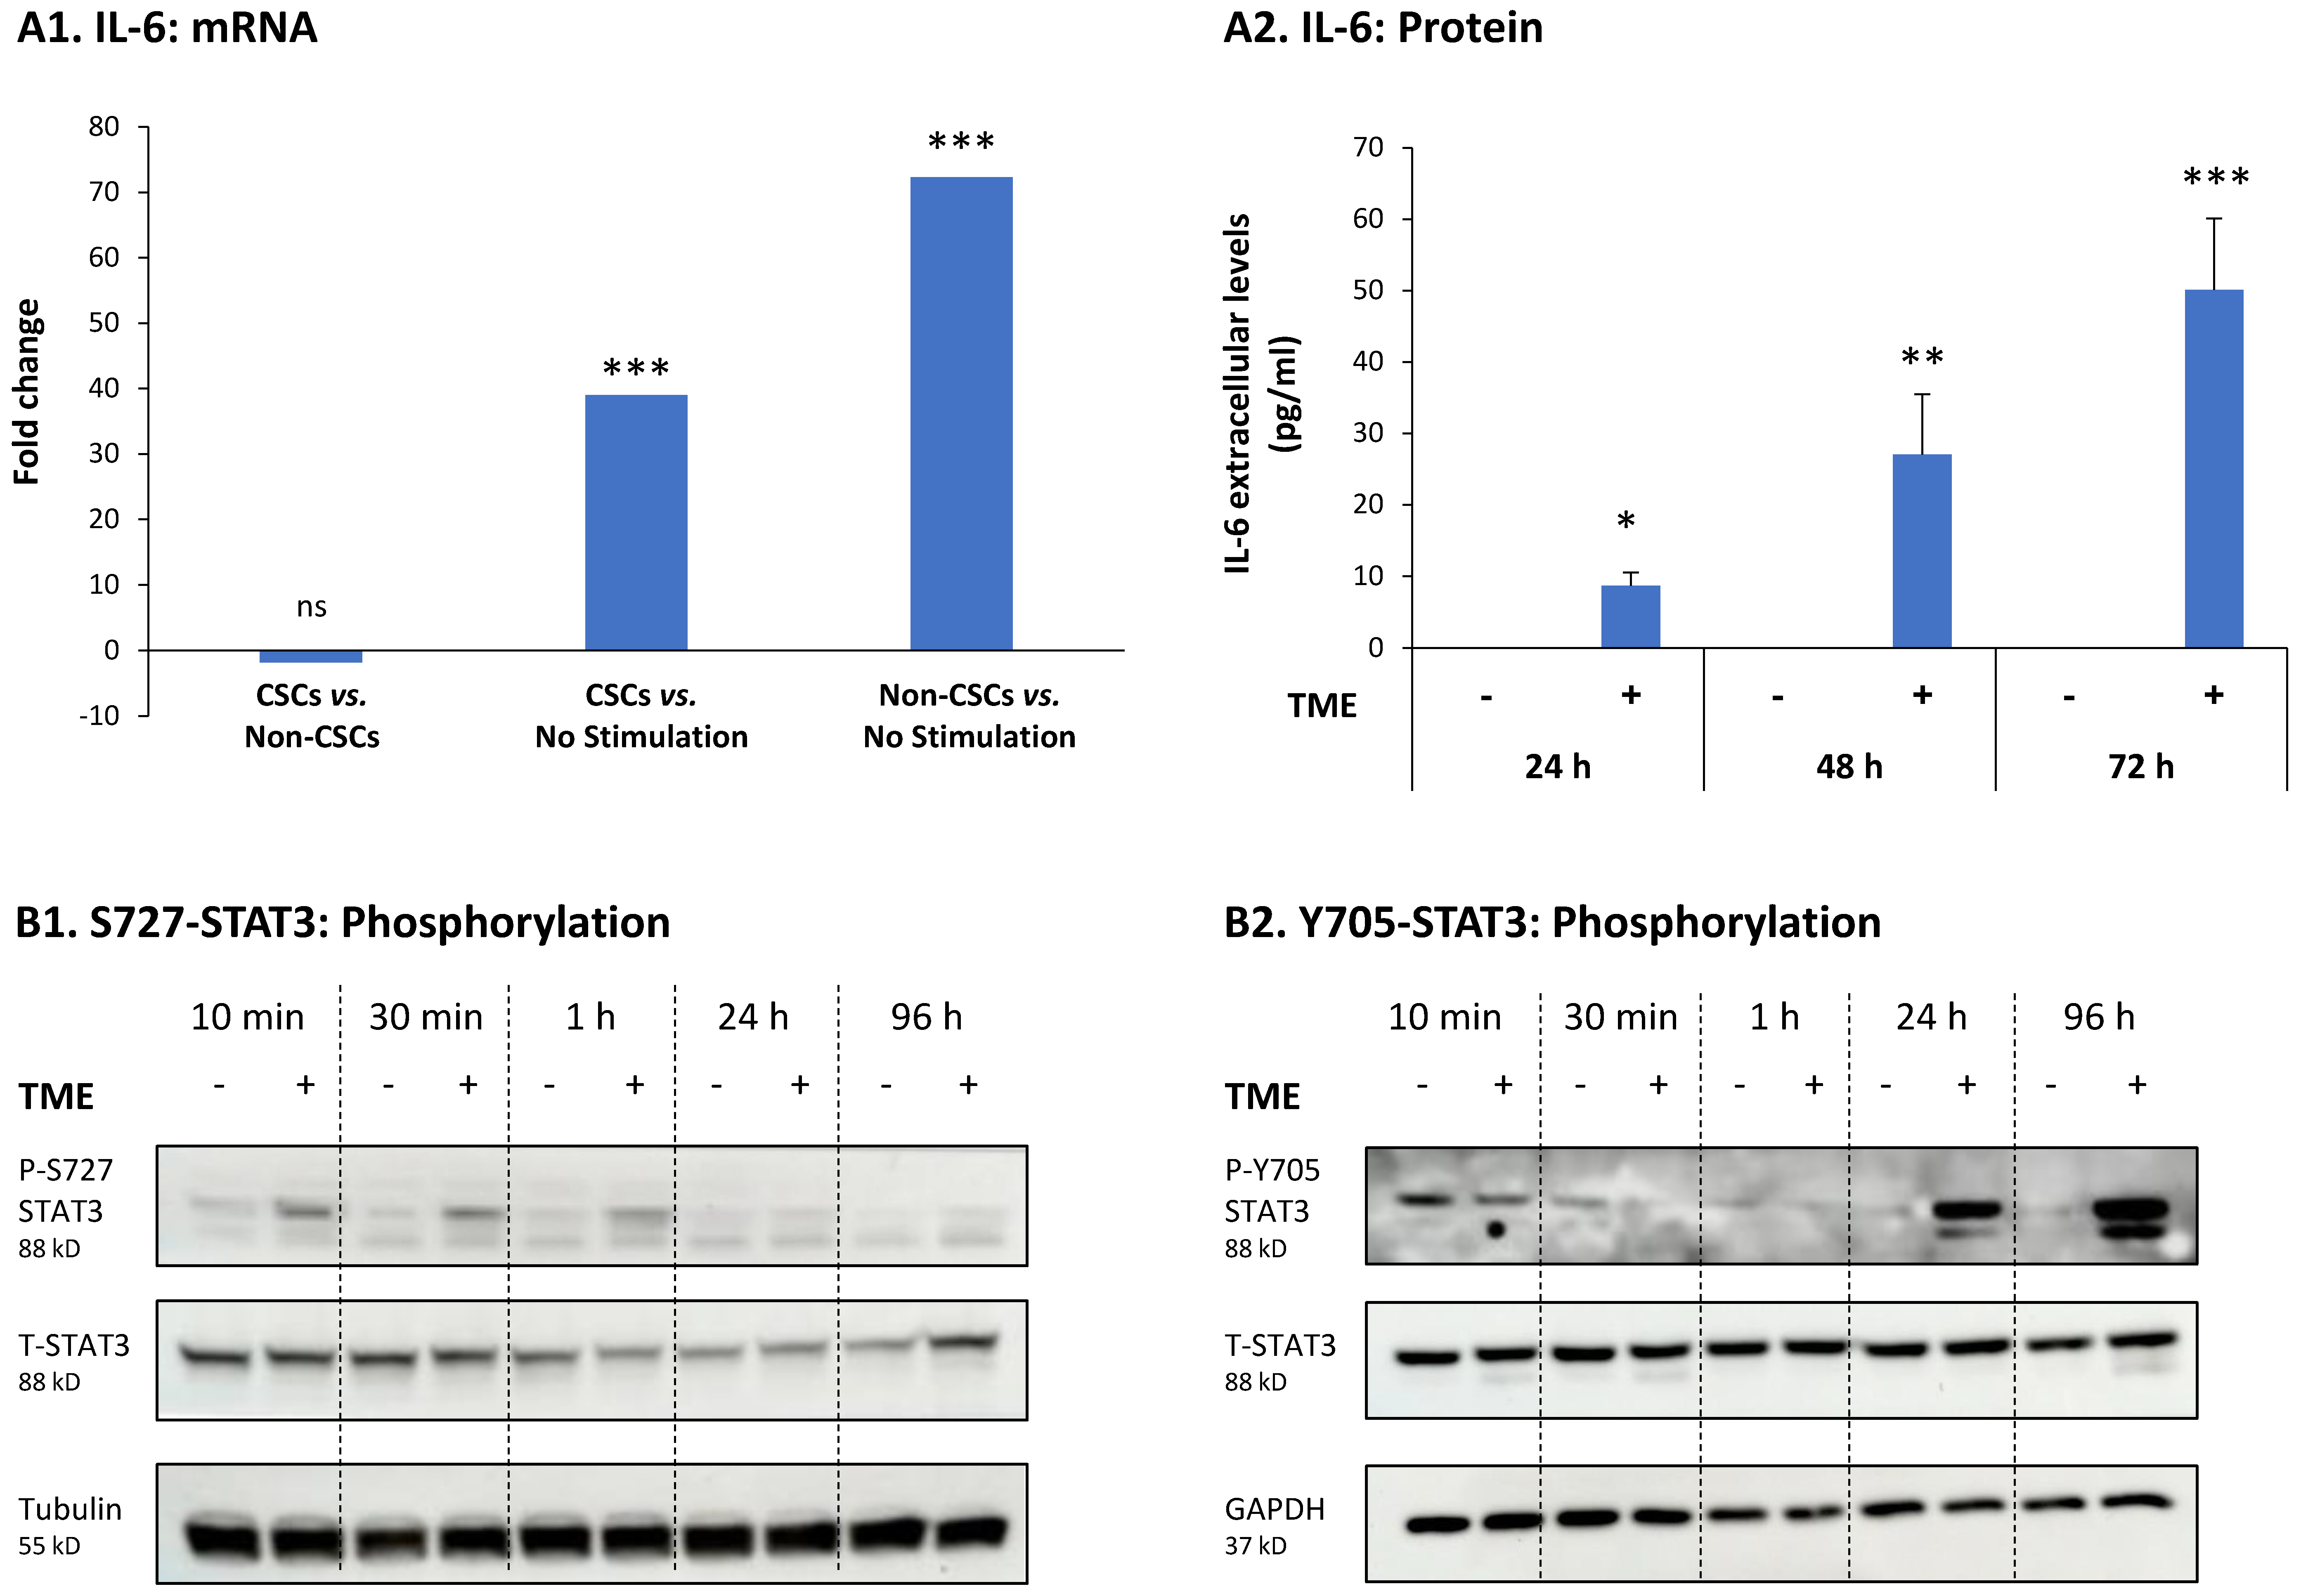
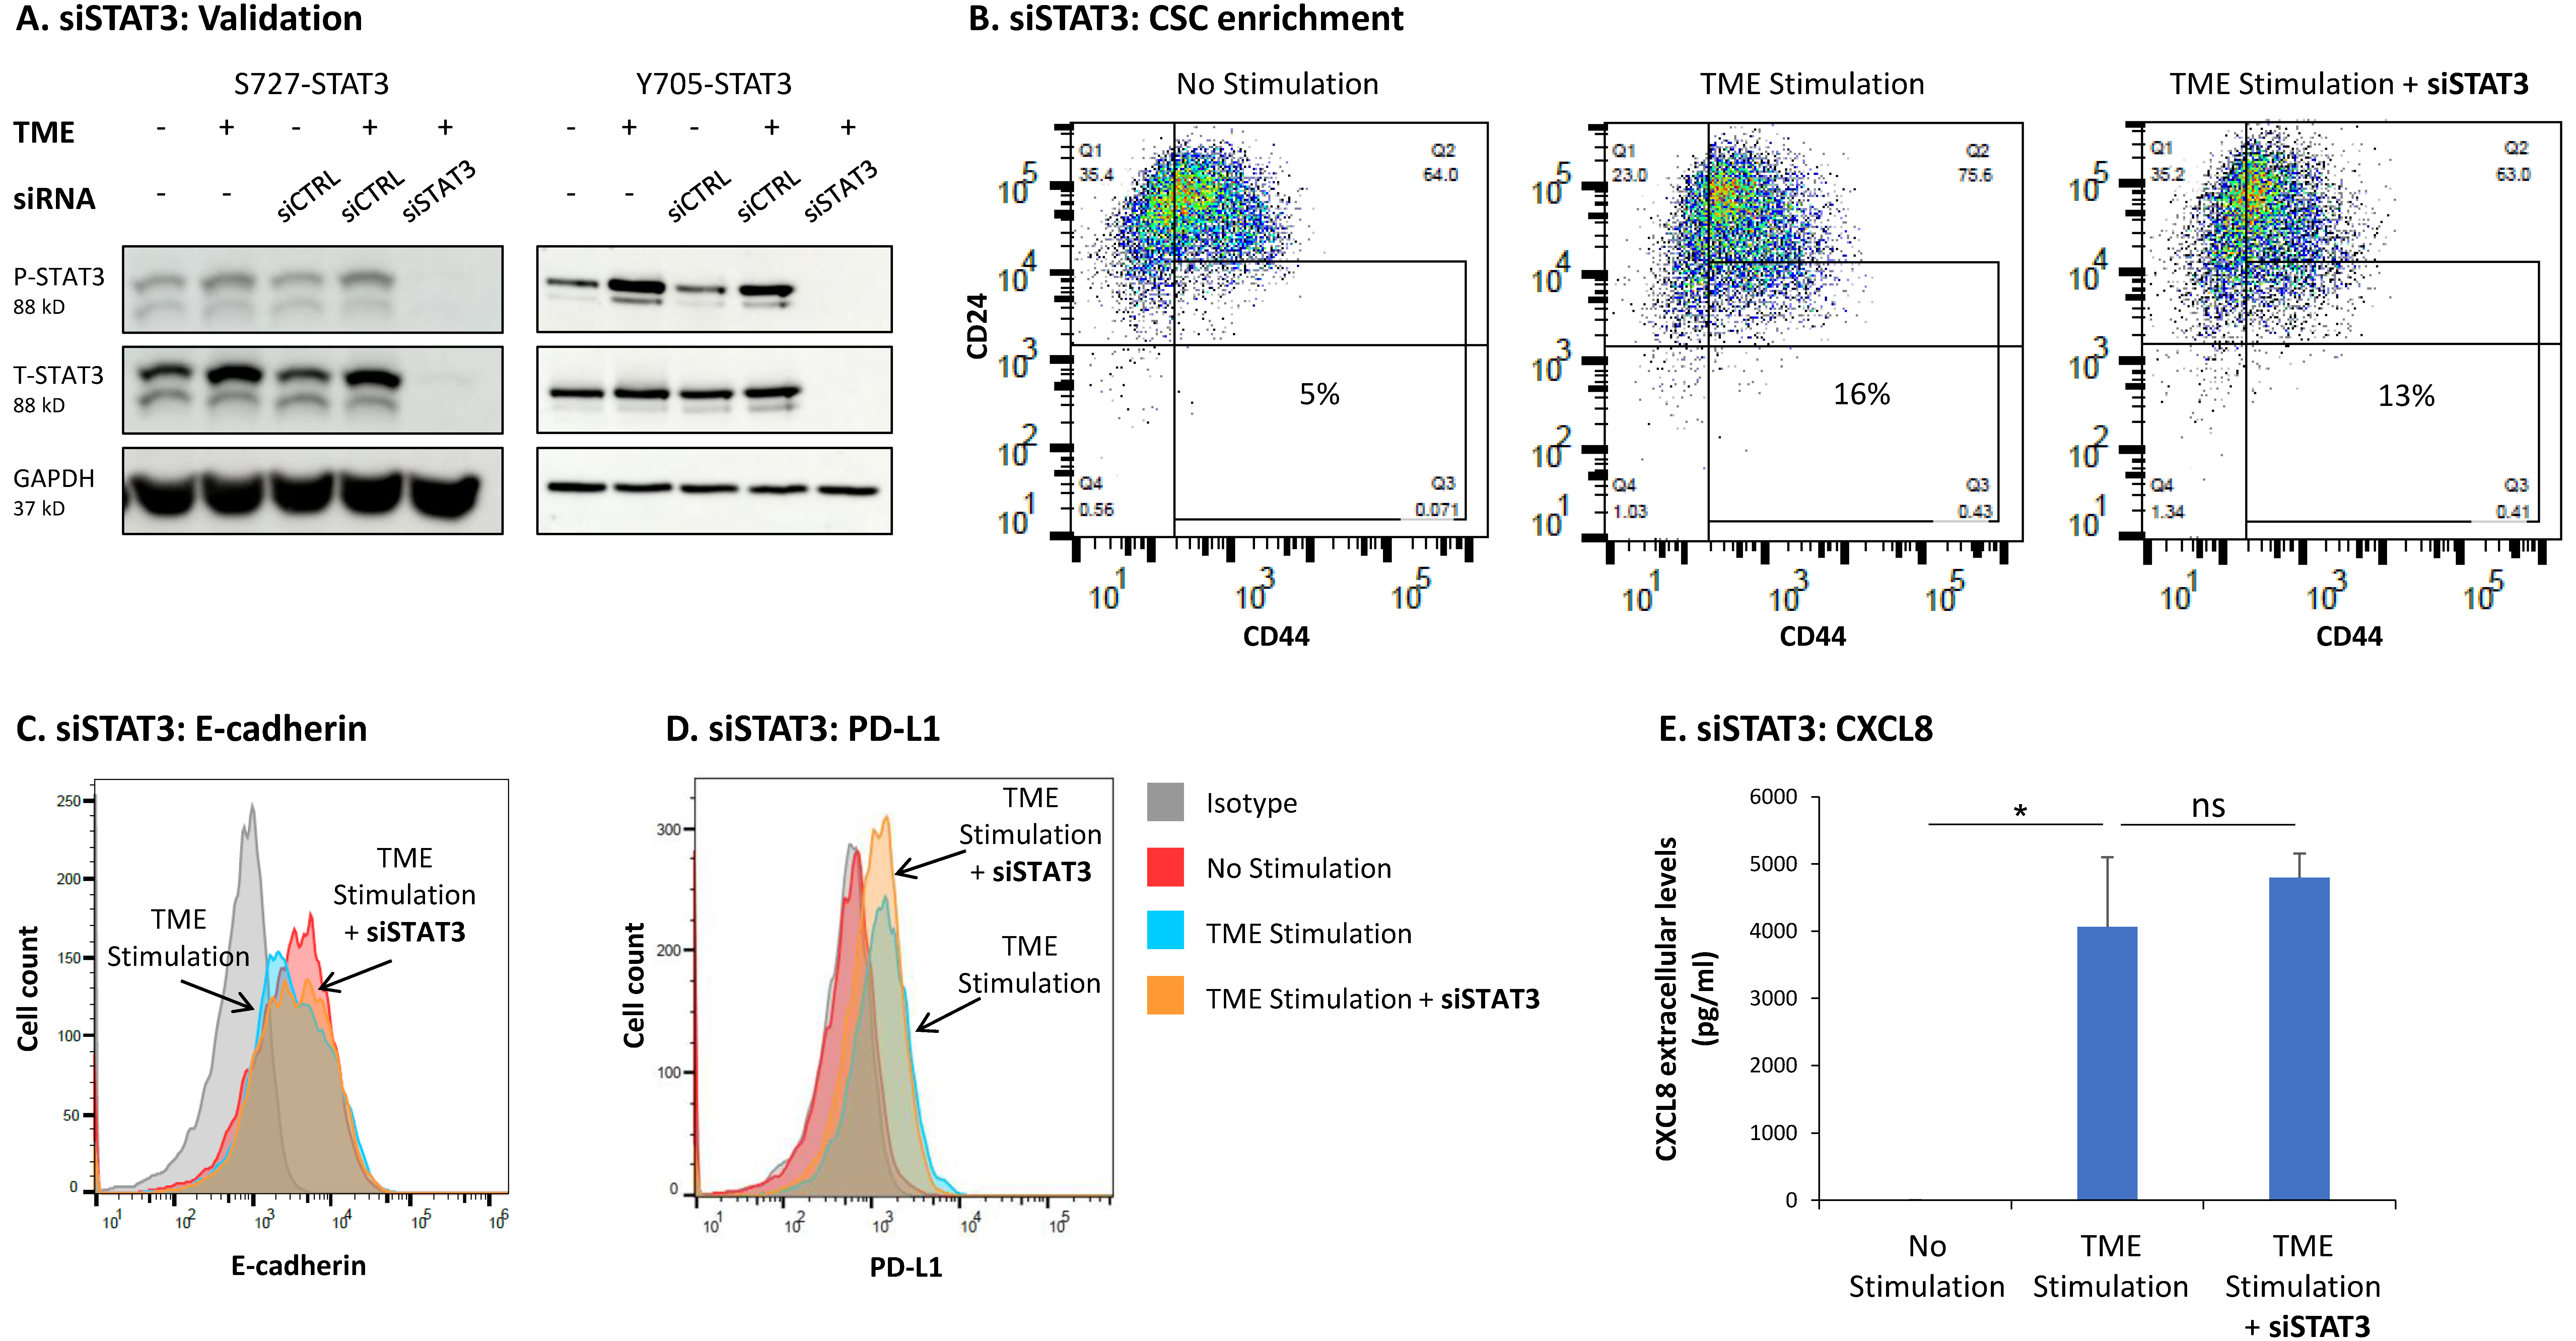
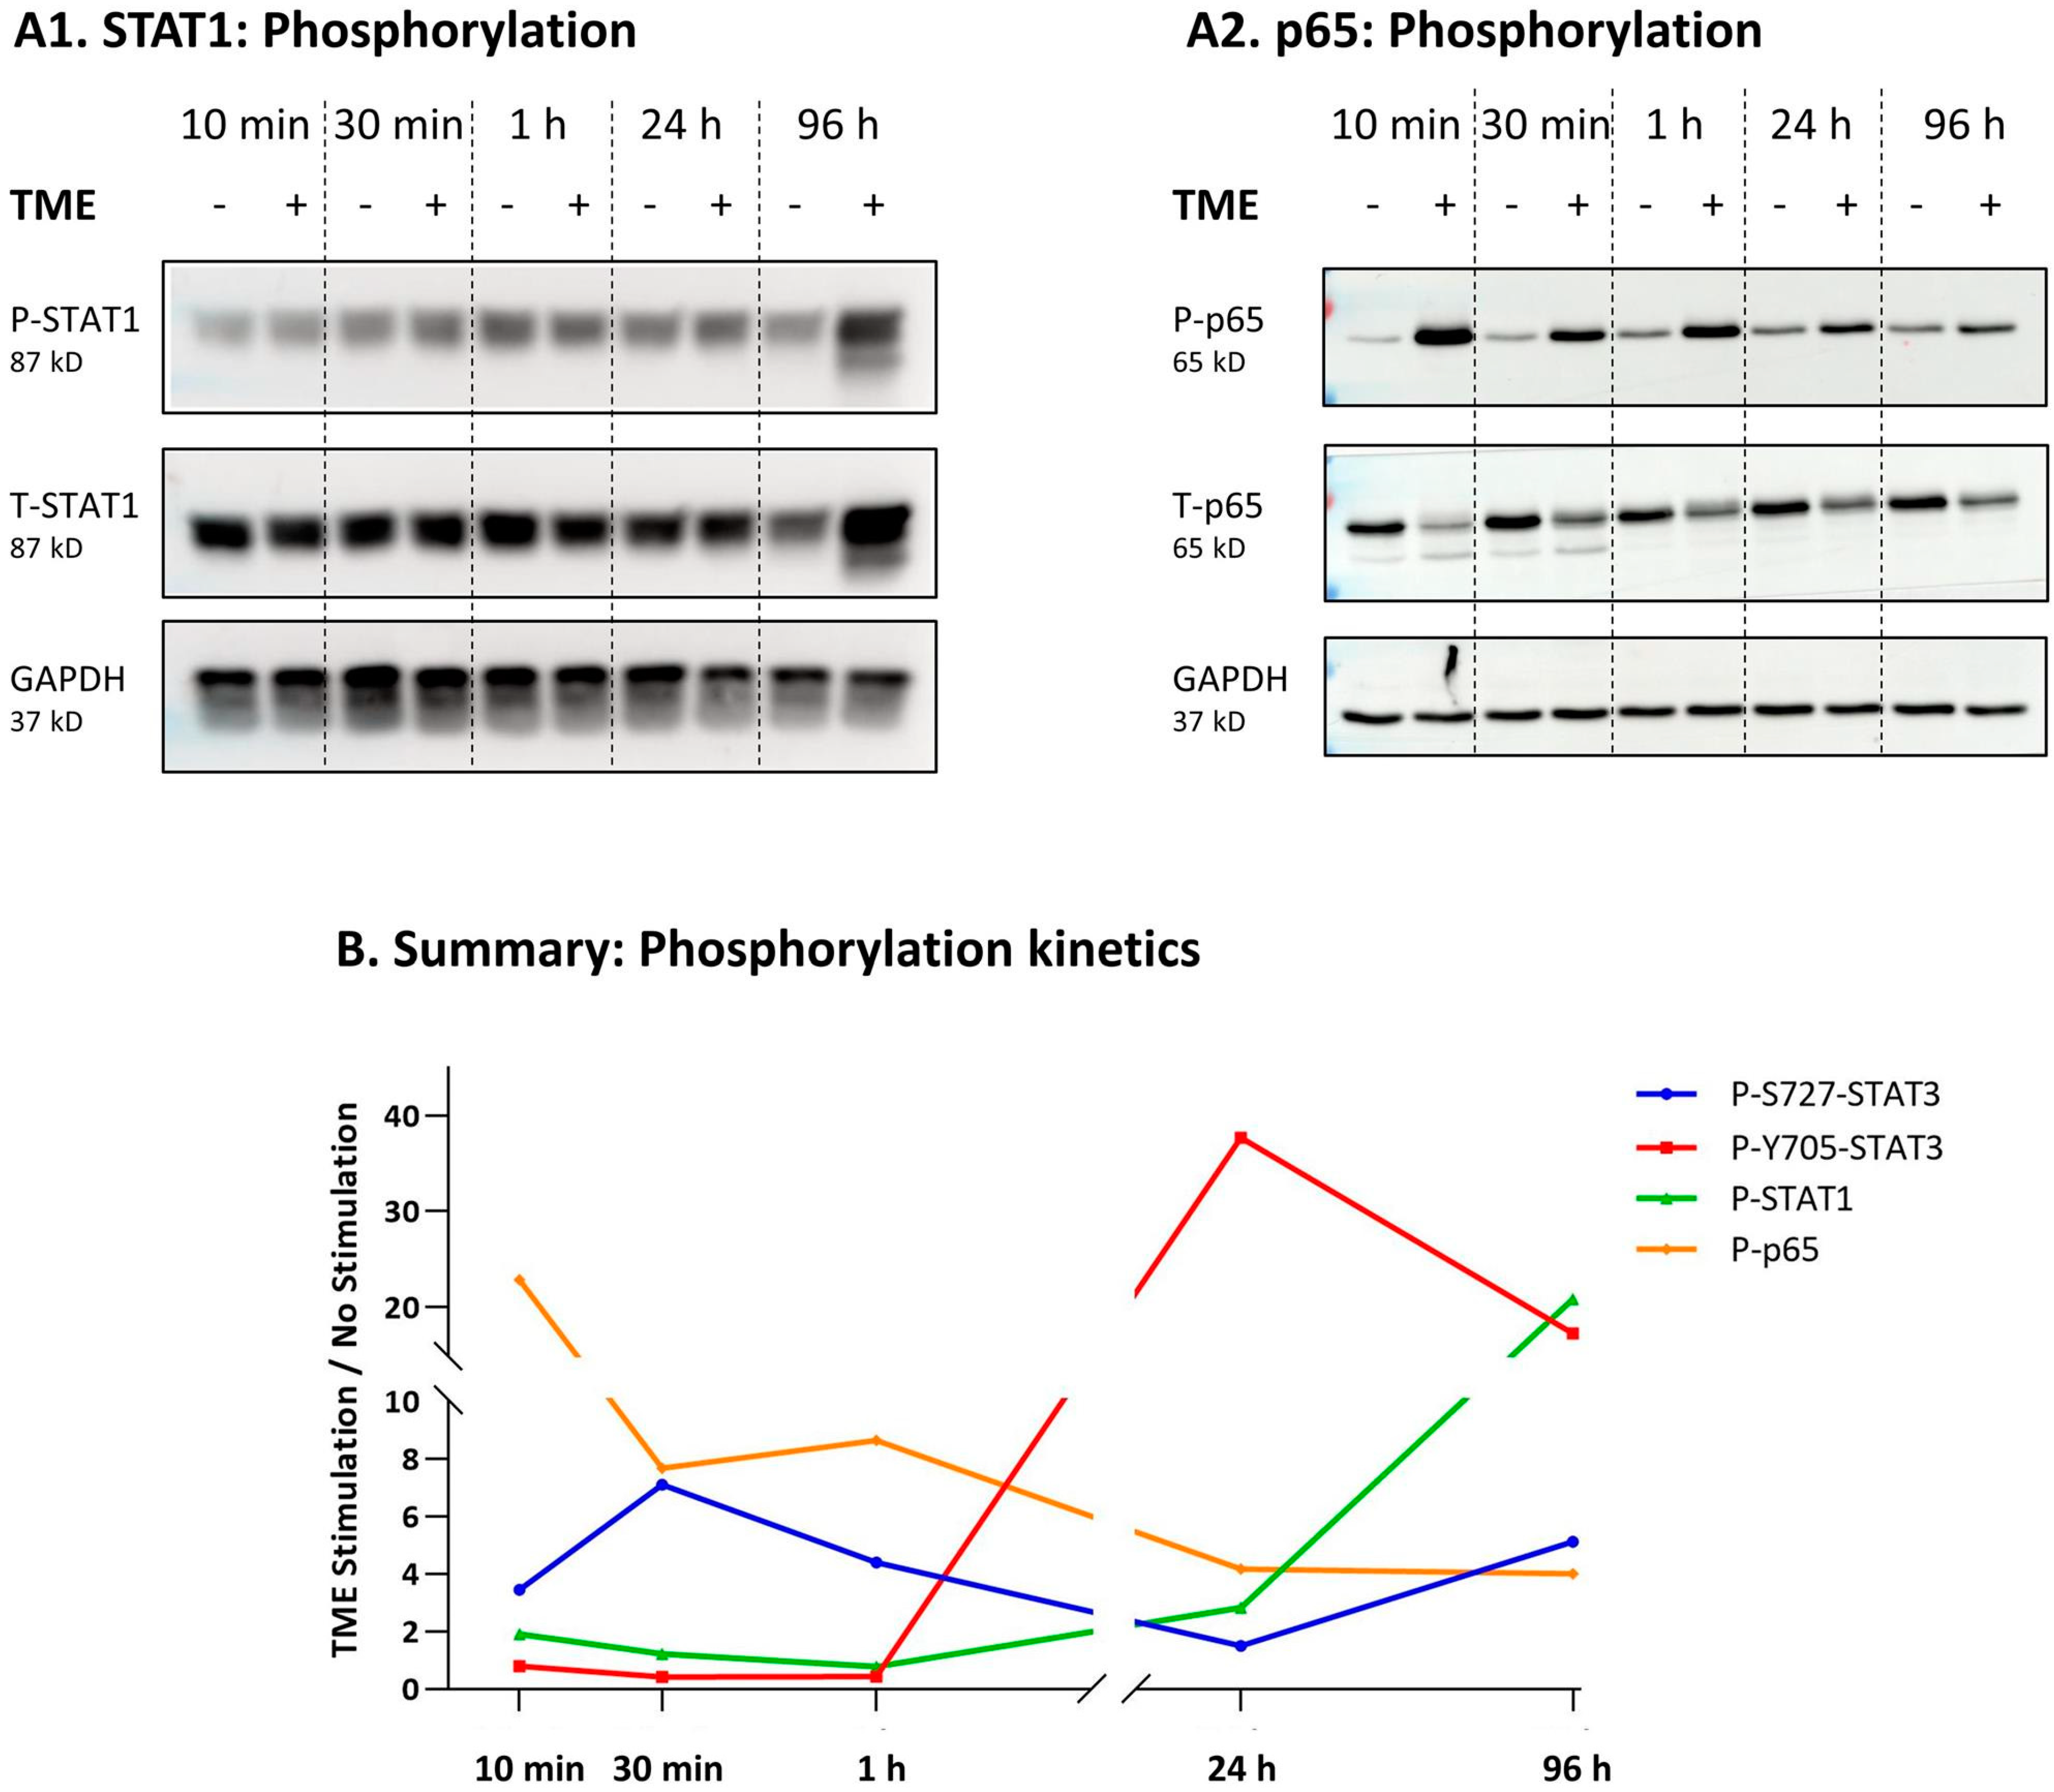
3.3. STAT3 Regulates the Pro-Metastatic Activities of TME-Stimulated HR+/HER2− Breast Cancer Cells
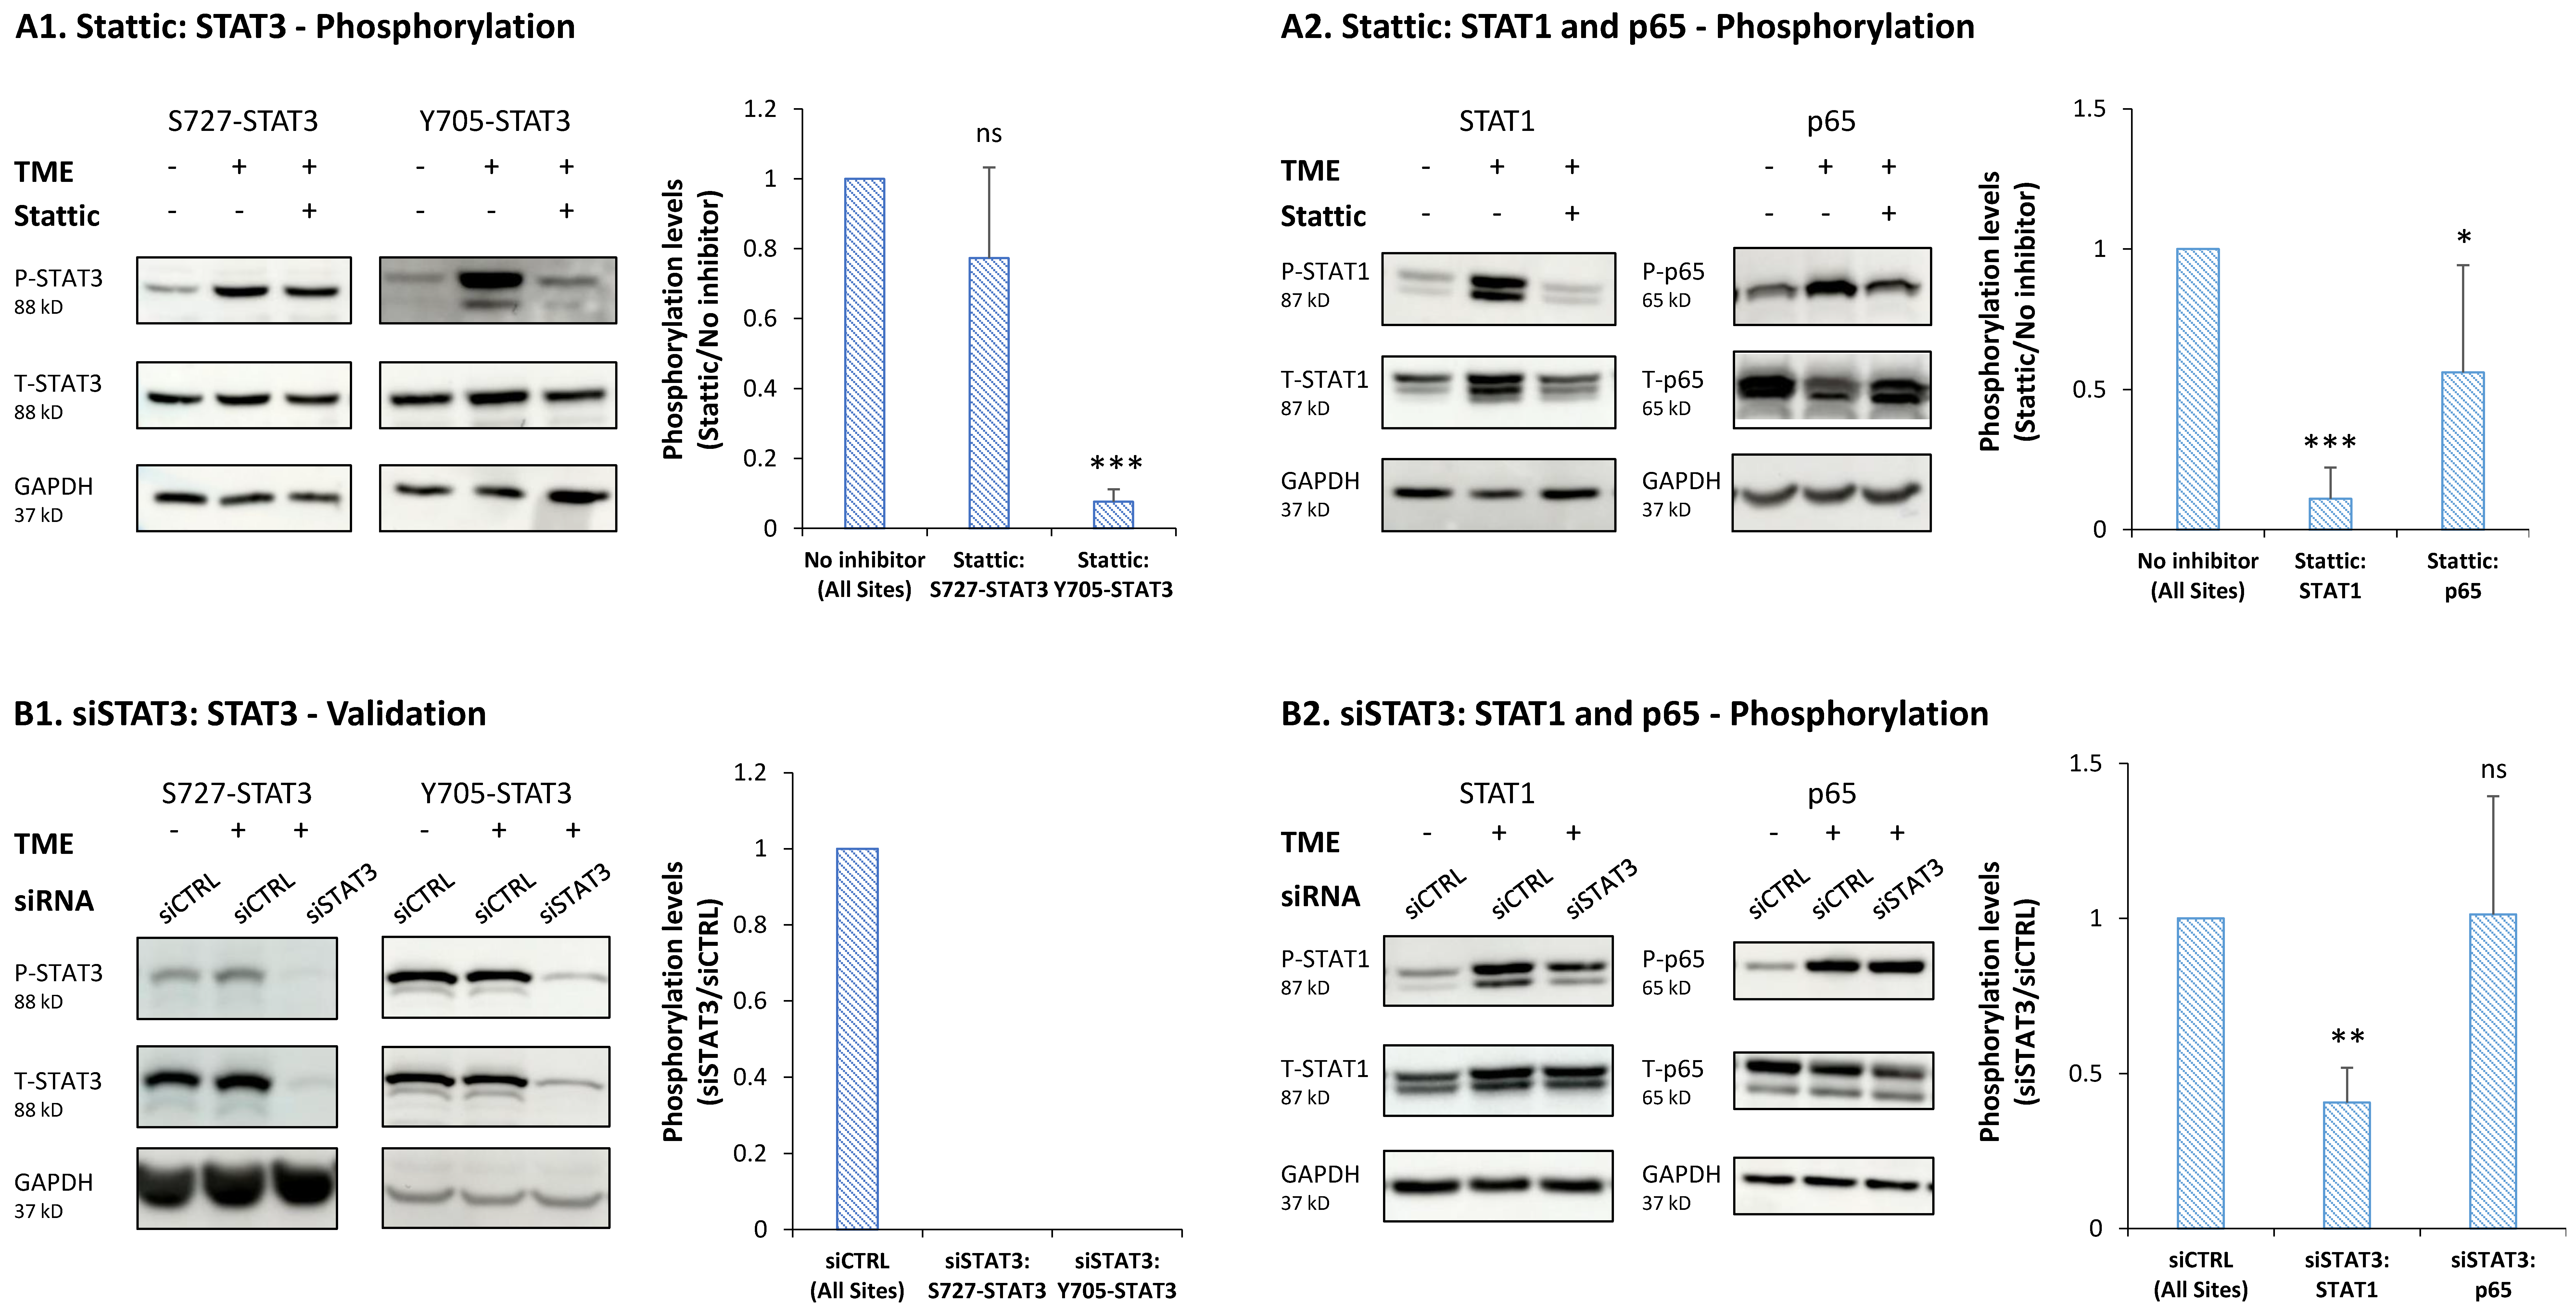
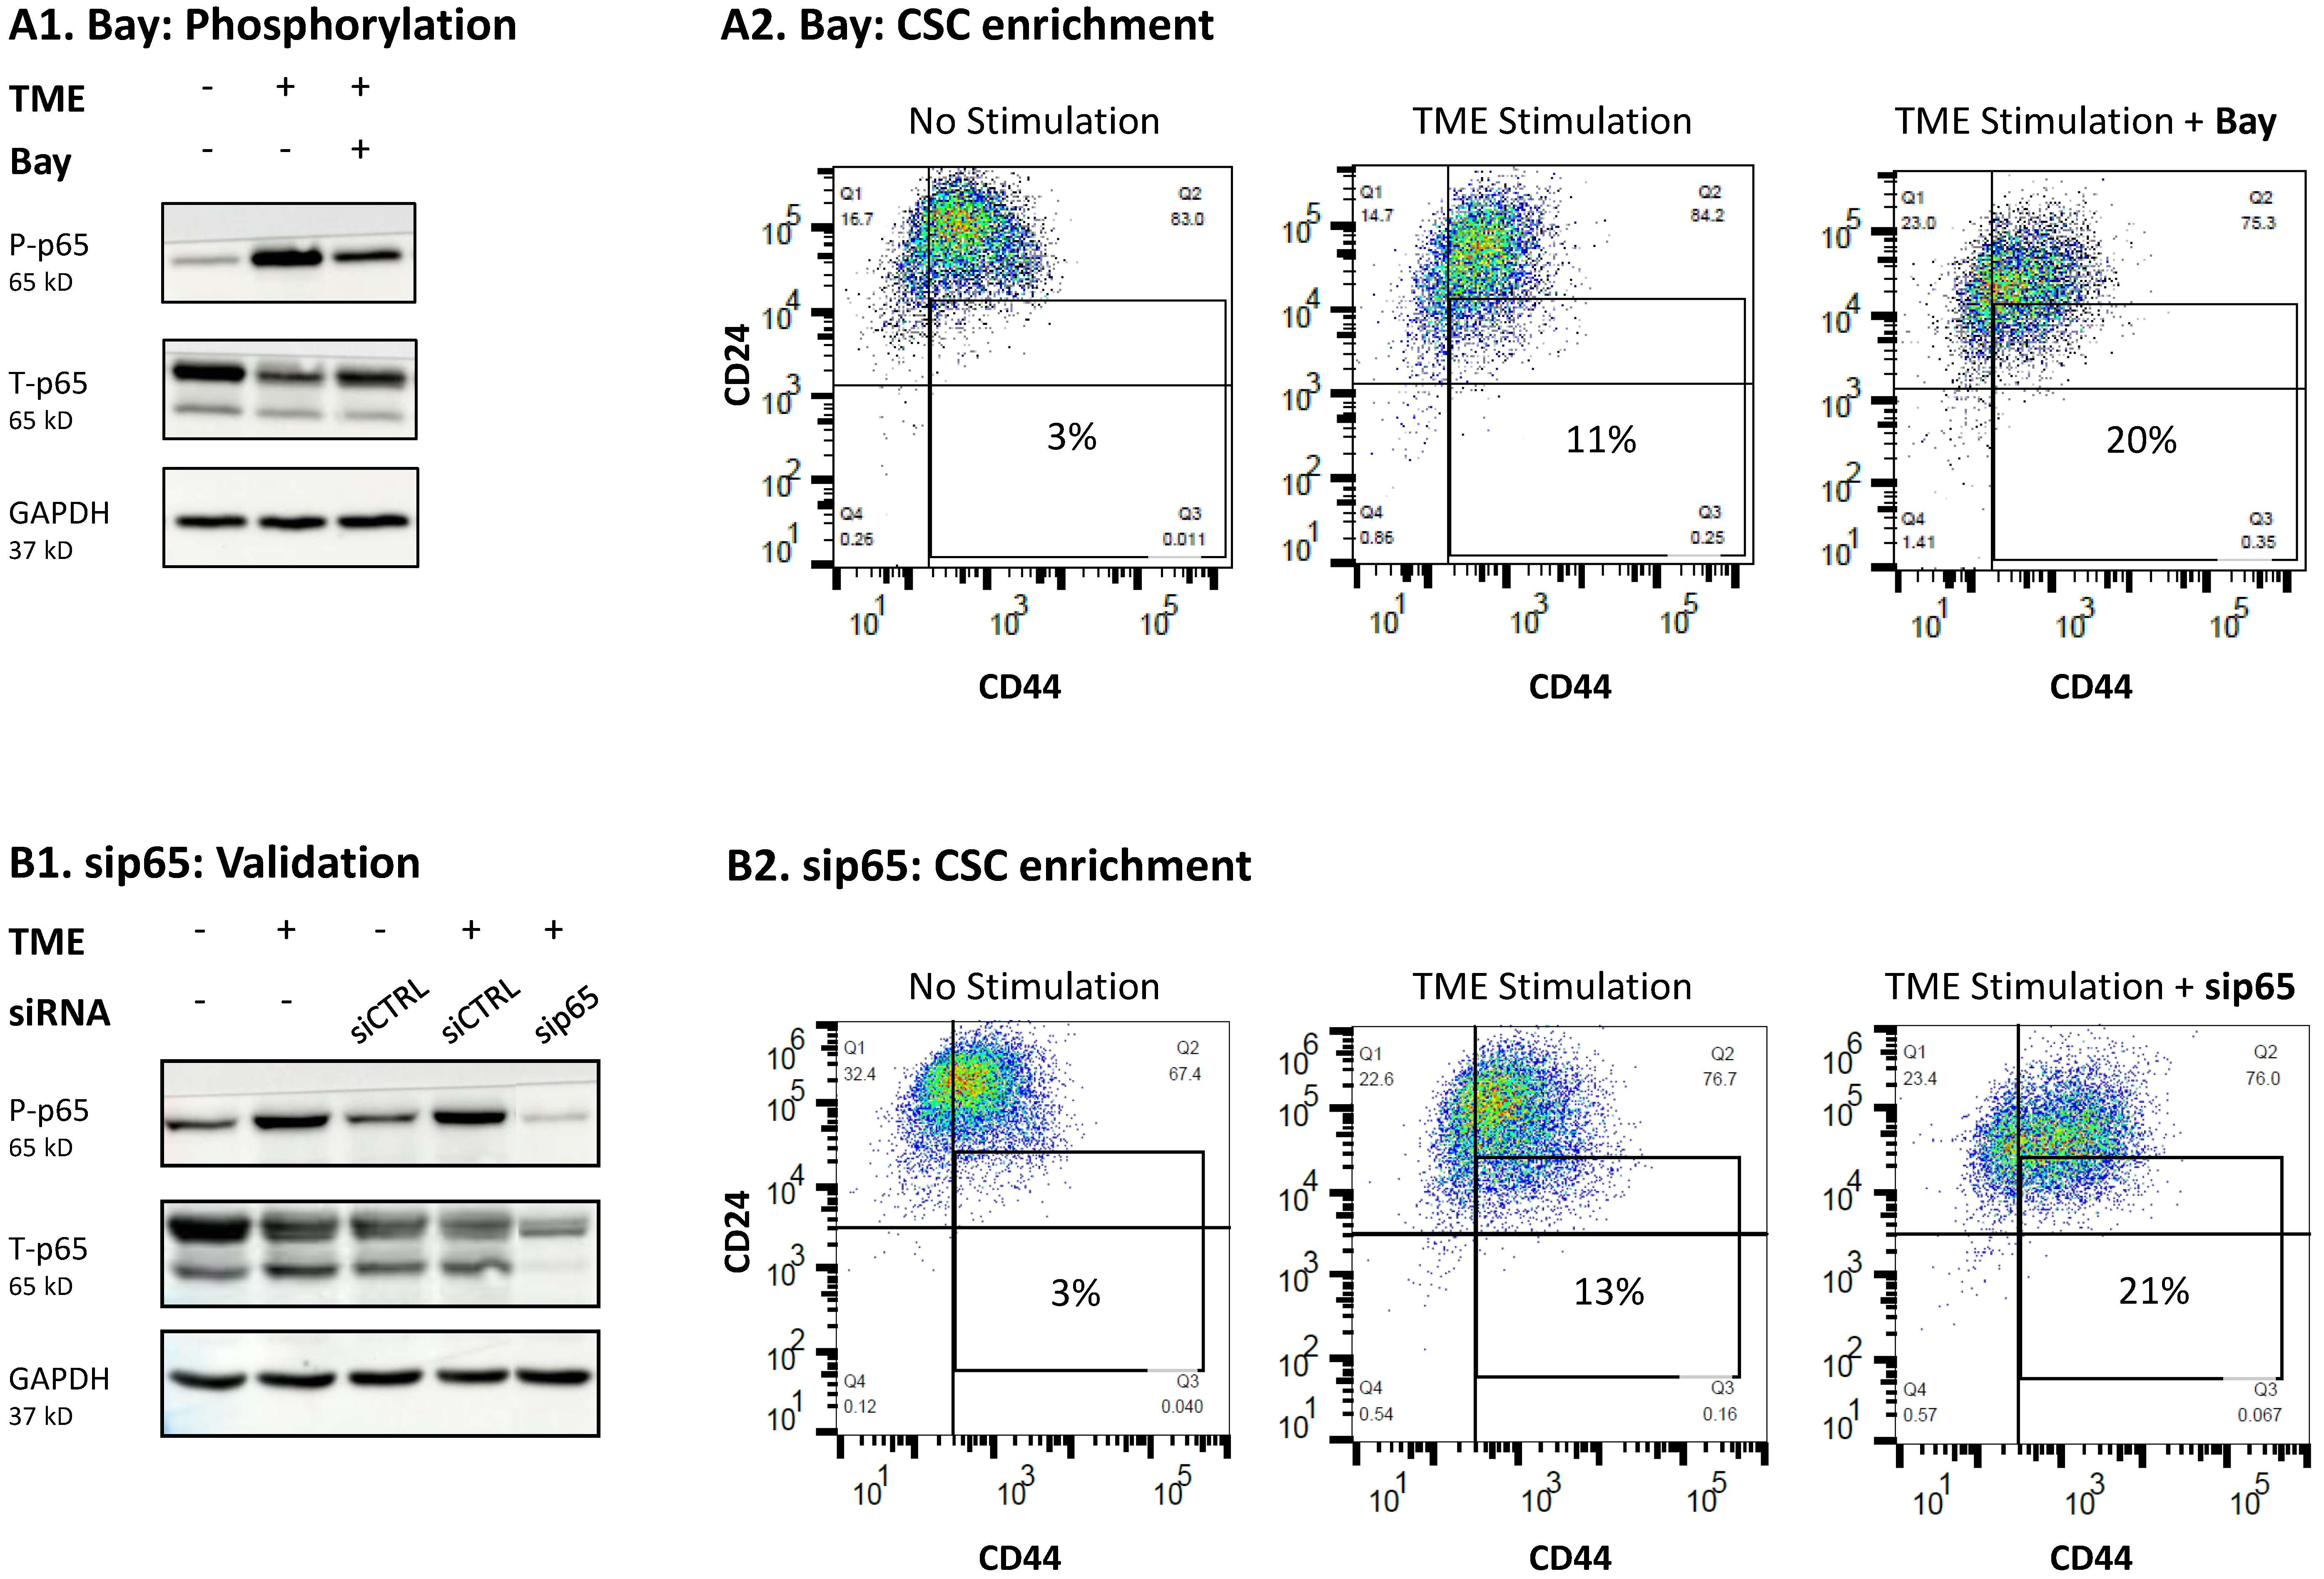
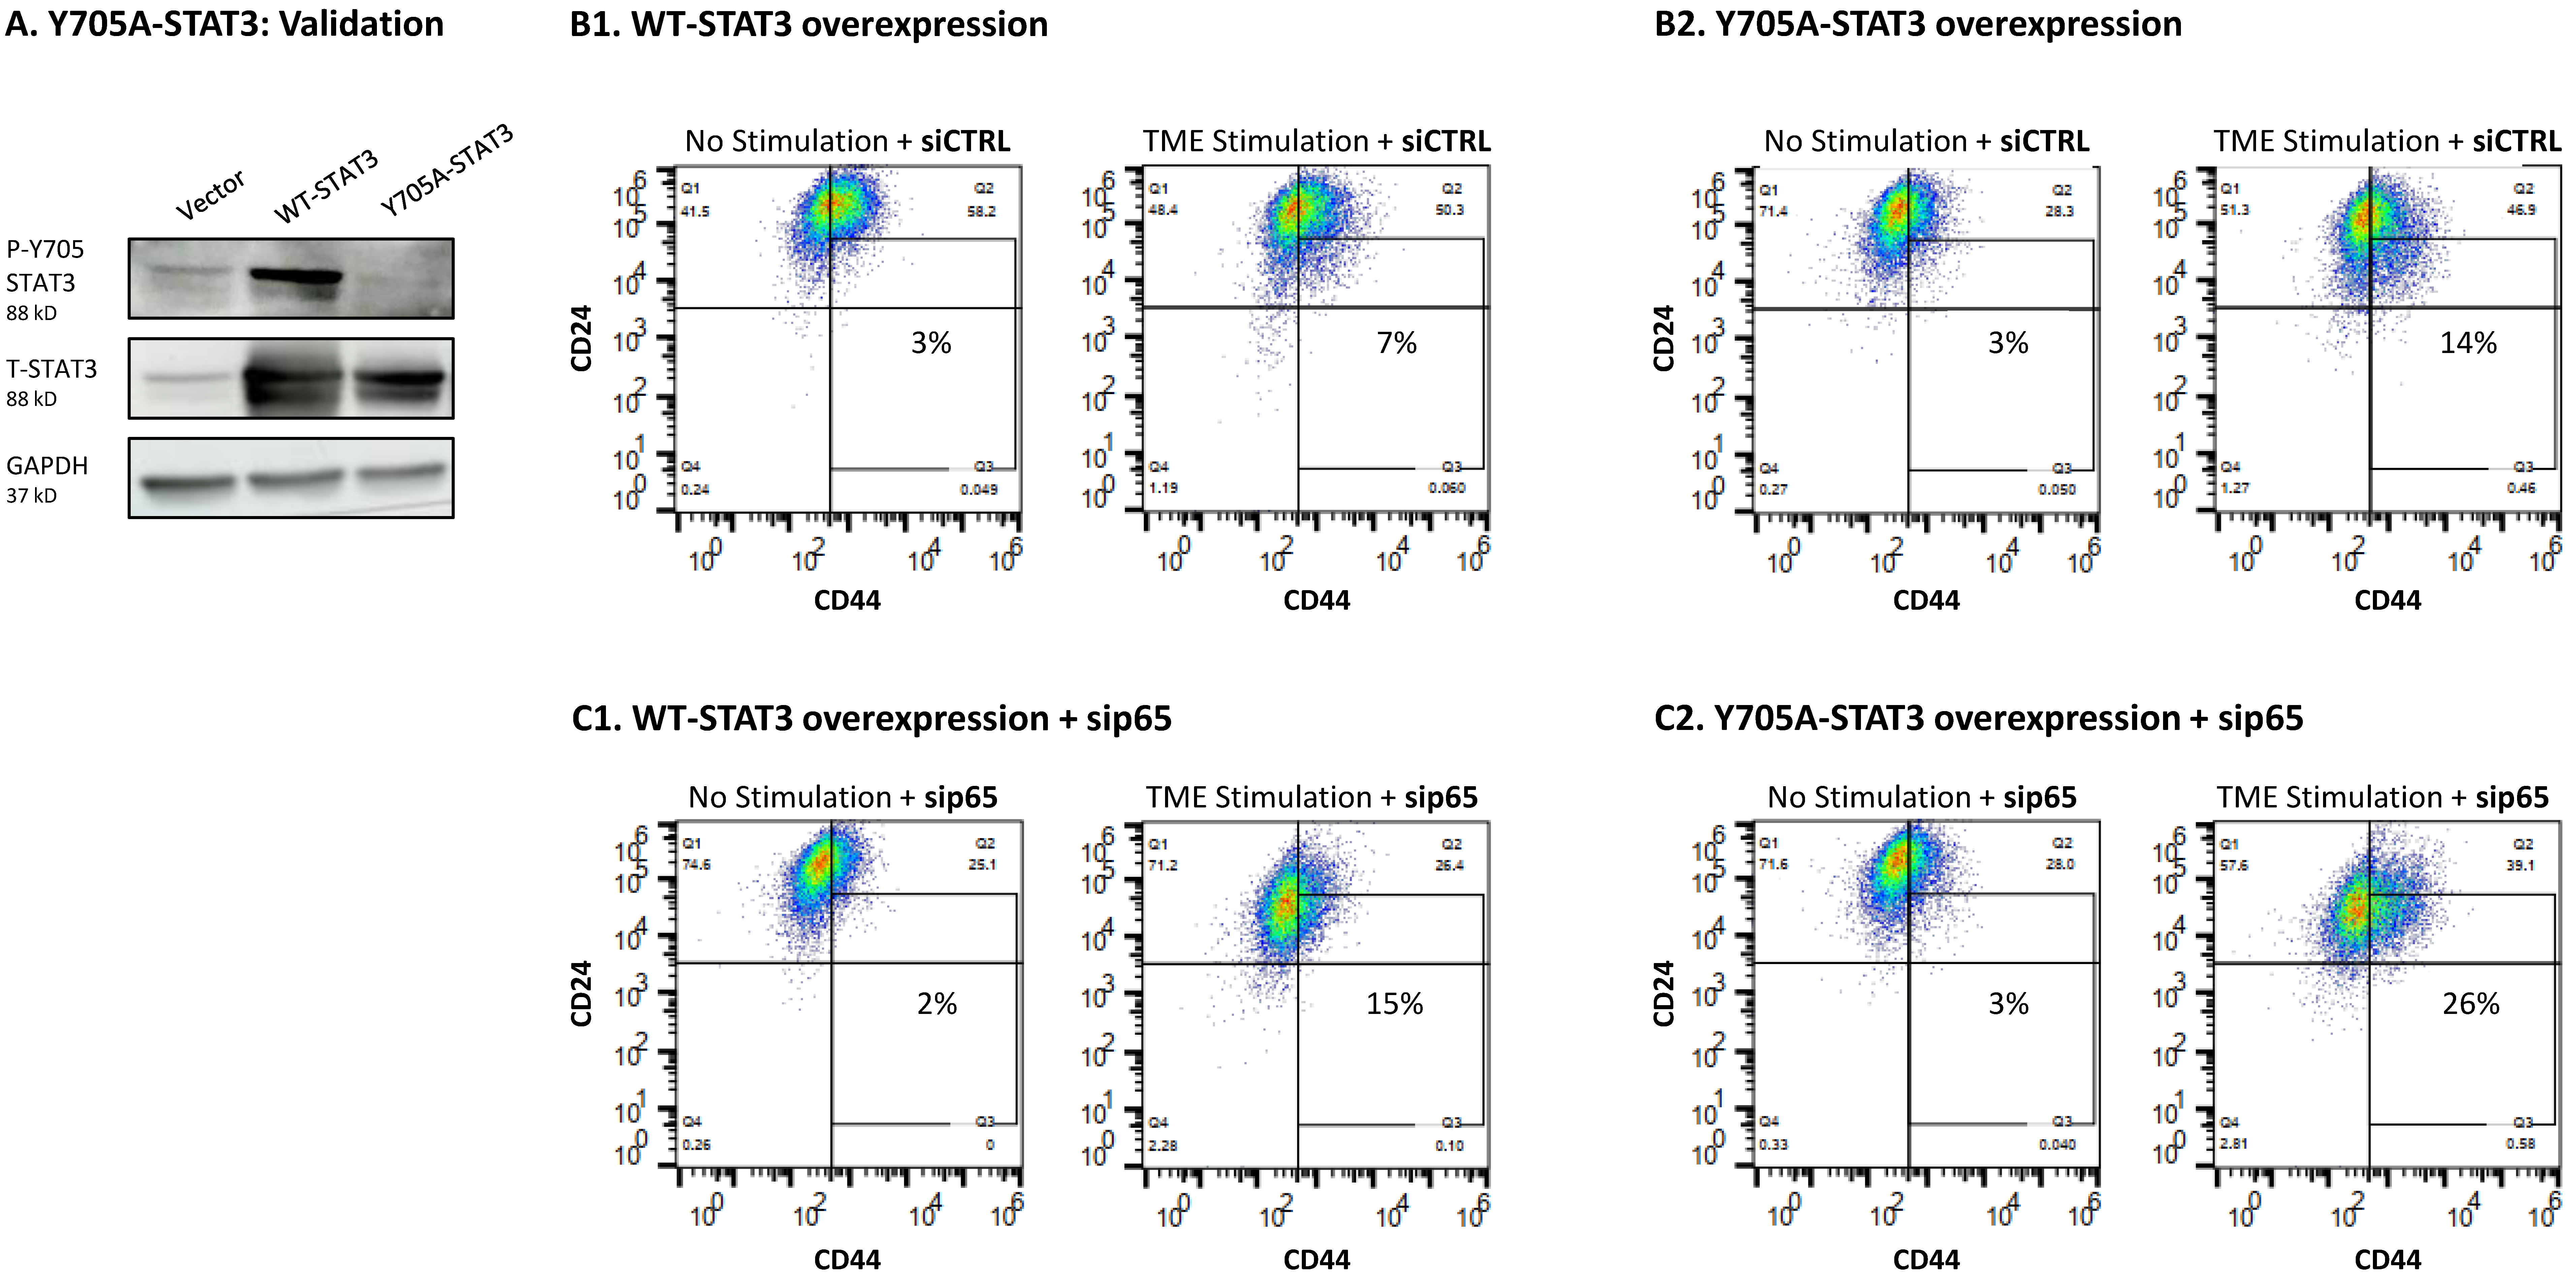
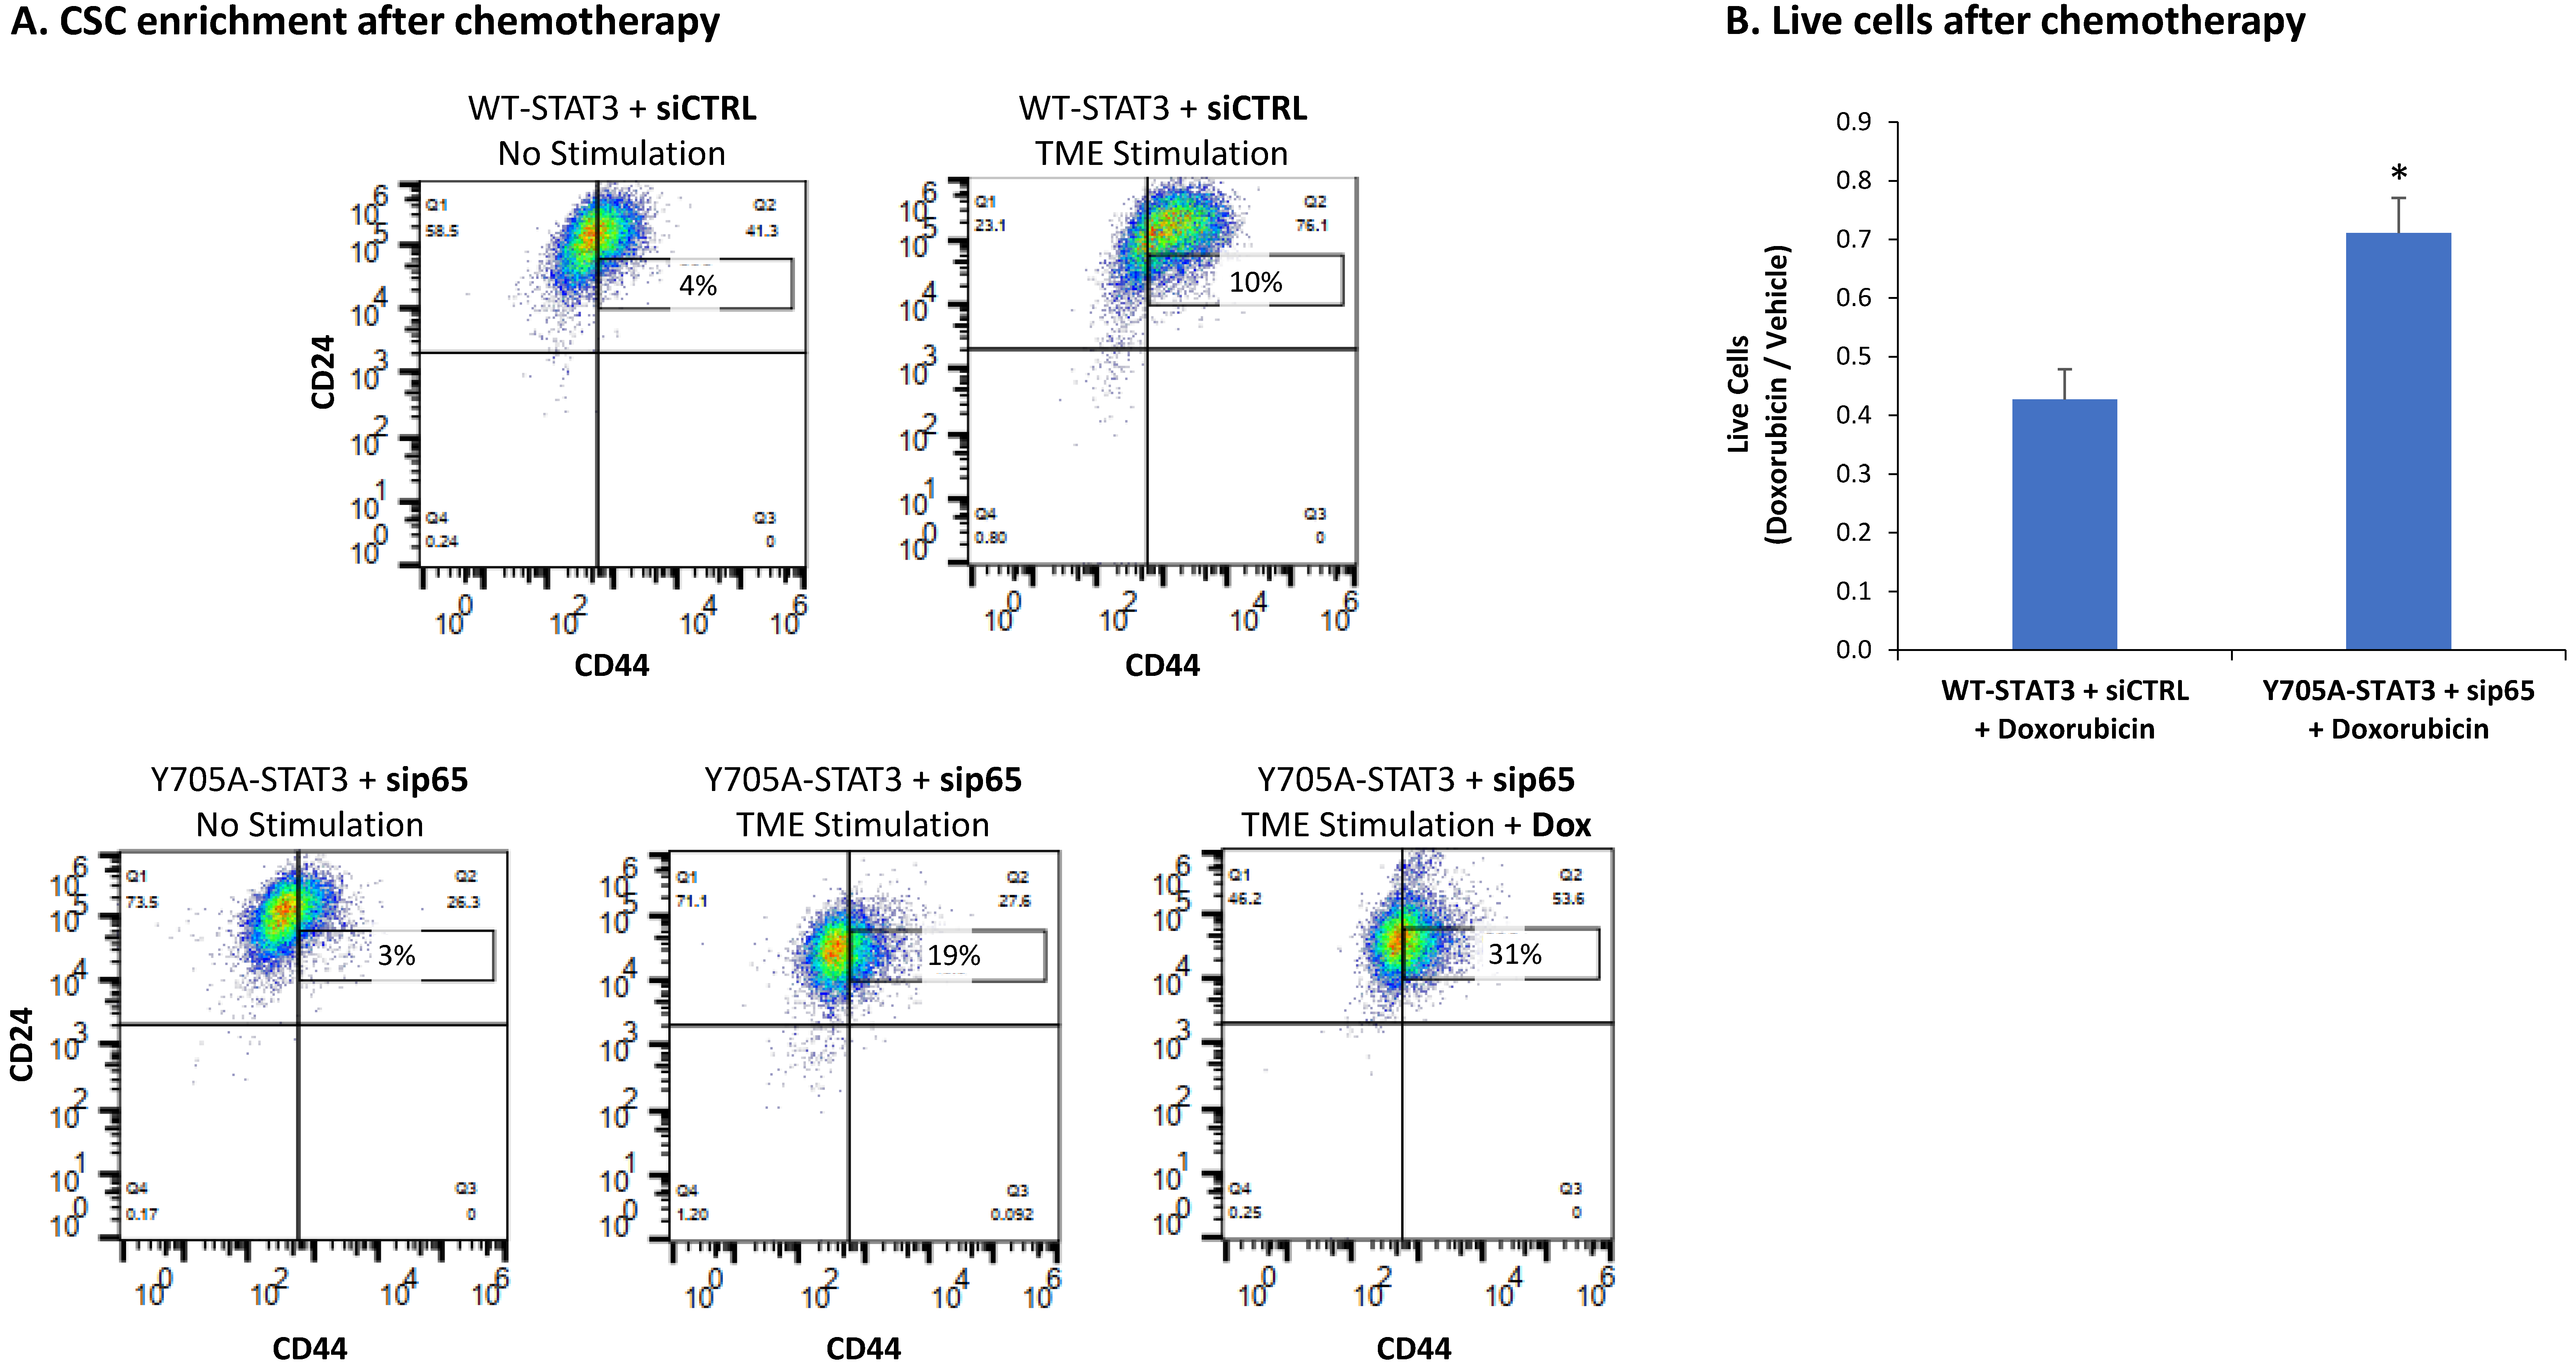
3.4. When the Entire STAT3 Protein Is Absent, Its Regulatory Effects Are Compensated by p65 Activation
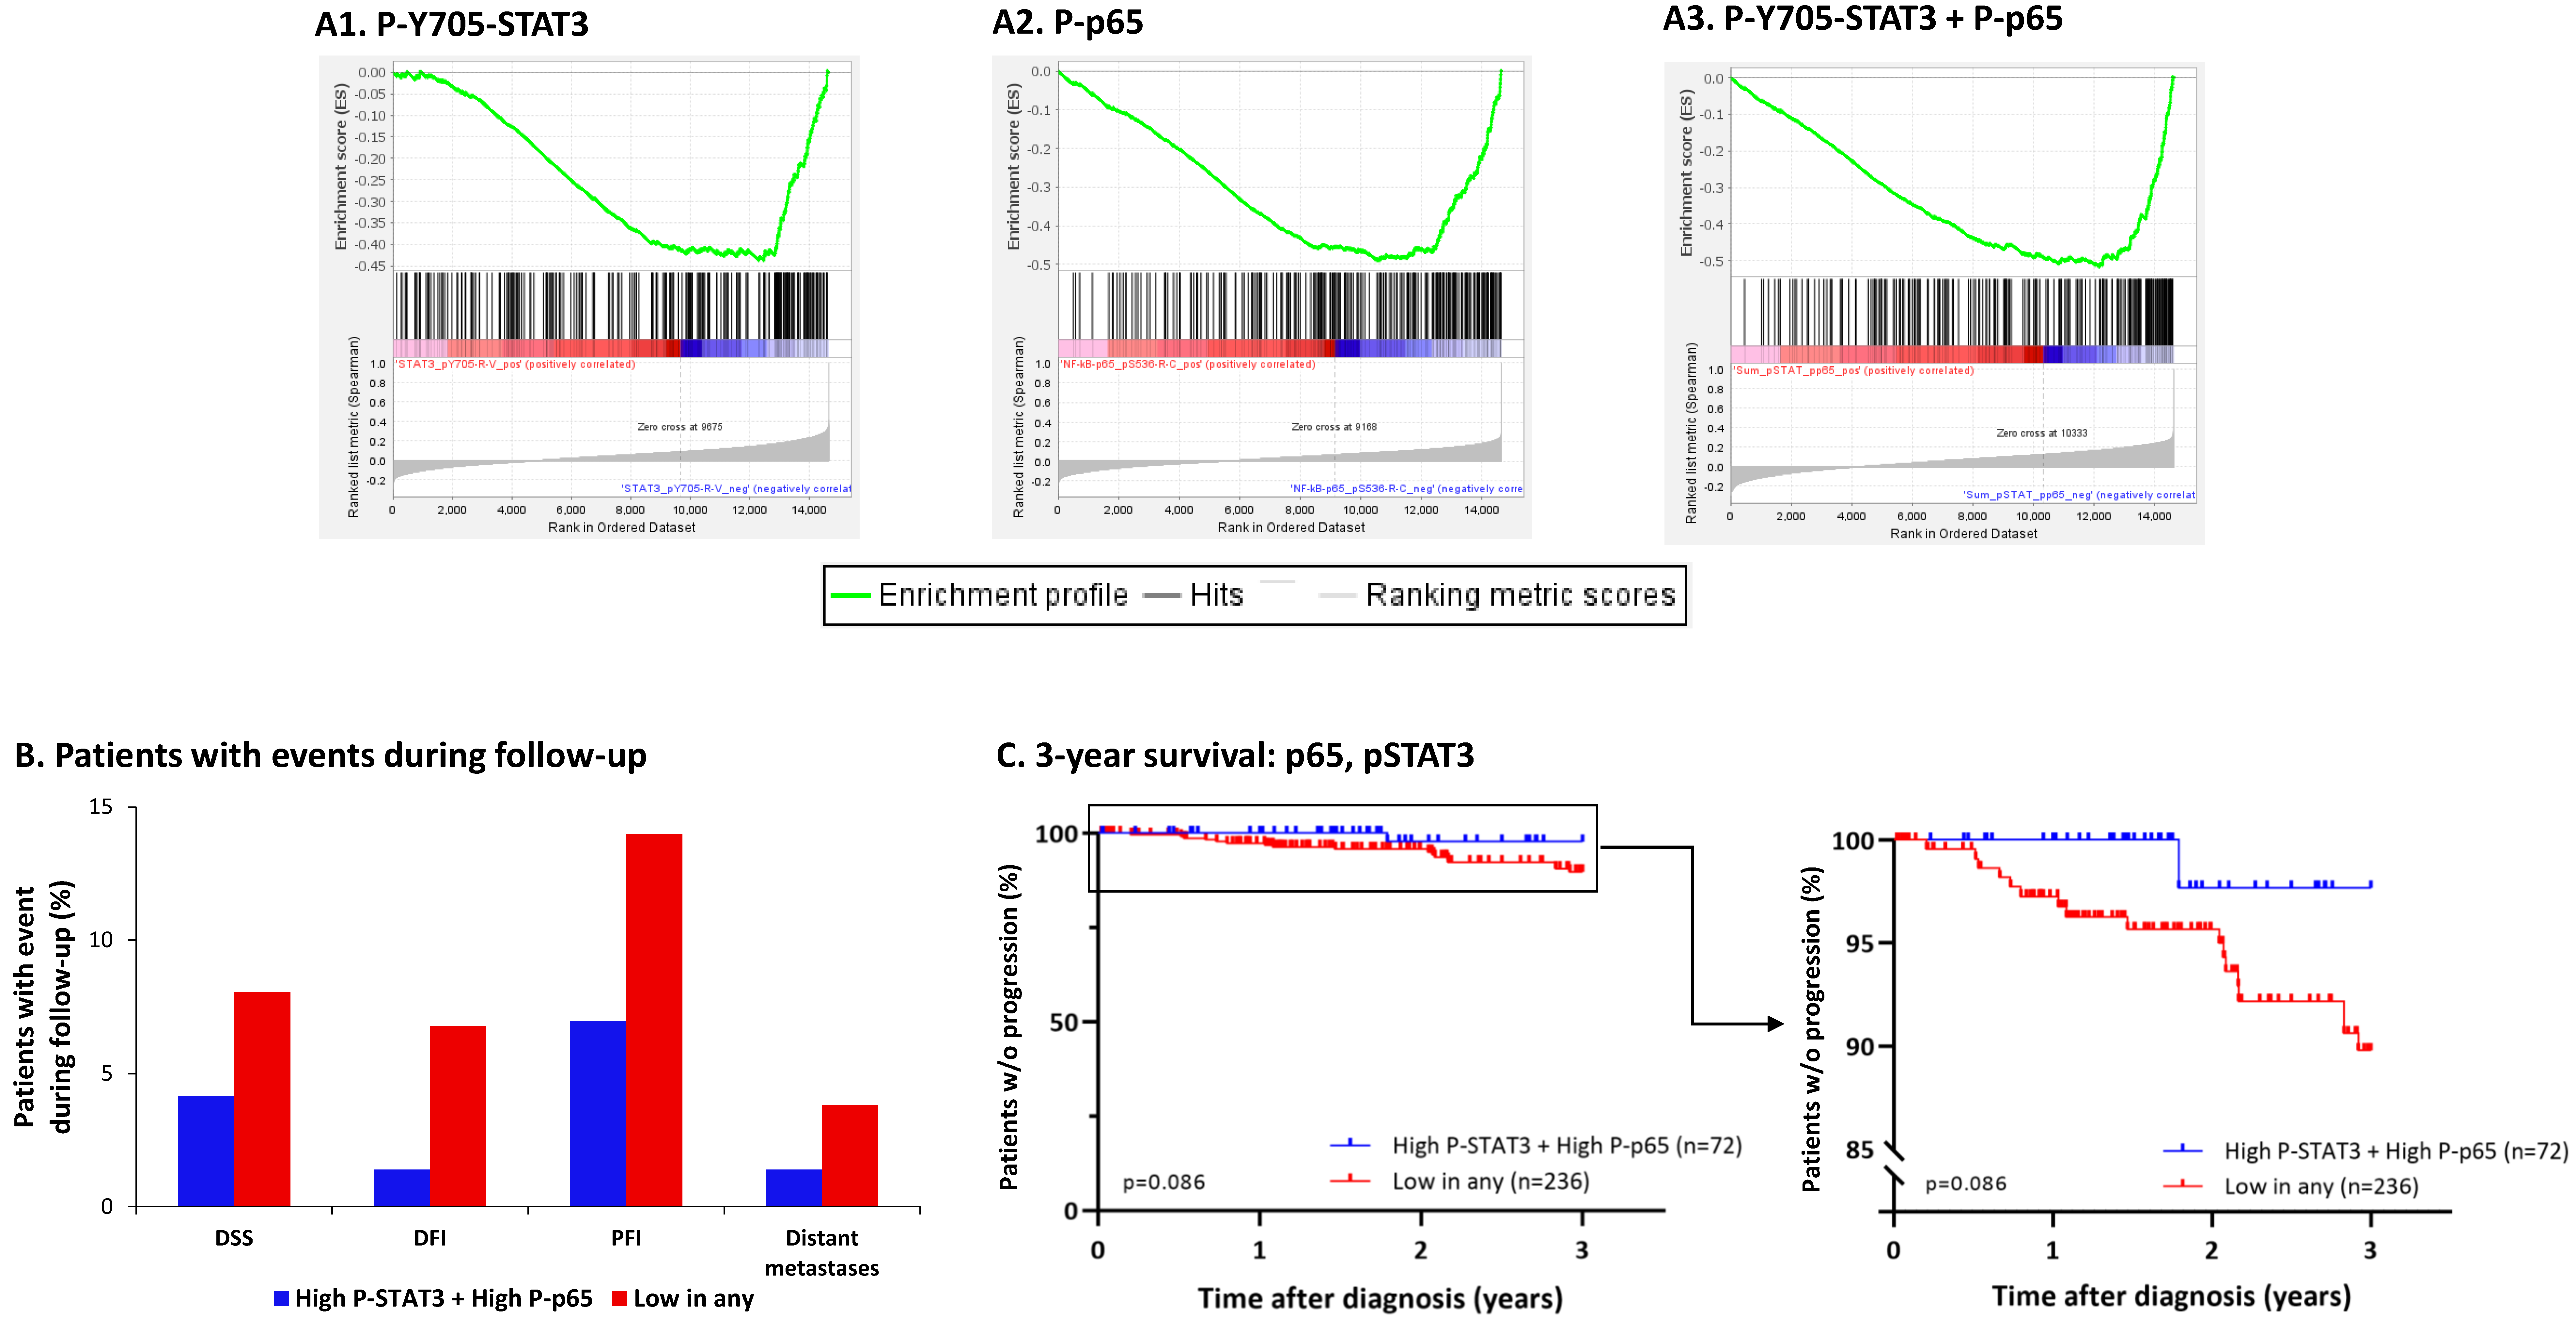
3.5. The Negative Regulatory Roles of Y705-STAT3 + p65 on CSC Enrichment Have Clinical Relevance
4. Discussion
5. Conclusions
Supplementary Materials
Author Contributions
Funding
Institutional Review Board Statement
Informed Consent Statement
Data Availability Statement
Acknowledgments
Conflicts of Interest
Abbreviations
References
- Molnar, I.A.; Molnar, B.A.; Vizkeleti, L.; Fekete, K.; Tamas, J.; Deak, P.; Szundi, C.; Szekely, B.; Moldvay, J.; Vari-Kakas, S.; et al. Breast carcinoma subtypes show different patterns of metastatic behavior. Virchows Arch. 2017, 470, 275–283. [Google Scholar] [CrossRef] [PubMed]
- Abdelhakiem, M.K.; Johnstone, C.; Bergom, C.; Currey, A.; Robbins, J.R. The influence of breast cancer subtype on survival after palliative radiation for osseous metastases. Cancer Med. 2020, 9, 8979–8988. [Google Scholar] [CrossRef] [PubMed]
- Harbeck, N.; Penault-Llorca, F.; Cortes, J.; Gnant, M.; Houssami, N.; Poortmans, P.; Ruddy, K.; Tsang, J.; Cardoso, F. Breast cancer. Nat. Rev. Dis. Primers 2019, 5, 66. [Google Scholar] [CrossRef]
- Garutti, M.; Griguolo, G.; Botticelli, A.; Buzzatti, G.; De Angelis, C.; Gerratana, L.; Molinelli, C.; Adamo, V.; Bianchini, G.; Biganzoli, L.; et al. Definition of High-Risk Early Hormone-Positive HER2-Negative Breast Cancer: A Consensus Review. Cancers 2022, 14, 1898. [Google Scholar] [CrossRef]
- Broom, R.J.; Tang, P.A.; Simmons, C.; Bordeleau, L.; Mulligan, A.M.; O’Malley, F.P.; Miller, N.; Andrulis, I.L.; Brenner, D.M.; Clemons, M.J. Changes in estrogen receptor, progesterone receptor and Her-2/neu status with time: Discordance rates between primary and metastatic breast cancer. Anticancer Res. 2009, 29, 1557–1562. [Google Scholar] [PubMed]
- Chen, S.; Chen, C.M.; Yu, K.D.; Zhou, R.J.; Shao, Z.M. Prognostic value of a positive-to-negative change in hormone receptor status after neoadjuvant chemotherapy in patients with hormone receptor-positive breast cancer. Ann. Surg. Oncol. 2012, 19, 3002–3011. [Google Scholar] [CrossRef] [PubMed]
- Mahmoud, R.; Ordonez-Moran, P.; Allegrucci, C. Challenges for Triple Negative Breast Cancer Treatment: Defeating Heterogeneity and Cancer Stemness. Cancers 2022, 14, 4280. [Google Scholar] [CrossRef] [PubMed]
- Radler, P.D.; Wehde, B.L.; Triplett, A.A.; Shrestha, H.; Shepherd, J.H.; Pfefferle, A.D.; Rui, H.; Cardiff, R.D.; Perou, C.M.; Wagner, K.U. Highly metastatic claudin-low mammary cancers can originate from luminal epithelial cells. Nat. Commun. 2021, 12, 3742. [Google Scholar] [CrossRef]
- Mei, Y.; Cai, D.; Dai, X. Modulating cancer stemness provides luminal a breast cancer cells with HER2 positive-like features. J. Cancer 2020, 11, 1162–1169. [Google Scholar] [CrossRef] [Green Version]
- Bao, L.; Cardiff, R.D.; Steinbach, P.; Messer, K.S.; Ellies, L.G. Multipotent luminal mammary cancer stem cells model tumor heterogeneity. Breast Cancer Res. 2015, 17, 137. [Google Scholar] [CrossRef] [Green Version]
- Fu, N.Y.; Nolan, E.; Lindeman, G.J.; Visvader, J.E. Stem Cells and the Differentiation Hierarchy in Mammary Gland Development. Physiol. Rev. 2020, 100, 489–523. [Google Scholar] [CrossRef] [PubMed]
- Wang, L.; Jin, Z.; Master, R.P.; Maharjan, C.K.; Carelock, M.E.; Reccoppa, T.B.A.; Kim, M.C.; Kolb, R.; Zhang, W. Breast Cancer Stem Cells: Signaling Pathways, Cellular Interactions, and Therapeutic Implications. Cancers 2022, 14, 3287. [Google Scholar] [CrossRef] [PubMed]
- Li, W.; Ma, H.; Zhang, J.; Zhu, L.; Wang, C.; Yang, Y. Unraveling the roles of CD44/CD24 and ALDH1 as cancer stem cell markers in tumorigenesis and metastasis. Sci. Rep. 2017, 7, 13856. [Google Scholar] [CrossRef] [PubMed] [Green Version]
- Taurin, S.; Alkhalifa, H. Breast cancers, mammary stem cells, and cancer stem cells, characteristics, and hypotheses. Neoplasia 2020, 22, 663–678. [Google Scholar] [CrossRef]
- Chen, W.; Zhang, L.; Liu, S.; Chen, C. Advances in Biomarkers and Endogenous Regulation of Breast Cancer Stem Cells. Cells 2022, 11, 2941. [Google Scholar] [CrossRef] [PubMed]
- Weitzenfeld, P.; Meshel, T.; Ben-Baruch, A. Microenvironmental networks promote tumor heterogeneity and enrich for metastatic cancer stem-like cells in Luminal-A breast tumor cells. Oncotarget 2016, 7, 81123–81143. [Google Scholar] [CrossRef] [Green Version]
- Chien, T.J. A review of the endocrine resistance in hormone-positive breast cancer. Am. J. Cancer Res. 2021, 11, 3813–3831. [Google Scholar]
- Porras, L.; Ismail, H.; Mader, S. Positive Regulation of Estrogen Receptor Alpha in Breast Tumorigenesis. Cells 2021, 10, 2966. [Google Scholar] [CrossRef]
- Galdiero, M.R.; Marone, G.; Mantovani, A. Cancer Inflammation and Cytokines. Cold Spring Harb. Perspect. Biol. 2018, 10, a028662. [Google Scholar] [CrossRef] [Green Version]
- Ben-Baruch, A. Tumor Necrosis Factor alpha: Taking a Personalized Road in Cancer Therapy. Front. Immunol. 2022, 13, 903679. [Google Scholar] [CrossRef]
- Danforth, D.N. The Role of Chronic Inflammation in the Development of Breast Cancer. Cancers 2021, 13, 3918. [Google Scholar] [CrossRef] [PubMed]
- Cruceriu, D.; Baldasici, O.; Balacescu, O.; Berindan-Neagoe, I. The dual role of tumor necrosis factor-alpha (TNF-alpha) in breast cancer: Molecular insights and therapeutic approaches. Cell Oncol. (Dordr.) 2020, 43, 1–18. [Google Scholar] [CrossRef] [PubMed]
- Soria, G.; Ofri-Shahak, M.; Haas, I.; Yaal-Hahoshen, N.; Leider-Trejo, L.; Leibovich-Rivkin, T.; Weitzenfeld, P.; Meshel, T.; Shabtai, E.; Gutman, M.; et al. Inflammatory mediators in breast cancer: Coordinated expression of TNFalpha & IL-1beta with CCL2 & CCL5 and effects on epithelial-to-mesenchymal transition. BMC Cancer 2011, 11, 130. [Google Scholar] [CrossRef] [Green Version]
- Semesiuk, N.I.; Zhylchuk, A.; Bezdenezhnykh, N.; Lykhova, A.; Vorontsova, A.L.; Zhylchuk, V.E.; Kudryavets, Y.I. Disseminated tumor cells and enhanced level of some cytokines in bone marrow and peripheral blood of breast cancer patients as predictive factors of tumor progression. Exp. Oncol. 2013, 35, 295–302. [Google Scholar] [PubMed]
- Al-Hatamleh, M.A.I.; Ahmad, S.; Boer, J.C.; Lim, J.; Chen, X.; Plebanski, M.; Mohamud, R. A Perspective Review on the Role of Nanomedicine in the Modulation of TNF-TNFR2 Axis in Breast Cancer Immunotherapy. J. Oncol. 2019, 2019, 6313242. [Google Scholar] [CrossRef] [PubMed] [Green Version]
- Ji, X.; Peng, Z.; Li, X.; Yan, Z.; Yang, Y.; Qiao, Z.; Liu, Y. Neutralization of TNFalpha in tumor with a novel nanobody potentiates paclitaxel-therapy and inhibits metastasis in breast cancer. Cancer Lett. 2017, 386, 24–34. [Google Scholar] [CrossRef]
- Warren, M.A.; Shoemaker, S.F.; Shealy, D.J.; Bshar, W.; Ip, M.M. Tumor necrosis factor deficiency inhibits mammary tumorigenesis and a tumor necrosis factor neutralizing antibody decreases mammary tumor growth in neu/erbB2 transgenic mice. Mol. Cancer Ther. 2009, 8, 2655–2663. [Google Scholar] [CrossRef] [Green Version]
- Garcia, R.; Franklin, R.A.; McCubrey, J.A. EGF induces cell motility and multi-drug resistance gene expression in breast cancer cells. Cell Cycle 2006, 5, 2820–2826. [Google Scholar] [CrossRef] [Green Version]
- Jeong, Y.; Bae, S.Y.; You, D.; Jung, S.P.; Choi, H.J.; Kim, I.; Lee, S.K.; Yu, J.; Kim, S.W.; Lee, J.E.; et al. EGFR is a Therapeutic Target in Hormone Receptor-Positive Breast Cancer. Cell Physiol. Biochem. 2019, 53, 805–819. [Google Scholar] [CrossRef]
- Haim, K.; Weitzenfeld, P.; Meshel, T.; Ben-Baruch, A. Epidermal Growth Factor and Estrogen Act by Independent Pathways to Additively Promote the Release of the Angiogenic Chemokine CXCL8 by Breast Tumor Cells. Neoplasia 2011, 13, 230–243. [Google Scholar] [CrossRef] [Green Version]
- Kim, J.; Kong, J.; Chang, H.; Kim, H.; Kim, A. EGF induces epithelial-mesenchymal transition through phospho-Smad2/3-Snail signaling pathway in breast cancer cells. Oncotarget 2016, 7, 85021–85032. [Google Scholar] [CrossRef] [PubMed] [Green Version]
- AlFakeeh, A.; Brezden-Masley, C. Overcoming endocrine resistance in hormone receptor-positive breast cancer. Curr. Oncol. 2018, 25, S18–S27. [Google Scholar] [CrossRef] [PubMed] [Green Version]
- Doll, F.; Pfeilschifter, J.; Huwiler, A. The epidermal growth factor stimulates sphingosine kinase-1 expression and activity in the human mammary carcinoma cell line MCF7. Biochim. Biophys. Acta 2005, 1738, 72–81. [Google Scholar] [CrossRef] [PubMed]
- Weitzenfeld, P.; Meron, N.; Leibovich-Rivkin, T.; Meshel, T.; Ben-Baruch, A. Progression of luminal breast tumors is promoted by menage a trois between the inflammatory cytokine TNFalpha and the hormonal and growth-supporting arms of the tumor microenvironment. Mediat. Inflamm. 2013, 2013, 720536. [Google Scholar] [CrossRef] [PubMed] [Green Version]
- Weitzenfeld, P.; Kossover, O.; Korner, C.; Meshel, T.; Wiemann, S.; Seliktar, D.; Legler, D.F.; Ben-Baruch, A. Chemokine axes in breast cancer: Factors of the tumor microenvironment reshape the CCR7-driven metastatic spread of luminal-A breast tumors. J. Leukoc. Biol. 2016, 99, 1009–1025. [Google Scholar] [CrossRef] [PubMed] [Green Version]
- Ruffini, P.A. The CXCL8-CXCR1/2 Axis as a Therapeutic Target in Breast Cancer Stem-Like Cells. Front. Oncol. 2019, 9, 40. [Google Scholar] [CrossRef] [Green Version]
- Matsushima, K.; Yang, D.; Oppenheim, J.J. Interleukin-8: An evolving chemokine. Cytokine 2022, 153, 155828. [Google Scholar] [CrossRef]
- Ma, J.H.; Qin, L.; Li, X. Role of STAT3 signaling pathway in breast cancer. Cell Commun. Signal 2020, 18, 33. [Google Scholar] [CrossRef] [Green Version]
- Dinakar, Y.H.; Kumar, H.; Mudavath, S.L.; Jain, R.; Ajmeer, R.; Jain, V. Role of STAT3 in the initiation, progression, proliferation and metastasis of breast cancer and strategies to deliver JAK and STAT3 inhibitors. Life Sci. 2022, 309, 120996. [Google Scholar] [CrossRef]
- To, S.Q.; Dmello, R.S.; Richards, A.K.; Ernst, M.; Chand, A.L. STAT3 Signaling in Breast Cancer: Multicellular Actions and Therapeutic Potential. Cancers 2022, 14, 429. [Google Scholar] [CrossRef]
- Ben-Baruch, A. Partners in crime: TNFalpha-based networks promoting cancer progression. Cancer Immunol. Immunother. CII 2020, 69, 263–273. [Google Scholar] [CrossRef] [PubMed]
- Smart, E.; Semina, S.E.; Frasor, J. Update on the Role of NFkappaB in Promoting Aggressive Phenotypes of Estrogen Receptor-Positive Breast Cancer. Endocrinology 2020, 161, 1–8. [Google Scholar] [CrossRef] [PubMed]
- Taniguchi, K.; Karin, M. NF-kappaB, inflammation, immunity and cancer: Coming of age. Nat. Rev. Immunol. 2018, 18, 309–324. [Google Scholar] [CrossRef]
- Hopkinson, B.M.; Klitgaard, M.C.; Petersen, O.W.; Villadsen, R.; Ronnov-Jessen, L.; Kim, J. Establishment of a normal-derived estrogen receptor-positive cell line comparable to the prevailing human breast cancer subtype. Oncotarget 2017, 8, 10580–10593. [Google Scholar] [CrossRef] [PubMed] [Green Version]
- El Mahdani, N.E.; Ameyar, M.; Cai, Z.; Colard, O.; Masliah, J.; Chouaib, S. Resistance to TNF-induced cytotoxicity correlates with an abnormal cleavage of cytosolic phospholipase A2. J. Immunol. 2000, 165, 6756–6761. [Google Scholar] [CrossRef] [PubMed] [Green Version]
- Dobin, A.; Davis, C.A.; Schlesinger, F.; Drenkow, J.; Zaleski, C.; Jha, S.; Batut, P.; Chaisson, M.; Gingeras, T.R. STAR: Ultrafast universal RNA-seq aligner. Bioinformatics 2013, 29, 15–21. [Google Scholar] [CrossRef]
- Edgar, R.; Domrachev, M.; Lash, A.E. Gene Expression Omnibus: NCBI gene expression and hybridization array data repository. Nucleic. Acids Res. 2002, 30, 207–210. [Google Scholar] [CrossRef] [Green Version]
- Raudvere, U.; Kolberg, L.; Kuzmin, I.; Arak, T.; Adler, P.; Peterson, H.; Vilo, J. g:Profiler: A web server for functional enrichment analysis and conversions of gene lists (2019 update). Nucleic. Acids Res. 2019, 47, W191–W198. [Google Scholar] [CrossRef] [Green Version]
- Mounir, M.; Lucchetta, M.; Silva, T.C.; Olsen, C.; Bontempi, G.; Chen, X.; Noushmehr, H.; Colaprico, A.; Papaleo, E. New functionalities in the TCGAbiolinks package for the study and integration of cancer data from GDC and GTEx. PLoS Comput. Biol. 2019, 15, e1006701. [Google Scholar] [CrossRef] [Green Version]
- Colaprico, A.; Silva, T.C.; Olsen, C.; Garofano, L.; Cava, C.; Garolini, D.; Sabedot, T.S.; Malta, T.M.; Pagnotta, S.M.; Castiglioni, I.; et al. TCGAbiolinks: An R/Bioconductor package for integrative analysis of TCGA data. Nucleic. Acids Res. 2016, 44, e71. [Google Scholar] [CrossRef]
- Liu, J.; Lichtenberg, T.; Hoadley, K.A.; Poisson, L.M.; Lazar, A.J.; Cherniack, A.D.; Kovatich, A.J.; Benz, C.C.; Levine, D.A.; Lee, A.V.; et al. An Integrated TCGA Pan-Cancer Clinical Data Resource to Drive High-Quality Survival Outcome Analytics. Cell 2018, 173, 400–416.e411. [Google Scholar] [CrossRef] [Green Version]
- Subramanian, A.; Tamayo, P.; Mootha, V.K.; Mukherjee, S.; Ebert, B.L.; Gillette, M.A.; Paulovich, A.; Pomeroy, S.L.; Golub, T.R.; Lander, E.S.; et al. Gene set enrichment analysis: A knowledge-based approach for interpreting genome-wide expression profiles. Proc. Natl. Acad. Sci. USA 2005, 102, 15545–15550. [Google Scholar] [CrossRef] [Green Version]
- Goldman, M.J.; Craft, B.; Hastie, M.; Repecka, K.; McDade, F.; Kamath, A.; Banerjee, A.; Luo, Y.; Rogers, D.; Brooks, A.N.; et al. Visualizing and interpreting cancer genomics data via the Xena platform. Nat. Biotechnol. 2020, 38, 675–678. [Google Scholar] [CrossRef]
- Page, D.B.; Postow, M.A.; Callahan, M.K.; Allison, J.P.; Wolchok, J.D. Immune modulation in cancer with antibodies. Annu. Rev. Med. 2014, 65, 185–202. [Google Scholar] [CrossRef]
- Najafi, M.; Farhood, B.; Mortezaee, K. Cancer stem cells (CSCs) in cancer progression and therapy. J. Cell Physiol. 2019, 234, 8381–8395. [Google Scholar] [CrossRef]
- Alidadiani, N.; Ghaderi, S.; Dilaver, N.; Bakhshamin, S.; Bayat, M. Epithelial mesenchymal transition Transcription Factor (TF): The structure, function and microRNA feedback loop. Gene 2018, 674, 115–120. [Google Scholar] [CrossRef]
- Huynh, J.; Etemadi, N.; Hollande, F.; Ernst, M.; Buchert, M. The JAK/STAT3 axis: A comprehensive drug target for solid malignancies. Semin. Cancer Biol. 2017, 45, 13–22. [Google Scholar] [CrossRef]
- Manore, S.G.; Doheny, D.L.; Wong, G.L.; Lo, H.W. IL-6/JAK/STAT3 Signaling in Breast Cancer Metastasis: Biology and Treatment. Front. Oncol. 2022, 12, 866014. [Google Scholar] [CrossRef]
- Kamran, M.Z.; Patil, P.; Gude, R.P. Role of STAT3 in cancer metastasis and translational advances. BioMed Res. Int. 2013, 2013, 421821. [Google Scholar] [CrossRef]
- Tesoriere, A.; Dinarello, A.; Argenton, F. The Roles of Post-Translational Modifications in STAT3 Biological Activities and Functions. Biomedicines 2021, 9, 956. [Google Scholar] [CrossRef]
- Laudisi, F.; Cherubini, F.; Monteleone, G.; Stolfi, C. STAT3 Interactors as Potential Therapeutic Targets for Cancer Treatment. Int. J. Mol. Sci. 2018, 19, 1787. [Google Scholar] [CrossRef] [Green Version]
- Schust, J.; Sperl, B.; Hollis, A.; Mayer, T.U.; Berg, T. Stattic: A small-molecule inhibitor of STAT3 activation and dimerization. Chem. Biol. 2006, 13, 1235–1242. [Google Scholar] [CrossRef] [Green Version]
- Costa-Pereira, A.P.; Tininini, S.; Strobl, B.; Alonzi, T.; Schlaak, J.F.; Is’harc, H.; Gesualdo, I.; Newman, S.J.; Kerr, I.M.; Poli, V. Mutational switch of an IL-6 response to an interferon-gamma-like response. Proc. Natl. Acad. Sci. USA 2002, 99, 8043–8047. [Google Scholar] [CrossRef] [Green Version]
- Jones, M.R.; Quinton, L.J.; Simms, B.T.; Lupa, M.M.; Kogan, M.S.; Mizgerd, J.P. Roles of interleukin-6 in activation of STAT proteins and recruitment of neutrophils during Escherichia coli pneumonia. J. Infect. Dis. 2006, 193, 360–369. [Google Scholar] [CrossRef] [Green Version]
- Hayden, M.S.; Ghosh, S. Regulation of NF-kappaB by TNF family cytokines. Semin. Immunol. 2014, 26, 253–266. [Google Scholar] [CrossRef] [Green Version]
- Karin, M. NF-kappaB as a critical link between inflammation and cancer. Cold Spring Harb. Perspect. Biol. 2009, 1, a000141. [Google Scholar] [CrossRef] [Green Version]
- Walker, F.C.; Sridhar, P.R.; Baldridge, M.T. Differential roles of interferons in innate responses to mucosal viral infections. Trends Immunol. 2021, 42, 1009–1023. [Google Scholar] [CrossRef]
- Barbato, L.; Bocchetti, M.; Di Biase, A.; Regad, T. Cancer Stem Cells and Targeting Strategies. Cells 2019, 8, 926. [Google Scholar] [CrossRef] [Green Version]
- Waks, A.G.; Winer, E.P. Breast Cancer Treatment: A Review. JAMA 2019, 321, 288–300. [Google Scholar] [CrossRef]
- Kauffman, M.K.; Kauffman, M.E.; Zhu, H.; Jia, Z.; Li, Y.R. Fluorescence-Based Assays for Measuring Doxorubicin in Biological Systems. React. Oxyg. Species (Apex) 2016, 2, 432–439. [Google Scholar] [CrossRef] [Green Version]
- Yang, L.; Shi, P.; Zhao, G.; Xu, J.; Peng, W.; Zhang, J.; Zhang, G.; Wang, X.; Dong, Z.; Chen, F.; et al. Targeting cancer stem cell pathways for cancer therapy. Signal Transduct. Target Ther. 2020, 5, 8. [Google Scholar] [CrossRef] [Green Version]
- Jin, W. Role of JAK/STAT3 Signaling in the Regulation of Metastasis, the Transition of Cancer Stem Cells, and Chemoresistance of Cancer by Epithelial-Mesenchymal Transition. Cells 2020, 9, 217. [Google Scholar] [CrossRef] [Green Version]
- Liubomirski, Y.; Lerrer, S.; Meshel, T.; Rubinstein-Achiasaf, L.; Morein, D.; Wiemann, S.; Korner, C.; Ben-Baruch, A. Tumor-Stroma-Inflammation Networks Promote Pro-metastatic Chemokines and Aggressiveness Characteristics in Triple-Negative Breast Cancer. Front. Immunol. 2019, 10, 757. [Google Scholar] [CrossRef] [PubMed] [Green Version]
- Gupta, P.; Singh, V.; Kumar, S.; Das, A.; Singh, G.; Bal, A. Breast cancer stem cell population in different molecular subtypes of breast cancer. Breast Dis. 2022, 41, 199–203. [Google Scholar] [CrossRef]
- Gatalica, Z.; Snyder, C.; Maney, T.; Ghazalpour, A.; Holterman, D.A.; Xiao, N.; Overberg, P.; Rose, I.; Basu, G.D.; Vranic, S.; et al. Programmed cell death 1 (PD-1) and its ligand (PD-L1) in common cancers and their correlation with molecular cancer type. Cancer Epidemiol. Biomark. Prev. 2014, 23, 2965–2970. [Google Scholar] [CrossRef] [PubMed] [Green Version]
- Rodriguez-Pinilla, S.M.; Sarrio, D.; Honrado, E.; Moreno-Bueno, G.; Hardisson, D.; Calero, F.; Benitez, J.; Palacios, J. Vimentin and laminin expression is associated with basal-like phenotype in both sporadic and BRCA1-associated breast carcinomas. J. Clin. Pathol. 2007, 60, 1006–1012. [Google Scholar] [CrossRef] [Green Version]
- Erlichman, N.; Baram, T.; Meshel, T.; Morein, D.; Da’adoosh, B.; Ben-Baruch, A. Tumor Cell-Autonomous Pro-Metastatic Activities of PD-L1 in Human Breast Cancer Are Mediated by PD-L1-S283 and Chemokine Axes. Cancers 2022, 14, 1042. [Google Scholar] [CrossRef]
- Huynh, J.; Ernst, M. IL6 Signaling in Cancer: Not Always Bad News. Cancer Res. 2021, 81, 4671–4672. [Google Scholar] [CrossRef]
- Shriki, A.; Lanton, T.; Sonnenblick, A.; Levkovitch-Siany, O.; Eidelshtein, D.; Abramovitch, R.; Rosenberg, N.; Pappo, O.; Elgavish, S.; Nevo, Y.; et al. Multiple Roles of IL6 in Hepatic Injury, Steatosis, and Senescence Aggregate to Suppress Tumorigenesis. Cancer Res. 2021, 81, 4766–4777. [Google Scholar] [CrossRef]
- D’Amico, S.; Shi, J.; Martin, B.L.; Crawford, H.C.; Petrenko, O.; Reich, N.C. STAT3 is a master regulator of epithelial identity and KRAS-driven tumorigenesis. Genes Dev. 2018, 32, 1175–1187. [Google Scholar] [CrossRef] [Green Version]
- Stenckova, M.; Nenutil, R.; Vojtesek, B.; Coates, P.J. Stat3 Tyrosine 705 and Serine 727 Phosphorylation Associate With Clinicopathological Characteristics and Distinct Tumor Cell Phenotypes in Triple-Negative Breast Cancer. Pathol. Oncol. Res. 2022, 28, 1610592. [Google Scholar] [CrossRef] [PubMed]
- Sim, D.Y.; Lee, H.J.; Jung, J.H.; Im, E.; Hwang, J.; Kim, D.S.; Kim, S.H. Suppression of STAT3 Phosphorylation and RelA/p65 Acetylation Mediated by MicroRNA134 Plays a Pivotal Role in the Apoptotic Effect of Lambertianic Acid. Int. J. Mol. Sci. 2019, 20, 2993. [Google Scholar] [CrossRef] [PubMed] [Green Version]
- Yoshida, Y.; Kumar, A.; Koyama, Y.; Peng, H.; Arman, A.; Boch, J.A.; Auron, P.E. Interleukin 1 activates STAT3/nuclear factor-kappaB cross-talk via a unique TRAF6- and p65-dependent mechanism. J. Biol. Chem. 2004, 279, 1768–1776. [Google Scholar] [CrossRef] [PubMed] [Green Version]
- Lin, W.H.; Chang, Y.W.; Hong, M.X.; Hsu, T.C.; Lee, K.C.; Lin, C.; Lee, J.L. STAT3 phosphorylation at Ser727 and Tyr705 differentially regulates the EMT-MET switch and cancer metastasis. Oncogene 2021, 40, 791–805. [Google Scholar] [CrossRef]
- Zou, S.; Tong, Q.; Liu, B.; Huang, W.; Tian, Y.; Fu, X. Targeting STAT3 in Cancer Immunotherapy. Mol. Cancer 2020, 19, 145. [Google Scholar] [CrossRef]
- Burstein, H.J. Systemic Therapy for Estrogen Receptor-Positive, HER2-Negative Breast Cancer. N. Engl. J. Med. 2020, 383, 2557–2570. [Google Scholar] [CrossRef]
- Willrich, M.A.; Murray, D.L.; Snyder, M.R. Tumor necrosis factor inhibitors: Clinical utility in autoimmune diseases. Transl. Res. 2015, 165, 270–282. [Google Scholar] [CrossRef]
- Billmeier, U.; Dieterich, W.; Neurath, M.F.; Atreya, R. Molecular mechanism of action of anti-tumor necrosis factor antibodies in inflammatory bowel diseases. World J. Gastroenterol. 2016, 22, 9300–9313. [Google Scholar] [CrossRef]


Disclaimer/Publisher’s Note: The statements, opinions and data contained in all publications are solely those of the individual author(s) and contributor(s) and not of MDPI and/or the editor(s). MDPI and/or the editor(s) disclaim responsibility for any injury to people or property resulting from any ideas, methods, instructions or products referred to in the content. |
© 2023 by the authors. Licensee MDPI, Basel, Switzerland. This article is an open access article distributed under the terms and conditions of the Creative Commons Attribution (CC BY) license (https://creativecommons.org/licenses/by/4.0/).
Share and Cite
Ben-Yaakov, H.; Meshel, T.; Pasmanik-Chor, M.; Körner, C.; Ben-Baruch, A. A Tumor Microenvironment-Driven Network Regulated by STAT3 and p65 Negatively Controls the Enrichment of Cancer Stem Cells in Human HR+/HER2− Breast Cancer. Cancers 2023, 15, 2255. https://doi.org/10.3390/cancers15082255
Ben-Yaakov H, Meshel T, Pasmanik-Chor M, Körner C, Ben-Baruch A. A Tumor Microenvironment-Driven Network Regulated by STAT3 and p65 Negatively Controls the Enrichment of Cancer Stem Cells in Human HR+/HER2− Breast Cancer. Cancers. 2023; 15(8):2255. https://doi.org/10.3390/cancers15082255
Chicago/Turabian StyleBen-Yaakov, Hagar, Tsipi Meshel, Metsada Pasmanik-Chor, Cindy Körner, and Adit Ben-Baruch. 2023. "A Tumor Microenvironment-Driven Network Regulated by STAT3 and p65 Negatively Controls the Enrichment of Cancer Stem Cells in Human HR+/HER2− Breast Cancer" Cancers 15, no. 8: 2255. https://doi.org/10.3390/cancers15082255