
MR Vascular Fingerprinting with Hybrid Gradient–Spin Echo Dynamic Susceptibility Contrast MRI for Characterization of Microvasculature in Gliomas
 , , , , and
Abstract
:Simple Summary
Abstract
1. Introduction
2. Materials and Methods
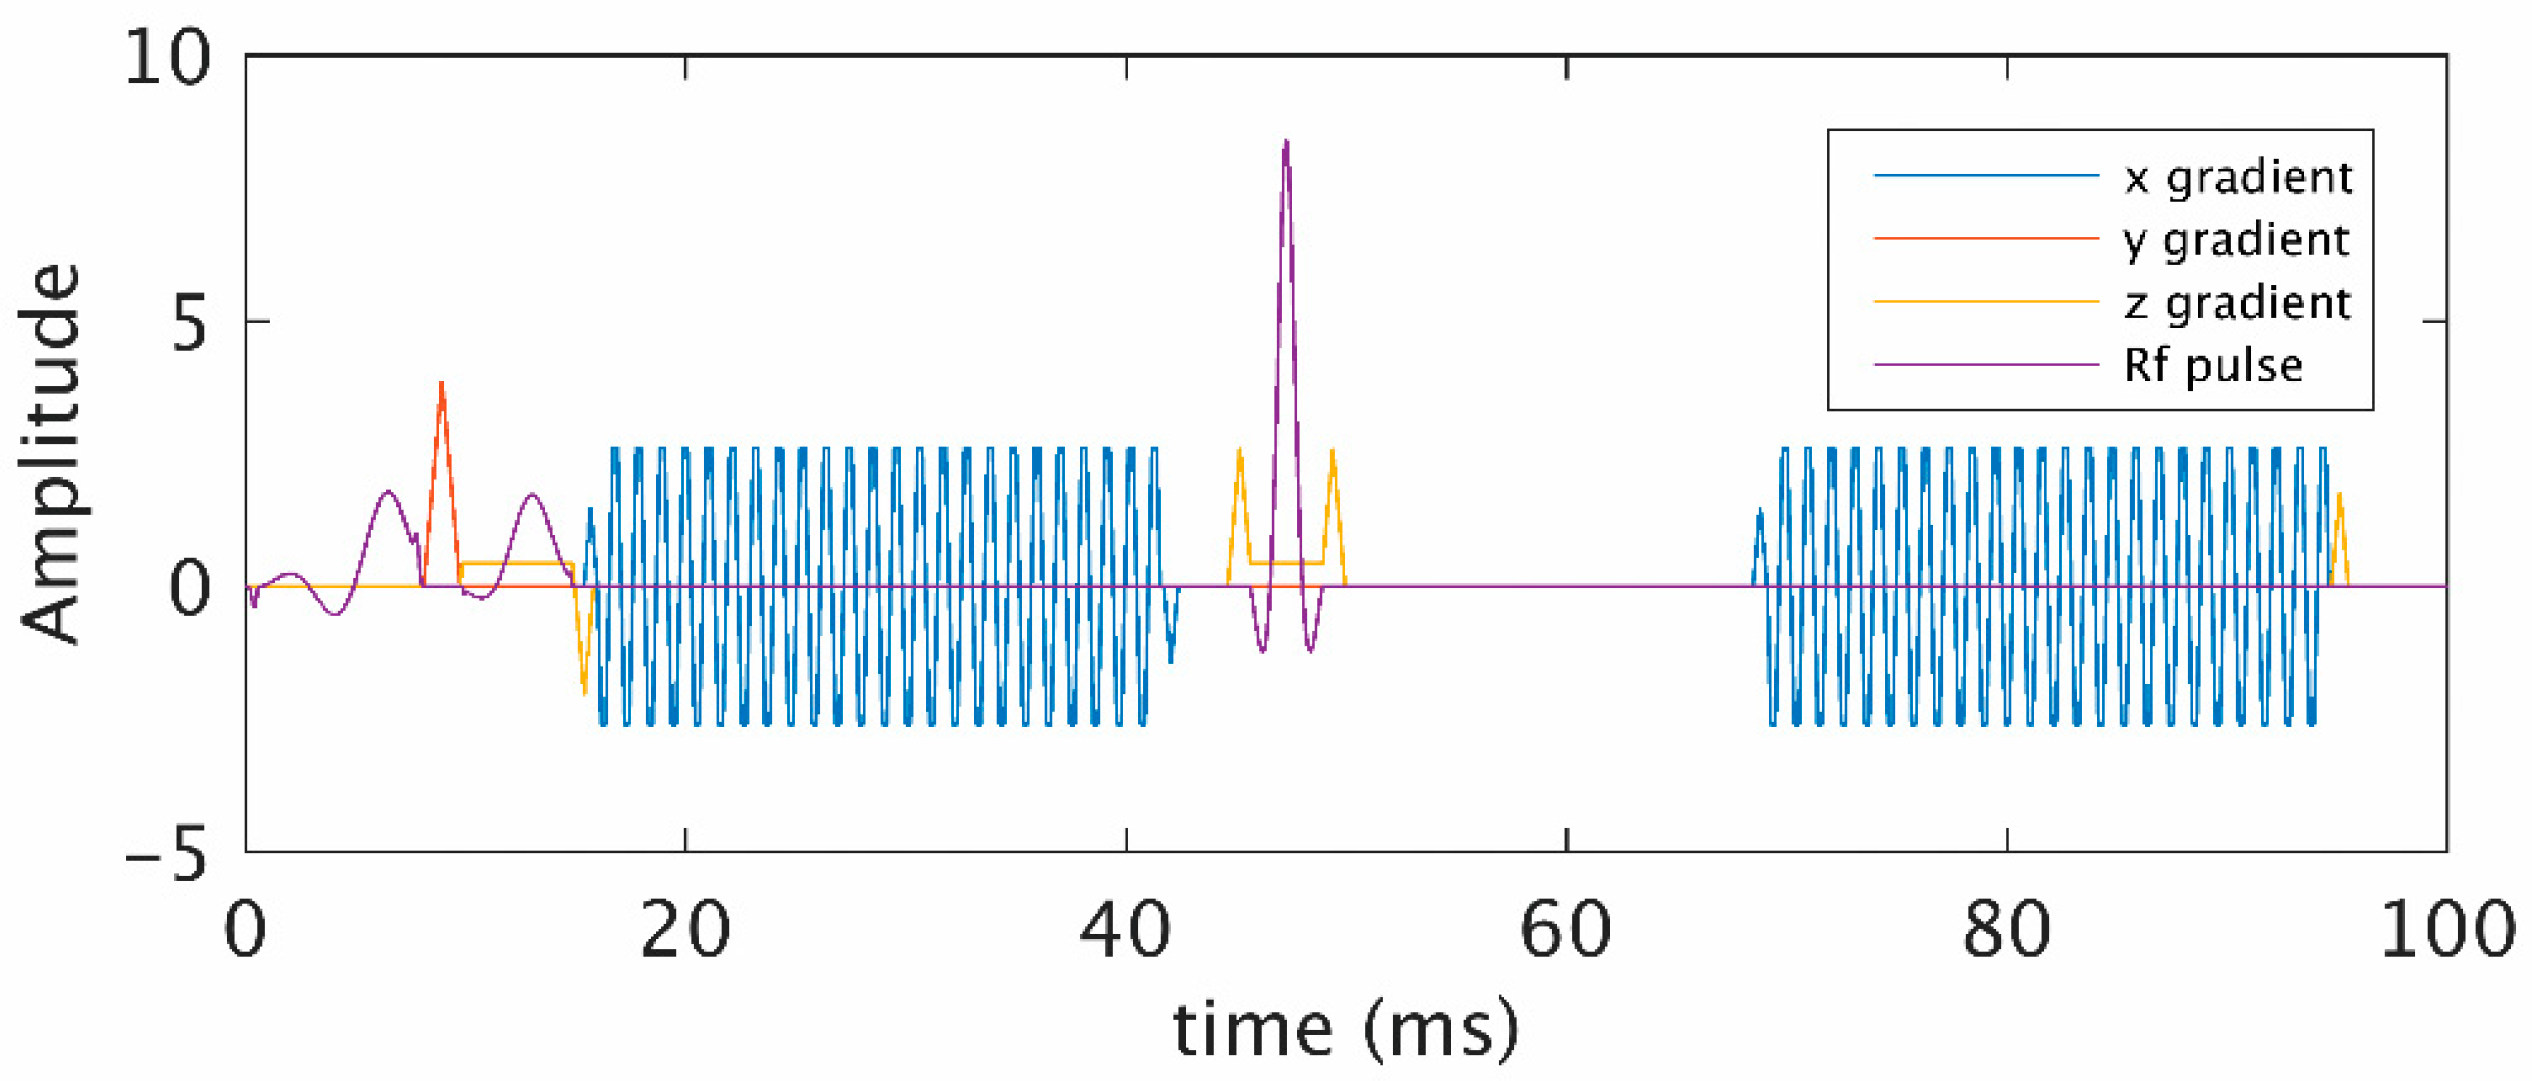
2.1. Data Acquisition
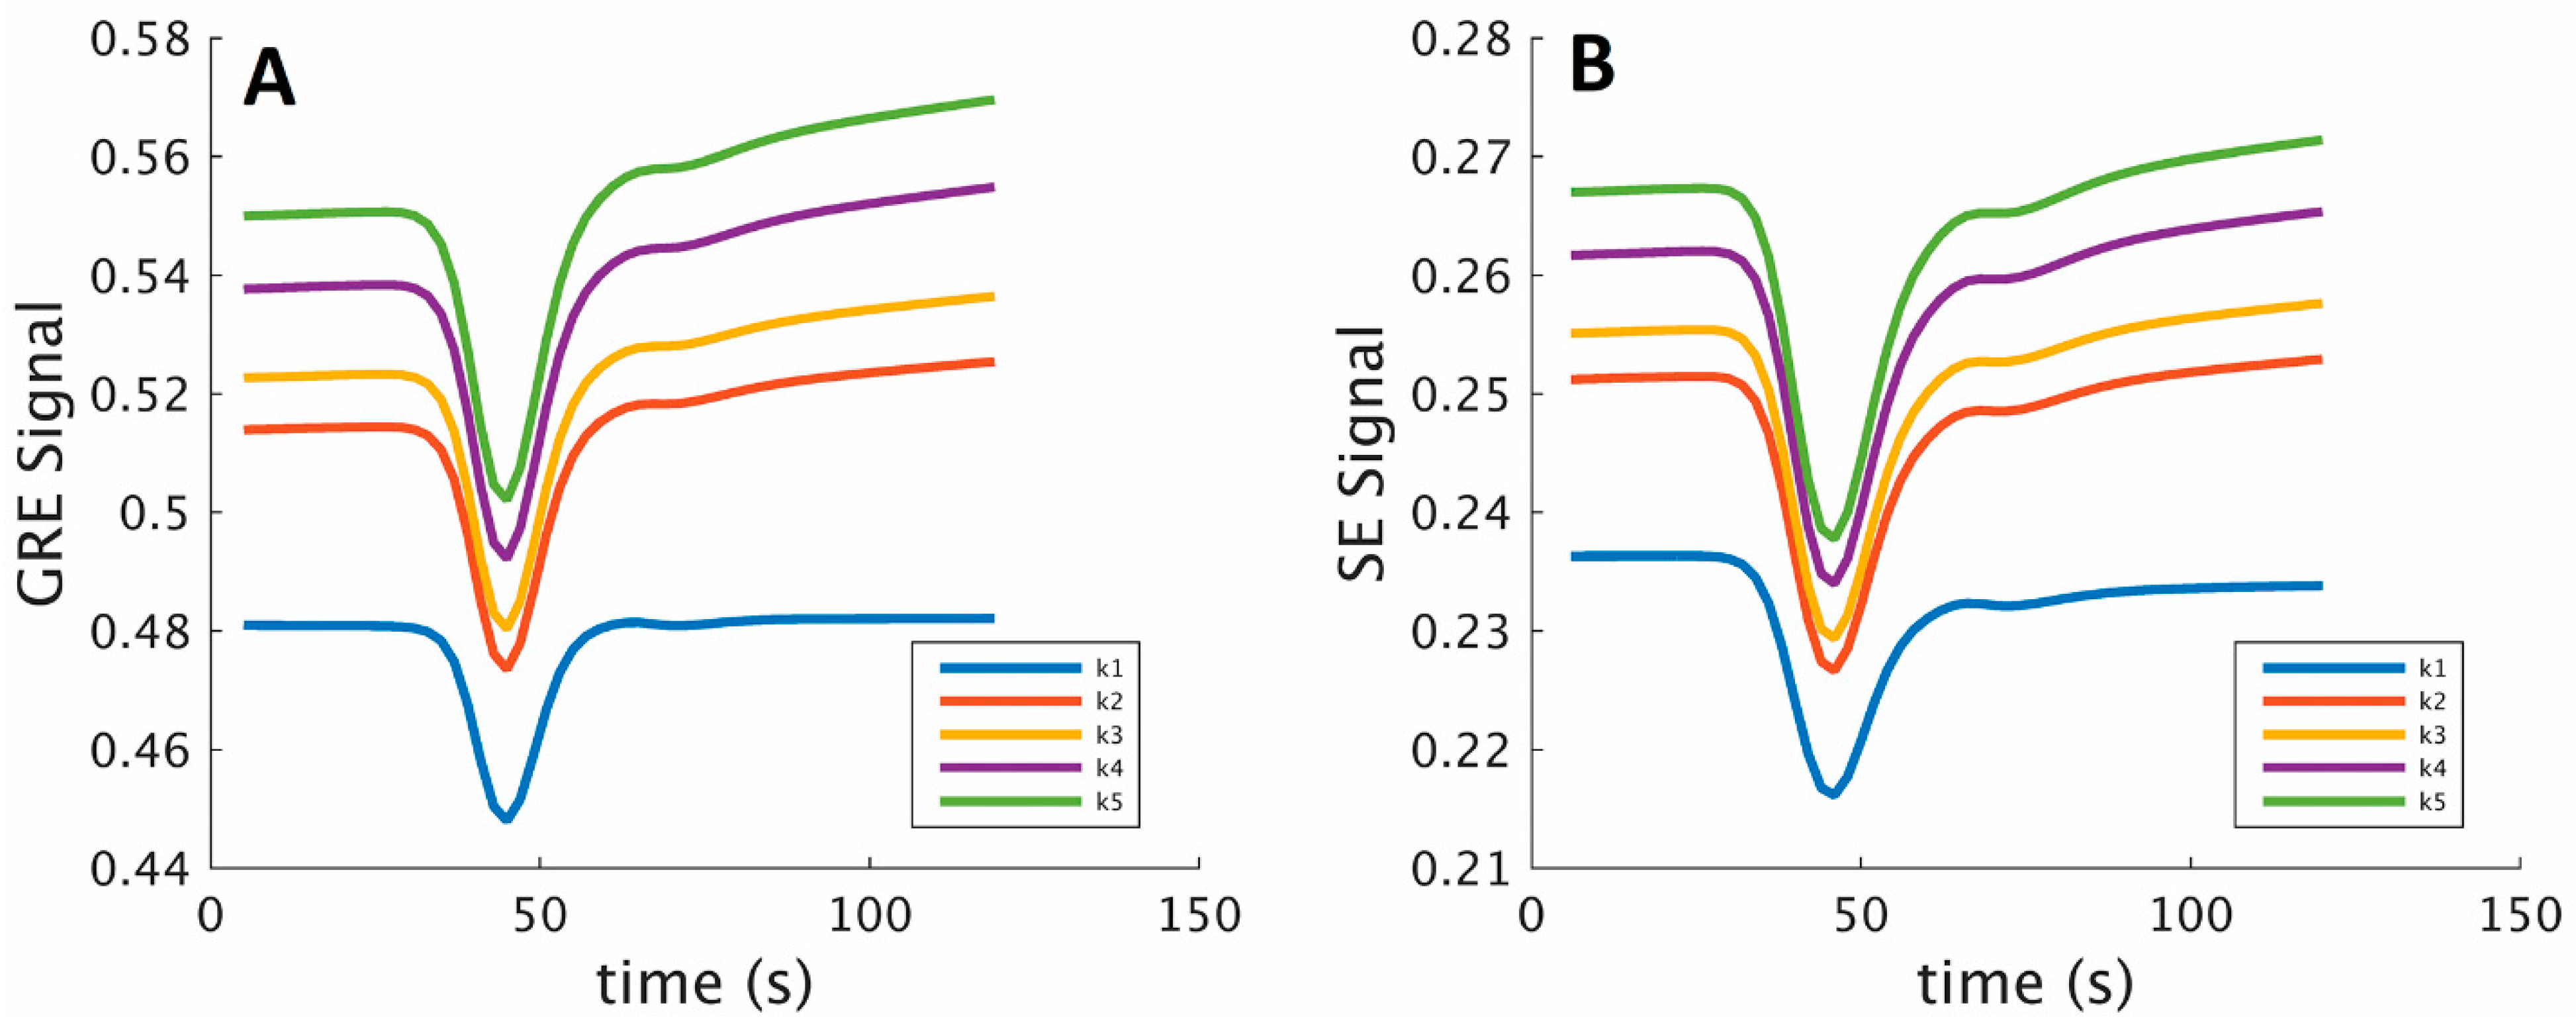
2.2. Simulation of MR Signal
2.3. Dictionary Generation and Matching
2.4. Comparison with Vessel Size Imaging
2.5. Noise Analysis
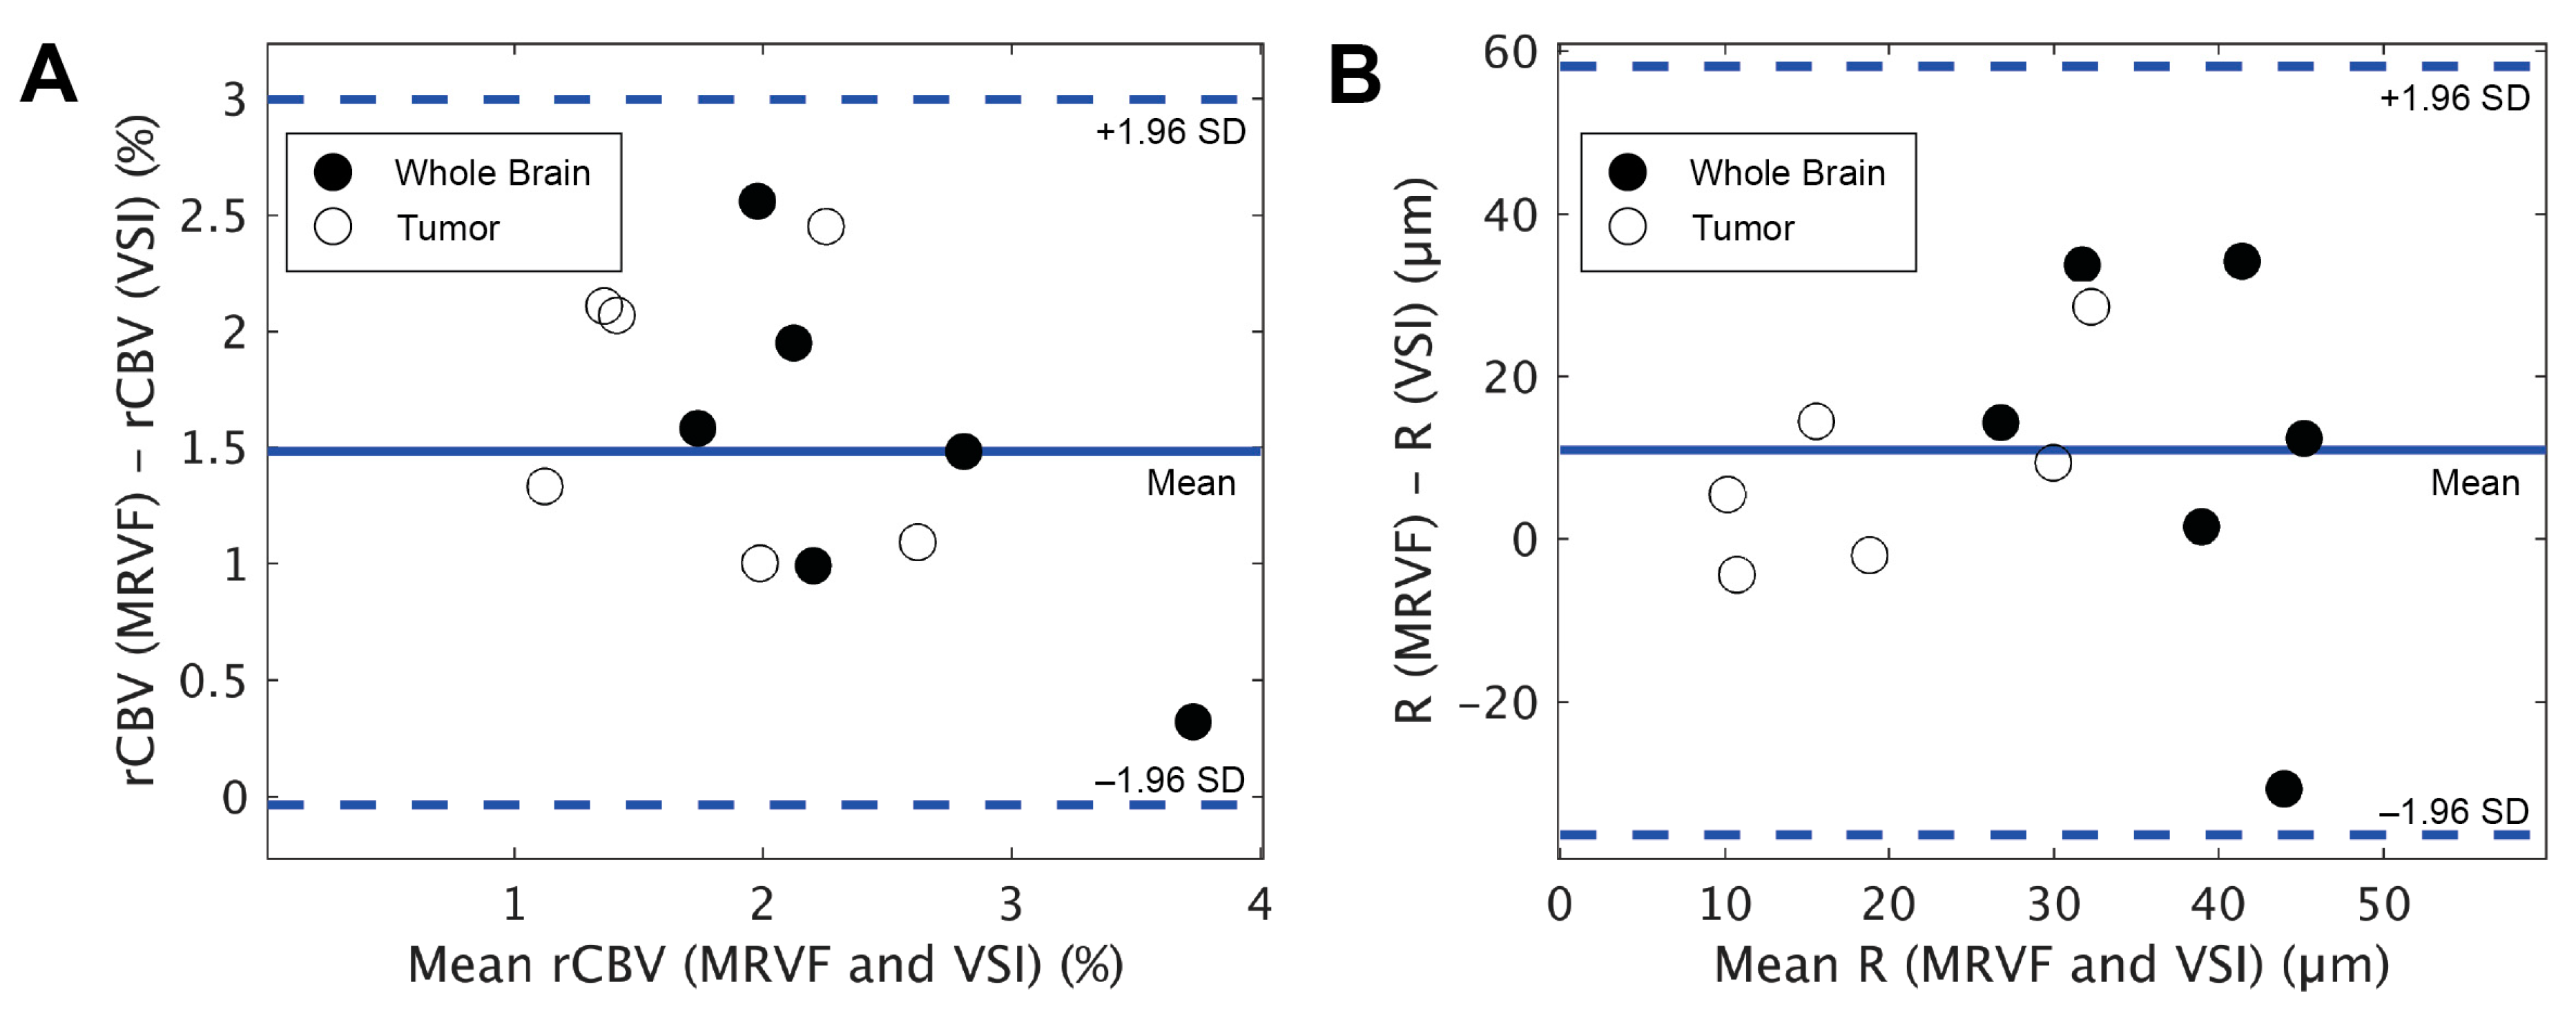
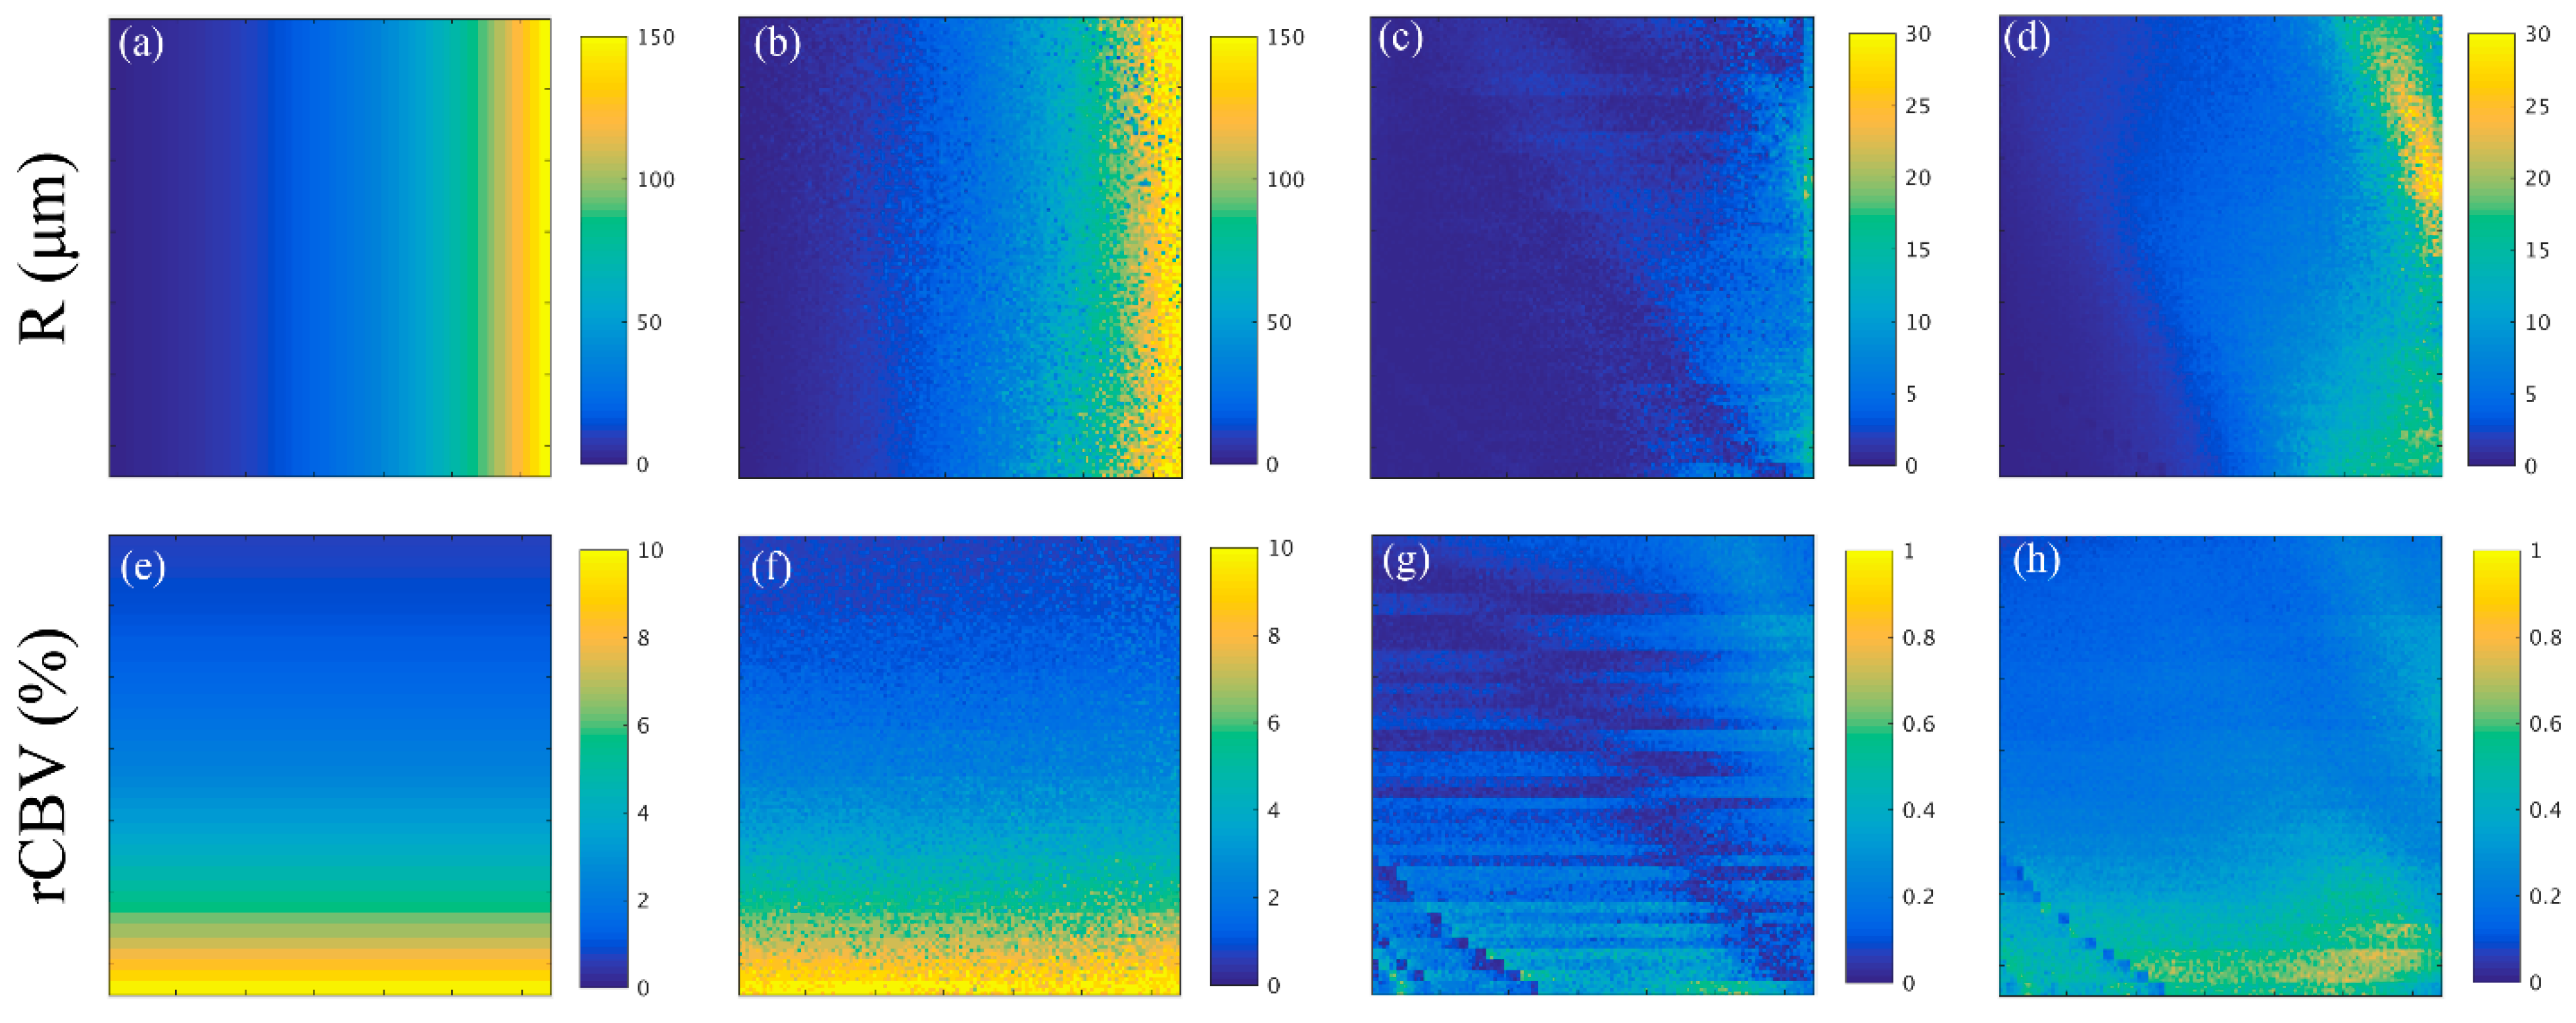
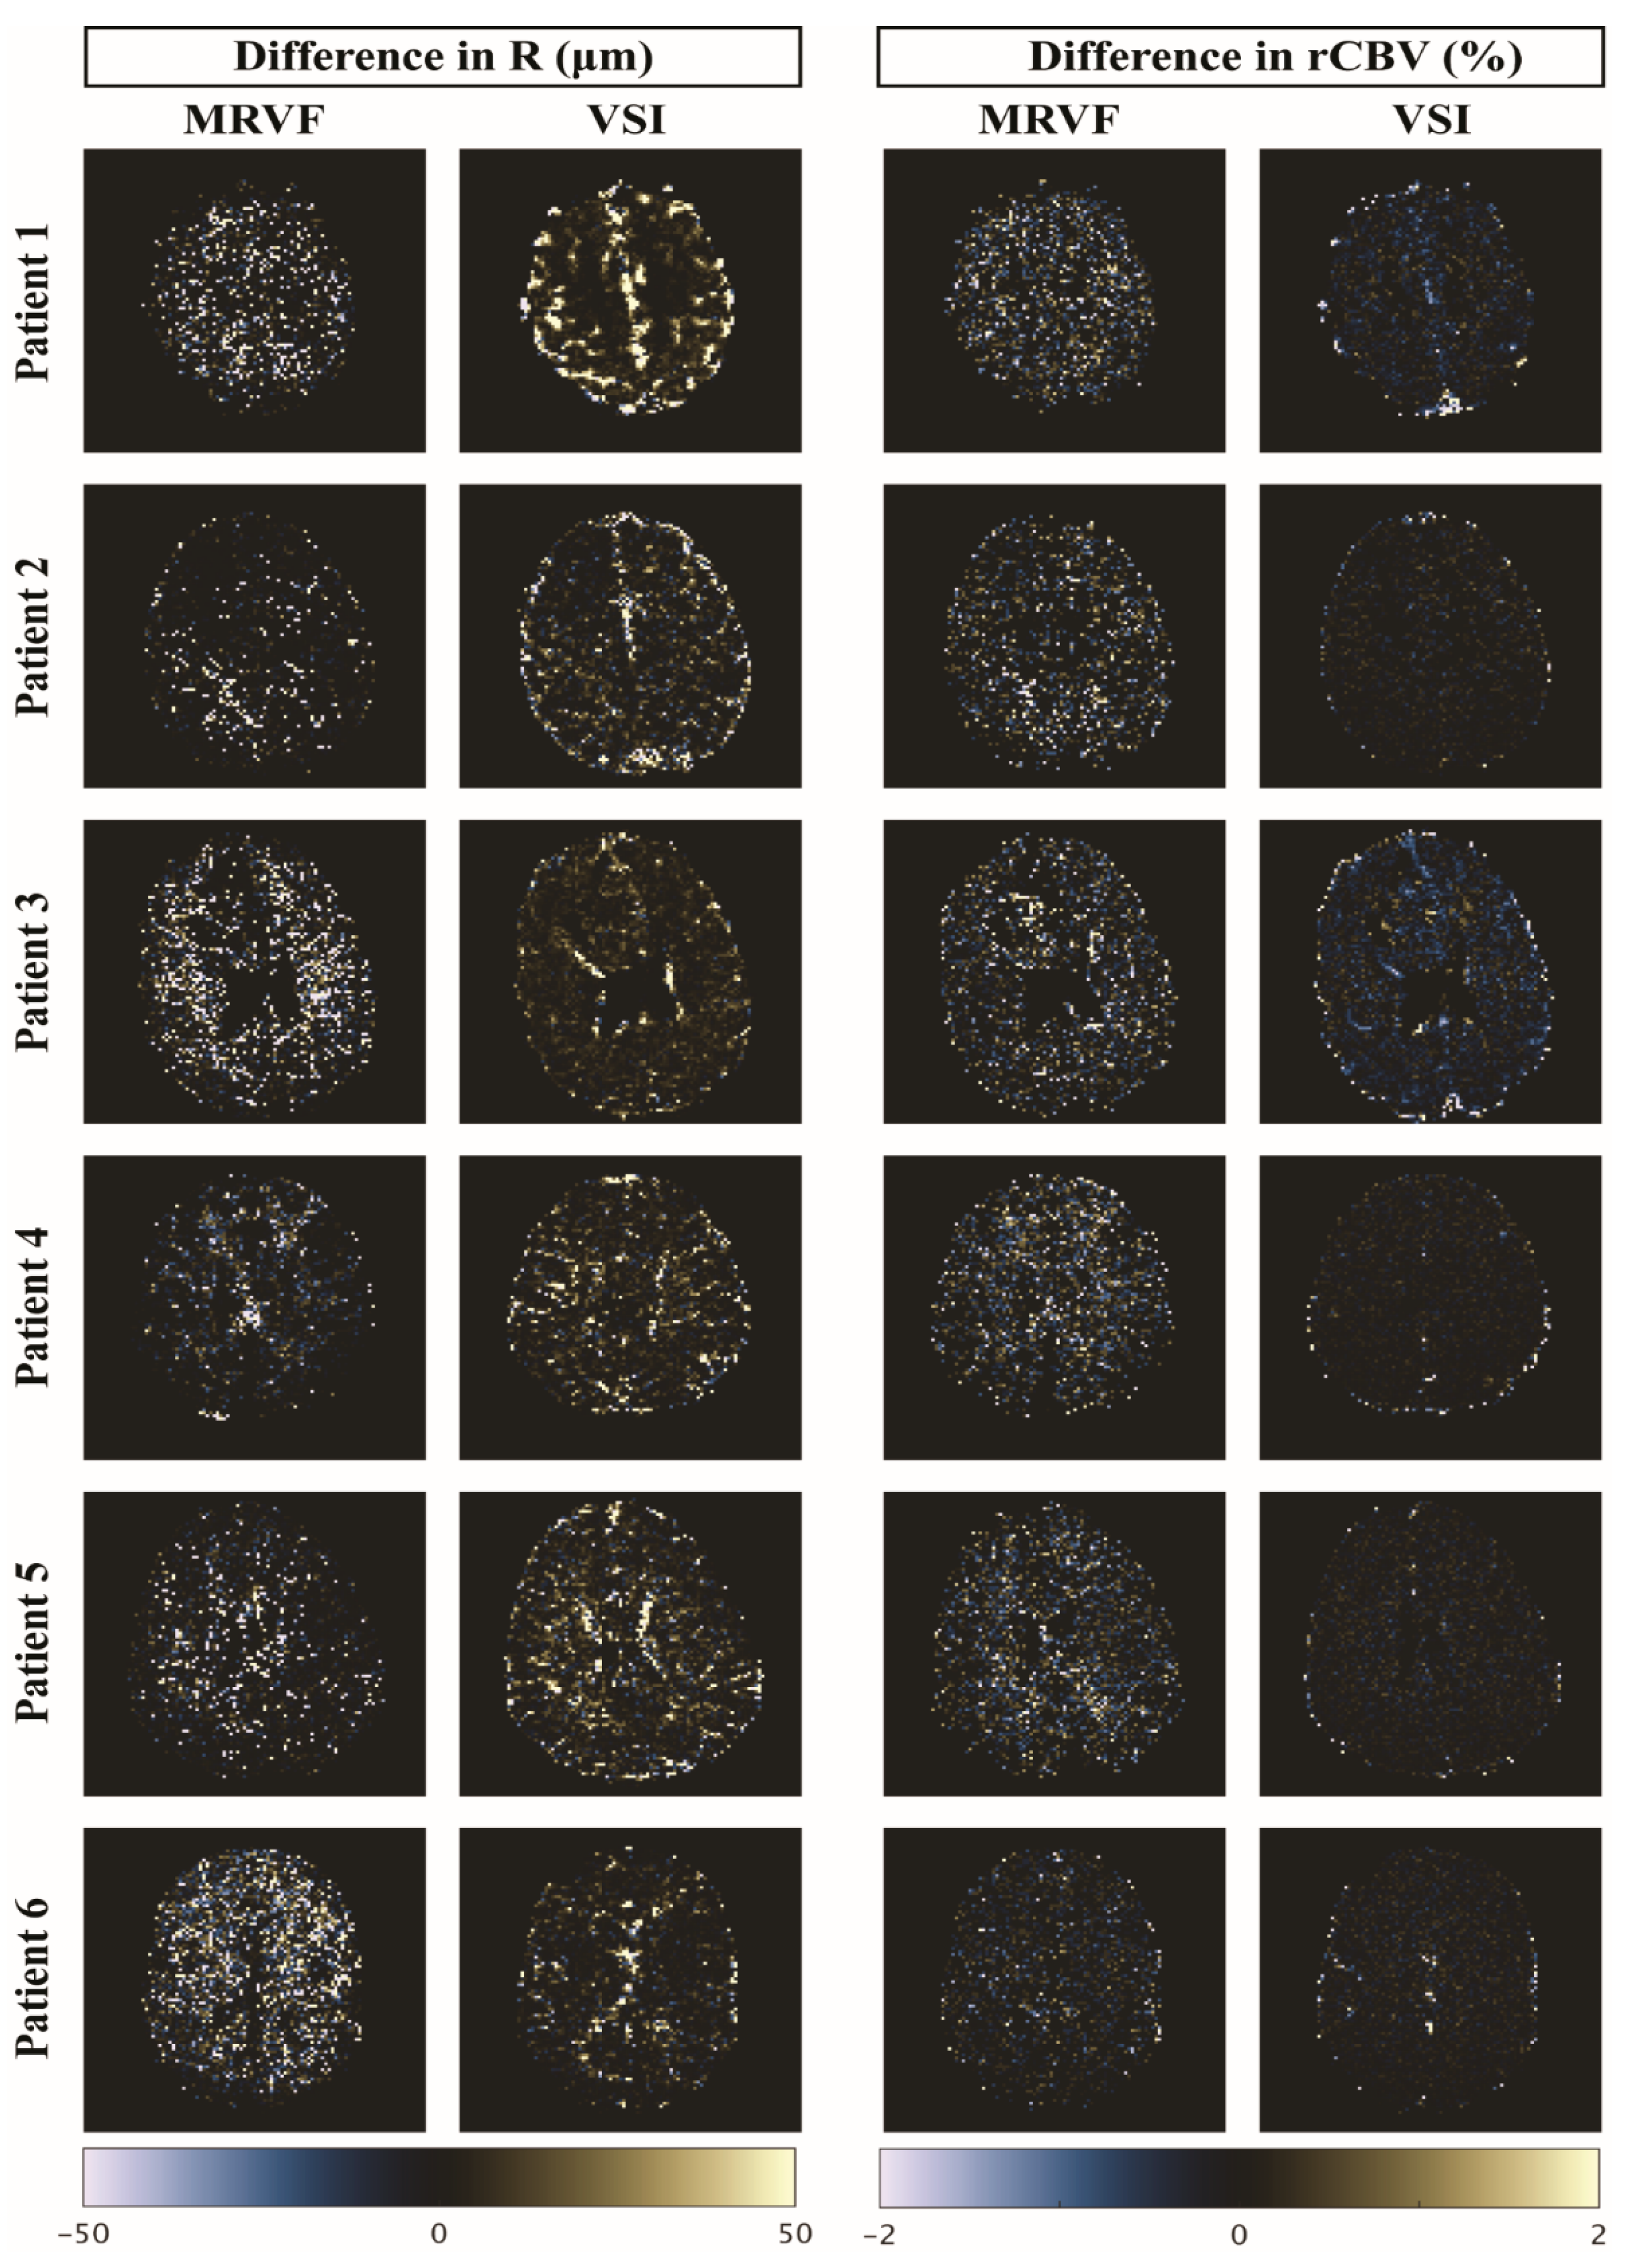
3. Results
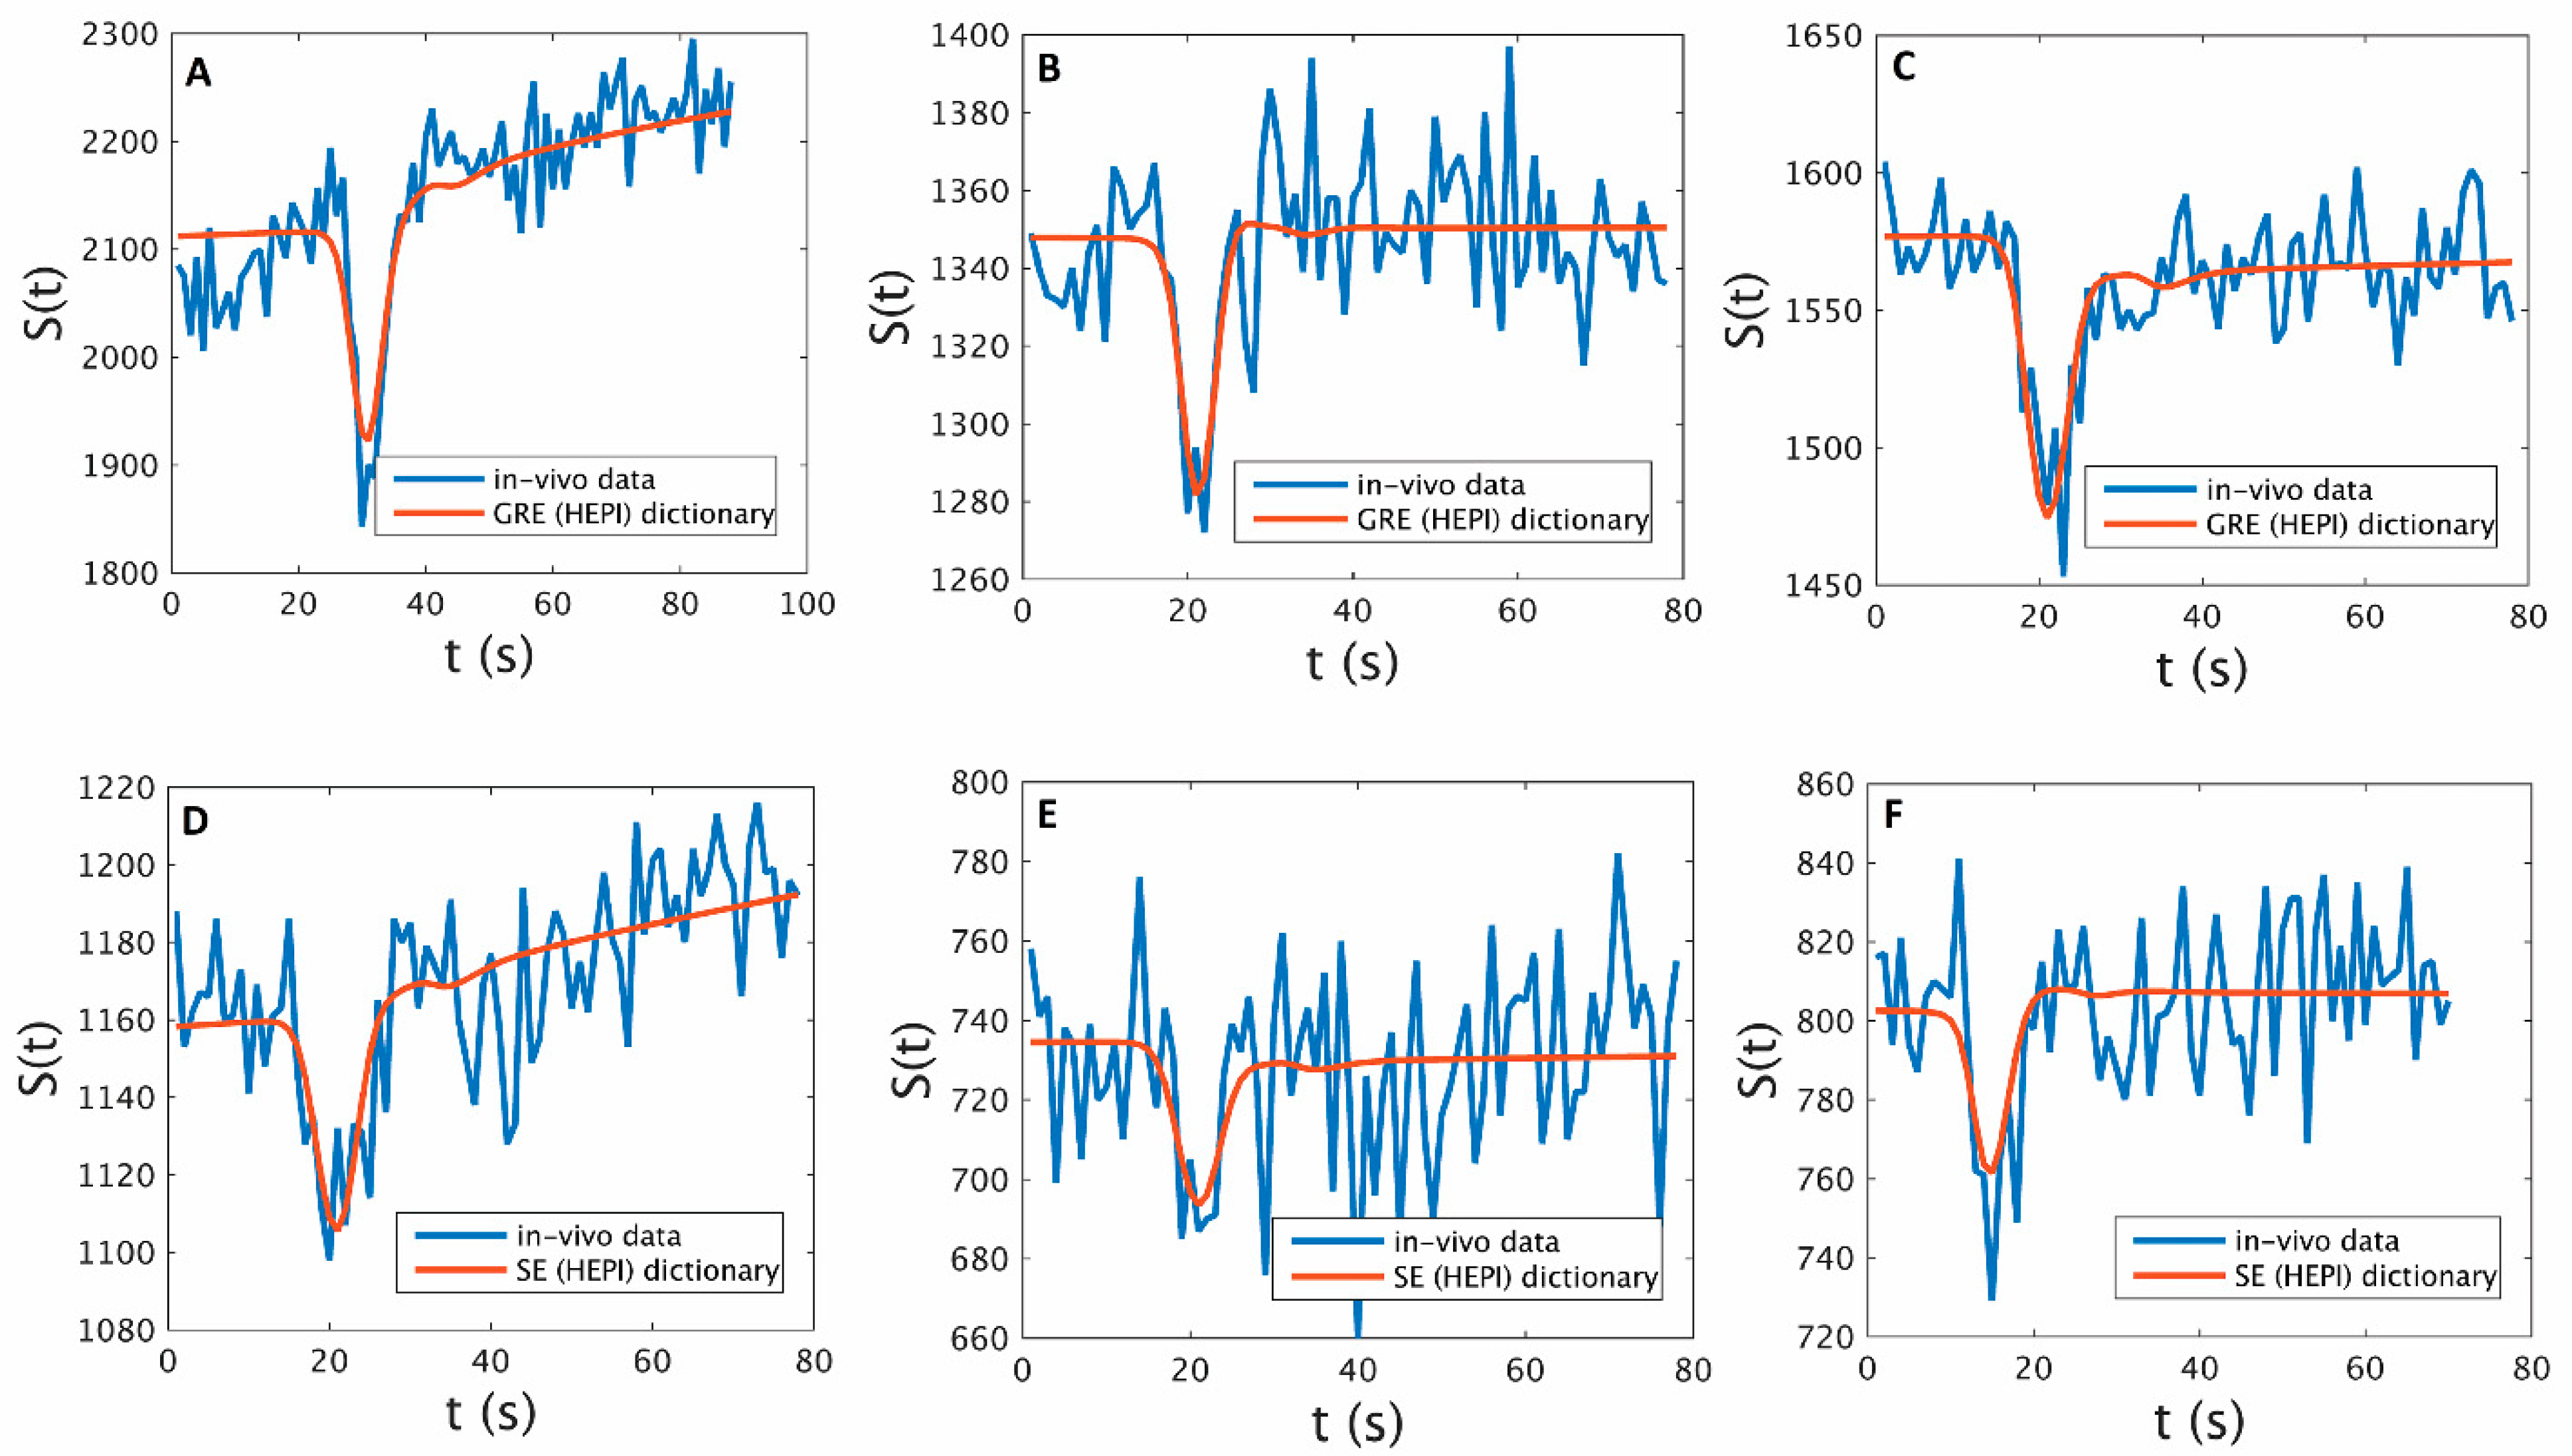
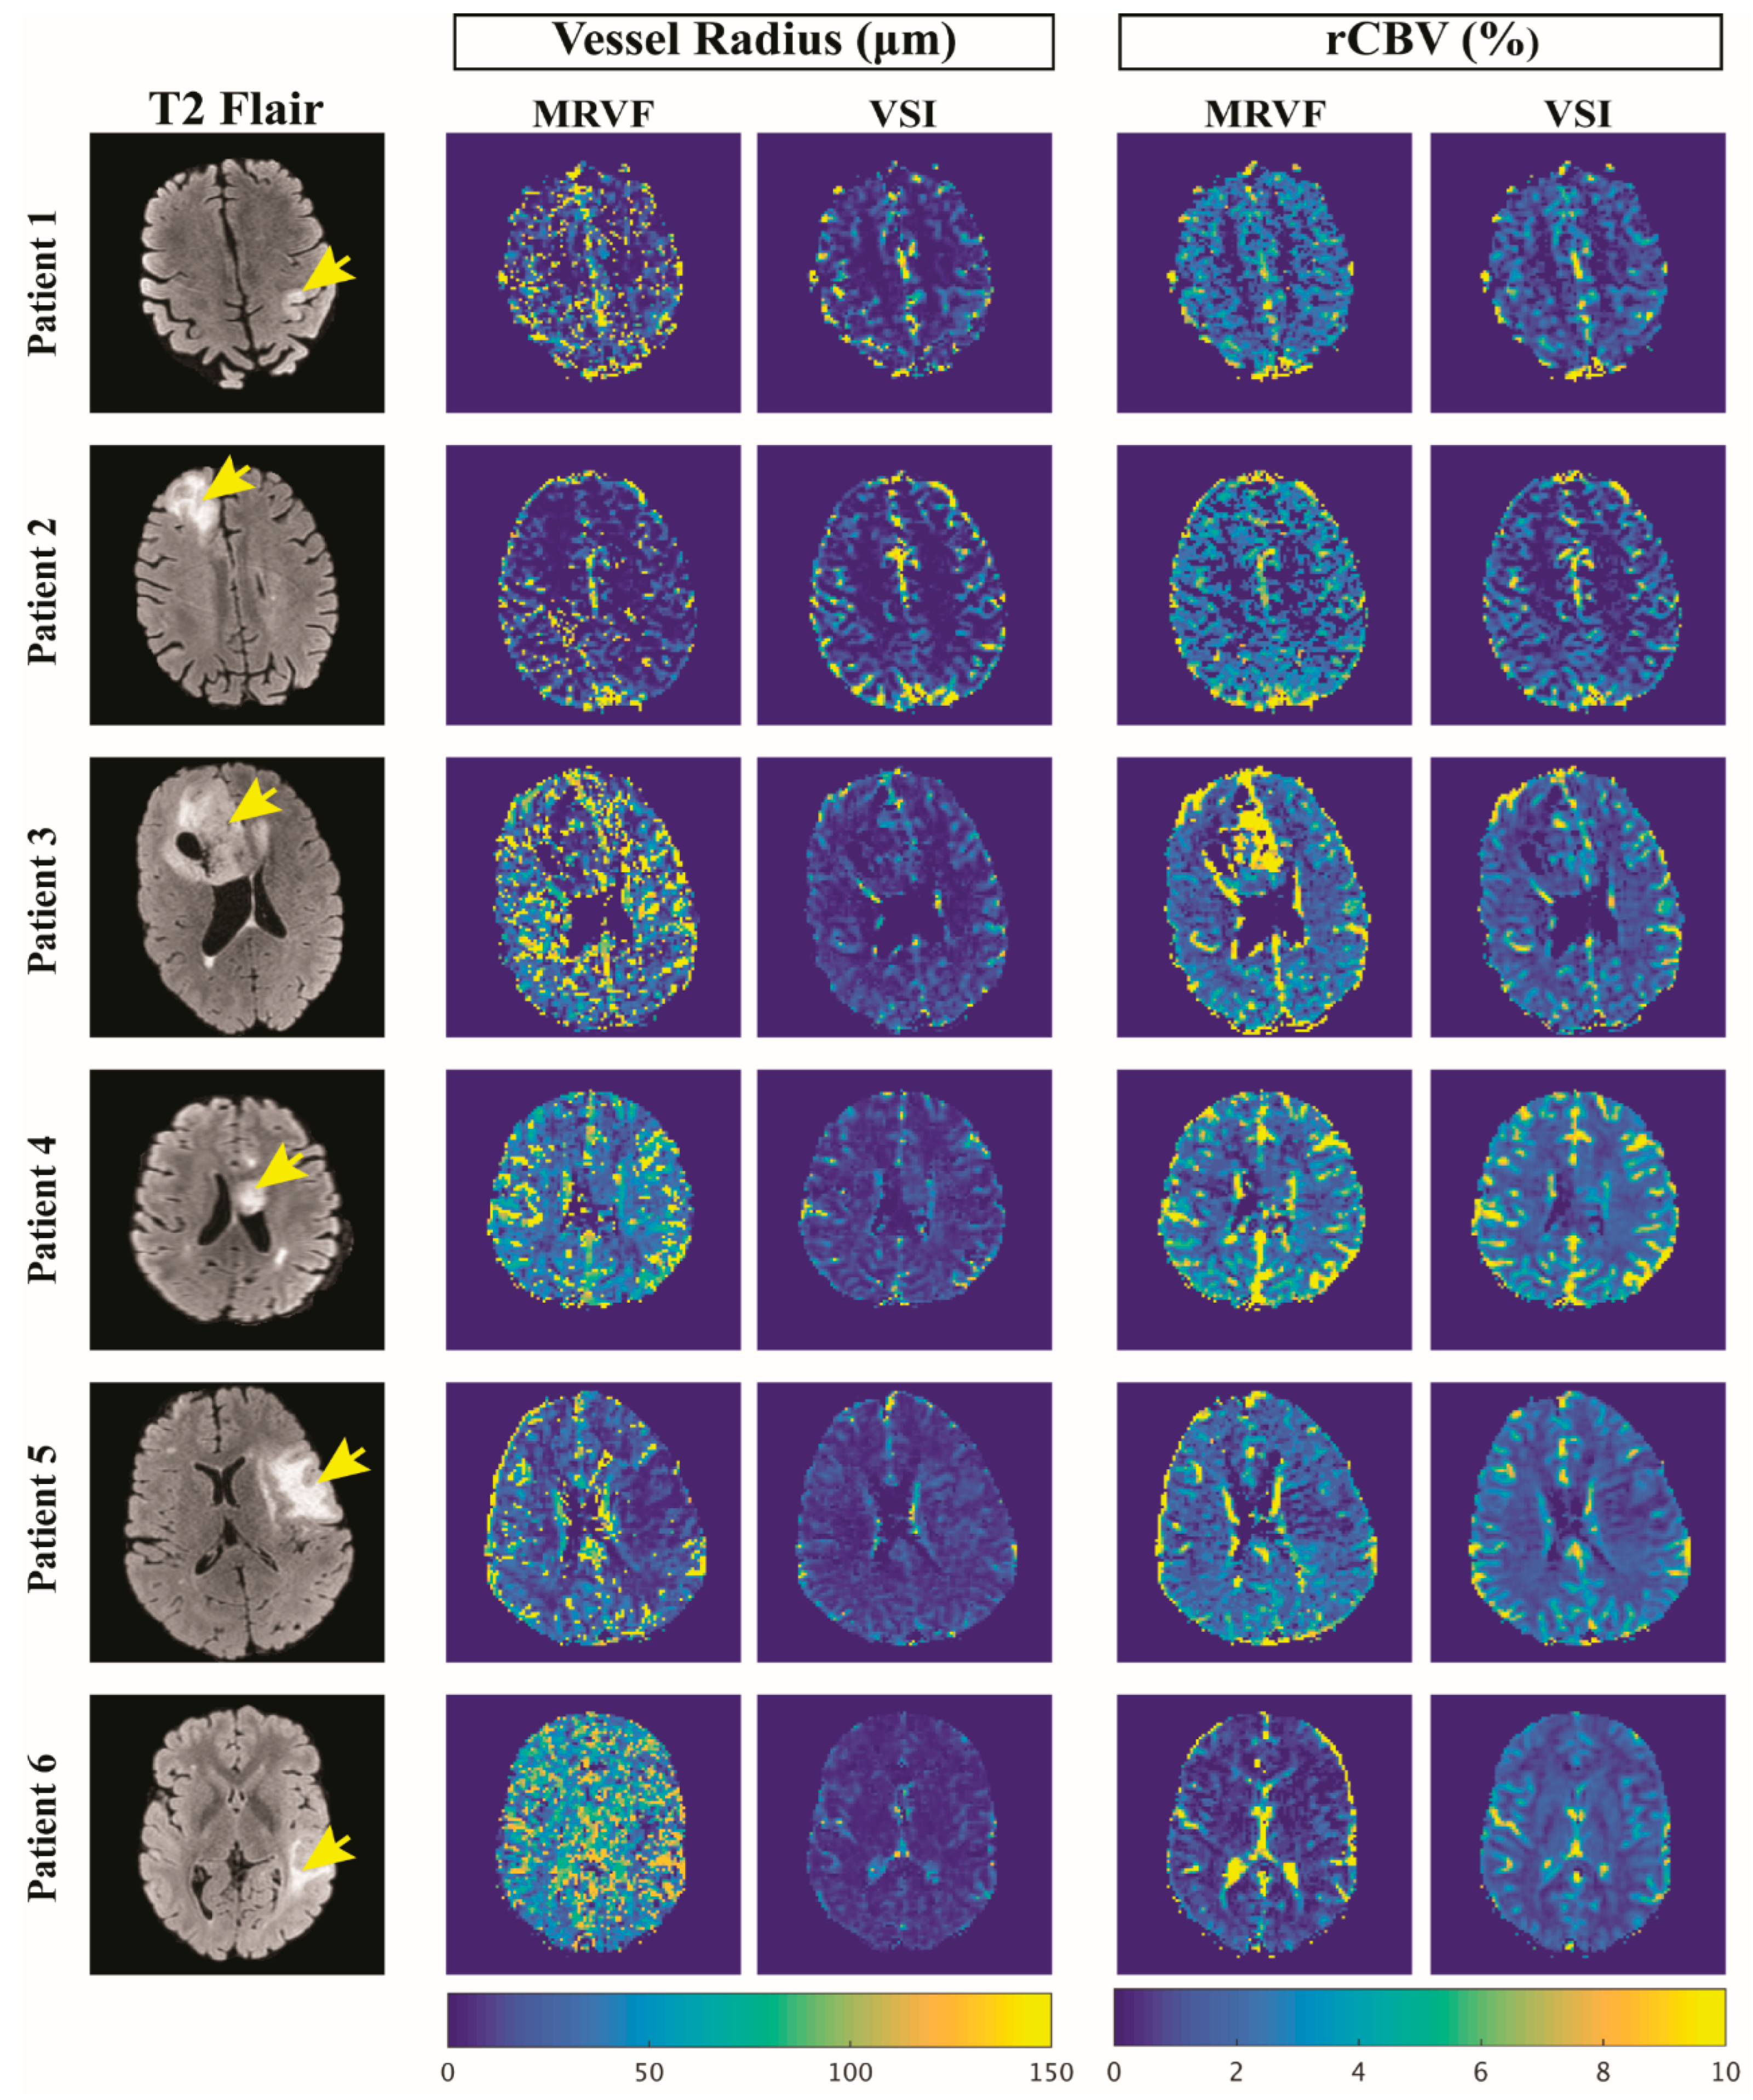
3.1. Parametric Maps
3.2. Noise Analysis
4. Discussion
5. Conclusions
Author Contributions
Funding
Institutional Review Board Statement
Informed Consent Statement
Data Availability Statement
Acknowledgments
Conflicts of Interest
References
- Villringer, A.; Rosen, B.R.; Belliveau, J.W.; Ackerman, J.L.; Lauffer, R.B.; Buxton, R.B.; Chao, Y.-S.; Wedeenand, V.J.; Brady, T.J. Dynamic Imaging with Lanthanide Chelates in Normal Brain: Contrast Due to Magnetic Susceptibility Effects. Magn. Reson. Med. 1988, 6, 164–174. [Google Scholar] [CrossRef]
- Shiroishi, M.S.; Castellazzi, G.; Boxerman, J.L.; D’Amore, F.; Essig, M.; Nguyen, T.B.; Provenzale, J.M.; Enterline, D.S.; Anzalone, N.; Dörfler, A.; et al. Principles of T2*-Weighted Dynamic Susceptibility Contrast MRI Technique in Brain Tumor Imaging: Principles of T2*-Weighted DSC-MRI. J. Magn. Reson. Imaging 2015, 41, 296–313. [Google Scholar] [CrossRef] [PubMed]
- Boxerman, J.L.; Quarles, C.C.; Hu, L.S.; Erickson, B.J.; Gerstner, E.R.; Smits, M.; Kaufmann, T.J.; Barboriak, D.P.; Huang, R.H.; Wick, W.; et al. Consensus Recommendations for a Dynamic Susceptibility Contrast MRI Protocol for Use in High-Grade Gliomas. Neuro-Oncol. 2020, 22, 1262–1275. [Google Scholar] [CrossRef] [PubMed]
- Aronen, H.J.; Perkiö, J. Dynamic Susceptibility Contrast MRI of Gliomas. Neuroimaging Clin. N. Am. 2002, 12, 501–523. [Google Scholar] [CrossRef] [PubMed]
- Paulson, E.S.; Schmainda, K.M. Comparison of Dynamic Susceptibility-Weighted Contrast-Enhanced MR Methods: Recommendations for Measuring Relative Cerebral Blood Volume in Brain Tumors. Radiology 2008, 249, 601–613. [Google Scholar] [CrossRef]
- Calamante, F.; Thomas, D.L.; Pell, G.S.; Wiersma, J.; Turner, R. Measuring Cerebral Blood Flow Using Magnetic Resonance Imaging Techniques. J. Cereb. Blood Flow Metab. Off. J. Int. Soc. Cereb. Blood Flow Metab. 1999, 19, 701–735. [Google Scholar] [CrossRef] [Green Version]
- Kremer, S.; Grand, S.; Remy, C.; Esteve, F.; Lefournier, V.; Pasquier, B.; Hoffmann, D.; Benabid, A.L.; Le Bas, J.-F. Cerebral Blood Volume Mapping by MR Imaging in the Initial Evaluation of Brain Tumors. J. Neuroradiol. J. Neuroradiol. 2002, 29, 105–113. [Google Scholar]
- Law, M.; Yang, S.; Babb, J.S.; Knopp, E.A.; Golfinos, J.G.; Zagzag, D.; Johnson, G. Comparison of Cerebral Blood Volume and Vascular Permeability from Dynamic Susceptibility Contrast-Enhanced Perfusion MR Imaging with Glioma Grade. Am. J. Neuroradiol. 2004, 25, 746–755. [Google Scholar]
- Lemasson, B.; Valable, S.; Farion, R.; Krainik, A.; Rémy, C.; Barbier, E.L. In Vivo Imaging of Vessel Diameter, Size, and Density: A Comparative Study between MRI and Histology: Vessel Diameter, Size, and Density: MRI vs. Histology. Magn. Reson. Med. 2013, 69, 18–26. [Google Scholar] [CrossRef] [Green Version]
- Chakhoyan, A.; Yao, J.; Leu, K.; Pope, W.B.; Salamon, N.; Yong, W.; Lai, A.; Nghiemphu, P.L.; Everson, R.G.; Prins, R.M.; et al. Validation of Vessel Size Imaging (VSI) in High-Grade Human Gliomas Using Magnetic Resonance Imaging, Image-Guided Biopsies, and Quantitative Immunohistochemistry. Sci. Rep. 2019, 9, 2846. [Google Scholar] [CrossRef] [Green Version]
- Boxerman, J.L.; Hamberg, L.M.; Rosen, B.R.; Weisskoff, R.M. MR Contrast Due to Intravascular Magnetic Susceptibility Perturbations. Magn. Reson. Med. 1995, 34, 555–566. [Google Scholar] [CrossRef]
- Troprès, I.; Grimault, S.; Vaeth, A.; Grillon, E.; Julien, C.; Payen, J.F.; Lamalle, L.; Décorps, M. Vessel Size Imaging. Magn. Reson. Med. 2001, 45, 397–408. [Google Scholar] [CrossRef] [PubMed]
- Ferreira, P.F.; Gatehouse, P.D.; Firmin, D.N. Myocardial First-Pass Perfusion Imaging with Hybrid-EPI: Frequency-Offsets and Potential Artefacts. J. Cardiovasc. Magn. Reson. 2012, 14, 44. [Google Scholar] [CrossRef] [PubMed] [Green Version]
- Kiselev, V.G.; Strecker, R.; Ziyeh, S.; Speck, O.; Hennig, J. Vessel Size Imaging in Humans. Magn. Reson. Med. 2005, 53, 553–563. [Google Scholar] [CrossRef] [PubMed]
- Kellner, E.; Breyer, T.; Gall, P.; Müller, K.; Trippel, M.; Staszewski, O.; Stein, F.; Saborowski, O.; Dyakova, O.; Urbach, H.; et al. MR Evaluation of Vessel Size Imaging of Human Gliomas: Validation by Histopathology: Vessel Size Imaging of Human Gliomas. J. Magn. Reson. Imaging 2015, 42, 1117–1125. [Google Scholar] [CrossRef]
- Dickson, J.D.; Ash, T.W.J.; Williams, G.B.; Sukstanskii, A.L.; Ansorge, R.E.; Yablonskiy, D.A. Quantitative Phenomenological Model of the BOLD Contrast Mechanism. J. Magn. Reson. San Diego Calif 1997 2011, 212, 17–25. [Google Scholar] [CrossRef]
- Christen, T.; Pannetier, N.A.; Ni, W.W.; Qiu, D.; Moseley, M.E.; Schuff, N.; Zaharchuk, G. MR Vascular Fingerprinting: A New Approach to Compute Cerebral Blood Volume, Mean Vessel Radius, and Oxygenation Maps in the Human Brain. NeuroImage 2014, 89, 262–270. [Google Scholar] [CrossRef] [Green Version]
- Pannetier, N.A.; Debacker, C.S.; Mauconduit, F.; Christen, T.; Barbier, E.L. A Simulation Tool for Dynamic Contrast Enhanced MRI. PLoS ONE 2013, 8, e57636. [Google Scholar] [CrossRef]
- Ma, D.; Gulani, V.; Seiberlich, N.; Liu, K.; Sunshine, J.L.; Duerk, J.L.; Griswold, M.A. Magnetic Resonance Fingerprinting. Nature 2013, 495, 187–192. [Google Scholar] [CrossRef] [Green Version]
- Klein, S.; Staring, M.; Murphy, K.; Viergever, M.A.; Pluim, J.P.W. Elastix: A Toolbox for Intensity-Based Medical Image Registration. IEEE Trans. Med. Imaging 2010, 29, 196–205. [Google Scholar] [CrossRef] [PubMed]
- Isensee, F.; Jaeger, P.F.; Kohl, S.A.A.; Petersen, J.; Maier-Hein, K.H. NnU-Net: A Self-Configuring Method for Deep Learning-Based Biomedical Image Segmentation. Nat. Methods 2021, 18, 203–211. [Google Scholar] [CrossRef] [PubMed]
- Kickingereder, P.; Isensee, F.; Tursunova, I.; Petersen, J.; Neuberger, U.; Bonekamp, D.; Brugnara, G.; Schell, M.; Kessler, T.; Foltyn, M.; et al. Automated Quantitative Tumour Response Assessment of MRI in Neuro-Oncology with Artificial Neural Networks: A Multicentre, Retrospective Study. Lancet Oncol. 2019, 20, 728–740. [Google Scholar] [CrossRef] [PubMed] [Green Version]
- Parker, G.J.M.; Roberts, C.; Macdonald, A.; Buonaccorsi, G.A.; Cheung, S.; Buckley, D.L.; Jackson, A.; Watson, Y.; Davies, K.; Jayson, G.C. Experimentally-Derived Functional Form for a Population-Averaged High-Temporal-Resolution Arterial Input Function for Dynamic Contrast-Enhanced MRI. Magn. Reson. Med. 2006, 56, 993–1000. [Google Scholar] [CrossRef] [PubMed]
- van Valenberg, W.; Klein, S.; Vos, F.M.; Koolstra, K.; van Vliet, L.J.; Poot, D.H.J. An Efficient Method for Multi-Parameter Mapping in Quantitative MRI Using B-Spline Interpolation. IEEE Trans. Med. Imaging 2020, 39, 1681–1689. [Google Scholar] [CrossRef] [Green Version]
- Covarrubias, D.J.; Rosen, B.R.; Lev, M.H. Dynamic Magnetic Resonance Perfusion Imaging of Brain Tumors. Oncologist 2004, 9, 528–537. [Google Scholar] [CrossRef] [Green Version]
- Boxerman, J.L.; Schmainda, K.M.; Weisskoff, R.M. Relative Cerebral Blood Volume Maps Corrected for Contrast Agent Extravasation Significantly Correlate with Glioma Tumor Grade, Whereas Uncorrected Maps Do Not. AJNR Am. J. Neuroradiol. 2006, 27, 859–867. [Google Scholar] [PubMed]
- Arzanforoosh, F.; Croal, P.L.; van Garderen, K.A.; Smits, M.; Chappell, M.A.; Warnert, E.A.H. Effect of Applying Leakage Correction on RCBV Measurement Derived From DSC-MRI in Enhancing and Nonenhancing Glioma. Front. Oncol. 2021, 11, 648528. [Google Scholar] [CrossRef] [PubMed]
- Boxerman, J.L.; Prah, D.E.; Paulson, E.S.; Machan, J.T.; Bedekar, D.; Schmainda, K.M. The Role of Preload and Leakage Correction in Gadolinium-Based Cerebral Blood Volume Estimation Determined by Comparison with MION as a Criterion Standard. AJNR Am. J. Neuroradiol. 2012, 33, 1081–1087. [Google Scholar] [CrossRef] [Green Version]
- Rosen, B.R.; Belliveau, J.W.; Vevea, J.M.; Brady, T.J. Perfusion Imaging with NMR Contrast Agents. Magn. Reson. Med. 1990, 14, 249–265. [Google Scholar] [CrossRef]
- Stokes, A.M.; Semmineh, N.; Quarles, C.C. Validation of a T1 and T2* Leakage Correction Method Based on Multiecho Dynamic Susceptibility Contrast MRI Using MION as a Reference Standard. Magn. Reson. Med. 2016, 76, 613–625. [Google Scholar] [CrossRef] [Green Version]
- Vonken, E.P.; van Osch, M.J.; Bakker, C.J.; Viergever, M.A. Simultaneous Quantitative Cerebral Perfusion and Gd-DTPA Extravasation Measurement with Dual-Echo Dynamic Susceptibility Contrast MRI. Magn. Reson. Med. 2000, 43, 820–827. [Google Scholar] [CrossRef] [PubMed]
- Stokes, A.M.; Semmineh, N.B.; Nespodzany, A.; Bell, L.C.; Quarles, C.C. Systematic Assessment of Multi-Echo Dynamic Susceptibility Contrast MRI Using a Digital Reference Object. Magn. Reson. Med. 2020, 83, 109–123. [Google Scholar] [CrossRef] [PubMed]
- van Zandwijk, J.K.; Simonis, F.F.J.; Heslinga, F.G.; Hofmeijer, E.I.S.; Geelkerken, R.H.; Haken, B. ten Comparing the Signal Enhancement of a Gadolinium Based and an Iron-Oxide Based Contrast Agent in Low-Field MRI. PLoS ONE 2021, 16, e0256252. [Google Scholar] [CrossRef]
- Cha, S.; Lupo, J.M.; Chen, M.-H.; Lamborn, K.R.; McDermott, M.W.; Berger, M.S.; Nelson, S.J.; Dillon, W.P. Differentiation of Glioblastoma Multiforme and Single Brain Metastasis by Peak Height and Percentage of Signal Intensity Recovery Derived from Dynamic Susceptibility-Weighted Contrast-Enhanced Perfusion MR Imaging. AJNR Am. J. Neuroradiol. 2007, 28, 1078–1084. [Google Scholar] [CrossRef] [PubMed] [Green Version]
- Paling, D.; Thade Petersen, E.; Tozer, D.J.; Altmann, D.R.; Wheeler-Kingshott, C.A.M.; Kapoor, R.; Miller, D.H.; Golay, X. Cerebral Arterial Bolus Arrival Time Is Prolonged in Multiple Sclerosis and Associated with Disability. J. Cereb. Blood Flow Metab. Off. J. Int. Soc. Cereb. Blood Flow Metab. 2014, 34, 34–42. [Google Scholar] [CrossRef] [Green Version]
- Lind, E.; Knutsson, L.; Kämpe, R.; Ståhlberg, F.; Wirestam, R. Assessment of MRI Contrast Agent Concentration by Quantitative Susceptibility Mapping (QSM): Application to Estimation of Cerebral Blood Volume during Steady State. Magn. Reson. Mater. Phys. Biol. Med. 2017, 30, 555–566. [Google Scholar] [CrossRef] [Green Version]
- Ni, W.; Christen, T.; Zun, Z.; Zaharchuk, G. Comparison of R2’ Measurement Methods in the Normal Brain at 3T. Magn. Reson. Med. 2015, 73, 1228–1236. [Google Scholar] [CrossRef] [Green Version]


| Subject | Age | Sex | Diagnosis (Grade) | Molecular Profile | Tumor Type | k (10−3 s−1) | R (µm) | rCBV (%) | |||
|---|---|---|---|---|---|---|---|---|---|---|---|
| Mean | SD | Mean | SD | Mean | SD | ||||||
| 1 | 65 | M | Glioblastoma (IV) | IDH wild type | Enhancing | 1.5 | 2 | 12.88 | 14.84 | 2.49 | 1.55 |
| 2 | 54 | M | Oligodendroglioma (III) | IDH mutant, 1p/19q co-deleted | Non-Enhancing | 0.58 | 1.7 | 8.53 | 11.63 | 2.45 | 1.87 |
| 3 | 24 | M | Oligodendroglioma (III) | IDH mutant, 1p/19q co-deleted | Enhancing | 0.75 | 1.5 | 22.78 | 32.35 | 3.48 | 3.12 |
| 4 | 22 | F | Oligodendroglioma (II) | IDH mutant, 1p/19q co-deleted | Non-Enhancing | 0.41 | 1.2 | 34.64 | 29.36 | 3.17 | 1.38 |
| 5 | 37 | M | Astrocytoma (III) | IDH mutant | Enhancing | 0.5 | 1.4 | 17.83 | 20.75 | 2.42 | 0.85 |
| 6 | 28 | F | Astrocytoma (II) | IDH mutant | Non-Enhancing | 0.45 | 1.5 | 46.58 | 44.41 | 1.79 | 1.45 |
| Subject | SSIM | |
|---|---|---|
| Vessel Radius | rCBV | |
| 1 | 0.78 | 0.78 |
| 2 | 0.72 | 0.77 |
| 3 | 0.77 | 0.77 |
| 4 | 0.88 | 0.81 |
| 5 | 0.79 | 0.79 |
| 6 | 0.89 | 0.79 |
| Average | 0.81 | 0.79 |
| SD | 0.07 | 0.02 |
| Subject | Mean of Vessel Radius (μm) | Mean of rCBV (%) | ||||||
|---|---|---|---|---|---|---|---|---|
| Whole Brain | Tumor | Whole Brain | Tumor | |||||
| MRVF | VSI | MRVF | VSI | MRVF | VSI | MRVF | VSI | |
| 1 | 33.94 | 19.66 | 12.88 | 7.44 | 2.7 | 1.71 | 2.49 | 1.49 |
| 2 | 28.68 | 59.31 | 8.53 | 12.92 | 3.10 | 1.15 | 2.45 | 0.38 |
| 3 | 48.61 | 14.84 | 22.78 | 8.36 | 3.55 | 2.07 | 3.48 | 1.03 |
| 4 | 51.39 | 39.05 | 34.64 | 25.31 | 3.89 | 3.57 | 3.17 | 2.08 |
| 5 | 39.73 | 38.26 | 17.83 | 19.85 | 3.26 | 0.70 | 2.42 | 0.31 |
| 6 | 58.54 | 24.34 | 46.58 | 17.98 | 2.53 | 0.95 | 1.79 | 0.46 |
| Average | 43.48 | 32.58 | 23.87 | 15.31 | 3.17 | 1.69 | 2.63 | 0.96 |
| SD | 11.31 | 16.36 | 14.32 | 6.98 | 0.51 | 1.05 | 0.60 | 0.71 |
| Subject | RMSD of Vessel Radius (μm) | RMSD of rCBV (%) | ||||||
|---|---|---|---|---|---|---|---|---|
| Whole Brain | Tumor | Whole Brain | Tumor | |||||
| MRVF | VSI | MRVF | VSI | MRVF | VSI | MRVF | VSI | |
| 1 | 28.92 | 60.10 | 18.97 | 6.01 | 0.81 | 1.21 | 0.31 | 1.27 |
| 2 | 21.66 | 136.67 | 8.62 | 7.26 | 0.71 | 0.79 | 0.37 | 0.05 |
| 3 | 34.12 | 21.15 | 30.3 | 7.02 | 1.02 | 1.04 | 1.23 | 0.29 |
| 4 | 27.32 | 62.33 | 23.31 | 16.19 | 1.43 | 1.82 | 1.56 | 0.13 |
| 5 | 26.32 | 63.95 | 19.84 | 12.86 | 0.63 | 0.25 | 0.51 | 0.04 |
| 6 | 29.35 | 41.31 | 34.54 | 41.26 | 0.71 | 0.47 | 0.72 | 0.06 |
| Average | 27.95 | 64.25 | 22.59 | 15.10 | 0.88 | 0.93 | 0.78 | 0.31 |
| SD | 4.09 | 39.14 | 9.15 | 13.41 | 0.30 | 0.56 | 0.51 | 0.48 |
Disclaimer/Publisher’s Note: The statements, opinions and data contained in all publications are solely those of the individual author(s) and contributor(s) and not of MDPI and/or the editor(s). MDPI and/or the editor(s) disclaim responsibility for any injury to people or property resulting from any ideas, methods, instructions or products referred to in the content. |
© 2023 by the authors. Licensee MDPI, Basel, Switzerland. This article is an open access article distributed under the terms and conditions of the Creative Commons Attribution (CC BY) license (https://creativecommons.org/licenses/by/4.0/).
Share and Cite
Venugopal, K.; Arzanforoosh, F.; van Dorth, D.; Smits, M.; van Osch, M.J.P.; Hernandez-Tamames, J.A.; Warnert, E.A.H.; Poot, D.H.J. MR Vascular Fingerprinting with Hybrid Gradient–Spin Echo Dynamic Susceptibility Contrast MRI for Characterization of Microvasculature in Gliomas. Cancers 2023, 15, 2180. https://doi.org/10.3390/cancers15072180
Venugopal K, Arzanforoosh F, van Dorth D, Smits M, van Osch MJP, Hernandez-Tamames JA, Warnert EAH, Poot DHJ. MR Vascular Fingerprinting with Hybrid Gradient–Spin Echo Dynamic Susceptibility Contrast MRI for Characterization of Microvasculature in Gliomas. Cancers. 2023; 15(7):2180. https://doi.org/10.3390/cancers15072180
Chicago/Turabian StyleVenugopal, Krishnapriya, Fatemeh Arzanforoosh, Daniëlle van Dorth, Marion Smits, Matthias J. P. van Osch, Juan A. Hernandez-Tamames, Esther A. H. Warnert, and Dirk H. J. Poot. 2023. "MR Vascular Fingerprinting with Hybrid Gradient–Spin Echo Dynamic Susceptibility Contrast MRI for Characterization of Microvasculature in Gliomas" Cancers 15, no. 7: 2180. https://doi.org/10.3390/cancers15072180