Article

Multiple Genes with Potential Tumor Suppressive Activity Are Present on Chromosome 10q Loss in Neuroblastoma and Are Associated with Poor Prognosis

1
U.O.C. Genetica Medica, IRCCS Istituto Giannina Gaslini, 16147 Genova, Italy
2
U.O.C. Oncologia Pediatrica, IRCCS Istituto Giannina Gaslini, 16147 Genova, Italy
3
Unità di Bioinformatica Clinica, IRCCS Istituto Giannina Gaslini, 16147 Genova, Italy
4
Direzione Scientifica, IRCCS Giannina Gaslini, 16147 Genova, Italy
5
IRCCS Istituto Giannina Gaslini, 16147 Genova, Italy
*
Author to whom correspondence should be addressed.
These authors contributed equally to this work.
Cancers 2023, 15(7), 2035; https://doi.org/10.3390/cancers15072035
Submission received: 7 March 2023 / Revised: 26 March 2023 / Accepted: 27 March 2023 / Published: 29 March 2023

Abstract

:

Simple Summary

Specific recurrent segmental aberrations (SCA) have been associated with poor survival in neuroblastoma (NB). The effect of many other not recurrent SCA has not been clarified yet. Here we examined the role of the loss of chromosome 10q in a cohort of 260 NB primary tumors, observing a lower survival rate for the patients expressing this rare SCA. We identified a cluster of 75 genes in the long arm of chromosome 10, whose deletion was associated with poorer survival. Six genes, and in particular CCSER2, appeared to be good candidates to play a role as tumor suppressor genes in NB and possible targets for future therapeutic interventions.

Abstract

Neuroblastoma (NB) is a tumor affecting the peripheral sympathetic nervous system that substantially contributes to childhood cancer mortality. Despite recent advances in understanding the complexity of NB, the mechanisms determining its progression are still largely unknown. Some recurrent segmental chromosome aberrations (SCA) have been associated with poor survival. However, the prognostic role of most SCA has not yet been investigated. We examined a cohort of 260 NB primary tumors at disease onset for the loss of chromosome 10q, by array-comparative genomic hybridization (a-CGH) and Single Nucleotide Polymorphism (SNP) array and we found that 26 showed 10q loss, while the others 234 displayed different SCA. We observed a lower event-free survival for NB patients displaying 10q loss compared to patients with tumors carrying other SCA. Furthermore, analyzing the region of 10q loss, we identified a cluster of 75 deleted genes associated with poorer outcome. Low expression of six of these genes, above all CCSER2, was significantly correlated to worse survival using in silico data from 786 NB patients. These potential tumor suppressor genes can be partly responsible for the poor prognosis of NB patients with 10q loss.

1. Introduction

Neuroblastoma (NB) is a pediatric tumor originating from immature nerve cells of neural crest characterized by genetic mutations and defective differentiation occurring during early development, representing about 7–8% of children’s cancers [1,2,3]. The age at diagnosis is 18 months on average and NB occurs before 6–8 years of life in 90% of cases. In half of the patients, NB is diagnosed in its metastatic form and determines 15% of deaths in pediatric oncology [4,5]. Current therapies, although articulated and including various approaches, are still not sufficient to definitively eradicate it in a large percentage of cases [6]. Clinical and biological factors, such as age at diagnosis, disease stage, tumor histo-pathology, DNA ploidy, and chromosomal abnormalities define the prognosis and specific treatment of NB patients [7,8,9,10,11,12]. Genome-wide association, high-throughput sequencing, and microarray-based studies have identified hereditable and somatically acquired genetic [7,8] and chromosomal changes that characterize NB [9,10,11,12]. Among these, only a few recurrent segmental chromosome aberrations (SCA) have been demonstrated to help discriminate between low and high-risk NB patients with fatal outcome [9,10,11,12]. The identification of chromosomal variations in NB samples gave information relevant to the diagnosis and disease prognosis. NB tumors with gain or loss of entire chromosomes are generally associated with a good prognosis, while tumors with SCA have poor outcome [13,14,15,16,17,18,19,20]. Recurrent SCA in NB involve losses of chromosome 1p, 3p, 4p, 6q, 11q, and 19p, and gains of 1q, 2p, 7q, and 17q that together with amplification of MYCN oncogene, specific amplifications on 2p and 12q and loss of whole chromosome X, are all markers of high-risk disease [13,14,15,16,17,18,19,20]. It is important to underline that amplification of MYCN and specific genes on chromosomes 2p and 12q [12,14,15], as well as loss of chromosomes 6q and 11q [12,13,17] are associated with the most aggressive form of NB. Genomic amplification and focal alterations affecting cell cycle genes (CDKN2A/B, CCND1, CDK4/6, and MDM2) [8,14,15,16,17,18], or genes implicated in chromatin remodeling and telomere maintenance (ATRX, ARID1A/B, and TERT) [8,11,13] have been described as contributing to the development and progression of NB. Large segmental chromosome changes are common in NB, while small chromosome or gene rearrangements are relatively rare, with recurrent somatic mutations mainly found in ALK, ATRX, PTPN11, and TIAM1 genes [7,8,12,13]. Unfortunately, SCA have not been fully investigated and their prognostic role remains largely unknown. Although many unbalanced chromosomal aberrations in NB have been well characterized, including focal amplification of oncogenes [13,14,15] and deletions of tumor suppressor genes [16,17,18], broad regions of chromosomal gains and losses are poorly understood. It is conceivable that the loss of large chromosome regions leads to the simultaneous inactivation of multiple tumor suppressor genes, greatly decreasing the dosage and the expression of resident genes. Even if chromosome 10q loss is not a frequent occurrence, it has already been reported in both familial and sporadic NB [21,22,23,24]. The prevalence of 10q allelic loss was 22.2% [24] while that of loss of heterozygosity (LOH) was 4.3% [23]. We intended to evaluate the potential impact of chromosome 10q loss on the survival rate of patients affected by NB. To reach this goal, we analyzed the influence of 10q loss on patients’ survival in a dataset of Italian NB cases enrolled in the Italian Neuroblastoma Registry.

2. Materials and Methods

2.1. Primary Tumors and Cell Lines

NB primary samples were obtained during surgery or biopsy. Tumor tissue samples were collected after resection and stored in the BIT-Gaslini Biobank, Tissue Section, IRCCS Istituto Giannina Gaslini, Genova, Italy. Tumor content was confirmed by a review of hematoxylin and eosin-stained tumor sections by the local pathologists. The stage of the NB patients was classified according to the International Staging System (INSS) [25], and the assessment of the risk of death was defined by the International Neuroblastoma Risk Group (INRG) classification system [26]. The clinical data is derived from the Italian Neuroblastoma Registry (RINB) of the AIEOP (the Italian Association of Pediatric Hematology and Oncology). The clinical characteristics of NB patients are collected in a pseudo-anonymized manner and stored in a secure system at Italian Inter-University Consortium CINECA. Our investigation was conducted following the Declaration of Helsinki, and it has obtained the approval of the Italian Institutional Ethics Committee (Measure n° 270/17 related to the clinical study protocol IGG-NCA.AP-2016, validated on 15 December 2016 and renewed on 24 May 2021). Written informed consent was obtained from the parents of all the NB patients at the time of the enrollment.
Human NB cell lines were obtained as follows: GICAN, IMR-32, and ACN from Interlab Cell Line Collection (ICLC, IRCCS Ospedale San Martino, Genova, Italy), SK-N-AS, SH-SY5Y, SH-EP, SK-N-SH, SK-N-BE(2)c, LA-N-1, and LA-N-5 from the Leibniz-Institute DMSZ, SMS-KCNR from Children’s Oncology Group Cell Culture, Tet-21/N kindly provided by Dr. M. Schwab (University of Heidelberg, Heidelberg, Germany). All NB cell lines were characterized by HLA class I typing by PCR-SSP sets, and by high-resolution oligonucleotide array comparative genomic hybridization (array-CGH) analysis. Cell lines were cultured in Dulbecco’s modified Eagle’s medium (DMEM) High Glucose (EuroClone, Milano, Italy) supplemented with 10% FBS (ThermoFisher Scientific, Waltham, MA, USA) and with 1% L-glutamine/penicillin-streptomycin. Cells were maintained at 37 °C in a humidified atmosphere containing 95% air and 5% CO2. Primary samples and cell lines. DNAs from NB primary tumors and cell lines were processed using the QIAamp DNA Extraction Kit (Qiagen, Hilden, Germany).

2.2. Genomic Profile Analysis

DNAs from 260 NB primary samples and 12 NB cell lines were tested by high-resolution oligonucleotide array-CGH and Single Nucleotide Polymorphism (SNP) array using a 4 × 180 K platform (Agilent Technologies, Santa Clara, CA, USA) with a mean resolution of approximately 25 kb. The copy number variants were defined as a displacement of the normal value of at least 8 consecutive probes and the mapping positions refer to the Genome Assembly GRCh19/hg19 (UCSC genome browser, http://genome.ucsc.edu, accessed on 20 October 2022). Images of the array were acquired by the Agilent C Scanner, and visualized by the Agilent Feature Extraction 10.5 Software. Data were examined by the genomic Workbench 7.0.40 software (Agilent), to detect chromosomal aberrations and breakpoints by ADM-1 (threshold 10), with 0.5 Mb window size in order to minimize potential false positives. The cutoffs to call aberrations were: 0.2 = gains, −0.3 = losses, 2 = amplifications, and −2 = homozygous deletions. The quality of the test was assessed by the strength of the QC metrics values. Polymorphisms (http://projects.trag.ca/variation/, accessed on 20 October 2022) were not included since they were considered normal variants.

2.3. Data Sets

2.3.1. Italian Cohort of NB Patients

A retrospective series of 260 NB primary samples carrying SCA genomic profile of all stages from children and adolescents (age < 18 years) at diagnosis was collected at IRCCS Istituto Giannina Gaslini, Genova, Italy, between 1995 and 2018. The main patients’ characteristics are resumed in Supplementary Table S1. About 38% of patients were aged 0–17 months, 48% 18–59 months, and 15% 60 months or more at the onset of the disease. Males were 53%. The majority of patients had stage 4 disease (51%), and about one-third carried the amplification of the MYCN proto-oncogene. Follow-up was obtained by the database of the Italian Neuroblastoma Registry (RINB) [27]. RINB was activated in 1979 and includes all subjects with any peripheral neuroblastic tumor (i.e., neuroblastoma, ganglioneuroblastoma, and benign ganglioneuroma) diagnosed at the institutions participating in the Italian Neuroblastoma Group. It was estimated that RINB collects more than 90% of the expected peripheral neuroblastic tumor incident cases in Italy [27]. The structure and protocol of RINB were approved by the Ethics Committees of each participating center. Parents or legal guardians of the enrolled patients were asked to sign an informed consent form. For this reason, no specific further consent was needed for this study. The RINB database is located at the Italian Inter-University Consortium CINECA headquarters in Italy and can be accessed only by authorized users. It received the ISO 9001:2015 Quality Management System certification, and the ISO/IEC 27,001:2013 Information Security Management System certification.

2.3.2. In Silico Data Sets

Genes contained in the region of deletion on chromosome 10q associated with poor survival in the RINB data set were traced in the large in silico data set summarized by Cangelosi et al. [28], and their association with both event-free (EFS) and overall survival (OS) was assessed. This dataset describes the gene expression profile of 786 NB tumors at onset and the clinical and molecular information of the patients. It combines the gene expression results from three different platforms. This large dataset is therefore the most complete available to date, concerning NB gene expression profiles and patients’ clinical data [28].
Genes not found in the Cangelosi et al. data set were searched in other two public large in silico data sets, one generated by Agilent customized 4 × 44 K oligonucleotide microarray, including the gene expression profile of 709 and 498 NB tumor samples [29] and one generated by the Illumina HiSeq 2000 platform [30]. All clinical data included in these two public datasets are obtainable via ArrayExpress (http://www.ebi.ac.uk/arrayexpress, accessed on 23 November 2022; login: E-MTAB-1781) and Gene Expression Omnibus (http://www.ncbi.nlm.nih.gov7geo, accessed on 23 November 2022; access: gse62564). Finally, results from in silico analysis were validated on in silico data from an independent cohort of 283 NB patients recently available on the AMC R2 platform [31].

2.4. Statistical Analysis

Descriptive statistics were reported as absolute frequencies and percentages for qualitative data, while median and interquartile range (IQR) were used for continuous variables, due to the non-normal distribution of most of them. Comparison between categorical variables was assessed by Pearson’s chi-squared test or Fisher’s exact test when appropriate. The Mann-Whitney U test was used for two-group comparisons of continuous variables, while in the presence of more than two groups, the Kruskal-Wallis test was applied [32].
The Kaplan-Meier method was used to assess the association between the expression of each gene examined and the survival of the patients, who were divided into two and three groups of identical sample size considering median and tertile values, respectively. By the Kalbfleisch and Prentice method, a 95% confidence interval (CI) of survival estimates was calculated [33].
Overall Survival (OS) time was determined starting from the date of diagnosis until the date of death or the last known information. Event Free survival (EFS) was determined starting from the date of diagnosis until the first event of death or disease recurrence. In the NRC-283 database, it was possible to find information on Progression Free survival (PFS) too.
Kaplan-Meier curves were compared by the log-rank test and the log-rank test for trend. A Multivariable Cox regression model was applied to adjust for the confounding effect of the prognostic factors available at diagnosis (MYCN status, age, and stage) [33]. NB patients were stratified into subgroups by MYCN status and stage at diagnosis (stages 1, 2, 3, 4, and 4s) [34].
All tests were two-tailed and a p-value < 0.05 was considered statistically significant. Association between deletion of each gene in the 10q region and patients’ survival was performed by an ad hoc program script implemented in R language, using the library “survival” developed by Herry Therneau. All the other analyses were performed by STATA statistical software (release 13.1, Stata Corporation, College Station, TX, USA).

3. Results

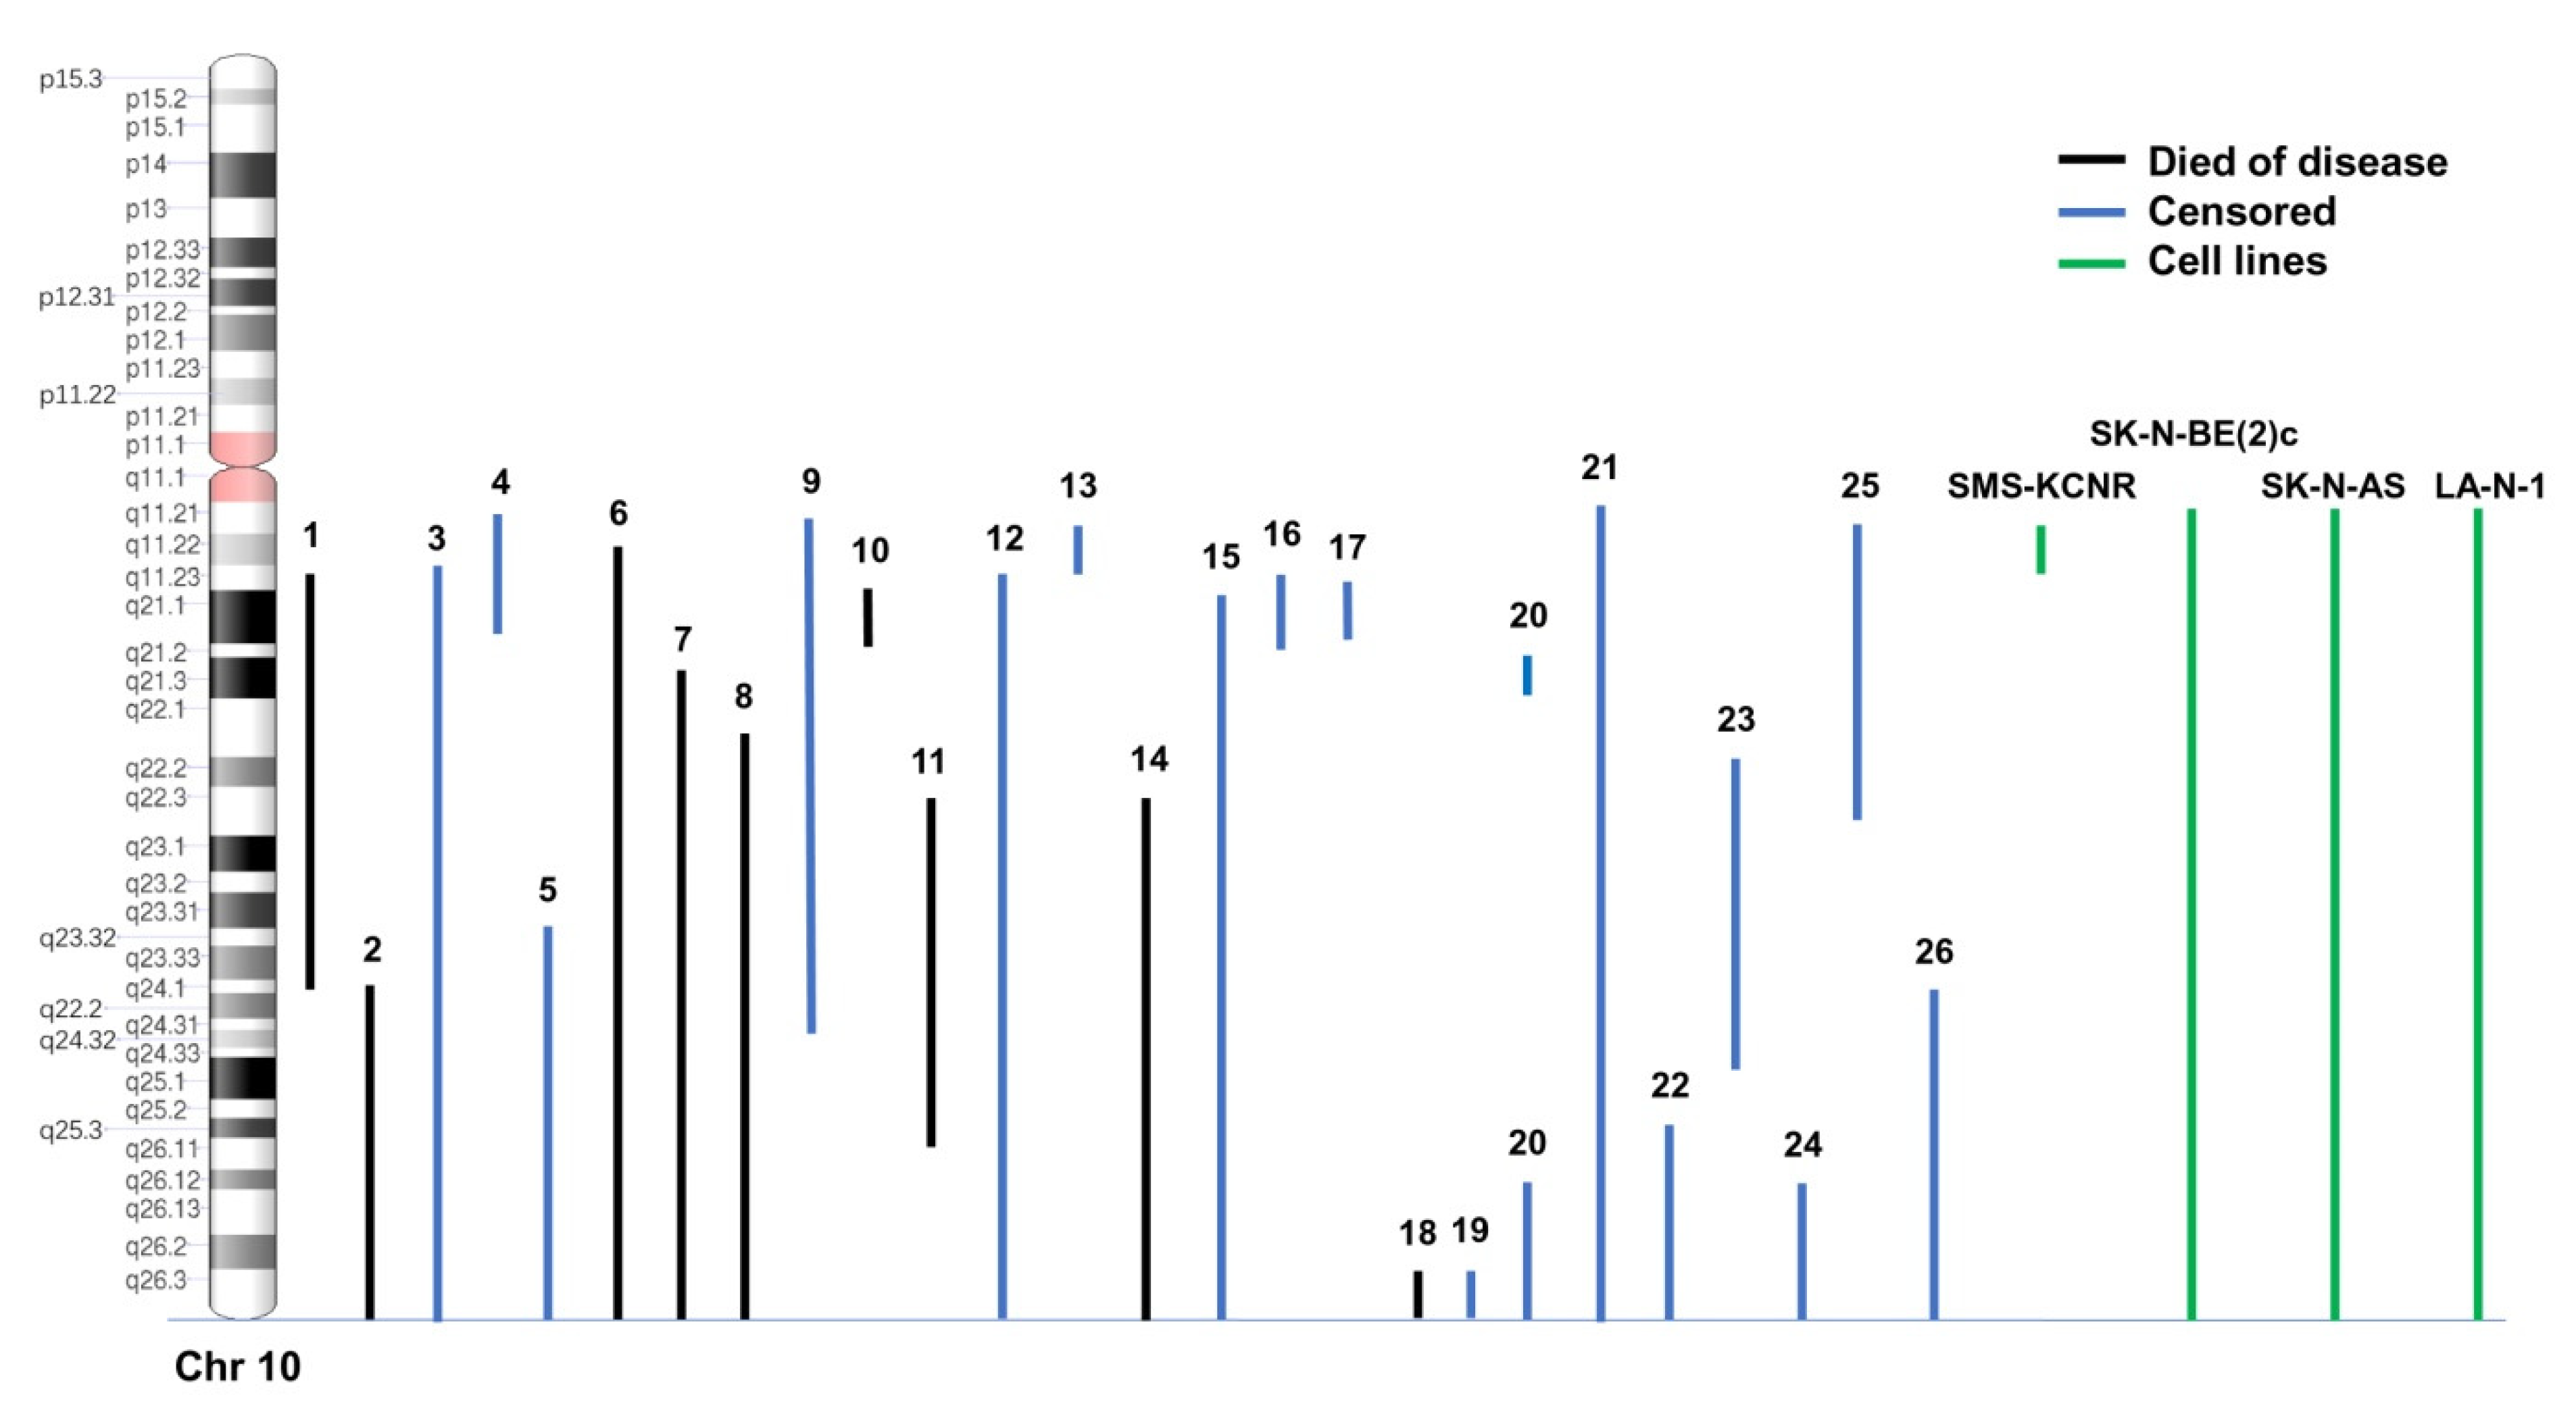
3.1. Analysis of 10q Loss in NB Samples and Cell Lines

The genomic profiles obtained by high-resolution array-CGH and SNP-array of 260 NB samples were reevaluated for the presence of 10q loss. In general, we observed recurrent loss of 1p, 3p, 4p, 6q, 11q, 19p and gain of 1q, 2p, 7q, 17q, and amplification of 12q and MYCN at expected frequency levels. In 23 NB samples, chromosome 10q was a loss in hemizygosis, in one sample it was a loss in homozygosis in the region 10q21.1, and two samples were subjected to copy-neutral loss of heterozygosity (CN-LOH) of chromosome 10q without changes in copy number. CN-LOH is a mechanism leading to the inactivation of tumor suppressor genes in tumors [35]. The precise loss boundaries are displayed in Figure 1 and Table 1. The other remaining 234 cases had other SCA both recurring and non-recurring, but no loss of chromosome 10q (Supplementary Table S1). We observed that only 38.4% (10/26) of samples with 10q loss also bear MYCN amplification (Table 1).
Genomic profile analysis of NB cell lines revealed that chromosome 10q was lost in SK-N-AS, SK-N-BE(2)c, SMS-KCNR, and LA-N-1, it was gained in SH-EP, and it was normal in other cell lines analyzed (Table 2).

3.2. Association between NB Patients’ Characteristics and 10q Loss

Table 3 shows the distribution of main patients’ characteristics at diagnosis by the status of chromosome 10q in the analyzed cohort of 260 NB patients. No association was observed with age, gender, stage, and MYCN status.
The association between the occurrence of 10q loss and losses in other chromosomes is reported in Supplementary Table S2. A higher proportion of other segmental deletions in patients with 10q loss was observed for chromosome 4q (11.5% vs. 2.6%, p = 0.05), 8p (15.4% vs. 2.1%, p = 0.007), 19q (19.2% vs. 4.3%, p = 0.010), and 21q (11.5% vs. 2.1%, p = 0.036). Furthermore, 10q loss was associated with gain in chromosome 1q (34.6% vs. 17.5%, p = 0.036), 3q (23.1 vs. 3.0), 5p (11.5% vs. 1.7%, p = 0.024), 6p (23.1 vs. 5.6, p = 0.006), 7q (23.1% vs. 9.0%, p = 0.038), and 17p (7.7 vs. 0.9, p = 0.051) (Supplementary Table S3).
The occurrence of loss in chromosome 10q was also associated with the number of other chromosome losses (median value: 2, IQR: 1–3, in patients with no loss of 10q, vs. 3, IQR: 1–5, in patients with loss of 10q, Figure 2A), with the number of chromosome gains (median: 2, IQR: 1–4, vs. 4, IQR: 3–6, Figure 2B), and with any other SCA (median: 4, IQR: 3–7, vs. 7, IQR: 4–10, Figure 2C).

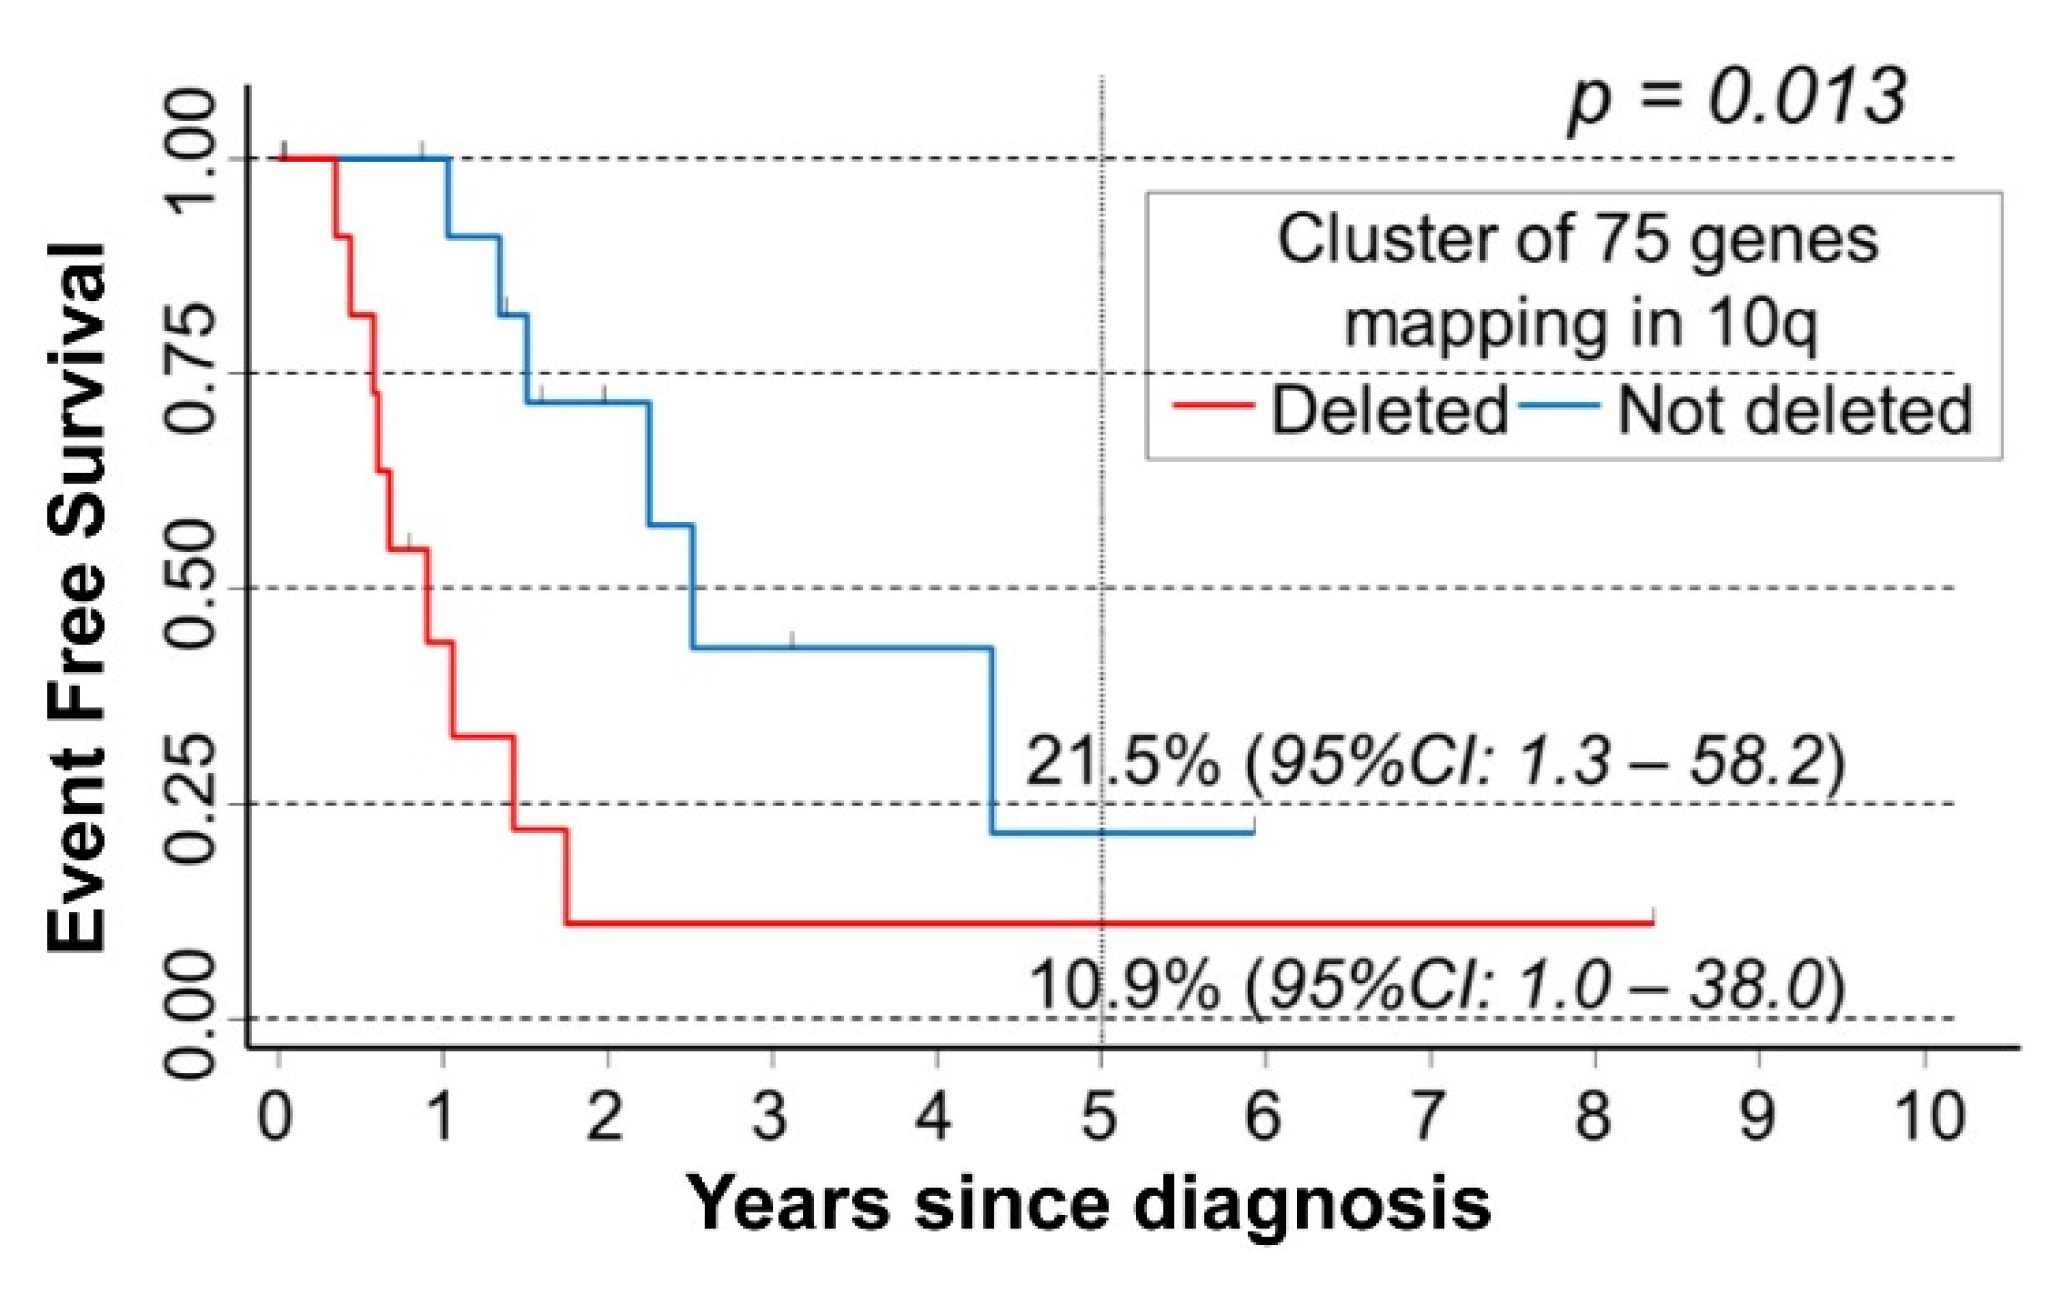
3.3. Survival Analysis of NB Patients by the Occurrence of Chromosome 10q Loss

The follow-up time of the entire cohort of 260 NB patients ranged between 0 days and 20 years with a median value of 3 years (IQR: 1.4–5.1). Sixty-nine deaths were observed, which included 4 deaths from toxicity and 1 for causes other than NB. Ninety-seven patients experienced disease relapse or progression, including 59 patients who died. One patient had a secondary malignancy after 1.9 years from diagnosis (acute myeloid leukemia, therapy-related), he was alive and in complete remission for NB at the end of 3 years follow-up.
Kaplan-Meier survival curves showed that patients carrying chromosome 10q loss had poorer survival compared with patients with other SCA (Figure 3A), and a similar pattern was observed for EFS (Figure 3B). The corresponding HRs adjusted for the main patients’ characteristics at diagnosis (age, MYCN status, and stage) were 1.7 for OS (95% CI: 0.84–3.5, p = 0.137), and 1.8 for EFS (95% CI: 1.0–3.1, p = 0.037).

3.4. Deletion Map of Chromosome 10q Loss Associated with NB Patients’ Survival

A minimum deleted region in 10q was not identifiable in the cohort of 26 NB patients here examined. In order to identify a set of genes with a potential tumor suppressor activity, OS and EFS analysis was carried out for each gene mapping in 10q splitting the sub-cohort of 26 patients bearing 10q loss (Table 1) into two groups based on the presence of deletion of each considered gene. With regard to OS, no statistically significant association was found with the deletion of any gene mapping in 10q. Conversely, a cluster of 75 genes was detected which were found deleted in 12 patients with very poor EFS survival (Figure 4).
The cluster inside the 10q loss region associated with reduced EFS included the following genes: ACTA2, AGAP11, ANKRD1, ANKRD22, ANXA11, ATAD1, BMPR1A, C10orf116, C10orf57, C10orf58, C10orf99, CFLP1, CH25H, DYDC1, DYDC2, EIF5AL1, FAM190B, FAM22A, FAM22D, FAM25A, FAM35A, FAS, FLJ37201, GHITM, GLUD1, GRID1, HTR7, IFIT1, IFIT1L, IFIT2, IFIT3, IFIT5, KIF20B, KILLIN, LDB3, LIPA, LIPF, LIPJ, LIPK, LIPM, LIPN, LOC219347, LOC439994, LOC642361, LOC650623, LOC728190, LRIT1, LRIT2, MAT1A, MBL1P, MINPP1, MIR107, MIR346, MMRN2, NRG3, NUDT9P1, OPN4, PANK1, PAPSS2, PCDH21, PCGF5, PLAC9, PTEN, RGR, RNLS, RPP30, SFTPA1, SFTPA2, SFTPD, SH2D4B, SLC16A12, SNCG, STAMBPL1, TSPAN14, and WAPAL.

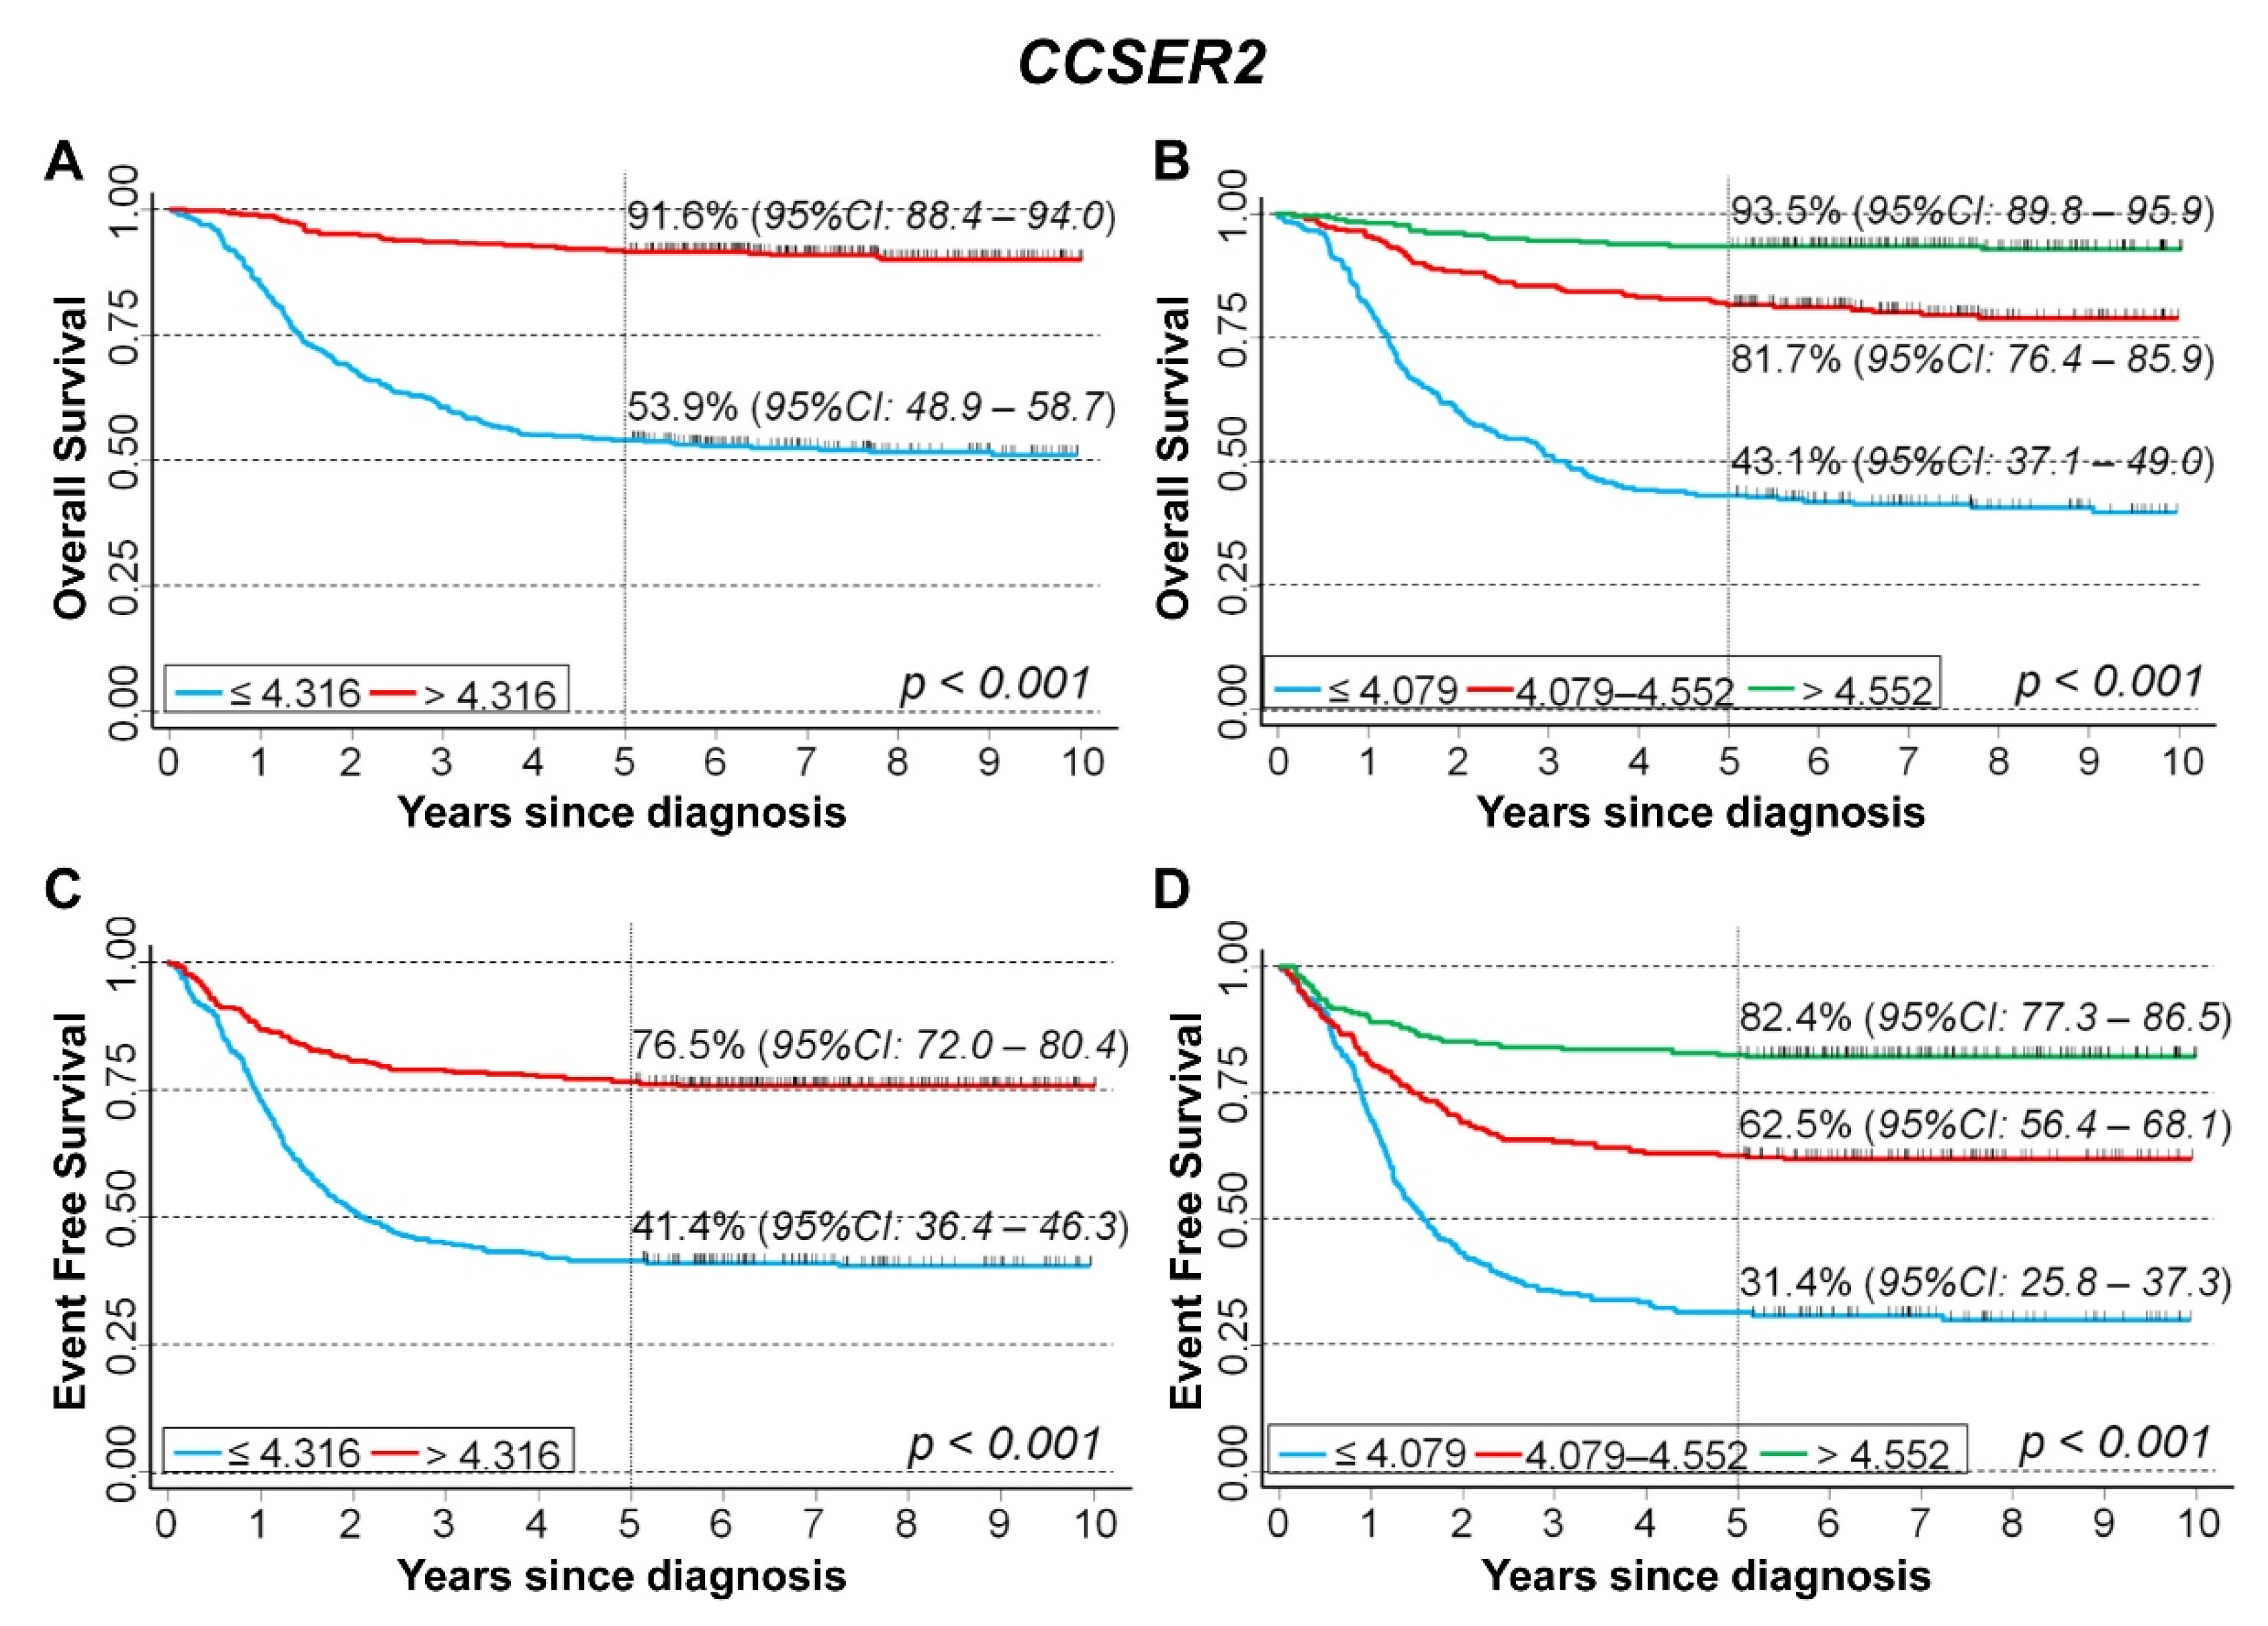
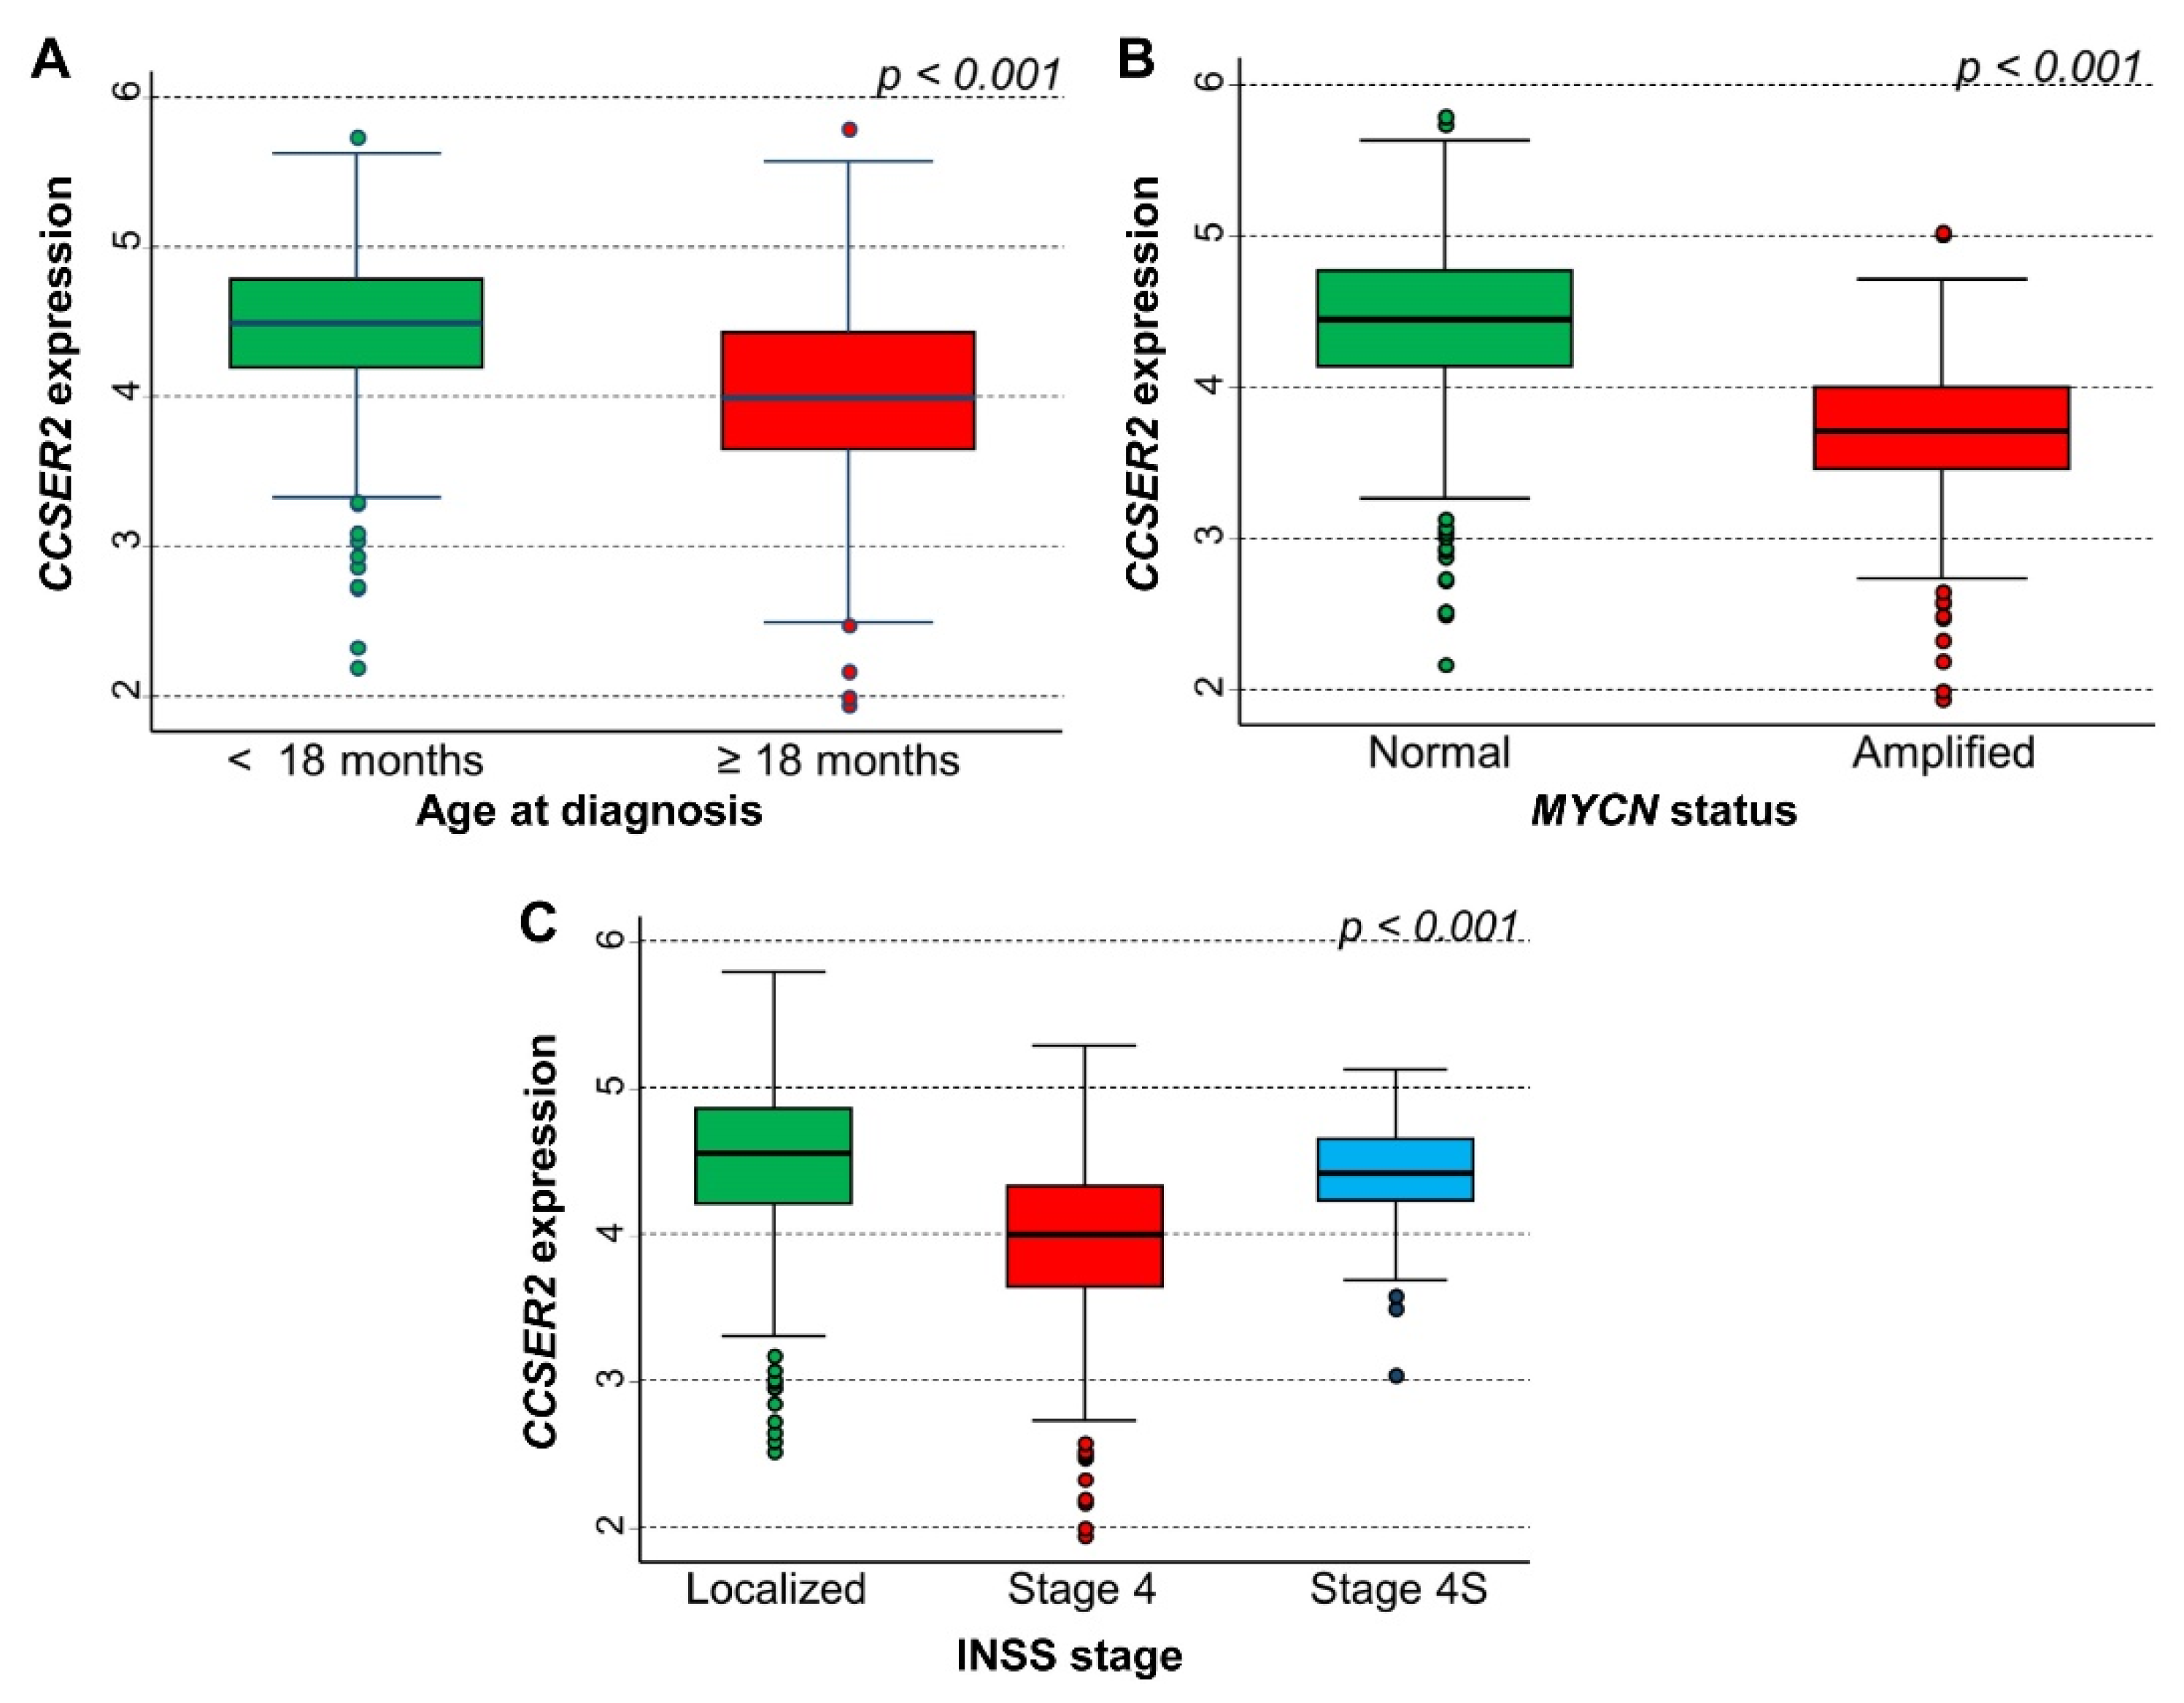
3.5. In Silico Analysis of the Association between the Expression of 75 Genes Identified in the Cluster Inside the 10q Loss Region and Survival of NB Patients
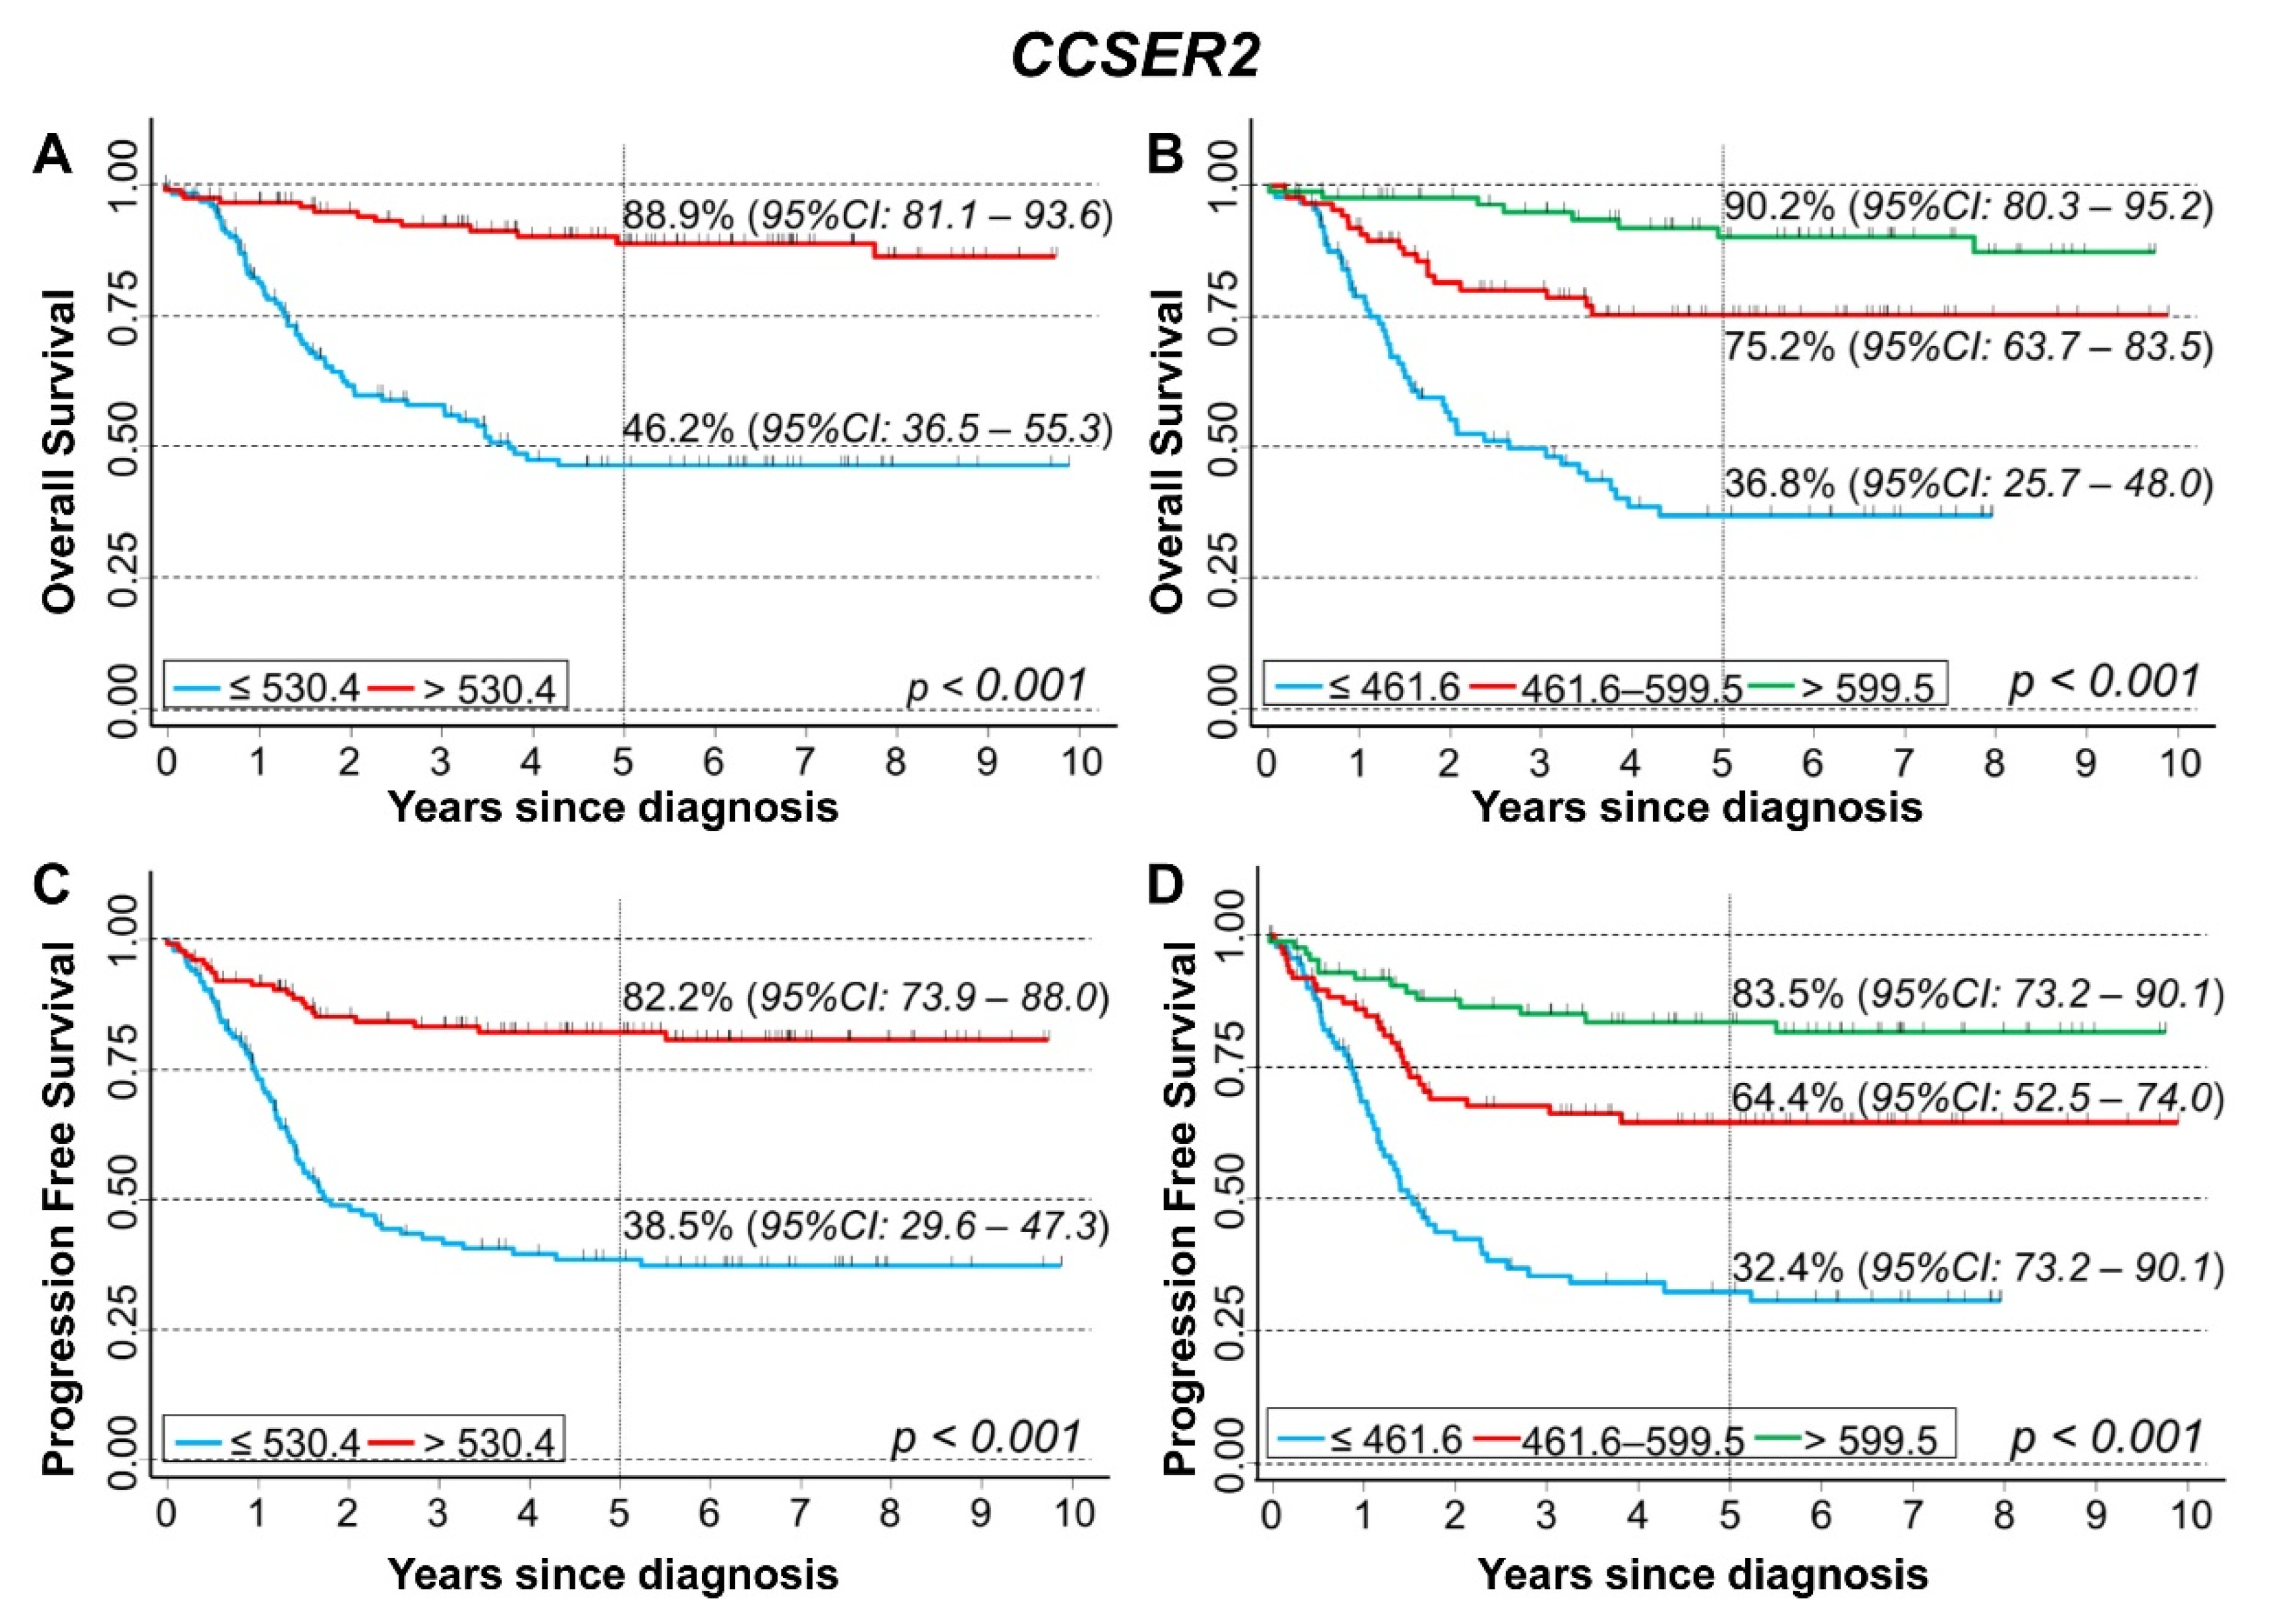
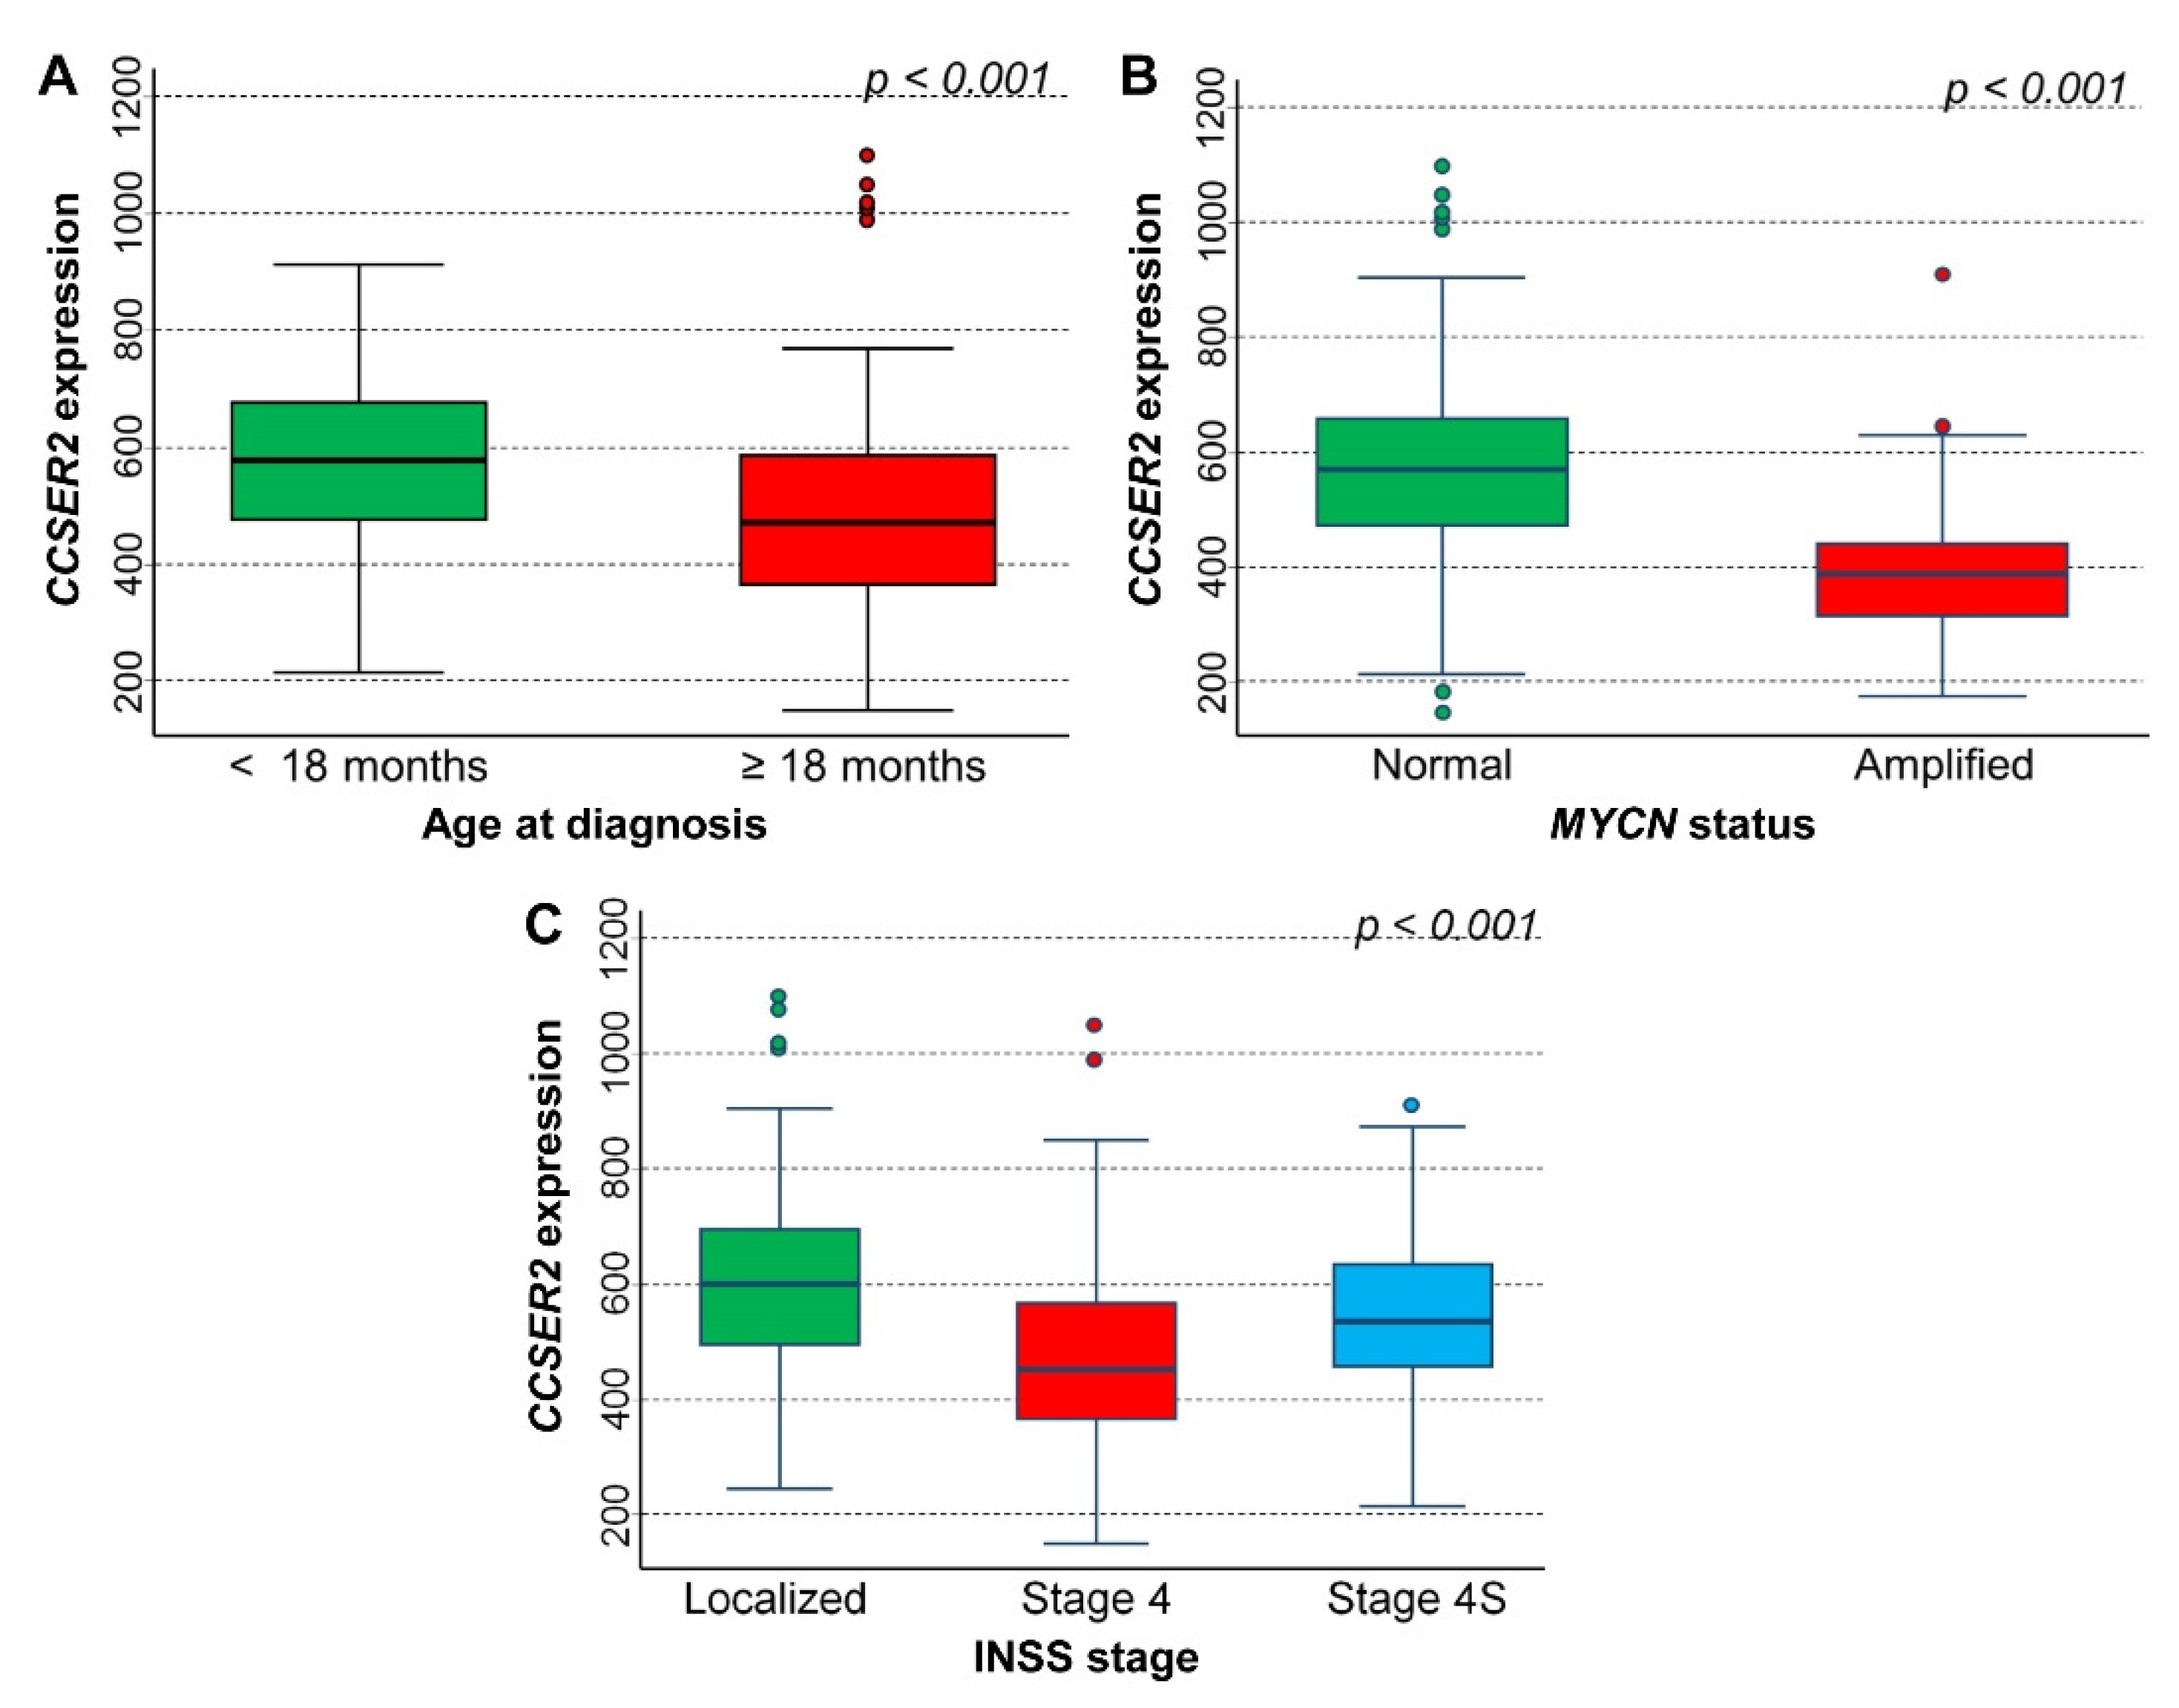
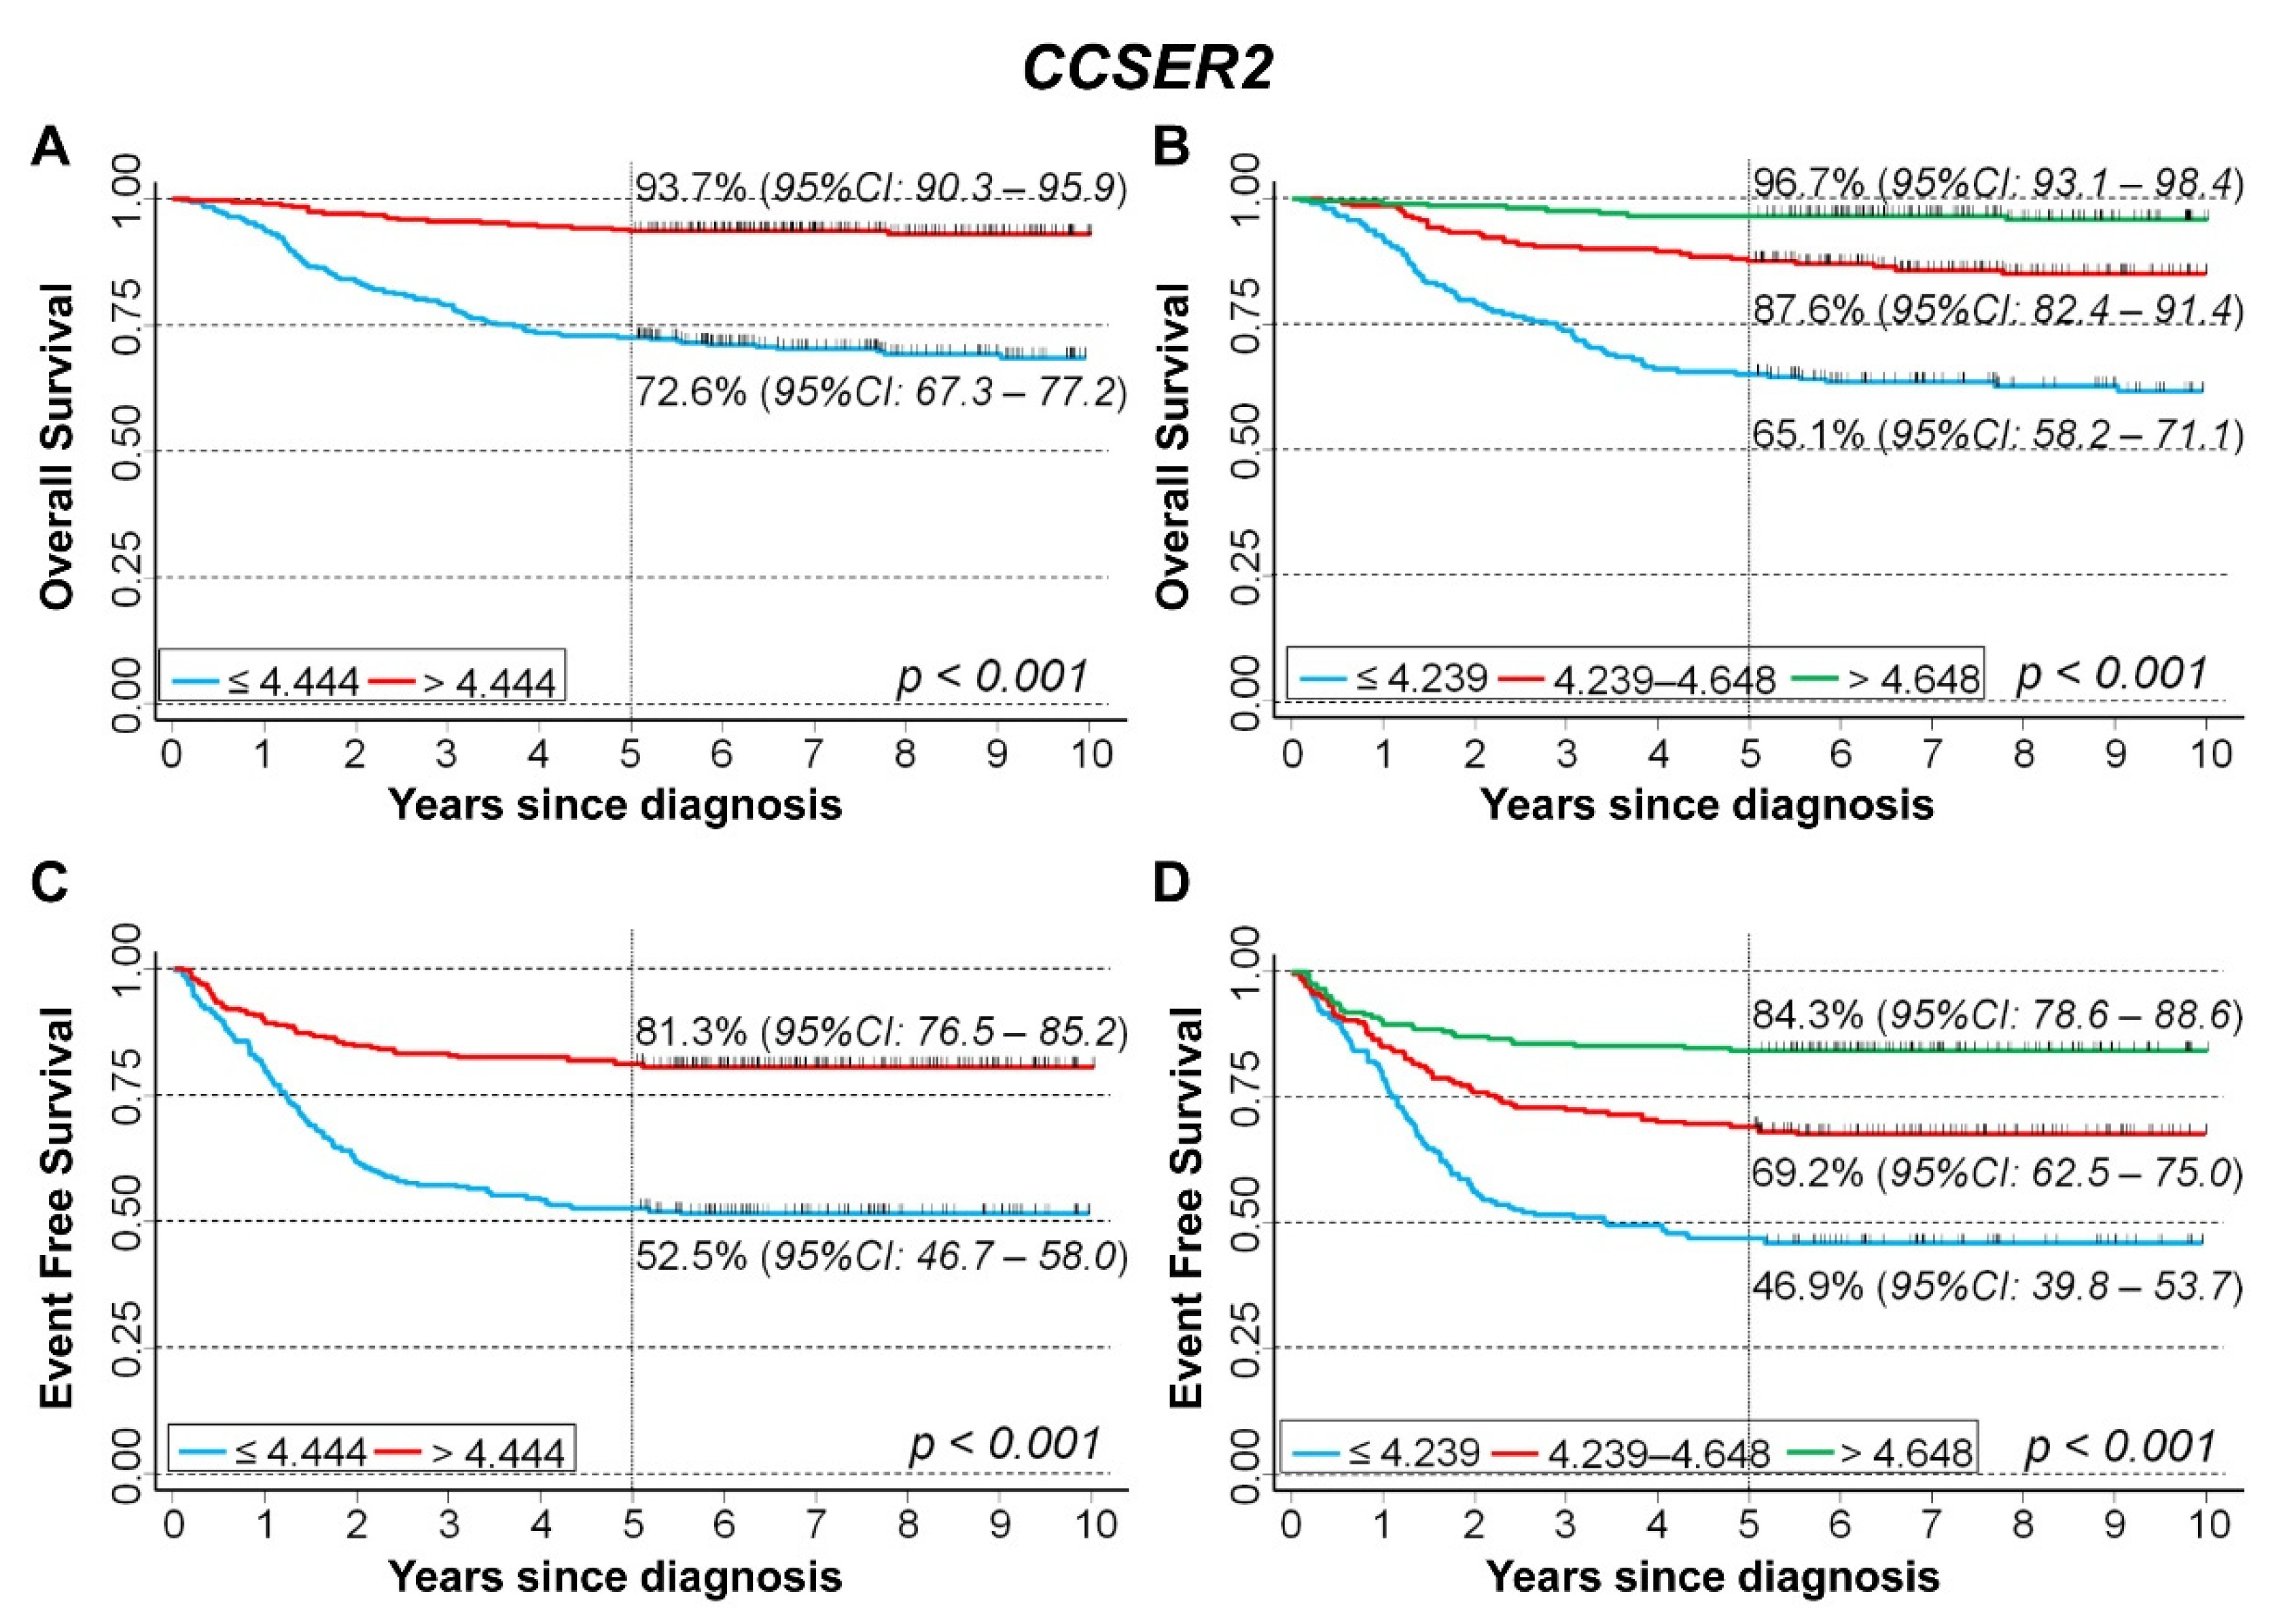
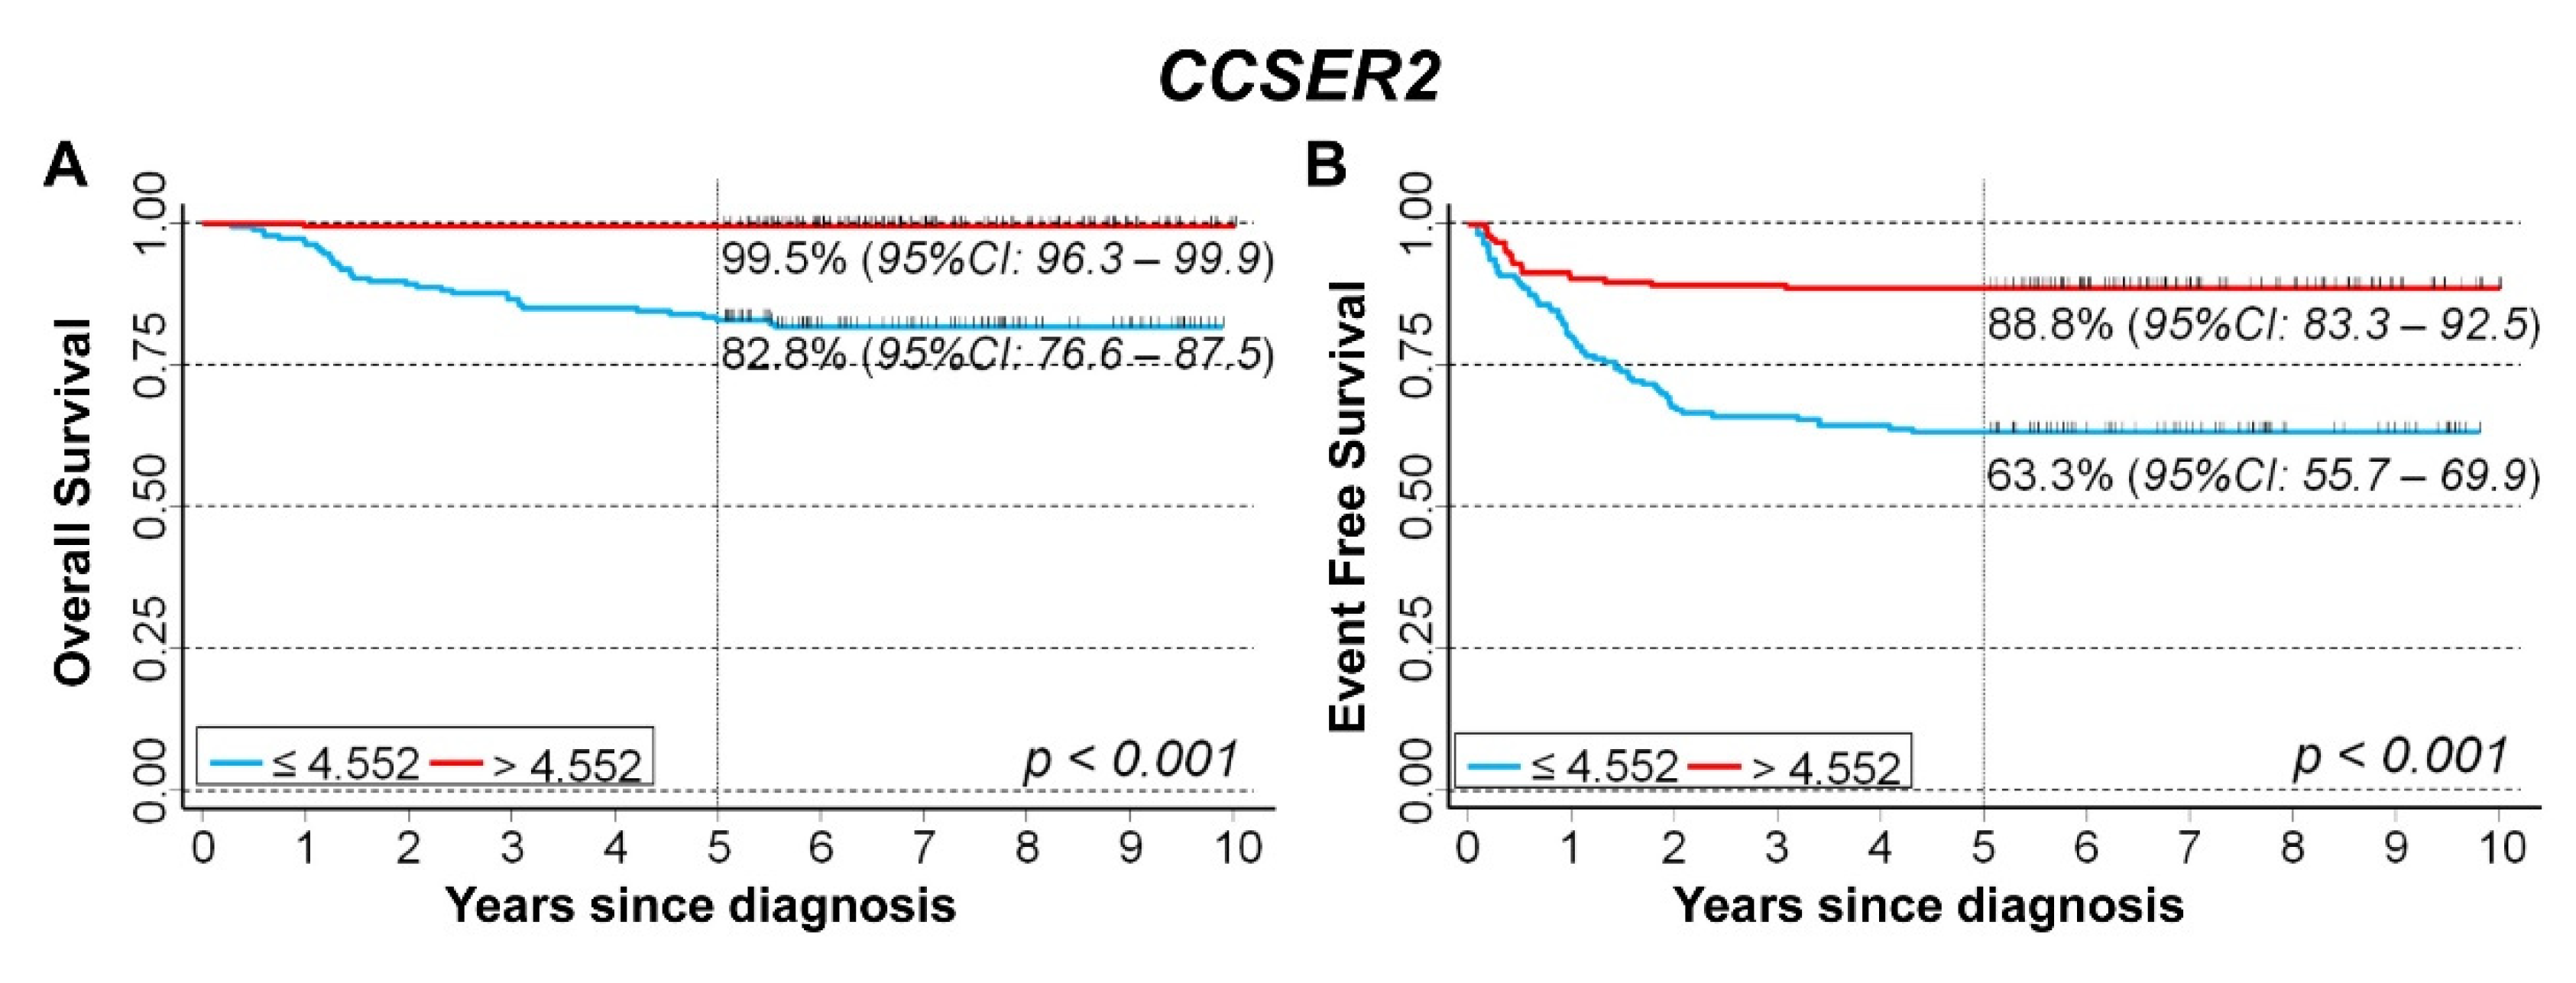
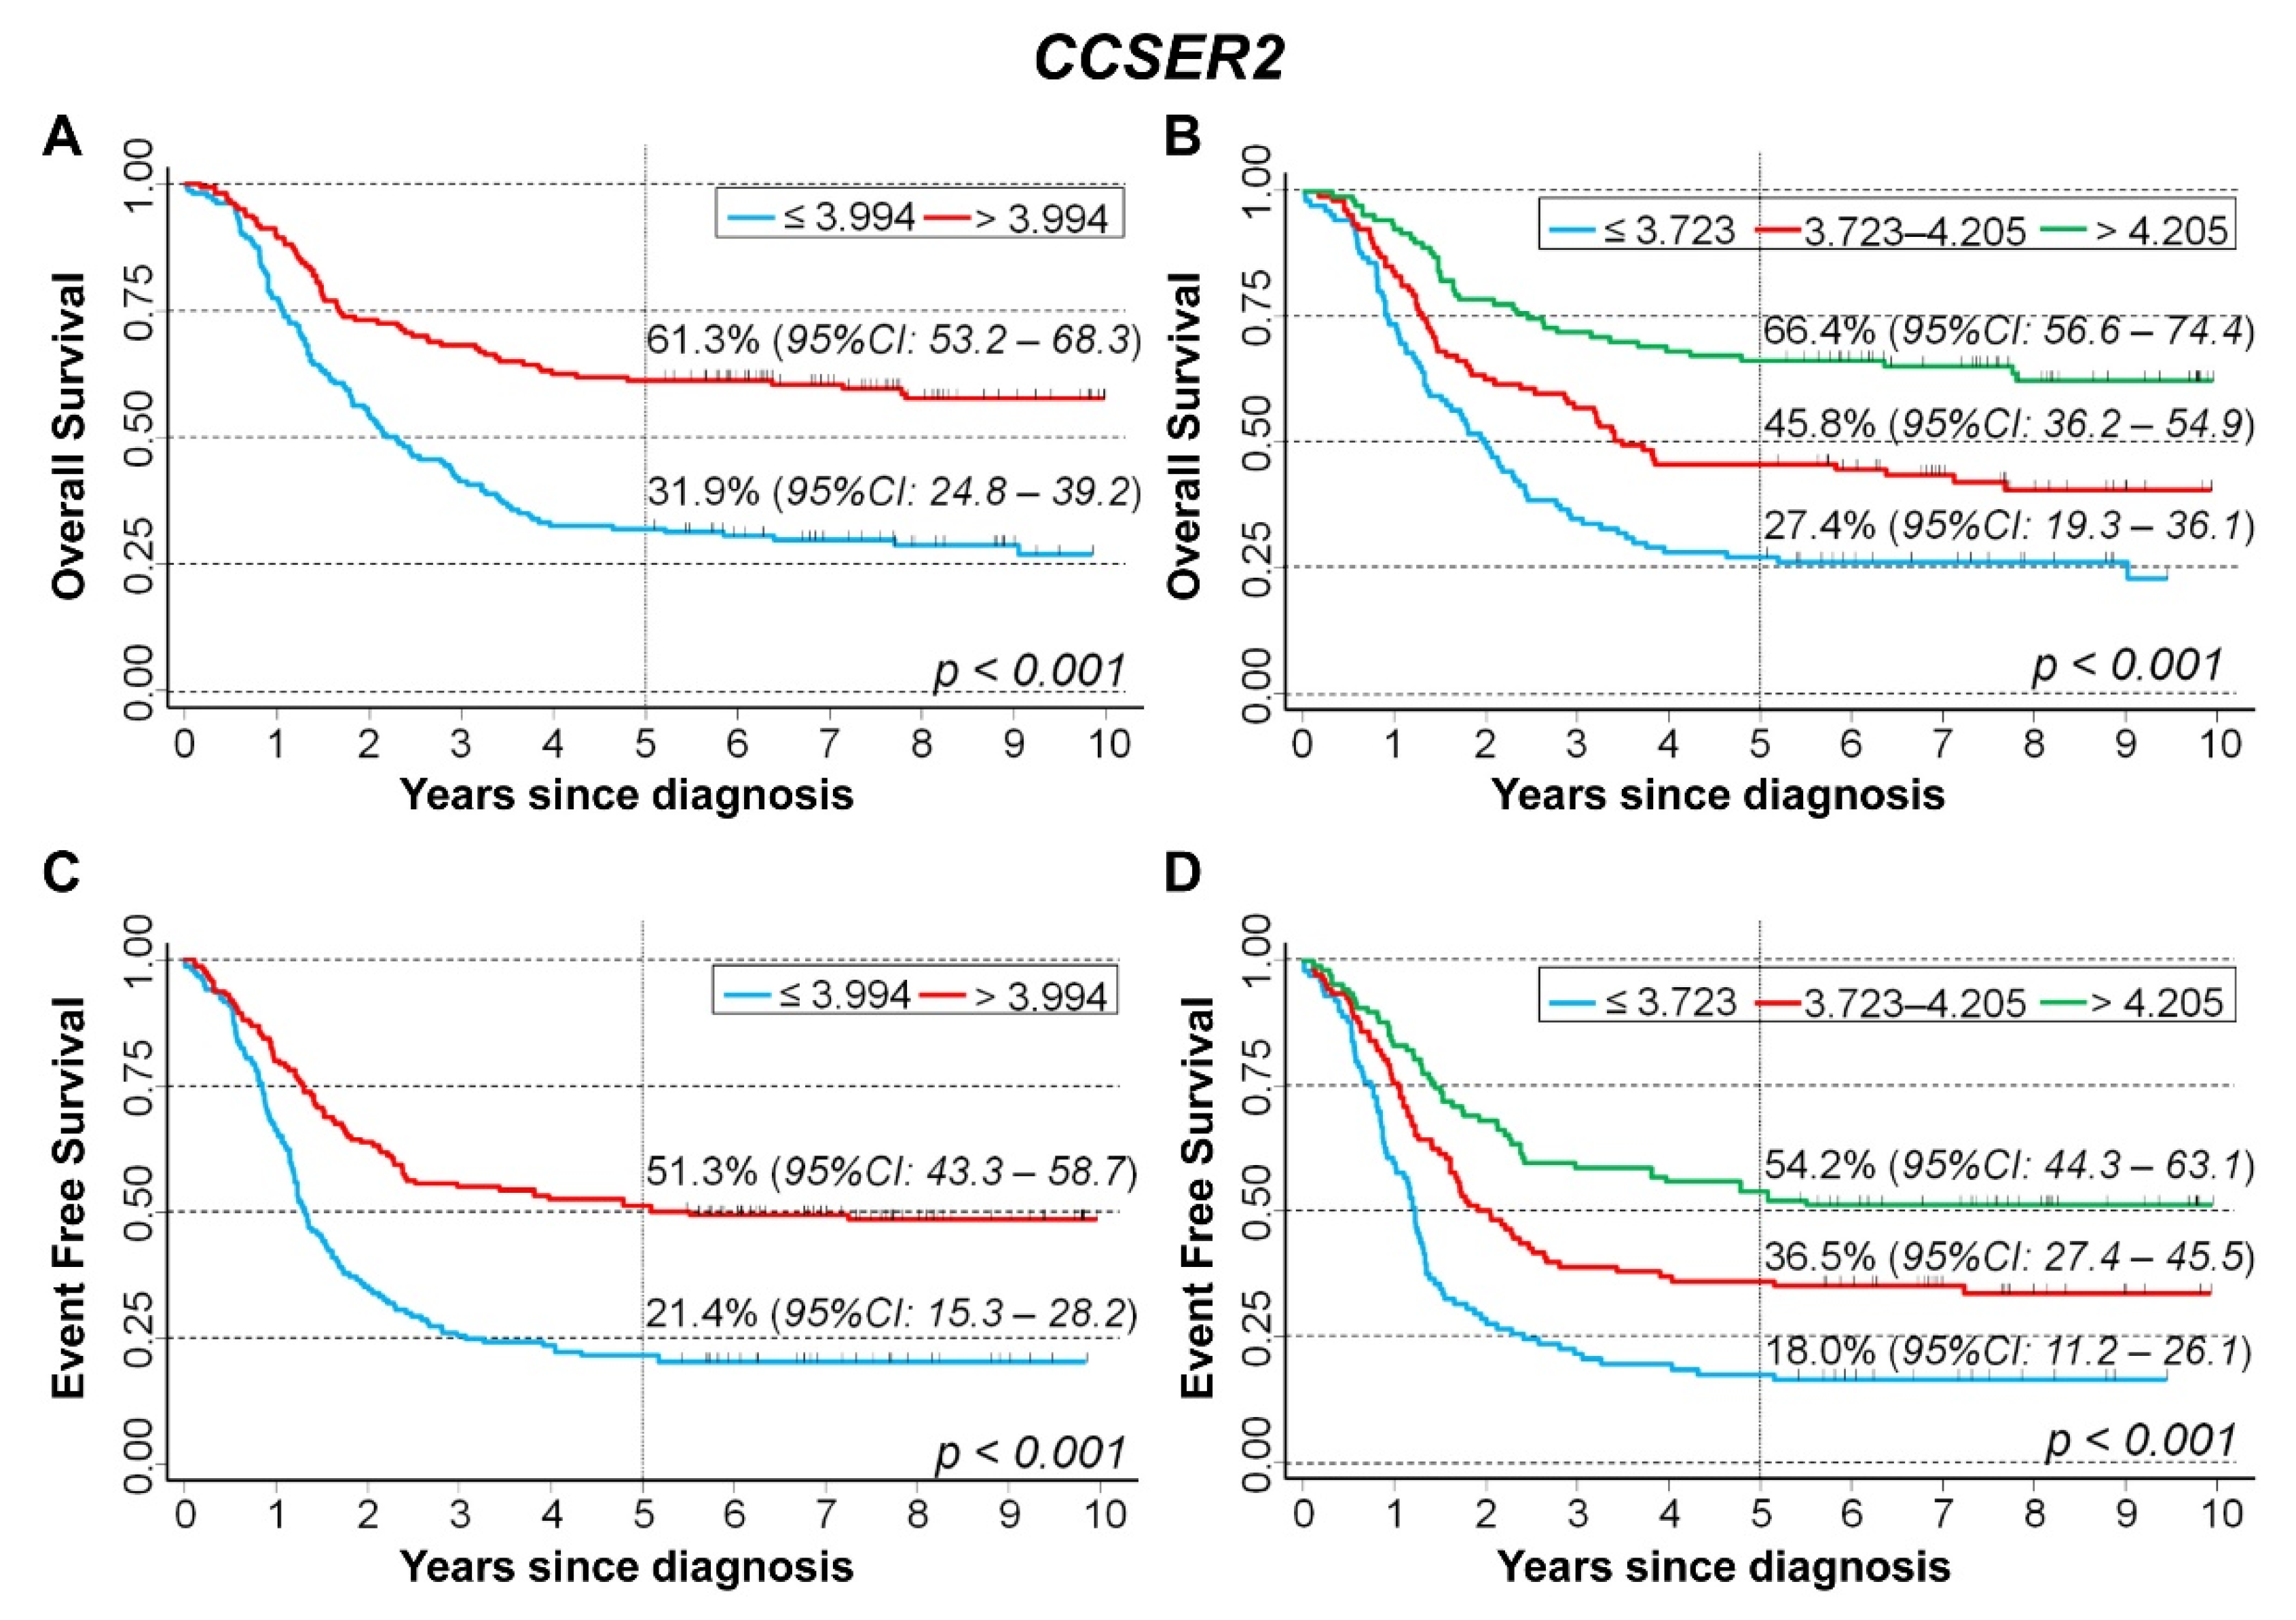
Among the 75 genes mapping in chromosome 10q and found associated with EFS in the cohort under study, 38 were analyzed in the large in silico data set summarized by Cangelosi et al. [28], namely: ACTA2, ANKRD22, ANXA11, ATAD1, BMPR1A, C10orf58 (alias FAM213A), CH25H, CCSER2 (alias, Gcap14, FAM190B, KIAA1128, NPD012), FAM35A, FAS, FLJ37201, GHITM, GLUD1, GRID1, HTR7, IFIT1, IFIT2, IFIT3, IFIT5, KIF20B, LDB3, LIPA, MINPP1, MMRN2, NRG3, PANK1, PAPSS2, PCDH21 (alias CDHR1), PCGF5, PLAC9, PTEN, RNLS, RPP30, SFTPA1 (alias PSDAP), SFTPA2 (alias PSAP), SNCG, STAMBPL1, and TSPAN14. Three other genes were traced in the E-MTAB-1781 data set (C10Orf57, alias FLJ3263, RGR, and SFTPD), and the remaining 34 (AGAP11, ANKRD1, C10ORF116, C10ORF99, CFL1P1, DYDC1, DYDC2, EIF5AL1, FAM22A, FAM22D, FAM25A, IFIT1B (alias IFIT1L), KLLN (alias KILLIN), LIPF, LIPJ, LIPK, LIPM, LIPN, LOC439994, LOC642361, LOC650623, LOC728190, LRIT1, LRIT2, MAT1A, MBL1P, MIR107, MIR346, NUDT9P1, OPN4, SH2D4B, SLC16A12, TMEM254AS1, and WAPAL) were found in SEQC-498 database. A positive association between gene expression and patients’ survival, observed in univariable analysis and confirmed in a multivariable Cox regression model adjusting for the available confounders (MYCN status, age, and stage at diagnosis), was found for eight genes, namely: AGAP11, CCSER2, FAM22A, FAM22D, IFIT2, PAPSS2, PCGF5, and NUDT9P1. Validation on the independent cohort NRC-283 in silico, confirmed the observed association only for CCSER2 both in univariable and in multivariable regression analysis, adjusting for MYCN status, age, and stage at diagnosis. Furthermore, the stratified analysis showed a potential protective effect of high CCSER2 expression levels in patients with both amplified and normal MYCN status, and in both localized and stage 4 diseases. The expression level of FAM22A and FAM22D was not available in the NRC-283 database. For the other five genes, after adjustment for the available confounders, the association with patients’ survival was no longer observed. The following paragraphs report the details of the analyses for the CCSER2 gene, while the results inherent to the genes AGAP11, IFIT2, PAPSS2, PCGF5, and NUDT9P1 are reported in Supplementary Genes Analysis, in Supplementary Figures S1–S20 and Supplementary Tables S4–S13. The results concerning all the other analyzed genes are reported in Supplementary Figures S21–S84 and Supplementary Tables S14–S83, except for C10orf99, FAM25A, MIR-107, and MIR-346 genes, which were not analyzed since they presented with ≥90% of missing values, probably related to the absence of expression in NB samples. The main features of the datasets here utilized are listed in Table 4.

CCSER2

We examined the association between CCSER2 gene expression and the survival rate of 786 NB patients in Cangelosi et al. data set, finding that the overall survival appears to be strongly associated with CCSER2 gene expression (Figure 5A). Splitting the data on the basis of tertile values, a clear trend emerged (Figure 5B). Results from the analysis of EFS were consistent with those observed for OS. In particular, 5-year EFS was 41.4% for gene expression values below the median, and 76.5% for values above (Figure 5C). Splitting the data on the basis of the tertile values, 5-year EFS was 31.4% for low expression levels, 62.5% for intermediate levels, and 82.4% for high values (Figure 5D).
CCSER2 gene expression was strongly associated with each favorable prognostic factor, which included lower age at the onset of disease (Figure 6A), normal MYCN status (Figure 6B), and both localized and 4S stages (Figure 6C).
Multivariable analysis via the Cox regression model (Table 5) confirmed the positive association between CCSER2 expression and patients’ survival. Adjusted HRs obtained by splitting the data on the median value were 0.37 for OS, and 0.55 for EFS. Splitting the data on the tertile values, a clear trend in HRs emerged (p < 0.001 for both OS and EFS). HRs adjusted estimates for OS were 0.60 for intermediate levels, and 0.27 for higher levels. The corresponding figures for EFS were 0.71, and 0.35. The positive association between gene expression and patients’ survival was confirmed by the highly significant linear trend in both OS and EFS observed including in the Cox model the original continuous values of CCSER2 expression.
Results of the analysis of the in silico cohort of 283 NB patients in the NRC-283 database confirmed the positive association between CCSER2 gene expression values and both overall and progression-free survival. Five-year OS was 46.2% for values below the median expression level and 88.9% for values above (Figure 7A). A clear trend was observed splitting the data on the tertiles (Figure 7B). With regard to PFS, a clear difference also emerged between estimates above and below the median expression level (Figure 7C). A trend in PFS estimates by increasing values of CCSER2 expression was also observed splitting the data on the tertiles (Figure 7D).
CCSER2 gene expression values were positively associated with favorable prognostic factors, including lower age at diagnosis (Figure 8A), normal MYCN status (Figure 8B), and localized stage or stage 4S (Figure 8C).
Adjusting for these potential confounders, the possible protective effect of high values of gene expression was confirmed in multivariable Cox regression analysis, both for OS and EFS (Table 6). In detail, for OS, HR was 0.36 for values above the median expression vs. values below. Stratification by tertile values showed a clear trend. A similar pattern emerged for PFS.
Results of the analysis of the sub-cohort of the Cangelosi et al. dataset with normal MYCN status showed a positive association between gene expression levels and OS, both splitting the data based on the median expression value (Figure 9A) or stratifying on the tertiles (Figure 9B). A similar pattern emerged for EFS (Figure 9C,D).
Multivariable analysis via the Cox regression model confirmed the observed association between CCSER2 expression and patients’ survival (Table 7). With regard to OS, HR was 0.37 for values above the median expression vs. values below. Stratifying on the tertiles, a clear trend was observed. A consistent pattern emerged for EFS.
The potential protective role of CCSER2 high expression values was also observed among patients with amplified MYCN status. OS was 14.5% in patients with values below the median and 45.5% for patients with values above (Figure 10A). Stratifying the tertile values, OS was 13.7% for low values, 23.5% for intermediate values, and 52.9% for high values (Figure 10B). With regard to EFS, survival probability was 13.5% for values below the median, 40.3% for values above (Figure 10C), and was 12.2% for values below the first tertile, 21.6% for intermediate values, and 47.1% for values above the second tertile (Figure 10D).
Multivariable analysis confirmed the positive association between CCSER2 expression and patients’ survival (Table 8). With regard to OS, HR was 0.49 splitting the data on the median expression value. HR was 0.38 for values below the first tertile and 0.69 for intermediate values vs. the lowest levels. A similar pattern was observed for EFS.
Analyzing patients with a localized stage at diagnosis, we found that the very small number of observed events in some subgroups did not allow us to both perform the analysis stratified on the tertile values and adjust for the potential confounding of clinical variables in a Cox regression model. OS was 82.8% for patients with expression values below the median, and 99.5% for values above (Figure 11A). With regard to EFS, the corresponding estimates were 63.3% and 88.8%, respectively (Figure 11B).
Among patients with stage 4 disease, a better prognosis was associated with high CCSER2 expression levels. In detail, OS was 31.9% in correspondence to values below the median and 61.3% for values above (Figure 12A). Splitting the data on the tertile values, OS was 27.4% for patients with the lowest values, 45.8% for patients with intermediate values, and 66.4% for patients with the highest values, respectively (Figure 12B). A similar pattern was observed for EFS, where the corresponding estimates were 21.4% and 51.3%, splitting the data on the median expression level, (Figure 12C), and 18.0%, 36.5%, and 54.2% splitting the data on the tertile values (Figure 12D), respectively.
Multivariable Cox regression analysis, adjusting for the potential effect of the main available confounders, confirmed the positive association between CCSER2 expression and patients’ survival (Table 9). For OS, HR was 0.65 for values above vs. below the median of gene expression and 0.51 or 0.71 for high or intermediate values vs. low values, obtained stratifying data on the tertiles. Consistent data were observed for EFS, where HR was 0.65 splitting the data on the median value, and 0.53 or 0.66, splitting the data on the tertiles, respectively.

4. Discussion

In recent years, recurrent losses and gains of large chromosomal regions related to NB prognosis have been identified. NB is mainly driven by structural chromosomal aberrations such as losses of chromosomes 1p, 3p, 4p, 6q, 11q, 19p, gains of 1q, 2p, 7q, 17q, amplifications of genes on 2p and 12q and of MYCN oncogene, and loss of whole chromosome X, which are all markers of high-risk disease [13,14,15,16,17,18,19,20]. This suggests that in the same chromosomal region tumor suppressor genes and oncogenes may coexist and cooperate in causing both tumor initiation and progression.
Here we provided evidence that the loss of the whole or part of the long arm of chromosome 10, although rare, correlates with poor prognosis in NB patients. Consistent with our findings, an NB study combining genomic and expression microarray data with survival data identified, along with other chromosomal abnormalities, 10q loss as a negative prognostic indicator [36]. These data highlight how the 10q loss can affect the transcriptional program of NB, and the need to define candidate tumor suppressor genes within this chromosome region. We hypothesized that the loss of chromosome 10q could induce the collective inactivation of many tumor suppressor genes by regulating the different tumor stages. To address this theory, we initially investigated a cluster of 75 genes mapped within the regions of 10q loss characterized by our 26 NB cases and associated with reduced EFS. A survival analysis of each gene in relation to the gene expression was performed using in silico data related to 786 NB patients included in the large data set summarized by Cangelosi et al. [28]. Six genes CCSER2, AGAP11, IFIT2, PAPSS2, PCGF5, and NUDT9P1 were observed to have potential NB tumor suppressor activity since their low expression was associated with poor survival even after correction for confounding by other prognostic factors (MYCN status, age at diagnosis, stage of disease). Then we suggest that the reduced expression of these genes provoked by 10q loss could promote the progression of NB.
Among them, the CCSER2 gene showed the greatest impact on the survival of NB patients. CCSER2 gene (also known as Gcap14, FAM190B, KIAA1128, NPD012) encodes for the Coiled-Coil Serine Rich 2 protein, that has been previously linked, along with other proteins, to the DISC1 pathway [37] through binding DISC1 itself or one of its interacting partners. DISC1 pathway is involved in neurogenesis, synapse regulation, neurite outgrowth, neural differentiation, proliferation, and migration [38,39]. What is interesting is that the protein DISC1 is involved in human NB cells regulating the activation of PI3K [39,40]. Furthermore, CCSER2 is a regulator of microtubule dynamics during neurodevelopment, and its deficiency results in defective neuronal migration [41]. CCSER2 has not yet been described as a tumor suppressor gene, however, there is a good chance that it could be involved in the development or progression of NB, even if functional studies will be needed to define this role. Notably, missense loss-of-function mutations of the CCSER2 gene have been reported in NB primary tumors [8].
AGAP11 is a long non-coding ribonucleic acid (lncRNA) that belongs to the ankyrin repeat and GTPase domain Arf GTPase activating protein gene family [42]. The lncRNAs commonly play a salient role in the spatiotemporal regulation of gene expression during developmental processes [43]. AGAP11 due to its inherent role in cell function as lncRNA mediates changes in the microenvironment and thereby participates in the development of cellular senescence [42]. Although there is no experimental data related to a particular function in the oncology field for AGAP11, there is evidence to suggest that genes closely related to tumors (such as LPL, MMP9, SGK1, TLR4, and FOS) interact with this lncRNA through different mechanism [44,45,46]. In light of our data, AGAP11 could be an NB tumor suppressor lncRNA at the 10q23.2 region, which needs to be checked with cellular functional studies.
IFIT2 (interferon-induced proteins with tetratricopeptide 2) gene is a crucial interferon-stimulated gene family protein, which has been confirmed to play an important role in the anti-tumor process inhibiting the proliferation and migration of cancer cells [47]. IFIT2 also improves cell death through apoptosis via a mitochondrial pathway on Bcl2 [48]. Studies have shown that IFIT2 depletion can lead to up-regulation of TNFα promoting angiogenesis, metastasis, epithelial-mesenchymal transition, cell migration, and invasion of oral squamous cell carcinoma [49]. Some studies have shown IFIT proteins as prognostic markers to determine the clinical outcome of many cancers [50,51,52,53,54]. Our analysis suggests that the down-regulation of IFIT2 was a negative prognostic factor for NB patients. Finally, it has been suggested that IFIT proteins could be a novel therapeutic target for tumor therapy [55], so IFIT2 could become a possible target in NB too.
PAPSS2 gene encodes for the bifunctional 3′-phosphoadenosine 5′-phosphosulfate synthetase 2, a rate-limiting enzyme in the sulfation pathway, and it was demonstrated that depletion of PAPSS2 led to premature cell senescence in xenograft tumor mouse model and various cancer cell [56]. To our knowledge, the role of PAPSS2 in NB progression is poorly defined, and no study, apart from ours, has elucidated the association between reduced PAPSS2 gene expression and decreased survival of NB patients.
PCGF5 gene encodes for the polycomb group ring finger protein 5, an important regulator of gene expression, and chromatin structure during neuronal development, acting primarily by modifying histones and reducing DNA accessibility [57]. Indeed, it has been reported that PCGF5 is a crucial requirement in the differentiation of mouse embryonic stem cells toward a neuronal cell fate [58]. PCGF5 is not only engaged to repress genes but also binds to active genes during neuronal differentiation [58].
NUDT9P1 (Nudix hydrolase 9 pseudogene 1) is a non-coding gene regulated by MYCN [59]. Interestingly, low expression of the NUDT9P1 gene was associated with poor outcomes of MYCN-non-amplified NB patients [59]. We also showed that low NUDT9P1 expression was associated with unfavorable patients’ characteristics at diagnosis, and higher values were observed for low-risk patients such as localized stage or stage 4S. Therefore, the NUDT9P1 MYCN-driven gene might play critical a role in NB carcinogenesis.
In addition, eight genes with potential oncogenic action were identified whose expression was inversely related to survival by correcting for the effect of possible confounders: ANXA11, EIF5AL1, GLUD1, KIF20B, LDB3, MINPP1, PANK1, and TSPAN14.
Our study demonstrates that loss of chromosome 10q affects multiple genes and that these genes may act collectively or redundantly at more than one stage of NB progression. The pathways associated with these six genes may represent promising targets for future therapeutic interventions.

5. Conclusions

Here we suggest that six genes could be potentially implicated as a target of 10q loss in NB: CCSER2, AGAP11, IFIT2, PAPSS2, PCGF5, and NUDT9P1. In particular, the CCSER2 gene might have potential relevance in NB as it is normally expressed during neurodevelopment, and its deficiency results in defective neuronal migration. Since NB is known to originate from neural crest cells, their defective migration could lead to the development of this peripheral neuroblastic tumor. Additional functional studies in vivo and in vitro must be carried out to demonstrate it. Nevertheless, it is likely that other genes resident on chromosome 10q may also be NB suppressors. In summary, our study points out that the loss of the long arm of chromosome 10 leads to the inactivation of multiple genes with potential tumor suppressive activity, acting collectively during the different steps of NB progression.

Supplementary Materials

The following supporting information can be downloaded at: https://www.mdpi.com/article/10.3390/cancers15072035/s1, Genes Analysis of AGAP11, IFIT2, PAPSS2, PCGF5, and NUDT9P1, Figures S1–S84: Association between gene expression and NB patients’ survival and clinical characteristics for the analyzed genes other than CCSER2, Table S1: Demographic and clinical characteristics at diagnosis of the cohort of 260 neuroblastoma patients included in the analysis, Table S2: Association between chromosome 10q loss and other chromosomes losses in a cohort of 260 neuroblastoma patients with segmental chromosome alterations at diagnosis, Table S3: Association between chromosome 10q loss and chromosomes gains in a cohort of 260 neuroblastoma patients with segmental chromosome alterations at diagnosis, Tables S4–S83: Association between gene expression and NB patients’ survival for the analyzed genes other than CCSER2.

Author Contributions

Conceptualization, A.P. and M.O.; methodology, S.P., M.O. and A.P.; software, S.P. and D.C.; validation, S.P., A.P., P.D.M. and M.O.; formal analysis, S.P.; investigation, M.O., A.P. and S.P.; resources, A.P., M.O., L.A. and S.P.; data curation, M.O., A.P. and S.P.; writing—original draft preparation, A.P., S.P. and M.O.; writing—review and editing, M.O., A.P., S.P., P.D.M. and L.A.; visualization, M.O. and S.P.; supervision, A.P. and P.D.M.; project administration, A.P.; funding acquisition, A.P. and F.Z. All authors have read and agreed to the published version of the manuscript.

Funding

This research was funded by Compagnia San Paolo (ID ROL 20207) and by the Italian Ministry of Health, RICERCA CORRENTE 2023 (MSALRC23).

Institutional Review Board Statement

Written informed consent was obtained from the parents of the patients before they were included in the study. The study was conducted according to the guidelines of the Declaration of Helsinki, and it was approved by the Italian Institutional Ethics Committee (Measure n 270/17 related to the clinical study protocol IGG-NCA-AP-2016, approved on 15 December 2016 and renewed on 24 May 2021).

Informed Consent Statement

Informed parental consent was obtained from all subjects involved in the study.

Data Availability Statement

All the data are contained within the article or in Supplementary Material and they are also available on the Internet Platform AMC R2 (https://r2.amc.nl).

Acknowledgments

We thank the BIT-Gaslini Biobank, IRCCS Istituto G. Gaslini, Genova, Italy, for providing NB specimens.

Conflicts of Interest

The authors declare no conflict of interest.

References

  1. Johnsen, J.I.; Dyberg, C.; Wickström, M. Neuroblastoma-A Neural Crest Derived Embryonal Malignancy. Front. Mol. Neurosci. 2019, 12, 9. [Google Scholar] [CrossRef] [PubMed]
  2. Newman, E.A.; Abdessalam, S.; Aldrink, J.H.; Austin, M.; Heaton, T.E.; Bruny, J.; Ehrlich, P.; Dasgupta, R.; Baertschiger, R.M.; Lautz, T.B.; et al. APSA Cancer committee. Update on neuroblastoma. J. Pediatr. Surg. 2019, 54, 383–389. [Google Scholar] [CrossRef] [PubMed]
  3. Tomolonis, J.A.; Agarwal, S.; Shohet, J.M. Neuroblastoma pathogenesis: Deregulation of embryonic neural crest development. Cell Tissue Res. 2018, 372, 245–262. [Google Scholar] [CrossRef] [Green Version]
  4. Cheung, N.K.; Dyer, M.A. Neuroblastoma: Developmental biology, cancer genomics and immunotherapy. Nat. Rev. Cancer 2013, 13, 397–411. [Google Scholar] [CrossRef] [PubMed] [Green Version]
  5. Matthay, K.K.; Maris, J.M.; Schleiermacher, G.; Nakagawara, A.; Mackall, C.L.; Diller, L.; Weiss, W.A. Neuroblastoma. Nat. Rev. Dis. Primers 2016, 2, 16078. [Google Scholar] [CrossRef]
  6. Louis, C.U.; Shohet, J.M. Neuroblastoma: Molecular pathogenesis and therapy. Ann. Rev. Med. 2015, 66, 49–63. [Google Scholar] [CrossRef] [Green Version]
  7. Brady, S.W.; Liu, Y.; Xiaotu Ma, X.; Gout, A.M.; Hagiwara, K.; Zhou, X.; Wang, J.; Macias, M.; Chen, X.; Easton, J.; et al. Pan-neuroblastoma analysis reveals age- and signature-associated driver alterations. Nat. Commun. 2020, 11, 5183. [Google Scholar] [CrossRef]
  8. Pugh, T.J.; Morozova, O.; Attiyeh, E.F.; Asgharzadeh, S.; Wei, J.S.; Auclair, D.; Carter, S.L.; Cibulskis, K.; Hanna, M.; Kiezun, A.; et al. The genetic landscape of high-risk neuroblastoma. Nat. Genet. 2013, 45, 279–284. [Google Scholar] [CrossRef] [Green Version]
  9. Newman, E.A.; Nuchtern, J.G. Recent biologic and genetic advances in neuroblastoma: Implications for diagnostic, risk stratification, and treatment strategies. Semin. Pediatr. Surg. 2016, 25, 257–264. [Google Scholar] [CrossRef]
  10. Bosse, K.R.; Maris, J.M. Advances in the translational genomics of neuroblastoma: From improving risk stratification and revealing novel biology to identifying actionable genomic alterations. Cancer 2016, 122, 20–33. [Google Scholar] [CrossRef] [Green Version]
  11. Cheung, N.K.; Zhang, J.; Lu, C.; Parker, M.; Bahrami, A.; Tickoo, S.K.; Heguy, A.; Pappo, A.S.; Federico, S.; Dalton, J.; et al. Association of age at diagnosis and genetic mutations in patients with neuroblastoma. J. Am. Med. Assoc. 2012, 307, 1062–1071. [Google Scholar] [CrossRef] [Green Version]
  12. Janoueix-Lerosey, I.; Schleiermacher, G.; Michels, E.; Mosseri, V.; Ribeiro, A.; Lequin, D.; Vermeulen, J.; Couturier, J.; Peuchmaur, M.; Valent, A.; et al. Overall genomic pattern is a predictor of outcome in neuroblastoma. J. Clin. Oncol. 2009, 27, 1026–1033. [Google Scholar] [CrossRef]
  13. Depuydt, P.; Boeva, V.; Hocking, T.D.; Cannoodt, R.; Ambros, I.M.; Ambros, P.F.; Asgharzadeh, S.; Attiyeh, E.F.; Combaret, V.; Defferrari, R.; et al. Genomic Amplifications and Distal 6q Loss: Novel Markers for Poor Survival in High-risk Neuroblastoma Patients. J. Natl. Cancer Inst. 2018, 110, 1084–1093. [Google Scholar] [CrossRef]
  14. Amoroso, L.; Ognibene, M.; Morini, M.; Conte, M.; Di Cataldo, A.; Tondo, A.; D’Angelo, P.; Castellano, A.; Garaventa, A.; Lasorsa, V.A.; et al. Genomic co-amplification of CDK4/MDM2/FRS2 is associated with very poor prognosis and atypical clinical features in neuroblastoma patients. Genes Chromosomes Cancer 2020, 59, 277–285. [Google Scholar] [CrossRef]
  15. Ognibene, M.; Amoroso, L.; Melchionda, F.; Cangelosi, D.; Zara, F.; Parodi, S.; Pezzolo, A. High Grade of Amplification of Six Regions on Chromosome 2p in a Neuroblastoma Patient with Very Poor Outcome: The Putative New Oncogene TSSC1. Cancers 2021, 13, 5792. [Google Scholar] [CrossRef]
  16. Ognibene, M.; Pezzolo, A. Ezrin interacts with the tumor suppressor CHL1 and promotes neuronal differentiation of human neuroblastoma. PLoS ONE 2020, 15, e0244069. [Google Scholar] [CrossRef]
  17. Ognibene, M.; Morini, M.; Garaventa, A.; Podestà, M.; Pezzolo, A. Identification of a minimal region of loss on chromosome 6q27 associated with poor survival of high-risk neuroblastoma patients. Cancer Biol. Ther. 2020, 21, 391–399. [Google Scholar] [CrossRef]
  18. Ognibene, M.; Pagnan, G.; Marimpietri, D.; Cangelosi, D.; Cilli, M.; Benedetti, M.C.; Boldrini, R.; Garaventa, A.; Frassoni, F.; Eva, A.; et al. CHL1 gene acts as a tumor suppressor in human neuroblastoma. Oncotarget 2018, 9, 25903–25921. [Google Scholar] [CrossRef] [Green Version]
  19. Lasorsa, V.A.; Cimmino, F.; Ognibene, M.; Mazzocco, K.; Erminio, G.; Morini, M.; Conte, M.; Iolascon, A.; Pezzolo, A.; Capasso, M. 19p loss is significantly enriched in older age neuroblastoma patients and correlates with poor prognosis. NPJ Genom Med. 2020, 5, 18. [Google Scholar] [CrossRef] [Green Version]
  20. Parodi, S.; Pistorio, A.; Erminio, G.; Ognibene, M.; Morini, M.; Garaventa, A.; Gigliotti, A.R.; Haupt, R.; Frassoni, F.; Pezzolo, A. Loss of whole chromosome X predicts prognosis of neuroblastoma patients with numerical genomic profile. Pediatr Blood Cancer. 2019, 66, e27635. [Google Scholar] [CrossRef]
  21. Brandetti, E.; Focaccetti, C.; Pezzolo, A.; Ognibene, M.; Folgiero, V.; Cotugno, N.; Benvenuto, M.; Palma, P.; Manzari, V.; Rossi, P.; et al. Enhancement of Neuroblastoma NK-Cell-Mediated Lysis through NF-kB p65 Subunit-Induced Expression of FAS and PVR, the Loss of Which Is Associated with Poor Patient Outcome. Cancers 2021, 13, 4368. [Google Scholar] [CrossRef] [PubMed]
  22. Altura, R.A.; Maris, J.M.; Li, H.; Boyett, J.M.; Brodeur, G.M.; Look, A.T. Novel regions of chromosomal loss in familial neuroblastoma by comparative genomic hybridization. Genes Chromosom. Cancer 1997, 19, 176–184. [Google Scholar] [CrossRef]
  23. Takita, J.; Hayashi, Y.; Kohno, T.; Shiseki, M.; Yamaguchi, N.; Hanada, R.; Yamamoto, K.; Yokota, J. Allelotype of neuroblastoma. Oncogene 1995, 11, 1829–1834. [Google Scholar] [PubMed]
  24. Kaneko, Y.; Kanda, N.; Maseki, N.; Sakurai, M.; Tsuchida, Y.; Takeda, T.; Okabe, I.; Sakurai, M. Different karyotypic patterns in early and advanced stage neuroblastomas. Cancer Res. 1987, 47, 311–318. [Google Scholar]
  25. Cohn, S.L.; Pearson, A.D.; London, W.B.; Monclair, T.; Ambros, P.F.; Brodeur, G.M.; Faldum, A.; Hero, B.; Iehara, T.; Machin, D.; et al. INRG Task Force. The International Neuroblastoma Risk Group (INRG) classification system: An INRG Task Force report. J. Clin. Oncol. 2009, 27, 289–297. [Google Scholar] [CrossRef] [Green Version]
  26. Park, J.R.; Bagatell, R.; Cohn, S.L.; Pearson, A.D.; Villablanca, J.G.; Berthold, F.; Burchill, S.; Boubaker, A.; McHugh, K.; Nuchtern, J.G.; et al. Revisions to the International neuroblastoma response criteria: A consensus statement from the National Cancer Institute clinical trials planning meeting. J. Clin. Oncol. 2017, 35, 2580–2587. [Google Scholar] [CrossRef]
  27. Haupt, R.; Garaventa, A.; Gambini, C.; Parodi, S.; Cangemi, G.; Casale, F.; Viscardi, E.; Bianchi, M.; Prete, A.; Jenkner, A.; et al. Improved survival of children with neuroblastoma between 1979 and 2005: A report of the Italian Neuroblastoma Registry. J. Clin. Oncol. 2010, 28, 2331–2338. [Google Scholar] [CrossRef]
  28. Cangelosi, D.; Morini, M.; Zanardi, N.; Sementa, A.R.; Muselli, M.; Conte, M.; Garaventa, A.; Pfeffer, U.; Bosco, M.C.; Varesio, L.; et al. Hypoxia Predicts Poor Prognosis in Neuroblastoma Patients and Associates with Biological Mechanisms Involved in Telomerase Activation and Tumor Microenvironment Reprogramming. Cancers 2020, 12, 2343. [Google Scholar] [CrossRef]
  29. Zhang, W.; Yu, Y.; Hertwig, F.; Thierry-Mieg, J.; Zhang, W.; Thierry-Mieg, D.; Wang, J.; Furlanello, C.; Devanarayan, V.; Cheng, J.; et al. Comparison of RNA-seq and microarray-based models for clinical endpoint prediction. Genome Biol. 2015, 16, 133. [Google Scholar] [CrossRef] [Green Version]
  30. Oberthuer, A.; Juraeva, D.; Hero, B.; Volland, R.; Sterz, C.; Schmidt, R.; Faldum, A.; Kahlert, Y.; Engesser, A.; Asgharzadeh, S.; et al. Revised risk estimation and treatment stratification of low- and intermediate-risk neuroblastoma patients by integrating clinical and molecular prognostic markers. Clin. Cancer Res. 2015, 21, 1904–1915. [Google Scholar] [CrossRef] [Green Version]
  31. Rajbhandari, P.; Lopez, G.; Capdevila, C.; Salvatori, B.; Yu, J.; Rodriguez-Barrueco, R.; Martinez, D.; Yarmarkovich, M.; Weichert-Leahey, N.; Abraham, B.J.; et al. Cross-cohort analysis identifies a TEAD4-MYCN positive feedback loop as the core regulatory element of high-risk neuroblastoma. Cancer Discov. 2018, 8, 582–599. [Google Scholar] [CrossRef] [Green Version]
  32. Gibbons, J.D.; Chakraborti, S. Nonparametric Statistical Inference, 5th ed.; CRC Press, Chapman & Hall: New York, NY, USA, 2010; pp. 1–650. [Google Scholar]
  33. Hosmer, D.W.; Lemeshow, S.; May, S. Applied Survival Analysis—Regression Modelling of Time to Event Data, 2nd ed.; John Wiley & Sons, Inc.: New York, NY, USA, 2008; pp. 1–416. [Google Scholar]
  34. Vandesompele, J.; Baudis, M.; De Preter, K.; Van Roy, N.; Ambros, P.; Bown, N.; Brinkschmidt, C.; Christiansen, H.; Combaret, V.; Lastowska, M.; et al. Unequivocal delineation of clinicogenetic subgroups and development of a new model for improved outcome prediction in neuroblastoma. J. Clin. Oncol. 2005, 23, 2280–2299. [Google Scholar] [CrossRef] [Green Version]
  35. Mikhail, F.M.; Biegel, J.A.; Cooley, L.D.; Dubuc, A.M.; Hirsch, B.; Horner, V.L.; Newman, S.; Shao, L.; Wolff, D.J.; Raca, G. Technical laboratory standards for interpretation and reporting of acquired copy-number abnormalities and copy-neutral loss of heterozygosity in neoplastic disorders: A joint consensus recommendation from the American College of Medical Genetics and Genomics (ACMG) and the Cancer Genomics Consortium (CGC). Genet Med. 2019, 21, 1903–1916. [Google Scholar]
  36. Lastowska, M.; Viprey, V.; Santibanez-Koref, M.; Wappler, I.; Peters, H.; Cullinane, C.; Roberts, P.; Hall, A.G.; Tweddle, D.A.; Pearson, A.D.; et al. Identification of candidate genes involved in neuroblastoma progression by combining genomic and expression microarrays with survival data. Oncogene 2007, 26, 7432–7444. [Google Scholar] [CrossRef] [Green Version]
  37. Brandon, N.J.; Sawa, A. Linking neurodevelopmental and synaptic theories of mental illness through DISC1. Nat. Rev. Neurosci. 2011, 12, 707–722. [Google Scholar] [CrossRef]
  38. Ishizuka, K.; Kamiya, A.; Oh, E.C.; Kanki, H.; Seshadri, S.; Robinson, J.F.; Murdoch, H.; Dunlop, A.J.; Kubo, K.I.; Furukori, K.; et al. DISC1-dependent switch from progenitor proliferation to migration in the developing cortex. Nature 2011, 473, 92–96. [Google Scholar] [CrossRef] [Green Version]
  39. Chen, Y.; Yan, Q.; Zhou, P.; Li, S.; Zhu, F. HERV-W env regulates calcium influx via activating TRPC3 channel together with depressing DISC1 in human neuroblastoma cells. J. Neurovirol. 2019, 25, 101–113. [Google Scholar] [CrossRef]
  40. You, Y.; Peng, B.; Ben, S.; Hou, W.; Sun, L.; Jiang, W. Lead Neurotoxicity on Human Neuroblastoma Cell Line SH-SY5Y is Mediated via Transcription Factor EGR1/Zif268 Induced Disrupted in Scherophernia-1 Activation. Neurochem. Res. 2018, 43, 1308–1316. [Google Scholar] [CrossRef]
  41. Mun, D.J.; Goo, B.S.; Suh, B.K.; Hong, J.H.; Woo, Y.; Kim, S.J.; Kim, S.; Lee, S.B.; Won, Y.; Yoo, J.Y.; et al. Gcap14 is a microtubule plus-end-tracking protein coordinating microtubule-actin crosstalk during neurodevelopment. Proc. Natl. Acad. Sci. USA 2023, 120, e2214507120. [Google Scholar] [CrossRef]
  42. Huang, H.; Yao, H.; Wei, Y.; Chen, M.; Sun, J. Cellular senescence-related long noncoding ribonucleic acids: Predicting prognosis in hepatocellular carcinoma. Cancer Rep. 2023, 1, e1791. [Google Scholar] [CrossRef]
  43. Lee, J.T. Epigenetic Regulation by Long Noncoding RNAs. Science 2012, 338, 1435–1439. [Google Scholar] [CrossRef] [PubMed] [Green Version]
  44. Min, L.; Wang, H.; Qi, H. Astragaloside IV inhibits the progression of liver cancer by modulating macrophage polarization through the TLR4/NF-κB/STAT3 signaling pathway. Am. J. Transl. Res. 2022, 14, 1551–1566. [Google Scholar] [PubMed]
  45. Xu, Y.; Tian, H.; Luan, C.G.; Sun, K.; Bao, P.J.; Zhang, H.Y.; Zhang, N. Telocytes promote hepatocellular carcinoma by activating the ERK signaling pathway and miR-942-3p/MMP9 axis. Cell Death Discov. 2021, 7, 209. [Google Scholar] [CrossRef] [PubMed]
  46. Yang, H.; Deng, Q.; Ni, T.; Liu, Y.; Lu, L.; Dai, H.; Wang, H.; Yang, W. Targeted Inhibition of LPL/FABP4/CPT1 fatty acid metabolic axis can effectively prevent the progression of nonalcoholic steatohepatitis to liver cancer. Int. J. Biol. Sci. 2021, 17, 4207–4222. [Google Scholar] [CrossRef] [PubMed]
  47. Chen, L.; Liu, S.; Xu, F.; Kong, Y.; Wan, L.; Zhang, Y.; Zhang, Z. Inhibition of Proteasome Activity Induces Aggregation of IFIT2 in the Centrosome and Enhances IFIT2-Induced Cell Apoptosis. Int. J. Biol. Sci. 2017, 13, 383–390. [Google Scholar] [CrossRef] [Green Version]
  48. Zhou, X.; Michal, J.J.; Zhang, L.; Ding, B.; Lunney, J.K.; Liu, B.; Jiang, Z. Interferon induced IFIT family genes in host antiviral defense. Int. J. Biol. Sci. 2013, 9, 200–208. [Google Scholar] [CrossRef] [Green Version]
  49. Lai, K.C.; Liu, C.J.; Lin, T.J.; Mar, A.C.; Wang, H.H.; Chen, C.W.; Hong, Z.X.; Lee, T.C. Blocking TNF-α inhibits angiogenesis and growth of IFIT2-depleted metastatic oral squamous cell carcinoma cells. Cancer Lett. 2016, 370, 207–215. [Google Scholar] [CrossRef]
  50. Danish, H.H.; Goyal, S.; Taunk, N.K.; Wu, H.; Moran, M.S.; Haffty, B.G. Interferon-induced protein with tetratricopeptide repeats 1 (IFIT1) as a prognostic marker for local control in T1-2 N0 breast cancer treated with breast-conserving surgery and radiation therapy (BCS + RT). Breast J. 2013, 19, 231–239. [Google Scholar] [CrossRef] [Green Version]
  51. Zhang, Y.; Kong, Y.; Liu, S.; Zeng, L.; Wan, L.; Zhang, Z. Curcumin induces apoptosis in human leukemic cell lines through an IFIT2-dependent pathway. Cancer Biol. Ther. 2017, 18, 43–50. [Google Scholar] [CrossRef] [Green Version]
  52. Zhang, J.F.; Chen, Y.; Lin, G.S.; Zhang, J.D.; Tang, W.L.; Huang, J.H.; Chen, J.S.; Wang, X.F.; Lin, Z.X. High IFIT1 expression predicts improved clinical outcome, and IFIT1 along with MGMT more accurately predicts prognosis in newly diagnosed glioblastoma. Hum. Pathol. 2016, 52, 136–144. [Google Scholar] [CrossRef]
  53. Yang, Y.; Zhou, Y.; Hou, J.; Bai, C.; Li, Z.; Fan, J.; Ng, I.O.L.; Zhou, W.; Sun, H.; Dong, Q.; et al. Hepatic IFIT3 predicts interferon-α therapeutic response in patients of hepatocellular carcinoma. Hepatology. 2017, 66, 152–166. [Google Scholar] [CrossRef] [Green Version]
  54. Zhao, Y.; Altendorf-Hofmann, A.; Pozios, I.; Camaj, P.; Däberitz, T.; Wang, X.; Niess, H.; Seeliger, H.; Popp, F.; Betzler, C.; et al. Elevated interferon-induced protein with tetratricopeptide repeats 3 (IFIT3) is a poor prognostic marker in pancreatic ductal adenocarcinoma. J. Cancer Res. Clin. Oncol. 2017, 143, 1061–1068. [Google Scholar] [CrossRef]
  55. Pidugu, V.K.; Pidugu, H.B.; Wu, M.M.; Liu, C.J.; Lee, T.C. Emerging Functions of Human IFIT Proteins in Cancer. Front. Mol. Biosci. 2019, 19, 148. [Google Scholar] [CrossRef] [Green Version]
  56. Jung, S.H.; Lee, H.C.; Yu, D.M.; Kim, B.C.; Park, S.M.; Lee, Y.S.; Park, H.J.; Ko, Y.G.; Lee, J.S. Heparan sulfation is essential for the prevention of cellular senescence. Cell Death Differ. 2016, 23, 417–429. [Google Scholar] [CrossRef] [Green Version]
  57. Di Croce, L.; Helin, K. Transcriptional regulation by Polycomb group proteins. Nat. Struct. Mol. Biol. 2013, 20, 1147–1155. [Google Scholar] [CrossRef]
  58. Yao, M.; Zhou, X.; Zhou, J.; Gong, S.; Hu, G.; Li, J.; Huang, K.; Lai, P.; Shi, G.; Hutchins, A.P.; et al. PCGF5 is required for neural differentiation of embryonic stem cells. Nat. Commun. 2018, 9, 1463. [Google Scholar] [CrossRef] [Green Version]
  59. Hsu, C.L.; Chang, H.Y.; Chang, J.Y.; Hsu, W.M.; Huang, H.C.; Juan, H.F. Unveiling MYCN regulatory networks in neuroblastoma via integrative analysis of heterogeneous genomics data. Oncotarget 2016, 7, 36293–36310. [Google Scholar] [CrossRef] [Green Version]
Figure 1. Detailed location of the 10q losses and/or CN-LOH found in 26 NB patients and 4 NB cell lines. Patients who died of disease are indicated in black, censored patients in blue, and cell lines in green.
Cancers 15 02035 g001
Figure 2. Association between 10q loss and other segmental chromosomal aberrations in a cohort of 260 neuroblastoma patients. (A) Other segmental deletions; (B) segmental gains; (C) any chromosomal aberrations but 10q loss.
Cancers 15 02035 g002
Figure 3. Survival analyses of 260 NB patients in relation to the chromosome 10q loss. (A) Overall Survival; (B) Event-Free Survival. Five-year survival estimates and their related 95% CI are shown.
Cancers 15 02035 g003
Figure 4. Event Free Survival of 26 NB patients bearing 10q loss in their primary tumor in association with the occurrence of the deletion of the cluster of 75 genes mapping in 10q. Five-year survival estimates and their related 95% CI are shown.
Cancers 15 02035 g004
Figure 5. Survival analyses of 786 NB patients using the Cangelosi et al. dataset for CCSER2 gene expression. Overall survival, cut-off on the median (A) or tertile (B) expression value; Event-free survival, cut-off on the median (C) or tertile (D) expression value. Five-year survival estimates and their related 95% CI are shown.
Cancers 15 02035 g005
Figure 6. Association between CCSER2 gene expression and the main patients’ characteristics at diagnosis evaluated on the cohort of 786 neuroblastoma patients in the data set of Cangelosi et al. (A) Age; (B) MYCN status; (C) INSS stage.
Cancers 15 02035 g006
Figure 7. Survival analyses of 283 NB patients using the NRC-283 dataset for CCSER2 gene expression. Overall survival, cut-off on the median (A) or tertile (B) expression value; Progression-free survival, cut-off on the median (C) or tertile (D) expression value. Five-year survival estimates and their related 95% CI are shown.
Cancers 15 02035 g007
Figure 8. The association between CCSER2 gene expression and the main patient characteristics at diagnosis was evaluated on the cohort of 283 neuroblastoma patients in the NRC-283 data set. (A) Age; (B) MYCN status; (C) INSS stage.
Cancers 15 02035 g008
Figure 9. Survival analyses of 629 NB patients with not amplified MYCN using the Cangelosi et al. dataset for CCSER2 gene expression. Overall survival, cut-off on the median (A) or tertile (B) expression value; Event-free survival, cut-off on the median (C) or tertile (D) expression value. Five-year survival estimates and their related 95% CI are shown.
Cancers 15 02035 g009
Figure 10. Survival analyses of 153 NB patients with amplified MYCN using the Cangelosi et al. dataset for CCSER2 gene expression values. Overall survival, cut-off on the median (A) or tertile (B) expression value; Event-free survival, cut-off on the median (C) or tertile (D) expression value. Five-year survival estimates and their related 95% CI are shown.
Cancers 15 02035 g010
Figure 11. Survival analyses of 373 NB patients with a localized stage at diagnosis using the Cangelosi et al. dataset for CCSER2 gene expression. Cut-off on the median expression value. (A) Overall survival; (B) Event-free survival. Five-year survival estimates and their related 95% CI are shown.
Cancers 15 02035 g011
Figure 12. Survival analyses of 320 NB patients with stage 4 at diagnosis using the Cangelosi et al. dataset for CCSER2 gene expression. Overall survival, cut-off on the median (A) or tertile (B) expression value; Event-free survival, cut-off on the median (C) or tertile (D) expression value. Five-year survival estimates and their related 95% CI are shown.
Cancers 15 02035 g012
Table 1. Chromosome 10q loss in 26 NB patients.
Case N°Age at Onset
(Months)
INSS StageINRG StageMYCN StatusCytoband and Chromosomal Coordinates of 10q LossRelapseFollow-UpDisease State
1 474Mgain10q11.23–q21.3; chr10:51676176–69078545yesdead
2 684Mgain10q24.1–q26.3;
chr10: 98064330–135404523
yesdead
3 403L2amplified10q11.23–q26.3;
chr10: 50955699–135372492
noaliveCR
4 464Msingle copy10q11.21–21.1;
chr10: 42969765–57723272
yesaliveAD
5 554Mamplified10q23.32–q26.3;
chr10: 93204607–135404523
noaliveCR
6 51L1amplified10q11.22–q26.3;
chr10: 48334407–135404523
yesdead
7 103L2amplified10q21.3–q26.3;
chr10: 64979620–135404523
nodead
8 141L1amplified10q22.1–q26.3;
chr10: 73406500–135404523
yesdead
9 2002AL1single copy10q11.21–q24.32;
chr10: 42969765–103988947
yesaliveCR
10 454Mgain10q21.1;
chr10: 55252216–56505255
yesdead
11 371L1single copy10q22.3–q26.11;
chr10: 78015106–121458431
yesdead
12 532BL1gainCN-LOH 10q11.23–q26.3; chr10: 4541520–67615559yesaliveCR
13 524Mgain10q11.22;
chr10: 46938469–48317747
yesaliveAD
14 224Mamplified10q22.3–q26.3;
chr10: 81234748–135404523
yesdead
15 333L2amplified10q21.1–q26.3;
chr10: 57654752–135411735
noaliveAD
16 14SMsgainCN-LOH 10q21.1–21.2;
chr10: 58949883–63882016
noaliveCR
17 21L1gain10q21.1;
chr10: 56329864–58030413
nana
18 123L2gain10q26.3;
chr10:133245712–135405996
nodead
19 104Msingle copy10q26.3;
chr10:133079678–134996216
noaliveCR
20 314Msingle copy10q21.3; 10q26.13–q26.3;
chr10:68757961–69106575
chr10:123773590–135421826
noaliveAD
21 304Mamplified10q11.21–q26.3; chr10:45247685–135372492yesaliveAD
22 204Mamplified10q25.3–q26.3;
chr10:116405945–135434178
noalivena
23 203L2single copy10q22.2–q24.33; chr10:75923421–105458525noaliveAD
24 594Msingle copy10q26.13–q26.3;
chr10:123773590–135377532
nana
25 524Msingle copy10q11.22–q22.3; chr10:49797866–77817731noaliveCR
26 464Mamplified10q24.1–q26.3;
chr10: 98515392–135404523
yesaliveAD
AD, active disease; CR, complete remission; CN-LOH, copy-neutral loss of heterozygosity; na, not available; INSS, International Neuroblastoma Staging System; INRG, International Neuroblastoma Risk Group.
Table 2. Chromosome 10q status in 12 NB cell lines.
NB Cell LineChromosome 10q StatusChromosomal Coordinates of 10q LossMYCN (2p24.3)
SK-N-AS10q11.21–q26.3 lossChr10: 43615122–135474787single copy
SK-N-BE(2)c10q11.21–q26.3 lossChr10: 42418957–135434178amplification
LA-N-110q11.21–q26.3 lossChr10: 42976950–135234843amplification
SMS-KCNR10q11.22 lossChr10: 46938469–49262406single copy
SH-EP10q23.31–q24.32 gainChr10:90628315–103956178gain
GICANnormal-single copy
ACNnormal-single copy
SH-SY5Ynormal-gain
SK-N-SHnormal-amplification
LA-N-5normal-amplification
IMR32normal-amplification
Tet-21/Nnormal-single copy
Table 3. Association between chromosome 10q status and patients’ characteristics in a cohort of 260 neuroblastoma patients with segmental chromosome alterations (SCA) at diagnosis.
Other SCA *Loss 10q
Patients’ CharacteristicsN%N%p
Age (months) 0.369
  0–179138.9726.9
  18–5910846.21661.5
  ≥603515.0311.5
Gender 0.619
  Male12352.61557.7
  Female11147.41142.3
INSS Stage 0.999
  1–25523.6624.0
  34218.0520.0
  411951.11352.0
  4S177.314.0
MYCN status 0.345
  Non-amplified16570.51661.5
  Amplified6929.51038.5
* Other than chromosome 10q loss.
Table 4. Main features of the four datasets utilized in the study.
Cangelosi et al.
(N = 786)
E-MTAB-1781
(N = 709)
SEQC-498
(N = 498)
NRC-283
(N = 283)
Patient CharacteristicsN%N%N%N%
Age at diagnosis
  <18 months44957.143160.830561.214551.2
  ≥18 months33742.927839.219838.813347.0
  Missing00.000.000.051.8
INSS Stage
  114318.215922.412124.35017.7
  212515.911816.67815.73612.7
  310513.49313.16312.74315.2
  432040.725936.518336.812443.8
  4s9211.78011.35310.6279.5
  Missing10.100.000.031.1
MYCN status
  Not amplified62980.058182.040180.522278.4
  Amplified15319.512217.29218.55519.4
  Missing40.560.851.062.2
Events *32040.7 1256 236.118336.997 334.3
Deaths22929.116122.710521.175 426.5
*, For NRC-283, events are referred to progression free survival; 1, 17 missing for the Event Free Survival; 2, 14 missing for the Event Free Survival; 3, 8 missing for the Progression Free Survival; 4, 7 missing for the Overall Survival.
Table 5. Survival of the cohort of 786 NB patients from the Cangelosi et al. data set, in relation to CCSER2 gene expression values, evaluated by the Cox model.
Univariable AnalysisMultivariable Analysis
Gene ExpressionN/OHR95% CIpHR95% CIp
Overall Survival
  Median <0.001 <0.001
    ≤4.316 (reference)393/1921- 1-
    >4.316393/370.140.10–0.21 0.370.25–0.55
  Tertiles <0.001 <0.001
    ≤4.079 (reference)262/1571- 1-
    4.079–4.552262/540.250.18–0.34 0.600.43–0.85
    >4.552262/180.080.05–0.13 0.270.16–0.47
  Continuous variable786/2290.280.23–0.33<0.0010.560.45–0.69<0.001
Event Free Survival
  Median <0.001 <0.001
    ≤4.316 (reference)377/2251- 1-
    >4.316392/950.320.25–0.40 0.550.41–0.72
  Tertiles <0.001 <0.001
    ≤4.079 (reference)248/1731- 1-
    4.079–4.552259/1000.440.34–0.56 0.710.53–0.94
    >4.552262/470.180.13–0.25 0.350.24–0.51
  Continuous variable769/3200.350.30–0.41<0.0010.550.45–0.68<0.001
N/O, Number of patients/Outcome (deaths for the overall and events for the event-free survival); HR, Hazard Ratio. Multivariable analysis: HRs are adjusted by MYCN status, age, and stage at diagnosis.
Table 6. Survival of the cohort of 283 NB patients from the NRC-283 data set, in relation to CCSER2 gene expression values, was evaluated by the Cox model.
Univariable AnalysisMultivariable Analysis
Gene ExpressionN/OHR95% CIpHR95% CIp
Overall Survival
  Median <0.001 0.003
    ≤530.4 (reference)141/621- 1-
    >530.4135/130.160.09–0.29 0.360.18–0.72
  Tertiles <0.001 0.017
    ≤461.6 (reference)94/481- 1-
    461.6–599.592/190.300.18–0.52 0.680.37–1.3
    >599.590/80.110.05–0.23 0.360.15–0.85
  Continuous variable276/750.9940.993–0.996<0.0010.9970.995–0.9990.005
Progression Free Survival
  Median <0.001 <0.001
    ≤530.4 (reference)140/751- 1-
    >530.4135/220.220.14–0.37 0.380.22–0.66
  Tertiles <0.001 0.008
    ≤461.6 (reference)94/551- 1-
    461.6–599.591/280.410.26–0.64 0.710.41–1.2
    >599.590/140.180.10–0.32 0.390.19–0.79
  Continuous variable265/970.9960.995–0.997<0.0010.9980.997–0.9990.014
N/O, Number of patients/Outcome (deaths for the overall and events for the progression-free survival); HR, Hazard Ratio. Multivariable analysis: HRs are adjusted by MYCN status, age, and stage at diagnosis.
Table 7. Survival of the cohort of 629 NB patients with not amplified MYCN status from the Cangelosi et al. dataset, in relation to CCSER2 gene expression values, evaluated by the Cox model.
Univariable AnalysisMultivariable Analysis
Gene ExpressionN/OHR95% CIpHR95% CIp
Overall Survival
  Median <0.001 <0.001
    ≤4.444 (reference)314/981- 1-
    >4.444315/210.180.11–0.29 0.370.23–0.60
  Tertiles <0.001 <0.001
    ≤4.239 (reference)209/801- 1-
    4.239–4.648210/310.320.22–0.50 0.660.43–1.0
    >4.648210/80.080.04–0.17 0.200.10–0.43
  Continuous variable629/1190.250.19–0.32<0.0010.520.38–0.70<0.001
Event Free Survival
  Median <0.001 <0.001
    ≤4.444 (reference)299/1461- 1-
    >4.4444315/610.330.25–0.47 0.440.32–0.61
  Tertiles <0.001 <0.001
    ≤4.239 (reference)196/1071- 1-
    4.239–4.648208/670.510.37–0.69 0.680.50–0.94
    >4.648210/330.230.15–0.34 0.340.23–0.52
  Continuous variable614/2070.280.22–0.37<0.0010.440.33–0.59<0.001
N/O, Number of patients/Outcome (deaths for the overall and events for the progression-free survival); HR, Hazard Ratio. Multivariable analysis: HRs are adjusted by age, and stage at diagnosis.
Table 8. Survival of the cohort of 153 NB patients with amplified MYCN status from the Cangelosi et al. dataset, in relation to CCSER2 gene expression values, evaluated by the Cox model.
Univariable AnalysisMultivariable Analysis
Gene ExpressionN/OHR95% CIpHR95% CIp
Overall Survival
  Median <0.001 <0.001
    ≤3.709 (reference)76/651- 1-
    >3.70977/430.450.31–0.67 0.490.33–0.73
  Tertiles <0.001 <0.001
    ≤3.574 (reference)51/441- 1-
    3.574–3.93651/390.690.45–1.1 0.690.45–1.1
    >3.93651/250.350.21–0.57 0.380.23–0.63
  Continuous variable153/1080.650.47–0.880.0080.700.50–0.970.038
Event Free Survival
  Median <0.001 0.001
    ≤3.709 (reference)74/641- 1-
    >3.70977/470.490.33–0.71 0.530.36–0.78
  Tertiles <0.001 <0.001
    ≤3.574 (reference)49/431- 1-
    3.574–3.93651/400.690.45–1.1 0.690.45–1.1
    >3.93651/280.390.24–0.63 0.420.26–0.68
  Continuous variable151/1110.690.51–0.950.0230.750.54–1.040.096
N/O, Number of patients/Outcome (deaths for the overall and events for the progression-free survival); HR, Hazard Ratio. Multivariable analysis: HRs are adjusted by age, and stage at diagnosis.
Table 9. Survival of the cohort of 320 NB patients with stage 4 at diagnosis from the Cangelosi et al. dataset, in relation to CCSER2 gene expression values, evaluated by the Cox model.
Univariable AnalysisMultivariable Analysis
Gene ExpressionN/OHR95% CIpHR95% CIp
Overall Survival
  Median <0.001 0.009
    ≤3.994 (reference)160/1161- 1-
    >3.994160/670.430.32–0.58 0.650.47–0.90
  Tertiles <0.001 <0.001
    ≤3.723 (reference)106/801- 1-
    3.723–4.205107/630.610.44–0.85 0.710.51–0.99
    >4.205107/400.320.22–0.46 0.510.33–0.77
  Continuous variable320/1830.520.41–0.64<0.0010.680.53–0.870.003
Event Free Survival
  Median <0.001 0.006
    ≤3.994 (reference)154/1231- 1-
    >3.994160/830.450.34–0.60 0.650.48–0.89
  Tertiles <0.001 0.001
    ≤3.723 (reference)100/831- 1-
    3.723–4.205107/700.560.41–0.78 0.660.48–0.91
    >4.205107/530.360.25–0.50 0.530.36–0.79
  Continuous variable314/2060.510.41–0.63<0.0010.650.51–0.850.002
N/O, Number of patients/Outcome (deaths for the overall and events for the progression-free survival); HR, Hazard Ratio. Multivariable analysis: HRs are adjusted by MYCN status and age.
Disclaimer/Publisher’s Note: The statements, opinions and data contained in all publications are solely those of the individual author(s) and contributor(s) and not of MDPI and/or the editor(s). MDPI and/or the editor(s) disclaim responsibility for any injury to people or property resulting from any ideas, methods, instructions or products referred to in the content.

