Article

Prognostic Value of Inflammatory and Nutritional Biomarkers of Immune Checkpoint Inhibitor Treatment for Recurrent or Metastatic Squamous Cell Carcinoma of the Head and Neck

Department of Otolaryngology, Head and Neck Surgery, School of Medicine, Tokai University, Isehara 259-1193, Japan
*
Author to whom correspondence should be addressed.
Cancers 2023, 15(7), 2021; https://doi.org/10.3390/cancers15072021
Submission received: 2 March 2023 / Revised: 24 March 2023 / Accepted: 27 March 2023 / Published: 28 March 2023
(This article belongs to the Section Cancer Therapy)

Abstract

:

Simple Summary

In recent years, various biomarkers have been developed to assist in the selection of anticancer agents. Inflammatory and nutritional biomarkers have been reported as useful for predicting prognosis after treatment with immune checkpoint inhibitor (ICI) treatment in head and neck cancers. Still, their prognostic value in recurrent or metastatic squamous cell carcinoma of the head and neck (HNSCC) has not been thoroughly investigated. Therefore, we evaluated the prognostic value of inflammatory and nutritional biomarkers of ICI treatment for RMHNSCC. We demonstrated that the lymphocyte-to-monocyte ratio (LMR) was the most important biomarker. This study suggests that LMR may be the most useful biomarker for predicting the prognosis of ICI treatment for RMHNSCC.

Abstract

This study aimed to determine the prognostic value of inflammatory and nutritional biomarkers of immune checkpoint inhibitor (ICI) therapy for recurrent or metastatic squamous cell carcinoma of the head and neck (RMHNSCC) and to identify the most useful factor for prognosis assessment. We retrospectively reviewed the medical records of patients with RMHNSCC who received ICI therapy. The response rate for ICI therapy and the relationship between inflammatory and nutritional biomarkers and overall survival were examined. The included biomarkers did not correlate with an objective response rate but were associated with a disease control rate. Univariate analysis showed significant correlations between the serum albumin level, C-reactive protein level, platelet to lymphocyte ratio, neutrophil to lymphocyte ratio, lymphocyte to monocyte ratio (LMR), systemic immune-inflammation index, and controlling the nutritional status score and overall survival; multivariate analysis showed that LMR was significantly correlated with overall survival. LMR was the most important biomarker according to the machine learning model. This study suggests that LMR may be the most useful biomarker for predicting the prognosis of ICI treatment for RMHNSCC.

1. Introduction

Head and neck squamous cell carcinomas constitute the sixth most common cancer type in the world [1]. Despite improvements in treatment, recurrence, and metastasis are common and contribute to poor prognosis. Therefore, improving the prognosis of recurrent or metastatic squamous cell carcinoma of head and neck (RMHNSCC) patients is crucial for the treatment of RMHNSCC. Recently, approved immune checkpoint inhibitors (ICIs) have significantly improved the prognosis of patients with recurrent or metastatic squamous cell carcinoma of the head and neck (RMHNSCC) compared to conventional chemotherapy [2,3]. ICIs have been widely used as a first-line treatment for RMHNSCC because they are associated with fewer adverse events [4,5] and better patient quality of life than chemotherapy. NCCN Guidelines for Head and Neck Cancers V.1.2023 recommend two ICIs, nivolumab, and pembrolizumab, as the preferred regimens. The CheckMate 141 study [2] was a clinical trial that evaluated the effectiveness of nivolumab for RMHNSCC. The trial compared nivolumab to chemotherapy and found that patients who received nivolumab had longer overall survival rates and fewer adverse events than chemotherapy. Additionally, the Keynote-048 trial [3] reported the effectiveness of pembrolizumab as a first-line treatment for RMHNSCC. Pembrolizumab alone and pembrolizumab plus chemotherapy demonstrated superior overall survival (OS) and progression-free survival (PFS) compared to chemotherapy, leading to the approval of pembrolizumab as a first-line treatment for RMHNSCC. However, the response rates in the Checkmate 141 study [2] and the Keynote 048 study [3] were 13.3% and 16.9%, respectively, and not many patients benefit from ICIs. Therefore, estimating the effects of ICIs and prognosis after ICI treatment is crucial in determining the optimal treatment strategy.
In recent years, various biomarkers have been developed to assist in the selection of anticancer agents [6,7], including PD-L1 expression [8,9], tumor mutation burden [10], interferon-γ signature [11], and the tumor microenvironment [12]. However, most of these biomarkers are research-based and unsuitable for clinical application. By contrast, several inflammatory and nutritional biomarkers have been reported to be associated with prognosis [13,14,15,16,17]. In particular, the neutrophil-to-lymphocyte ratio (NLR) is a well-known biomarker that has been reported to be an independent prognostic factor in head and neck cancer [18]. In addition, many inflammatory and nutritional biomarkers that can be easily measured from blood tests, such as the platelet-to-lymphocyte ratio (PLR) [19,20], lymphocyte-to-monocyte ratio (LMR) [21], systemic immune-inflammation index (SII) [22,23], CRP-to-Alb ratio (CAR) [24,25], the controlling nutritional status (CONUT) score [14,26], prognostic nutrition index (PNI) [27,28], prognostic index (PI) [29], and the Glasgow Prognostic Score (GPS) [13], have been reported to be useful for predicting prognosis after treatment in head and neck and other cancers [19,20,24,25,30]. However, it is unclear which biomarkers best predict prognosis after ICI treatment, and their prognostic value in RMHNSCC has not been thoroughly investigated.
Therefore, this study aimed to determine the prognostic value of inflammatory and nutritional biomarkers, the levels of which can be measured by blood analysis in the treatment of RMHNSCC with ICIs, and to identify the most useful factor for prognosis assessment.

2. Materials and Methods

2.1. Patient and Data Collection

We retrospectively reviewed the medical records of patients with RMHNSCC who underwent ICI therapy at Tokai University Hospital in Kanagawa, Japan, from April 2017 to June 2022. Patients were included if they had an Eastern Cooperative Oncology Group (ECOG) performance status (PS) of 0–2, had received at least one cycle of immunotherapy, had adequate organ function, and could undergo imaging analysis or be clinically evaluated after ICI therapy. Nivolumab was administered to patients every two weeks at 3 mg/kg of body weight or 240 mg/body doses. Pembrolizumab was administered at a dose of 200 mg every three weeks. The ICI was selected at our multidisciplinary head and neck cancer conference based on each patient’s condition. In principle, nivolumab was indicated for the treatment of platinum-refractory RMHNSCC, and pembrolizumab was indicated for the first-line treatment of RMHNSCC or platinum-sensitive RMHNSCC. ICIs were continued until disease progression or unacceptable toxicity was observed, and patients were followed up until death or the cutoff date (31 May 2022).
The clinical response to treatment was assessed every 4–12 weeks using computed tomography. Tumor response was evaluated using the Response Evaluation Criteria in Solid Tumors (RECIST) version 1.1. The objective response rate (ORR) was defined as the percentage of patients who achieved a complete response (CR) or a partial response (PR) as the best response. The disease control rate (DCR) was defined as the percentage of patients with CR, PR, or stable disease (SD) as the best response. OS was defined as the time from the start of treatment to the date of death, regardless of the cause or cutoff. Progression-free survival (PFS) was defined as the time from the start of treatment to the cutoff date when disease progression or death for any reason was no longer observed. The duration of response was defined as the time from the initial response (CR, PR, or SD) to the start of disease progression (PD).
Adverse events were recorded using the National Cancer Institute Common Terminology Criteria for Adverse Events version 5.0.
The Institutional Review Board of Tokai University Hospital (22R200) approved this study, which was conducted according to the principles of the Declaration of Helsinki. Furthermore, a requirement for informed consent was waived because this study is a retrospective analysis of existing administrative and clinical data. This manuscript was prepared following the Guidelines for Recommendations for Reporting Tumor Marker Prognostic Studies [31], as appropriate.

2.2. Definitions of Inflammatory and Nutritional Biomarkers

Albumin (Alb), a C-reactive protein (CRP), total cholesterol levels in serum and leucocyte, including neutrophil, lymphocyte, and monocyte, and platelet counts in peripheral blood were determined through blood analysis before the initiation of ICI therapy. Based on these results, the values of the following parameters were calculated: PLR, the ratio of platelet count to lymphocyte count; NLR, the ratio of neutrophil count to lymphocyte count; LMR, the ratio of lymphocyte count to monocyte count; SII, which is the neutrophil count × platelet count/total lymphocyte count; CAR, the ratio of the serum CRP level to serum Alb level; CONUT score, which is calculated using the serum Alb level, the total lymphocyte count, and total cholesterol level; PNI, which is 10 × serum Alb level + 0.005 × total lymphocyte count; PI, measured using the serum CRP level and leucocyte count: A CRP level > 1 mg/dL was given a score of 1, whereas a CRP level ≤ 1 mg/dL was defined as a score of 0; and GPS was measured using the serum CRP level and serum Alb level: A CRP level > 1.0 mg/dL and Alb level < 3.5 g/dL were given a score of 2, a CRP level > 1.0 mg/dL or Alb level < 3.5 g/dL was given a score of 1, and a CRP level ≤ 1.0 mg/dL and Alb level ≥ 3.5 g/dL were given a score of 0.

2.3. Statistical Analysis

OS and PFS were estimated using the Kaplan–Meier method and evaluated using the log-rank test. The association between ORR and each factor was assessed using the univariate and multivariate logistic regression models. The cutoff values for inflammatory and nutritional biomarkers were determined using survival Classification and Regression Tree (CART) analysis (https://cran.r-project.org/web/packages/survival/index.html (accessed on 12 Febrary 2023) and https://cran.r-project.org/web/packages/rpart/index.html (accessed on 12 Febrary 2023)) for each biomarker. The biomarkers for which results were not output by CART underwent the performance of a receiver operating characteristic (ROC) curve for OS after 12 months from the start of treatment, which identified the optimal cutoff value that had the highest sensitivity and specificity. Each biomarker was classified into two groups (high and low) by cutoff value. A Cox regression model was used to analyze the relationship between inflammatory and nutritional biomarker levels associated with OS and PFS. A multivariate analysis was performed after adjusting for age. In addition, to identify the inflammatory and nutritional biomarkers most related to OS in machine learning models, the survival CART and random survival forest (RSF) analyses [32] were conducted.
Furthermore, RSF was utilized to obtain the survival probabilities of each patient, and those with a predicted survival probability of 50% or higher at 24 months were classified as the high survival rate group, while those with less were deemed as the low survival rate group. A comparison of the overall survival rates between the two groups was conducted through a log-rank test. Finally, we computed the concordance index (c-index) for both the RSF and Cox regression model to compare the accuracy of the predictive model. Logistic regression models, cox regression model, CART, and RSF were performed using R software (ver. 4.2.2; https://www.R-project.org (accessed on 1 December 2022)). Survival probabilities and the c-index were obtained using the R-powered data tool Exploratory v6.12.2 (https::/exploratory.io (accessed on 10 March 2023)). Other statistical analyses were performed using GraphPad Prism 8 software (GraphPad Software Inc., San Diego, CA, USA). A statistically significant correlation was set at p < 0.05; a significant trend was defined as a p < 0.1.

3. Results

3.1. Patient Characteristics

From June 2017 to June 2022, 109 patients with RMHNSCC were treated with ICI treatment. Seven patients were excluded from the study because their general condition deteriorated or therapy was discontinued at the patient’s request before the first evaluation. Finally, 102 patients were enrolled in this study. The median follow-up time from ICI initiation was 13.5 months (interquartile range: 6–22). Their characteristics are summarized in Table 1. There were 93 men and nine women with a median age of 70 (47–87) years. The primary site was the hypopharynx in 40 patients, the oropharynx in 24 patients, the larynx in 12 patients, the oral cavity in 8 patients, the nasopharynx in 6 patients, and other sites in 12 patients. The ECOG PS was 0–1 in 100 patients and 2 in 2 patients. Locoregional recurrence was evident in 71 patients, distant metastases in 32 patients, and both locoregional recurrence and distant metastases in 10 patients for the evaluated disease sites. ICIs were the first line of treatment in 11 patients, the second line in 47 patients, the third line in 36 patients, and the fourth line in 8 patients. The type of ICIs was nivolumab in 76 patients and pembrolizumab in 26 patients. Prior to receiving ICI therapy, 31 patients underwent surgery, 77 patients received radiotherapy, 81 patients underwent chemotherapy, and 16 patients received cetuximab. Of the patients who received these prior treatments, 20 experienced treatment-induced immune-related adverse events, while 82 did not. There was no apparent unbalance in the patient distribution by cutoffs for each inflammatory and nutritional biomarker.

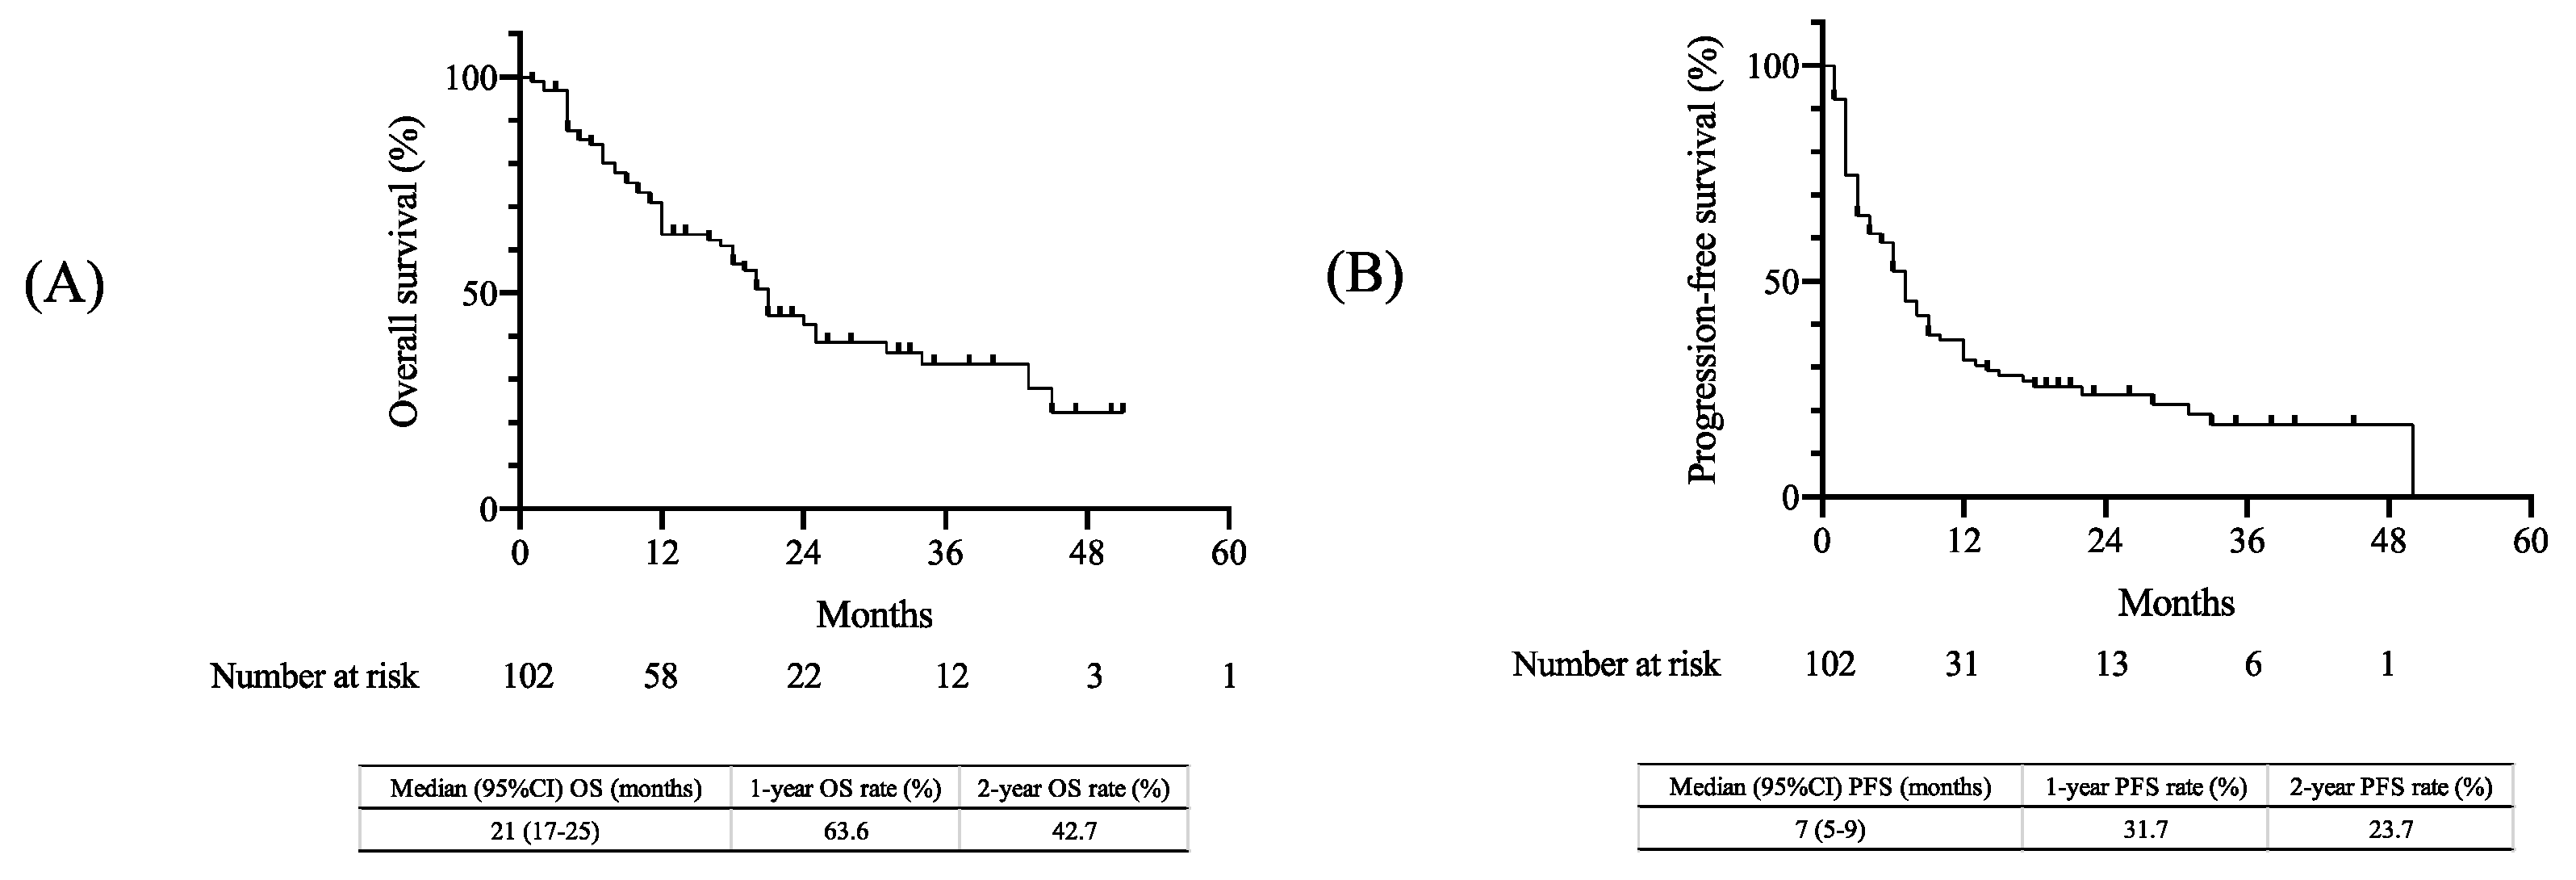
3.2. Treatment Outcomes

OS and PFS were estimated using the Kaplan–Meier method (Figure 1). The median OS was 21 months (95% confidence interval [CI], 17–25 months), with 1-year and 2-year OS rates of 63.6% and 42.7%, respectively (Figure 1A). Additionally, the median PFS was estimated to be seven months (95% CI, 5–9 months), with 1-year and 2-year PFS rates of 31.7% and 23.7%, respectively (Figure 1B).
The treatment response was evaluated using RECIST version 1.1. (Table 2). Among the 102 patients evaluated, a complete response (CR) was observed in 16 patients (15.7%), and a partial response (PR) was achieved in 38 patients (37.3%). A stable disease (SD) was noted in 22 patients (21.6%), and a progressive disease (PD) was observed in 26 patients (25.5%). The ORR (CR+ PR) was 52.9%, and the DCR (CR+ PR+ SD) was 74.5%.

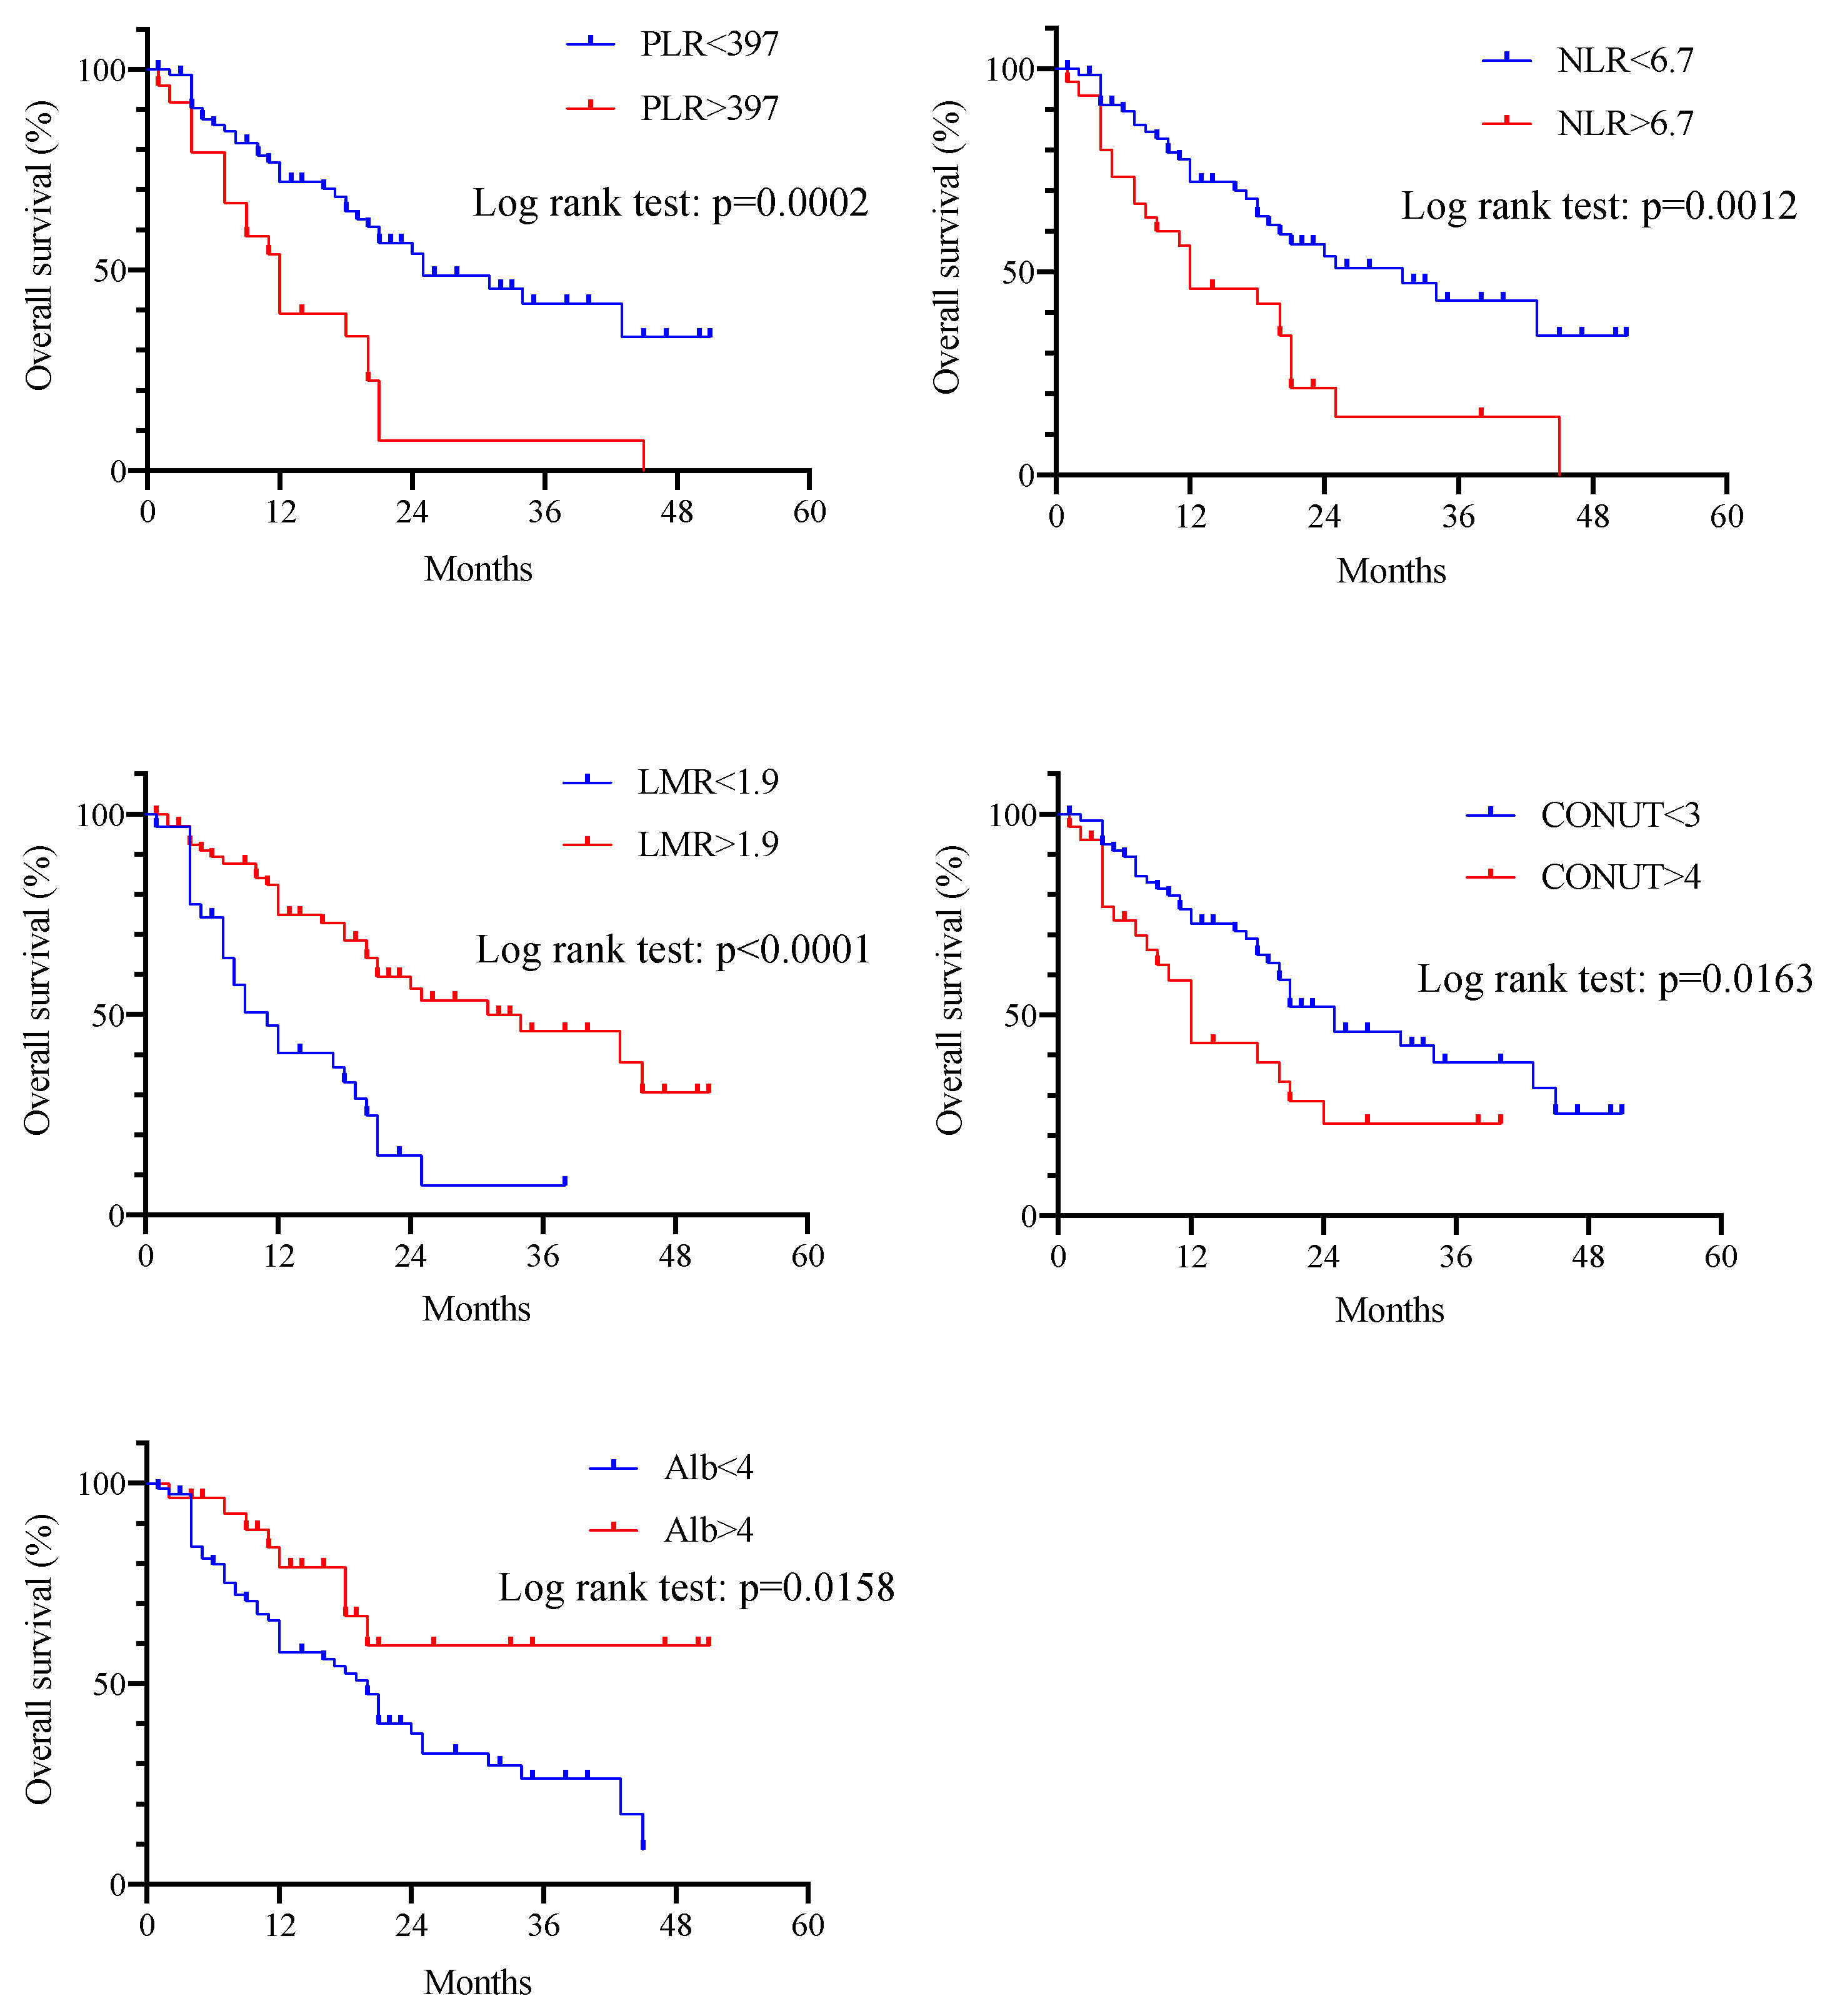
3.3. Analysis of Inflammatory and Nutritional Biomarkers

The results of ORR and DCR associated with inflammation and nutritional biomarkers in ICI therapy are shown in Table 3. Regarding the determination of cutoff values, each biomarker was initially analyzed using CART, and cutoff values was output for PLR, LMR, and GPS. Cutoff values for the remaining NLR, SII, CAR, CONUT, PNI, PI, BMI, Alb, CRP, and BMI were determined using ROC curves. The cutoff values for each biomarker were as follows: age: 70 years, PLR: 397, NLR: 6.7, LMR: 1.88, SII: 107.5, CAR: 0.14, CONUT score: 3, PNI: 37.7, PI: 0, GPS: 0, body mass index (BMI): 20 kg/m2, Alb level: 4.1 g/dL, and CRP level: 0.89 mg/dL. No significant correlation was found between any factor and ORR. Regarding the analysis of DCR and each biomarker, significant correlations were observed between PLR, SII, and CAR in the univariate analysis. However, in the multivariate analysis, no significant differences were observed.
Table 4 shows the cox regression analysis of inflammatory and nutritional biomarkers associated with OS and PFS in patients undergoing ICI therapy. The analysis of OS and inflammatory and nutritional biomarkers showed significant correlations of OS with the Alb level, CRP level, PLR, NLR, LMR, SII, and CONUT score. In addition, multivariate analysis demonstrated that LMR was significantly correlated with OS. In the analysis of PFS and included factors, significant correlations were observed between the PFS and Alb level, CRP level, PLR, NLR, LMR, CONUT score, PNI, and GPS. Multivariate analysis showed no significant correlation; however, a significant trend in the Alb level was observed.
Figure 2 shows the results of Kaplan–Meier survival curves and the log-rank tests of cutoff values for the Alb level, PLR, NLR, LMR, and CONUT score, which were highly correlated with OS by the cox regression model. There were significant differences in OS between the two groups for each biomarker. Among them, the LMR had the lowest p-value in the log-rank test.
PLR, platelet to lymphocyte ratio; NLR, neutrophil to lymphocyte ratio; LMR, lymphocyte to monocyte ratio; CONUT, controlling nutritional status; Alb, albumin

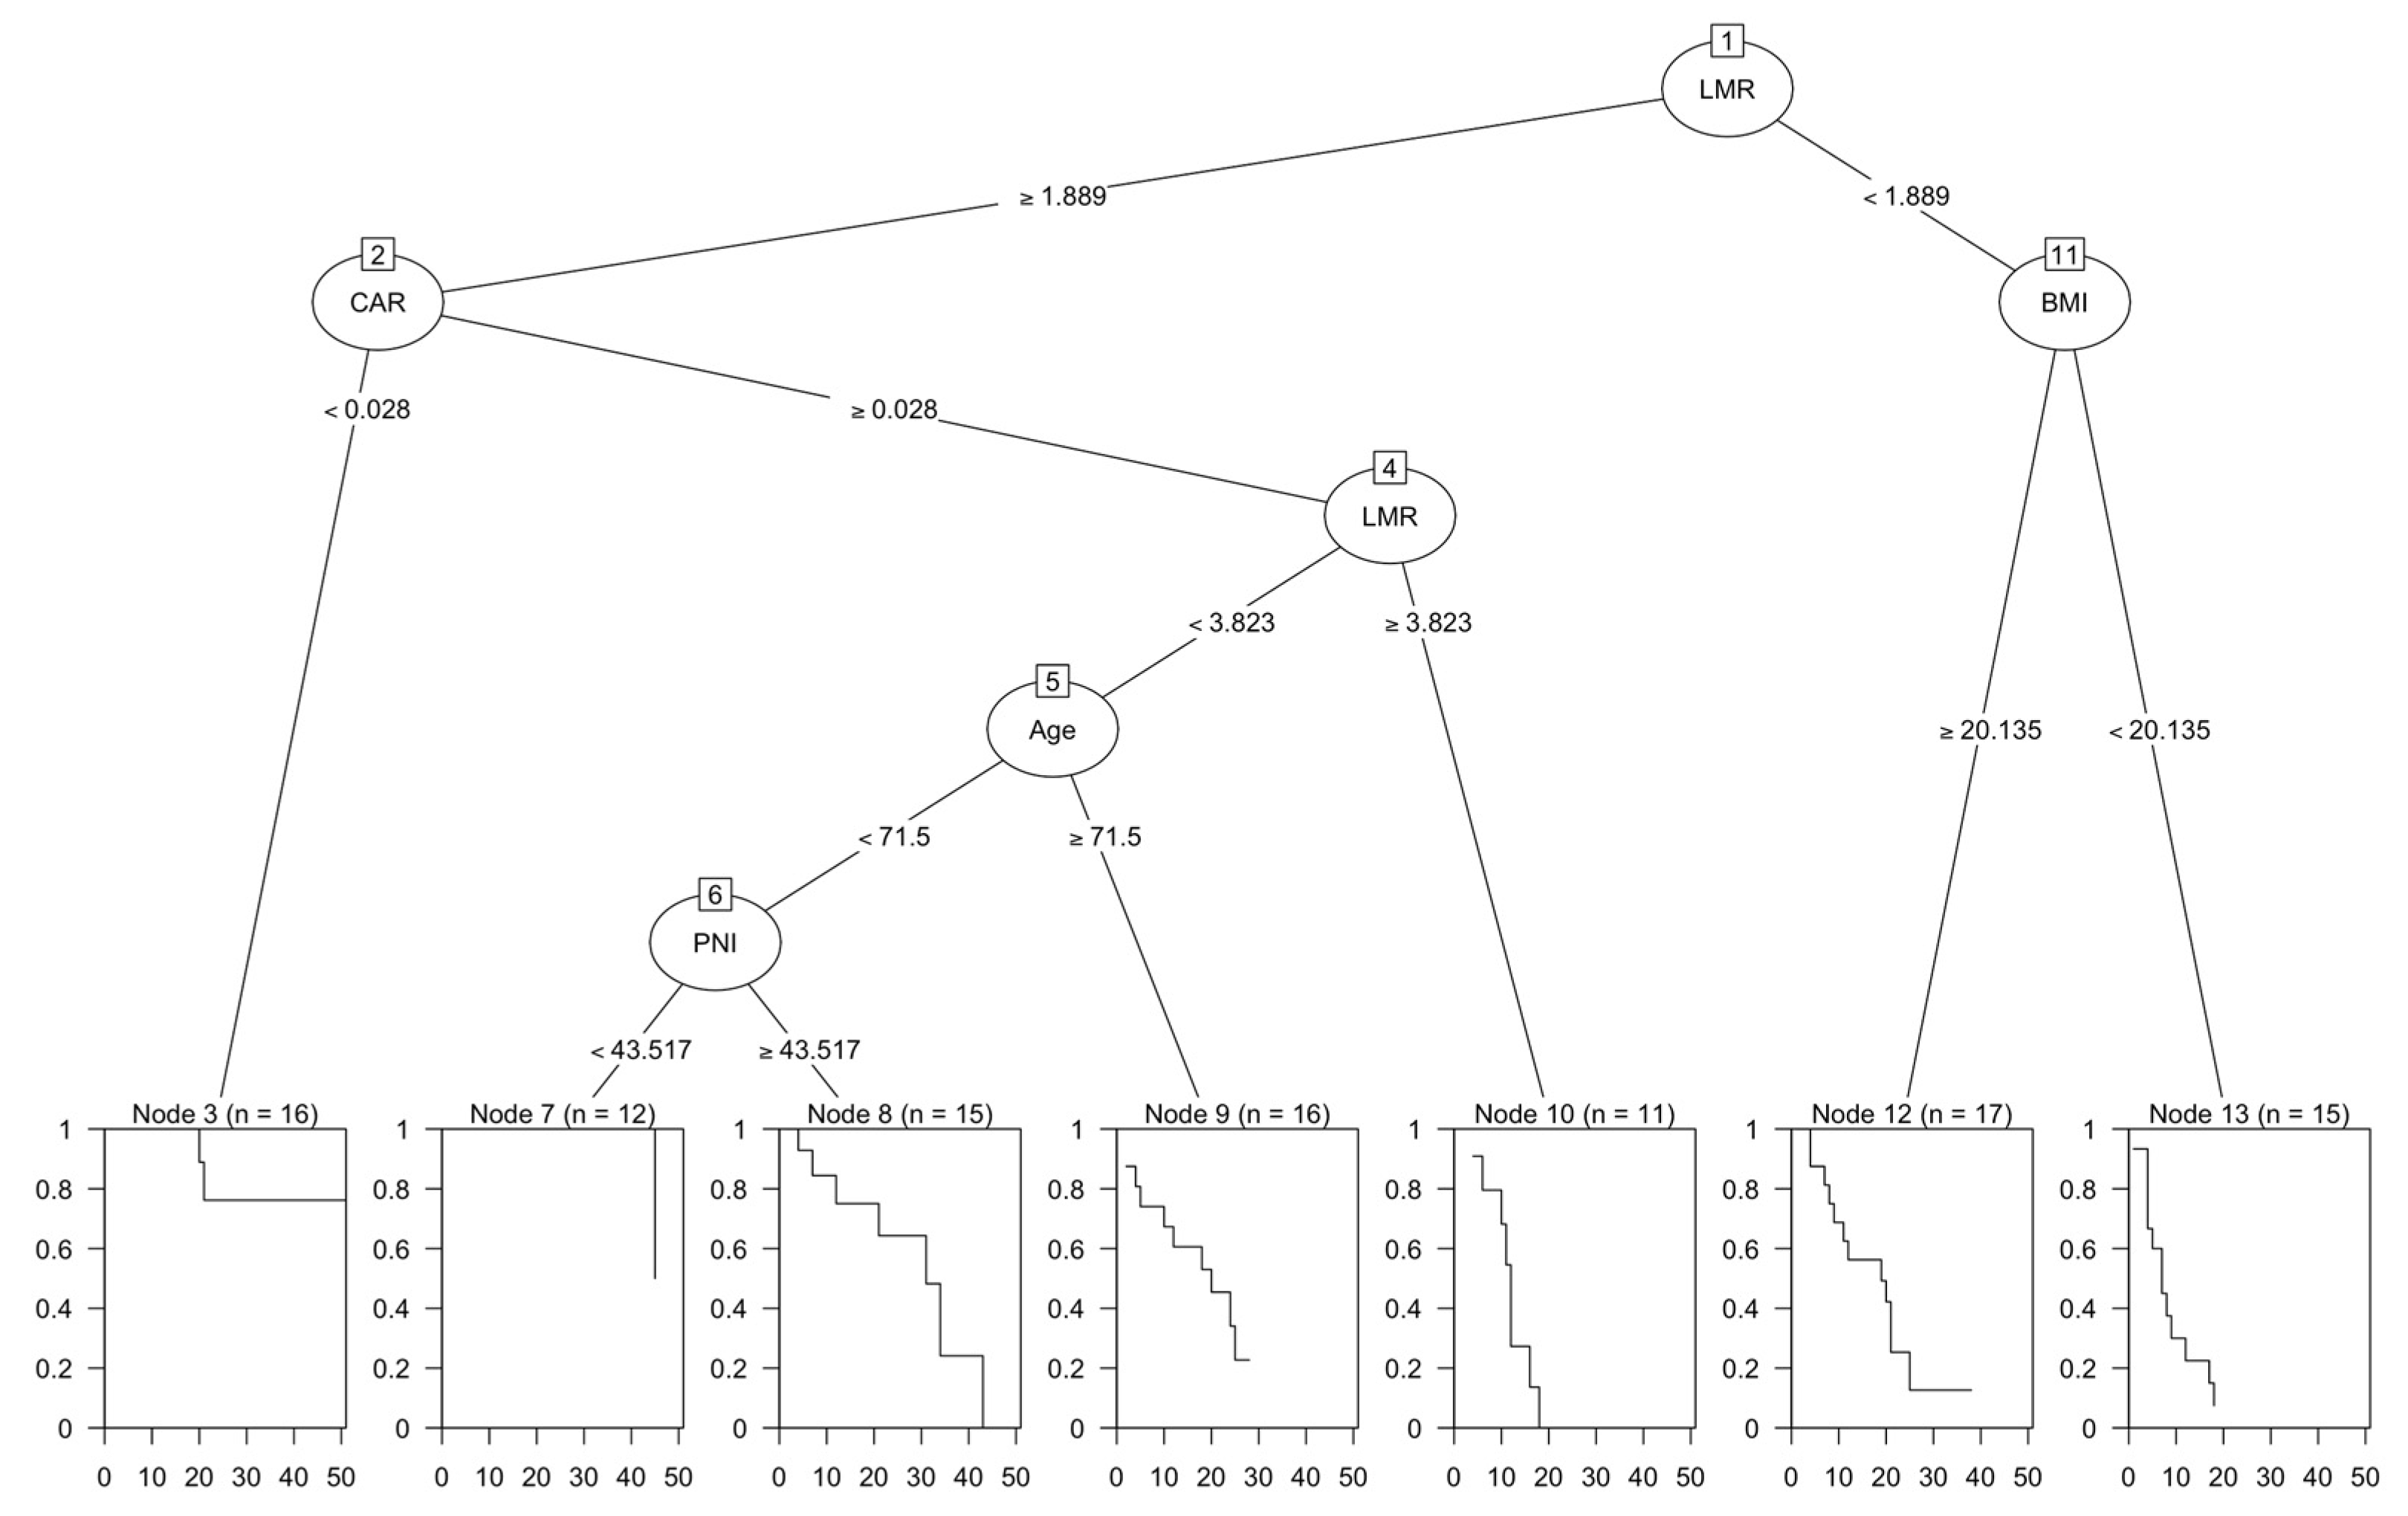
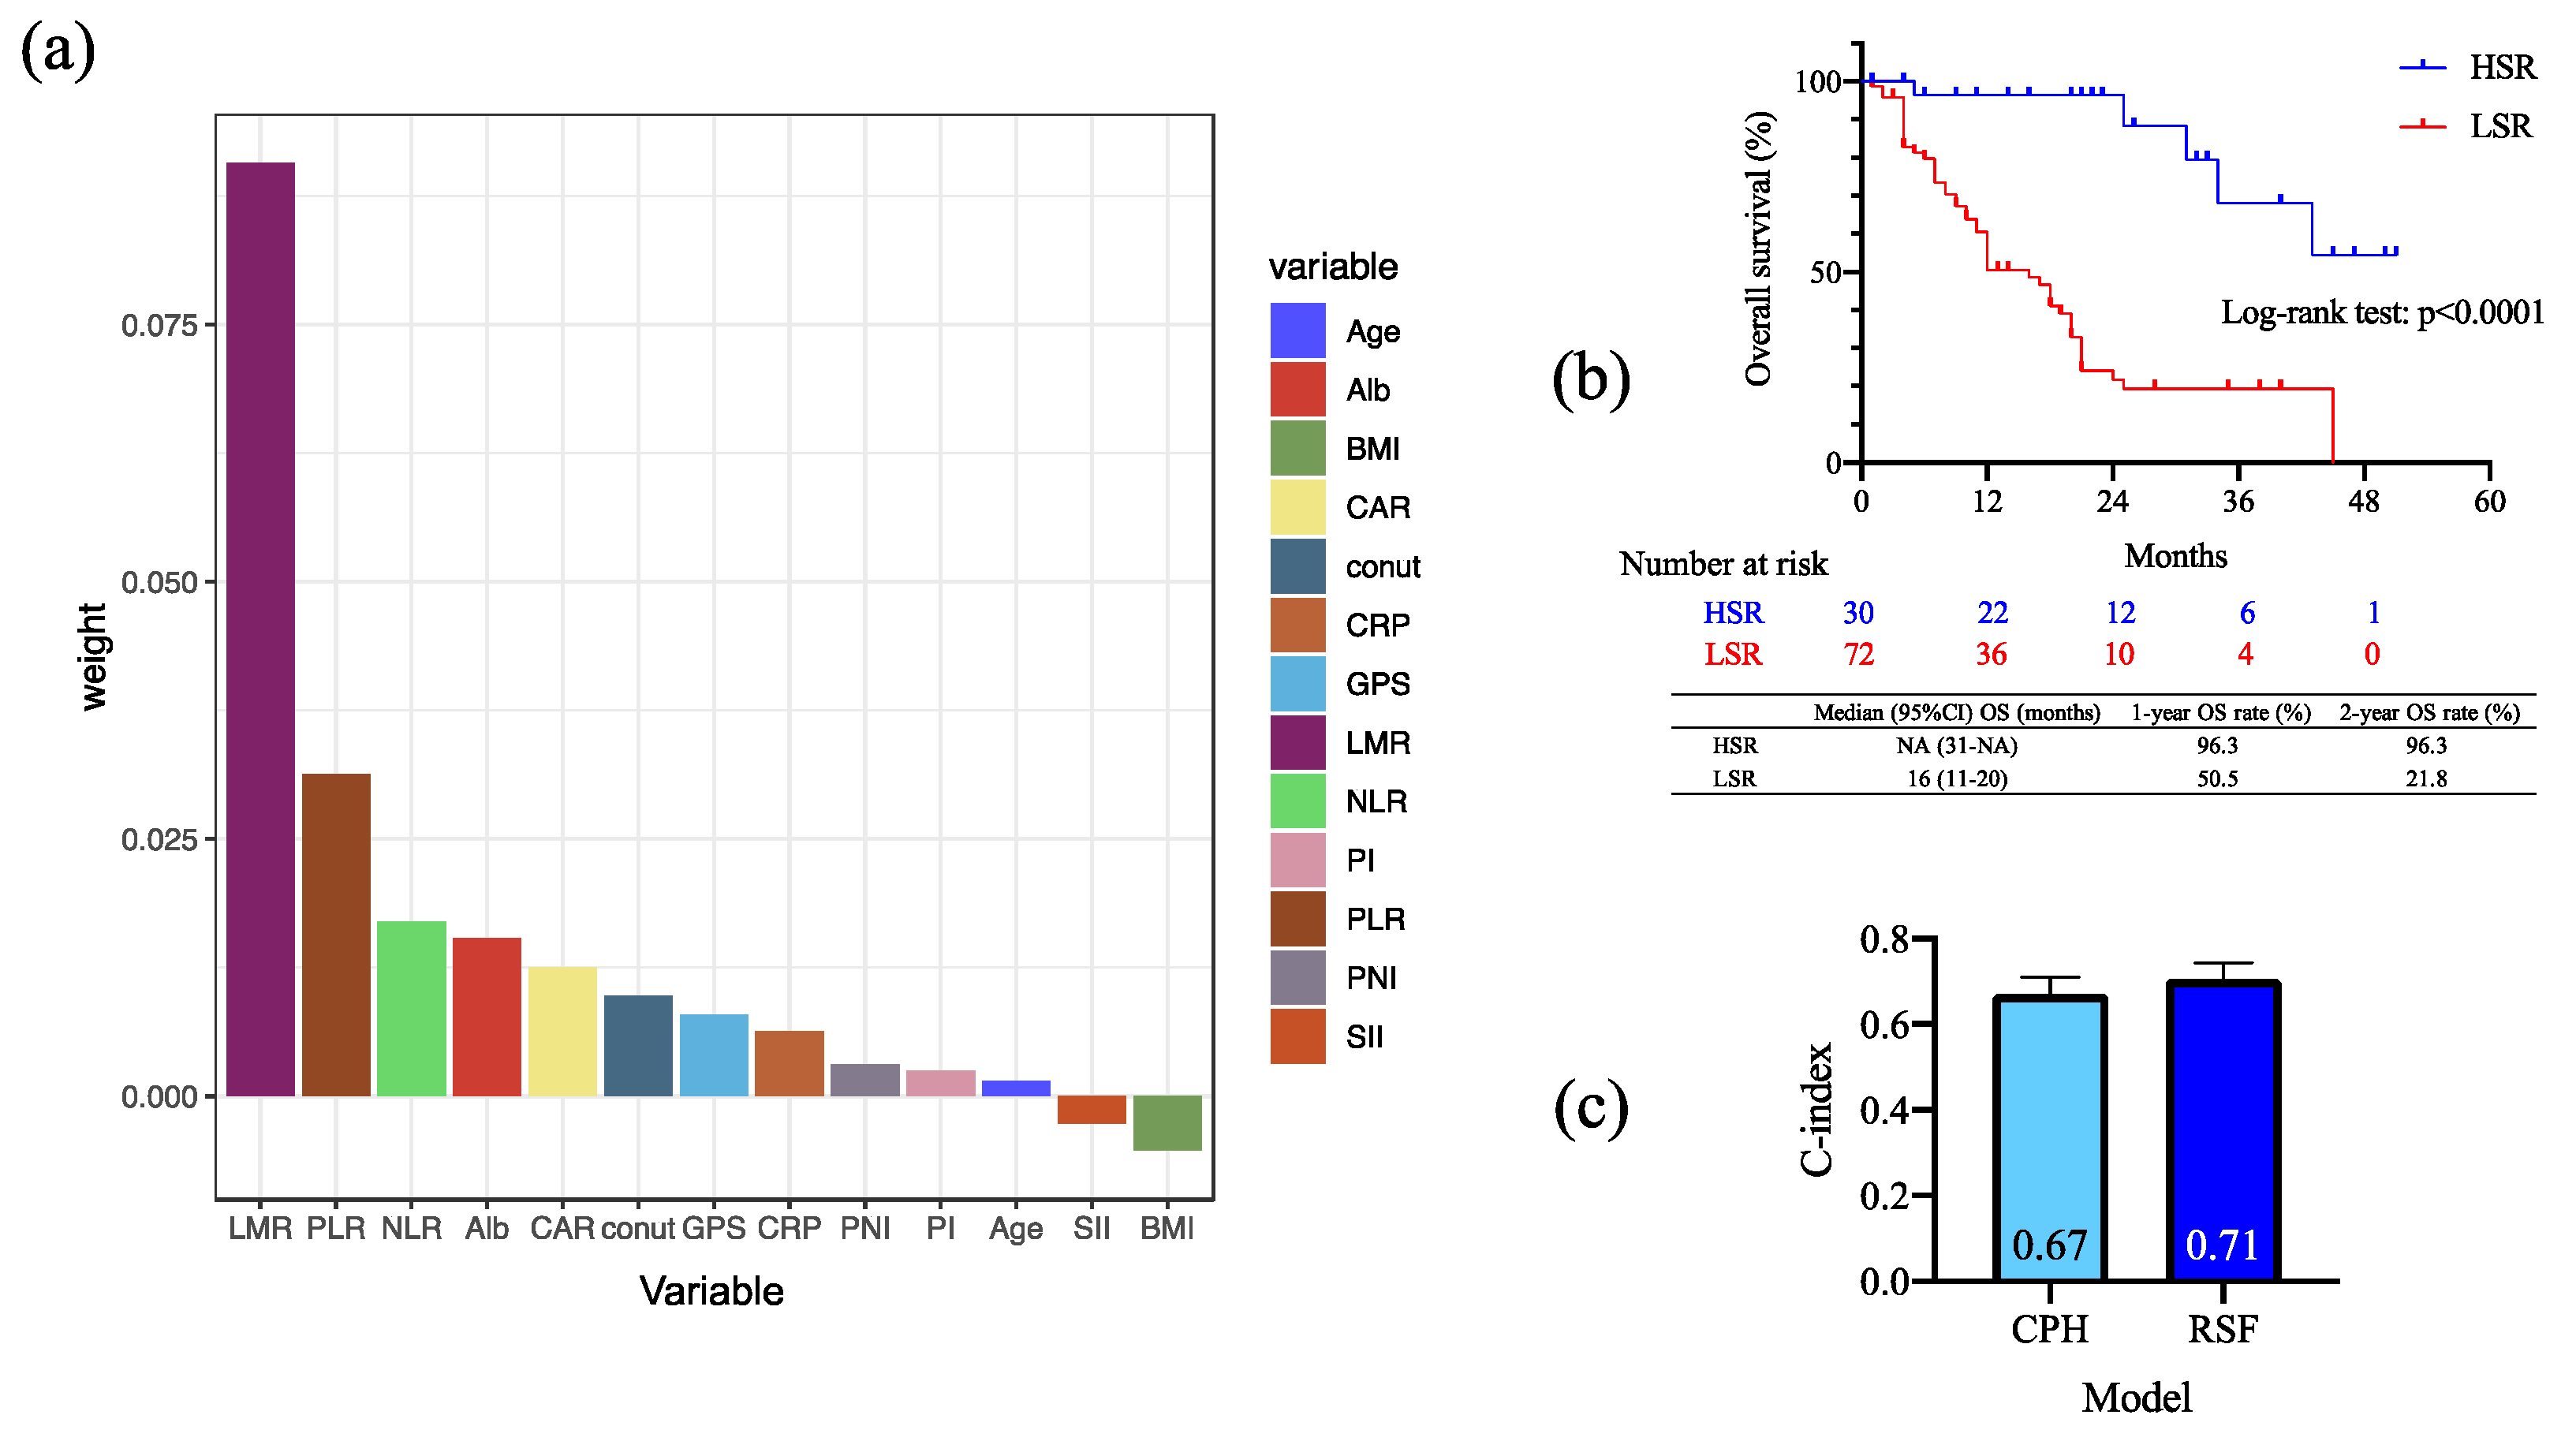
3.4. Importance of Inflammatory and Nutritional Biomarkers Using Machine Learning Models

The result of the survival CART analysis is shown in Figure 3. All biomarkers were entered into CART and analyzed. As a result, LMR, CAR, BMI, Age, and PNI were selected, and the results were output as shown. The root node was first divided based on LMR, with the result that LMR was the most important factor. For a high LMR, an interaction was found between CAR, age, PNI, and OS. For a low LMR, an interaction was found for BMI.
CART, Classification and Regression Tree; LMR, lymphocyte to monocyte ratio; CAR, C-reactive protein to albumin ratio; PNI, prognostic nutrition index; BMI, body mass index
Figure 4a shows the analysis results of the variable importance (VIMP) of included biomarkers by RSF. The VIMP was obtained by measuring the decrease in prediction accuracy when randomizing a particular variable. A higher VIMP meant that the variable contributed more to predictive accuracy. The RSF demonstrated that LMR was the most important biomarker in that model, similar to the Cox regression model and CART analysis results. Moreover, PLR, NLR, and Alb were the following important biomarkers that contributed to OS in ICI-treated patients. The result of OS between the high and low survival rates group based on the prediction model by RSF showed a significant difference between the two groups in the log-rank test. By comparing the c-index by model, RSF had a c-index of 0.71, while the cox proportional hazard model had a c-index of 0.67, which was slightly higher for RSF. However, the results show that the prediction accuracy was not high for both groups.
Alb, albumin level; BMI, body mass index; CAR, CAR, CRP to albumin ratio; CONUT, controlling nutritional status; CRP, C-reactive protein; GPS, Glasgow prognostic score; LMR, lymphocyte to monocyte ratio; NLR, neutrophil to lymphocyte ratio; PI, predictive index; PLR, platelet to lymphocyte ratio; PNI, prognostic nutrition index; SII, systemic immune-inflammation index; HSR, high survival rate group; LSR, low survival rate group; CPH, cox proportional hazard model; RSF, random survival forest.

4. Discussion

With the widespread use of immunotherapy in the management of head and neck cancer, treatment outcomes and prognosis are being elucidated [5,33,34,35,36,37,38]. According to the results of this study, the ORR and DCR were 52.9% and 74.5%, respectively. Moreover, the median OS was 21 (95% CI 17-25) months, with an estimated 12-month OS rate of 63.6%. The median PFS was 7 (95% CI 5-9) months, with an estimated 12-month PFS rate of 31.7%. These results are favorable compared to the results of other published reports. While differences in the type of ICIs could be a possible explanation, the results of subgroup analysis revealed no significant differences (Figure S1). Therefore, other factors could provide a more likely reason. Another factor that was considered was the patient’s PS. As a general rule, we only included cases with a PS of 0-1, and the proportion of subjects with a PS > 2 was lower than in other reports. This could be the cause of the favorable results obtained in this study. Many reports have shown that patients with poor PS have less efficacy in ICIs [39,40,41,42]. A poor PS may indicate a poor systemic status, but biomarkers as indicators of the systemic status have not been thoroughly investigated. To date, several inflammatory and nutritional biomarkers have been reported as useful in predicting the prognosis of various carcinomas [13,15,17,20,23,27,43] and head and neck cancers after treatment with ICIs [24,30,44]. However, the prognostic value of these factors in RMHNSCC has not been thoroughly investigated. Therefore, we examined the prognostic value of these factors in RMHNSCC.
In the analysis of the correlation between ORR with ICI therapy and inflammatory and nutritional biomarkers, no significant correlation was found between any factor and ORR. However, the correlation between DCR and the included factors showed a significant correlation with SII and significant trends with PLR, LMR, PNI, PI, and CRP levels. Khaki et al. [41] reported that patients with an ECOG PS ≥ 2 had an ORR with ICI that was similar to patients with an ECOG PS of 0 to 1, but this may not compensate for the negative prognostic value of a poor PSThis result, which is consistent with our results and shows that these inflammatory and nutritional biomarkers may be related to long-term prognosis, although they are less related to ORR.
Univariate analysis for the correlation between inflammatory and nutritional biomarkers and OS showed significant correlations of the Alb level, CRP level, PLR, NLR, LMR, SII, and CONUT score with OS, while multivariate analysis showed a significant correlation only between LMR and OS. In the analysis of PFS and the included factors, univariate analysis showed significant correlations with the Alb level, CRP level, PLR, NLR, LMR, CONUT score, PNI, and GPS. In contrast, multivariate analysis revealed no significant results. Moreover, Kaplan–Meier survival curves and log-rank tests using cutoff values for the Alb level, PLR, NLR, LMR, and CONUT score demonstrated significant differences between the two groups for each biomarker. The results of this study suggest that several inflammatory and nutritional biomarkers are associated with OS and PFS in patients with RMHNSCC. Still, LMR may be the most significant prognostic factor. As an inflammatory biomarker, monocytes have been shown to regulate tumor development, progression, and metastasis [45], while tumor-associated macrophages may promote tumor cell growth, migration, and metastasis [46]. Lymphocytes are a major component of the host immune system and can eliminate cancer cells and prevent tumor progression [47]. Therefore, relatively high monocyte counts and low lymphocyte counts may predict a poor prognosis.
Several reports have been published on LMR and the prognosis of patients with RMHNSCC [21,48,49]; Kano et al. [21] reported that pretreatment with LMR could be considered an independent prognostic factor in patients with laryngeal, nasopharyngeal, and hypopharyngeal cancer undergoing chemoradiotherapy. Aoyama et al. [48] reported that the combination of LMR and PS was useful as a prognostic marker in patients with RMHNSCC treated with the EXTREME regimen. The present results indicate that LMR is also a useful biomarker in patients with RMHNSCC treated using ICIs. Other inflammatory and nutritional biomarkers, such as NLR and PLR, have also been reported as useful biomarkers for ICI therapy [20,24,30,44], but the results vary across reports. Although no precise mechanism has been elucidated, all these factors are relevant to the prognosis of RMHNSCC. The levels of inflammatory biomarkers, including LMR and PLR, and nutritional biomarkers, such as the CONUT score and GPS, which can be easily measured in blood samples, may be useful prognostic biomarkers.
We performed survival CART and random survival forest analyses [32] as machine learning models to identify the most valuable biomarkers in patients with RMHNSCC when treated using ICIs. The survival CART is a decision tree-based method used for survival analysis. The survival CART aims to build a decision tree that predicts survival time or time to an event in individuals based on a set of predictor variables. Random survival forest is a machine learning method that combines multiple decision trees in an ensemble learning process to evaluate and visualize the importance of factors. It can also predict the effectiveness of cancer treatment and survival duration. Our study results reveal that LMR was the most potent contributor to OS in both models. Together, these results suggest that LMR may be the most beneficial biomarker in patients with RMHNSCC undergoing ICI therapy. In addition, we tested the predictive model of RSF by dividing patients into two groups based on their predicted survival rates to evaluate whether the model could make such predictions. The results showed a statistically significant difference in the log-rank test between high and low survival groups. These results suggest that the model can make certain predictions, but the accuracy of this prediction was not high, with a c-index of 0.7. The small number of patients and variability were considered the main reasons for this accuracy.
This study had several limitations. First, this was a single-center retrospective study that evaluated a small number of patients. Second, the use of chemotherapy after ICI therapy was not standardized and may have been subject to bias due to differing drug selections. Third, inflammatory and nutritional biomarkers must be interpreted cautiously because of the many factors involved. Finally, a large study is needed to elucidate the prognostic biomarkers of ICI treatment for RMHNSCC in the future. As a result, the prognostic impact of biomarkers that differ across reports needs to be homogenized, and machine learning models should enable prognosis prediction.

5. Conclusions

We evaluated the prognostic value of inflammatory and nutritional biomarkers of ICI treatment for RMHNSCC. These biomarkers did not correlate with ORR but correlated with DCR. Univariate analysis showed significant correlations between the Alb level, CRP level, PLR, NLR, LMR, SII, CONUT score, and OS. Additionally, multivariate analysis showed that LMR was significantly correlated with OS. LMR was the most important biomarker, according to the machine learning model. This study suggests that LMR may be the most useful biomarker for predicting the prognosis of ICI treatment for RMHNSCC.

Supplementary Materials

The following supporting information can be downloaded at: https://www.mdpi.com/article/10.3390/cancers15072021/s1, Figure S1: Kaplan–Meier curves of overall survival (A) and progression-free survival (B) according to the immune checkpoint inhibitors.

Author Contributions

Conceptualization, A.S. and H.I.; methodology, A.S.; validation, A.S., H.I. and K.O.; formal analysis, A.S.; investigation, A.S.; resources, A.S., K.E., M.Y., T.T., A.Y., T.W., T.I., D.M., and K.O.; data curation, A.S.; writing—original draft preparation, A.S.; writing—review and editing, AS; visualization, A.S.; supervision, K.O.; project administration, A.S. All authors have read and agreed to the published version of the manuscript.

Funding

This research was funded by Institutional Research Facilitation Fund (22F-144100).

Institutional Review Board Statement

This study was conducted in accordance with the Declaration of Helsinki and approved by the Institutional Review Board of Tokai University Hospital (22R200).

Informed Consent Statement

Patient consent was waived due to the study’s retrospective nature.

Data Availability Statement

All relevant data have been presented in this manuscript.

Conflicts of Interest

The authors declare no conflict of interest.

References

  1. Warnakulasuriya, S. Global epidemiology of oral and oropharyngeal cancer. Oral Oncol. 2009, 45, 309–316. [Google Scholar] [CrossRef] [PubMed]
  2. Ferris, R.L.; Blumenschein, G., Jr.; Fayette, J.; Guigay, J.; Colevas, A.D.; Licitra, L.; Harrington, K.; Kasper, S.; Vokes, E.E.; Even, C.; et al. Nivolumab for Recurrent Squamous-Cell Carcinoma of the Head and Neck. N. Engl. J. Med. 2016, 375, 1856–1867. [Google Scholar] [CrossRef] [PubMed] [Green Version]
  3. Burtness, B.; Harrington, K.J.; Greil, R.; Soulieres, D.; Tahara, M.; de Castro, G., Jr.; Psyrri, A.; Baste, N.; Neupane, P.; Bratland, A.; et al. Pembrolizumab alone or with chemotherapy versus cetuximab with chemotherapy for recurrent or metastatic squamous cell carcinoma of the head and neck (KEYNOTE-048): A randomized, open-label, phase 3 study. Lancet 2019, 394, 1915–1928. [Google Scholar] [CrossRef]
  4. Matsuo, M.; Yasumatsu, R.; Masuda, M.; Toh, S.; Wakasaki, T.; Hashimoto, K.; Taura, M.; Uchi, R.; Nakagawa, T. Relationship between immune-related adverse events and the long-term outcomes in recurrent/metastatic head and neck squamous cell carcinoma treated with nivolumab. Oral Oncol. 2020, 101, 104525. [Google Scholar] [CrossRef]
  5. Matsuki, T.; Okamoto, I.; Fushimi, C.; Takahashi, H.; Okada, T.; Kondo, T.; Sato, H.; Ito, T.; Tokashiki, K.; Tsukahara, K.; et al. Real-World, Long-Term Outcomes of Nivolumab Therapy for Recurrent or Metastatic Squamous Cell Carcinoma of the Head and Neck and Impact of the Magnitude of Best Overall Response: A Retrospective Multicenter Study of 88 Patients. Cancers 2020, 12, 3427. [Google Scholar] [CrossRef]
  6. Biomarkers Definitions Working Group. Biomarkers and surrogate endpoints: Preferred definitions and conceptual framework. Clin. Pharmacol. Ther. 2001, 69, 89–95. [Google Scholar] [CrossRef]
  7. Gavrielatou, N.; Doumas, S.; Economopoulou, P.; Foukas, P.G.; Psyrri, A. Biomarkers for immunotherapy response in head and neck cancer. Cancer Treat. Rev. 2020, 84, 101977. [Google Scholar] [CrossRef]
  8. Cohen, E.E.W.; Bell, R.B.; Bifulco, C.B.; Burtness, B.; Gillison, M.L.; Harrington, K.J.; Le, Q.T.; Lee, N.Y.; Leidner, R.; Lewis, R.L.; et al. The Society for Immunotherapy of Cancer consensus statement on immunotherapy for the treatment of squamous cell carcinoma of the head and neck (HNSCC). J. Immunother. Cancer 2019, 7, 184. [Google Scholar] [CrossRef] [Green Version]
  9. Patel, S.P.; Kurzrock, R. PD-L1 Expression as a Predictive Biomarker in Cancer Immunotherapy. Mol. Cancer Ther. 2015, 14, 847–856. [Google Scholar] [CrossRef] [Green Version]
  10. Cristescu, R.; Mogg, R.; Ayers, M.; Albright, A.; Murphy, E.; Yearley, J.; Sher, X.; Liu, X.Q.; Lu, H.; Nebozhyn, M.; et al. Pan-tumor genomic biomarkers for PD-1 checkpoint blockade-based immunotherapy. Science 2018, 362, eaar3593. [Google Scholar] [CrossRef] [PubMed] [Green Version]
  11. Seiwert, T.Y.; Burtness, B.; Mehra, R.; Weiss, J.; Berger, R.; Eder, J.P.; Heath, K.; McClanahan, T.; Lunceford, J.; Gause, C.; et al. Safety and clinical activity of pembrolizumab for treatment of recurrent or metastatic squamous cell carcinoma of the head and neck (KEYNOTE-012): An open-label, multicentre, phase 1b trial. Lancet Oncol. 2016, 17, 956–965. [Google Scholar] [CrossRef] [PubMed]
  12. Davis, R.J.; Van Waes, C.; Allen, C.T. Overcoming barriers to effective immunotherapy: MDSCs, TAMs, and Tregs as mediators of the immunosuppressive microenvironment in head and neck cancer. Oral Oncol. 2016, 58, 59–70. [Google Scholar] [CrossRef] [PubMed] [Green Version]
  13. Forrest, L.M.; McMillan, D.C.; McArdle, C.S.; Angerson, W.J.; Dunlop, D.J. Evaluation of cumulative prognostic scores based on the systemic inflammatory response in patients with inoperable non-small-cell lung cancer. Br. J. Cancer 2003, 89, 1028–1030. [Google Scholar] [CrossRef] [PubMed] [Green Version]
  14. Lin, Q.; Li, C.; Lin, X.; Lin, S.; Chen, W.; Chen, X.; Huang, X.; Wang, D. Prognostic Value of Controlling Nutritional Status Score in Advanced Hypopharyngeal Cancer. Laryngoscope 2023, 1–8. [Google Scholar] [CrossRef]
  15. Onodera, T.; Goseki, N.; Kosaki, G. Prognostic nutritional index in gastrointestinal surgery of malnourished cancer patients. Nihon Geka Gakkai Zasshi 1984, 85, 1001–1005. [Google Scholar]
  16. Luo, Z.; Zhou, L.; Balde, A.I.; Li, Z.; He, L.; ZhenWei, C.; Zou, Z.; Huang, S.; Han, S.; Wei Zhou, M.; et al. Prognostic impact of preoperative prognostic nutritional index in resected advanced gastric cancer: A multicenter propensity score analysis. Eur. J. Surg. Oncol. 2019, 45, 425–431. [Google Scholar] [CrossRef] [PubMed]
  17. Tokunaga, R.; Sakamoto, Y.; Nakagawa, S.; Ohuchi, M.; Izumi, D.; Kosumi, K.; Taki, K.; Higashi, T.; Miyamoto, Y.; Yoshida, N.; et al. CONUT: A novel independent predictive score for colorectal cancer patients undergoing potentially curative resection. Int. J. Color. Dis. 2017, 32, 99–106. [Google Scholar] [CrossRef]
  18. Mariani, P.; Russo, D.; Maisto, M.; Troiano, G.; Caponio, V.C.A.; Annunziata, M.; Laino, L. Pretreatment neutrophil-to-lymphocyte ratio is an independent prognostic factor in head and neck squamous cell carcinoma: Meta-analysis and trial sequential analysis. J. Oral. Pathol. Med. 2022, 51, 39–51. [Google Scholar] [CrossRef]
  19. Diem, S.; Schmid, S.; Krapf, M.; Flatz, L.; Born, D.; Jochum, W.; Templeton, A.J.; Fruh, M. Neutrophil-to-Lymphocyte ratio (NLR) and Platelet-to-Lymphocyte ratio (PLR) as prognostic markers in patients with non-small cell lung cancer (NSCLC) treated with nivolumab. Lung Cancer 2017, 111, 176–181. [Google Scholar] [CrossRef] [PubMed]
  20. Xu, H.; He, A.; Liu, A.; Tong, W.; Cao, D. Evaluation of the prognostic role of platelet-lymphocyte ratio in cancer patients treated with immune checkpoint inhibitors: A systematic review and meta-analysis. Int. Immunopharmacol. 2019, 77, 105957. [Google Scholar] [CrossRef]
  21. Kano, S.; Homma, A.; Hatakeyama, H.; Mizumachi, T.; Sakashita, T.; Kakizaki, T.; Fukuda, S. Pretreatment lymphocyte-to-monocyte ratio as an independent prognostic factor for head and neck cancer. Head Neck 2017, 39, 247–253. [Google Scholar] [CrossRef] [PubMed] [Green Version]
  22. Hu, B.; Yang, X.R.; Xu, Y.; Sun, Y.F.; Sun, C.; Guo, W.; Zhang, X.; Wang, W.M.; Qiu, S.J.; Zhou, J.; et al. Systemic immune-inflammation index predicts prognosis of patients after curative resection for hepatocellular carcinoma. Clin. Cancer Res. 2014, 20, 6212–6222. [Google Scholar] [CrossRef] [Green Version]
  23. Wang, Y.T.; Kuo, L.T.; Weng, H.H.; Hsu, C.M.; Tsai, M.S.; Chang, G.H.; Lee, Y.C.; Huang, E.I.; Tsai, Y.T. Systemic Immun e-Inflammation Index as a Predictor for Head and Neck Cancer Prognosis: A Meta-Analysis. Front. Oncol. 2022, 12, 899518. [Google Scholar] [CrossRef] [PubMed]
  24. Tanoue, K.; Tamura, S.; Kusaba, H.; Shinohara, Y.; Ito, M.; Tsuchihashi, K.; Shirakawa, T.; Otsuka, T.; Ohmura, H.; Isobe, T.; et al. Predictive impact of C-reactive protein to albumin ratio for recurrent or metastatic head and neck squamous cell carcinoma receiving nivolumab. Sci. Rep. 2021, 11, 2741. [Google Scholar] [CrossRef] [PubMed]
  25. Ikoma, T.; Shimokawa, M.; Matsumoto, T.; Boku, S.; Yasuda, T.; Shibata, N.; Kurioka, Y.; Takatani, M.; Nobuhisa, T.; Namikawa, T.; et al. Inflammatory prognostic factors in advanced or recurrent esophageal squamous cell carcinoma treated with nivolumab. Cancer Immunol. Immunother. 2022, 72, 427–435. [Google Scholar] [CrossRef]
  26. Ignacio de Ulíbarri, J.; González-Madroño, A.; de Villar, N.G.; González, P.; González, B.; Mancha, A.; Rodríguez, F.; Fernández, G. CONUT: A tool for controlling nutritional status. First validation in a hospital population. Nutr. Hosp. 2005, 20, 38–45. [Google Scholar] [PubMed]
  27. Migita, K.; Matsumoto, S.; Wakatsuki, K.; Ito, M.; Kunishige, T.; Nakade, H.; Kitano, M.; Nakatani, M.; Sho, M. The prognostic significance of inflammation-based markers in patients with recurrent gastric cancer. Surg. Today 2018, 48, 282–291. [Google Scholar] [CrossRef] [PubMed]
  28. Jiang, C.; Xiu, Y.; Zhang, S.; Yu, X.; Qiao, K.; Huang, Y. A Novel Inflammatory and Nutritional Prognostic Scoring System for Nonpathological Complete Response Breast Cancer Patients Undergoing Neoadjuvant Chemotherapy. Dis. Markers 2022, 2022, 8044550. [Google Scholar] [CrossRef]
  29. Kasymjanova, G.; MacDonald, N.; Agulnik, J.S.; Cohen, V.; Pepe, C.; Kreisman, H.; Sharma, R.; Small, D. The predictive value of pretreatment inflammatory markers in advanced non-small-cell lung cancer. Curr. Oncol. 2010, 17, 52–58. [Google Scholar] [CrossRef] [Green Version]
  30. Matsuo, M.; Yasumatsu, R.; Masuda, M.; Toh, S.; Wakasaki, T.; Hashimoto, K.; Jiromaru, R.; Manako, T.; Nakagawa, T. Inflammation-based Prognostic Score as a Prognostic Biomarker in Patients With Recurrent and/or Metastatic Head and Neck Squamous Cell Carcinoma Treated With Nivolumab Therapy. Vivo 2022, 36, 907–917. [Google Scholar] [CrossRef]
  31. McShane, L.M.; Altman, D.G.; Sauerbrei, W.; Taube, S.E.; Gion, M.; Clark, G.M.; Statistics Subcommittee of the NCI-EORTC Working Group on Cancer Diagnostics. REporting recommendations for tumour MARKer prognostic studies (REMARK). Br. J. Cancer 2005, 93, 387–391. [Google Scholar] [CrossRef] [PubMed] [Green Version]
  32. Ishwaran, H.; Kogalur, U.B.; Blackstone, E.H.; Lauer, M.S. Random survival forests. Ann. Appl. Stat. 2008, 2, 841–860. [Google Scholar] [CrossRef]
  33. Harrington, K.J.; Burtness, B.; Greil, R.; Soulieres, D.; Tahara, M.; de Castro, G., Jr.; Psyrri, A.; Brana, I.; Baste, N.; Neupane, P.; et al. Pembrolizumab With or Without Chemotherapy in Recurrent or Metastatic Head and Neck Squamous Cell Carcinoma: Updated Results of the Phase III KEYNOTE-048 Study. J. Clin. Oncol. 2023, 41, 790–802. [Google Scholar] [CrossRef] [PubMed]
  34. Ferris, R.L.; Blumenschein, G., Jr.; Fayette, J.; Guigay, J.; Colevas, A.D.; Licitra, L.; Harrington, K.J.; Kasper, S.; Vokes, E.E.; Even, C.; et al. Nivolumab vs investigator’s choice in recurrent or metastatic squamous cell carcinoma of the head and neck: 2-year long-term survival update of CheckMate 141 with analyses by tumor PD-L1 expression. Oral. Oncol. 2018, 81, 45–51. [Google Scholar] [CrossRef] [PubMed]
  35. Politz, S.; Wagner, M.; Schwub, D.; Cattenberg, S.; Thurnheer, R.; Schelosky, L. Enhancing Visibility of the Hypopharyngeal-Esophageal Region by Introduction of a Physiological Eructation Maneuver. Biomed. Hub 2019, 4, 1–6. [Google Scholar] [CrossRef] [PubMed]
  36. Yasumatsu, R.; Shimizu, Y.; Hanai, N.; Kariya, S.; Yokota, T.; Fujii, T.; Tsukahara, K.; Ando, M.; Hanyu, K.; Ueda, T.; et al. Outcomes of long-term nivolumab and subsequent chemotherapy in Japanese patients with head and neck cancer: 2-year follow-up from a multicenter real-world study. Int. J. Clin. Oncol. 2022, 27, 95–104. [Google Scholar] [CrossRef]
  37. Otsuki, S.; Hori, R.; Shinohara, S.; Kojima, T.; Tamaki, H.; Asato, R.; Kitamura, M.; Ichimaru, K.; Kitani, Y.; Kumabe, Y.; et al. Real-world 2-year long-term outcomes and prognostic factors in patients receiving nivolumab therapy for recurrent or metastatic squamous cell carcinoma of the head and neck. Auris Nasus Larynx 2022, 49, 834–844. [Google Scholar] [CrossRef]
  38. Takahashi, S.; Oridate, N.; Tanaka, K.; Shimizu, Y.; Fujimoto, Y.; Matsumoto, K.; Yokota, T.; Yamazaki, T.; Takahashi, M.; Ueda, T.; et al. First-line pembrolizumab +/− chemotherapy for recurrent/metastatic head and neck cancer: Japanese subgroup of KEYNOTE-048. Int. J. Clin. Oncol. 2022, 27, 1805–1817. [Google Scholar] [CrossRef]
  39. Chalker, C.; Voutsinas, J.M.; Wu, Q.V.; Santana-Davila, R.; Hwang, V.; Baik, C.S.; Lee, S.; Barber, B.; Futran, N.D.; Houlton, J.J.; et al. Performance status (PS) as a predictor of poor response to immune checkpoint inhibitors (ICI) in recurrent/metastatic head and neck cancer (RMHNSCC) patients. Cancer Med. 2022, 11, 4104–4111. [Google Scholar] [CrossRef] [PubMed]
  40. Dall’Olio, F.G.; Maggio, I.; Massucci, M.; Mollica, V.; Fragomeno, B.; Ardizzoni, A. ECOG performance status >/=2 as a prognostic factor in patients with advanced non small cell lung cancer treated with immune checkpoint inhibitors-A systematic review and meta-analysis of real world data. Lung Cancer 2020, 145, 95–104. [Google Scholar] [CrossRef]
  41. Khaki, A.R.; Li, A.; Diamantopoulos, L.N.; Bilen, M.A.; Santos, V.; Esther, J.; Morales-Barrera, R.; Devitt, M.; Nelson, A.; Hoimes, C.J.; et al. Impact of performance status on treatment outcomes: A real-world study of advanced urothelial cancer treated with immune checkpoint inhibitors. Cancer 2020, 126, 1208–1216. [Google Scholar] [CrossRef] [PubMed]
  42. Sehgal, K.; Gill, R.R.; Widick, P.; Bindal, P.; McDonald, D.C.; Shea, M.; Rangachari, D.; Costa, D.B. Association of Performance Status With Survival in Patients With Advanced Non-Small Cell Lung Cancer Treated With Pembrolizumab Monotherapy. JAMA Netw. Open 2021, 4, e2037120. [Google Scholar] [CrossRef]
  43. Ying, H.Q.; Deng, Q.W.; He, B.S.; Pan, Y.Q.; Wang, F.; Sun, H.L.; Chen, J.; Liu, X.; Wang, S.K. The prognostic value of preoperative NLR, d-NLR, PLR and LMR for predicting clinical outcome in surgical colorectal cancer patients. Med. Oncol. 2014, 31, 305. [Google Scholar] [CrossRef]
  44. Yasumatsu, R.; Wakasaki, T.; Hashimoto, K.; Nakashima, K.; Manako, T.; Taura, M.; Matsuo, M.; Nakagawa, T. Monitoring the neutrophil-to-lymphocyte ratio may be useful for predicting the anticancer effect of nivolumab in recurrent or metastatic head and neck cancer. Head Neck 2019, 41, 2610–2618. [Google Scholar] [CrossRef] [PubMed]
  45. Olingy, C.E.; Dinh, H.Q.; Hedrick, C.C. Monocyte heterogeneity and functions in cancer. J. Leukoc. Biol. 2019, 106, 309–322. [Google Scholar] [CrossRef] [Green Version]
  46. Mantovani, A.; Allavena, P.; Sica, A.; Balkwill, F. Cancer-related inflammation. Nature 2008, 454, 436–444. [Google Scholar] [CrossRef] [PubMed]
  47. Rosenberg, S.A. Progress in human tumour immunology and immunotherapy. Nature 2001, 411, 380–384. [Google Scholar] [CrossRef]
  48. Aoyama, J.; Kuwahara, T.; Sano, D.; Fujisawa, T.; Tokuhisa, M.; Shimizu, M.; Sakagami, T.; Ichikawa, Y.; Iwai, H.; Oridate, N. Combination of Performance Status and Lymphocyte-monocyte Ratio as a Novel Prognostic Marker for Patients With Recurrent/Metastatic Squamous Cell Carcinoma of the Head and Neck. Cancer Diagn. Progn. 2021, 1, 353–361. [Google Scholar] [CrossRef]
  49. Tham, T.; Olson, C.; Khaymovich, J.; Herman, S.W.; Costantino, P.D. The lymphocyte-to-monocyte ratio as a prognostic indicator in head and neck cancer: A systematic review and meta-analysis. Eur. Arch. Otorhinolaryngol 2018, 275, 1663–1670. [Google Scholar] [CrossRef] [PubMed]
Figure 1. Kaplan–Meier curves in the overall population: (A) OS and (B) PFS. OS, overall survival; PFS, progression-free survival; CI, confidence interval.
Cancers 15 02021 g001
Figure 2. Kaplan–Meier curves for correlation between overall survival and PLR, NLR, LMR, CONUT score, and Alb level according to cutoff values. Significant differences in overall survival were observed between the two groups for each biomarker.
Cancers 15 02021 g002
Figure 3. Classification and regression tree (CART) analysis. The root node was first divided based on LMR. For a high LMR, an interaction was found between CAR, age, PNI, and overall survival. For a low LMR, an interaction was found for BMI.
Cancers 15 02021 g003
Figure 4. (a) The analysis of the importance of included factors using random survival forest (RSF). LMR had the highest weight of all factors. (b) Kaplan–Meier survival curves and log-rank tests by predicted survival rate using the RSF model. There was a significant difference between the two groups. (c) Comparison of c-index by model. RSF had a c-index of 0.71, while the cox proportional hazard model had a c-index of 0.67, which was slightly higher for RSF.
Cancers 15 02021 g004
Table 1. Patient characteristics.
VariablesNumber (n = 102)%
Sex
 Male9391.2
 Female98.8
Median age (range)70 (47–87)
Primary site
 Oral87.8
 Nasopharynx65.9
 Oropharynx2423.5
 Hypopharynx4039.2
 Larynx1211.8
 Others1211.8
ECOG performance status
 0 or 110098.0
 >222.0
Type of Recurrence
 Locoregional7169.6
 Distant2120.6
 Locoregional+Distant109.8
ICI line
 1st1110.8
 2nd4746.1
 3rd3635.3
 >4th87.8
Previous treatment
 Nivolumab7674.5
 Pembrolizumab2625.5
Prior treatment
 Surgery3130.4
 Radiation7775.5
 Chemo8179.4
 Cetaximub1615.7
irAE
 Yes2019.6
 No8280.4
PLR
 ≦3977775.4
 >3972524.5
NLR
 ≦6.77169.6
 >6.73130.3
LMR
 ≦1.883231.3
 >1.887068.6
SII
 ≦107.55452.9
 >107.54847
CAR
 ≦0.145250.9
 >0.145049
CONUT
 ≦37068.6
 ≧43231.3
PNI
 ≦37.71817.6
 >37.78482.3
PI
 06866.6
 ≧13433.3
GPS
 08785.2
 ≧11514.7
BMI
 ≦204544.1
 >205755.8
Alb
 ≦4.17472.5
 >4.12827.4
CRP
 ≦0.896664.7
 >0.893635.2
ECOG, Eastern Cooperative Oncology Group; ICI, immune check point inhibitor; irAE, immune rerated adverse event; PLR, platelet to lymphocyte ratio; NLR, neutrophil to lymphocyte ratio; LMR, lymphocyte to monocyte ratio; SII, systemic immune-inflammation index; CAR, CRP to Alb ratio; CONUT, controlling nutritional status; PNI, prognostic nutrition index; PI, predictive index; GPS, Glasgow prognostic score; BMI, body mass index; Alb, albumin; CRP, C-reactive protein.
Table 2. Effectiveness of immune checkpoint inhibitor therapy.
VariablesAll%
Number of patients (%)102
Best response (%)
Complete response1615.7
Partial response3837.3
Stable disease2221.6
Progressive disease2625.5
ORR5452.9
DCR7674.5
ORR, objective response rate; DCR, disease control rate.
Table 3. Prognostic analysis of ORR (a) and DCR (b) in patients who received immune checkpoint inhibitor therapy.
(a) Overall Response Rate
Univariate
Odds Ratio95% CIp-Value
Age (<70 or >70)0.9970.458–2.170.9940
BMI (Cutoff: 20)0.5270.211–1.320.1720
Alb (Cutoff:4.1)0.6760.289–1.580.3650
CRP (Cutoff:0.89)1.350.582–3.110.4880
PLR (Cutoff: 397)0.7360.337–1.610.4410
NLR (Cutoff: 6.7)0.7320.336–1.60.4330
LMR (cutoff: 1.88)0.8920.386–2.060.7890
SII (Cutoff: 107.5)1.440.518–4.020.4830
CAR (Cutoff: 0.14)0.6230.272–1.430.2640
CONUT (Cutoff: 3)0.780.26–2.340.6570
PNI (Cutoff: 37.7)1.720.781–3.780.1780
PI (Cutoff: 0)2.010.817–4.920.1290
GPS (Cutoff: 0)0.6270.277–1.420.2630
(b) Disease control rate
Univariate Multivariate
Odds ratio95% CIp-valueOdds ratio95% CIp-value
Age (<70 or >70)0.4520.179–1.140.0925 0.3910.145–1.060.651
BMI (Cutoff: 20)0.3930.149–1.040.0598 1.820.682–4.860.232
Alb (Cutoff:4.1)0.4870.192–1.240.1300
CRP (Cutoff:0.89)2.40.952–6.050.0635
PLR (Cutoff: 397)0.3650.144–0.9230.03320.3970.117–1.410.157
NLR (Cutoff: 6.7)0.6260.255–1.540.3070
LMR (cutoff: 1.88)0.5210.206–1.310.1670
SII (Cutoff: 107.5)2.931.01–8.520.04780.6130.186–2.020.420
CAR (Cutoff: 0.14)0.3820.152–0.9570.03990.6190221–1.740.360
CONUT (Cutoff: 3)0.4480.142–1.410.1700
PNI (Cutoff: 37.7)2.090.847–5.160.1100
PI (Cutoff: 0)2.540.788–8.180.1190
GPS (Cutoff: 0)0.4340.174–1.080.0726
ORR, objective response rate; DCR, disease response rate; PLR, platelet to lymphocyte ratio; NLR, neutrophil to lymphocyte ratio; LMR, lymphocyte to monocyte ratio; SII, systemic immune-inflammation index; CAR, CRP to Alb ratio; CONUT, controlling nutritional status; PNI, prognostic nutrition index; PI, predictive index; GPS, Glasgow prognostic score; BMI, body mass index; Alb, albumin; CRP, C-reactive protein. Bold indicates statistically significant p-values.
Table 4. Cox regression analysis for correlation of nutritional and inflammatory biomarkers associated with overall survival and progression-free survival.
Overall Survival
Univariate Multivariate
Hazard Ratio95% CIp-ValueHazard Ratio95% CIp-Value
Age (<70 or >70)0.77370.4308–1.3890.3904 1.1890.6783–2.0860.545
BMI (Cutoff: 20)0.82110.4776–1.4120.4757
Alb (Cutoff:4.1)0.41330.1938–0.88130.02220.52970.2353–1.1920.1248
CRP (Cutoff:0.89)1.7921.039–3.0930.0361
PLR (Cutoff: 397)2.771.568–4.8910.00041.7760.7779–4.0570.1726
NLR (Cutoff: 6.7)2.3491.361–4.0530.00220.91840.4027–2.0950.8397
LMR (cutoff: 1.88)0.31170.1776–0.54730.00000.42750.2073–0.88160.02139
SII (Cutoff: 107.5)1.7741.023–3.0790.0414
CAR (Cutoff: 0.14)1.4790.8541–2.560.1625
CONUT (Cutoff: 3)1.9421.104–3.4170.02131.0830.5665–2.0690.8098
PNI (Cutoff: 37.7)0.5430.2887–1.0220.0582
PI (Cutoff: 0)1.7290.9952–3.0050.0520
GPS (Cutoff: 0)1.6530.847–3.2270.1407
Progression-Free Survival
Univariate Multivariate
Hazard ratio95% CIp-valueHazard ratio95% CIp-value
Age (<70 or >70)0.97010.6128–1.5360.8969 0.94090.5804–1.5250.8047
BMI (Cutoff: 20)0.95650.6021–1.5190.8504
Alb (Cutoff 4.1)0.46610.2636–0.82440.00870.54680.2933–1.0190.05749
CRP (Cutoff 0.89)1.6441.019–2.6530.0416
PLR (Cutoff: 397)1.8991.152–3.1330.01201.3960.6435–3.0280.3986
NLR (Cutoff: 6.7)1.7731.103–2.850.01801.1560.5495–2.4340.7019
LMR (cutoff: 1.88)0.60330.372–0.97860.0406
SII (Cutoff: 107.5)1.3640.861–2.1620.1859
CAR (Cutoff: 0.14)1.4830.9355–2.3520.0937
CONUT (Cutoff: 3)1.8481.131–3.0190.01420.85040.4017–1.80.672
PNI (Cutoff: 37.7)0.36220.2048–0.64040.00050.38560.07537–1.9730.2525
PI (Cutoff: 0)1.4920.9179–2.4250.1065
GPS (Cutoff: 0)2.6021.437–4.7090.00160.88070.1881–4.1230.8718
PLR, platelet to lymphocyte ratio; NLR, neutrophil to lymphocyte ratio; LMR, lymphocyte to monocyte ratio; SII, systemic immune-inflammation index; CAR, CRP to Alb ratio; CONUT, controlling nutritional status; PNI, prognostic nutrition index; PI, predictive index; GPS, Glasgow prognostic score; BMI, body mass index; Alb, albumin; CRP, C-reactive protein. Bold indicates statistically significant p-values.
Disclaimer/Publisher’s Note: The statements, opinions and data contained in all publications are solely those of the individual author(s) and contributor(s) and not of MDPI and/or the editor(s). MDPI and/or the editor(s) disclaim responsibility for any injury to people or property resulting from any ideas, methods, instructions or products referred to in the content.

