
Examination of the Functional Relationship between PD-L1 DNA Methylation and mRNA Expression in Non-Small-Cell Lung Cancer
 , and
, and 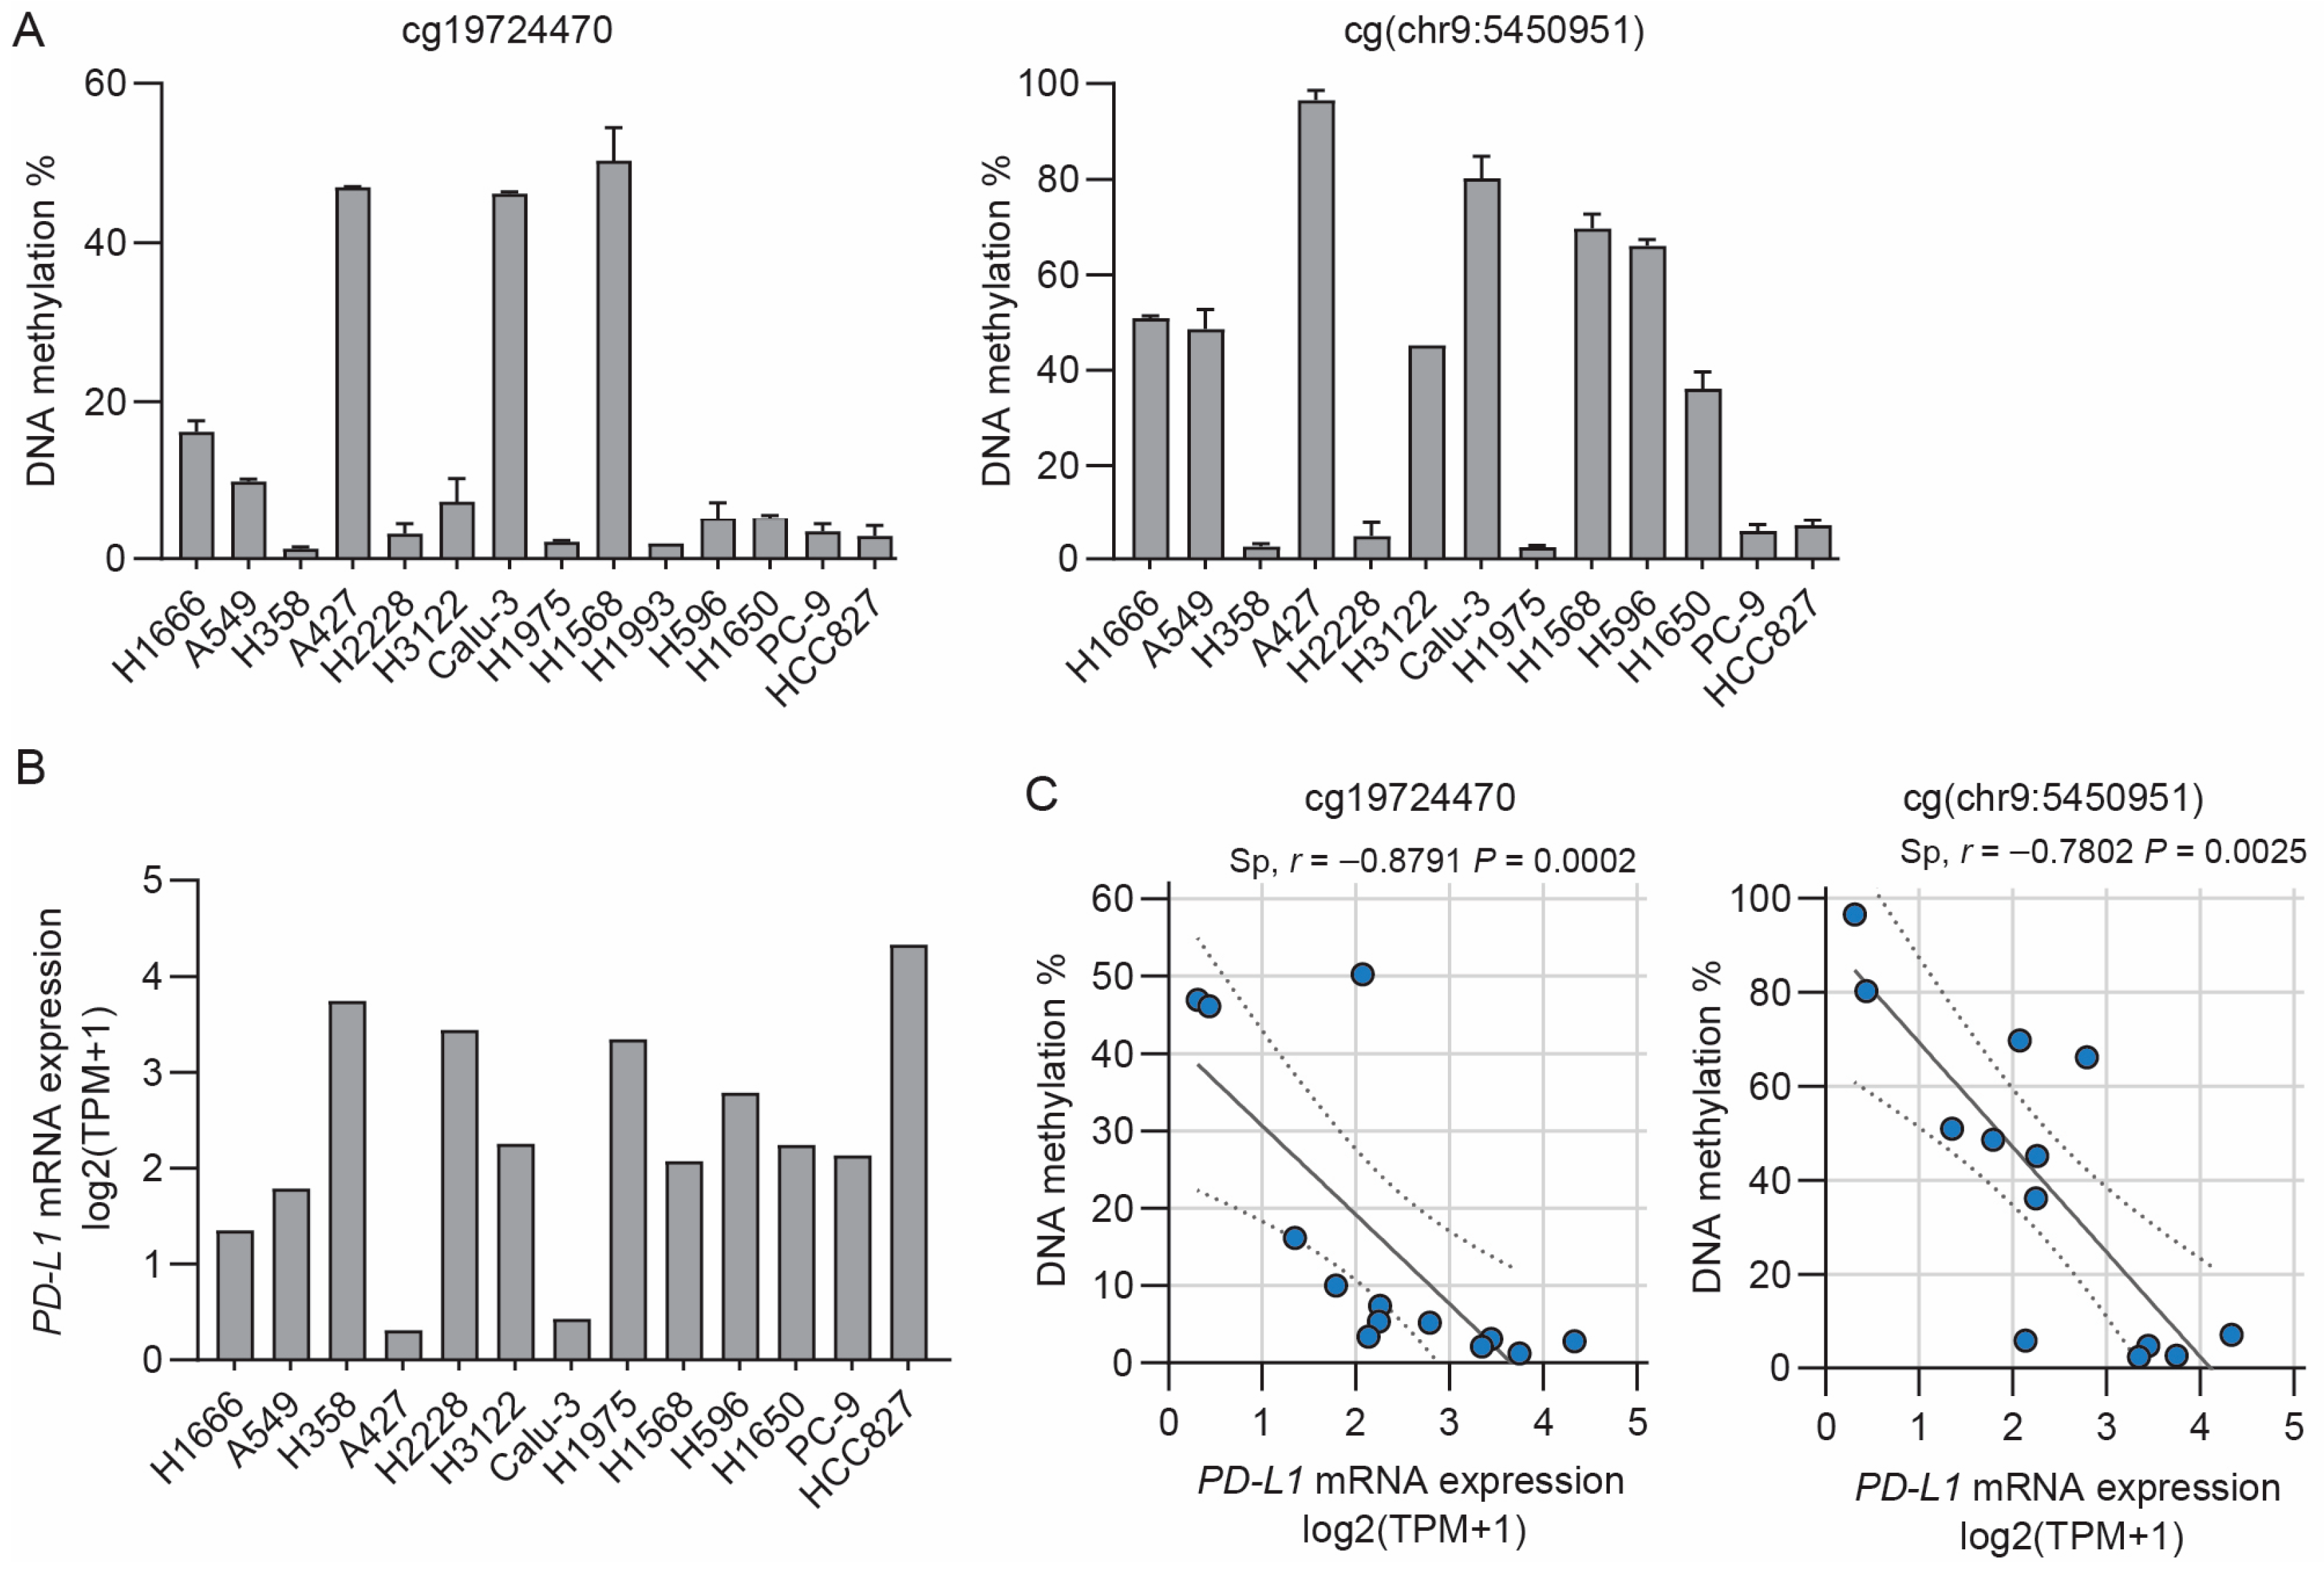
Abstract
:Simple Summary
Abstract
1. Introduction
2. Material and Methods
2.1. Cell Culture
2.2. Lung Tissue from NSCLC Patients
2.3. RNA Expression Analyses
2.4. DNA Methylation Analyses
2.5. CRISPR-Cas9-Mediated Deletions
2.6. dSaCas9-TET1 and dSpCas9-DNMT3A Fusions
2.7. Statistical Analyses
3. Results
3.1. Inverse Correlation between PD-L1 Methylation and mRNA Expression in NSCLC Cell Lines
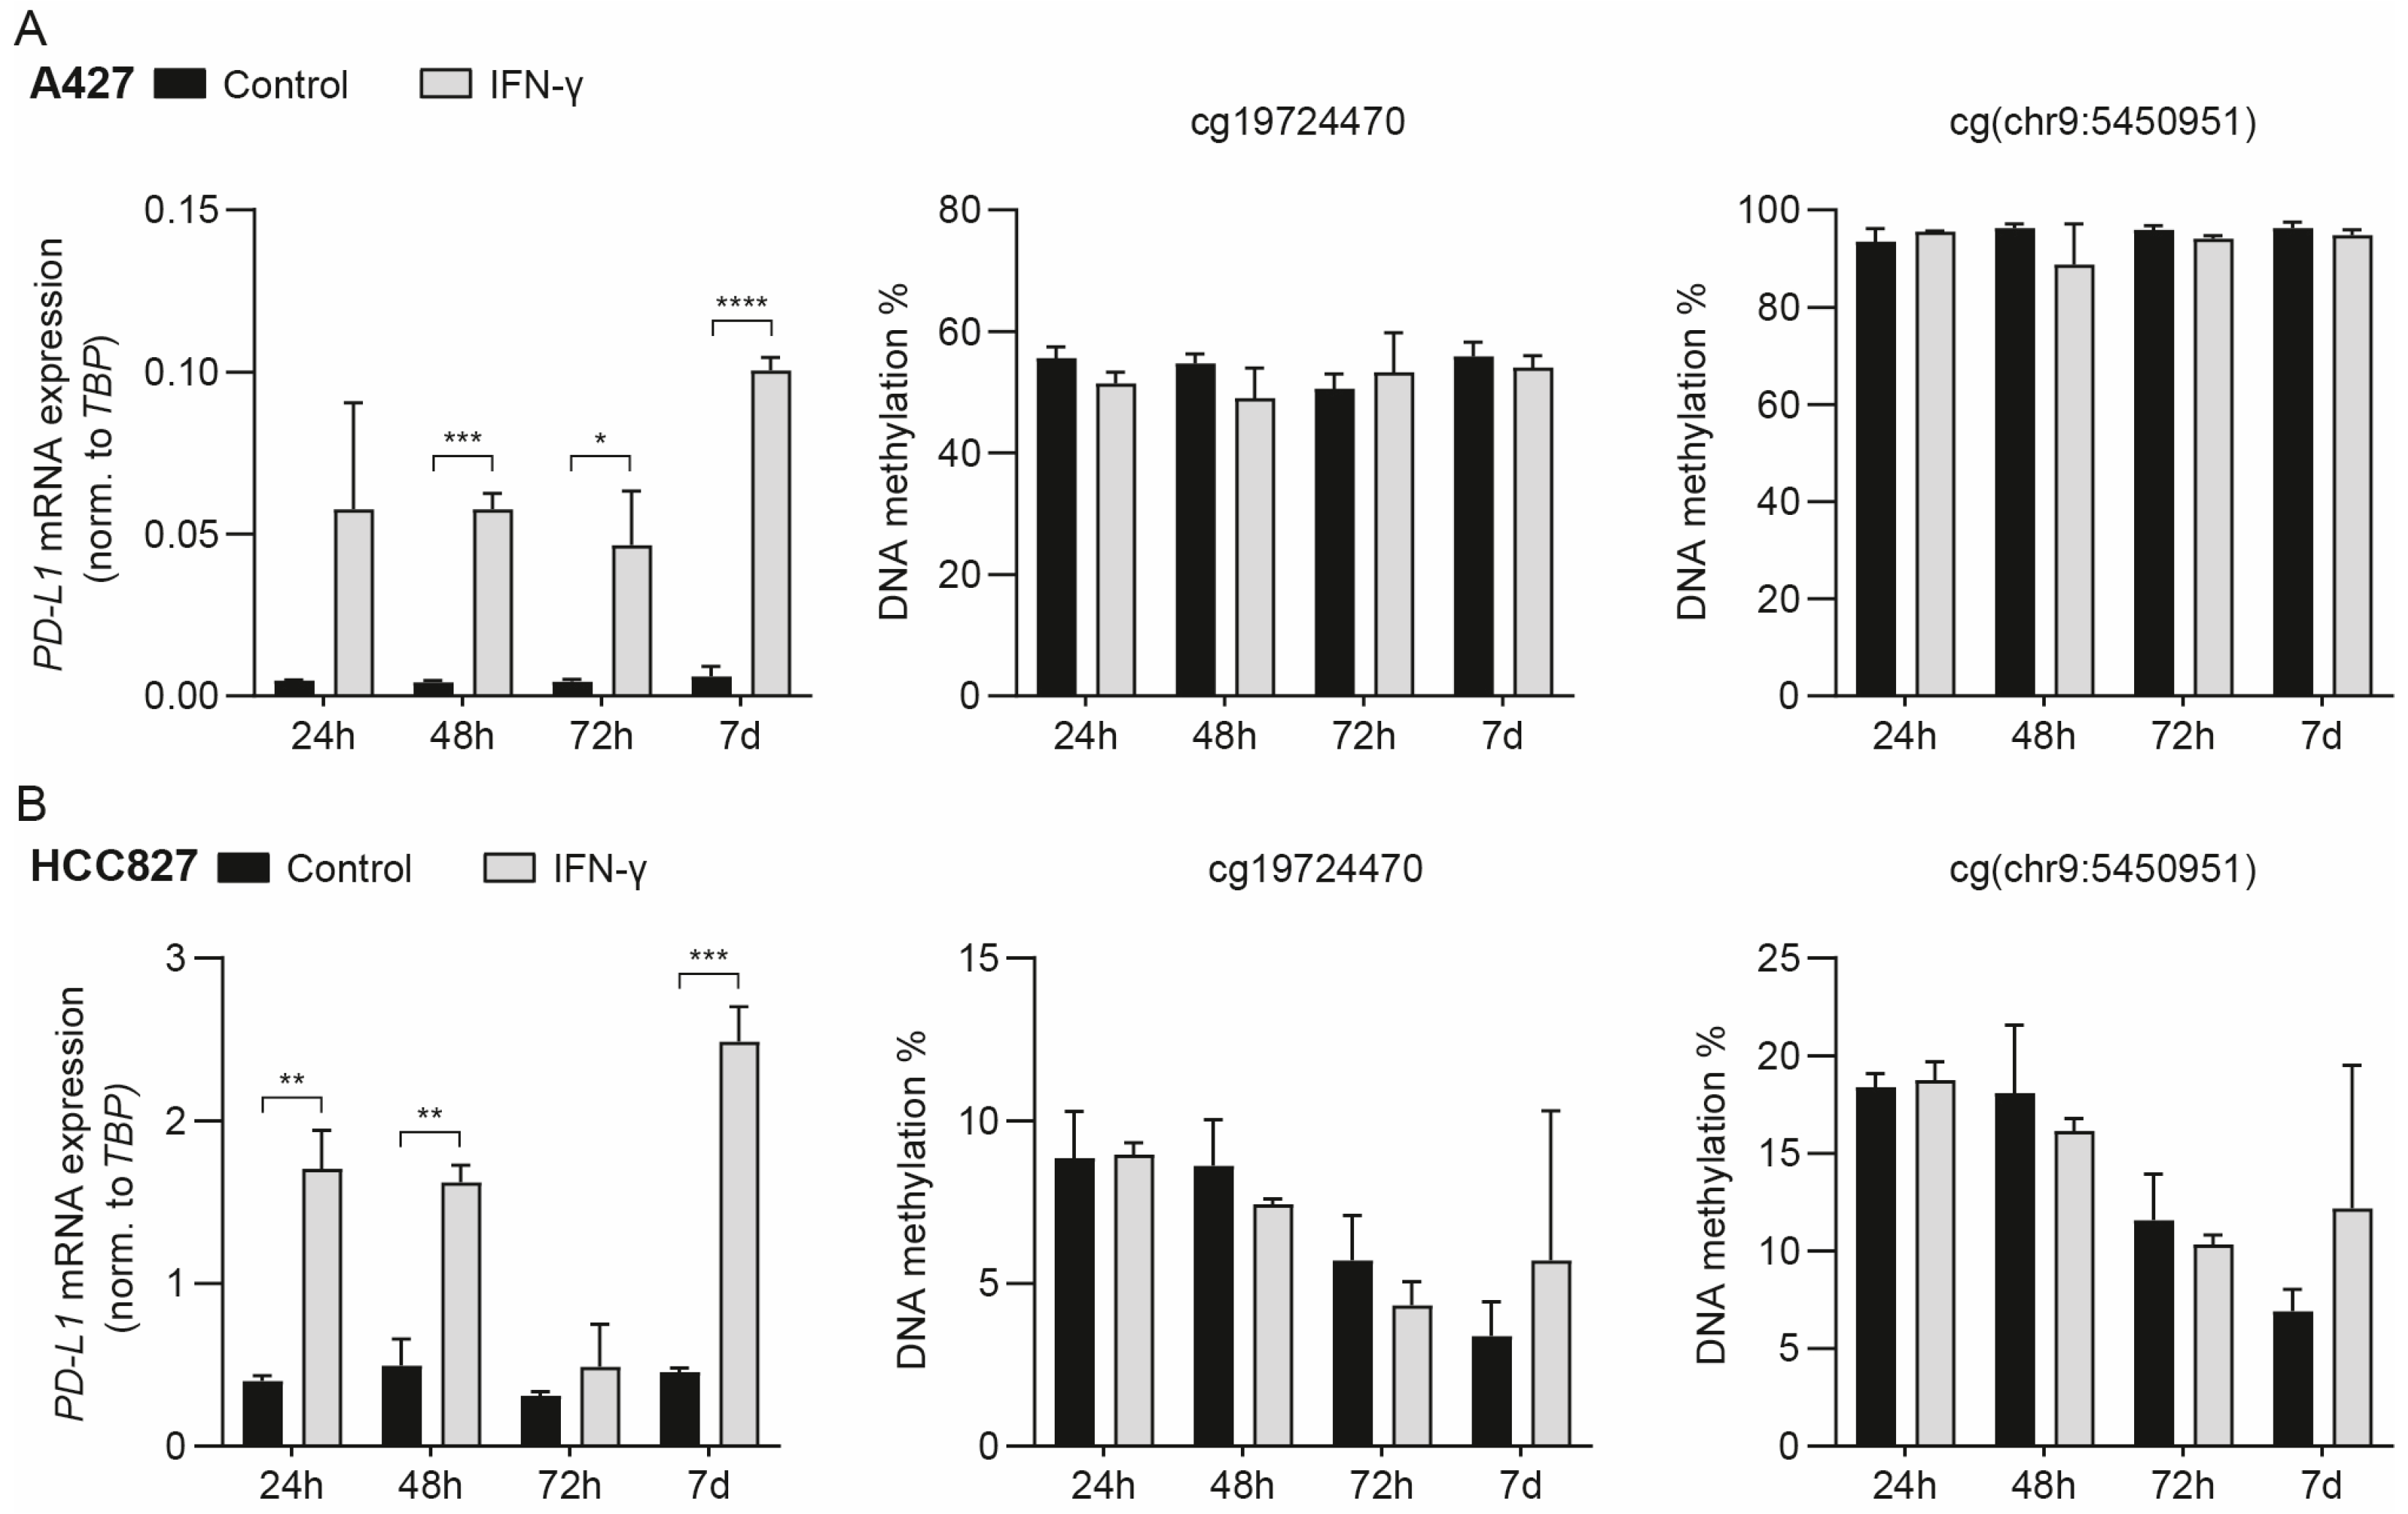
3.2. IFN-γ-Mediated Induction of PD-L1 mRNA Expression Does Not Drive Concomitant DNA Methylation Changes
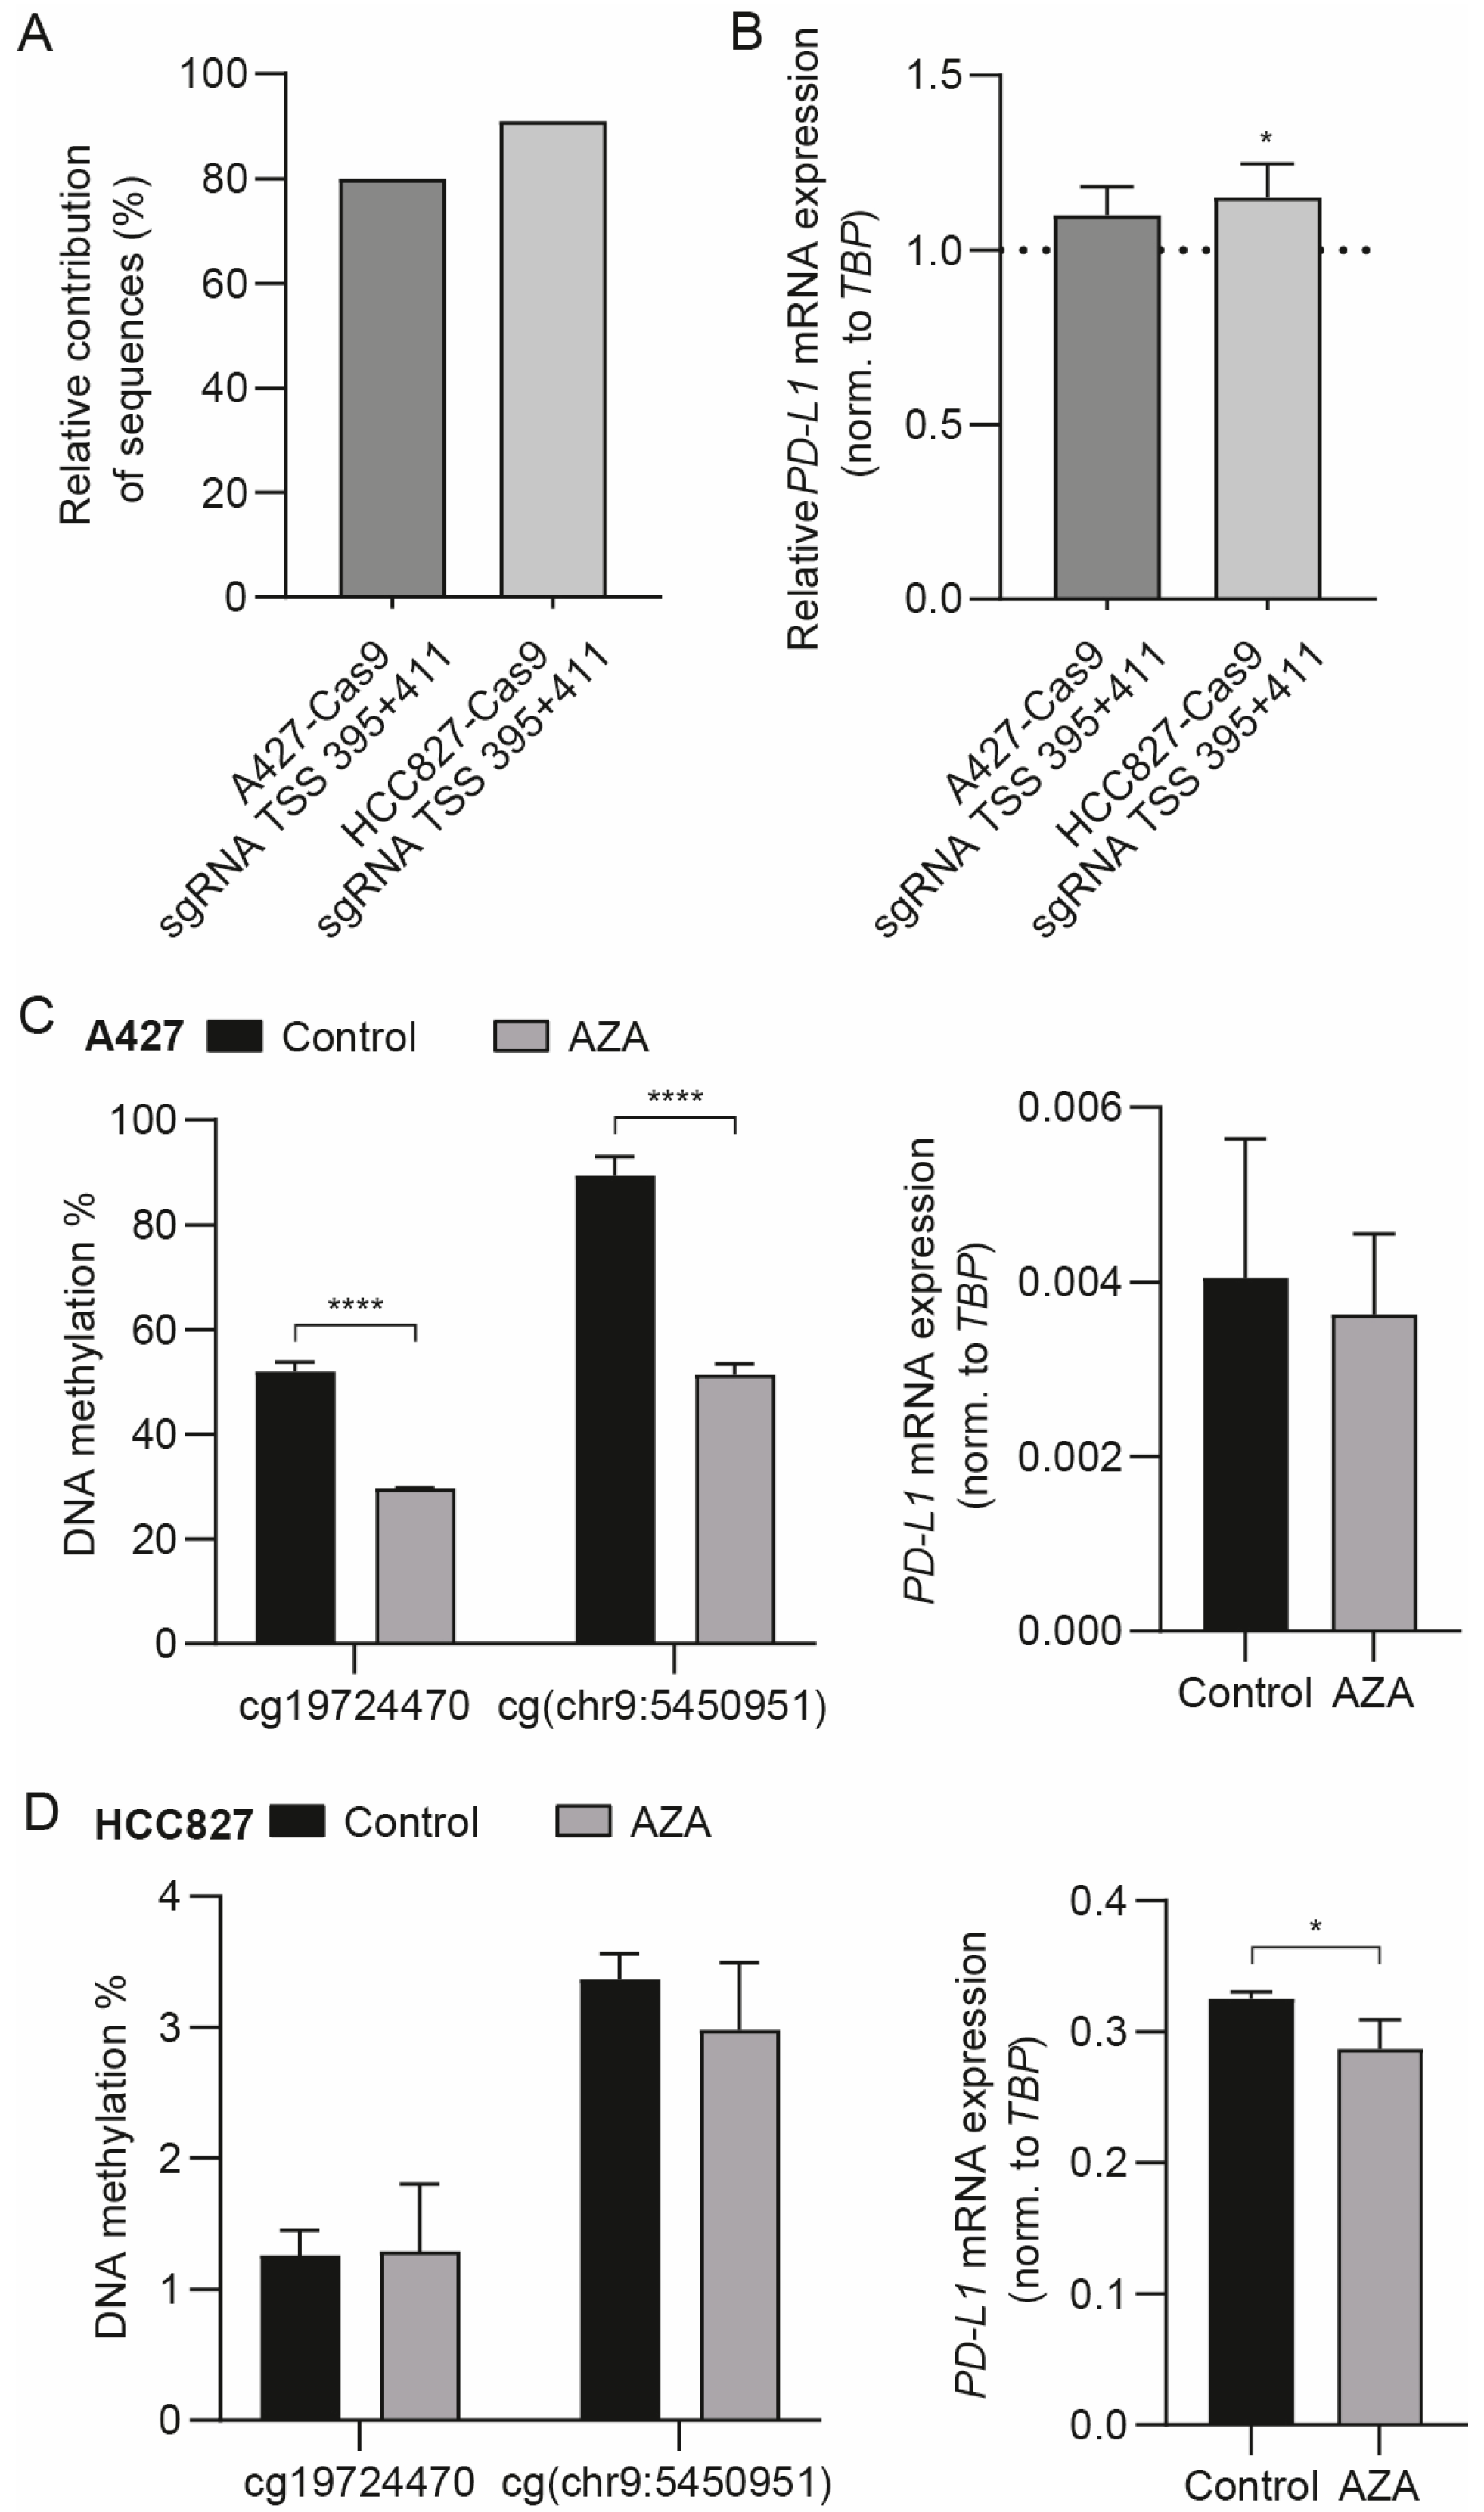
3.3. The Differentially Methylated Region including cg19724470 and cg(chr9:5450951) Does Not Actively Regulate PD-L1 mRNA Expression
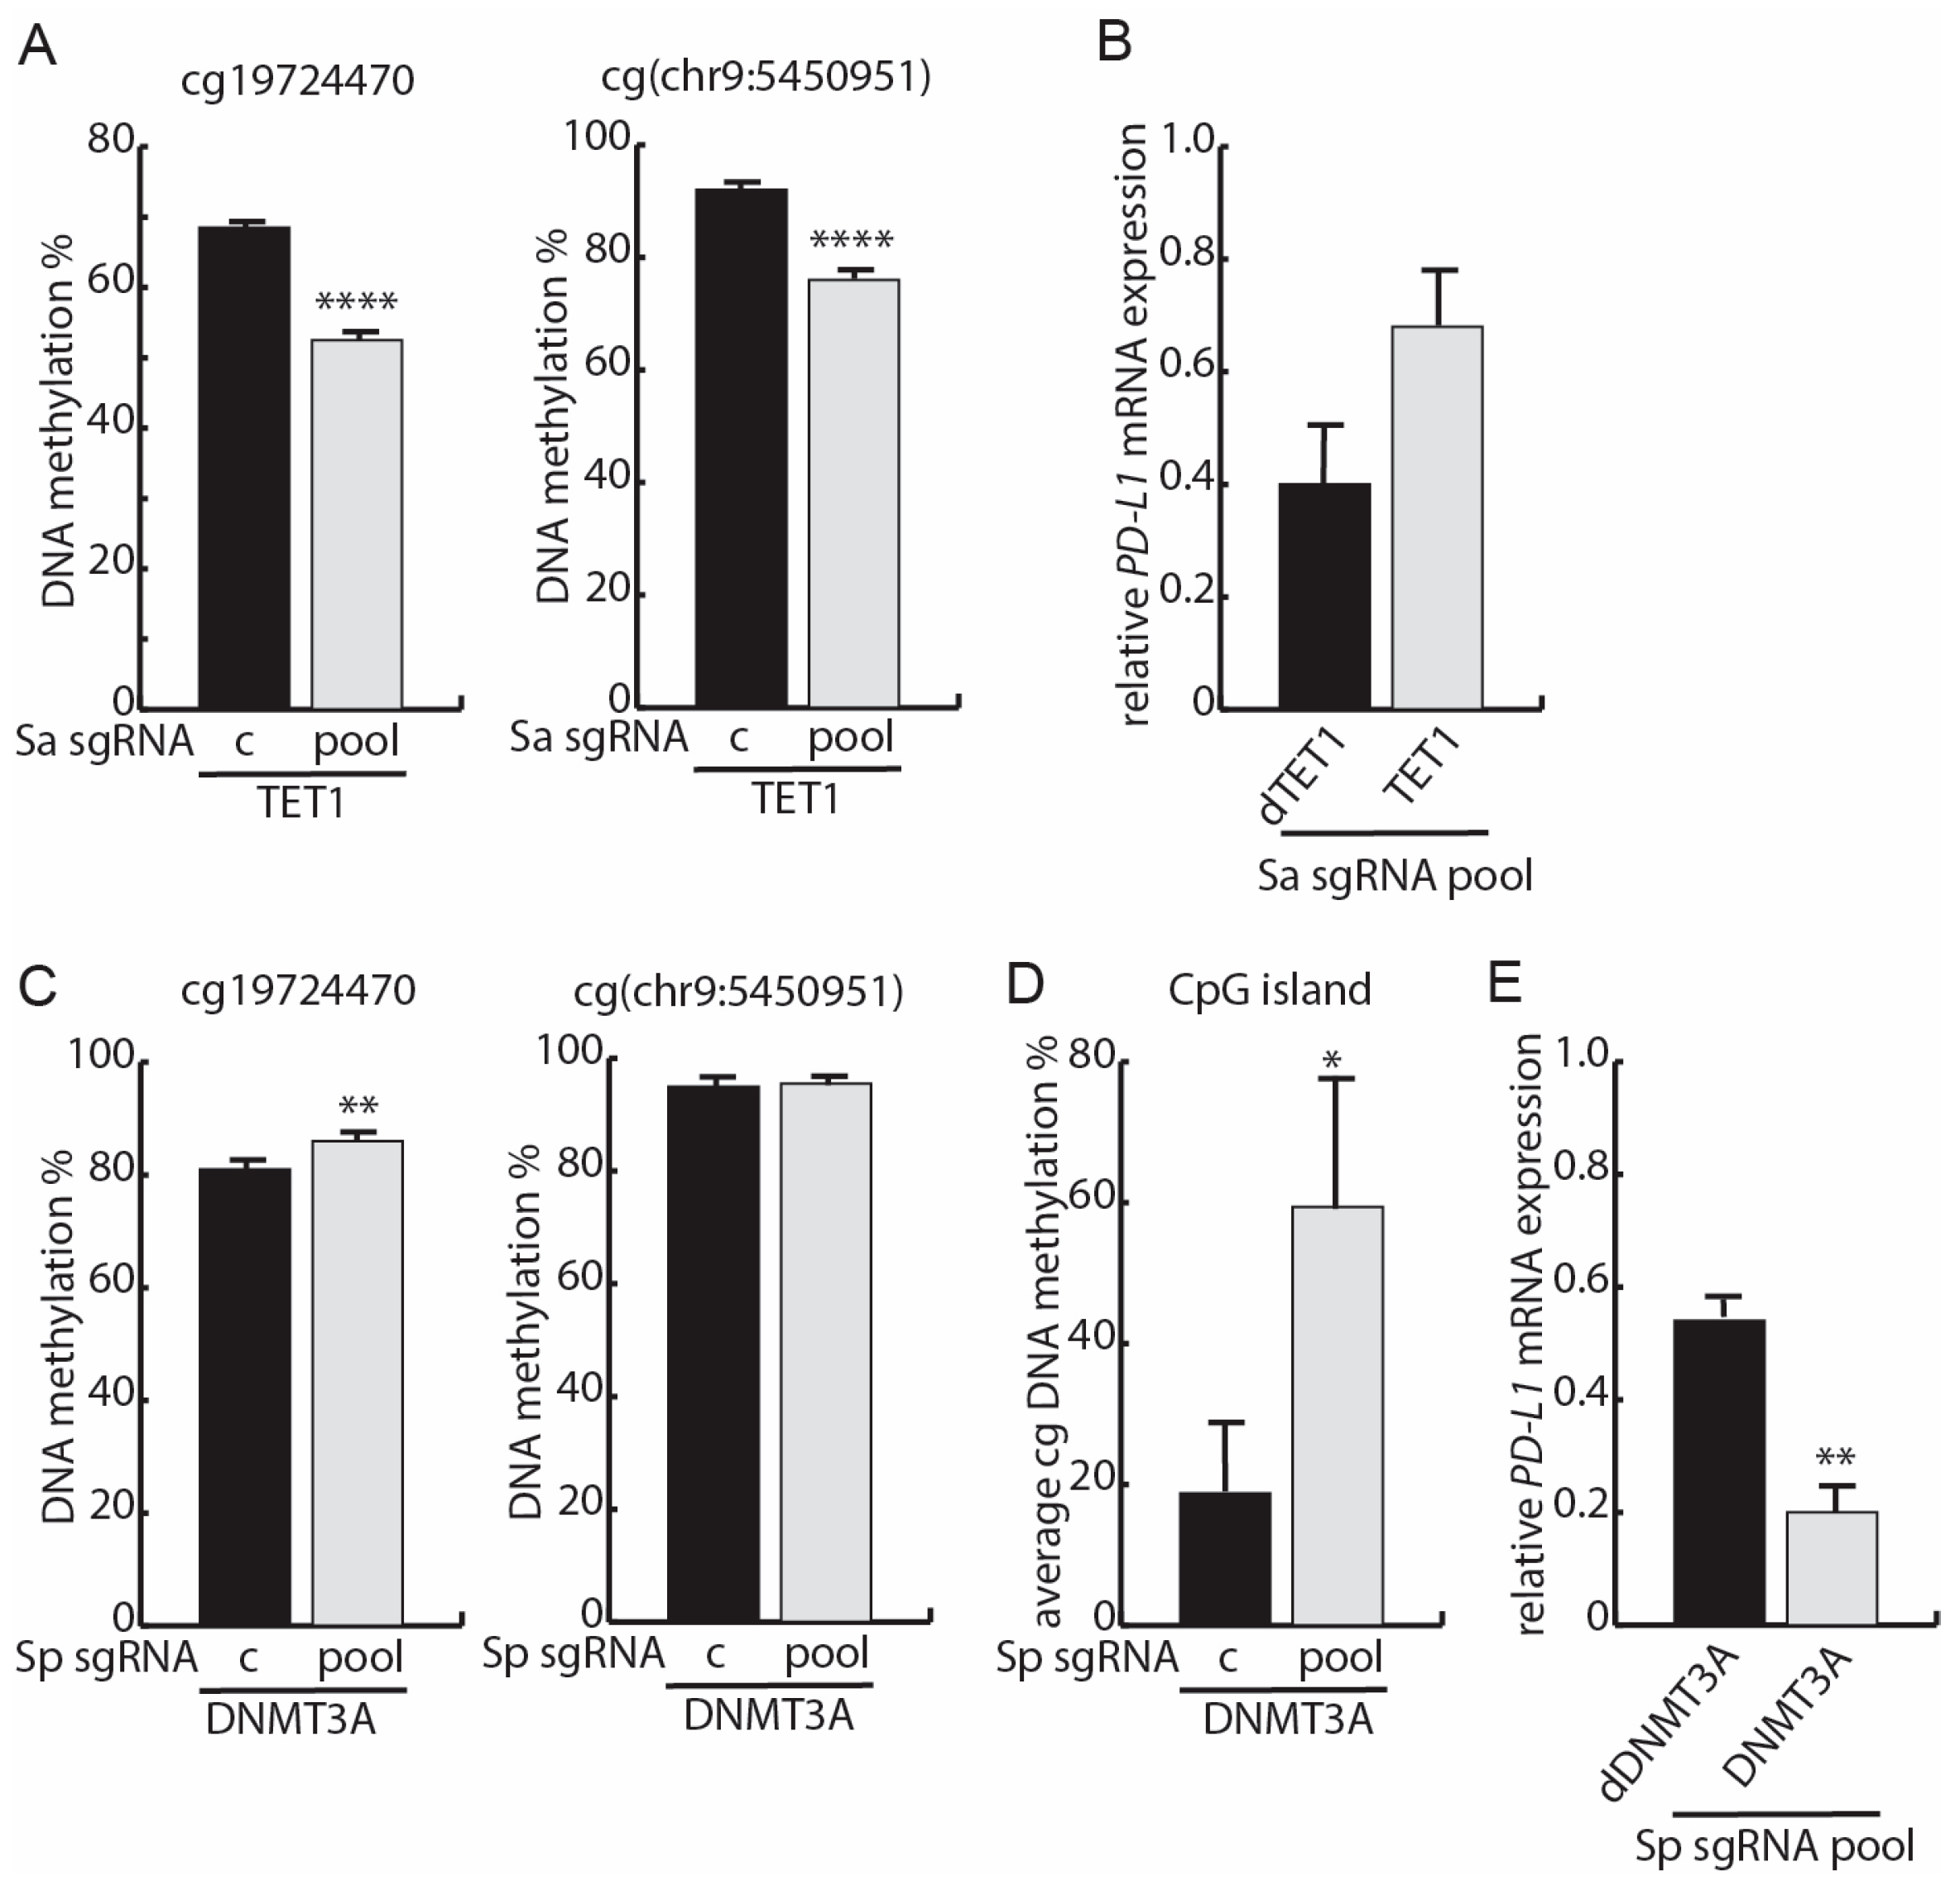
3.4. Targeted Methylation with dSpCas9-DNMT3A Decreases PD-L1 mRNA Expression
3.5. Methylation of cg19724470 Is Correlated with PD-L1 TPS in NSCLC Patients
4. Discussion
5. Conclusions
Supplementary Materials
Author Contributions
Funding
Informed Consent Statement
Data Availability Statement
Conflicts of Interest
References
- Ishida, Y.; Agata, Y.; Shibahara, K.; Honjo, T. Induced expression of PD-1, a novel member of the immunoglobulin gene superfamily, upon programmed cell death. EMBO J. 1992, 11, 3887–3895. [Google Scholar] [CrossRef]
- Keir, M.E.; Butte, M.J.; Freeman, G.J.; Sharpe, A.H. PD-1 and its ligands in tolerance and immunity. Annu. Rev. Immunol. 2008, 26, 677–704. [Google Scholar] [CrossRef] [PubMed] [Green Version]
- Boussiotis, V.A. Molecular and Biochemical Aspects of the PD-1 Checkpoint Pathway. N. Engl. J. Med. 2016, 375, 1767–1778. [Google Scholar] [CrossRef] [Green Version]
- Sun, C.; Mezzadra, R.; Schumacher, T.N. Regulation and Function of the PD-L1 Checkpoint. Immunity 2018, 48, 434–452. [Google Scholar] [CrossRef] [PubMed] [Green Version]
- Azuma, K.; Ota, K.; Kawahara, A.; Hattori, S.; Iwama, E.; Harada, T.; Matsumoto, K.; Takayama, K.; Takamori, S.; Kage, M.; et al. Association of PD-L1 overexpression with activating EGFR mutations in surgically resected nonsmall-cell lung cancer. Ann. Oncol. 2014, 25, 1935–1940. [Google Scholar] [CrossRef] [PubMed]
- Akbay, E.A.; Koyama, S.; Carretero, J.; Altabef, A.; Tchaicha, J.H.; Christensen, C.L.; Mikse, O.R.; Cherniack, A.D.; Beauchamp, E.M.; Pugh, T.J.; et al. Activation of the PD-1 pathway contributes to immune escape in EGFR-driven lung tumors. Cancer Discov. 2013, 3, 1355–1363. [Google Scholar] [CrossRef] [Green Version]
- Ota, K.; Azuma, K.; Kawahara, A.; Hattori, S.; Iwama, E.; Tanizaki, J.; Harada, T.; Matsumoto, K.; Takayama, K.; Takamori, S.; et al. Induction of PD-L1 Expression by the EML4-ALK Oncoprotein and Downstream Signaling Pathways in Non-Small Cell Lung Cancer. Clin. Cancer Res. 2015, 21, 4014–4021. [Google Scholar] [CrossRef] [PubMed] [Green Version]
- Sumimoto, H.; Takano, A.; Teramoto, K.; Daigo, Y. RAS-Mitogen-Activated Protein Kinase Signal Is Required for Enhanced PD-L1 Expression in Human Lung Cancers. PLoS ONE 2016, 11, e0166626. [Google Scholar] [CrossRef] [Green Version]
- Garcia-Diaz, A.; Shin, D.S.; Moreno, B.H.; Saco, J.; Escuin-Ordinas, H.; Rodriguez, G.A.; Zaretsky, J.M.; Sun, L.; Hugo, W.; Wang, X.; et al. Interferon Receptor Signaling Pathways Regulating PD-L1 and PD-L2 Expression. Cell. Rep. 2019, 29, 3766. [Google Scholar] [CrossRef]
- Tabchi, S.; Kourie, H.R.; Klastersky, J. Concurrent driver mutations/rearrangements in non-small-cell lung cancer. Curr. Opin. Oncol. 2017, 29, 118–122. [Google Scholar] [CrossRef]
- Tan, C.S.; Kumarakulasinghe, N.B.; Huang, Y.Q.; Ang, Y.L.E.; Choo, J.R.; Goh, B.C.; Soo, R.A. Third generation EGFR TKIs: Current data and future directions. Mol. Cancer 2018, 17, 29. [Google Scholar] [CrossRef]
- Chhouri, H.; Alexandre, D.; Grumolato, L. Mechanisms of Acquired Resistance and Tolerance to EGFR Targeted Therapy in Non-Small Cell Lung Cancer. Cancers 2023, 15, 504. [Google Scholar] [CrossRef] [PubMed]
- Niu, M.; Yi, M.; Li, N.; Luo, S.; Wu, K. Predictive biomarkers of anti-PD-1/PD-L1 therapy in NSCLC. Exp. Hematol. Oncol. 2021, 10, 18. [Google Scholar] [CrossRef]
- Doroshow, D.B.; Sanmamed, M.F.; Hastings, K.; Politi, K.; Rimm, D.L.; Chen, L.; Melero, I.; Schalper, K.A.; Herbst, R.S. Immunotherapy in Non-Small Cell Lung Cancer: Facts and Hopes. Clin. Cancer Res. 2019, 25, 4592–4602. [Google Scholar] [CrossRef] [PubMed] [Green Version]
- Brahmer, J.; Reckamp, K.L.; Baas, P.; Crino, L.; Eberhardt, W.E.; Poddubskaya, E.; Antonia, S.; Pluzanski, A.; Vokes, E.E.; Holgado, E.; et al. Nivolumab versus Docetaxel in Advanced Squamous-Cell Non-Small-Cell Lung Cancer. N. Engl. J. Med. 2015, 373, 123–135. [Google Scholar] [CrossRef] [Green Version]
- Borghaei, H.; Paz-Ares, L.; Horn, L.; Spigel, D.R.; Steins, M.; Ready, N.E.; Chow, L.Q.; Vokes, E.E.; Felip, E.; Holgado, E.; et al. Nivolumab versus Docetaxel in Advanced Nonsquamous Non-Small-Cell Lung Cancer. N. Engl. J. Med. 2015, 373, 1627–1639. [Google Scholar] [CrossRef]
- Kazandjian, D.; Suzman, D.L.; Blumenthal, G.; Mushti, S.; He, K.; Libeg, M.; Keegan, P.; Pazdur, R. FDA Approval Summary: Nivolumab for the Treatment of Metastatic Non-Small Cell Lung Cancer With Progression On or After Platinum-Based Chemotherapy. Oncologist 2016, 21, 634–642. [Google Scholar] [CrossRef] [PubMed] [Green Version]
- Garon, E.B.; Rizvi, N.A.; Hui, R.; Leighl, N.; Balmanoukian, A.S.; Eder, J.P.; Patnaik, A.; Aggarwal, C.; Gubens, M.; Horn, L.; et al. Pembrolizumab for the treatment of non-small-cell lung cancer. N. Engl. J. Med. 2015, 372, 2018–2028. [Google Scholar] [CrossRef] [PubMed]
- Fehrenbacher, L.; Spira, A.; Ballinger, M.; Kowanetz, M.; Vansteenkiste, J.; Mazieres, J.; Park, K.; Smith, D.; Artal-Cortes, A.; Lewanski, C.; et al. Atezolizumab versus docetaxel for patients with previously treated non-small-cell lung cancer (POPLAR): A multicentre, open-label, phase 2 randomised controlled trial. Lancet 2016, 387, 1837–1846. [Google Scholar] [CrossRef]
- Rittmeyer, A.; Barlesi, F.; Waterkamp, D.; Park, K.; Ciardiello, F.; von Pawel, J.; Gadgeel, S.M.; Hida, T.; Kowalski, D.M.; Dols, M.C.; et al. Atezolizumab versus docetaxel in patients with previously treated non-small-cell lung cancer (OAK): A phase 3, open-label, multicentre randomised controlled trial. Lancet 2017, 389, 255–265. [Google Scholar] [CrossRef]
- Lai, Q.; Wang, H.; Li, A.; Xu, Y.; Tang, L.; Chen, Q.; Zhang, C.; Gao, Y.; Song, J.; Du, Z. Decitibine improve the efficiency of anti-PD-1 therapy via activating the response to IFN/PD-L1 signal of lung cancer cells. Oncogene 2018, 37, 2302–2312. [Google Scholar] [CrossRef] [PubMed]
- Herbst, R.S.; Baas, P.; Kim, D.W.; Felip, E.; Perez-Gracia, J.L.; Han, J.Y.; Molina, J.; Kim, J.H.; Arvis, C.D.; Ahn, M.J.; et al. Pembrolizumab versus docetaxel for previously treated, PD-L1-positive, advanced non-small-cell lung cancer (KEYNOTE-010): A randomised controlled trial. Lancet 2016, 387, 1540–1550. [Google Scholar] [CrossRef] [PubMed]
- Mok, T.S.K.; Wu, Y.L.; Kudaba, I.; Kowalski, D.M.; Cho, B.C.; Turna, H.Z.; Castro, G., Jr.; Srimuninnimit, V.; Laktionov, K.K.; Bondarenko, I.; et al. Pembrolizumab versus chemotherapy for previously untreated, PD-L1-expressing, locally advanced or metastatic non-small-cell lung cancer (KEYNOTE-042): A randomised, open-label, controlled, phase 3 trial. Lancet 2019, 393, 1819–1830. [Google Scholar] [CrossRef] [PubMed]
- Reck, M.; Rodriguez-Abreu, D.; Robinson, A.G.; Hui, R.; Csoszi, T.; Fulop, A.; Gottfried, M.; Peled, N.; Tafreshi, A.; Cuffe, S.; et al. Pembrolizumab versus Chemotherapy for PD-L1-Positive Non-Small-Cell Lung Cancer. N. Engl. J. Med. 2016, 375, 1823–1833. [Google Scholar] [CrossRef] [Green Version]
- Pai-Scherf, L.; Blumenthal, G.M.; Li, H.; Subramaniam, S.; Mishra-Kalyani, P.S.; He, K.; Zhao, H.; Yu, J.; Paciga, M.; Goldberg, K.B.; et al. FDA Approval Summary: Pembrolizumab for Treatment of Metastatic Non-Small Cell Lung Cancer: First-Line Therapy and Beyond. Oncologist 2017, 22, 1392–1399. [Google Scholar] [CrossRef] [Green Version]
- Patel, S.P.; Kurzrock, R. PD-L1 Expression as a Predictive Biomarker in Cancer Immunotherapy. Mol. Cancer Ther. 2015, 14, 847–856. [Google Scholar] [CrossRef] [Green Version]
- Hermann, A.; Goyal, R.; Jeltsch, A. The Dnmt1 DNA-(cytosine-C5)-methyltransferase methylates DNA processively with high preference for hemimethylated target sites. J. Biol. Chem. 2004, 279, 48350–48359. [Google Scholar] [CrossRef] [Green Version]
- Okano, M.; Bell, D.W.; Haber, D.A.; Li, E. DNA methyltransferases Dnmt3a and Dnmt3b are essential for de novo methylation and mammalian development. Cell 1999, 99, 247–257. [Google Scholar] [CrossRef] [Green Version]
- Niehrs, C.; Schafer, A. Active DNA demethylation by Gadd45 and DNA repair. Trends Cell. Biol. 2012, 22, 220–227. [Google Scholar] [CrossRef]
- Wu, X.; Zhang, Y. TET-mediated active DNA demethylation: Mechanism, function and beyond. Nat. Rev. Genet. 2017, 18, 517–534. [Google Scholar] [CrossRef]
- Pfeifer, G.P. Defining Driver DNA Methylation Changes in Human Cancer. Int. J. Mol. Sci. 2018, 19, 1166. [Google Scholar] [CrossRef] [Green Version]
- Jones, P.A. Functions of DNA methylation: Islands, start sites, gene bodies and beyond. Nat. Rev. Genet. 2012, 13, 484–492. [Google Scholar] [CrossRef] [PubMed]
- Van Tongelen, A.; Loriot, A.; De Smet, C. Oncogenic roles of DNA hypomethylation through the activation of cancer-germline genes. Cancer Lett. 2017, 396, 130–137. [Google Scholar] [CrossRef] [PubMed]
- Goltz, D.; Gevensleben, H.; Dietrich, J.; Dietrich, D. PD-L1 (CD274) promoter methylation predicts survival in colorectal cancer patients. Oncoimmunology 2017, 6, e1257454. [Google Scholar] [CrossRef] [PubMed] [Green Version]
- Micevic, G.; Thakral, D.; McGeary, M.; Bosenberg, M.W. PD-L1 methylation regulates PD-L1 expression and is associated with melanoma survival. Pigment. Cell. Melanoma Res. 2019, 32, 435–440. [Google Scholar] [CrossRef]
- Xu, J.; Wei, L.; Liu, H.; Lei, Y.; Zhu, Y.; Liang, C.; Sun, G. CD274 (PD-L1) Methylation is an Independent Predictor for Bladder Cancer Patients’ Survival. Cancer Investig. 2022, 40, 228–233. [Google Scholar] [CrossRef]
- Goltz, D.; Gevensleben, H.; Grunen, S.; Dietrich, J.; Kristiansen, G.; Landsberg, J.; Dietrich, D. PD-L1 (CD274) promoter methylation predicts survival in patients with acute myeloid leukemia. Leukemia 2017, 31, 738–743. [Google Scholar] [CrossRef]
- Gevensleben, H.; Holmes, E.E.; Goltz, D.; Dietrich, J.; Sailer, V.; Ellinger, J.; Dietrich, D.; Kristiansen, G. PD-L1 promoter methylation is a prognostic biomarker for biochemical recurrence-free survival in prostate cancer patients following radical prostatectomy. Oncotarget 2016, 7, 79943–79955. [Google Scholar] [CrossRef] [PubMed]
- Zhang, Y.; Xiang, C.; Wang, Y.; Duan, Y.; Liu, C.; Zhang, Y. PD-L1 promoter methylation mediates the resistance response to anti-PD-1 therapy in NSCLC patients with EGFR-TKI resistance. Oncotarget 2017, 8, 101535–101544. [Google Scholar] [CrossRef] [PubMed] [Green Version]
- Kowanetz, M.; Zou, W.; Gettinger, S.N.; Koeppen, H.; Kockx, M.; Schmid, P.; Kadel, E.E., 3rd; Wistuba, I.; Chaft, J.; Rizvi, N.A.; et al. Differential regulation of PD-L1 expression by immune and tumor cells in NSCLC and the response to treatment with atezolizumab (anti-PD-L1). Proc. Natl. Acad. Sci. USA 2018, 115, E10119–E10126. [Google Scholar] [CrossRef] [PubMed] [Green Version]
- Asgarova, A.; Asgarov, K.; Godet, Y.; Peixoto, P.; Nadaradjane, A.; Boyer-Guittaut, M.; Galaine, J.; Guenat, D.; Mougey, V.; Perrard, J.; et al. PD-L1 expression is regulated by both DNA methylation and NF-kB during EMT signaling in non-small cell lung carcinoma. Oncoimmunology 2018, 7, e1423170. [Google Scholar] [CrossRef] [PubMed] [Green Version]
- Wrangle, J.; Wang, W.; Koch, A.; Easwaran, H.; Mohammad, H.P.; Vendetti, F.; Vancriekinge, W.; Demeyer, T.; Du, Z.; Parsana, P.; et al. Alterations of immune response of Non-Small Cell Lung Cancer with Azacytidine. Oncotarget 2013, 4, 2067–2079. [Google Scholar] [CrossRef] [Green Version]
- Franzen, A.; Vogt, T.J.; Muller, T.; Dietrich, J.; Schrock, A.; Golletz, C.; Brossart, P.; Bootz, F.; Landsberg, J.; Kristiansen, G.; et al. PD-L1 (CD274) and PD-L2 (PDCD1LG2) promoter methylation is associated with HPV infection and transcriptional repression in head and neck squamous cell carcinomas. Oncotarget 2018, 9, 641–650. [Google Scholar] [CrossRef] [Green Version]
- Conway, K.; Tsai, Y.S.; Edmiston, S.N.; Parker, J.S.; Parrish, E.A.; Hao, H.; Kuan, P.F.; Scott, G.A.; Frank, J.S.; Googe, P.; et al. Characterization of the CpG Island Hypermethylated Phenotype Subclass in Primary Melanomas. J. Investig. Dermatol. 2022, 142, 1869–1881. [Google Scholar] [CrossRef]
- Stresemann, C.; Lyko, F. Modes of action of the DNA methyltransferase inhibitors azacytidine and decitabine. Int. J. Cancer 2008, 123, 8–13. [Google Scholar] [CrossRef] [PubMed]
- Xu, Y.; Li, P.; Liu, Y.; Xin, D.; Lei, W.; Liang, A.; Han, W.; Qian, W. Epi-immunotherapy for cancers: Rationales of epi-drugs in combination with immunotherapy and advances in clinical trials. Cancer Commun. 2022, 42, 493–516. [Google Scholar] [CrossRef] [PubMed]
- Jakobsen, K.R.; Demuth, C.; Madsen, A.T.; Hussmann, D.; Vad-Nielsen, J.; Nielsen, A.L.; Sorensen, B.S. MET amplification and epithelial-to-mesenchymal transition exist as parallel resistance mechanisms in erlotinib-resistant, EGFR-mutated, NSCLC HCC827 cells. Oncogenesis 2017, 6, e307. [Google Scholar] [CrossRef] [PubMed] [Green Version]
- Thomsen, R.; Solvsten, C.A.; Linnet, T.E.; Blechingberg, J.; Nielsen, A.L. Analysis of qPCR data by converting exponentially related Ct values into linearly related X0 values. J. Bioinform. Comput. Biol. 2010, 8, 885–900. [Google Scholar] [CrossRef]
- Vad-Nielsen, J.; Staunstrup, N.H.; Kjeldsen, M.L.; Dybdal, N.; Flandin, G.; De Stradis, C.; Daugaard, T.F.; Vilsboll-Larsen, T.; Maansson, C.T.; Doktor, T.K.; et al. Genome-wide epigenetic and mRNA-expression profiling followed by CRISPR/Cas9-mediated gene-disruptions corroborate the MIR141/MIR200C-ZEB1/ZEB2-FGFR1 axis in acquired EMT-associated EGFR TKI-resistance in NSCLC cells. Transl. Lung Cancer Res. 2023, 12, 42–65. [Google Scholar] [CrossRef]
- Dietz, L.L.; Furman, N.T.; Larsen, T.V.; Daugaard, T.F.; Thomsen, E.A.; Keller, J.L.; Aagaard, L.; Sorensen, B.S.; Nielsen, A.L. An Extended PD-L2 Cytoplasmic Domain Results From Alternative Splicing in NSCLC Cells. J. Immunother. 2022, 45, 379–388. [Google Scholar] [CrossRef]
- Liu, Z.; Chen, O.; Wall, J.B.J.; Zheng, M.; Zhou, Y.; Wang, L.; Vaseghi, H.R.; Qian, L.; Liu, J. Systematic comparison of 2A peptides for cloning multi-genes in a polycistronic vector. Sci. Rep. 2017, 7, 2193. [Google Scholar] [CrossRef] [PubMed] [Green Version]
- Zhou, X.; Vink, M.; Klaver, B.; Berkhout, B.; Das, A.T. Optimization of the Tet-On system for regulated gene expression through viral evolution. Gene Ther. 2006, 13, 1382–1390. [Google Scholar] [CrossRef] [PubMed]
- Friedland, A.E.; Baral, R.; Singhal, P.; Loveluck, K.; Shen, S.; Sanchez, M.; Marco, E.; Gotta, G.M.; Maeder, M.L.; Kennedy, E.M.; et al. Characterization of Staphylococcus aureus Cas9: A smaller Cas9 for all-in-one adeno-associated virus delivery and paired nickase applications. Genome Biol. 2015, 16, 257. [Google Scholar] [CrossRef] [PubMed] [Green Version]
- Qi, L.S.; Larson, M.H.; Gilbert, L.A.; Doudna, J.A.; Weissman, J.S.; Arkin, A.P.; Lim, W.A. Repurposing CRISPR as an RNA-guided platform for sequence-specific control of gene expression. Cell 2013, 152, 1173–1183. [Google Scholar] [CrossRef] [Green Version]
- Liu, X.S.; Wu, H.; Ji, X.; Stelzer, Y.; Wu, X.; Czauderna, S.; Shu, J.; Dadon, D.; Young, R.A.; Jaenisch, R. Editing DNA Methylation in the Mammalian Genome. Cell 2016, 167, 233–247.e17. [Google Scholar] [CrossRef] [Green Version]
- Lin, L.; Liu, Y.; Xu, F.; Huang, J.; Daugaard, T.F.; Petersen, T.S.; Hansen, B.; Ye, L.; Zhou, Q.; Fang, F.; et al. Genome-wide determination of on-target and off-target characteristics for RNA-guided DNA methylation by dCas9 methyltransferases. Gigascience 2018, 7, 1–19. [Google Scholar] [CrossRef]
- Yusa, K.; Zhou, L.; Li, M.A.; Bradley, A.; Craig, N.L. A hyperactive piggyBac transposase for mammalian applications. Proc. Natl. Acad. Sci. USA 2011, 108, 1531–1536. [Google Scholar] [CrossRef] [Green Version]
- Amini, M.; Hejazi, M.; Ghorban, K.; Mokhtarzadeh, A.; Baradaran, B. Identification of functional methylated CpG loci in PD-L1 promoter as the novel epigenetic biomarkers for primary gastric cancer. Gene 2021, 772, 145376. [Google Scholar] [CrossRef] [PubMed]
- Demuth, C.; Andersen, M.N.; Jakobsen, K.R.; Madsen, A.T.; Sorensen, B.S. Increased PD-L1 expression in erlotinib-resistant NSCLC cells with MET gene amplification is reversed upon MET-TKI treatment. Oncotarget 2017, 8, 68221–68229. [Google Scholar] [CrossRef] [Green Version]
- Larsen, T.V.; Hussmann, D.; Nielsen, A.L. PD-L1 and PD-L2 expression correlated genes in non-small-cell lung cancer. Cancer Commun. 2019, 39, 30. [Google Scholar] [CrossRef] [Green Version]
- Gao, Y.; Yang, J.; Cai, Y.; Fu, S.; Zhang, N.; Fu, X.; Li, L. IFN-gamma-mediated inhibition of lung cancer correlates with PD-L1 expression and is regulated by PI3K-AKT signaling. Int. J. Cancer 2018, 143, 931–943. [Google Scholar] [CrossRef] [Green Version]
- Sapozhnikov, D.M.; Szyf, M. Unraveling the functional role of DNA demethylation at specific promoters by targeted steric blockage of DNA methyltransferase with CRISPR/dCas9. Nat. Commun. 2021, 12, 5711. [Google Scholar] [CrossRef]
- Coelho, M.A.; de Carne Trecesson, S.; Rana, S.; Zecchin, D.; Moore, C.; Molina-Arcas, M.; East, P.; Spencer-Dene, B.; Nye, E.; Barnouin, K.; et al. Oncogenic RAS Signaling Promotes Tumor Immunoresistance by Stabilizing PD-L1 mRNA. Immunity 2017, 47, 1083–1099.e6. [Google Scholar] [CrossRef] [PubMed] [Green Version]
- Liu, C.; Zheng, S.; Wang, Z.; Wang, S.; Wang, X.; Yang, L.; Xu, H.; Cao, Z.; Feng, X.; Xue, Q.; et al. KRAS-G12D mutation drives immune suppression and the primary resistance of anti-PD-1/PD-L1 immunotherapy in non-small cell lung cancer. Cancer Commun. 2022, 42, 828–847. [Google Scholar] [CrossRef] [PubMed]
- Hu, X.; Lin, Z.; Wang, Z.; Zhou, Q. Emerging role of PD-L1 modification in cancer immunotherapy. Am. J. Cancer Res. 2021, 11, 3832–3840. [Google Scholar] [PubMed]
- Burr, M.L.; Sparbier, C.E.; Chan, Y.C.; Williamson, J.C.; Woods, K.; Beavis, P.A.; Lam, E.Y.N.; Henderson, M.A.; Bell, C.C.; Stolzenburg, S.; et al. CMTM6 maintains the expression of PD-L1 and regulates anti-tumour immunity. Nature 2017, 549, 101–105. [Google Scholar] [CrossRef] [PubMed] [Green Version]
- Mezzadra, R.; Sun, C.; Jae, L.T.; Gomez-Eerland, R.; de Vries, E.; Wu, W.; Logtenberg, M.E.W.; Slagter, M.; Rozeman, E.A.; Hofland, I.; et al. Identification of CMTM6 and CMTM4 as PD-L1 protein regulators. Nature 2017, 549, 106–110. [Google Scholar] [CrossRef]
- Skafi, N.; Fayyad-Kazan, M.; Badran, B. Immunomodulatory role for MicroRNAs: Regulation of PD-1/PD-L1 and CTLA-4 immune checkpoints expression. Gene 2020, 754, 144888. [Google Scholar] [CrossRef] [PubMed]
- Pauken, K.E.; Torchia, J.A.; Chaudhri, A.; Sharpe, A.H.; Freeman, G.J. Emerging concepts in PD-1 checkpoint biology. Semin. Immunol. 2021, 52, 101480. [Google Scholar] [CrossRef]


Disclaimer/Publisher’s Note: The statements, opinions and data contained in all publications are solely those of the individual author(s) and contributor(s) and not of MDPI and/or the editor(s). MDPI and/or the editor(s) disclaim responsibility for any injury to people or property resulting from any ideas, methods, instructions or products referred to in the content. |
© 2023 by the authors. Licensee MDPI, Basel, Switzerland. This article is an open access article distributed under the terms and conditions of the Creative Commons Attribution (CC BY) license (https://creativecommons.org/licenses/by/4.0/).
Share and Cite
Larsen, T.V.; Dybdal, N.; Daugaard, T.F.; Lade-Keller, J.; Lin, L.; Sorensen, B.S.; Nielsen, A.L. Examination of the Functional Relationship between PD-L1 DNA Methylation and mRNA Expression in Non-Small-Cell Lung Cancer. Cancers 2023, 15, 1909. https://doi.org/10.3390/cancers15061909
Larsen TV, Dybdal N, Daugaard TF, Lade-Keller J, Lin L, Sorensen BS, Nielsen AL. Examination of the Functional Relationship between PD-L1 DNA Methylation and mRNA Expression in Non-Small-Cell Lung Cancer. Cancers. 2023; 15(6):1909. https://doi.org/10.3390/cancers15061909
Chicago/Turabian StyleLarsen, Trine V., Nina Dybdal, Tina F. Daugaard, Johanne Lade-Keller, Lin Lin, Boe S. Sorensen, and Anders L. Nielsen. 2023. "Examination of the Functional Relationship between PD-L1 DNA Methylation and mRNA Expression in Non-Small-Cell Lung Cancer" Cancers 15, no. 6: 1909. https://doi.org/10.3390/cancers15061909