
FoxP3 Expression in Tumor-Infiltrating Lymphocytes as Potential Predictor of Response to Immune Checkpoint Inhibitors in Patients with Advanced Melanoma and Non-Small Cell Lung Cancer
 , , , ,
Abstract
:Simple Summary
Abstract
1. Introduction
2. Materials and Methods
3. Results
3.1. Patient Characteristics
3.2. Correlation with Survival Parameters in the Malignant Melanoma Group
3.3. Correlation with Survival Parameters in the NSCLC Group
3.4. Co-Expression of FoxP3 and CD68
3.5. Correlation of IHC Expression with Clinical Parameters
4. Discussion
5. Conclusions
Author Contributions
Funding
Institutional Review Board Statement
Informed Consent Statement
Data Availability Statement
Conflicts of Interest
References
- Wolchok, J.D.; Chiarion-Sileni, V.; Gonzalez, R.; Grob, J.-J.; Rutkowski, P.; Lao, C.D.; Cowey, C.L.; Schadendorf, D.; Wagstaff, J.; Dummer, R.; et al. CheckMate 067: 6.5-Year Outcomes in Patients (Pts) with Advanced Melanoma. JCO 2021, 39, 9506. [Google Scholar] [CrossRef]
- Sezer, A.; Kilickap, S.; Gümüş, M.; Bondarenko, I.; Özgüroğlu, M.; Gogishvili, M.; Turk, H.M.; Cicin, I.; Bentsion, D.; Gladkov, O.; et al. Cemiplimab Monotherapy for First-Line Treatment of Advanced Non-Small-Cell Lung Cancer with PD-L1 of at Least 50%: A Multicentre, Open-Label, Global, Phase 3, Randomised, Controlled Trial. Lancet 2021, 397, 592–604. [Google Scholar] [CrossRef]
- Reck, M.; Rodriguez-Abreu, D.; Robinson, A.; Hui, R.; Csoszi, T.; Fulop, A.; Gottfried, M.; Peled, N.; Tafreshi, A.; Cuffe, S.; et al. Updated Analysis of KEYNOTE-024: Pembrolizumab versus Platinum-Based Chemotherapy for Advanced Non-Small-Cell Lung Cancer with PD-L1 Tumor Proportion Score of 50% or Greater. Fac. Sci. Med. Health Pap. Part B 2019, 37, 537–546. [Google Scholar] [CrossRef]
- Herbst, R.S.; Giaccone, G.; de Marinis, F.; Reinmuth, N.; Vergnenegre, A.; Barrios, C.H.; Morise, M.; Felip, E.; Andric, Z.; Geater, S.; et al. Atezolizumab for First-Line Treatment of PD-L1–Selected Patients with NSCLC. N. Engl. J. Med. 2020, 383, 1328–1339. [Google Scholar] [CrossRef]
- Rizvi, N.A.; Hellmann, M.D.; Snyder, A.; Kvistborg, P.; Makarov, V.; Havel, J.J.; Lee, W.; Yuan, J.; Wong, P.; Ho, T.S.; et al. Mutational Landscape Determines Sensitivity to PD-1 Blockade in Non–Small Cell Lung Cancer. Science 2015, 348, 124–128. [Google Scholar] [CrossRef] [Green Version]
- Liu, D.; Yang, X.; Wu, X. Tumor Immune Microenvironment Characterization Identifies Prognosis and Immunotherapy-Related Gene Signatures in Melanoma. Front. Immunol. 2021, 12, 663495. [Google Scholar] [CrossRef]
- Murciano-Goroff, Y.R.; Warner, A.B.; Wolchok, J.D. The Future of Cancer Immunotherapy: Microenvironment-Targeting Combinations. Cell Res. 2020, 30, 507–519. [Google Scholar] [CrossRef]
- Gainor, J.F.; Shaw, A.T.; Sequist, L.V.; Fu, X.; Azzoli, C.G.; Piotrowska, Z.; Huynh, T.; Zhao, L.; Fulton, L.; Schultz, K.R.; et al. EGFR Mutations and ALK Rearrangements Are Associated with Low Response Rates to PD-1 Pathway Blockade in Non-Small Cell Lung Cancer (NSCLC): A Retrospective Analysis. Clin. Cancer Res. 2016, 22, 4585–4593. [Google Scholar] [CrossRef] [Green Version]
- Han, J.; Khatwani, N.; Searles, T.G.; Turk, M.J.; Angeles, C.V. Memory CD8+ T Cell Responses to Cancer. Semin. Immunol. 2020, 49, 101435. [Google Scholar] [CrossRef]
- Tumeh, P.C.; Harview, C.L.; Yearley, J.H.; Shintaku, I.P.; Taylor, E.J.M.; Robert, L.; Chmielowski, B.; Spasic, M.; Henry, G.; Ciobanu, V.; et al. PD-1 Blockade Induces Responses by Inhibiting Adaptive Immune Resistance. Nature 2014, 515, 568–571. [Google Scholar] [CrossRef] [Green Version]
- Zhang, J.; Li, S.; Liu, F.; Yang, K. Role of CD68 in Tumor Immunity and Prognosis Prediction in Pan-Cancer. Sci. Rep. 2022, 12, 7844. [Google Scholar] [CrossRef] [PubMed]
- Griss, J.; Bauer, W.; Wagner, C.; Simon, M.; Chen, M.; Grabmeier-Pfistershammer, K.; Maurer-Granofszky, M.; Roka, F.; Penz, T.; Bock, C.; et al. B Cells Sustain Inflammation and Predict Response to Immune Checkpoint Blockade in Human Melanoma. Nat. Commun. 2019, 10, 4186. [Google Scholar] [CrossRef] [PubMed] [Green Version]
- Willsmore, Z.N.; Harris, R.J.; Crescioli, S.; Hussein, K.; Kakkassery, H.; Thapa, D.; Cheung, A.; Chauhan, J.; Bax, H.J.; Chenoweth, A.; et al. B Cells in Patients With Melanoma: Implications for Treatment With Checkpoint Inhibitor Antibodies. Front. Immunol. 2021, 11, 622442. [Google Scholar] [CrossRef] [PubMed]
- Koyama, S.; Akbay, E.A.; Li, Y.Y.; Herter-Sprie, G.S.; Buczkowski, K.A.; Richards, W.G.; Gandhi, L.; Redig, A.J.; Rodig, S.J.; Asahina, H.; et al. Adaptive Resistance to Therapeutic PD-1 Blockade Is Associated with Upregulation of Alternative Immune Checkpoints. Nat. Commun. 2016, 7, 10501. [Google Scholar] [CrossRef] [Green Version]
- Acharya, N.; Sabatos-Peyton, C.; Anderson, A.C. Tim-3 Finds Its Place in the Cancer Immunotherapy Landscape. J. Immunother. Cancer 2020, 8, e000911. [Google Scholar] [CrossRef]
- Liu, M.; Wang, X.; Wang, L.; Ma, X.; Gong, Z.; Zhang, S.; Li, Y. Targeting the IDO1 Pathway in Cancer: From Bench to Bedside. J. Hematol. Oncol. 2018, 11, 100. [Google Scholar] [CrossRef] [Green Version]
- Tawbi, H.A.; Schadendorf, D.; Lipson, E.J.; Ascierto, P.A.; Matamala, L.; Castillo Gutiérrez, E.; Rutkowski, P.; Gogas, H.J.; Lao, C.D.; De Menezes, J.J.; et al. Relatlimab and Nivolumab versus Nivolumab in Untreated Advanced Melanoma. N. Engl. J. Med. 2022, 386, 24–34. [Google Scholar] [CrossRef]
- Long, G.V.; Dummer, R.; Hamid, O.; Gajewski, T.F.; Caglevic, C.; Dalle, S.; Arance, A.; Carlino, M.S.; Grob, J.-J.; Kim, T.M.; et al. Epacadostat plus Pembrolizumab versus Placebo plus Pembrolizumab in Patients with Unresectable or Metastatic Melanoma (ECHO-301/KEYNOTE-252): A Phase 3, Randomised, Double-Blind Study. Lancet Oncol. 2019, 20, 1083–1097. [Google Scholar] [CrossRef]
- Mariathasan, S.; Turley, S.J.; Nickles, D.; Castiglioni, A.; Yuen, K.; Wang, Y.; Kadel III, E.E.; Koeppen, H.; Astarita, J.L.; Cubas, R.; et al. TGFβ Attenuates Tumour Response to PD-L1 Blockade by Contributing to Exclusion of T Cells. Nature 2018, 554, 544–548. [Google Scholar] [CrossRef]
- Allan, S.E.; Alstad, A.N.; Merindol, N.; Crellin, N.K.; Amendola, M.; Bacchetta, R.; Naldini, L.; Roncarolo, M.G.; Soudeyns, H.; Levings, M.K. Generation of Potent and Stable Human CD4+ T Regulatory Cells by Activation-Independent Expression of FOXP3. Mol. Ther. 2008, 16, 194–202. [Google Scholar] [CrossRef]
- González-Navajas, J.M.; Fan, D.D.; Yang, S.; Yang, F.M.; Lozano-Ruiz, B.; Shen, L.; Lee, J. The Impact of Tregs on the Anticancer Immunity and the Efficacy of Immune Checkpoint Inhibitor Therapies. Front. Immunol. 2021, 12, 625783. [Google Scholar] [CrossRef] [PubMed]
- Ohue, Y.; Nishikawa, H. Regulatory T (Treg) Cells in Cancer: Can Treg Cells Be a New Therapeutic Target? Cancer Sci. 2019, 110, 2080–2089. [Google Scholar] [CrossRef] [PubMed] [Green Version]
- Zuo, T.; Wang, L.; Morrison, C.; Chang, X.; Zhang, H.; Li, W.; Liu, Y.; Wang, Y.; Liu, X.; Chan, M.W.Y.; et al. FOXP3 Is an X-Linked Breast Cancer Suppressor Gene and an Important Repressor of the HER-2/ErbB2 Oncogene. Cell 2007, 129, 1275–1286. [Google Scholar] [CrossRef] [PubMed] [Green Version]
- Wang, L.; Liu, R.; Li, W.; Chen, C.; Katoh, H.; Chen, G.-Y.; McNally, B.; Lin, L.; Zhou, P.; Zuo, T.; et al. Somatic Single-Hits Inactivate the X-Linked Tumor Suppressor FOXP3 in the Prostate. Cancer Cell 2009, 16, 336–346. [Google Scholar] [CrossRef] [PubMed] [Green Version]
- Hinz, S.; Pagerols-Raluy, L.; Oberg, H.-H.; Ammerpohl, O.; Grüssel, S.; Sipos, B.; Grützmann, R.; Pilarsky, C.; Ungefroren, H.; Saeger, H.-D.; et al. Foxp3 Expression in Pancreatic Carcinoma Cells as a Novel Mechanism of Immune Evasion in Cancer. Cancer Res. 2007, 67, 8344–8350. [Google Scholar] [CrossRef] [Green Version]
- Ebert, L.M.; Tan, B.S.; Browning, J.; Svobodova, S.; Russell, S.E.; Kirkpatrick, N.; Gedye, C.; Moss, D.; Ng, S.P.; MacGregor, D.; et al. The Regulatory T Cell-Associated Transcription Factor FoxP3 Is Expressed by Tumor Cells. Cancer Res. 2008, 68, 3001–3009. [Google Scholar] [CrossRef] [Green Version]
- Shang, B.; Liu, Y.; Jiang, S.; Liu, Y. Prognostic Value of Tumor-Infiltrating FoxP3+ Regulatory T Cells in Cancers: A Systematic Review and Meta-Analysis. Sci. Rep. 2015, 5, 15179. [Google Scholar] [CrossRef] [Green Version]
- Ma, G.-F.; Miao, Q.; Liu, Y.-M.; Gao, H.; Lian, J.-J.; Wang, Y.-N.; Zeng, X.-Q.; Luo, T.-C.; Ma, L.-L.; Shen, Z.-B.; et al. High FoxP3 Expression in Tumour Cells Predicts Better Survival in Gastric Cancer and Its Role in Tumour Microenvironment. Br. J. Cancer 2014, 110, 1552–1560. [Google Scholar] [CrossRef] [Green Version]
- Hao, Q.; Zhang, C.; Gao, Y.; Wang, S.; Li, J.; Li, M.; Xue, X.; Li, W.; Zhang, W.; Zhang, Y. FOXP3 Inhibits NF-ΚB Activity and Hence COX2 Expression in Gastric Cancer Cells. Cell. Signal. 2014, 26, 564–569. [Google Scholar] [CrossRef]
- Cioplea, M.; Nichita, L.; Georgescu, D.; Sticlaru, L.; Cioroianu, A.; Nedelcu, R.; Turcu, G.; Rauta, A.; Mogodici, C.; Zurac, S.; et al. FOXP3 in Melanoma with Regression: Between Tumoral Expression and Regulatory T Cell Upregulation. J. Immunol. Res. 2020, 2020, 5416843. [Google Scholar] [CrossRef]
- Yang, S.; Liu, Y.; Li, M.-Y.; Ng, C.S.H.; Yang, S.; Wang, S.; Zou, C.; Dong, Y.; Du, J.; Long, X.; et al. FOXP3 Promotes Tumor Growth and Metastasis by Activating Wnt/β-Catenin Signaling Pathway and EMT in Non-Small Cell Lung Cancer. Mol. Cancer 2017, 16, 124. [Google Scholar] [CrossRef] [PubMed]
- Tan, C.L.; Kuchroo, J.R.; Sage, P.T.; Liang, D.; Francisco, L.M.; Buck, J.; Thaker, Y.R.; Zhang, Q.; McArdel, S.L.; Juneja, V.R.; et al. PD-1 Restraint of Regulatory T Cell Suppressive Activity Is Critical for Immune Tolerance. J. Exp. Med. 2020, 218, e20182232. [Google Scholar] [CrossRef] [PubMed]
- Kamada, T.; Togashi, Y.; Tay, C.; Ha, D.; Sasaki, A.; Nakamura, Y.; Sato, E.; Fukuoka, S.; Tada, Y.; Tanaka, A.; et al. PD-1+ Regulatory T Cells Amplified by PD-1 Blockade Promote Hyperprogression of Cancer. Proc. Natl. Acad. Sci. USA 2019, 116, 9999–10008. [Google Scholar] [CrossRef] [PubMed] [Green Version]
- Revenko, A.; Carnevalli, L.S.; Sinclair, C.; Johnson, B.; Peter, A.; Taylor, M.; Hettrick, L.; Chapman, M.; Klein, S.; Solanki, A.; et al. Direct Targeting of FOXP3 in Tregs with AZD8701, a Novel Antisense Oligonucleotide to Relieve Immunosuppression in Cancer. J. Immunother. Cancer 2022, 10, e003892. [Google Scholar] [CrossRef]
- Selby, M.J.; Engelhardt, J.J.; Quigley, M.; Henning, K.A.; Chen, T.; Srinivasan, M.; Korman, A.J. Anti-CTLA-4 Antibodies of IgG2a Isotype Enhance Antitumor Activity through Reduction of Intratumoral Regulatory T Cells. Cancer Immunol. Res. 2013, 1, 32–42. [Google Scholar] [CrossRef] [PubMed] [Green Version]
- Hodi, F.S.; Butler, M.; Oble, D.A.; Seiden, M.V.; Haluska, F.G.; Kruse, A.; MacRae, S.; Nelson, M.; Canning, C.; Lowy, I.; et al. Immunologic and Clinical Effects of Antibody Blockade of Cytotoxic T Lymphocyte-Associated Antigen 4 in Previously Vaccinated Cancer Patients. Proc. Natl. Acad. Sci. USA 2008, 105, 3005–3010. [Google Scholar] [CrossRef] [PubMed] [Green Version]
- Salmi, S.; Siiskonen, H.; Sironen, R.; Tyynelä-Korhonen, K.; Hirschovits-Gerz, B.; Valkonen, M.; Auvinen, P.; Pasonen-Seppänen, S. The Number and Localization of CD68+ and CD163+ Macrophages in Different Stages of Cutaneous Melanoma. Melanoma Res. 2019, 29, 237–247. [Google Scholar] [CrossRef] [Green Version]
- Van Dalen, F.; van Stevendaal, M.; Fennemann, F.; Verdoes, M.; Ilina, O. Molecular Repolarisation of Tumour-Associated Macrophages. Molecules 2018, 24, 9. [Google Scholar] [CrossRef] [Green Version]
- Arlauckas, S.P.; Garris, C.S.; Kohler, R.H.; Kitaoka, M.; Cuccarese, M.F.; Yang, K.S.; Miller, M.A.; Carlson, J.C.; Freeman, G.J.; Anthony, R.M.; et al. In Vivo Imaging Reveals a Tumor-Associated Macrophage Mediated Resistance Pathway in Anti-PD-1 Therapy. Sci. Transl. Med. 2017, 9, eaal3604. [Google Scholar] [CrossRef] [Green Version]
- Gunnarsson, U.; Strigård, K.; Edin, S.; Gkekas, I.; Mustonen, H.; Kaprio, T.; Böckelman, C.; Hagström, J.; Palmqvist, R.; Haglund, C. Association between Local Immune Cell Infiltration, Mismatch Repair Status and Systemic Inflammatory Response in Colorectal Cancer. J. Transl. Med. 2020, 18, 178. [Google Scholar] [CrossRef] [Green Version]
- Morrison, C.; Pabla, S.; Conroy, J.M.; Nesline, M.K.; Glenn, S.T.; Dressman, D.; Papanicolau-Sengos, A.; Burgher, B.; Andreas, J.; Giamo, V.; et al. Predicting Response to Checkpoint Inhibitors in Melanoma beyond PD-L1 and Mutational Burden. J. Immunother. Cancer 2018, 6, 32. [Google Scholar] [CrossRef] [PubMed]
- Larkin, J.; Chiarion-Sileni, V.; Gonzalez, R.; Grob, J.J.; Cowey, C.L.; Lao, C.D.; Schadendorf, D.; Dummer, R.; Smylie, M.; Rutkowski, P.; et al. Combined Nivolumab and Ipilimumab or Monotherapy in Untreated Melanoma. N. Engl. J. Med. 2015, 373, 23–34. [Google Scholar] [CrossRef] [PubMed] [Green Version]
- Yang, J.; Dong, M.; Shui, Y.; Zhang, Y.; Zhang, Z.; Mi, Y.; Zuo, X.; Jiang, L.; Liu, K.; Liu, Z.; et al. A Pooled Analysis of the Prognostic Value of PD-L1 in Melanoma: Evidence from 1062 Patients. Cancer Cell Int. 2020, 20, 96. [Google Scholar] [CrossRef] [PubMed] [Green Version]


| Variable | Overall N = 46 | Malignant Melanoma N = 31 | NSCLC N = 15 |
|---|---|---|---|
| Age (years) | |||
| Median (IQR) | 68 (62, 73) | 70 (64, 76) | 65 (59, 71) |
| Range | 43, 85 | 52, 85 | 43, 79 |
| Sex | |||
| Women | 11 (24%) | 8 (26%) | 3 (20%) |
| Men | 35 (76%) | 23 (74%) | 12 (80%) |
| Lymphocytes (×109/L) | |||
| ≤0.8 | 6 (13%) | 4 (13%) | 2 (13%) |
| >0.8 | 40 (87%) | 27 (87%) | 13 (87%) |
| Leukocytes (×109/L) | |||
| ≤10 | 37 (80%) | 28 (90%) | 9 (60%) |
| >10 | 9 (20%) | 3 (9.7%) | 6 (40%) |
| Neutrophils (×109/L) | |||
| ≤7 | 39 (85%) | 29 (94%) | 10 (67%) |
| >7 | 7 (15%) | 2 (6.5%) | 5 (33%) |
| Monocytes (×109/L) | |||
| ≤1.2 | 40 (87%) | 26 (84%) | 14 (93%) |
| >1.2 | 6 (13%) | 5 (16%) | 1 (6.7%) |
| LDH (μkat/L) | |||
| ≤3.55 (Men), 3.75 (Women) | 31 (78%) | 18 (72%) | 13 (87%) |
| >3.55 (Men), 3.75 (Women) | 9 (22%) | 7 (28%) | 2 (13%) |
| Missing | 6 | 6 | 0 |
| CRP (mg/L) | |||
| ≤5 | 18 (49%) | 14 (64%) | 4 (27%) |
| >5 | 19 (51%) | 8 (36%) | 11 (73%) |
| Missing | 9 | 9 | 0 |
| Metformin comedication | |||
| Yes | 4 (8.7%) | 1 (3.2%) | 3 (20%) |
| No | 42 (91.3%) | 30 (96.8%) | 12 (80%) |
| PPI comedication | |||
| Yes | 7 (15.2%) | 2 (6.4%) | 5 (33.3%) |
| No | 39 (84.8%) | 29 (93.6%) | 10 (66.6%) |
| Line of treatment | |||
| 1st line | 36 (78%) | 30 (97%) | 6 (40%) |
| 2nd line | 8 (17%) | 0 (0%) | 8 (53%) |
| 3rd or later line | 2 (4.4%) | 1 (3.2%) | 1 (6.7%) |
| Best overall response | |||
| Complete response | 10 (23%) | 9 (29%) | 1 (7.7%) |
| Partial response | 14 (32%) | 8 (26%) | 6 (46%) |
| Stable disease | 2 (4.5%) | 1 (3.2%) | 1 (7.7%) |
| Disease progression | 18 (41%) | 13 (42%) | 5 (38%) |
| Unknown | 2 | 0 | 2 |
| Clinical benefit rate | 25 (56.8%) | 18 (58.1%) | 7 (54%) |
| Unknown | 2 | 0 | 2 |
| Survival parameters (median, 95% CI) | |||
| PFS (months) | 10 (5.1, 19) | 11 (4.8, —) | 8.2 (5.1, —) |
| OS (months) | 25 (18, —) | 27 (20, —) | 15 (9.3, —) |
| Gene Variant | All Patients | Malignant Melanoma | NSCLC | |||
|---|---|---|---|---|---|---|
| BRAF | 14 | 45.2% | 14 | 53.8% | 0 | 0.0% |
| NRAS | 12 | 38.7% | 12 | 46.2% | 0 | 0.0% |
| TP53 | 8 | 25.8% | 5 | 19.2% | 2 | 40.0% |
| KRAS | 3 | 9.7% | 1 | 3.8% | 2 | 40.0% |
| ARID2 | 3 | 9.7% | 0 | 0.0% | 0 | 0.0% |
| CDKN2A | 3 | 9.7% | 3 | 11.5% | 0 | 0.0% |
| CTNNB1 | 2 | 6.5% | 2 | 7.7% | 0 | 0.0% |
| PTEN | 2 | 6.5% | 0 | 0.0% | 2 | 40.0% |
| ARID1A | 1 | 3.2% | 1 | 3.8% | 0 | 0.0% |
| ATM | 1 | 3.2% | 0 | 0.0% | 1 | 20.0% |
| POLE | 1 | 3.2% | 1 | 3.8% | 0 | 0.0% |
| SF3B1 | 1 | 3.2% | 1 | 3.8% | 0 | 0.0% |
| PFS | OS | ||||||
|---|---|---|---|---|---|---|---|
| Characteristic | N | HR | Median Survival | p-Value | HR | Median Survival | p-Value |
| CD3 IEL | 0.202 | 0.122 | |||||
| Negative | 13 | — | — | — | — | ||
| Positive | 16 | 1.87 | 8.8 | 2.27 | 25 | ||
| CD3 stromal | 0.667 | 0.834 | |||||
| Negative | 6 | — | 9.5 | — | 47 | ||
| Positive | 22 | 0.78 | 15 | 1.15 | 26 | ||
| CD8 IEL | 0.484 | 0.093 | |||||
| Negative | 17 | — | 11 | — | — | ||
| Positive | 12 | 1.38 | 10 | 2.31 | 22 | ||
| CD8 stromal | 0.811 | 0.539 | |||||
| Negative | 7 | — | 11 | — | 13 | ||
| Positive | 22 | 1.14 | 9.5 | 0.70 | 27 | ||
| CD20 | 0.966 | 0.417 | |||||
| Negative | 26 | — | 9.5 | — | 31 | ||
| Positive | 4 | 0.97 | 13 | 1.68 | 25 | ||
| CD68 | 0.034 | 0.968 | |||||
| Negative | 26 | — | 15 | — | 27 | ||
| Positive | 4 | 3.21 | 4.1 | 1.03 | 36 | ||
| FoxP3 | 0.048 | 0.852 | |||||
| Negative | 25 | — | 17 | — | 27 | ||
| Positive | 4 | 3.04 | 4.5 | 1.15 | 33 | ||
| IDO1 | 0.519 | 0.180 | |||||
| Negative | 23 | — | 8.0 | — | 26 | ||
| Positive | 7 | 0.70 | 15 | 0.38 | — | ||
| LAG-3 | 0.606 | 0.770 | |||||
| Negative | 23 | — | 11 | — | 31 | ||
| Positive | 7 | 0.75 | 15 | 1.18 | 25 | ||
| TGFβ IC | 0.384 | 0.366 | |||||
| Negative | 16 | — | 5.5 | — | 27 | ||
| Positive | 14 | 0.67 | 16 | 0.63 | — | ||
| TGFβ TC | 0.916 | 0.991 | |||||
| Negative | 26 | — | 11 | — | 27 | ||
| Positive | 4 | 0.92 | 33 | 1.01 | 39 | ||
| PD1 | 0.850 | 0.501 | |||||
| Negative | 22 | — | 11 | — | 31 | ||
| Positive | 8 | 1.10 | 10 | 1.44 | 25 | ||
| PD-L1 CPS | 0.052 | 0.794 | |||||
| <1 | 9 | — | 6.2 | — | 27 | ||
| ≥1 | 17 | 0.39 | 17 | 0.87 | 25 | ||
| PD-L1 CPS | 0.195 | 0.529 | |||||
| <10 | 19 | — | 8.0 | — | 26 | ||
| ≥10 | 7 | 0.45 | — | 0.67 | — | ||
| PD-L1 CPS | 0.407 | 0.240 | |||||
| <50 | 22 | — | 9.5 | — | 25 | ||
| ≥50 | 4 | 0.54 | 30 | 0.31 | — | ||
| PD-L1 TPS | 0.005 | 0.060 | |||||
| <1 | 18 | — | 5.5 | — | 20 | ||
| ≥1 | 9 | 0.20 | — | 0.32 | — | ||
| PD-L1 TPS | 0.268 | 0.467 | |||||
| <10 | 24 | — | 9.5 | — | 25 | ||
| ≥10 | 3 | 0.34 | — | 0.48 | — | ||
| PD-L1 TPS | 0.268 | 0.467 | |||||
| <50 | 24 | — | 9.5 | — | 25 | ||
| ≥50 | 3 | 0.34 | — | 0.48 | — | ||
| TMB high | 0.058 | 0.923 | |||||
| Negative | 9 | — | 4.4 | — | 27 | ||
| Positive | 17 | 0.41 | 15 | 0.95 | 26 | ||
| PFS | OS | ||||||
|---|---|---|---|---|---|---|---|
| Characteristic | N | HR | Median Survival | p-Value | HR | Median Survival | p-Value |
| CD3 IEL | 0.767 | 0.980 | |||||
| Negative | 7 | — | 6.1 | — | 14 | ||
| Positive | 8 | 1.20 | 10 | 1.02 | 19 | ||
| CD3 stromal | 0.289 | 0.258 | |||||
| Negative | 4 | — | 4.9 | — | 14 | ||
| Positive | 11 | 0.46 | 13 | 0.47 | 22 | ||
| CD8 IEL | 0.089 | 0.122 | |||||
| Negative | 9 | — | 14 | — | 19 | ||
| Positive | 5 | 2.86 | 4.8 | 2.60 | 9.3 | ||
| CD8 stromal | 0.131 | 0.423 | |||||
| Negative | 7 | — | 22 | — | 15 | ||
| Positive | 7 | 2.75 | 5.1 | 1.67 | 11 | ||
| CD20 | 0.522 | 0.701 | |||||
| Negative | 13 | — | 8.2 | — | 15 | ||
| Positive | 2 | 1.66 | 10 | 0.67 | 17 | ||
| CD68 | 0.097 | 0.182 | |||||
| Negative | 14 | — | 10 | — | 17 | ||
| Positive | 1 | 5.98 | 2.3 | 4.14 | 8.5 | ||
| FoxP3 | 0.003 | 0.035 | |||||
| Negative | 11 | — | 15 | — | 22 | ||
| Positive | 4 | 8.70 | 3.4 | 3.86 | 8.3 | ||
| IDO1 | 0.767 | 0.601 | |||||
| Negative | 13 | — | 8.2 | — | 15 | ||
| Positive | 2 | 1.27 | 10 | 1.51 | 13 | ||
| LAG-3 | 0.146 | 0.293 | |||||
| Negative | 11 | — | 13 | — | 19 | ||
| Positive | 4 | 2.47 | 3.3 | 1.92 | 12 | ||
| TGFβ IC | 0.115 | 0.066 | |||||
| Negative | 13 | — | 13 | — | 19 | ||
| Positive | 2 | 3.47 | 3.7 | 4.35 | 7.0 | ||
| TGFβ TC * | |||||||
| Negative | 15 | ||||||
| Positive | 0 | ||||||
| PD1 | 0.807 | 0.693 | |||||
| Negative | 12 | — | 6.1 | — | 14 | ||
| Positive | 3 | 1.18 | 15 | 1.31 | 22 | ||
| PD-L1 CPS | 0.162 | 0.222 | |||||
| <1 | 1 | — | — | — | — | ||
| ≥1 | 14 | 6.1 | 14 | ||||
| PD-L1 CPS | 0.481 | 0.553 | |||||
| <10 | 5 | — | 19 | — | 14 | ||
| ≥10 | 10 | 1.73 | 8.2 | 0.69 | 19 | ||
| PD-L1 CPS | 0.439 | 0.437 | |||||
| <50 | 9 | — | 14 | — | 19 | ||
| ≥50 | 6 | 1.60 | 5.5 | 1.63 | 13 | ||
| PD-L1 TPS | 0.313 | 0.712 | |||||
| <1 | 6 | — | 19 | — | 16 | ||
| ≥1 | 9 | 1.98 | 6.1 | 0.80 | 15 | ||
| PD-L1 TPS | 0.313 | 0.712 | |||||
| <10 | 6 | — | 19 | — | 16 | ||
| ≥10 | 9 | 1.98 | 6.1 | 0.80 | 15 | ||
| PD-L1 TPS | 0.557 | 0.649 | |||||
| <50 | 10 | — | 10 | — | 16 | ||
| ≥50 | 5 | 1.45 | 4.8 | 1.34 | 15 | ||
| TMB high | 0.199 | 0.063 | |||||
| Negative | 3 | — | 6.1 | — | 11 | ||
| Positive | 2 | 0.00 | 21 | 0.00 | 23 | ||
| CD68 Expression | ||||
|---|---|---|---|---|
| Negative | Positive | Total | p-Value 1 | |
| FoxP3 nuclear expression | 0.004 | |||
| negative | 24 (96%) | 1 (4.0%) | 25 (100%) | |
| positive | 1 (25%) | 3 (75%) | 4 (100%) | |
| total | 25 (86%) | 4 (14%) | 29 (100%) | |
| CD68 Expression | ||||
|---|---|---|---|---|
| Negative | Positive | Total | p-Value 1 | |
| FoxP3 nuclear expression | 0.999 | |||
| negative | 10 (91%) | 1 (9.1%) | 11 (100%) | |
| positive | 4 (100%) | 0 (0%) | 4 (100%) | |
| total | 14 (93%) | 1 (6.7%) | 15 (100%) | |
| PFS | OS | ||||||
|---|---|---|---|---|---|---|---|
| Characteristic | N | HR | Median Survival | p-Value | HR | Median Survival | p-Value |
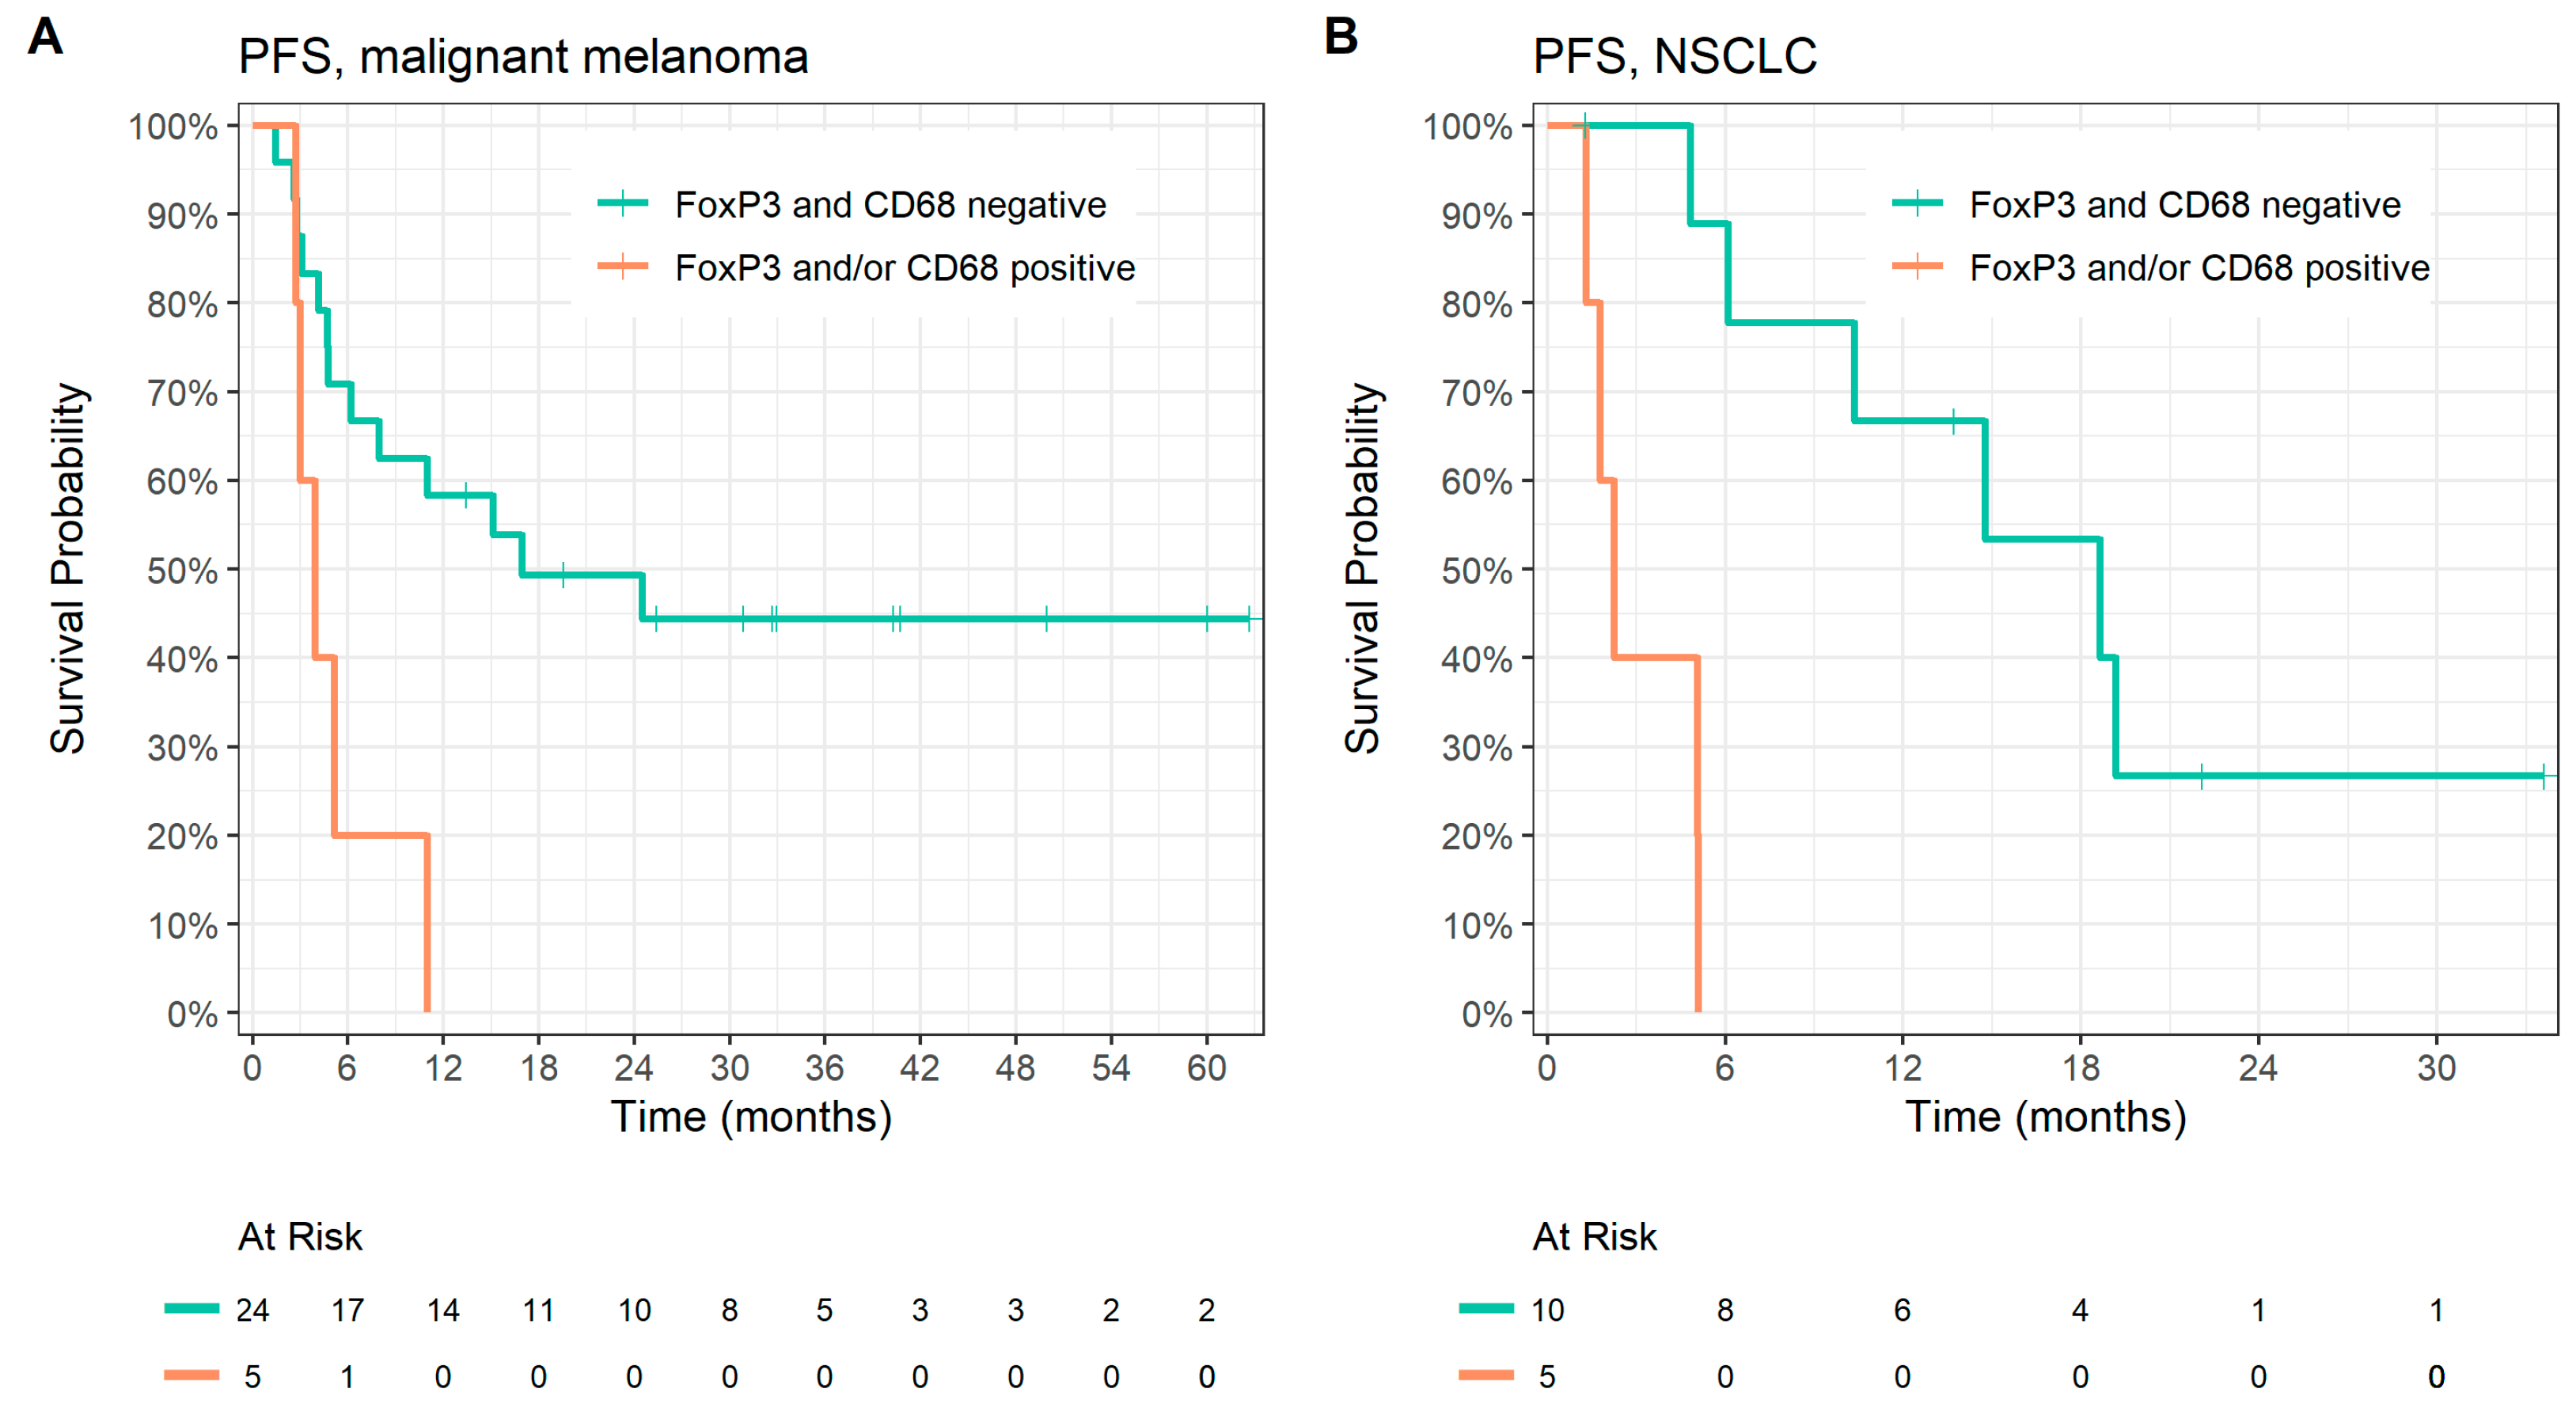
| FoxP3 + CD68 (melanoma group) | 0.025 | 0.517 | |||||
| Both Negative | 24 | — | 17 | — | 27 | ||
| Positive | 5 | 3.97 | 3.9 | 1.55 | 15 | ||
| FoxP3 + CD68 (NSCLC group) | 0.001 | 0.020 | |||||
| Both Negative | 10 | — | 19 | — | 23 | ||
| Positive | 5 | 18.8 | 2.3 | 5.24 | 8.5 | ||
| CRP | |||||
|---|---|---|---|---|---|
| ≤5 mg/L | >5 mg/L | Missing | Total | p-Value | |
| FoxP3 expression | 0.024 | ||||
| Negative | 17 (47%) | 13 (36%) | 6 (17%) | 36 (100%) | |
| Positive | 0 (0%) | 6 (75%) | 2 (25%) | 8 (100%) | |
| Missing | 1 (50%) | 0 (0%) | 1 (50%) | 2 (100%) | |
| Total | 18 (39%) | 19 (41%) | 9 (20%) | 46 (100%) | |
Disclaimer/Publisher’s Note: The statements, opinions and data contained in all publications are solely those of the individual author(s) and contributor(s) and not of MDPI and/or the editor(s). MDPI and/or the editor(s) disclaim responsibility for any injury to people or property resulting from any ideas, methods, instructions or products referred to in the content. |
© 2023 by the authors. Licensee MDPI, Basel, Switzerland. This article is an open access article distributed under the terms and conditions of the Creative Commons Attribution (CC BY) license (https://creativecommons.org/licenses/by/4.0/).
Share and Cite
Grell, P.; Borilova, S.; Fabian, P.; Selingerova, I.; Novak, D.; Muller, P.; Kiss, I.; Vyzula, R. FoxP3 Expression in Tumor-Infiltrating Lymphocytes as Potential Predictor of Response to Immune Checkpoint Inhibitors in Patients with Advanced Melanoma and Non-Small Cell Lung Cancer. Cancers 2023, 15, 1901. https://doi.org/10.3390/cancers15061901
Grell P, Borilova S, Fabian P, Selingerova I, Novak D, Muller P, Kiss I, Vyzula R. FoxP3 Expression in Tumor-Infiltrating Lymphocytes as Potential Predictor of Response to Immune Checkpoint Inhibitors in Patients with Advanced Melanoma and Non-Small Cell Lung Cancer. Cancers. 2023; 15(6):1901. https://doi.org/10.3390/cancers15061901
Chicago/Turabian StyleGrell, Peter, Simona Borilova, Pavel Fabian, Iveta Selingerova, David Novak, Petr Muller, Igor Kiss, and Rostislav Vyzula. 2023. "FoxP3 Expression in Tumor-Infiltrating Lymphocytes as Potential Predictor of Response to Immune Checkpoint Inhibitors in Patients with Advanced Melanoma and Non-Small Cell Lung Cancer" Cancers 15, no. 6: 1901. https://doi.org/10.3390/cancers15061901