Article

Standardization of Body Composition Status in Patients with Advanced Urothelial Tumors: The Role of a CT-Based AI-Powered Software for the Assessment of Sarcopenia and Patient Outcome Correlation

1
Department of Radiological Sciences, Oncology and Pathology, Sapienza University of Rome, 00161 Rome, Italy
2
Department of Maternal Infant and Urologic Sciences, Sapienza University of Rome, 00161 Rome, Italy
3
Department of Translational and Precision Medicine, Sapienza University of Rome, 00161 Rome, Italy
*
Author to whom correspondence should be addressed.
Cancers 2023, 15(11), 2968; https://doi.org/10.3390/cancers15112968
Submission received: 25 March 2023 / Revised: 26 May 2023 / Accepted: 26 May 2023 / Published: 29 May 2023
(This article belongs to the Special Issue Updates on Imaging of Common Urogenital Neoplasms)

Abstract

:

Simple Summary

Artificial Intelligence (AI)-driven software that utilizes Computed Tomography (CT)images has the capability to automatically assess body composition and diagnose sarcopenia. Our research indicates that combining standardized CT staging methods with sarcopenia analysis could assist in identifying patients with advanced urothelial tumors who may benefit from customized nutritional therapies, ultimately resulting in improved outcomes and quality of life. The AI tool can represent a means to increase the clinical value of CT imaging reports and to promote the development of precision medicine.

Abstract

Background: Sarcopenia is a well know prognostic factor in oncology, influencing patients’ quality of life and survival. We aimed to investigate the role of sarcopenia, assessed by a Computed Tomography (CT)-based artificial intelligence (AI)-powered-software, as a predictor of objective clinical benefit in advanced urothelial tumors and its correlations with oncological outcomes. Methods: We retrospectively searched patients with advanced urothelial tumors, treated with systemic platinum-based chemotherapy and an available total body CT, performed before and after therapy. An AI-powered software was applied to CT to obtain the Skeletal Muscle Index (SMI-L3), derived from the area of the psoas, long spine, and abdominal muscles, at the level of L3 on CT axial images. Logistic and Cox-regression modeling was implemented to explore the association of sarcopenic status and anthropometric features to the clinical benefit rate and survival endpoints. Results: 97 patients were included, 66 with bladder cancer and 31 with upper-tract urothelial carcinoma. Clinical benefit outcomes showed a linear positive association with all the observed body composition variables variations. The chances of not experiencing disease progression were positively associated with ∆_SMI-L3, ∆_psoas, and ∆_long spine muscle when they ranged from ~10–20% up to ~45–55%. Greater survival chances were matched by patients achieving a wider ∆_SMI-L3, ∆_abdominal and ∆_long spine muscle. Conclusions: A CT-based AI-powered software body composition and sarcopenia analysis provide prognostic assessments for objective clinical benefits and oncological outcomes.

1. Introduction

Cancer cachexia is a complex condition where there is a progressive reduction in skeletal muscle mass that cannot be fully restored by traditional nutritional intervention, resulting in a gradual decline in bodily functions. The loss of muscle mass and malnutrition are common conditions found in cancer patients, with an incidence ranging from 25% to 60% depending on the type of cancer, stage of disease, and type of treatment [1]. The low muscle mass represents one of the criteria for malnutrition diagnosis according to Global Leadership Initiative on Malnutrition (GLIM) guidelines [2]. Despite affecting about half of patients at diagnosis as described in the PreMIO observational study conducted on over 1000 patients suffering from different solid tumors [3], malnutrition is often underestimated and not fully considered by urogenital oncologists. Standardization of the sarcopenia definition is an urgent issue in oncology [4] indeed no screening tests to assess sarcopenia and/or the risk of malnutrition are usually requested at disease diagnosis. Cachexia has been shown to be a significant poor prognostic factor for relapse-free survival of patients affected with urothelial tumors. [5] Currently, there is no standard method for diagnosing sarcopenia in genitourinary tumor [6] patients, particularly for urothelial tumors, [7] differently from other diagnostic procedures [8,9,10,11,12,13]. A Computed Tomography (CT)-based imaging for the assessment of muscle mass is a very accurate tool for the detection of sarcopenia in oncological patients. However, the need of tracing manually the muscle groups to calculate body composition parameters is a costly and time-consuming limitation [14]. On the other hand, the development and progressive implementation of a dedicated CT imaging-based artificial intelligence (AI)-powered software has allowed for automated quantification of muscle mass by assessing skeletal muscle cross-sectional area (SMA) at the level of the third lumbar vertebra (L3), providing an ease calculation of another key body composition variable, the skeletal muscle index (SMI) obtained by normalizing the SMA to the patient’s height (m2) [15]. Indeed, AI gives an opportunity to automate the process of sarcopenia assessment [16], providing meaningful clinical measurements that can be considered independent imaging biomarkers for overall survival, as it is carried out for other tumors [17]. Based on the hypothesis that sarcopenia is associated with poorer patients’ oncological outcomes, the objective of the study was to verify if sarcopenia, evaluated using a CT-based AI-powered software, can predict objective clinical benefit in terms of tumor response rate to systemic chemotherapy, for advanced urothelial tumors. Additionally, the study aimed, as a secondary endpoint, to establish a correlation between sarcopenia and cancer outcomes.

2. Materials and Methods

2.1. Study Design

This was a retrospective single-center observational study that received formal approval from the Institutional Review Board, with a waiver of informed consent. The study was conducted in accordance with the guidelines for good clinical practice with ethical principles as reported in the latest version of the Declaration of Helsinki.
The medical records data were collected for 97 patients with a histologically confirmed diagnosis of urothelial tumors before the initiation and after 4–6 cycles of chemotherapy (at the first oncological reassessment) from January 2018 to January 2021 at our institution. The data collected included gender, age, height, weight, body mass index, number of drugs taken (not related to cancer treatment), ECOG Performance Status (PS), and clinical- and radiological stages.
Inclusion criteria were the following: age > 18 years, diagnosis of advanced urothelial tumor, availability of CT scan before and after treatment, and follow-up of at least 60 months.
Exclusion criteria were as follows: Patients with a life expectancy lower than 3 months or affected by any chronic inflammatory pathology in active status, with no long-term clinical information available, unsuitable for chemotherapy treatment, or with any contraindication to perform CT examinations.
As per institutional protocols, the staging CT scans were performed at both baselines and after 6 months of treatment.

2.2. Image Acquisition and Analysis

Images were acquired on a multidetector CT scanner (Somatom Sensation 64; Siemens Healthineers, Erlangen, Germany). Scanning parameters were as follows: tube voltage, 120 kVp; tube current, 100–250 mAs; pitch, 1.2; and collimation, 0.625–0.75 mm. Images were reconstructed using a 1-mm slice thickness on axial, coronal, and sagittal planes, using both soft tissue kernel (B31f) and lung kernel (B75f) reconstruction.
The CT acquisition protocol used was the standard for urothelial tumors and it included: A pre-contrast phase, a corticomedullary phase (data acquisition 25–35 s after contrast media injection); a nephrographic phase (80–100 s); an excretory phase (10–16 min).
The Quantib body composition® software (Rotterdam, Netherlands) was used to measure body composition quantitatively [18]. This software analyzed CT images of patients taken during staging CT examinations stored in our institutional picture archiving and communication system (PACS) selecting just the non-contrast phase. The software focused on the L3 vertebral body level and automatically segmented the images to determine the areas of the abdominal, psoas, and long spine muscles. Finally, the software generated in a few minutes a form displaying the relevant values, as shown in Figure 1.
Manual corrections were not made, and patients with grossly incorrect segmentations were excluded from the study. There was no specific definition for what constituted an incorrect segmentation; all segmentations were considered either of high quality or had only a small portion of the muscle volume accurately delineated. Minor errors were permitted without any additional correction.

2.3. Sarcopenia and Response to Therapy Definition

The SMA was obtained by summing the muscle areas of the psoas muscle, abdominal muscle, and long spine muscle.
The SMI was obtained by normalizing the SMA by the patients’ squared height. According to the literature, an SMI cut-off value for the sarcopenia definition was set at <55 cm2/m2 for men and <39 cm2/m2 for women [19]. The body mass index (BMI) was calculated as generally obtained (weight/height2) before and after therapy.
The RECIST 1.1 criteria [20] were used to identify and classify patients’ responses to therapy. Complete response (CR) was defined as the disappearance of all target lesions for a period of at least one month; partial response (PR) as at least a 30% decrease in the sum of the maximum diameter of target lesions, taking as reference the baseline sum of the longest diameter (LD); stable disease (SD) as neither sufficient shrinkage to qualify for PR nor sufficient increase to qualify for PD, taking as reference the smallest sum LD since the treatment started; progressive disease (PD) as at least a 20% increase in the sum of the LD of target lesions, taking as reference the smallest sum LD recorded since the treatment started or the appearance of one or more new lesions. Overall survival (OS) was defined as the time between diagnosis and last contact or date of death. Clinical benefit rate (CBR) was defined as the percentage of advanced-stage patients who achieve complete response, partial response, or at least six months of stable disease as a result of therapy [21].

2.4. Statistical Analysis

Statistical analyses along with reporting and interpretation of the results were conducted according to the previously described methodology [22] and consisted of four separate analytical steps [23,24].
Initially, descriptive statistics were used to summarize pertinent study information. The association between sarcopenia and clinical variables was tested by Fisher’s exact test or Mann–Whitney U test.
Second, a set of regression analyses was performed to assess the initial degree of correlation between CT scan AI-based Quantib Body Composition® SMI-L3 and each single anthropomorphic sarcopenia-related measures (i.e., CT-defined subcutaneous and visceral fat as well as psoas, abdominal and long spine muscle). This was tested both at baseline and repeated with the same data after the first cycle of systemic chemotherapy administration. Moreover, a multivariable linear regression model was developed including those clinic-demographic and tumor-related features commonly associated with clinical and survival outcomes (i.e., age at diagnosis, gender, ECOG performance status, number of medications taken unrelated to cancer therapy, as well as tumor location and stage) in order to identify which association was more significantly correlated with the computed SMI-L3 and the sarcopenia pre-established cut-off criteria [25].
Third, the clinical benefit outcome measured at the end of the systemic therapy was defined by the presence of partial/complete radiological response (RaR) as well as the confirmation of the stable disease in contrast with the documented progression of advanced urothelial carcinomas. Given the known association of sarcopenia status with male or female gender, a set of bivariable logistic regression was modeled between each computed sarcopenia-related feature adjusted for gender status and the dichotomized clinical benefit outcome. Additionally, a multivariable logistic model by clinical and demographic confounders was further performed to identify sarcopenia-related predictors independently associated with clinical benefit endpoint.
As the fourth analytic step, we investigated the association of SMI-L3 both as a continuous and dichotomized covariate with OS using univariable Cox regression analysis. Univariable survival estimates were plotted using the Kaplan–Meier method. The log-rank test was used to assess the difference in OS between sub-groups. A multivariate Cox proportional hazards model was also developed by adjusting for previously mentioned confounders also associated with survival outcomes. Finally, sarcopenia status variation as a function SMI-L3 variation (∆_SMI-L3) as well as any AI-computed subcutaneous/visceral fat or muscular anthropometric variations were forced, using locally weighted scatter plot smoother (LOWESS) function, against the multivariable-adjusted predicted probability models for clinical benefit and survival assessment. This was meant to graphically depict the influence of body composition variations on the pre-established endpoints at the moment of primary disease diagnosis. Statistical analysis was performed using Stata version 17.1 (Stata Corporation, College Station, TX, USA) with statistical significance set as p < 0.05.

3. Results

3.1. Demographic, Tumor- and Sarcopenia-Related Characteristics of the Study Population

We retrospectively reviewed the medical records of 97 patients with a histologically confirmed diagnosis of an advanced urothelial tumor of the upper urinary tract (33; 34.1%) (Figure 2) and urothelial tumor of the urinary bladder (64; 65.9%) (Figure 2) [26].
The median age of non-sarcopenic vs. sarcopenic patients was 73 (Interquartile range [IQR], 64–76) vs. 69 (IQR, 64–74) before and 73 (IQR, 66–76) vs. 68 years (IQR, 64–74) after therapy.
There were no differences in the distribution of the clinical and demographical factors among the non-sarcopenic and sarcopenic patients both at baseline and after therapy.
The SMI-L3 variable (cm2/m2), as well as the additional variables, were significantly different before and after therapy (p < 0.001) (Table 1).

3.2. Correlation between AI Skeletal Muscle Index (SMI-L3) and Anthropomorphic Sarcopenia-Related Variables Pre-/Post-Systemic Treatment

At baseline, out of 97 patients, 34 (66.7%) males and 17 (33.3%) females met the definition criteria calibrated on the CT-defined AI software SMI-L3 and were considered as affected by sarcopenic status.
At univariable linear regression modeling, we found an increasingly positive and constant association between SMI-L3 and each anthropometric sarcopenia-related feature. The coefficient correlation of determination (r2) was especially relevant when assessing SMI-L3 and the abdominal muscle area (r2: 0.726, d.f.: 95, value: 0.450, 95% CI: 0.394–0.507, p < 0.0001), followed by the long spine and psoas area (r2: 0.599, d.f.: 95, value: 0.740, 95% CI: 0.617–0.863, p < 0.0001 and r2: 0.463, d.f.: 95, value: 1.471, 95% CI:1.149 –1.794, p < 0.0001). At multivariable linear regression, the goodness of fit statistics for the SMI-L3 model reached the highest degree of correlation (r2: 0.857) and the correlations were confirmed with the visceral fat area as well as with the psoas, long spine, and abdominal muscle area (cm2/m2) independently from demographic and clinical confounders (Figure S1A,B).
After the first cycle of systemic therapy administration, the observed correlations remained stable and highly significant at both unilinear regression with the muscle-skeletal components (i.e., abdominal, psoas, and long spine muscle area [cm2/m2]) reaching the highest degree of correlation with SMI-L3 also when adjusted with clinic confounders (r2: 0.874) (Figure 2A,B).

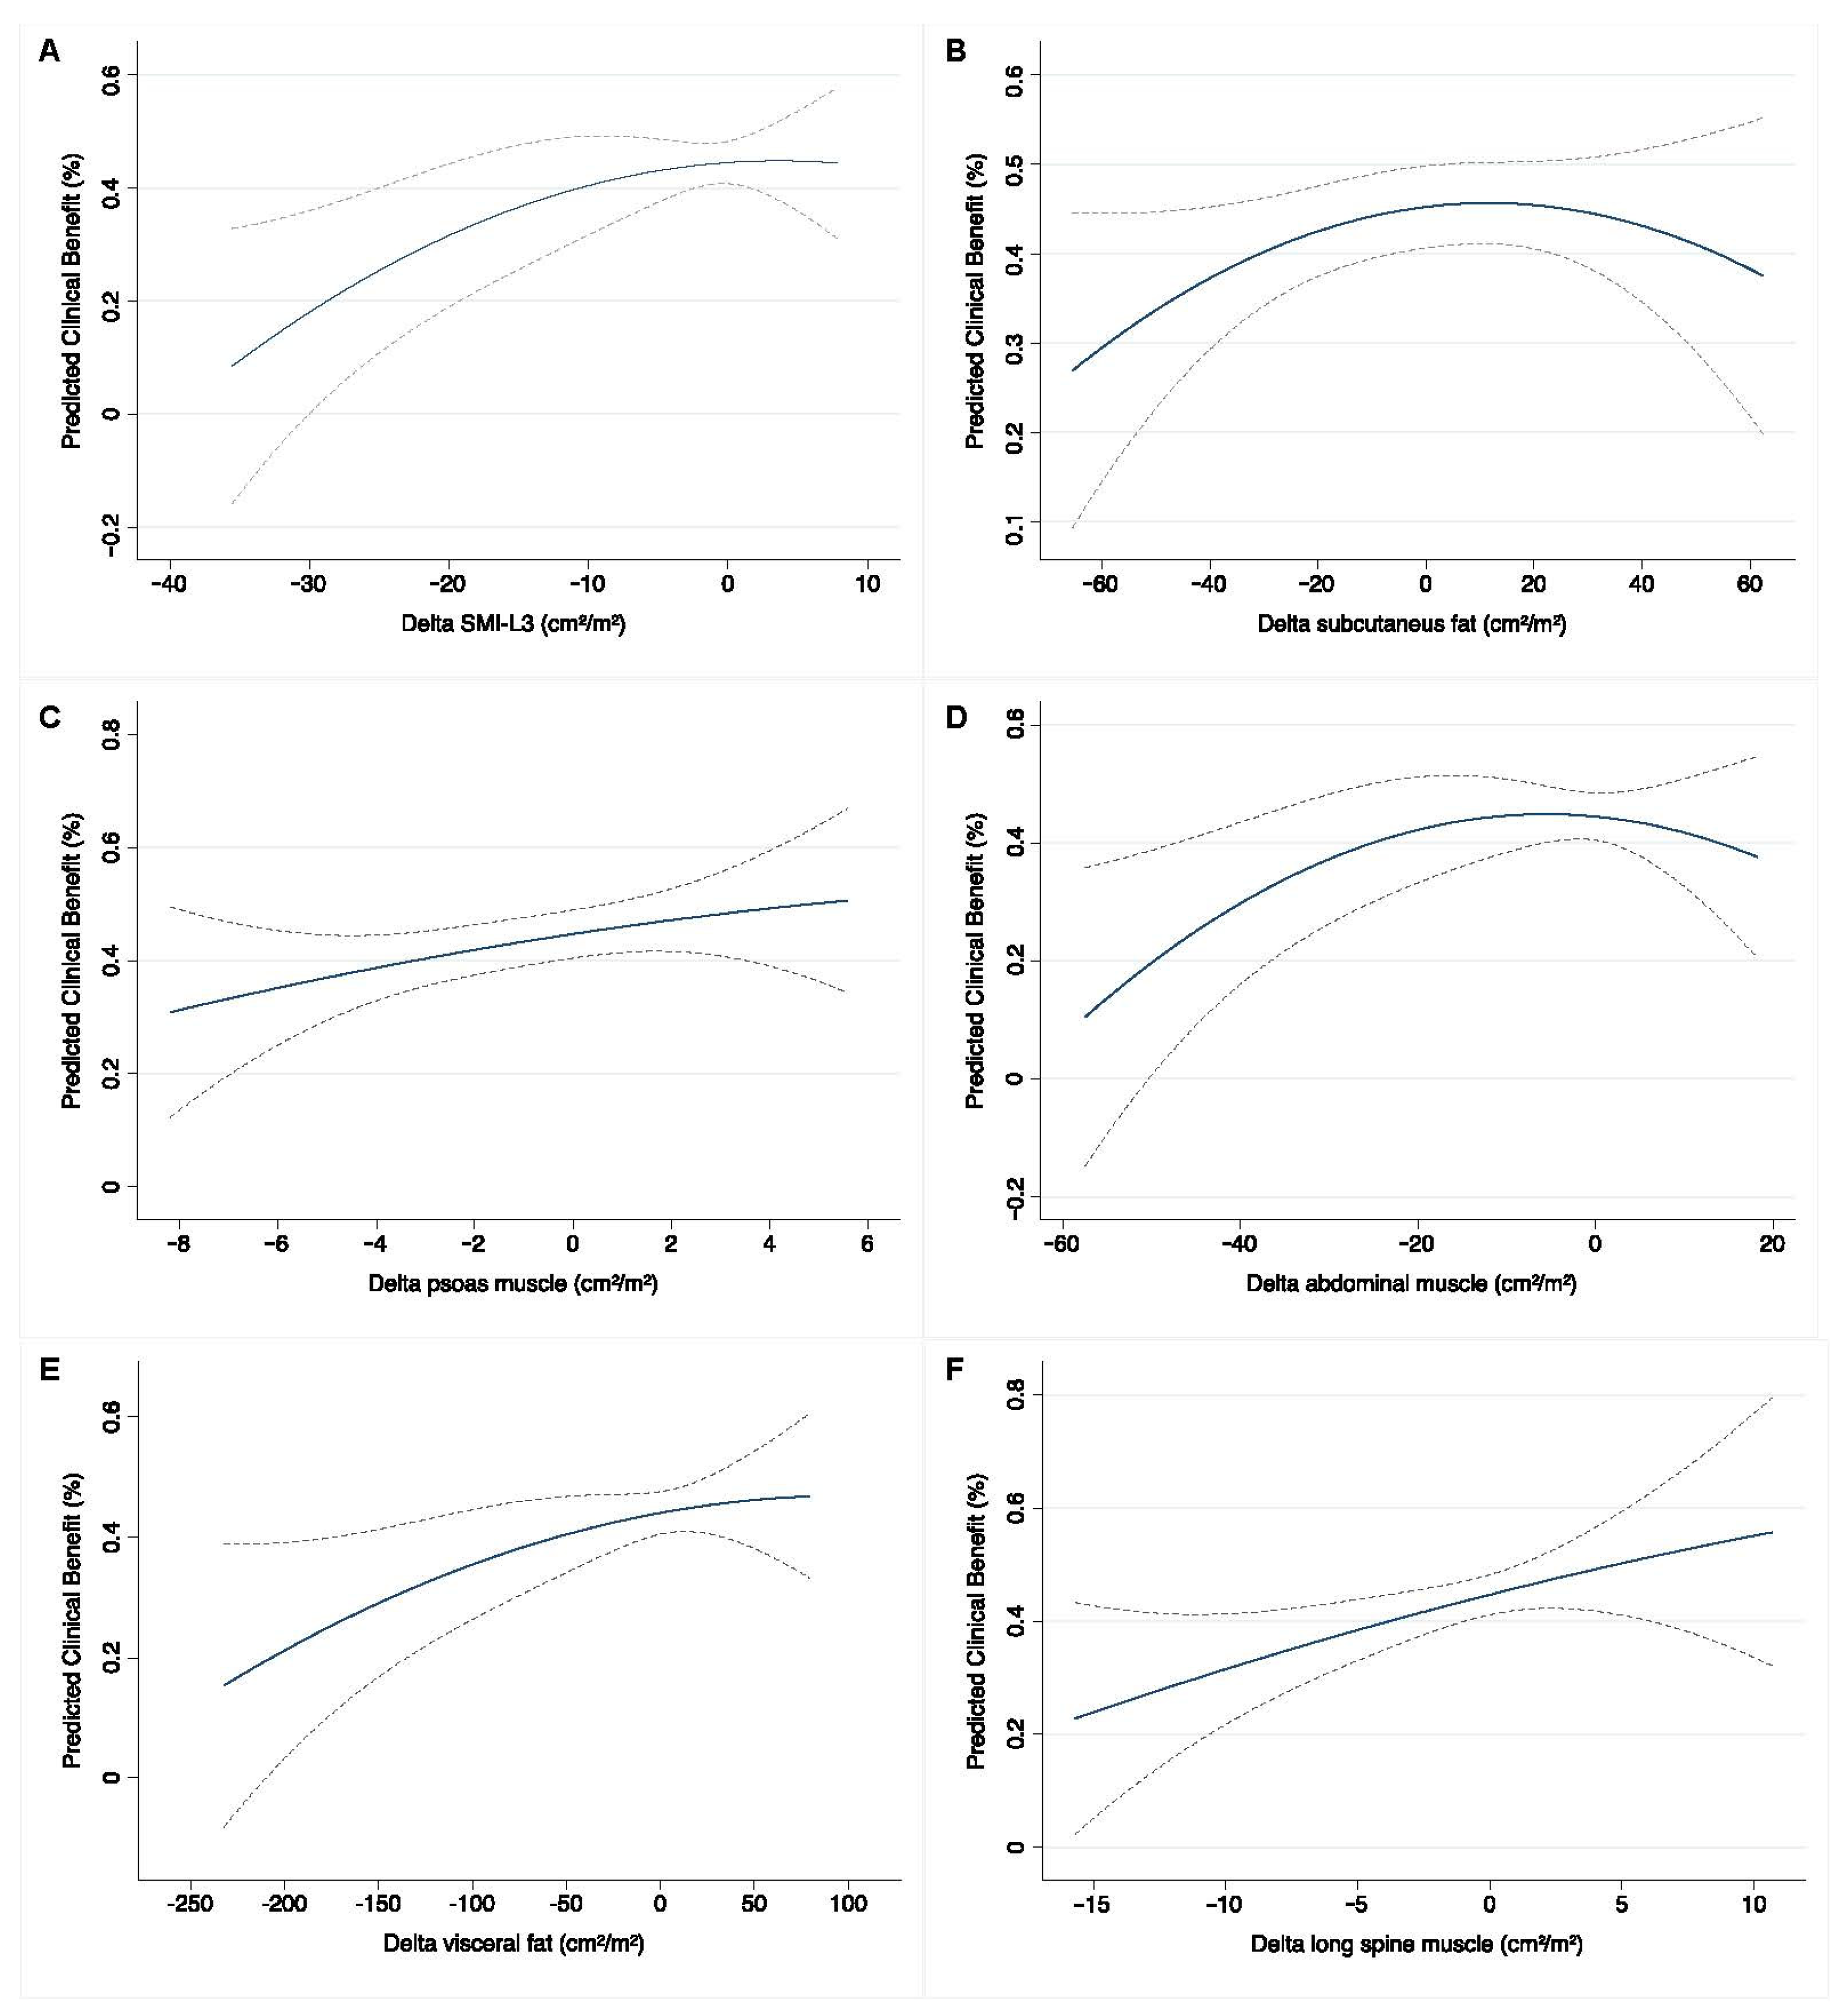
3.3. Baseline and Early Predictors of Clinical Benefit Measured at the Completion of Systemic Therapy

In total, all patients received a median number of 5 cycles of platinum-based chemotherapy which was mainly represented by Gemcitabine plus Cisplatin (GC) (53, 54.6%) or Carboplatin (44, 45.4%) for patients with renal insufficiency or frailty. The CT scan performed after 4–6 cycles, at the first oncological reassessment, revealed that the overall number of subjects with SMI-L3 defined sarcopenia status was 52 (53.6%). Among these, sarcopenic patients who exhibited disease progression were 26 (50%) while the remaining was associated with both complete/partial RaR (26, 50%). Among the non-sarcopenic group, after chemotherapy, 16 (35.6%) had progression of disease while 29 (64.4%) had complete/partial response. At univariable logistic regression adjusted by gender, baseline predictors for clinical benefit outcomes were represented by the sole abdominal, psoas muscle area, and subcutaneous fat area (aOR: 0.97, 95% CI: 0.95–0.99, aOR: 0.90, 95% CI: 0.82–0.99 and aOR: 0.99, 95% CI: 0.98–1, respectively). However, although not statistically significant, both SMI-L3 and its derived sarcopenia-related cut-off demonstrated an overlapping trend toward significance in line with the other individual aforementioned predictors (aOR: 0.96, 95% CI: 0.92–1.1 and aOR: 2.33, 95% CI: 0.99–5.52) (Table S1A). Notably, at this baseline assessment, none of these anthropometric features resulted independently able to induce relevant clinical benefit outcomes except from some expected clinical variables. Interestingly, after the first oncological reassessment of disease sarcopenic status both by SMI-L3 coefficient and its standardized cut-off, was found independently predicting clinical benefits (OR: 0.93, 95% CI: 0.88–0.98 and OR: 2.31, 95% CI: 1.15–5.78) (Table S1B). Finally, the trajectory of the LOWESS functions depicting the predicted probability for RaR clinical benefit outcomes showed an almost linear positive association with all the observed body composition variables variations between pre-/post-systemic treatment. (Figure 3). This was especially true for ∆_SMI-L3 (Figure 3A) and ∆_psoas (Figure 3C) and ∆_long spine muscle area (cm2/m2) (Figure 3F) where the chances of not experiencing disease progression increased from the ~10–20% up to ~45–55%.

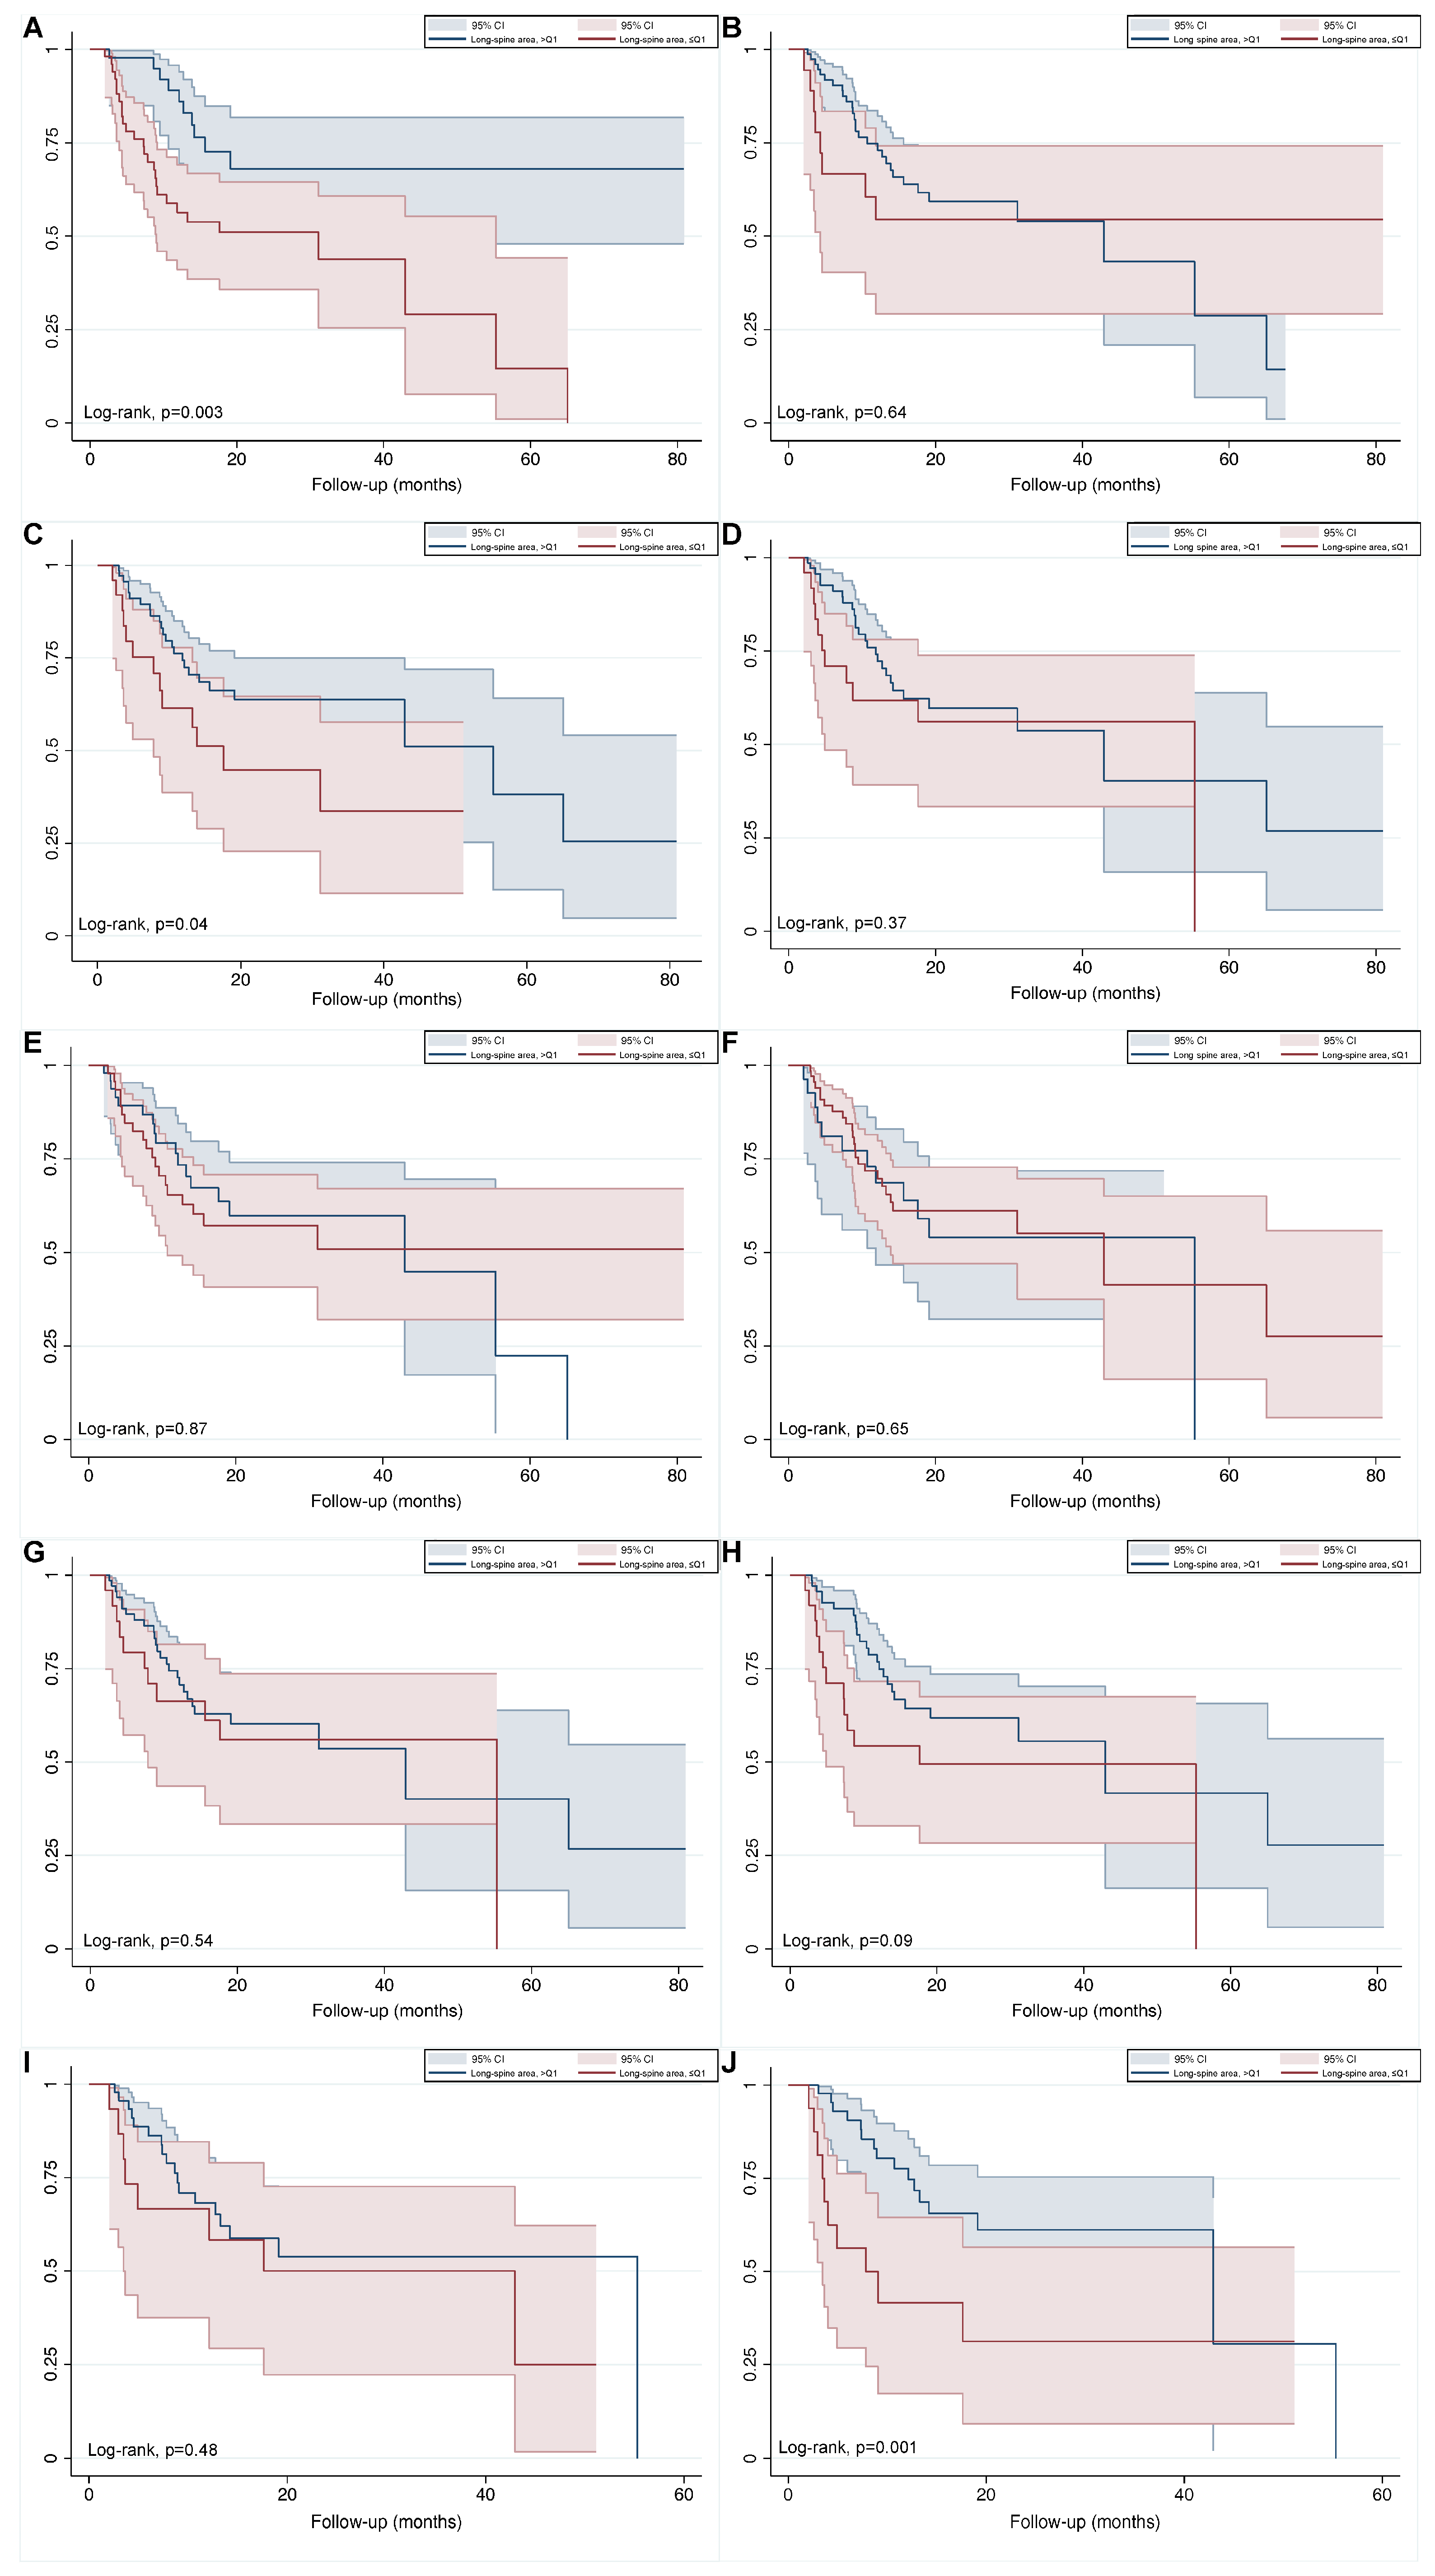
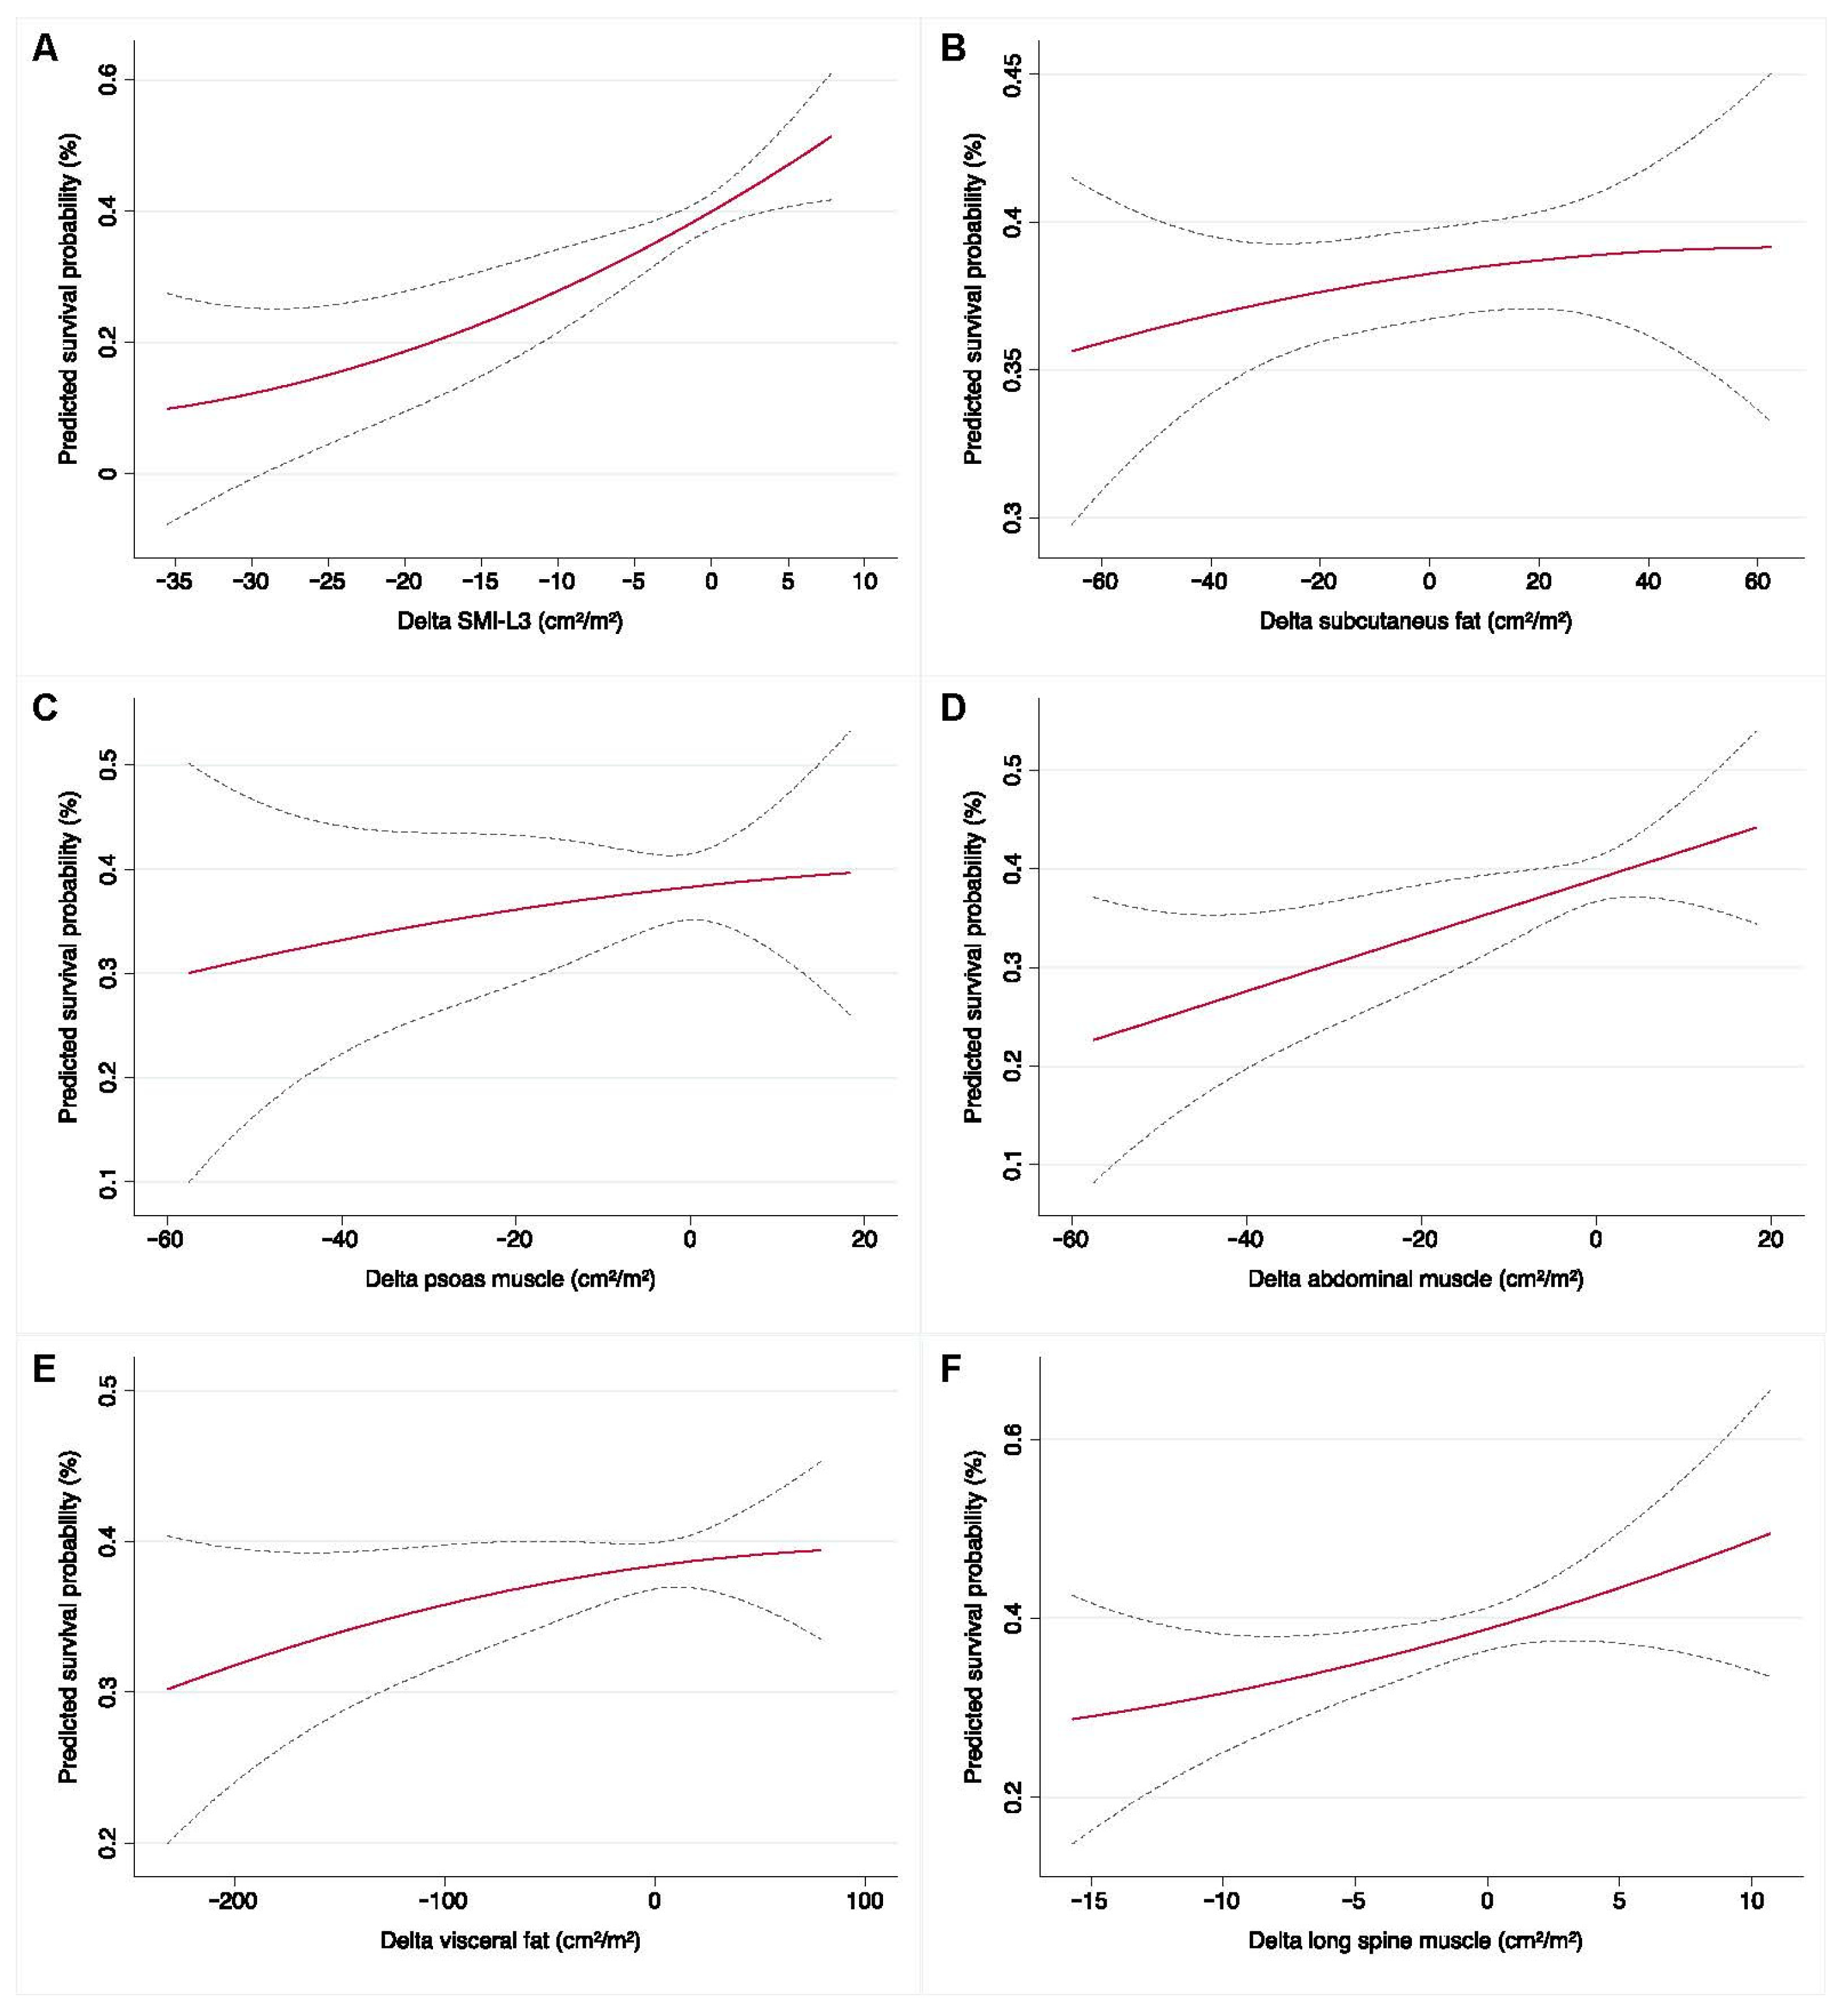
3.4. Baseline and Early Determinates for Overall Survival

Within a median follow-up time of 17.43 months (IQR 1.6–80.9), months, 37 (38.1%) subjects were deceased by any cause. In the sarcopenic cohort, 28 patients (75.8%) were recorded as having passed away, while 9 patients (24.3%) were recognized as survivors. SMI-L3 variation (∆-SMI-L3) was significantly discordant across the two sub-groups ranging from a median value of −1.857 (standard deviation [SD] 5.784), respectively. The univariable effect of sarcopenia and other subgroups on OS has been depicted in Kaplan–Meier plots shown in Figure 4.
As expected, at univariable Cox regression modeling before and after chemotherapy, higher registered values of sarcopenic and anthropometric measures had been associated with reduced OS. This was also independently true at multivariable assessment for SMI-L3 and the subsequent sarcopenia definition at baseline (HR: 0.95, 95% CI: 0.92–0.99 and HR: 3.80, 95% CI: 1.72–8.41) (Table S2A). and after the first cycle of therapy (HR: 0.94, 95% CI: 0.91–0.98 and HR: 3.29, 95% CI: 1.51–7.17) (Table S2B).
Moreover, when implementing the LOWESS function to model ∆-SMI-L3 on the predicted survival probability derived from the multivariable Cox regression model (Figure 5), greater survival chances were matched by those patients achieving wider ∆_SMI-L3 over the course of follow-up (10–20% vs. 50–60%) (Figure 5A). This was noted especially for ∆_abdominal (Figure 5D) and long spine muscle area (Figure 5F) (cm2/m2) which varied from ~20–30% up to ~50–55% when a consistent muscular mass was gained.

4. Discussion

Accurate prediction of individual cancer patient’s response to chemotherapy remains a goal in the field of oncology.
The development of sarcopenia is a result of tumor progression and systemic inflammation caused by the tumor, so its presence indicates tumor aggressiveness. In addition, sarcopenic patients are characterized by poor general health and physical performance, which can contribute to a worse prognosis for cancer-bearing patients. The effectiveness of sarcopenia as a prognostic biomarker can be attributed to its distinctive hybrid nature [27].
Several studies have investigated the association between sarcopenia, assessed by AI tools and oncological outcomes, [28]; including patients with breast, [29] gastric [30], endometrial [31] and cervical cancer [32]. Focusing on genitourinary tumors [33], Wu et al. (2019) [34] used transfer learning to train a convolutional neural network (CNN) model on a then expanded dataset of pre- and post-treatment CT scans of 123 bladder cancer patients undergoing neoadjuvant chemotherapy; in another study [35] sarcopenia in metastatic renal carcinoma, according to SMI thresholds after segmentation by the deep learning algorithm, had statistically significant correlation with lower overall survival compared to non-sarcopenic patients [36].
However, to date, there are no studies that have analyzed sarcopenia in advanced urothelial tumors through artificial intelligence software. In this setting, our primary endpoint was to confirm the role of sarcopenia, assessed using a CT based AI-powered software, as a prognostic predictor of objective clinical benefit in terms of tumor response rate to systemic therapy, in advanced urothelial tumors and correlate sarcopenia status with oncological outcomes. As anticipated, we discovered a strong connection between sarcopenia and aging, which is widely recognized as a current health concern among older adults [37,38]. Our results also showed that the number of drugs taken (unrelated to the cancer treatment) and consequently the presence of comorbidities in patients were not statistically significant factors. This finding is in contrast with previous research; Pacifico et al. [39] in a systematic review discovered that individuals with multiple comorbidities, such as cardiovascular diseases, dementia, diabetes [40], and respiratory diseases, had the highest prevalence of sarcopenia [41]. Our outcome is likely a result of the insignificant impact of comorbidities on the sarcopenia status of patients who have advanced cancer.
In this study we found that sarcopenia, assessed by the CT-based AI-powered software is a negative prognostic factor in advanced urothelial cancers; indeed, overall survival was significantly different between the sarcopenic and non-sarcopenic groups. Our data are in line with Yumioka’s and Shimizu’s studies, which demonstrated how sarcopenia is a predictive factor of overall survival in patients affected by urothelial carcinoma and treated with gemcitabine and cis-/carbo-platin [42,43]. Results also confirm recent findings concerning the association of sarcopenia in patients affected by genitourinary tumors and oncologic outcomes [44]. Specifically, sarcopenia has been correlated to a worse prognosis in patients with urothelial carcinoma, including muscle-invasive bladder cancer [45,46] and upper tract urothelial carcinoma by Fukushima et al. in a systematic review of the literature [27]. The findings on genitourinary tumors align with those from systematic reviews and meta-analyses on other types of tumors. It has been shown that pre-treatment sarcopenia is a separate risk factor for both lower overall survival and decreased compliance with adjuvant therapies in pancreatic [47], gastrointestinal [48,49], breast [50], gynecological [51], and hematological [52] cancers. In these prior studies, the presence of sarcopenia was evaluated using commonly accepted methods, such as manually tracing the areas of all muscle groups on CT scans.
It is important to mention that other anthropometric measurements may not be reliable. Indeed, using BMI alone to assess obesity and evaluate outcomes and prognosis in cancer patients is inaccurate since it cannot distinguish between fat and lean mass or between visceral and subcutaneous fat [53].
Although traditional methods of evaluating body composition, such as anthropomorphic measurements, bioelectrical impedance, and dual-energy X-ray absorptiometry, have some drawbacks, computed tomography and magnetic resonance imaging are the benchmark techniques for analyzing body composition. Nevertheless, also these imaging methods demand manual segmentation by an expert reader, which is a time-consuming and labor-intensive task. Consequently, their application in large-scale studies and regular clinical practice is limited [54].
In the present study, we found that integrating a fully automated AI-powered tool into radiological practice, provides an opportunity for innovation to effectively investigate sarcopenia status facilitating the detection of muscle loss and it allows to reduce operator-dependent bias of segmentation in the set of scans routinely acquired for staging and follow-up purposes.
The ability of AI models to analyze large sets of data and extract high-level abstractions beyond manual skills provides impactful information and greatly refines the standard for assessing the risk of muscle depletion in patients with urogenital cancers [55,56] as well as in non-oncological and pediatric patients [57].
This study has several limitations, including its retrospective design and small sample size. Another limitation is the lack of correlation with the patient’s nutritional status. Furthermore, this study, like the other retrospective studies previously described, was not designed to show whether sarcopenia is treatable.
Even though our work is focused on advanced-stage urothelial tumors treated with platinum-based systemic chemotherapy, it would be interesting to evaluate how body composition affects other subtypes of urogenital tumors treated with different therapeutic regimens. Finally, the AI tool’s performance was not compared to manual muscle area segmentation, as the accuracy of the method has already been established in other studies [58].
Despite its limitations, this study marks the first use of CT AI-based body composition measurement in patients with advanced urothelial tumors. Our findings, supported by further evidence, could lead to the development of standardized pathways that link the radiological staging of cancers with sarcopenia assessment and personalized nutritional therapy. This has the potential to enhance both quality of life and cancer outcomes.

5. Conclusions

The utilization of an easy-to-use CT-based AI tool allowed us to assess the sarcopenia status of patients with advanced urothelial tumors. Indeed, routine CT scans represented an important imaging biomarker on body composition status, which correlated with poorer oncological outcomes. The AI tool can represent a means to increase the clinical value of CT imaging reports and to promote the implementation of precision medicine [59].

Supplementary Materials

The following supporting information can be downloaded at: https://www.mdpi.com/article/10.3390/cancers15112968/s1, Figure S1: Univariable linear regression plots depicting AI-based Quantib Body Composition® Skeletal Muscle Index (SMI-L3) and anthropomorphic sarcopenia-related variables at baseline (A). Multivariable linear regression model assessing SMI-L3, clinic-demographic and anthropomorphic sarcopenia-related variables at baseline (B). Figure S2: Univariable linear regression plots depicting AI-based Quantib Body Composition® Skeletal Muscle Index (SMI-L3) and anthropomorphic sarcopenia-related variables after fist therapy cycle (A). Multivariable linear regression model assessing SMI-L3, clinic-demographic and anthropomorphic sarcopenia-related variables after fist therapy cycle (B). Table S1: Bivariable and Multivariable adjusted Cox regression modeling for anthropometric measures assessing the Odds Ratio for overall survival at baseline (A) and post-systemic treatment (B). Table S2: Bivariable and Multivariable adjusted Cox regression modeling for anthropometric measures assessing the hazard for overall survival at baseline (A) and post-systemic treatment (B).

Author Contributions

Conceptualization, A.B.; Methodology, M.P.; Formal analysis, M.P. and F.D.G.; Resources, A.D.; Data curation, L.C., E.M. and M.R.; Writing—original draft, A.B. and F.D.G.; Writing—review & editing, M.P., N.L., S.P., M.M., D.S. and C.C.; Supervision, V.P. All authors have read and agreed to the published version of the manuscript.

Funding

This research received no external funding.

Institutional Review Board Statement

Ethical review and approval were waived for this study due to its retrospective design.

Informed Consent Statement

Informed consent was obtained from all subjects involved in the study.

Data Availability Statement

The data presented in this study are available upon request from the corresponding author. The data are not publicly available due to restrictions.

Conflicts of Interest

The authors declare no conflict of interest.

References

  1. Muscaritoli, M.; Lucia, S.; Farcomeni, A.; Lorusso, V.; Saracino, V.; Barone, C.; Plastino, F.; Gori, S.; Magarotto, R.; Carteni, G.; et al. Prevalence of malnutrition in patients at first medical oncology visit: The PreMiO study. Oncotarget 2017, 8, 79884–79896. [Google Scholar] [CrossRef] [PubMed]
  2. Cederholm, T.; Jensen, G.L.; Correia, M.; Gonzalez, M.C.; Fukushima, R.; Higashiguchi, T.; Baptista, G.; Barazzoni, R.; Blaauw, R.; Coats, A.J.S.; et al. GLIM criteria for the diagnosis of malnutrition—A consensus report from the global clinical nutrition community. J. Cachexia Sarcopenia Muscle 2019, 10, 207–217. [Google Scholar] [CrossRef]
  3. Serinelli, S.; Panebianco, V.; Martino, M.; Battisti, S.; Rodacki, K.; Marinelli, E.; Zaccagna, F.; Semelka, R.C.; Tomei, E. Accuracy of MRI skeletal age estimation for subjects 12–19. Potential use for subjects of unknown age. Int. J. Legal Med. 2015, 129, 609–617. [Google Scholar] [CrossRef] [PubMed]
  4. Taguchi, S.; Nakagawa, T.; Uemura, Y.; Akamatsu, N.; Gonoi, W.; Naito, A.; Kawai, T.; Kume, H.; Fukuhara, H. Comparison of major definitions of sarcopenia based on the skeletal muscle index in patients with urothelial carcinoma. Future Oncol. 2021, 17, 197–203. [Google Scholar] [CrossRef] [PubMed]
  5. Chen, H.-W.; Chen, Y.-C.; Yang, L.-H.; Shih, M.-C.P.; Li, C.-C.; Chueh, K.-S.; Wu, W.-J.; Juan, Y.-S. Impact of cachexia on oncologic outcomes of sarcopenic patients with upper tract urothelial carcinoma after radical nephroureterectomy. PLoS ONE 2021, 16, e0250033. [Google Scholar] [CrossRef]
  6. Richenberg, J.; Løgager, V.; Panebianco, V.; Rouviere, O.; Villeirs, G.; Schoots, I.G. The primacy of multiparametric MRI in men with suspected prostate cancer. Eur. Radiol. 2019, 29, 6940–6952. [Google Scholar] [CrossRef]
  7. Ferro, M.; Babă, D.-F.; de Cobelli, O.; Musi, G.; Lucarelli, G.; Terracciano, D.; Porreca, A.; Busetto, G.M.; Del Giudice, F.; Soria, F.; et al. Neutrophil percentage-to-albumin ratio predicts mortality in bladder cancer patients treated with neoadjuvant chemotherapy followed by radical cystectomy. Future Sci. OA 2021, 7, FSO709. [Google Scholar] [CrossRef]
  8. Maggi, M.; Panebianco, V.; Mosca, A.; Salciccia, S.; Gentilucci, A.; Di Pierro, G.; Busetto, G.M.; Barchetti, G.; Campa, R.; Sperduti, I.; et al. Prostate Imaging Reporting and Data System 3 Category Cases at Multiparametric Magnetic Resonance for Prostate Cancer: A Systematic Review and Meta-analysis. Eur. Urol. Focus 2020, 6, 463–478. [Google Scholar] [CrossRef]
  9. Panebianco, V.; Sciarra, A.; Marcantonio, A.; Forte, V.; Biondi, T.; Laghi, A.; Catalano, C. Conventional imaging and multiparametric magnetic resonance (MRI, MRS, DWI, MRP) in the diagnosis of prostate cancer. Q. J. Nucl. Med. Mol. Imaging 2012, 56, 331–342. [Google Scholar]
  10. Sciarra, A.; Panebianco, V.; Ciccariello, M.; Salciccia, S.; Lisi, D.; Osimani, M.; Alfarone, A.; Gentilucci, A.; Parente, U.; Passariello, R.; et al. Magnetic Resonance Spectroscopic Imaging (1 H-MRSI) and Dynamic Contrast-Enhanced Magnetic Resonance (DCE-MRI): Pattern Changes from Inflammation to Prostate Cancer. Cancer Investig. 2010, 28, 424–432. [Google Scholar] [CrossRef]
  11. Pavone, P.; Laghi, A.; Panebianco, V.; Catalano, C.; Lobina, L.; Passariello, R. MR cholangiography: Techniques and clinical applications. Eur. Radiol. 1998, 8, 901–910. [Google Scholar] [CrossRef] [PubMed]
  12. Di Silverio, F.; Sciarra, A.; Parente, U.; Andrea, A.; Von Heland, M.; Panebianco, V.; Passariello, R. Neoadjuvant Therapy with Sorafenib in Advanced Renal Cell Carcinoma with Vena Cava Extension Submitted to Radical Nephrectomy. Urol. Int. 2008, 80, 451–453. [Google Scholar] [CrossRef] [PubMed]
  13. Sciarra, A.; Panebianco, V.; Cattarino, S.; Busetto, G.M.; De Berardinis, E.; Ciccariello, M.; Gentile, V.; Salciccia, S. Multiparametric magnetic resonance imaging of the prostate can improve the predictive value of the urinary prostate cancer antigen 3 test in patients with elevated prostate-specific antigen levels and a previous negative biopsy. BJU Int. 2012, 110, 1661–1665. [Google Scholar] [CrossRef] [PubMed]
  14. Mourtzakis, M.; Prado, C.M.; Lieffers, J.R.; Reiman, T.; McCargar, L.J.; Baracos, V.E. A practical and precise approach to quantification of body composition in cancer patients using computed tomography images acquired during routine care. Appl. Physiol. Nutr. Metab. 2008, 33, 997–1006. [Google Scholar] [CrossRef] [PubMed]
  15. Sánchez-Torralvo, F.J.; Ruiz-García, I.; Contreras-Bolívar, V.; González-Almendros, I.; Ruiz-Vico, M.; Abuín-Fernández, J.; Barrios, M.; Alba, E.; Olveira, G. CT-Determined Sarcopenia in GLIM-Defined Malnutrition and Prediction of 6-Month Mortality in Cancer Inpatients. Nutrients 2021, 13, 2647. [Google Scholar] [CrossRef] [PubMed]
  16. Bedrikovetski, S.; Seow, W.; Kroon, H.M.; Traeger, L.; Moore, J.W.; Sammour, T. Artificial intelligence for body composition and sarcopenia evaluation on computed tomography: A systematic review and meta-analysis. Eur. J. Radiol. 2022, 149, 110218. [Google Scholar] [CrossRef]
  17. Picchio, M.; Mapelli, P.; Panebianco, V.; Castellucci, P.; Incerti, E.; Briganti, A.; Gandaglia, G.; Kirienko, M.; Barchetti, F.; Nanni, C.; et al. Imaging biomarkers in prostate cancer: Role of PET/CT and MRI. Eur. J. Nucl. Med. Mol. Imaging 2015, 42, 644–655. [Google Scholar] [CrossRef]
  18. Ha, J.; Park, T.; Kim, H.-K.; Shin, Y.; Ko, Y.; Kim, D.W.; Sung, Y.S.; Lee, J.; Ham, S.J.; Khang, S.; et al. Development of a fully automatic deep learning system for L3 selection and body composition assessment on computed tomography. Sci. Rep. 2021, 11, 21656. [Google Scholar] [CrossRef]
  19. Fearon, K.; Strasser, F.; Anker, S.D.; Bosaeus, I.; Bruera, E.; Fainsinger, R.L.; Jatoi, A.; Loprinzi, C.; MacDonald, N.; Mantovani, G.; et al. Definition and classification of cancer cachexia: An international consensus. Lancet Oncol. 2011, 12, 489–495. [Google Scholar] [CrossRef]
  20. Eisenhauer, E.A.; Therasse, P.; Bogaerts, J.; Schwartz, L.H.; Sargent, D.; Ford, R.; Dancey, J.; Arbuck, S.; Gwyther, S.; Mooney, M.; et al. New response evaluation criteria in solid tumours: Revised RECIST guideline (version 1.1). Eur. J. Cancer 2009, 45, 228–247. [Google Scholar] [CrossRef]
  21. Delgado, A.; Guddati, A.K. Clinical endpoints in oncology—A primer. Am. J. Cancer Res. 2021, 11, 1121–1131. [Google Scholar]
  22. Salciccia, S.; Del Giudice, F.; Gentile, V.; Mastroianni, C.M.; Pasculli, P.; Di Lascio, G.; Ciardi, M.R.; Sperduti, I.; Maggi, M.; De Berardinis, E.; et al. Interplay between male testosterone levels and the risk for subsequent invasive respiratory assistance among COVID-19 patients at hospital admission. Endocrine 2020, 70, 206–210. [Google Scholar] [CrossRef] [PubMed]
  23. Busetto, G.M.; Giovannone, R.; Antonini, G.; Rossi, A.; Del Giudice, F.; Tricarico, S.; Ragonesi, G.; Gentile, V.; De Berardinis, E. Short-term pretreatment with a dual 5α-reductase inhibitor before bipolar transurethral resection of the prostate (B-TURP): Evaluation of prostate vascularity and decreased surgical blood loss in large prostates: Short-term treatment with dutasteride before B-TURP. BJU Int. 2015, 116, 117–123. [Google Scholar] [CrossRef] [PubMed]
  24. Giovannone, R.; Busetto, G.M.; Antonini, G.; De Cobelli, O.; Ferro, M.; Tricarico, S.; Del Giudice, F.; Ragonesi, G.; Conti, S.L.; Lucarelli, G.; et al. Hyperhomocysteinemia as an Early Predictor of Erectile Dysfunction: International Index of Erectile Function (IIEF) and Penile Doppler Ultrasound Correlation with Plasma Levels of Homocysteine. Medicine 2015, 94, e1556. [Google Scholar] [CrossRef]
  25. Caan, B.J.; Feliciano, E.M.C.; Prado, C.M.; Alexeeff, S.; Kroenke, C.H.; Bradshaw, P.; Quesenberry, C.P.; Weltzien, E.K.; Castillo, A.L.; Olobatuyi, T.A.; et al. Association of Muscle and Adiposity Measured by Computed Tomography with Survival in Patients with Nonmetastatic Breast Cancer. JAMA Oncol. 2018, 4, 798. [Google Scholar] [CrossRef] [PubMed]
  26. Del Giudice, F.; Leonardo, C.; Simone, G.; Pecoraro, M.; De Berardinis, E.; Cipollari, S.; Flammia, S.; Bicchetti, M.; Busetto, G.M.; Chung, B.I.; et al. Preoperative detection of Vesical Imaging-Reporting and Data System (VI-RADS) score 5 reliably identifies extravesical extension of urothelial carcinoma of the urinary bladder and predicts significant delayed time to cystectomy: Time to reconsider the nee: VI-RADS score 5 may avoid deep primary TURBT. BJU Int. 2020, 126, 610–619. [Google Scholar] [CrossRef]
  27. Fukushima, H.; Takemura, K.; Suzuki, H.; Koga, F. Impact of Sarcopenia as a Prognostic Biomarker of Bladder Cancer. Int. J. Mol. Sci. 2018, 19, 2999. [Google Scholar] [CrossRef]
  28. Huang, Y.-T.; Tsai, Y.-S.; Lin, P.-C.; Yeh, Y.-M.; Hsu, Y.-T.; Wu, P.-Y.; Shen, M.-R. The Value of Artificial Intelligence-Assisted Imaging in Identifying Diagnostic Markers of Sarcopenia in Patients with Cancer. Dis. Markers 2022, 2022, 1819841. [Google Scholar] [CrossRef]
  29. Jang, W.; Jeong, C.; Kwon, K.; Yoon, T.I.; Yi, O.; Kim, K.W.; Yang, S.-O.; Lee, J. Artificial intelligence for predicting five-year survival in stage IV metastatic breast cancer patients: A focus on sarcopenia and other host factors. Front. Physiol. 2022, 13, 977189. [Google Scholar] [CrossRef]
  30. Chung, H.; Ko, Y.; Lee, I.; Hur, H.; Huh, J.; Han, S.; Kim, K.W.; Lee, J. Prognostic artificial intelligence model to predict 5 year survival at 1 year after gastric cancer surgery based on nutrition and body morphometry. J. Cachexia Sarcopenia Muscle 2023, 14, 847–859. [Google Scholar] [CrossRef]
  31. Kim, S.I.; Chung, J.Y.; Paik, H.; Seol, A.; Yoon, S.H.; Kim, T.M.; Kim, H.S.; Chung, H.H.; Cho, J.Y.; Kim, J.-W.; et al. Prognostic role of computed tomography-based, artificial intelligence-driven waist skeletal muscle volume in uterine endometrial carcinoma. Insights Imaging 2021, 12, 192. [Google Scholar] [CrossRef] [PubMed]
  32. Han, Q.; Kim, S.I.; Yoon, S.H.; Kim, T.M.; Kang, H.-C.; Kim, H.J.; Cho, J.Y.; Kim, J.-W. Impact of Computed Tomography-Based, Artificial Intelligence-Driven Volumetric Sarcopenia on Survival Outcomes in Early Cervical Cancer. Front. Oncol. 2021, 11, 741071. [Google Scholar] [CrossRef] [PubMed]
  33. Stangl-Kremser, J.; Mari, A.; Lai, L.Y.; Lee, C.T.; Vince, R.; Zaslavsky, A.; Salami, S.S.; Fajkovic, H.; Shariat, S.F.; Palapattu, G.S. Sarcopenic Obesity and its Prognostic Impact on Urological Cancers: A Systematic Review. J. Urol. 2021, 206, 854–865. [Google Scholar] [CrossRef] [PubMed]
  34. Wu, E.; Hadjiiski, L.M.; Samala, R.K.; Chan, H.-P.; Cha, K.H.; Richter, C.; Cohan, R.H.; Caoili, E.M.; Paramagul, C.; Alva, A.; et al. Deep Learning Approach for Assessment of Bladder Cancer Treatment Response. Tomography 2019, 5, 201–208. [Google Scholar] [CrossRef]
  35. Roblot, V.; Giret, Y.; Mezghani, S.; Auclin, E.; Arnoux, A.; Oudard, S.; Duron, L.; Fournier, L. Validation of a deep learning segmentation algorithm to quantify the skeletal muscle index and sarcopenia in metastatic renal carcinoma. Eur. Radiol. 2022, 32, 4728–4737. [Google Scholar] [CrossRef]
  36. Cheung, H.; Wang, Y.; Chang, S.L.; Khandwala, Y.S.; Del Giudice, F.; Chung, B.I. Adoption of Robot-Assisted Partial Nephrectomies: A Population-Based Analysis of U.S. Surgeons from 2004 to 2013. J. Endourol. 2017, 31, 886–892. [Google Scholar] [CrossRef]
  37. Cruz-Jentoft, A.J.; Landi, F.; Schneider, S.M.; Zúñiga, C.; Arai, H.; Boirie, Y.; Chen, L.-K.; Fielding, R.A.; Martin, F.C.; Michel, J.-P.; et al. Prevalence of and interventions for sarcopenia in ageing adults: A systematic review. Report of the International Sarcopenia Initiative (EWGSOP and IWGS). Age Ageing 2014, 43, 748–759. [Google Scholar] [CrossRef]
  38. Papadopoulou, S.K. Sarcopenia: A Contemporary Health Problem among Older Adult Populations. Nutrients 2020, 12, 1293. [Google Scholar] [CrossRef]
  39. Pacifico, J.; Geerlings, M.A.; Reijnierse, E.M.; Phassouliotis, C.; Lim, W.K.; Maier, A.B. Prevalence of sarcopenia as a comorbid disease: A systematic review and meta-analysis. Exp. Gerontol. 2020, 131, 110801. [Google Scholar] [CrossRef]
  40. Zhang, X.; Zhao, Y.; Chen, S.; Shao, H. Anti-diabetic drugs and sarcopenia: Emerging links, mechanistic insights, and clinical implications. J. Cachexia Sarcopenia Muscle 2021, 12, 1368–1379. [Google Scholar] [CrossRef]
  41. Campins, L.; Camps, M.; Riera, A.; Pleguezuelos, E.; Yébenes, J.C.; Serra-Prat, M. Oral Drugs Related with Muscle Wasting and Sarcopenia. A Review. Pharmacology 2017, 99, 1–8. [Google Scholar] [CrossRef] [PubMed]
  42. Yumioka, T.; Honda, M.; Nishikawa, R.; Teraoka, S.; Kimura, Y.; Iwamoto, H.; Morizane, S.; Hikita, K.; Takenaka, A. Sarcopenia as a significant predictive factor of neutropenia and overall survival in urothelial carcinoma patients underwent gemcitabine and cisplatin or carboplatin. Int. J. Clin. Oncol. 2020, 25, 158–164. [Google Scholar] [CrossRef]
  43. Shimizu, R.; Honda, M.; Teraoka, S.; Yumioka, T.; Yamaguchi, N.; Kawamoto, B.; Iwamoto, H.; Morizane, S.; Hikita, K.; Takenaka, A. Sarcopenia is associated with survival in patients with urothelial carcinoma treated with systemic chemotherapy. Int. J. Clin. Oncol. 2022, 27, 175–183. [Google Scholar] [CrossRef] [PubMed]
  44. Nicolazzo, C.; Busetto, G.M.; Del Giudice, F.; Sperduti, I.; Giannarelli, D.; Gradilone, A.; Gazzaniga, P.; de Berardinis, E.; Raimondi, C. The long-term prognostic value of survivin expressing circulating tumor cells in patients with high-risk non-muscle invasive bladder cancer (NMIBC). J. Cancer Res. Clin. Oncol. 2017, 143, 1971–1976. [Google Scholar] [CrossRef]
  45. Del Giudice, F.; Pecoraro, M.; Vargas, H.A.; Cipollari, S.; De Berardinis, E.; Bicchetti, M.; Chung, B.I.; Catalano, C.; Narumi, Y.; Catto, J.W.F.; et al. Systematic Review and Meta-Analysis of Vesical Imaging-Reporting and Data System (VI-RADS) Inter-Observer Reliability: An Added Value for Muscle Invasive Bladder Cancer Detection. Cancers 2020, 12, 2994. [Google Scholar] [CrossRef] [PubMed]
  46. Panebianco, V.; Pecoraro, M.; Del Giudice, F.; Takeuchi, M.; Muglia, V.F.; Messina, E.; Cipollari, S.; Giannarini, G.; Catalano, C.; Narumi, Y. VI-RADS for Bladder Cancer: Current Applications and Future Developments. J. Magn. Reson. Imaging 2022, 55, 23–36. [Google Scholar] [CrossRef] [PubMed]
  47. Basile, D.; Corvaja, C.; Caccialanza, R.; Aprile, G. Sarcopenia: Looking to muscle mass to better manage pancreatic cancer patients. Curr. Opin. Support. Palliat. Care 2019, 13, 279–285. [Google Scholar] [CrossRef]
  48. Kurk, S.A.; Peeters, P.H.M.; Dorresteijn, B.; De Jong, P.A.; Jourdan, M.; Creemers, G.-J.M.; Erdkamp, F.L.G.; De Jongh, F.E.; Kint, P.A.M.; Poppema, B.J.; et al. Loss of skeletal muscle index and survival in patients with metastatic colorectal cancer: Secondary analysis of the phase 3 CAIRO3 trial. Cancer Med. 2020, 9, 1033–1043. [Google Scholar] [CrossRef]
  49. Panebianco, V.; Grazhdani, H.; Iafrate, F.; Petroni, M.; Anzidei, M.; Laghi, A.; Passariello, R. 3D CT protocol in the assessment of the esophageal neoplastic lesions: Can it improve TNM staging? Eur. Radiol. 2006, 16, 414–421. [Google Scholar] [CrossRef]
  50. Iwase, T.; Wang, X.; Shrimanker, T.V.; Kolonin, M.G.; Ueno, N.T. Body composition and breast cancer risk and treatment: Mechanisms and impact. Breast Cancer Res. Treat. 2021, 186, 273–283. [Google Scholar] [CrossRef]
  51. Ubachs, J.; Ziemons, J.; Minis-Rutten, I.J.G.; Kruitwagen, R.F.P.M.; Kleijnen, J.; Lambrechts, S.; Olde Damink, S.W.M.; Rensen, S.S.; Van Gorp, T. Sarcopenia and ovarian cancer survival: A systematic review and meta-analysis. J. Cachexia Sarcopenia Muscle 2019, 10, 1165–1174. [Google Scholar] [CrossRef]
  52. Jung, J.; Lee, E.; Shim, H.; Park, J.-H.; Eom, H.-S.; Lee, H. Prediction of clinical outcomes through assessment of sarcopenia and adipopenia using computed tomography in adult patients with acute myeloid leukemia. Int. J. Hematol. 2021, 114, 44–52. [Google Scholar] [CrossRef]
  53. Cecchini, S.; Cavazzini, E.; Marchesi, F.; Sarli, L.; Roncoroni, L. Computed Tomography Volumetric Fat Parameters versus Body Mass Index for Predicting Short-term Outcomes of Colon Surgery. World J. Surg. 2011, 35, 415–423. [Google Scholar] [CrossRef]
  54. Wang, B.; Torriani, M. Artificial Intelligence in the Evaluation of Body Composition. Semin. Musculoskelet. Radiol. 2020, 24, 030–037. [Google Scholar] [CrossRef]
  55. Chung, H.; Jo, Y.; Ryu, D.; Jeong, C.; Choe, S.; Lee, J. Artificial-intelligence-driven discovery of prognostic biomarker for sarcopenia. J. Cachexia Sarcopenia Muscle 2021, 12, 2220–2230. [Google Scholar] [CrossRef] [PubMed]
  56. Bhinder, B.; Gilvary, C.; Madhukar, N.S.; Elemento, O. Artificial Intelligence in Cancer Research and Precision Medicine. Cancer Discov. 2021, 11, 900–915. [Google Scholar] [CrossRef] [PubMed]
  57. Somasundaram, E.; Castiglione, J.A.; Brady, S.L.; Trout, A.T. Defining Normal Ranges of Skeletal Muscle Area and Skeletal Muscle Index in Children on CT Using an Automated Deep Learning Pipeline: Implications for Sarcopenia Diagnosis. Am. J. Roentgenol. 2022, 219, 326–336. [Google Scholar] [CrossRef] [PubMed]
  58. Borrelli, P.; Kaboteh, R.; Enqvist, O.; Ulén, J.; Trägårdh, E.; Kjölhede, H.; Edenbrandt, L. Artificial intelligence-aided CT segmentation for body composition analysis: A validation study. Eur. Radiol. Exp. 2021, 5, 11. [Google Scholar] [CrossRef] [PubMed]
  59. Ferro, M.; de Cobelli, O.; Musi, G.; del Giudice, F.; Carrieri, G.; Busetto, G.M.; Falagario, U.G.; Sciarra, A.; Maggi, M.; Crocetto, F.; et al. Radiomics in prostate cancer: An up-to-date review. Ther. Adv. Urol. 2022, 14, 175628722211090. [Google Scholar] [CrossRef] [PubMed]
Figure 1. Case example of the automatic segmentation performed by the software at the level of the third lumbar vertebra.
Cancers 15 02968 g001
Figure 2. (A) Computed tomography (CT) image of a 75-year-old men with advanced right Upper Tract Urothelial Tumor (SMI value = 40.54 cm2/m2; (B) CT image of 72-year-old men with advanced Bladder Tumor on left posterior wall. (SMI value = 44.86 cm2/m2).
Cancers 15 02968 g002
Figure 3. LOWESS functions depicting the predicted probability for RaR clinical benefit outcomes (AF).
Cancers 15 02968 g003
Figure 4. The effect of sarcopenia on OS depicted by Kaplan-Meier plots (AJ).
Cancers 15 02968 g004
Figure 5. LOWESS function to model ∆-SMI-L3 for the predicted survival probability derived from multivariable Cox regression model (AF).
Cancers 15 02968 g005
Table 1. Patients’ population demographic characteristics and disease outcome according to the body composition status at baseline and after systemic chemotherapy.
VariablesNo Sarcopenic Status, Baseline
(By SMI-L3 Cut-Off)
Sarcopenic Status, Baseline
(By SMI-L3 Cut-Off)
p-Value *No SARCOPENIC Status, after CHT
(By SMI-L3 Cut-Off)
Sarcopenic Status,
after CHT
(By SMI-L3 Cut-Off)
p-Value *
Sample size, n (%)46 (47.4)51 (52.6) 45 (46.4)52 (53.6) 
 Demographics and tumor-related features 
Age y, median (IQR)73 (64–76)69 (64–74)0.41473 (66–76)68 (64–74)0.126
Age y, n (%)      
<70 y19 (41.3)30 (58.8)0.10517 (37.8)32 (61.5)0.025
≥70 y27 (58.7)21 (42.2)28 (62.2)20 (38.5)
Gender, n (%)      
Male36 (78.3)34 (66.7)0.25911 (24.4)16 (30.8)0.506
Female10 (27.7)17 (33.3)34 (75.6)36 (69.2)
ECOG PS, n (%)      
<239 (84.8)40 (78.4)0.44738 (84.4)41 (78.8)0.603
≥27 (15.2)11 (21.6)7 (15.6)11 (21.2)
n. of Medications, n (%)      
<636 (78.3)42 (82.4)0.62034 (75.6)44 (84.6)0.311
≥610 (21.7)9 (17.6)11 (24.4)8 (15.4)
Primary location n (%)      
BCa24 (52.2)37 (72.5)0.04924 (53.3)37 (71.2)0.096
UTUC21 (45.7)12 (23.5)20 (44.4)13 (25.0)
Concomitant 1 (2.2)2 (3.9)1 (2.2)2 (3.8)
Oncologic stage, n (%)      
III22 (47.8)17 (33.3)0.15522 (48.9)17 (32.7)0.146
IV24 (52.2)34 (66.7)23 (51.1)35 (67.3)
 Anthropometric measures 
Height, m1.70 (1.66–1.75)1.70 (1.62–1.75)0.7531.70 (1.64–1.73)1.70 (1.64–1.75)0.677
Weight, kg77 (70–85.25)70 (60–75)0.00177 (70–80.25)70 (60–80)0.005
BMI, kg/m226.3 (24.85–27.75)24.2 (21.9–26.5)0.00126.3 (25.3–29.3)23.5 (21.7–26.4)0.007
SMA, cm2179.7 (167.8–194)135.8 (114.8–155.2)<0.0001173.1 (157.2–193)133.7 (116–154.4)<0.0001
SMI-L3, (cm2/m2)62 (57.8–67.1)48.6 (43.1–53)<0.000159.9 (57.3–63.8)47.9 (43.4–50.9)<0.0001
Subcutaneous fat, (cm2/m2)184.2 (133.6–221.8)135.2 (108.4–178.6)0.003178.7 (130.7–215.1)143.1 (108.4–183.2)0.002
Visceral fat, (cm2/m2)207 (153.7–255.7)103 (67.9–175.7)<0.0001182.6 (140–218.4)137 (64.5–181.6)<0.0001
Psoas muscle, (cm2/m2)21.7 (19.4–24.6)16.5 (13.3–20)<0.000120.8 (18–22.8)16.1 (13.5–19)<0.0001
Abdominal muscle, (cm2/m2)100.6 (89.6–109.2)71.5 (59.1–82.2)<0.000193.4 (86.6–106.9)71.6 (59.7–80.9)<0.0001
Long spine muscle, (cm2/m2)60.3 (54.8–64.1)45.5 (40.8–55)<0.000157.9 (51.4–62.8)46.4 (40.7–55.2)<0.0001
∆_SMI-L3, mean (SD)−1.86 (5.78)
∆_Subcutaneous fat mean (SD)0.25 (24.93)
∆_Visceral fat, mean (SD)−4.93 (42.17)
∆_ Psoas muscle, mean (SD)−0.85 (2.56)
∆_ Abdominal muscle, mean (SD)−3.02 (10.74)
∆_ Long spine muscle, mean (SD)−1.06 (3.39)
 Clinical outcomes 
Clinical Benefit, n (%)      
SD/PR/CR30 (65.2)25 (49)0.15129 (64.4)26 (50.0)0.217
PD16 (34.8)26 (51)16 (35.6)26 (50.0)
Survival n (%)      
Deceased37 (80.4)23 (45.1)0.00135 (77.8)25 (48.1)0.003
Survivors9 (19.6)28 (54.9)10 (22.2)27 (51.9)
* p-values according to Fisher’s Exact test or Mann-Whitney U test when appropriate (bold p-value means that it is statistically significant). CHT, chemotherapy; PS, performance status; BCa, bladder cancer; UTUC, Upper tract Urothelial Carcinoma; BMI, body mass index; SMA, skeletal muscle area; SMI, skeletal muscle mass index; SD, stable disease; PR, partial response; CR, complete response; PD, progression disease.
Disclaimer/Publisher’s Note: The statements, opinions and data contained in all publications are solely those of the individual author(s) and contributor(s) and not of MDPI and/or the editor(s). MDPI and/or the editor(s) disclaim responsibility for any injury to people or property resulting from any ideas, methods, instructions or products referred to in the content.

