
Pterygium and Ocular Surface Squamous Neoplasia: Optical Biopsy Using a Novel Autofluorescence Multispectral Imaging Technique

 , , , and
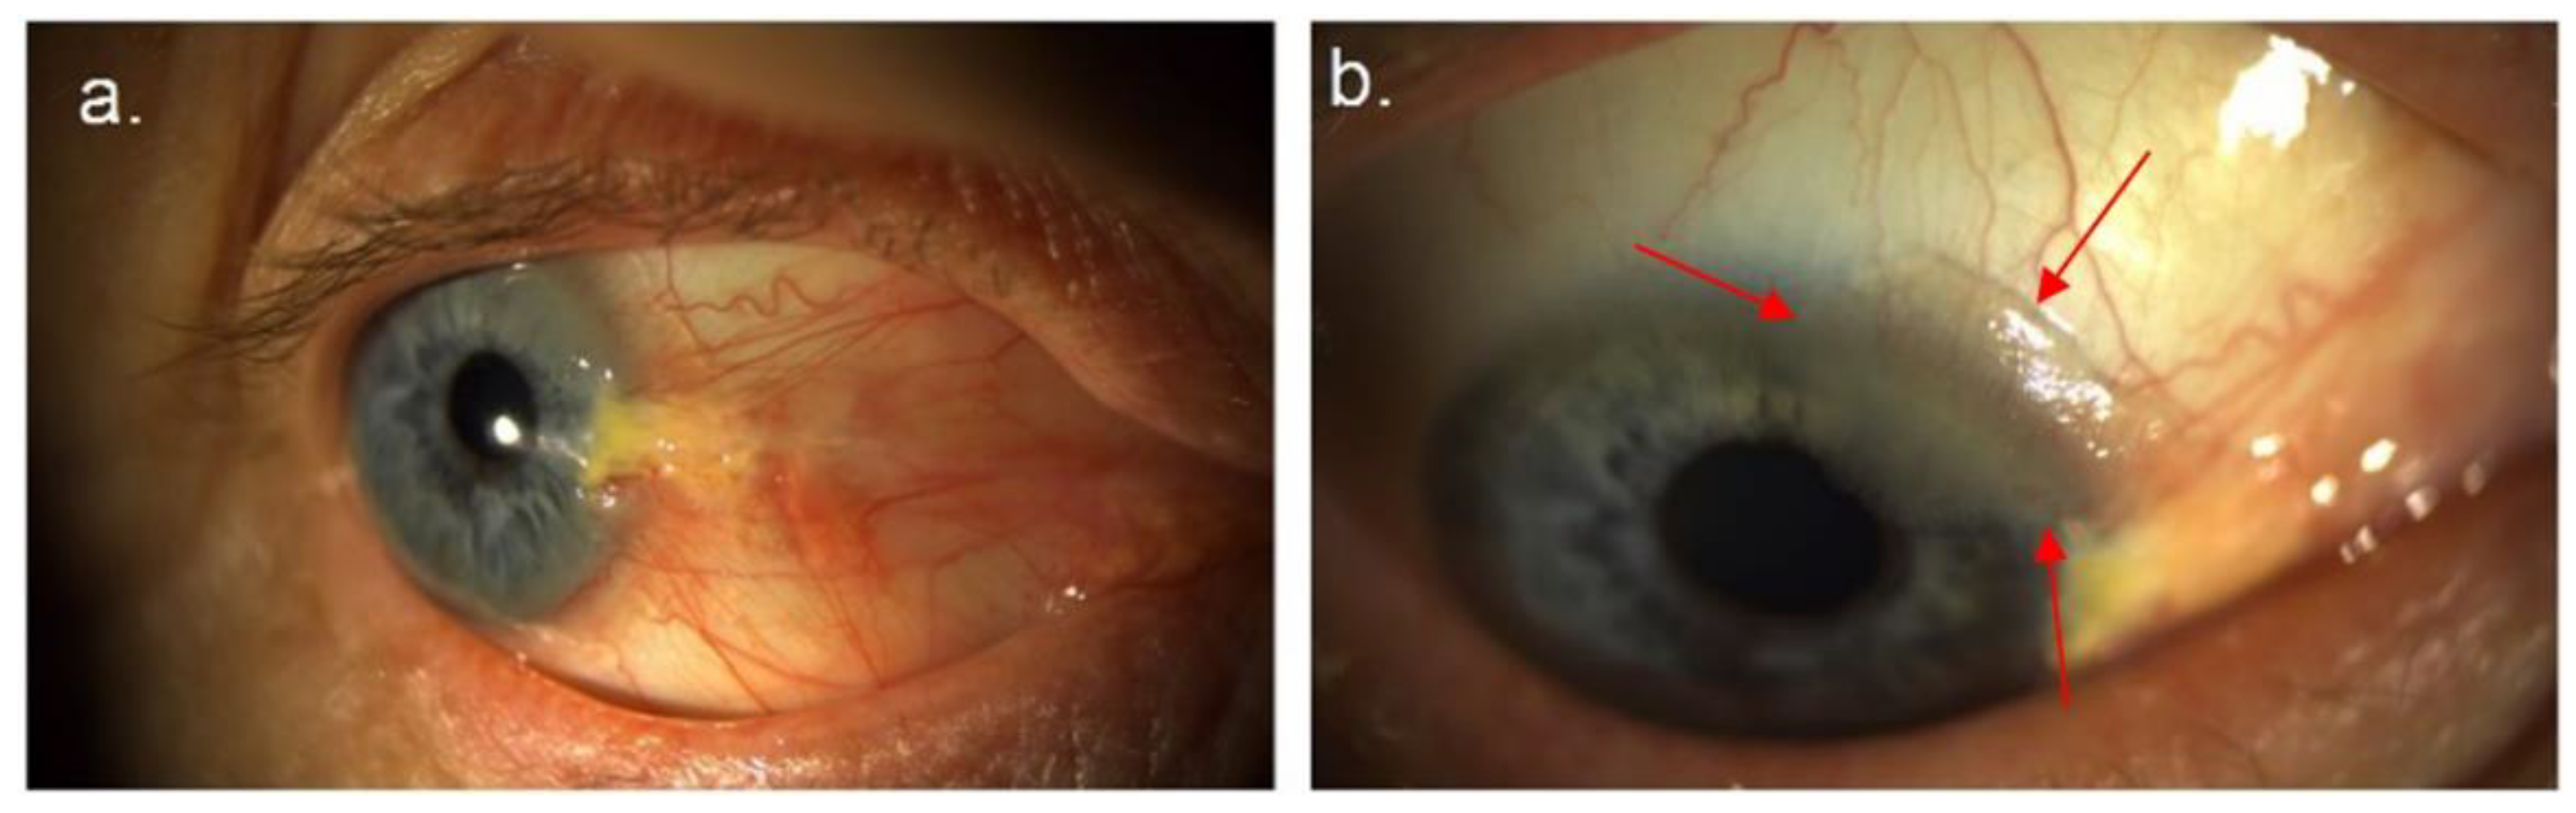
Abstract
:Simple Summary
Abstract
1. Introduction
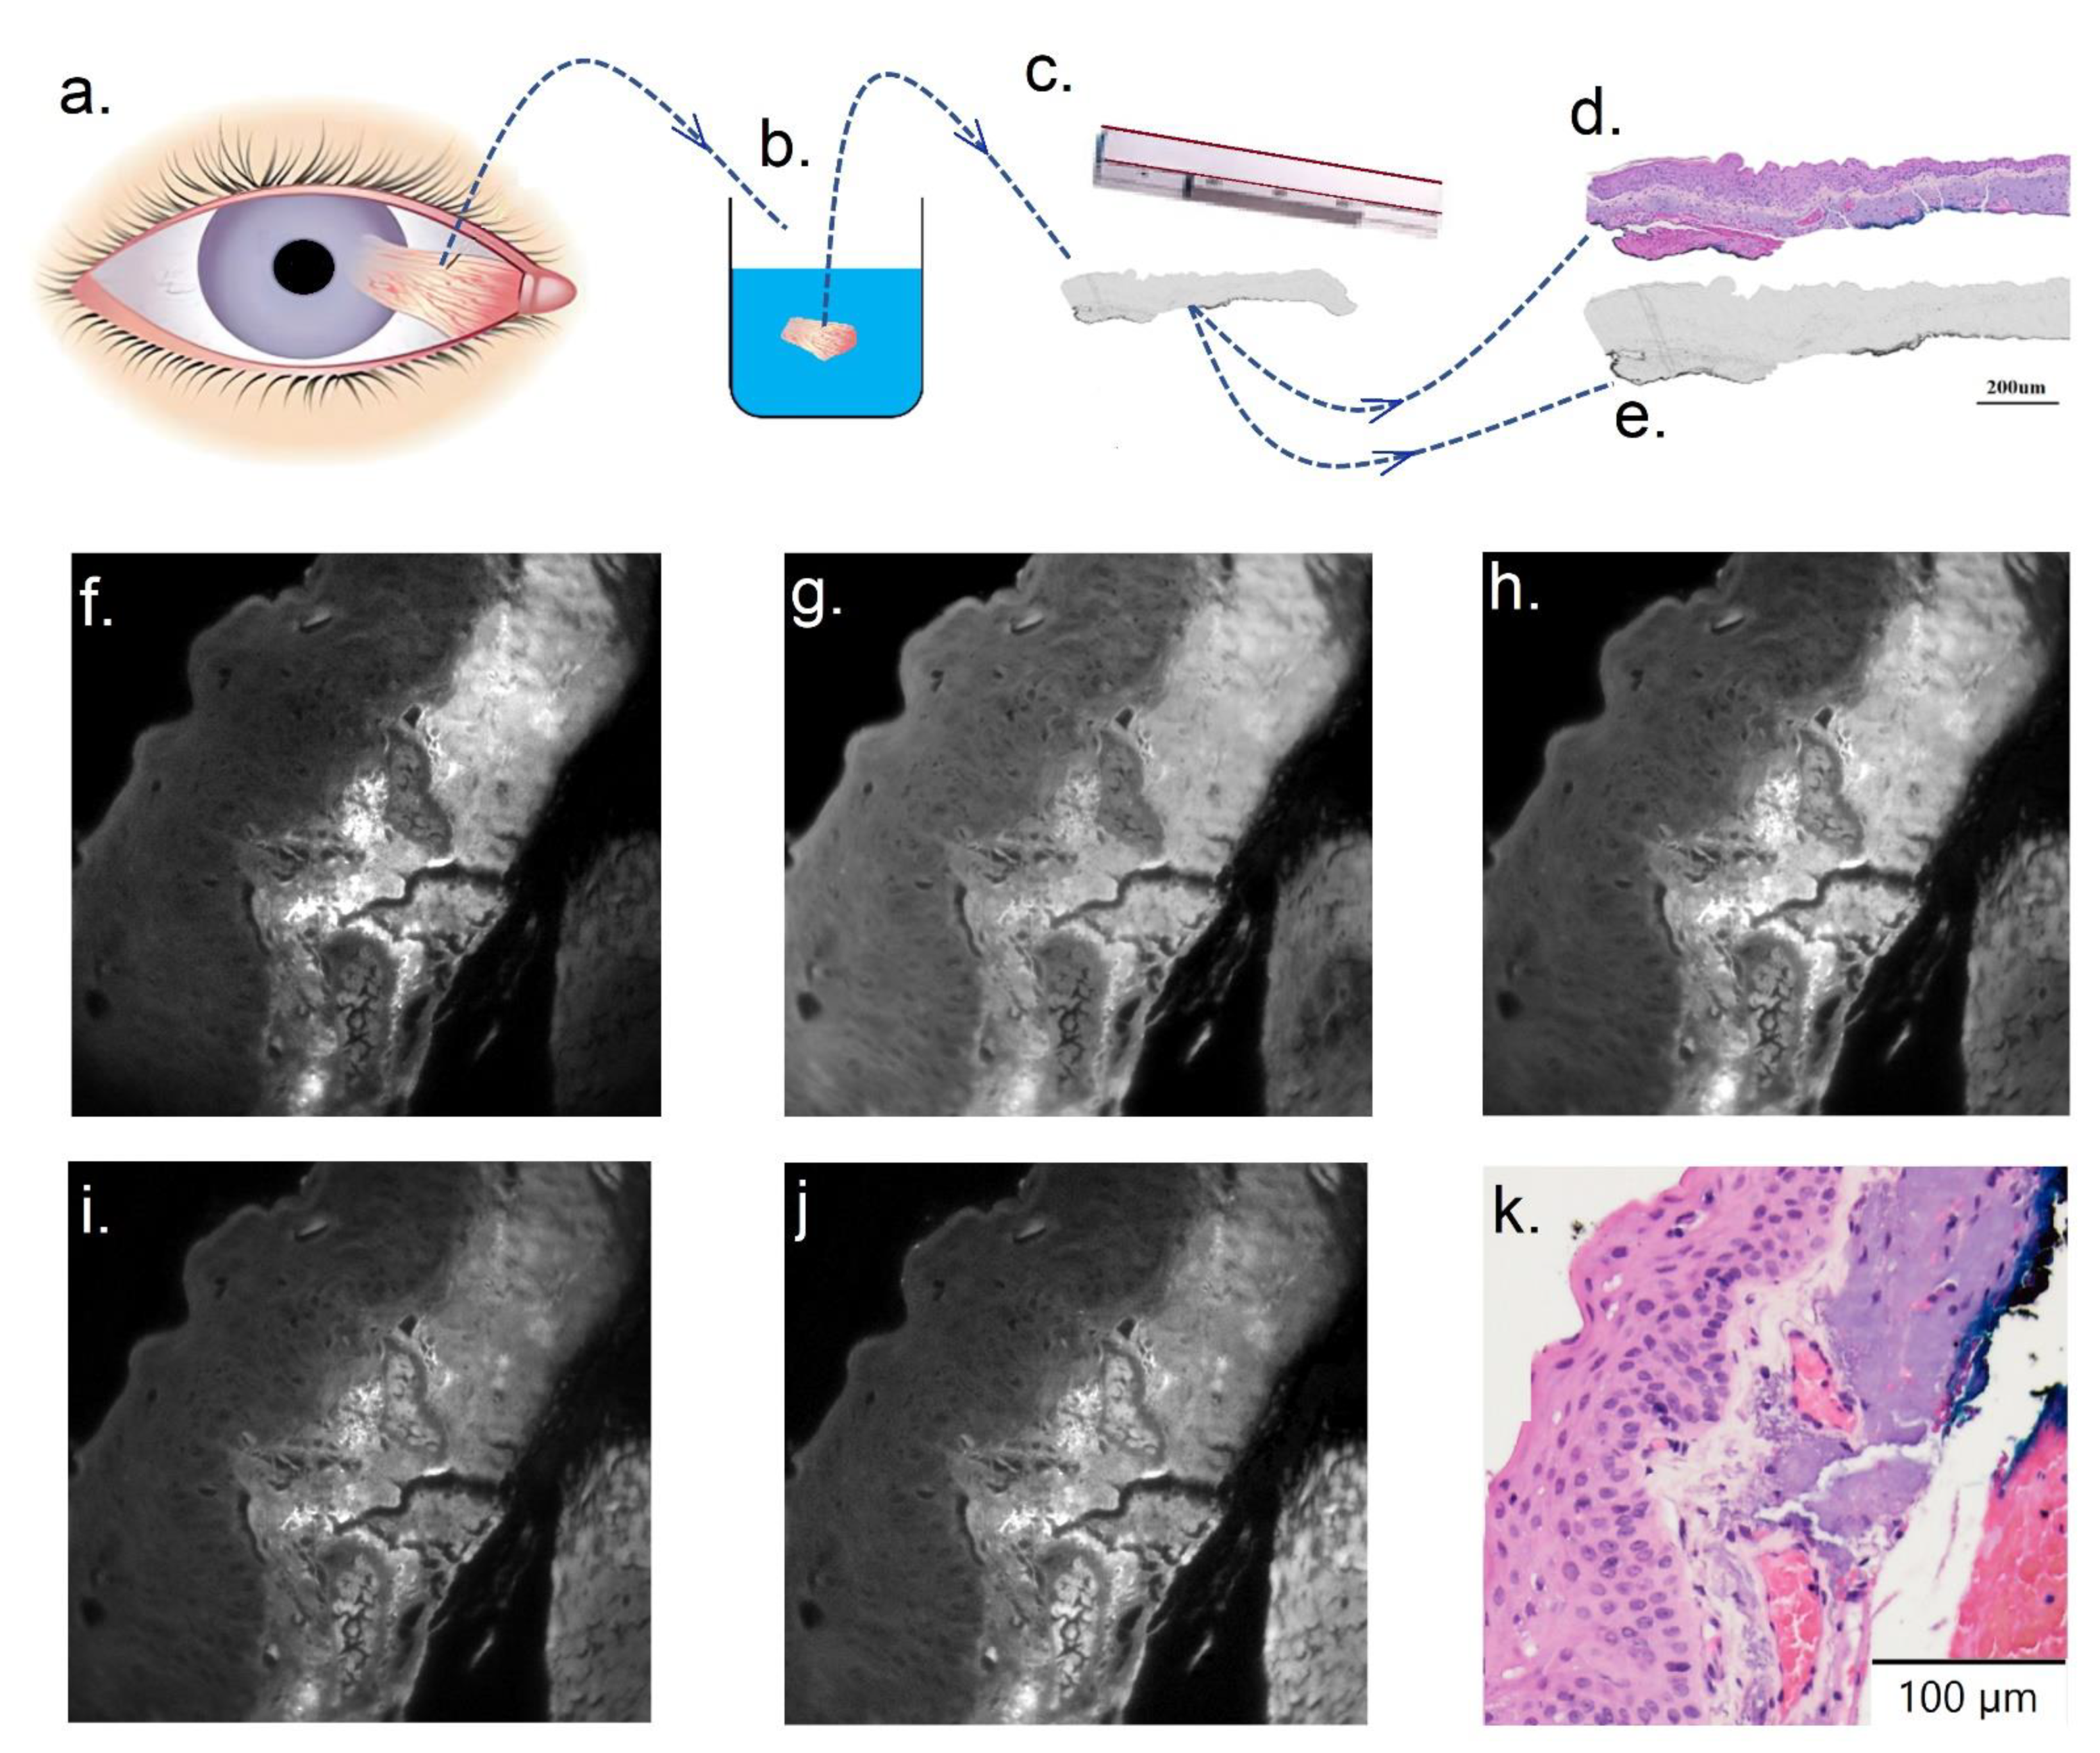
2. Materials and Methods
2.1. Patient Recruitment
2.2. Multispectral Imaging
2.3. Establishing Spectral Signatures
2.4. Fused Classification Framework
2.5. Multivariate Analysis and Data Analysis Method
2.6. Statistics
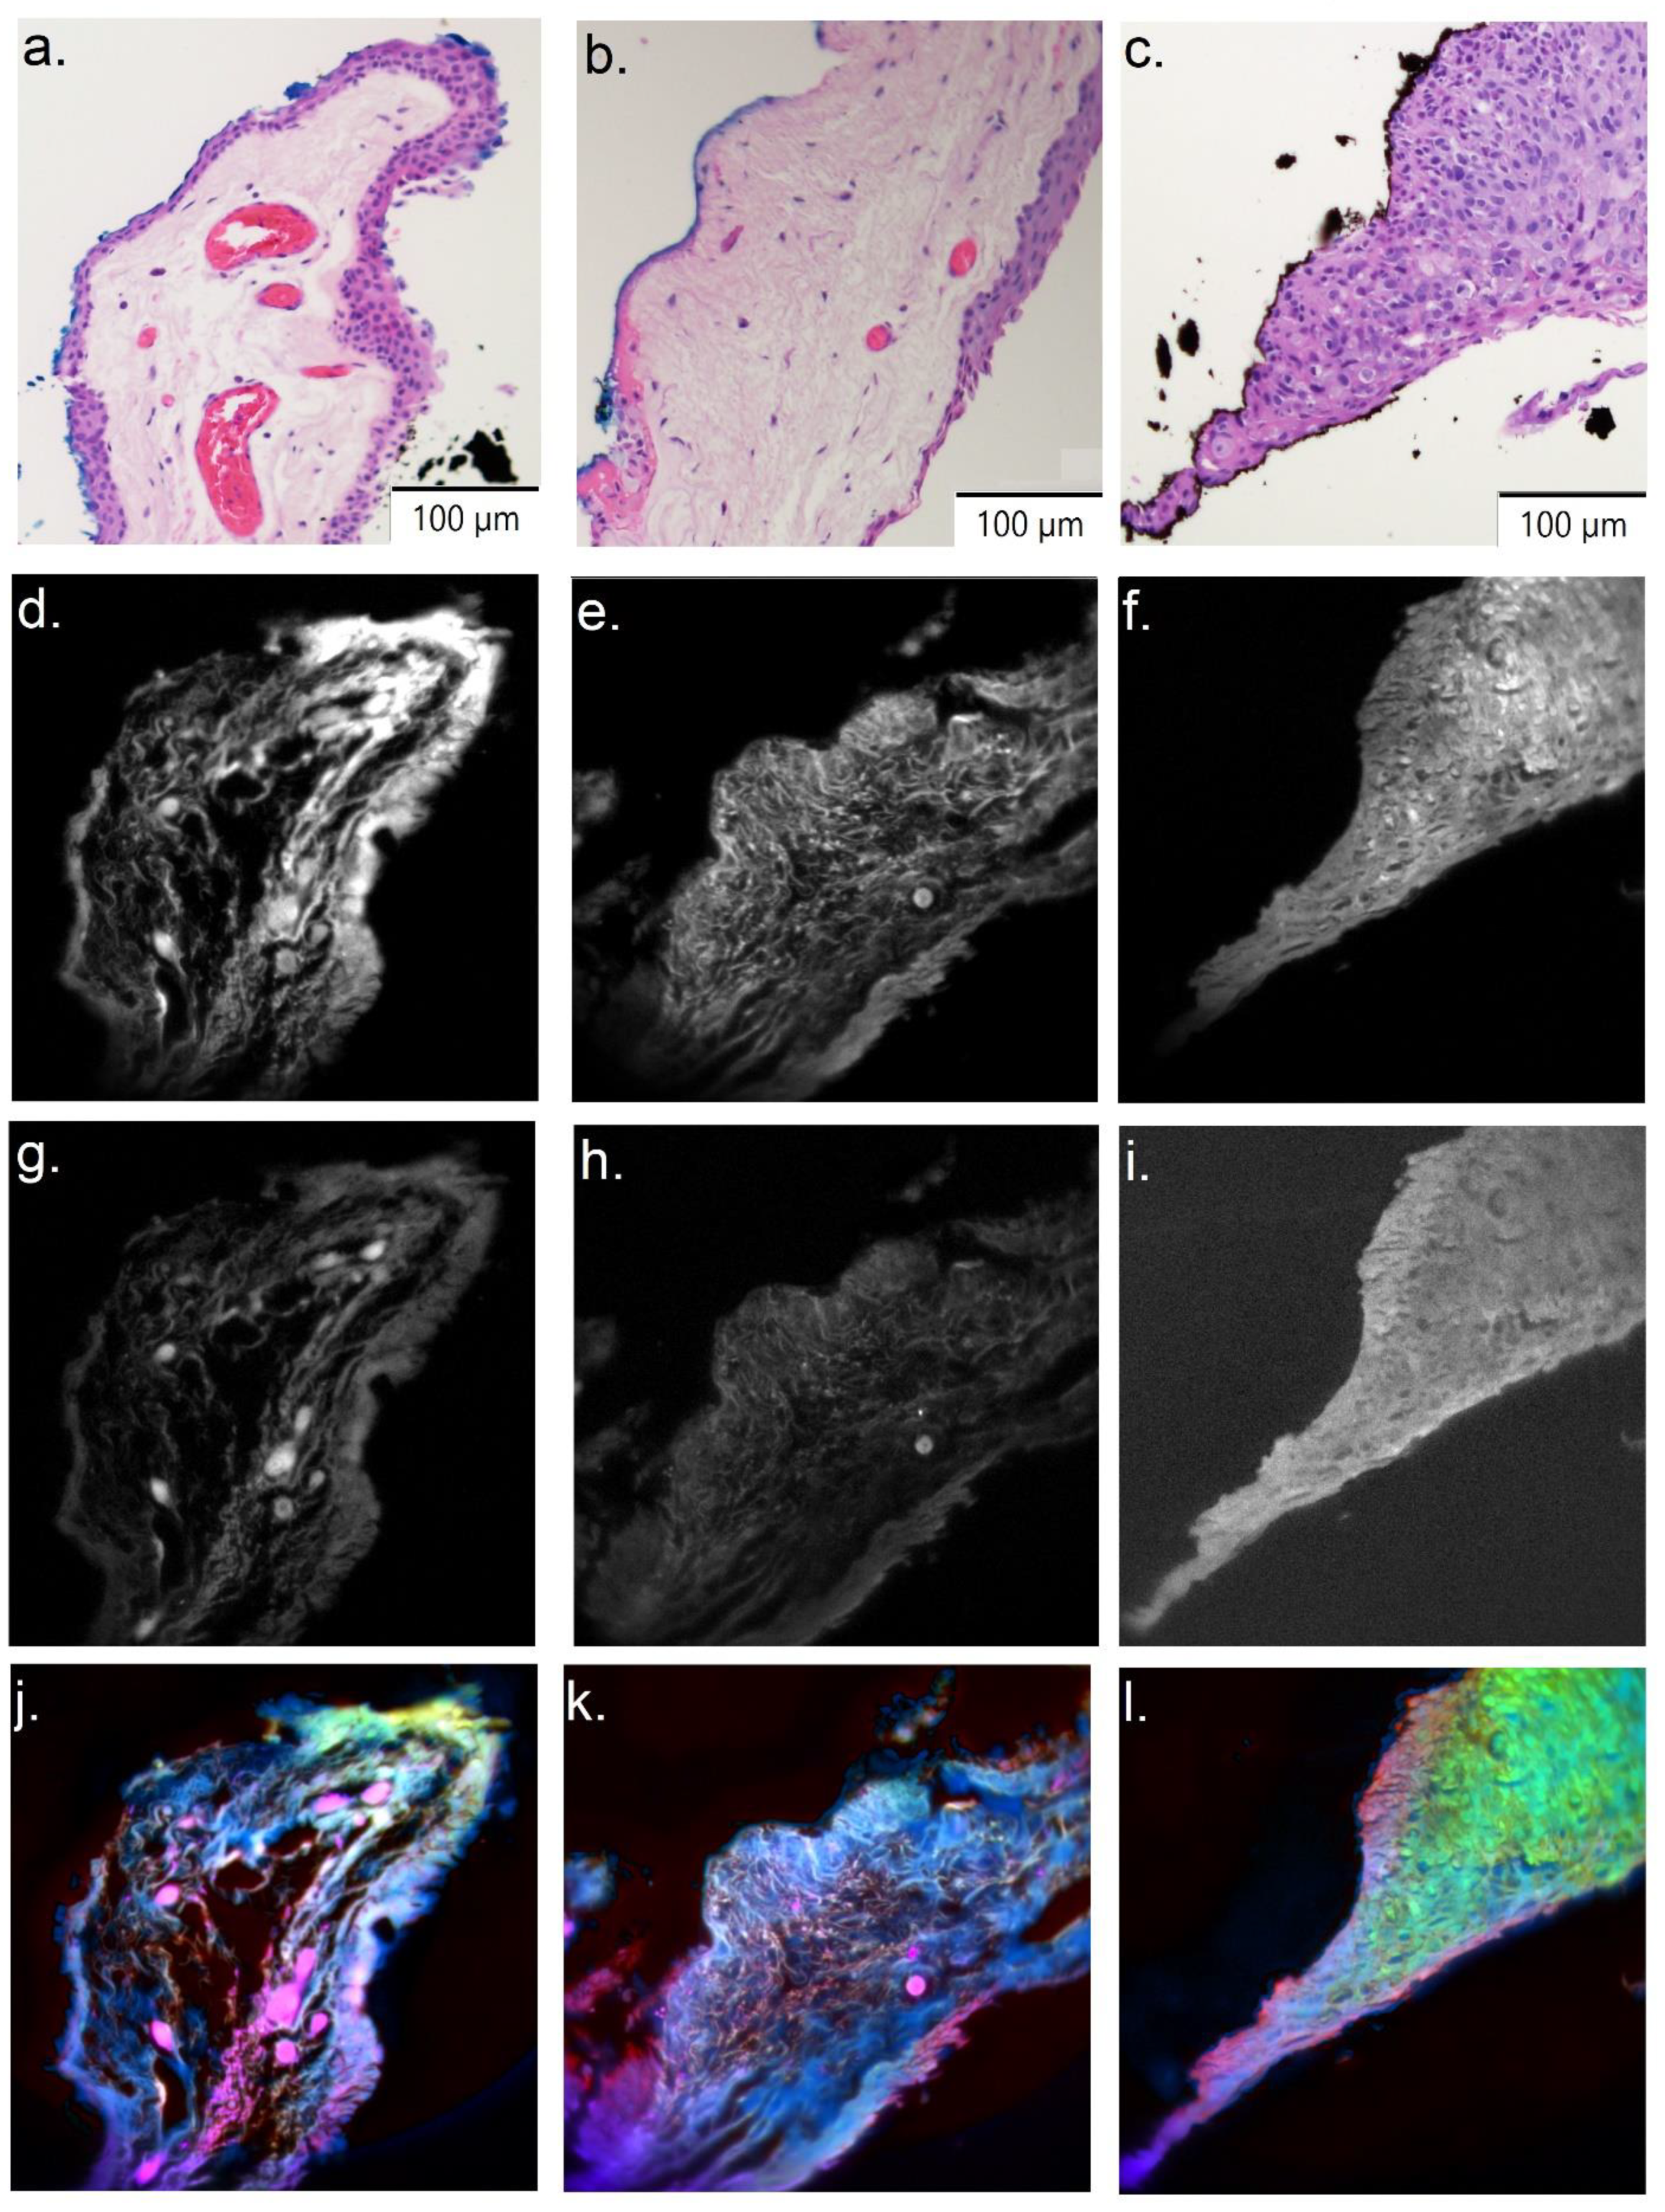
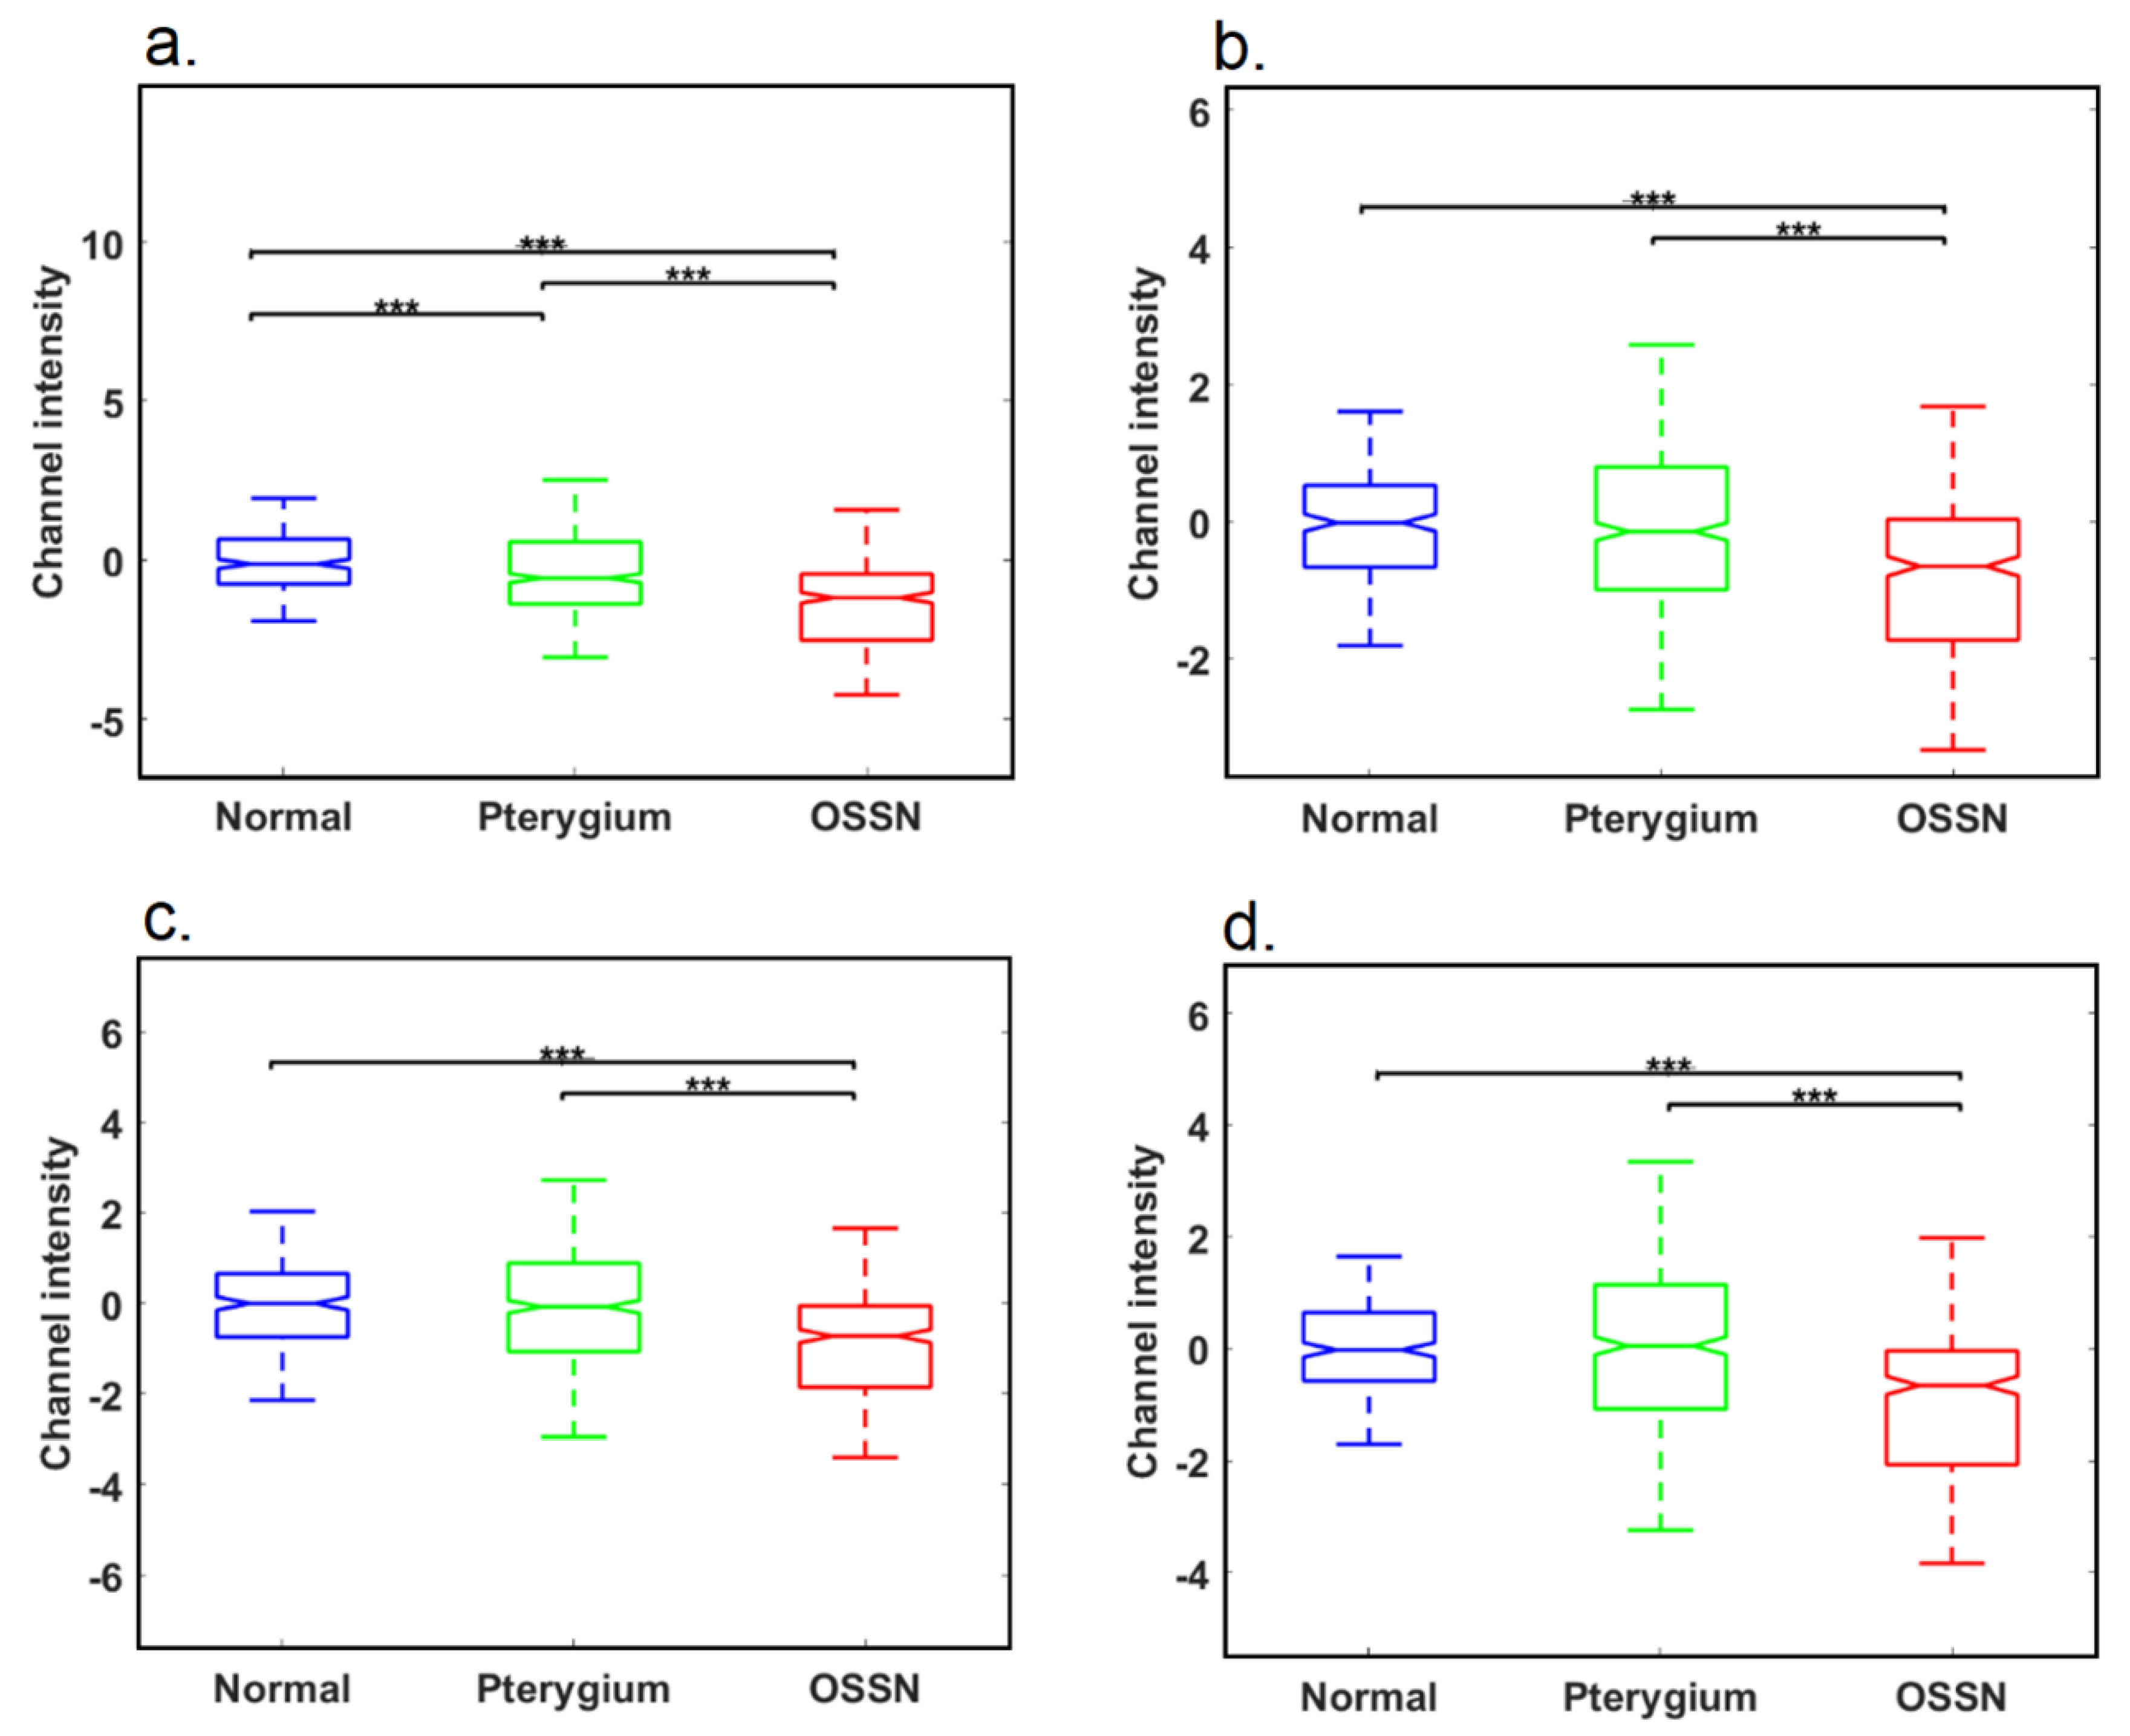
3. Results
3.1. OSSN and PTG Classification
3.2. OSSN and PTG Spectral Signature Visualization
3.3. Fluorophore Analysis
3.4. Boundary Detection
4. Discussion
5. Conclusions
Supplementary Materials
Author Contributions
Funding
Institutional Review Board Statement
Informed Consent Statement
Data Availability Statement
Conflicts of Interest
References
- Oellers, P.; Karp, C.L.; Sheth, A.; Kao, A.A.; Abdelaziz, A.; Matthews, J.L.; Dubovy, S.R.; Galor, A. Prevalence, treatment, and outcomes of coexistent ocular surface squamous neoplasia and pterygium. Ophthalmology 2013, 120, 445–450. [Google Scholar] [CrossRef] [PubMed] [Green Version]
- Coroneo, M. Ultraviolet radiation and the anterior eye. Eye Contact Lens Sci. Clin. Pract. 2011, 37, 214–224. [Google Scholar] [CrossRef] [PubMed]
- Grupcheva, C.N.; Radeva, M.N.; Grupchev, D.I.; Nikolova, S.P. Damage of the ocular surface from indoor suntanning—Insights from in vivo confocal microscopy. Contact Lens Anterior Eye 2021, 44, 101438. [Google Scholar] [CrossRef] [PubMed]
- Grupcheva, C.N.; Grupchev, D.I.; Radeva, M.N.; Hristova, E.G. UV damage of the anterior ocular surface–microstructural evidence by in vivo confocal microscopy. Contact Lens Anter. Eye 2018, 41, 482–488. [Google Scholar] [CrossRef]
- Lee, G.A.; Hirst, L.W. Ocular surface squamous neoplasia. Surv. Ophthalmol. 1995, 39, 429–450. [Google Scholar] [CrossRef]
- Basti, S.; Macsai, M.S. Ocular surface squamous neoplasia: A review. Cornea 2003, 22, 687–704. [Google Scholar] [CrossRef]
- Kim, Y.J.; Kim, J.; Choung, H.; Kim, M.K.; Wee, W.R. Conjunctival granuloma with necrosis associated with exposed suture in upper double lid masquerading as ocular surface squamous neoplasia: A case report. BMC Ophthalmol. 2017, 17, 55. [Google Scholar] [CrossRef] [Green Version]
- Panchapakesan, J.; Hourihan, F.; Mitchell, P. Prevalence of pterygium and pinguecula: The Blue Mountains Eye Study. Aust. N. Z. J. Ophthalmol. 1998, 26, S2–S5. [Google Scholar] [CrossRef]
- Wlodarczyk, J.; Whyte, P.; Cockrum, P.; Taylor, H. Pterygium in Australia: A cost of illness study. Clin. Exp. Ophthalmol. 2001, 29, 370–375. [Google Scholar] [CrossRef]
- Chui, J.; Coroneo, M.T.; Tat, L.T.; Crouch, R.; Wakefield, D.; Di Girolamo, N. Ophthalmic pterygium: A stem cell disorder with premalignant features. Am. J. Pathol. 2011, 178, 817–827. [Google Scholar] [CrossRef]
- Hirst, L.W.; Axelsen, R.A.; Schwab, I. Pterygium and associated ocular surface squamous neoplasia. Arch. Ophthalmol. 2009, 127, 31–32. [Google Scholar] [PubMed] [Green Version]
- Ip, M.H.; Tat, L.; Coroneo, M.T. The treatment of recurrent conjunctival and corneal intraepithelial neoplasia with interferon alfa-2b and retinoic acid:~ 9 years’ follow-up on tumor control. Ocul. Surf. 2020, 18, 354–359. [Google Scholar] [CrossRef] [PubMed]
- Holland, E.J.; Mannis, M.J.; Lee, W.B. Ocular Surface Disease: Cornea, Conjunctiva and Tear Film: Expert Consult-Online and Print; Elsevier Health Sciences: Philadelphia, PA, USA, 2013. [Google Scholar]
- Hirst, L.W. The treatment of pterygium. Surv. Ophthalmol. 2003, 48, 145–180. [Google Scholar] [CrossRef]
- Radhakrishnan, A. Squamous neoplasia [OSSN]—A brief review. Kerala J. Ophthalmol. 2011, 23, 347–351. [Google Scholar]
- Nguena, M.B.; van den Tweel, J.G.; Makupa, W.; Hu, V.H.; Weiss, H.A.; Gichuhi, S.; Burton, M.J. Diagnosing ocular surface squamous neoplasia in East Africa: Case-control study of clinical and in vivo confocal microscopy assessment. Ophthalmology 2014, 121, 484–491. [Google Scholar] [CrossRef] [Green Version]
- Mendoza, P.R.; Craven, C.M.; Ip, M.H.; Wilson, M.W.; Coroneo, M.T.; Grossniklaus, H.E. Conjunctival squamous cell carcinoma with corneal stromal invasion in presumed pterygia: A case series. Ocul. Oncol. Pathol. 2018, 4, 240–249. [Google Scholar] [CrossRef]
- Ditta, L.C.; Shildkrot, Y.; Wilson, M.W. Outcomes in 15 patients with conjunctival melanoma treated with adjuvant topical mitomycin C: Complications and recurrences. Ophthalmology 2011, 118, 1754–1759. [Google Scholar] [CrossRef]
- Gichuhi, S.; Macharia, E.; Kabiru, J.; Zindamoyen, A.M.; Rono, H.; Ollando, E.; Wanyonyi, L.; Wachira, J.; Munene, R.; Onyuma, T.; et al. Clinical presentation of ocular surface squamous neoplasia in Kenya. JAMA Ophthalmol. 2015, 133, 1305–1313. [Google Scholar] [CrossRef]
- Barros, J.N.; Lowen, M.S.; Ballalai, P.L.; Mascaro, V.L.D.M.; Gomes, J.A.P.; Martins, M.C. Predictive index to differentiate invasive squamous cell carcinoma from preinvasive ocular surface lesions by impression cytology. Br. J. Ophthalmol. 2009, 93, 209–214. [Google Scholar] [CrossRef]
- Galor, A.; Karp, C.L.; Oellers, P.; Kao, A.A.; Abdelaziz, A.; Feuer, W.; Dubovy, S.R. Predictors of ocular surface squamous neoplasia recurrence after excisional surgery. Ophthalmology 2012, 119, 1974–1981. [Google Scholar] [CrossRef] [Green Version]
- Singh, R.; Joseph, A.; Umapathy, T.; Tint, N.L.; Dua, H.S. Impression cytology of the ocular surface. Br. J. Ophthalmol. 2005, 89, 1655–1659. [Google Scholar] [CrossRef] [PubMed] [Green Version]
- Tananuvat, N.; Lertprasertsuk, N.; Mahanupap, P.; Noppanakeepong, P. Role of impression cytology in diagnosis of ocular surface neoplasia. Cornea 2008, 27, 269–274. [Google Scholar] [CrossRef] [PubMed]
- Calonge, M.; Diebold, Y.; Sáez, V.; de Salamanca, A.E.; García-Vázquez, C.; Corrales, R.M.; Herreras, J.M. Impression cytology of the ocular surface: A review. Exp. Eye Res. 2004, 78, 457–472. [Google Scholar] [CrossRef] [PubMed]
- Lu, G.; Little, J.V.; Wang, X.; Zhang, H.; Patel, M.R.; Griffith, C.C.; El-Deiry, M.W.; Chen, A.Y.; Fei, B. Detection of head and neck cancer in surgical specimens using quantitative hyperspectral imaging. Clin. Cancer Res. 2017, 23, 5426–5436. [Google Scholar] [CrossRef] [Green Version]
- Yousef, Y.A.; Finger, P.T. Squamous carcinoma and dysplasia of the conjunctiva and cornea: An analysis of 101 cases. Ophthalmology 2012, 119, 233–240. [Google Scholar] [CrossRef]
- Zarei-Ghanavati, M.; Mousavi, E.; Nabavi, A.; Latifi, G.; Mehrjardi, H.Z.; Mohebbi, M.; Ghassemi, H.; Mirzaie, F.; Zare, M.A. Changes in in vivo confocal microscopic findings of ocular surface squamous neoplasia during treatment with topical interferon alfa-2b. Ocul. Surf. 2018, 16, 235–241. [Google Scholar] [CrossRef]
- Venkateswaran, N.; Sripawadkul, W.; Karp, C.L. The role of imaging technologies for ocular surface tumors. Curr. Opin. Ophthalmol. 2021, 32, 369–378. [Google Scholar] [CrossRef]
- Vajzovic, L.M.; Karp, C.L.; Haft, P.; Shousha, M.A.; Dubovy, S.R.; Hurmeric, V.; Yoo, S.H.; Wang, J. Ultra high-resolution anterior segment optical coherence tomography in the evaluation of anterior corneal dystrophies and degenerations. Ophthalmology 2011, 118, 1291–1296. [Google Scholar] [CrossRef]
- Nanji, A.A.; Mercado, C.; Galor, A.; Dubovy, S.; Karp, C.L. Updates in ocular surface tumor diagnostics. Int. Ophthalmol. Clin. 2017, 57, 47–62. [Google Scholar] [CrossRef]
- Habibalahi, A.; Bala, C.; Allende, A.; Anwer, A.G.; Goldys, E.M. Novel automated non invasive detection of ocular surface squamous neoplasia using multispectral autofluorescence imaging. Ocul. Surf. 2019, 17, 540–550. [Google Scholar] [CrossRef]
- Habibalahi, A.; Moghari, M.D.; Campbell, J.M.; Anwer, A.G.; Mahbub, S.B.; Gosnell, M.; Saad, S.; Pollock, C.; Goldys, E.M. Non-invasive real-time imaging of reactive oxygen species (ROS) using auto-fluorescence multispectral imaging technique: A novel tool for redox biology. Redox Biol. 2020, 34, 101561. [Google Scholar] [CrossRef] [PubMed]
- Campbell, J.M.; Habibalahi, A.; Mahbub, S.; Gosnell, M.; Anwer, A.G.; Paton, S.; Gronthos, S.; Goldys, E. Non-destructive, label free identification of cell cycle phase in cancer cells by multispectral microscopy of autofluorescence. BMC Cancer 2019, 19, 1242. [Google Scholar] [CrossRef] [PubMed]
- Jahr, W.; Schmid, B.; Schmied, C.; Fahrbach, F.O.; Huisken, J. Hyperspectral light sheet microscopy. Nat. Commun. 2015, 6, 7990. [Google Scholar] [CrossRef] [PubMed] [Green Version]
- Luthman, A.S.; Dumitru, S.; Quiros-Gonzalez, I.; Joseph, J.; Bohndiek, S.E. Fluorescence hyperspectral imaging (fHSI) using a spectrally resolved detector array. J. Biophotonics 2017, 10, 840–853. [Google Scholar] [CrossRef] [PubMed]
- Heiden, M.G.V.; Cantley, L.C.; Thompson, C.B. Understanding the Warburg effect: The metabolic requirements of cell proliferation. Science 2009, 324, 1029–1033. [Google Scholar] [CrossRef] [Green Version]
- Li, B.-H.; Xie, S.-S. Autofluorescence excitation-emission matrices for diagnosis of colonic cancer. World J. Gastroenterol. WJG 2005, 11, 3931–3934. [Google Scholar] [CrossRef]
- Stringari, C.; Edwards, R.A.; Pate, K.T.; Waterman, M.L.; Donovan, P.J.; Gratton, E. Metabolic trajectory of cellular differentiation in small intestine by Phasor Fluorescence Lifetime Microscopy of NADH. Sci. Rep. 2012, 2, 568. [Google Scholar] [CrossRef] [Green Version]
- Skala, M.C.; Riching, K.M.; Gendron-Fitzpatrick, A.; Eickhoff, J.; Eliceiri, K.W.; White, J.G.; Ramanujam, N. In vivo multiphoton microscopy of NADH and FAD redox states, fluorescence lifetimes, and cellular morphology in precancerous epithelia. Proc. Natl. Acad. Sci. USA 2007, 104, 19494–19499. [Google Scholar] [CrossRef] [Green Version]
- Wagnieres, G.A.; Star, W.M.; Wilson, B.C. In vivo fluorescence spectroscopy and imaging for oncological applications. Photochem. Photobiol. 1998, 68, 603. [Google Scholar] [CrossRef]
- Campbell, J.M.; Habibalahi, A.; Mahbub, S.B.; Paton, S.; Gronthos, S.; Goldys, E.M. Multispectral characterisation of mesenchymal stem/stromal cells: Age, cell cycle, senescence, and pluripotency. In Label-Free Biomedical Imaging and Sensing (LBIS); International Society for Optics and Photonics: San Francisco, CA, USA, 2020. [Google Scholar]
- Campbell, J.M.; Mahbub, S.; Habibalahi, A.; Paton, S.; Gronthos, S.; Goldys, E. Ageing human bone marrow mesenchymal stem cells have depleted NAD(P)H and distinct multispectral autofluorescence. GeroScience 2020, 43, 859–868. [Google Scholar] [CrossRef]
- Gosnell, M.E.; Anwer, A.G.; Mahbub, S.B.; Perinchery, S.B.M.; Inglis, D.; Adhikary, P.; Jazayeri, J.A.; Cahill, M.; Saad, S.; Pollock, C.A.; et al. Quantitative non-invasive cell characterisation and discrimination based on multispectral autofluorescence features. Sci. Rep. 2016, 6, 23453. [Google Scholar] [CrossRef] [PubMed] [Green Version]
- Mahbub, S.B.; Guller, A.; Campbell, J.M.; Anwer, A.G.; Gosnell, M.E.; Vesey, G.; Goldys, E.M. Non-Invasive Monitoring of Functional State of Articular Cartilage Tissue with Label-Free Unsupervised Hyperspectral Imaging. Sci. Rep. 2019, 9, 4398. [Google Scholar] [CrossRef] [PubMed]
- Mahbub, S.B.; Ploschner, M.; Gosnell, M.E.; Anwer, A.G.; Goldys, E.M. Statistically strong label-free quantitative identification of native fluorophores in a biological sample. Sci. Rep. 2017, 7, 15792. [Google Scholar] [CrossRef] [PubMed] [Green Version]
- Rehman, A.U.; Anwer, A.G.; Gosnell, M.E.; Mahbub, S.B.; Liu, G.; Goldys, E.M. Fluorescence quenching of free and bound NADH in HeLa cells determined by hyperspectral imaging and unmixing of cell autofluorescence. Biomed. Opt. Express 2017, 8, 1488–1498. [Google Scholar] [CrossRef] [PubMed] [Green Version]
- Campbell, J.M.; Mahbub, S.B.; Bertoldo, M.J.; Habibalahi, A.; Goss, D.M.; Ledger, W.L.; Gilchrist, R.B.; Wu, L.E.; Goldys, E.M. Multispectral autofluorescence characteristics of reproductive aging in old and young mouse oocytes. Biogerontology 2022, 1–13. [Google Scholar] [CrossRef]
- Habibalahi, A. Non-Invasive Cancer Characterisation Using Autofluorescence Imaging. Ph.D. Thesis, Macquarie University, Sydney, Australia, 2019. [Google Scholar]
- Habibalahi, A.; Allende, A.; Bala, C.; Anwer, A.G.; Mukhopadhyay, S.; Goldys, E.M. Optimized autofluorescence spectral signature for non-invasive diagnostics of ocular surface squamous neoplasia (OSSN). IEEE Access 2019, 7, 141343–141351. [Google Scholar] [CrossRef]
- Tan, T.C.; Mahbub, S.B.; Campbell, J.M.; Habibalahi, A.; Campugan, C.A.; Rose, R.D.; Chow, D.J.; Mustafa, S.; Goldys, E.M.; Dunning, K.R. Non-invasive, label-free optical analysis to detect aneuploidy within the inner cell mass of the preimplantation embryo. Human Reprod. 2022, 37, 14–29. [Google Scholar] [CrossRef]
- Maćkiewicz, A.; Ratajczak, W. Principal components analysis (PCA). Comput. Geosci. 1993, 19, 303–342. [Google Scholar] [CrossRef]
- Habibalahi, A.; Safizadeh, M.S. Forward to residual stress measurement by using pulsed eddy current technique. Insight- Non- Destr. Test. Cond. Monit. 2013, 55, 492–497. [Google Scholar] [CrossRef]
- Habibalahi, A.; Bertoldo, M.J.; Mahbub, S.B.; Campbell, J.M.; Goss, D.M.; Ledger, W.L.; Gilchrist, R.B.; Wu, L.E.; Goldys, E.M. NMN treatment reverses unique deep radiomic signature morphology of oocytes from aged mice. Res. Sq. 2021. [Google Scholar] [CrossRef]
- Furey, T.S.; Cristianini, N.; Duffy, N.; Bednarski, D.W.; Schummer, M.; Haussler, D. Support vector machine classification and validation of cancer tissue samples using microarray expression data. Bioinformatics 2000, 16, 906–914. [Google Scholar] [CrossRef] [PubMed]
- Deng, W.; McKelvey, K.J.; Guller, A.; Fayzullin, A.; Campbell, J.M.; Clement, S.; Habibalahi, A.; Wargocka, Z.; Liang, L.; Shen, C.; et al. Application of mitochondrially targeted nanoconstructs to neoadjuvant x-ray-induced photodynamic therapy for rectal cancer. ACS Cent. Sci. 2020, 6, 715–726. [Google Scholar] [CrossRef]
- Hanley, J.A.; McNeil, B.J. The meaning and use of the area under a receiver operating characteristic (ROC) curve. Radiology 1982, 143, 29–36. [Google Scholar] [CrossRef] [PubMed] [Green Version]
- Habibalahi, A.; Safizadeh, M.S. Pulsed eddy current and ultrasonic data fusion applied to stress measurement. Meas. Sci. Technol. 2014, 25, 055601. [Google Scholar] [CrossRef]
- Arlot, S.; Celisse, A. A survey of cross-validation procedures for model selection. Stat. Surv. 2010, 4, 40–79. [Google Scholar] [CrossRef]
- Habibalahi, A.; Moghari, M.D.; Samadian, K.; Mousavi, S.S.; Safizadeh, M.S. Improving pulse eddy current and ultrasonic testing stress measurement accuracy using neural network data fusion. IET Sci. Meas. Technol. 2015, 9, 514–521. [Google Scholar] [CrossRef]
- Di Girolamo, N.; Chui, J.; Coroneo, M.T.; Wakefield, D. Pathogenesis of pterygia: Role of cytokines, growth factors, and matrix metalloproteinases. Prog. Retin. Eye Res. 2004, 23, 195–228. [Google Scholar] [CrossRef]
- Alomar, T.S.; Nubile, M.; Lowe, J.; Dua, H.S. Corneal intraepithelial neoplasia: In vivo confocal microscopic study with histopathologic correlation. Am. J. Ophthalmol. 2011, 151, 238–247. [Google Scholar] [CrossRef]
- Gosnell, M.E.; Anwer, A.G.; Cassano, J.C.; Sue, C.M.; Goldys, E.M. Functional hyperspectral imaging captures subtle details of cell metabolism in olfactory neurosphere cells, disease-specific models of neurodegenerative disorders. Biochim. Biophys. Acta BBA Mol. Cell Res. 2016, 1863, 56–63. [Google Scholar] [CrossRef] [Green Version]
- Perez-Rico, C.; Pascual, G.; Sotomayor, S.; Asúnsolo, Á.; Cifuentes, A.; García-Honduvilla, N.; Buján, J. Elastin development-associated extracellular matrix constituents of subepithelial connective tissue in human pterygium. Investig. Ophthalmol. Vis. Sci. 2014, 55, 6309–6318. [Google Scholar] [CrossRef] [Green Version]
- Ramanujam, N. Fluorescence spectroscopy of neoplastic and non-neoplastic tissues. Neoplasia 2000, 2, 89–117. [Google Scholar] [CrossRef] [PubMed] [Green Version]
- Ng, J.; Coroneo, M.T.; Wakefield, D.; Di Girolamo, N. Ultraviolet radiation and the role of matrix metalloproteinases in the pathogenesis of ocular surface squamous neoplasia. Investig. Ophthalmol. Vis. Sci. 2008, 49, 5295–5306. [Google Scholar] [CrossRef] [PubMed] [Green Version]
- Wu, C.; Gleysteen, J.; Teraphongphom, N.T.; Li, Y.; Rosenthal, E. In-vivo optical imaging in head and neck oncology: Basic principles, clinical applications and future directions. Int. J. Oral Sci. 2018, 10, 10. [Google Scholar] [CrossRef] [PubMed] [Green Version]
- Moesta, K.T.; Ebert, B.; Handke, T.; Nolte, D.; Nowak, C.; Haensch, W.E.; Pandey, R.K.; Dougherty, T.J.; Rinneberg, H.; Schlag, P.M. Protoporphyrin IX occurs naturally in colorectal cancers and their metastases. Cancer Res. 2001, 61, 991–999. [Google Scholar] [PubMed]
- Lange, C.A.; Tisch-Rottensteiner, J.; Böhringer, D.; Martin, G.; Schwartzkopff, J.; Auw-Haedrich, C. Enhanced TKTL1 expression in malignant tumors of the ocular adnexa predicts clinical outcome. Ophthalmology 2012, 119, 1924–1929. [Google Scholar] [CrossRef] [PubMed]
- Meleppat, R.K.; Ronning, K.E.; Karlen, S.J.; Kothandath, K.K.; Burns, M.E.; Pugh, E.N.; Zawadzki, R.J. In situ morphologic and spectral characterization of retinal pigment epithelium organelles in mice using multicolor confocal fluorescence imaging. Investig. Ophthalmol. Vis. Sci. 2020, 61, 1. [Google Scholar] [CrossRef]
- Meleppat, R.K.; Ronning, K.E.; Karlen, S.J.; Burns, M.E.; Pugh, E.N.; Zawadzki, R.J. In vivo multimodal retinal imaging of disease-related pigmentary changes in retinal pigment epithelium. Sci. Rep. 2021, 11, 16252. [Google Scholar] [CrossRef]
- Etzioni, R.; Urban, N.; Ramsey, S.D.; McIntosh, M.W.; Schwartz, S.B.M.; Reid, B.J.; Radich, J.P.; Anderson, G.; Hartwell, L. The case for early detection. Nat. Rev. Cancer 2003, 3, 243–252. [Google Scholar] [CrossRef]
- Jabs, D.A.; Brezin, A.P.; Levinson, R.D.; McCluskey, P.; Oden, N.; Palestine, A.G.; Read, R.W.; Thorne, J.E.; Trusko, B.E.; Vitale, A.; et al. Classification criteria for multifocal choroiditis with panuveitis. Am. J. Ophthalmol. 2021, 228, 152–158. [Google Scholar]
- Backes, Y.; de Vos tot Nederveen Cappel, W.H.; van Bergeijk, J.; ter Borg, F.; Schwartz, M.P.; Spanier, B.W.M.; Geesing, J.M.J.; Kessels, K.; Kerkhof, M.; Groen, J.N.; et al. Risk for incomplete resection after macroscopic radical endoscopic resection of T1 colorectal cancer: A multicenter cohort study. Off. J. Am. Coll. Gastroenterol. ACG 2017, 112, 785–796. [Google Scholar] [CrossRef]
- Gichuhi, S.; Macharia, E.; Kabiru, J.; Zindamoyen, A.M.; Rono, H.; Ollando, E.; Wachira, J.; Munene, R.; Maina, J.; Onyuma, T.; et al. Topical fluorouracil after surgery for ocular surface squamous neoplasia in Kenya: A randomised, double-blind, placebo-controlled trial. Lancet Glob. Health 2016, 4, e378–e385. [Google Scholar] [CrossRef] [Green Version]
- Karp, C.L.; Galor, A.; Chhabra, S.; Barnes, S.D.; Alfonso, E.C. Subconjunctival/perilesional recombinant interferon α2b for ocular surface squamous neoplasia: A 10-year review. Ophthalmology 2010, 117, 2241–2246. [Google Scholar] [CrossRef] [PubMed]
- Krilis, M.; Tsang, H.; Coroneo, M. Treatment of conjunctival and corneal epithelial neoplasia with retinoic acid and topical interferon alfa-2b: Long-term follow-up. Ophthalmology 2012, 119, 1969–1973. [Google Scholar] [CrossRef] [PubMed]
- Gichuhi, S.; Ohnuma, S.-I.; Sagoo, M.S.; Burton, M.J. Pathophysiology of ocular surface squamous neoplasia. Exp. Eye Res. 2014, 129, 172–182. [Google Scholar] [CrossRef] [Green Version]
- Vabalas, A.; Gowen, E.; Poliakoff, E.; Casson, A.J. Machine learning algorithm validation with a limited sample size. PLoS ONE 2019, 14, e0224365. [Google Scholar] [CrossRef]
- Drukker, K.; Duewer, F.; Giger, M.L.; Malkov, S.; Flowers, C.I.; Joe, B.; Kerlikowske, K.; Drukteinis, J.S.; Li, H.; Shepherd, J.A. Mammographic quantitative image analysis and biologic image composition for breast lesion characterization and classification. Med. Phys. 2014, 41, 031915. [Google Scholar] [CrossRef] [Green Version]
- DaCosta, R.S.; Andersson, H.; Wilson, B.C. Molecular Fluorescence Excitation–Emission Matrices Relevant to Tissue Spectroscopy. Photochem. Photobiol. 2003, 78, 384–392. [Google Scholar] [CrossRef]
- Gosnell, M.E. Unlocking the Potential of Spectral Imaging for the Characterisation of Cell and Stem Cell Populations. Doctoral Dissertation, Department of Physics and Astronomy, Faculty of Science, Macquarie University, Sydney, Australia, 2014. [Google Scholar]
- Mahbub, S.B. Unsupervised Hyperspectral Unmixing Analysis for Label-free Quantitative Identification of Native Fluorophores in a Biological Sample by a Robust Dependent Component Analysis (RoDECA). Doctoral Dissertation, Department of Physics and Astronomy, Faculty of Science and Engineering, Macquarie University, Sydney, Australia, 2017. [Google Scholar]
- Pych, W. A fast algorithm for cosmic‐ray removal from single images. Publ. Astron. Soc. Pac. 2003, 116, 148. [Google Scholar]
- Vidal, M.; Amigo, J.M. Pre-processing of hyperspectral images. Essential steps before image analysis. Chemom. Intell. Lab. Syst. 2012, 117, 138–148. [Google Scholar]
- Zhang, B.; Fadili, J.M.; Starck, J.L. Wavelets, ridgelets, and curvelets for Poisson noise removal. IEEE Trans. Image Process. 2008, 17, 1093–1108. [Google Scholar]
- Lin, E.B.; Ling, Y. Image compression and denoising via nonseparable wavelet approximation. J. Comput. Appl. Math. 2003, 155, 131–152. [Google Scholar]


Publisher’s Note: MDPI stays neutral with regard to jurisdictional claims in published maps and institutional affiliations. |
© 2022 by the authors. Licensee MDPI, Basel, Switzerland. This article is an open access article distributed under the terms and conditions of the Creative Commons Attribution (CC BY) license (https://creativecommons.org/licenses/by/4.0/).
Share and Cite
Habibalahi, A.; Allende, A.; Michael, J.; Anwer, A.G.; Campbell, J.; Mahbub, S.B.; Bala, C.; Coroneo, M.T.; Goldys, E.M. Pterygium and Ocular Surface Squamous Neoplasia: Optical Biopsy Using a Novel Autofluorescence Multispectral Imaging Technique. Cancers 2022, 14, 1591. https://doi.org/10.3390/cancers14061591
Habibalahi A, Allende A, Michael J, Anwer AG, Campbell J, Mahbub SB, Bala C, Coroneo MT, Goldys EM. Pterygium and Ocular Surface Squamous Neoplasia: Optical Biopsy Using a Novel Autofluorescence Multispectral Imaging Technique. Cancers. 2022; 14(6):1591. https://doi.org/10.3390/cancers14061591
Chicago/Turabian StyleHabibalahi, Abbas, Alexandra Allende, Jesse Michael, Ayad G. Anwer, Jared Campbell, Saabah B. Mahbub, Chandra Bala, Minas T. Coroneo, and Ewa M. Goldys. 2022. "Pterygium and Ocular Surface Squamous Neoplasia: Optical Biopsy Using a Novel Autofluorescence Multispectral Imaging Technique" Cancers 14, no. 6: 1591. https://doi.org/10.3390/cancers14061591