
Evolution of RAS Mutations in Cell-Free DNA of Patients with Tissue RAS Wild-Type Metastatic Colorectal Cancer Receiving First-Line Treatment: The PERSEIDA Study

 , , , , ,
Abstract
:Simple Summary
Abstract
1. Introduction
2. Materials and Methods
Statistical Analysis
3. Results
3.1. Baseline Characteristics
3.2. Primary Endpoint
3.3. Secondary Endpoints
3.4. Exploratory Endpoints (Only Assessed in the Panitumumab Subpopulation)
4. Discussion
5. Conclusions
Supplementary Materials
Author Contributions
Funding
Institutional Review Board Statement
Informed Consent Statement
Data Availability Statement
Acknowledgments
Conflicts of Interest
References
- Bray, F.; Ferlay, J.; Soerjomataram, I.; Siegel, R.L.; Torre, L.A.; Jemal, A. Global cancer statistics 2018: GLOBOCAN estimates of incidence and mortality worldwide for 36 cancers in 185 countries. CA Cancer J. Clin. 2018, 68, 394–424. [Google Scholar] [CrossRef] [PubMed] [Green Version]
- European Commission. Colorectal Cancer Burden in EU-27. 2021. Available online: https://ecis.jrc.ec.europa.eu/pdf/Colorectal_cancer_factsheet-Mar_2021.pdf (accessed on 19 May 2022).
- Sociedad Española de Oncología Médica (SEOM). Las Cifras del Cáncer en España 2022. Available online: https://seom.org/images/LAS_CIFRAS_DEL_CANCER_EN_ESPANA_2022.pdf (accessed on 19 May 2022).
- Van Cutsem, E.; Cervantes, A.; Adam, R.; Sobrero, A.; van Krieken, J.H.; Aderka, D.; Aguilar, E.A.; Bardelli, A.; Benson, A.; Bodoky, G.; et al. ESMO consensus guidelines for the management of patients with metastatic colorectal cancer. Ann. Oncol. 2016, 27, 1386–1422. [Google Scholar] [CrossRef]
- Fernández-Medarde, A.; Santos, E. Ras in Cancer and Developmental Diseases. Genes Cancer 2011, 2, 344–358. [Google Scholar] [CrossRef] [PubMed] [Green Version]
- Douillard, J.-Y.; Oliner, K.S.; Siena, S.; Tabernero, J.; Burkes, R.; Barugel, M.; Humblet, Y.; Bodoky, G.; Cunningham, D.; Jassem, J.; et al. Panitumumab–FOLFOX4 treatment and RAS mutations in colorectal cancer. N. Engl. J. Med. 2013, 369, 1023–1034. [Google Scholar] [CrossRef] [PubMed] [Green Version]
- Van Cutsem, E.; Lenz, H.-J.; Köhne, C.-H.; Heinemann, V.; Tejpar, S.; Melezínek, I.; Beier, F.; Stroh, C.; Rougier, P.; van Krieken, J.H.; et al. Fluorouracil, leucovorin, and irinotecan plus cetuximab treatment and RAS mutations in colorectal cancer. J. Clin. Oncol. 2015, 33, 692–700. [Google Scholar] [CrossRef] [PubMed] [Green Version]
- Bokemeyer, C.; Bondarenko, I.; Hartmann, J.; de Braud, F.; Schuch, G.; Zubel, A.; Celik, I.; Schlichting, M.; Koralewski, P. Efficacy according to biomarker status of cetuximab plus FOLFOX-4 as first-line treatment for metastatic colorectal cancer: The OPUS study. Ann. Oncol. 2011, 22, 1535–1546. [Google Scholar] [CrossRef] [PubMed]
- Kyrochristos, I.D.; Roukos, D.H. Comprehensive intra-individual genomic and transcriptional heterogeneity: Evidence-based Colorectal Cancer Precision Medicine. Cancer Treat. Rev. 2019, 80, 101894. [Google Scholar] [CrossRef]
- Bi, F.; Wang, Q.; Dong, Q.; Wang, Y.; Zhang, L.; Zhang, J. Circulating tumor DNA in colorectal cancer: Opportunities and challenges. Am. J. Transl. Res. 2020, 12, 1044–1055. [Google Scholar]
- Raimondi, C.; Nicolazzo, C.; Belardinilli, F.; Loreni, F.; Gradilone, A.; Mahdavian, Y.; Gelibter, A.; Giannini, G.; Cortesi, E.; Gazzaniga, P. Transient Disappearance of RAS Mutant Clones in Plasma: A Counterintuitive Clinical Use of EGFR Inhibitors in RAS Mutant Metastatic Colorectal Cancer. Cancers 2019, 11, 42. [Google Scholar] [CrossRef] [Green Version]
- Siravegna, G.; Marsoni, S.; Siena, S.; Bardelli, A. Integrating liquid biopsies into the management of cancer. Nat. Rev. Clin. Oncol. 2017, 14, 531–548. [Google Scholar] [CrossRef]
- Normanno, N.; Abate, R.E.; Lambiase, M.; Forgione, L.; Cardone, C.; Iannaccone, A.; Sacco, A.; Rachiglio, A.; Martinelli, E.; Rizzi, D.; et al. RAS testing of liquid biopsy correlates with the outcome of metastatic colorectal cancer patients treated with first-line FOLFIRI plus cetuximab in the CAPRI-GOIM trial. Ann. Oncol. 2017, 29, 112–118. [Google Scholar] [CrossRef] [PubMed]
- Jahr, S.; Hentze, H.; Englisch, S.; Hardt, D.; Fackelmayer, F.O.; Hesch, R.D.; Knippers, R. DNA fragments in the blood plasma of cancer patients: Quantitations and evidence for their origin from apoptotic and necrotic cells. Cancer Res. 2001, 61, 1659–1665. [Google Scholar]
- Diehl, F.; Li, M.; Dressman, D.; He, Y.; Shen, D.; Szabo, S.; Diaz, L.A.; Goodman, S.N.; David, K.A.; Juhl, H.; et al. Detection and quantification of mutations in the plasma of patients with colorectal tumors. Proc. Natl. Acad. Sci. USA 2005, 102, 16368–16373. [Google Scholar] [CrossRef] [Green Version]
- Castells, A.; Puig, P.; Móra, J.; Boadas, J.; Boix, L.; Urgell, E.; Solé, M.; Capellà, G.; Lluís, F.; Fernández-Cruz, L.; et al. K-ras Mutations in DNA Extracted From the Plasma of Patients With Pancreatic Carcinoma: Diagnostic Utility and Prognostic Significance. J. Clin. Oncol. 1999, 17, 578. [Google Scholar] [CrossRef] [PubMed]
- Ryan, B.M.; Lefort, F.; McManus, R.; Daly, J.; Keeling, P.W.N.; Weir, D.G.; Kelleher, D. A prospective study of circulating mutant KRAS2 in the serum of patients with colorectal neoplasia: Strong prognostic indicator in postoperative follow up. Gut 2003, 52, 101–108. [Google Scholar] [CrossRef] [PubMed] [Green Version]
- Wang, S.; An, T.; Wang, J.; Zhao, J.; Wang, Z.; Zhuo, M.; Bai, H.; Yang, L.; Zhang, Y.; Wang, X.; et al. Potential Clinical Significance of a Plasma-Based KRAS Mutation Analysis in Patients with Advanced Non–Small Cell Lung Cancer. Clin. Cancer Res. 2010, 16, 1324–1330. [Google Scholar] [CrossRef] [PubMed] [Green Version]
- Crowley, E.; Di Nicolantonio, F.; Loupakis, F.; Bardelli, A. Liquid biopsy: Monitoring cancer-genetics in the blood. Nat. Rev. Clin. Oncol. 2013, 10, 472–484. [Google Scholar] [CrossRef]
- Li, M.; Diehl, F.; Dressman, D.; Vogelstein, B.; Kinzler, K.W. BEAMing up for detection and quantification of rare sequence variants. Nat. Methods 2006, 3, 95–97. [Google Scholar] [CrossRef]
- Diehl, F.; Li, M.; He, Y.; Kinzler, K.W.; Vogelstein, B.; Dressman, D. BEAMing: Single-molecule PCR on microparticles in water-in-oil emulsions. Nat. Methods 2006, 3, 551–559. [Google Scholar] [CrossRef]
- Diaz, L.A., Jr.; Williams, R.T.; Wu, J.; Kinde, I.; Hecht, J.R.; Berlin, J.; Allen, B.; Bozic, I.; Reiter, J.G.; Nowak, M.A.; et al. The molecular evolution of acquired resistance to targeted EGFR blockade in colorectal cancers. Nature 2012, 486, 537–540. [Google Scholar] [CrossRef] [Green Version]
- Eisenhauer, E.A.; Therasse, P.; Bogaerts, J.; Schwartz, L.H.; Sargent, D.; Ford, R.; Dancey, J.; Arbuck, S.; Gwyther, S.; Mooney, M.; et al. New response evaluation criteria in solid tumours: Revised RECIST guideline (version 1.1). Eur. J. Cancer 2009, 45, 228–247. [Google Scholar] [CrossRef] [PubMed]
- García-Foncillas, J.; Tabernero, J.; Élez, E.; Aranda, E.; Benavides, M.; Camps, C.; Jantus-Lewintre, E.; López, R.; Muinelo-Romay, L.; Montagut, C.; et al. Prospective multicenter real-world RAS mutation comparison between OncoBEAM-based liquid biopsy and tissue analysis in metastatic colorectal cancer. Br. J. Cancer 2018, 119, 1464–1470. [Google Scholar] [CrossRef] [PubMed]
- Grasselli, J.; Elez, E.; Caratù, G.; Matito, J.; Santos, C.; Macarulla, T.; Vidal, J.; Garcia, M.; Viéitez, J.; Paéz, D.; et al. Concordance of blood- and tumor-based detection of RAS mutations to guide anti-EGFR therapy in metastatic colorectal cancer. Ann. Oncol. 2017, 28, 1294–1301. [Google Scholar] [CrossRef] [PubMed]
- Schmiegel, W.; Scott, R.J.; Dooley, S.; Lewis, W.; Meldrum, C.J.; Pockney, P.; Draganic, B.; Smith, S.; Hewitt, C.; Philimore, H.; et al. Blood-based detection of RAS mutations to guide anti-EGFR therapy in colorectal cancer patients: Concordance of results from circulating tumor DNA and tissue-based RAS testing. Mol. Oncol. 2017, 11, 208–219. [Google Scholar] [CrossRef] [Green Version]
- Thomsen, C.B.; Andersen, R.F.; Lindebjerg, J.; Hansen, T.F.; Jensen, L.H.; Jakobsen, A. Plasma Dynamics of RAS/RAF Mutations in Patients with Metastatic Colorectal Cancer Receiving Chemotherapy and Anti-EGFR Treatment. Clin. Color. Cancer 2019, 18, 28–33.e3. [Google Scholar] [CrossRef]
- Kagawa, Y.; Elez, E.; García-Foncillas, J.; Bando, H.; Taniguchi, H.; Vivancos, A.; Akagi, K.; García, A.; Denda, T.; Ros, J.; et al. Combined Analysis of Concordance between Liquid and Tumor Tissue Biopsies for RAS Mutations in Colorectal Cancer with a Single Metastasis Site: The METABEAM Study. Clin. Cancer Res. 2021, 27, 2515–2522. [Google Scholar] [CrossRef]
- Wang, F.; Huang, Y.-S.; Wu, H.-X.; Wang, Z.-X.; Jin, Y.; Yao, Y.-C.; Chen, Y.-X.; Zhao, Q.; Chen, S.; He, M.-M.; et al. Genomic temporal heterogeneity of circulating tumour DNA in unresectable metastatic colorectal cancer under first-line treatment. Gut 2021, 71, 1340–1349. [Google Scholar] [CrossRef]
- Formica, V.; Lucchetti, J.; Doldo, E.; Riondino, S.; Morelli, C.; Argirò, R.; Renzi, N.; Nitti, D.; Nardecchia, A.; Dell’Aquila, E.; et al. Clinical utility of plasma KRAS, NRAS and BRAF mutational analysis with real time PCR in metastatic colorectal cancer patients-the importance of tissue/plasma discordant cases. J. Clin. Med. 2020, 10, 87. [Google Scholar] [CrossRef]
- Bando, H.; Kagawa, Y.; Kato, T.; Akagi, K.; Denda, T.; Nishina, T.; Komatsu, Y.; Oki, E.; Kudo, T.; Kumamoto, H.; et al. A multicentre, prospective study of plasma circulating tumour DNA test for detecting RAS mutation in patients with metastatic colorectal cancer. Br. J. Cancer 2019, 120, 982–986. [Google Scholar] [CrossRef]
- Hamfjord, J.; Guren, T.K.; Glimelius, B.; Sorbye, H.; Pfeiffer, P.; Dajani, O.; Lingjaerde, O.C.; Tveit, K.M.; Pallisgaard, N.; Spindler, K.G.; et al. Clinicopathological factors associated with tumour-specific mutation detection in plasma of patients with RAS-mutated or BRAF-mutated metastatic colorectal cancer. Int. J. Cancer 2021, 149, 1385–1397. [Google Scholar] [CrossRef]
- Peeters, M.; Price, T.; Boedigheimer, M.; Kim, T.W.; Ruff, P.; Gibbs, P.; Thomas, A.L.; Demonty, G.; Hool, K.; Ang, A. Evaluation of Emergent Mutations in Circulating Cell-Free DNA and Clinical Outcomes in Patients with Metastatic Colorectal Cancer Treated with Panitumumab in the ASPECCT Study. Clin. Cancer Res. 2019, 25, 1216–1225. [Google Scholar] [CrossRef] [PubMed] [Green Version]
- Siena, S.; Sartore-Bianchi, A.; Garcia-Carbonero, R.; Karthaus, M.; Smith, D.; Tabernero, J.; Van Cutsem, E.; Guan, X.; Boedigheimer, M.; Ang, A.; et al. Dynamic molecular analysis and clinical correlates of tumor evolution within a phase II trial of panitumumab-based therapy in metastatic colorectal cancer. Ann. Oncol. 2018, 29, 119–126. [Google Scholar] [CrossRef] [PubMed]
- Kim, T.W.; Peeters, M.; Thomas, A.L.; Gibbs, P.; Hool, K.; Zhang, J.; Ang, A.L.; Bach, B.A.; Price, T. Impact of Emergent Circulating Tumor DNA RAS Mutation in Panitumumab-Treated Chemoresistant Metastatic Colorectal Cancer. Clin. Cancer Res. 2018, 24, 5602–5609. [Google Scholar] [CrossRef] [Green Version]
- Parseghian, C.M.; Sun, R.; Napolitano, S.; Morris, V.K.; Henry, J.; Willis, J.; Sanchez, E.V.; Raghav, K.P.S.; Ang, A.; Kopetz, S. Rarity of acquired mutations (MTs) after first-line therapy with anti-EGFR therapy (EGFRi). J. Clin. Oncol. 2021, 39, 3514. [Google Scholar] [CrossRef]
- Misale, S.; Di Nicolantonio, F.; Sartore-Bianchi, A.; Siena, S.; Bardelli, A. Resistance to Anti-EGFR Therapy in Colorectal Cancer: From Heterogeneity to Convergent Evolution. Cancer Discov. 2014, 4, 1269–1280. [Google Scholar] [CrossRef] [Green Version]
- Maurel, J.; Alonso, V.; Escudero, P.; Fernández-Martos, C.; Salud, A.; Méndez, M.; Gallego, J.; Rodriguez, J.R.; Martín-Richard, M.; Fernández-Plana, J.; et al. Clinical Impact of Circulating Tumor RAS and BRAF Mutation Dynamics in Patients with Metastatic Colorectal Cancer Treated with First-Line Chemotherapy Plus Anti–Epidermal Growth Factor Receptor Therapy. JCO Precis. Oncol. 2019, 18, 1–16. [Google Scholar] [CrossRef]
- Morano, F.; Corallo, S.; Lonardi, S.; Raimondi, A.; Cremolini, C.; Rimassa, L.; Murialdo, R.; Zaniboni, A.; Sartore-Bianchi, A.; Tomasello, G.; et al. Negative Hyperselection of Patients with RAS and BRAF Wild-Type Metastatic Colorectal Cancer Who Received Panitumumab-Based Maintenance Therapy. J. Clin. Oncol. 2019, 37, 3099–3110. [Google Scholar] [CrossRef]
- Arnold, D.; Lueza, B.; Douillard, J.-Y.; Peeters, M.; Lenz, H.-J.; Venook, A.; Heinemann, V.; Van Cutsem, E.; Pignon, J.-P.; Tabernero, J.; et al. Prognostic and predictive value of primary tumour side in patients with RAS wild-type metastatic colorectal cancer treated with chemotherapy and EGFR directed antibodies in six randomized trials. Ann. Oncol. 2017, 28, 1713–1729. [Google Scholar] [CrossRef]
- Holch, J.W.; Ricard, I.; Stintzing, S.; Modest, D.P.; Heinemann, V. The relevance of primary tumour location in patients with metastatic colorectal cancer: A meta-analysis of first-line clinical trials. Eur. J. Cancer 2017, 70, 87–98. [Google Scholar] [CrossRef]
- Parseghian, C.M.; Napolitano, S.; Loree, J.M.; Kopetz, S. Mechanisms of Innate and Acquired Resistance to Anti-EGFR Therapy: A Review of Current Knowledge with a Focus on Rechallenge Therapies. Clin. Cancer Res. 2019, 25, 6899–6908. [Google Scholar] [CrossRef]
- Callesen, L.B.; Hamfjord, J.; Boysen, A.K.; Pallisgaard, N.; Guren, T.K.; Kure, E.H.; Spindler, K.-L.G. Circulating tumour DNA and its clinical utility in predicting treatment response or survival in patients with metastatic colorectal cancer: A systematic review and meta-analysis. Br. J. Cancer 2022, 127, 500–513. [Google Scholar] [CrossRef] [PubMed]


| Panitumumab Subpopulation 1 (n = 102) | Evaluable Population (n = 119) | |
|---|---|---|
| Male, n (%) | 63 (61.8) | 73 (61.3) |
| Age (years), mean (SD) | 62.2 (10.6) | 62.3 (10.6) |
| BMI (Kg/m2), mean (SD) | 26.0 (4.0) | 25.8 (4.3) |
| ECOG performance status, n (%) | ||
| 0 | 48 (47.1) | 56 (47.1) |
| 1 | 50 (49.0) | 59 (49.6) |
| 2 | 1 (1.0) | 1 (0.84) |
| Not available | 3 (2.9) | 3 (2.5) |
| Köhne prognostic score, n (%) | ||
| Low risk | 44 (43.1) | 50 (42.0) |
| Medium risk | 45 (44.1) | 55 (46.2) |
| High risk | 9 (8.8) | 10 (8.4) |
| Not available | 4 (3.9) | 4 (3.4) |
| Time (months) since histological diagnosis, mean (SD) | 6.0 (10.4) | 6.2 (11.1) |
| Primary tumor location, n (%) | ||
| Left colon | 82 (80.4) | 95 (79.8) |
| Right colon | 20 (19.6) | 24 (20.2) |
| Previous surgeries for colorectal cancer, n (%) | 37 (36.3) | 45 (37.8) |
| Prior treatment for colorectal cancer, n (%) | 17 (16.7) | 20 (16.8) |
| Radiotherapy | 1 (1.0) | 1 (0.8) |
| Chemotherapy | 11 (10.8) | 12 (10.1) |
| Radiotherapy and chemotherapy | 5 (4.9) | 7 (5.9) |
| No prior treatment | 84 (82.4) | 98 (82.4) |
| Affected organs, n (%) | ||
| Liver | 68 (66.7) | 60 (67.2) |
| Lung | 39 (38.2) | 42 (35.3) |
| Basal ganglia | 28 (27.5) | 35 (29.4) |
| Peritoneum | 18 (17.7) | 22 (18.5) |
| Adrenal | 8 (7.8) | 8 (6.7) |
| Bone | 4 (3.9) | 4 (3.4) |
| Other | 20 (19.6) | 26 (21.9) |
| Sum of diameters of target lesions (mm), mean (SD) | 89.9 (75.1) | 88.1 (71.8) |
| Serum carcinoembryonic antigen (ng/mL), median (Q1, Q3) | 38.6 (7.6, 176.5) | 33.8 (6.8, 170.8) |
| Lactate dehydrogenase, ULN, median (Q1, Q3) | 326.5 (211.0, 498.0) | 312.0 (207.0, 478.0) |
| Time (months) since RAS wild-type determination by solid biopsy, mean (SD) | 1.03 (3.29) | 1.17 (3.47) |
| Solid biopsy extraction localization, n (%) | ||
| Primary | 88 (86.3) | 104 (87.4) |
| Metastasis | 14 (13.7) | 15 (12.6) |
| Panitumumab Subpopulation 1 (n = 102) | Evaluable Population 1 (n = 119) | |||||
|---|---|---|---|---|---|---|
| MAF ≥ 1% | MAF ≥ 0.1% | MAF ≥ 0.02% | MAF ≥ 1% | MAF ≥ 0.1% | MAF ≥ 0.02% | |
| At baseline | ||||||
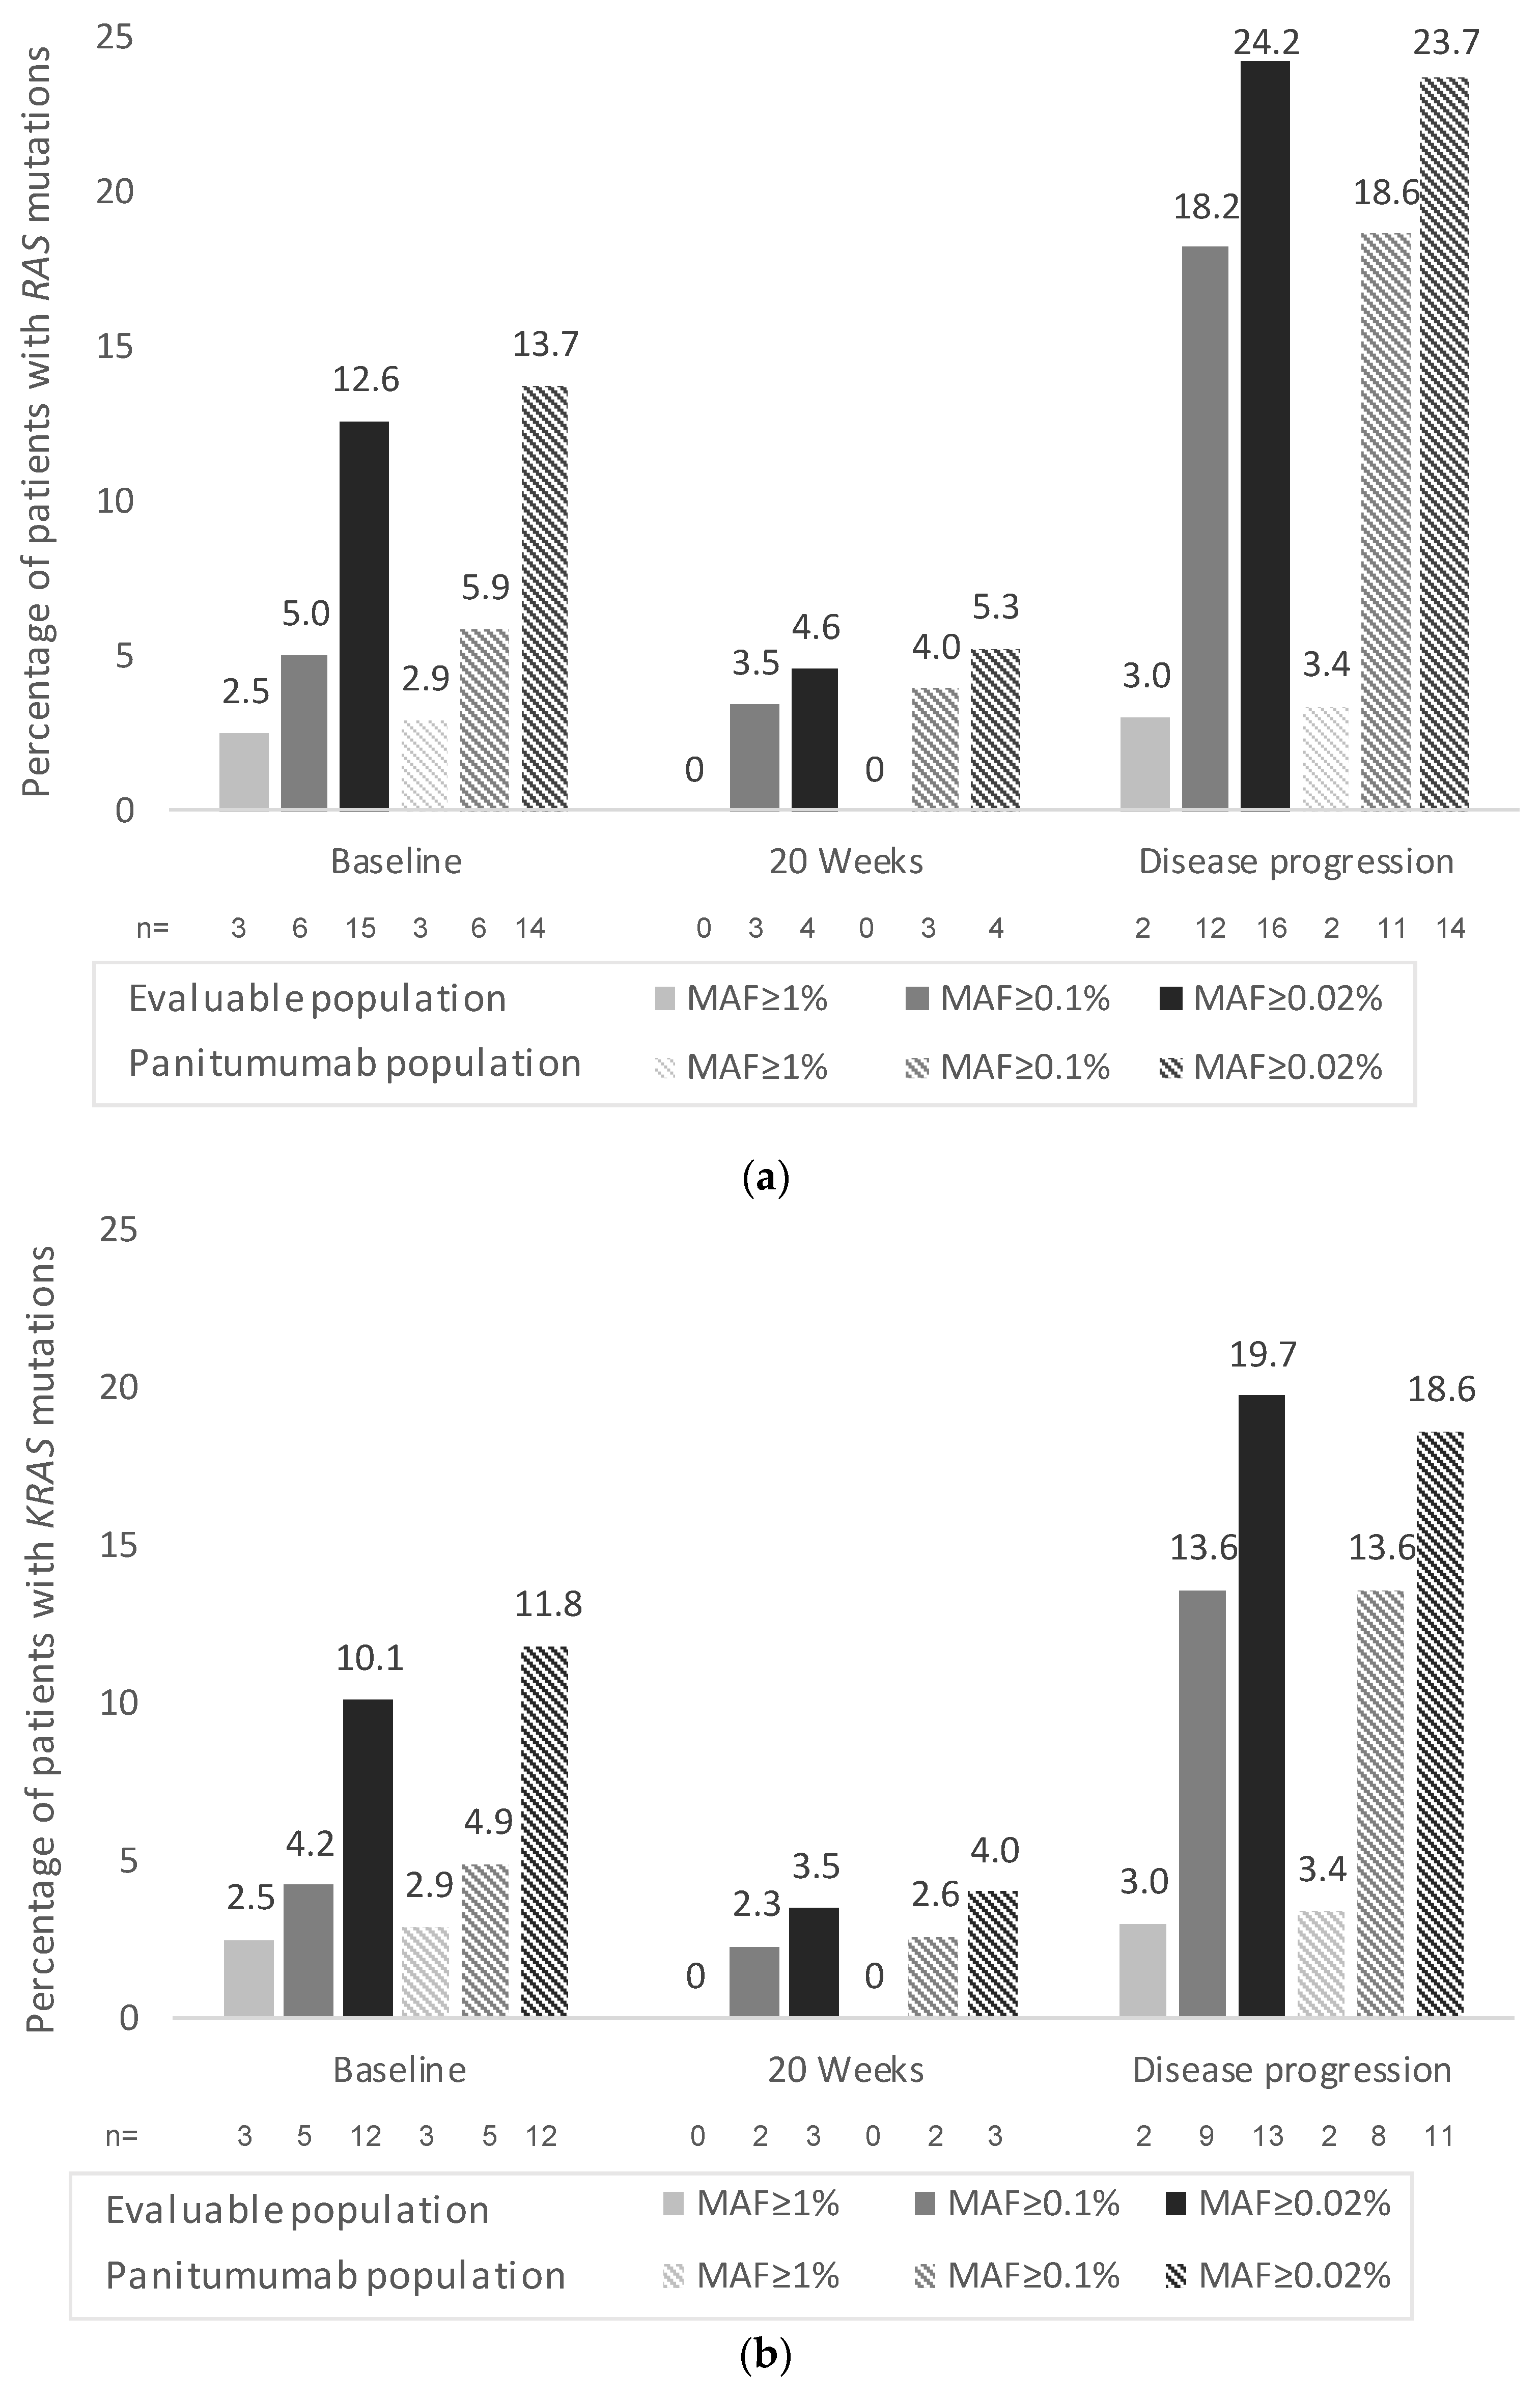
| RAS mutant detection rate, % (95% CI) 2 | 2.9 (0.6–8.4) | 5.9 (2.2–12.4) | 13.7 (7.7–22.0) | 2.5 (0.5–7.2) | 5.0 (1.9–10.7) | 12.6 (7.2–19.9) |
| Negative percent agreement (RAS), % (95% CI) 3 | 97.1 (91.6–99.4) | 94.1 (87.6–97.8) | 86.3 (78.0–92.3) | 97.5 (92.8–99.5) | 95.0 (89.4–98.1) | 87.4 (80.1–92.8) |
| At disease progression | ||||||
| Patients that converted to RAS mutant at progression, n (%) 4 | 1 (1.0) | 9 (8.8) | 9 (8.8) | 1 (0.8) | 10 (8.4) | 11 (9.2) |
| Conversion rate, % (95% CI) 5 | 1.7 (0.04–9.2) | 15.8 (7.5–27.9) | 17.7 (8.4–30.9) | 1.5 (0.04–8.3) | 15.6 (7.8–26.9) | 19.0 (9.9–31.4) |
| RAS Wild-Type | RAS Mutant | Odds Ratio (95% CI) | ||
|---|---|---|---|---|
| At baseline | ||||
| Total population (n = 93) | ||||
| MAF ≥ 1% | ORR 1, % (95% CI) | 76.7% (66.6–84.9%) | 33.3% (0.8–90.6%) | 6.6 (0.6–76.1) |
| n/N 2 | 69/90 | 1/3 | ||
| MAF ≥ 0.1% | ORR 1, % (95% CI) | 76.1% (65.9–84.6%) | 60.0% (14.7–94.7%) | 2.1 (0.3–13.6) |
| n/N 2 | 67/88 | 3/5 | ||
| MAF ≥ 0.02% | ORR 1, % (95% CI) | 77.5% (66.8–86.1%) | 61.5% (31.6–86.1%) | 2.2 (0.6–7.4) |
| n/N 2 | 62/80 | 8/13 | ||
| Left-sided tumors (n = 73) | ||||
| MAF ≥ 1% | ORR 1, % (95% CI) | 80.0% (68.7–88.6%) | 33.3% (0.8–90.6%) | 8.0 (0.7–94.7) |
| n/N 2 | 56/70 | 1/3 | ||
| MAF ≥ 0.1% | ORR 1, % (95% CI) | 79.4% (67.9–88.3%) | 60.0% (14.7–94.7%) | 2.6 (0.4–16.9) |
| n/N 2 | 54/68 | 3/5 | ||
| MAF ≥ 0.02% | ORR 1, % (95% CI) | 81.7% (69.6–90.5%) | 61.5% (31.6–86.1%) | 2.8 (0.8–10.2) |
| n/N 2 | 49/60 | 8/13 | ||
| Right-sided tumors (n = 20) | ||||
| MAF ≥ 1% | ORR 1, % (95% CI) | 65.0% (40.8–84.6%) | 0% | - |
| n/N 2 | 13/20 | 0/0 | ||
| MAF ≥ 0.1% | ORR 1, % (95% CI) | 65.0% (40.8–84.6%) | 0% | - |
| n/N 2 | 13/20 | 0/0 | ||
| MAF ≥ 0.02% | ORR 1, % (95% CI) | 65.0% (40.8–84.6%) | 0% | - |
| n/N 2 | 13/20 | 0/0 | ||
| At any time | ||||
| Total population (n = 93) | ||||
| MAF ≥ 1% | ORR 1, % (95% CI) | 76.4% (66.2–84.8%) | 50.0% (6.8–93.2%) | 3.2 (0.4–24.4) |
| n/N 2 | 68/89 | 2/4 | ||
| MAF ≥ 0.1% | ORR 1, % (95% CI) | 74.7% (63.6–83.8%) | 78.6% (49.2–95.3%) | 0.8 (0.2–3.2) |
| n/N 2 | 59/79 | 11/14 | ||
| MAF ≥ 0.02% | ORR 1, % (95% CI) | 74.7% (62.9–84.2%) | 77.3% (54.6–92.2%) | 0.9 (0.3–2.7) |
| n/N 2 | 53/71 | 17/22 | ||
| Left-sided tumors (n = 73) | ||||
| MAF ≥ 1% | ORR 1, % (95% CI) | 79.7% (68.3–88.4%) | 50.0% (6.8–93.2%) | 3.9 (0.5–30.4) |
| n/N 2 | 55/69 | 2/4 | ||
| MAF ≥ 0.1% | ORR 1, % (95% CI) | 78.3% (65.8–87.9%) | 76.9% (46.2–95.0%) | 1.1 (0.3–4.5) |
| n/N 2 | 47/60 | 10/13 | ||
| MAF ≥ 0.02% | ORR 1, % (95% CI) | 79.6% (65.9–89.2%) | 75.0% (50.9–91.3%) | 1.3 (0.4–4.3) |
| n/N 2 | 42/53 | 15/20 | ||
| Right-sided tumors (n = 20) | ||||
| MAF ≥ 1% | ORR 1, % (95% CI) | 65.0% (40.8–84.6%) | 0% | - |
| n/N 2 | 13/20 | 0/0 | ||
| MAF ≥ 0.1% | ORR 1, % (95% CI) | 63.2% (38.4–83.7%) | 100% (2.5–100%) | - |
| n/N 2 | 12/19 | 1/1 | ||
| MAF ≥ 0.02% | ORR 1, % (95% CI) | 61.1% (35.8–82.7%) | 100% (15.8–100%) | - |
| n/N 2 | 11/18 | 2/2 | ||
Publisher’s Note: MDPI stays neutral with regard to jurisdictional claims in published maps and institutional affiliations. |
© 2022 by the authors. Licensee MDPI, Basel, Switzerland. This article is an open access article distributed under the terms and conditions of the Creative Commons Attribution (CC BY) license (https://creativecommons.org/licenses/by/4.0/).
Share and Cite
Valladares-Ayerbes, M.; Garcia-Alfonso, P.; Muñoz Luengo, J.; Pimentel Caceres, P.P.; Castillo Trujillo, O.A.; Vidal-Tocino, R.; Llanos, M.; Llorente Ayala, B.; Limon Miron, M.L.; Salud, A.; et al. Evolution of RAS Mutations in Cell-Free DNA of Patients with Tissue RAS Wild-Type Metastatic Colorectal Cancer Receiving First-Line Treatment: The PERSEIDA Study. Cancers 2022, 14, 6075. https://doi.org/10.3390/cancers14246075
Valladares-Ayerbes M, Garcia-Alfonso P, Muñoz Luengo J, Pimentel Caceres PP, Castillo Trujillo OA, Vidal-Tocino R, Llanos M, Llorente Ayala B, Limon Miron ML, Salud A, et al. Evolution of RAS Mutations in Cell-Free DNA of Patients with Tissue RAS Wild-Type Metastatic Colorectal Cancer Receiving First-Line Treatment: The PERSEIDA Study. Cancers. 2022; 14(24):6075. https://doi.org/10.3390/cancers14246075
Chicago/Turabian StyleValladares-Ayerbes, Manuel, Pilar Garcia-Alfonso, Jorge Muñoz Luengo, Paola Patricia Pimentel Caceres, Oscar Alfredo Castillo Trujillo, Rosario Vidal-Tocino, Marta Llanos, Beatriz Llorente Ayala, Maria Luisa Limon Miron, Antonieta Salud, and et al. 2022. "Evolution of RAS Mutations in Cell-Free DNA of Patients with Tissue RAS Wild-Type Metastatic Colorectal Cancer Receiving First-Line Treatment: The PERSEIDA Study" Cancers 14, no. 24: 6075. https://doi.org/10.3390/cancers14246075