
Role of Artificial Intelligence in Radiogenomics for Cancers in the Era of Precision Medicine

 , , ,
, , ,  ,
,
Abstract
:Simple Summary
Abstract
1. Introduction
2. Search Strategy and Statistics of Radiogenomics Studies
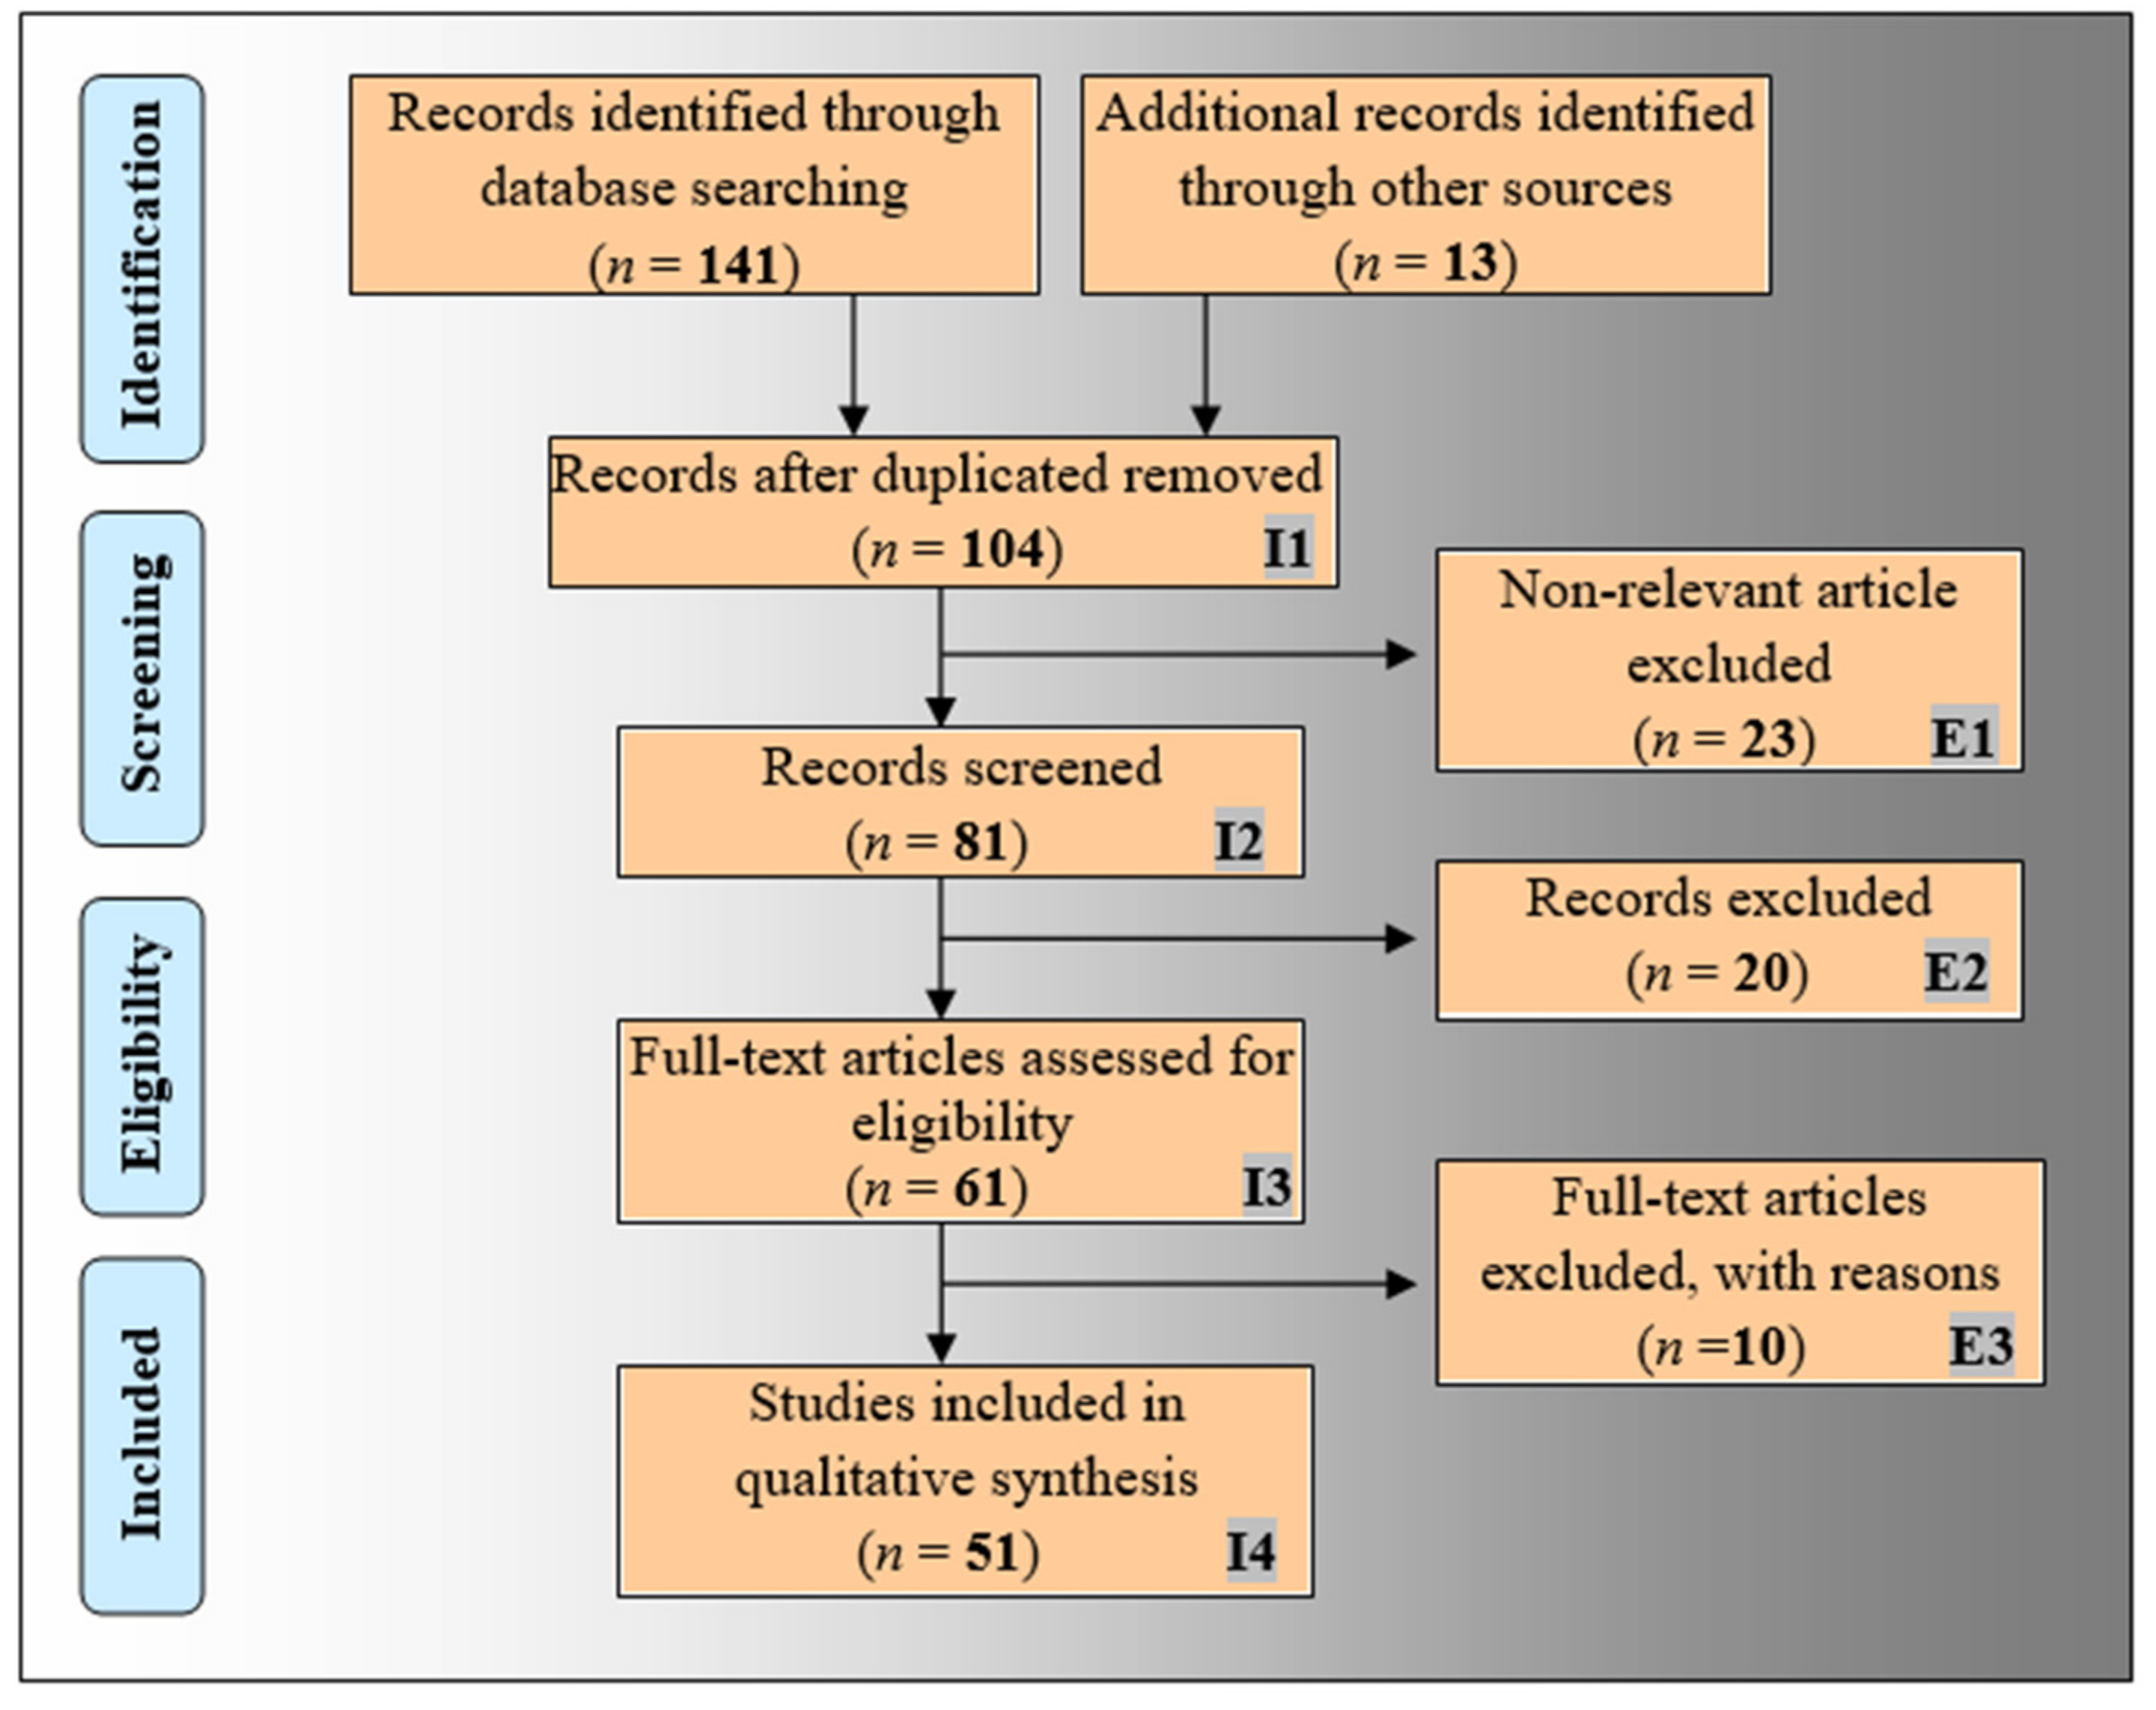
2.1. The PRISMA Model
2.2. Statistical Distributions of AI Attributes of Radiogenomics Studies
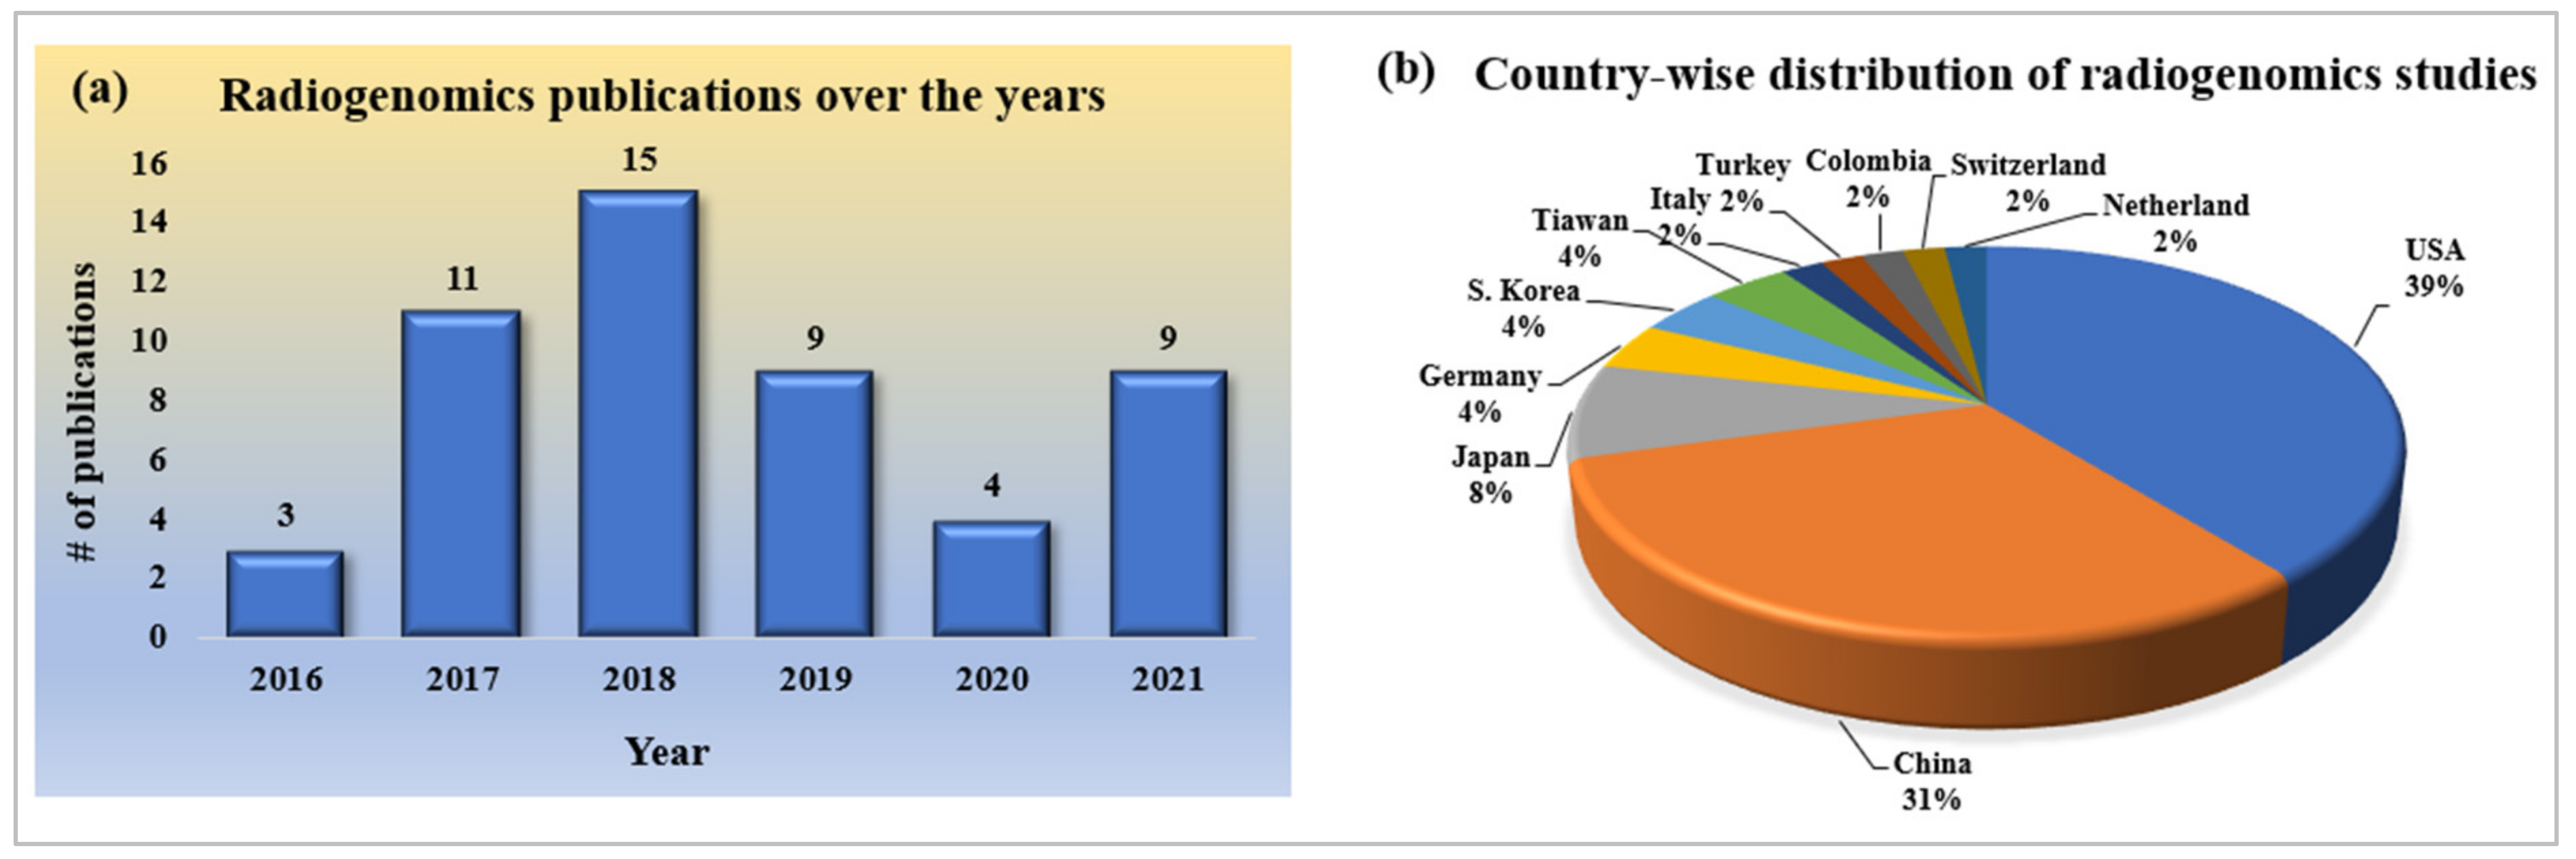
2.2.1. Statistical Distribution of Publication Trends of Radiogenomics Using AI
2.2.2. Statistical Distribution of Country-Wise Study of Radiogenomics Using AI
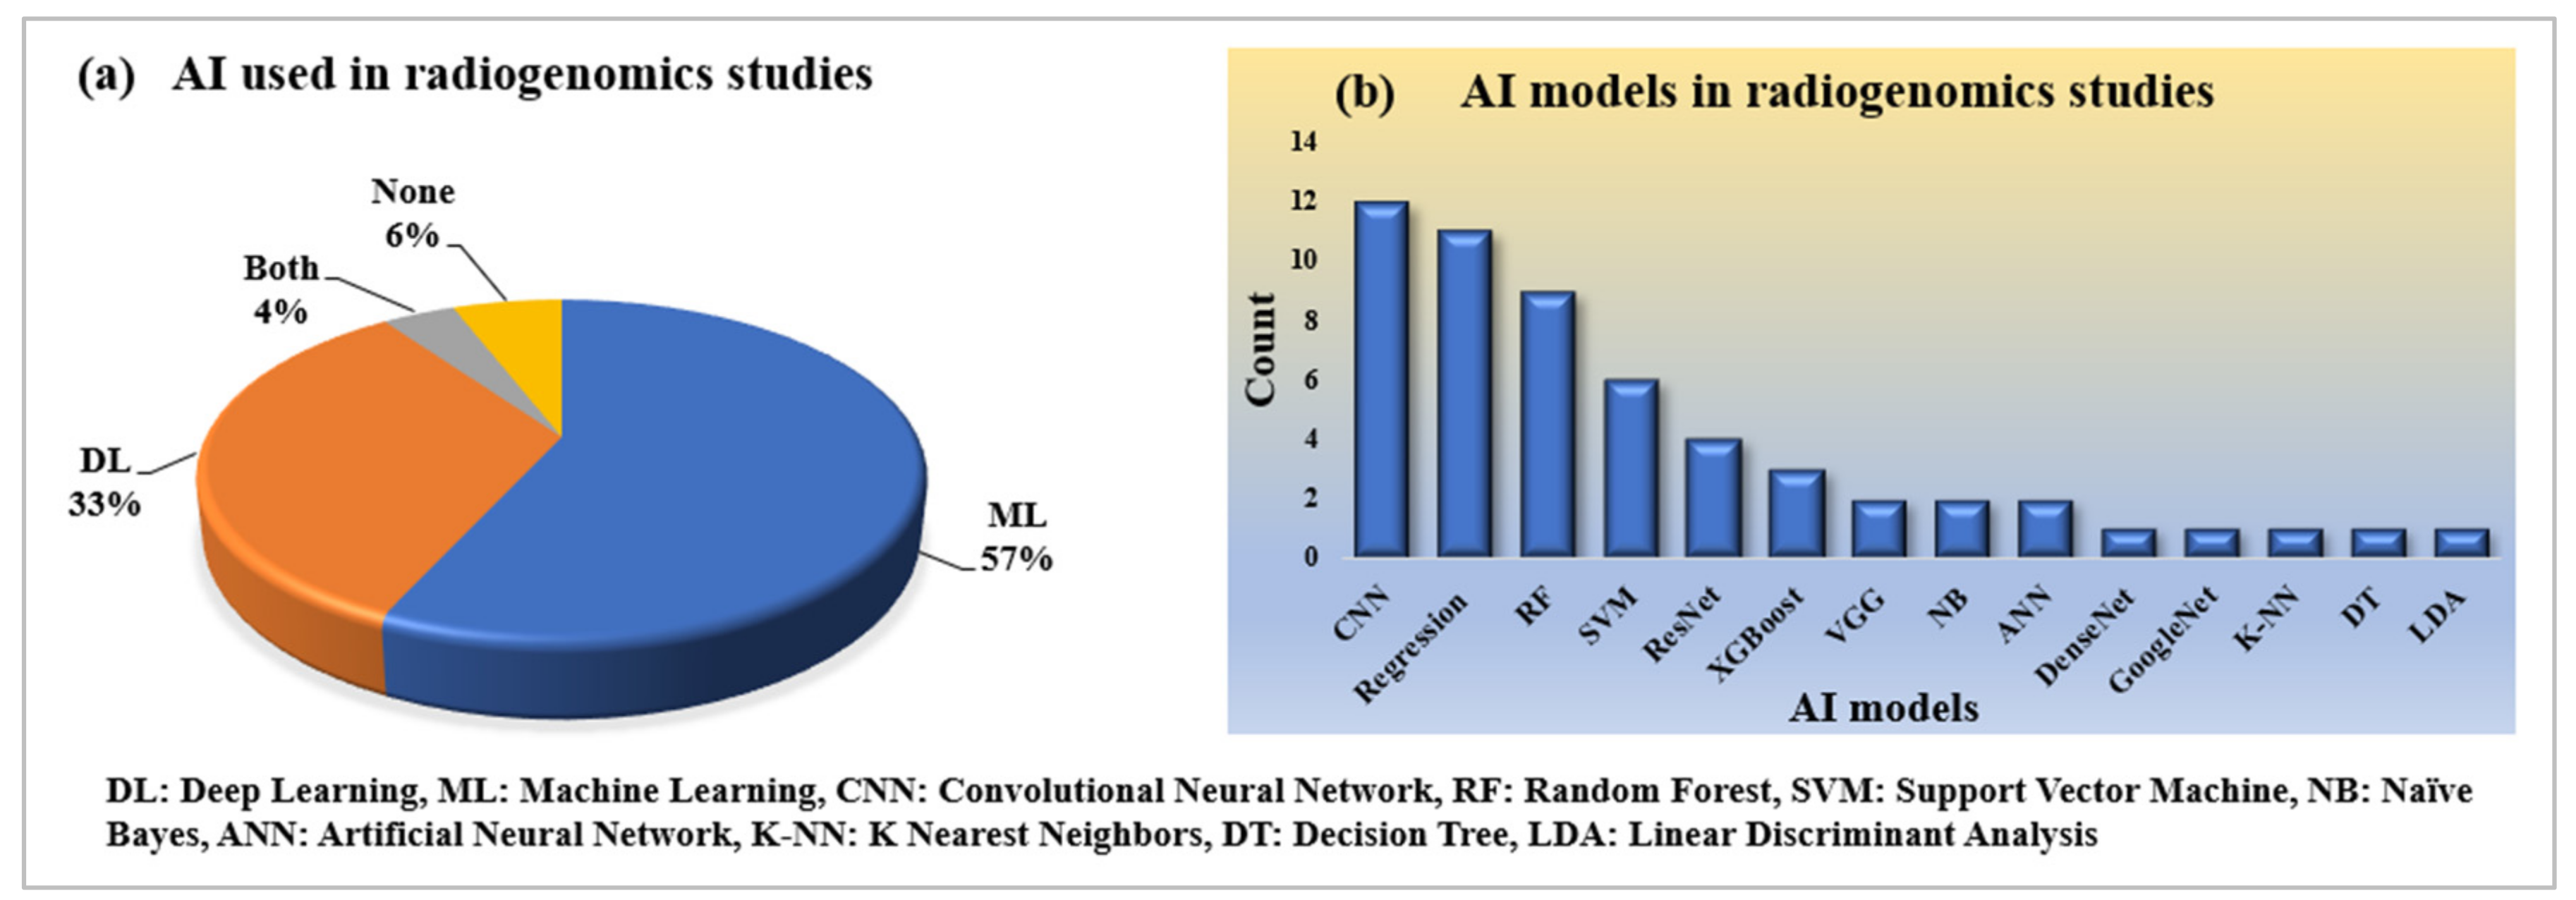
2.2.3. Statistical Distribution of AI and Its Model Used in Radiogenomics Studies
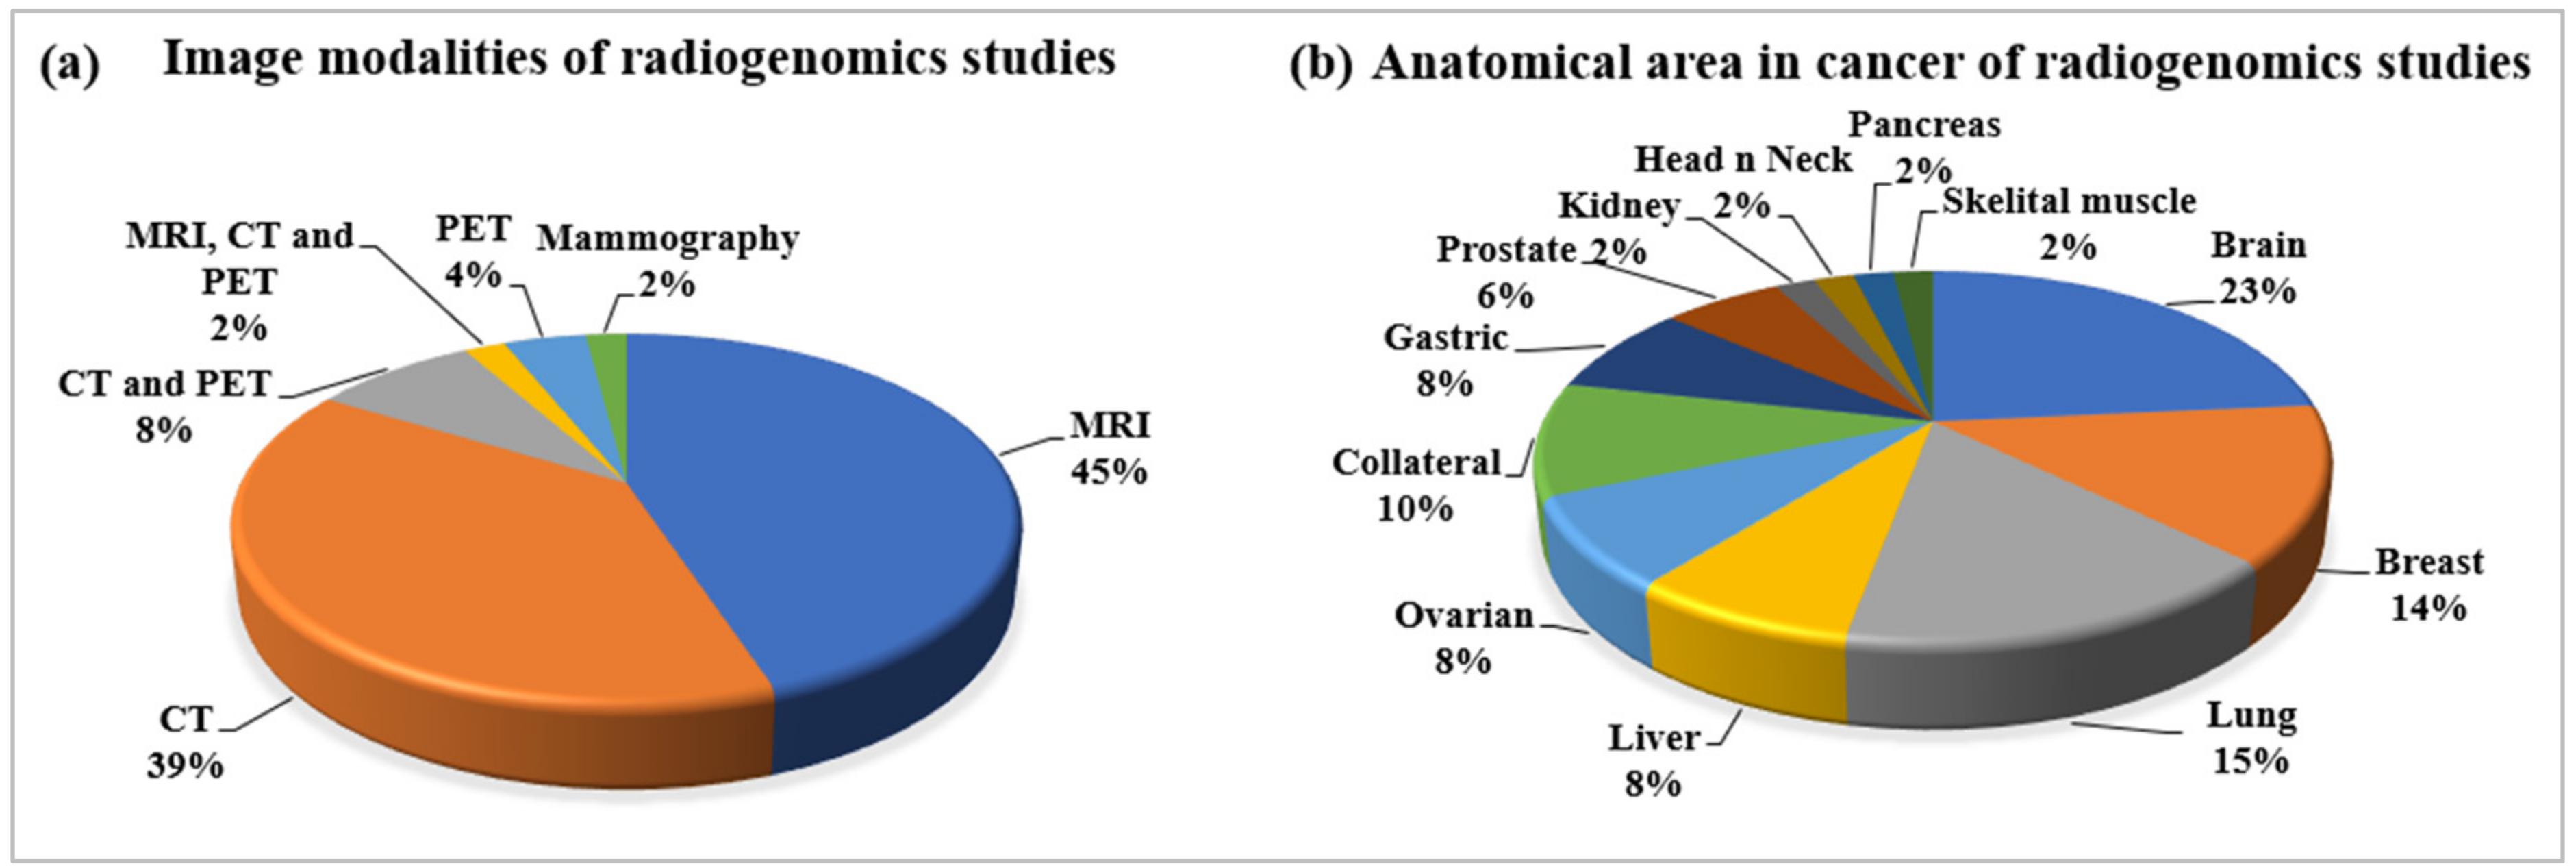
2.2.4. Statistical Distribution of Image Modalities Used in Radiogenomics
2.2.5. Statistical Distribution of Anatomical Area of Cancer in Radiogenomics
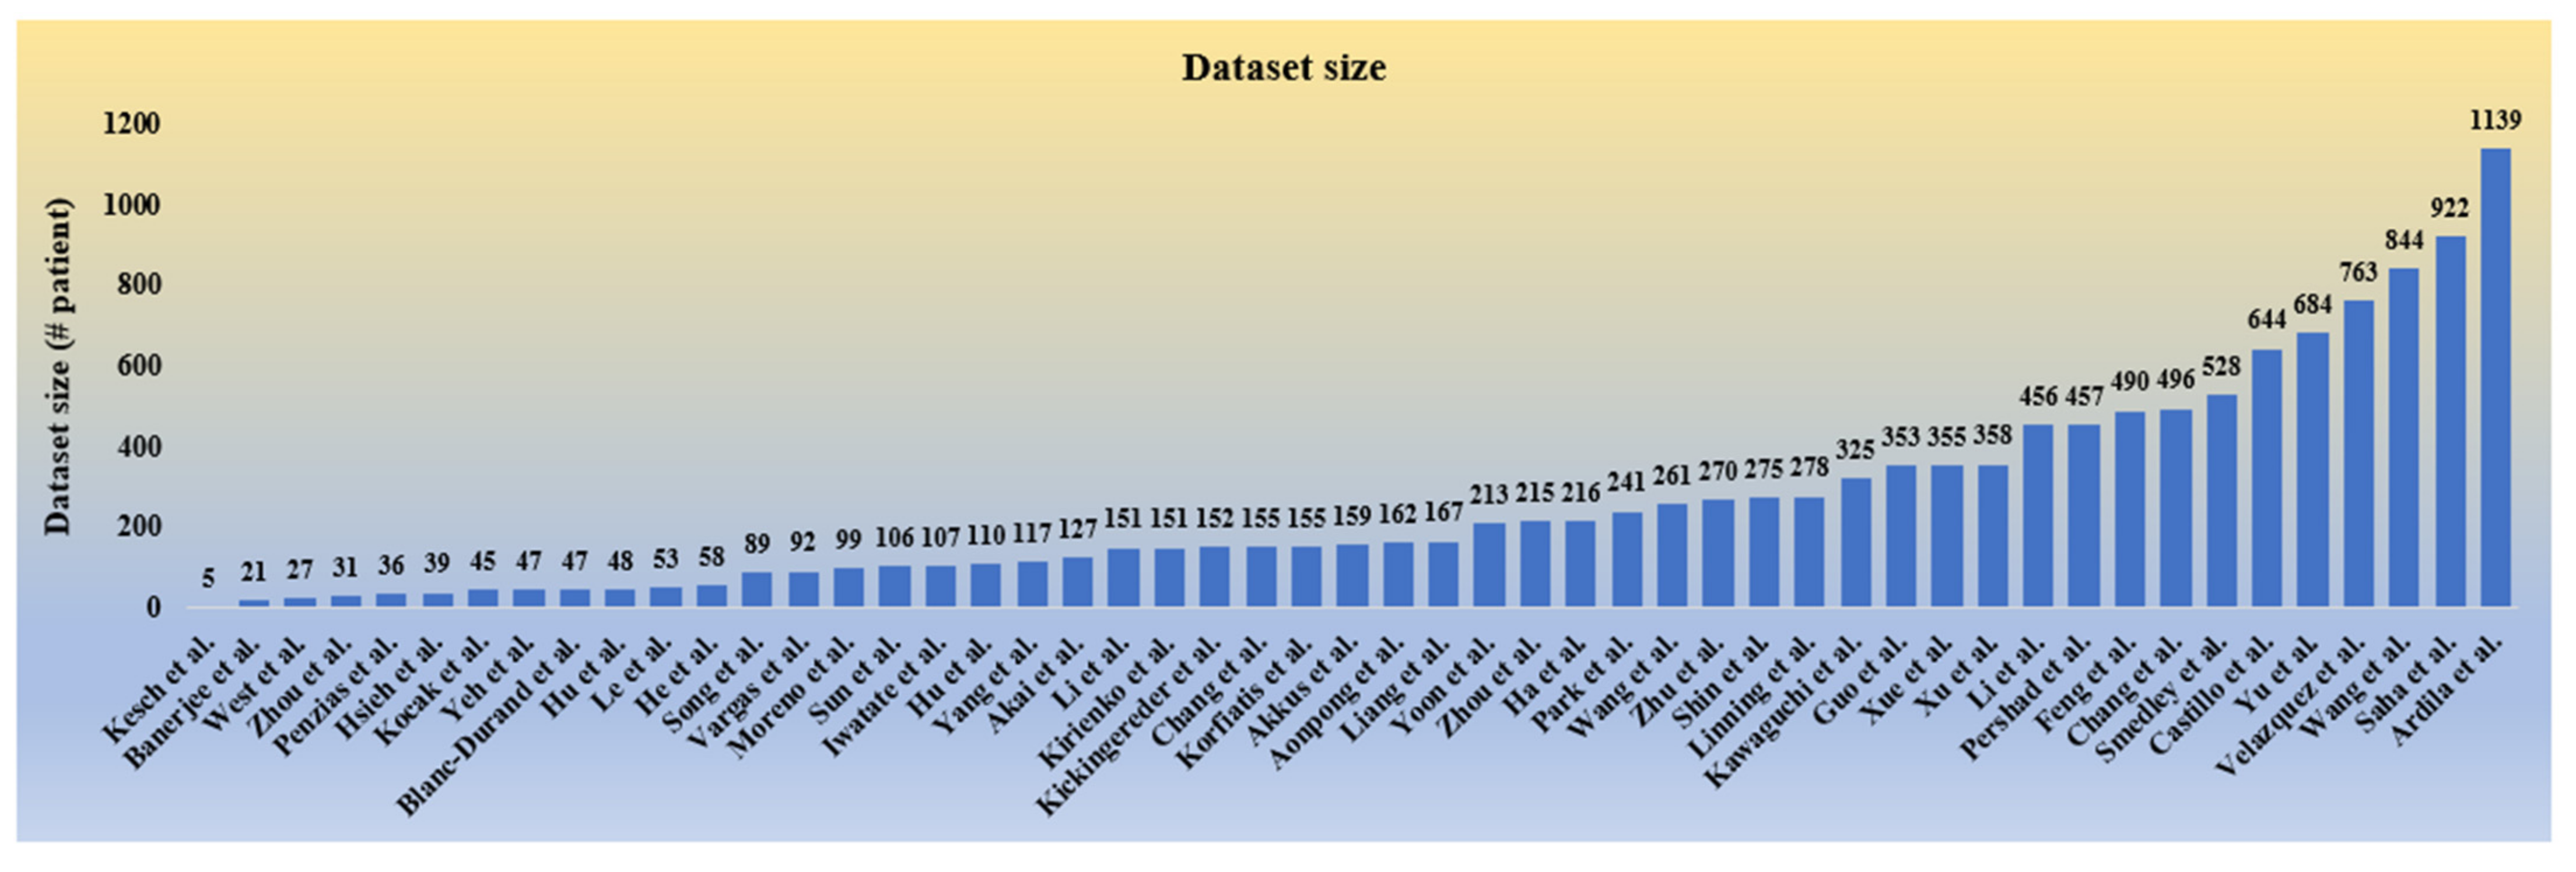
2.2.6. Statistical Distribution of Dataset Used in Radiogenomics
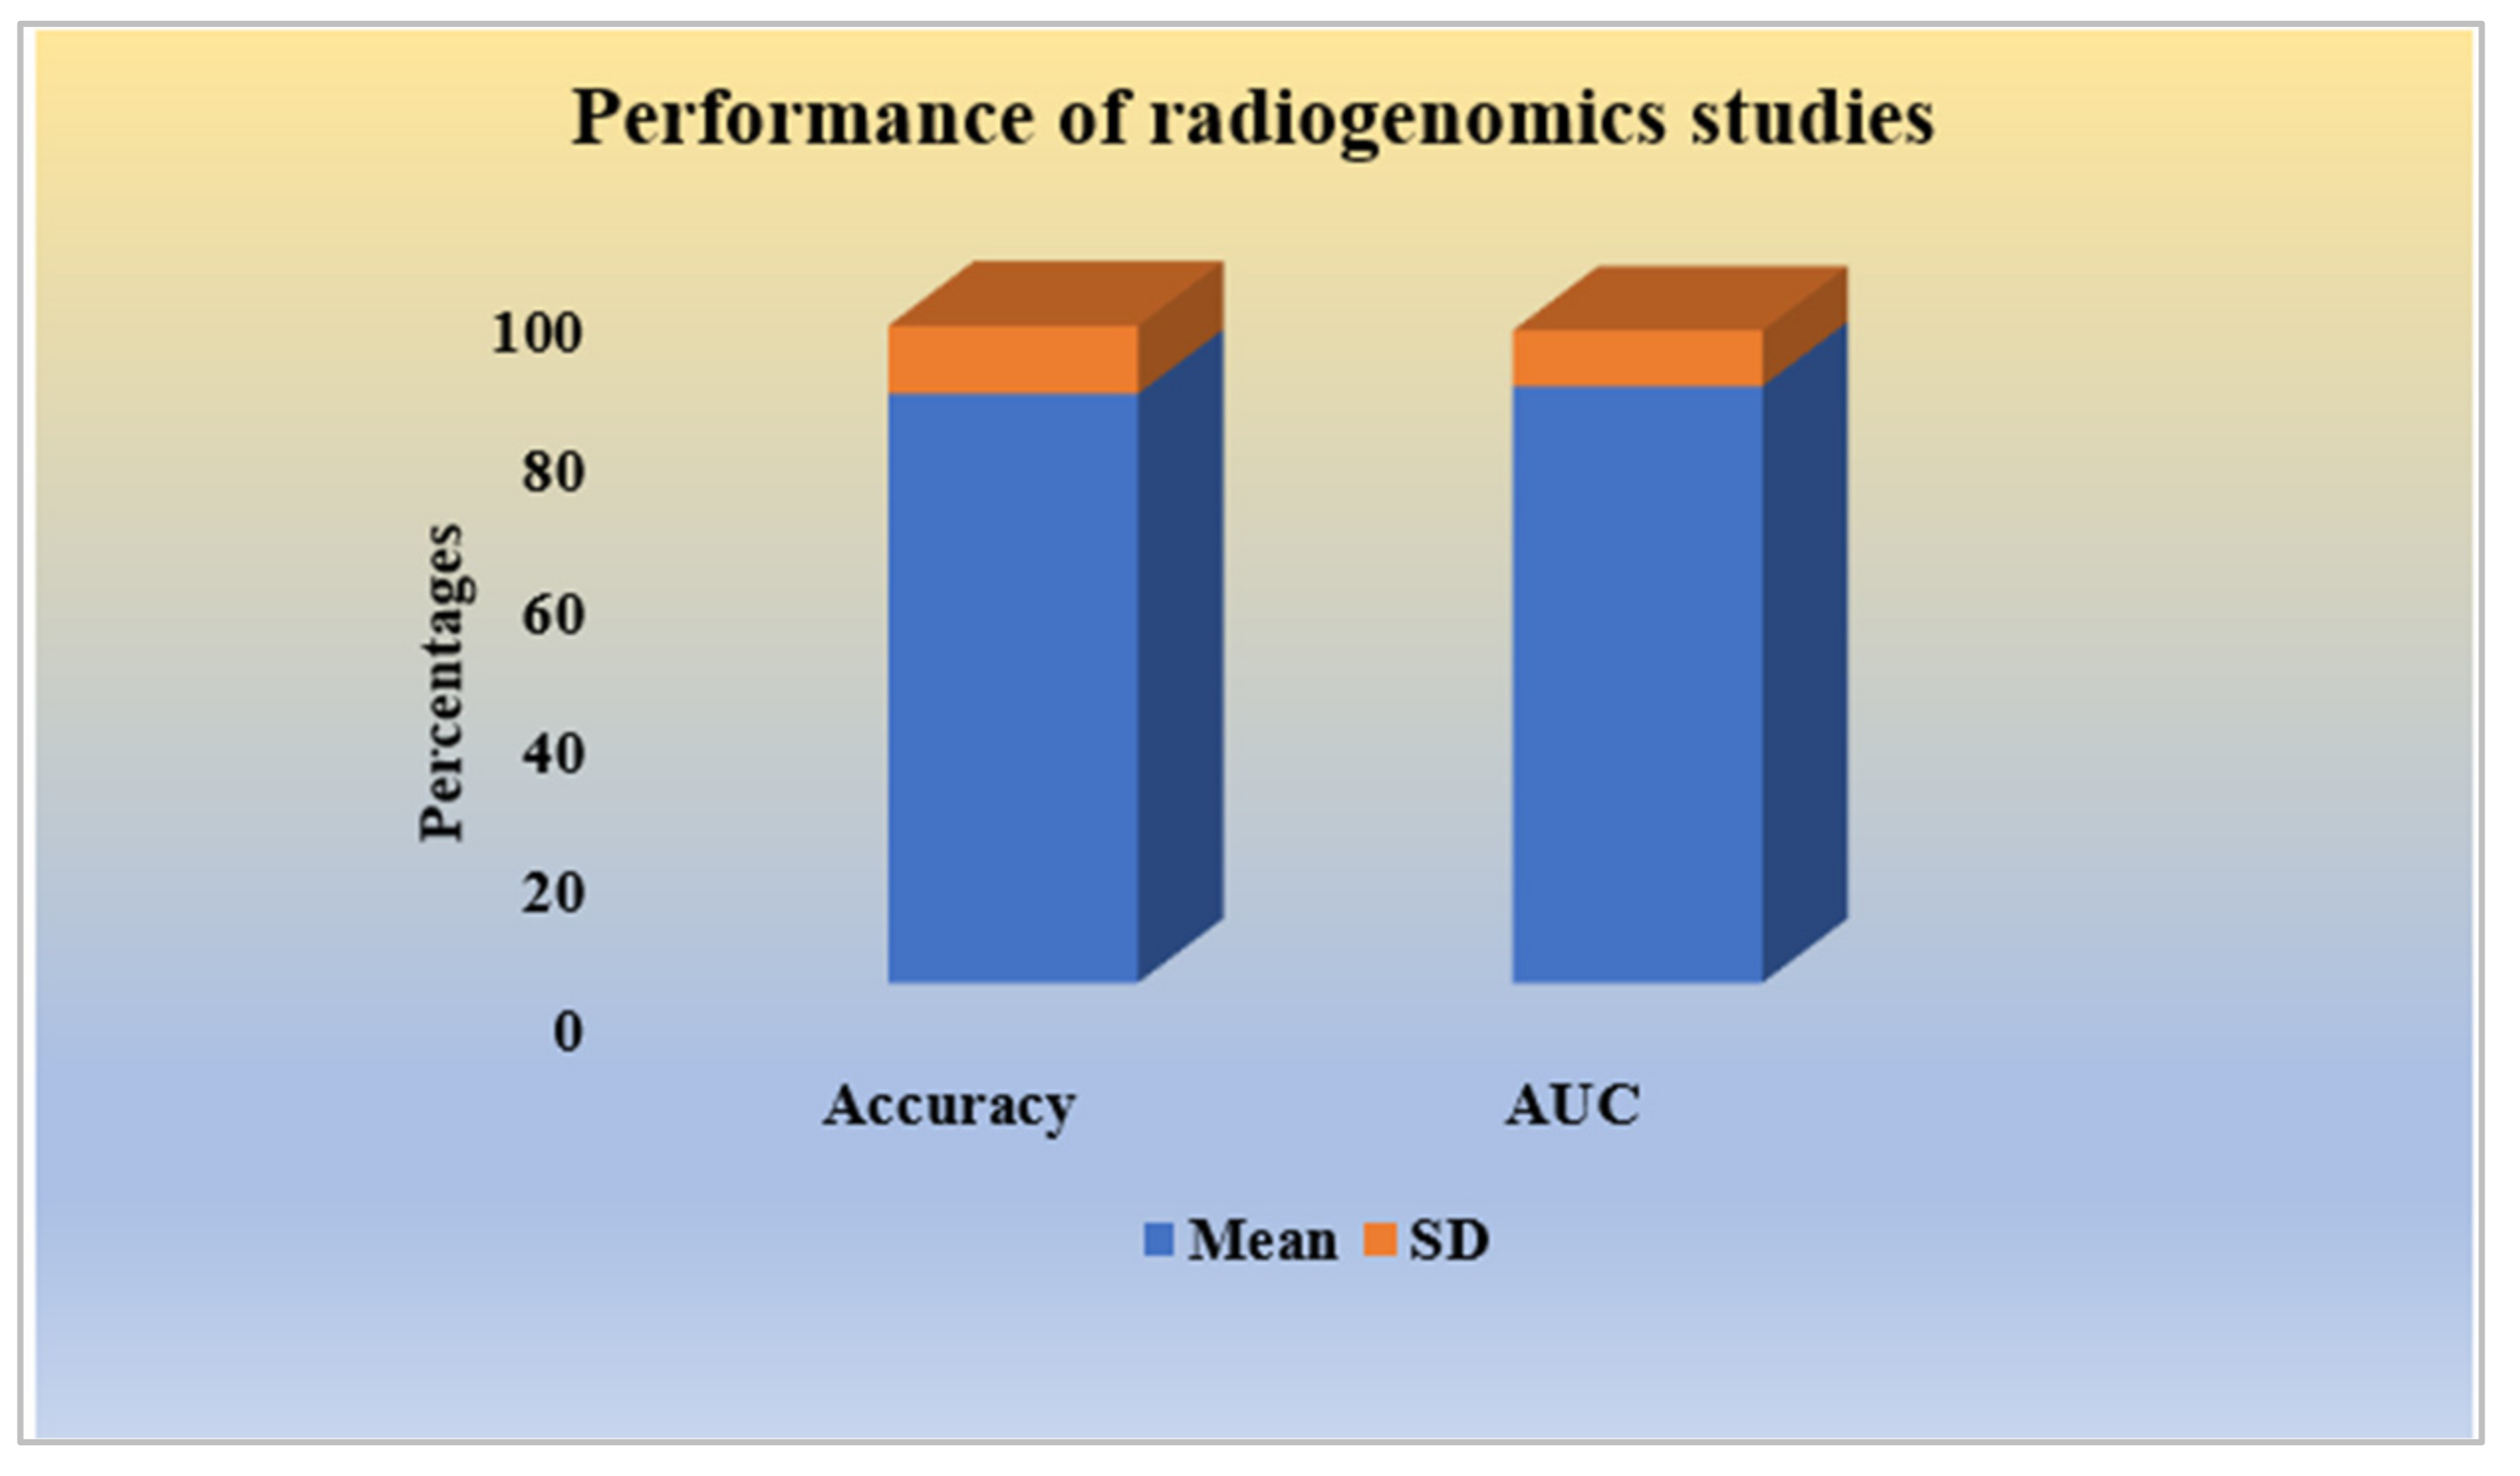
2.2.7. Performance Analysis of Radiogenomics Studies
3. An Insight of Radiogenomics
3.1. Conventional and Deep Radiomics
3.2. Significance of Genomics Study in Cancer Research
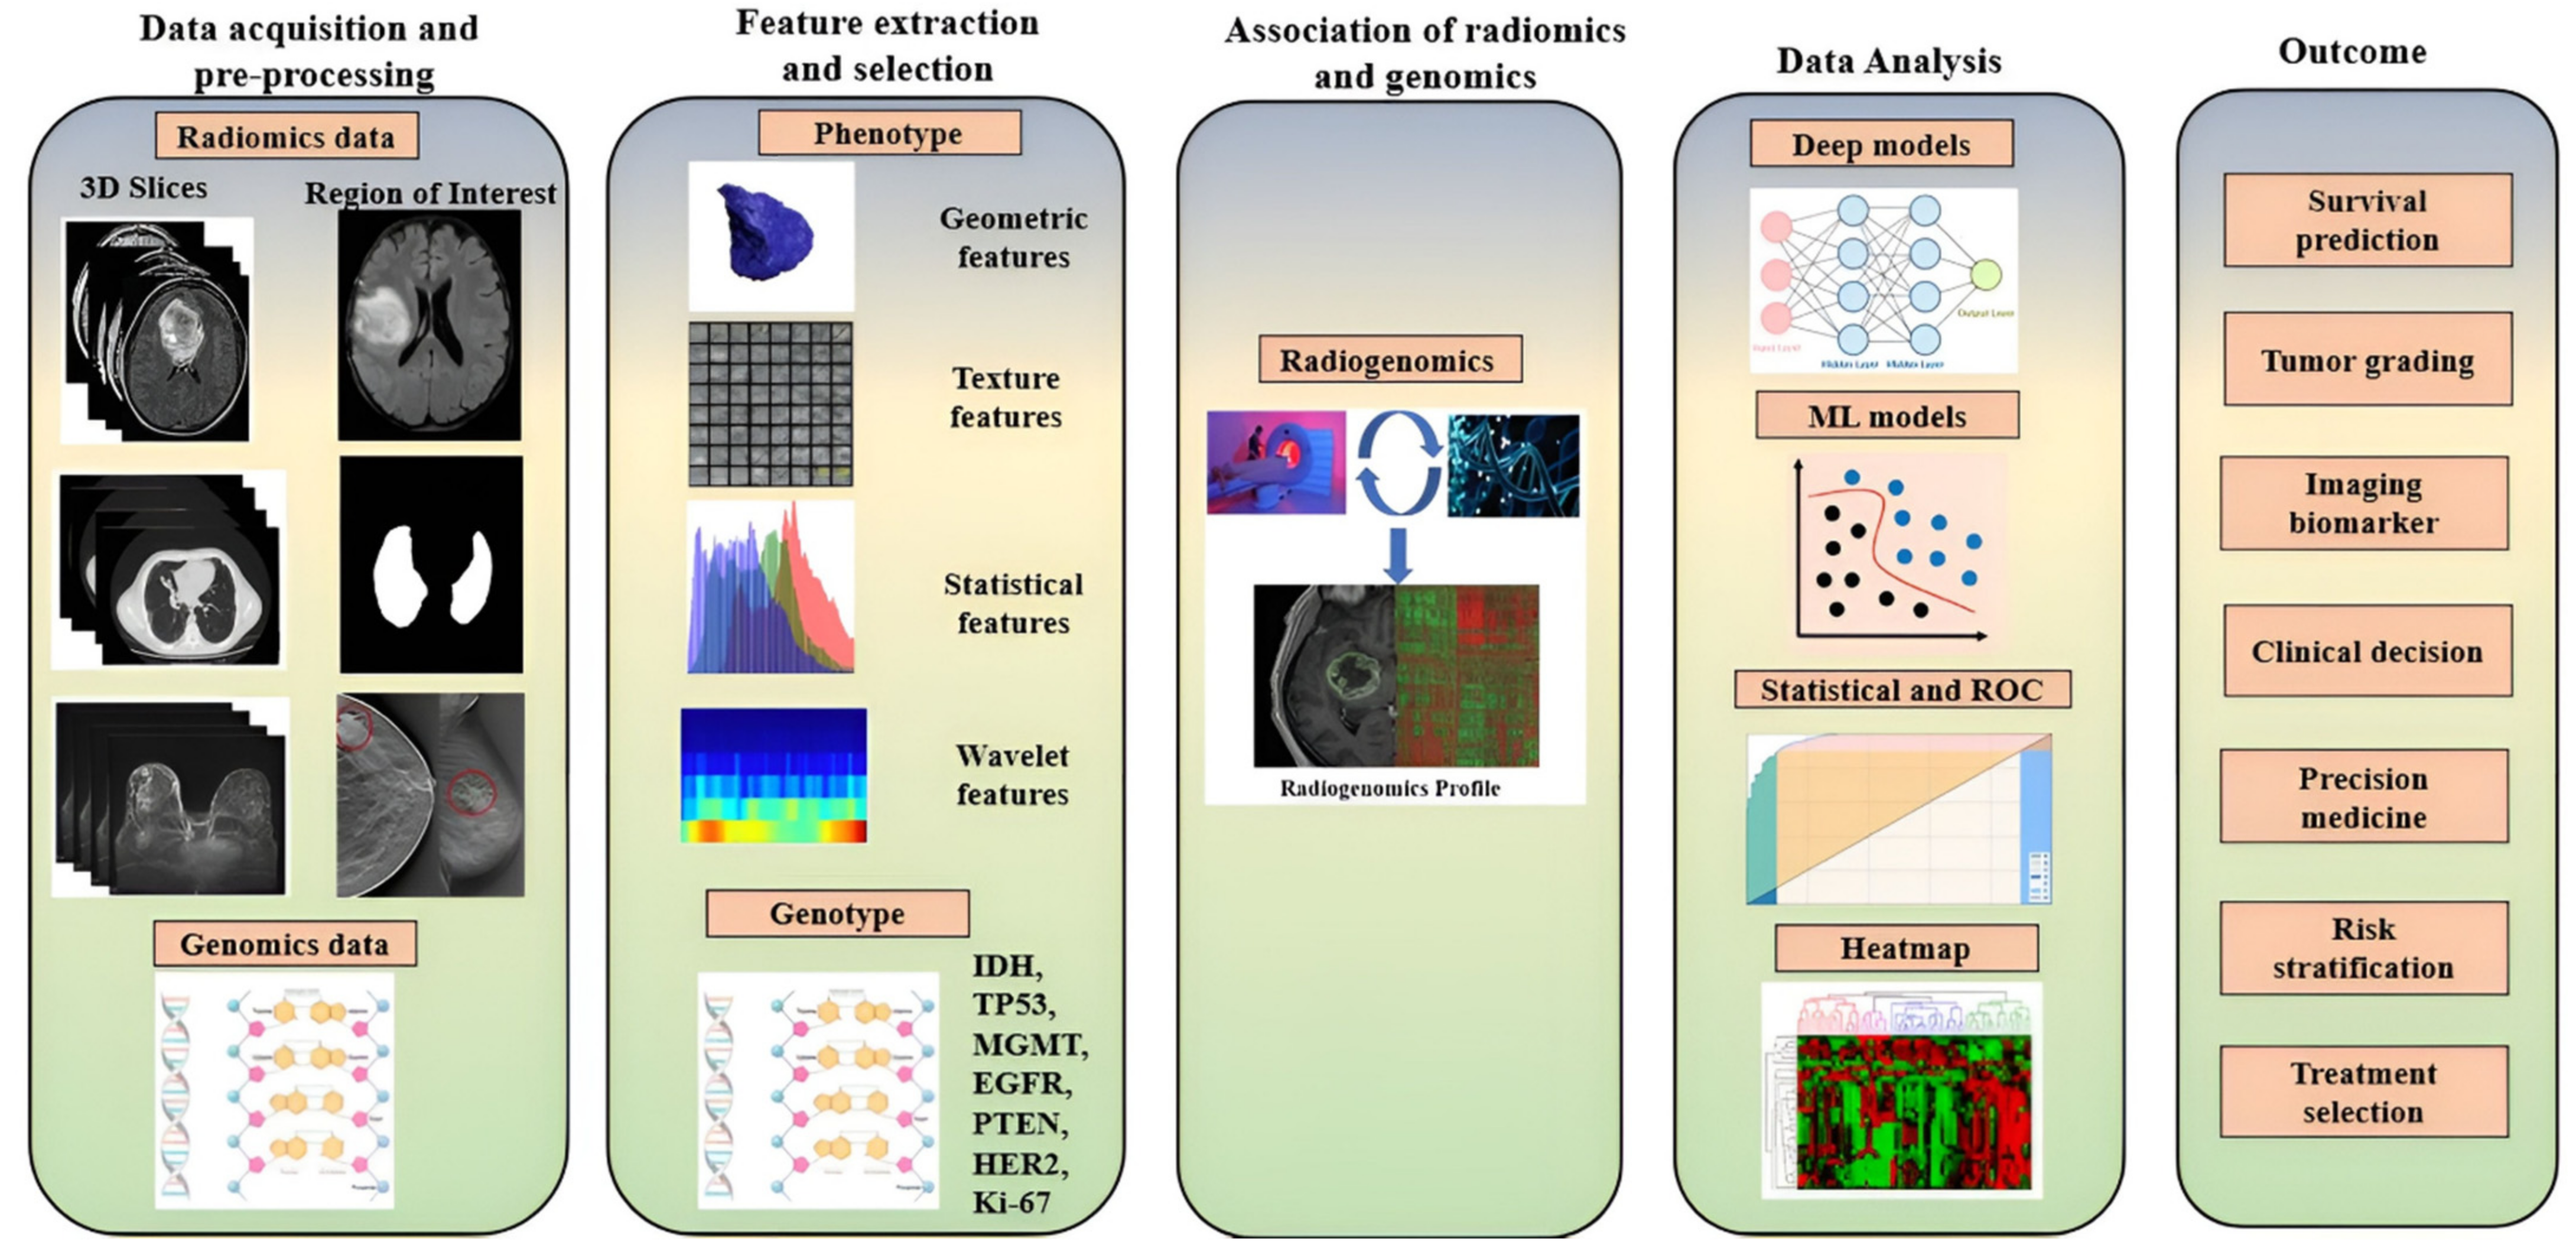
3.3. Overall Flow of Radiogenomics

| SN | Genotype | Function | Mutation Effect | Prominent Cancers |
|---|---|---|---|---|
| 1 | TP53 (p53) [46] | Tumor suppressor gene, Initiating apoptosis, DNA repair | Genetic instability, reduced apoptosis, angiogenesis | Breast, brain, bone, leukemia, lung |
| 2 | IDH1, IDH2 [78] | Control citric acid cycle | Loss of normal enzymatic function | Leukemia, bone, brain, prostate |
| 4 | MGMT [79] | Coding for a protein that repairs DNA | Reduces binding of transcription factors and decreases gene expression; cause of glioblastomas | Brain |
| 5 | EGFR and PTEN [80] | Protein on cells helps them grow | Tumorigenesis of glioblastoma; predictor of poor survival | Brain, lung |
| 6 | ER/PR [81] | Transcription of millions of genes leads to cell proliferation | Mammary gland development and cell proliferation | Breast |
| 7 | RB1 [82] | Tumor suppressor | Blocks cell-cycle progression | Retina, brain |
| 8 | Histone H3 [83] | DNA repair | Poor prognosis | Brain, bone |
| 9 | ATRX [84] | Protein formation for normal development | Intellectual disability, genital abnormalities, hypotonia, facial disorder | Brain |
| 10 | BRAF [85] | Encode B-Raf protein | Melanoma and colorectal cancer | Skin, colon |
| 11 | HER2 [86] | Control cell growth | Breast, bladder, ovarian, pancreatic, and stomach cancers | Breast, ovarian, pancreas, lung |
| 12 | Ki-67 [87] | Cell proliferation, Prevent aggregation of mitotic chromosomes | Inhibition of ribosomal RNA; synthesis; prostate, brain, and breast carcinomas, nephroblastoma, and neuroendocrine tumors | Prostate, brain, breast, kidney |
| 13 | PD-L1 IHC [88] | Controls the induction and maintenance of immune tolerance within the tumor microenvironment | Squamous cell carcinoma | Skin |
| 14 | NF1 [89] | Production of neurofibromin protein for cell growth | Deprivation of neurofibromin only causes uncontrolled cell growth | Skin, nervous system |
| 15 | MYB family [90] | Proliferation and differentiation of hematopoietic progenitor cells | Deletion in the C-terminal domain that causes cancer | Leukemia, glioma |
| 16 | BRCA1 and BRCA2 [91] | Repair damaged DNA and tumor suppressor | Abnormal cell growth, which can lead to cancer | Breast, ovarian |
| 17 | CDKN2A/B Family [92] | Produce the p14(ARF) and p16(INK4A) proteins. | 40% of melanoma, 95% of pancreatic tumors | Melanoma, glioblastoma, and pancreatic |
| 18 | MSH2, MSH6, and MLH1 [93] | Repair damaged DNA and tumor suppressor | Lynch syndrome; complete loss of MSH6 protein production. | Colon |
| 19 | CDH1 [94] | Produce protein called epithelial cadherin or E-cadherin | Hereditary diffuse gastric cancer (HDGC) | Gastric |
| 20 | KRAS [95] | Making a protein called K-Ras | 32% of lung cancers; 85% to 90% of pancreatic cancer; 40% of colorectal cancers, | Lung, pancreatic, colorectal |
| 21 | PBRM1 [96] | Tumor suppressor, chromatin remodeling | 40% of clear cell renal cell carcinoma (ccRCC) | Kidney |
| 22 | TERT [96] | Produce enzyme called telomerase; protect from chromosome degrading | Potential as biomarkers of various cancer | Brain, melanoma, leukemia |
| 23 | SMARCB1 [97] | Chromatin remodeling | Coffin–Siris syndrome (CSS) | Brain and kidney |
| 24 | PDGFRA [98] | Produce protein PDGFRA | Amino acid residue changes | Gastric |
4. The Era of Radiogenomics in Precision Medicine
5. What Have We Achieved So Far in Radiogenomics?

6. Artificial Intelligence in Radiogenomics
6.1. What AI Offers: A Computational Perspective
6.2. Cross-Validation: A Crucial Step
6.3. Performance Metrics: An Essential Step in the Evaluation of the AI Models
6.4. Is AI Efficient for Radiogenomics?
7. AI in Radiogenomics Studies of Different Cancer Types
| CIT * | Motivation | Radiomics Information | Genomics Information | AI-Based Models | Dataset | PM $ | Performance Measure | Outcomes |
|---|---|---|---|---|---|---|---|---|
| (a) | ||||||||
| [133] | Risk assessment in breast cancer | Traditional Radiographic, Texture Analysis, Pretrained CNN for deep features | BRCA1/2 | SVM Model | 456 clinical FFDM patients | AUC | BRCA1/2 gene-mutation: AUC = 0.86 unilateral cancer patients: AUC = 0.84 | Fusion classifiers performed significantly better. Deep features performed very well. |
| [134] | Association Assessment of imaging phenotype with molecular subtype. | 529 tumor and tissue imaging features. | Luminal A, ER, PR, EGFR, Ki67, HRE2 | ML-based multivariate models | 922 patients (Proprietary data) | AUC | Luminal A subtype: AUC = 0.697, TNBC: AUC = 0.654, ER: AUC = 0.649%, PR: AUC = 0.622% | Application in early diagnosis with association relation between the MRI-based imaging features and genomic features. |
| [135] | Prediction of molecular subtypes and prognostic biomarkers | CT perfusion features include lymph node status, tumor grading, tumor size | ER, PR, Luminal A, Ki67, HRE2 | SVM, RF, Decision tree, Naïve Bayes | 723 patients (Proprietary data) | AUC, ACC. | Random Forest: AUC: 0.86, Tumor grade and size: AUC: 0.88 and 0.85 ER and PR status: AUC: 0.88 and 0.85 HER2 and Ki67: AUC: 0.88 and 0.85 Molecular subtypes: AUC: 0.82 | Helps in non-invasive diagnosis by performing a depth analysis of the relation between molecular subtype and CT-based imaging features. |
| [123] | Classification of breast cancer molecular subtype | Deep features | Luminal A | Google Net, VGG, & CIFAR network | 272 patients (Proprietary data) | AUC | Deep features: AUC = 65% TL: AUC = 60% | Provides a non-invasive way to detect Luminal A tumor subtype with the help of DL. |
| [136] | Diagnosis of breast cancer | Features: tumor shape, size, morphology, enhancement texture, enhancement-variance kinetics, and kinetic curve assessment. | RNA sequencing, KEGG, GSEA | Radiogenomics | TCGA/TCIA | - | - | Detailed analysis of the association between the gene pathways and imaging features provides a future direction for the non-invasive diagnosis of breast cancer. |
| (b) | ||||||||
| [137] | CAD system | Traditional features: morphological, intensity, and textural features. | IDH1 | Logistic regression | 32 (WT IDH) and 7 (mutant IDH) patients from TCIA | ACC, SENS, SPEC | Morphology: ACC = 51% (20/39), SPEC = 50% (16/32), SENS = 57% (4/7); Intensity: ACC = 59% (23/39), SPEC = 59% (19/32), SENS = 57% (4/7); Texture: ACC = 85% (33/39), SENS = 86% (6/7), SPEC = 84% (27/32). | Non-invasive diagnosis of tumor CAD system. |
| [138] | Prediction of IDH1 for LGG tumor | Texture, intensity, shape, and wavelet features. | IDH1 | CNN | 151 patients from the Department of Neurosurgery, Huashan Hospital. | AUC, ACC, SPEC, SENS, NPV, PPV, MCC | IDH1 estimation, in radiomics method: AUC = 86%, DLR: AUC = 92%, DLR based on multiple-modality MRI, AUC = 95% | Provides a direction for early researchers to choose the models as it gives a comparative performance analysis of DL-based radiomics and normal radiomics methods. |
| [139] | Classification of MGMT promoter | Nine textures, histogram, gray level-based features | MGMT, IDH1 | XGBoost | 262 subjects from TCGA and TCIA | AUC, ACC, SENS, SPEC, F1 score | AUC = 89.6% | Yields better treatment planning for patients with IDH1 wildtype GBM in the primary diagnosis phase. |
| [140] | Characterization of genetic heterogeneity over enhancing and non-enhancing tumor. | MR imaging texture features | EGFR, PTEN, PDGFRA, CDKN2A, TP53 and RB1. | Predictive decision-tree models. | 18 GBM Patients (Proprietary data) | ACC, LOOCV, | Accuracy for 6 driver genes: EGFR = 75%, PDGFRA = 77.1%, CDKN2A = 87.5%, TP53 = 37.5%, RB1 = 87.5%, | In primary diagnosis and better treatment planning of patient with GBM. |
| (c) | ||||||||
| [141] | Prediction of EGFR and KRAS mutation | Texture and Non-texture features | EGFR and KRAS | Ensemble model based on ML and CNN. | 99 patients from the TCIA | AUC, ACC, SENS, SPEC | AUC for ML models: EGFR = 75%, KRAS = 72%, For DL models: EGFR = 82.8% KRAS = 72.2%. | Enhancing the performance of non-invasive diagnosis of lung cancer by predicting EGFR and KRAS mutation in a small dataset |
| [142] | Prediction histology and tumor Recurrence. | 117 radiomic features based on GLM. | KRAS, TP53, EGFR | ML and Generalized linear model | 151 Institutional databases | ACC, F1-score | AUC = 87% | Compressive analysis of showing a correlation between genomic and tumor subtype. |
| [143] | Prediction of tumor Recurrence in Non-small cell lung cancer (NSCLC. | Handcrafted: GLCM, histogram-based statistics, Laplace of Gaussian. Deep features | The RNA-sequencing. | Genotype-guided radiomics method | 162 patients from the TCIA dataset | AUC, ACC, SENS, SPEC | AUC = 76.67% and ACC = 83.28% | Showing an effective prediction method with low cost and improved accuracy. |
| [144] | Risk prediction of lung cancer | Feature: patient’s current and prior CT volumes | - | 3D CNN | 6716 National Lung Cancer Screening Trial cases | AUC | AUC = 94.4% in risk prediction | Clinical validation proves its low-biased performance and allows enhancement of the screening process via CAD and automated screening to the radiologist. |
| [143] | Classification of histology subtype | 1695 quantitative radiomic features (LOG, GLCM) | Histological subtypes | Incremental Forward Search and SVM | 278 patients (181 NSCLC and 97 SCLC) | AUC | SCLC vs. NSCLC: 74.1%, SCLC vs. AD: 82.2%, SCLC vs. SCC 66.5% and AD vs. SCC: 66.5% | Detailed analysis of phenotypic variation exists among various lung cancer histological subtypes in CT images. |
| [145] | Classify somatic mutations | Radiomic signature including tumor volume and maximum diameter, intensity. | EGFR and KRAS | Random Forest | Four independent datasets (PROFILE, TIANJIN, MOFFITT, xHARVARD-RT) | AUC | AUC: 80% EGFR+ and KRAS+, 69% with EGFR+ and EGFR−, 63% with KRAS+/KRAS− radiomic signatures | Relation between the imaging phenotype captured with a genotype and EGFR mutant tumors has a clinical impact in selecting patients for targeted therapies. |
| (d) | ||||||||
| [146] | Prediction of early recurrence of HCC | 21 CT image-based radiomic signature | - | Machine learning | Proprietary data (215 HCC patients) | AUC, SENS, SPEC | Radiomic features: AUC = 81.7%, clinical data AUC = 78.1%, combined model AUC = 83.6% | Shows a direction towards preoperative estimation in early prediction of recurrence less than 1 year and helps radiologists with better treatment planning. |
| [147] | Diagnosis in HCC | Features include texture features, first-order histogram, and GLCM. | TP53, TOP2A, CTNNB1, CDKN2A and AKT1 | Machine learning | 27 patients from TCGA, and TCIA. | AUC, SPEC, SENS. | TP53: AUC = 86.61%, TOP2A 78.0%, CTNNB1: 86.8% | Ability to categorize HCC tumors on a genetic level which helps the radiologist for early diagnosis of HCC patient |
| [148] | Prediction of progression-free survival (PFS) and overall survival in uHCC | SUV statistics, co-occurrence matrix, neighborhood intensity, neighborhood gray level dependence | Alpha-fetoprotein | Machine learning | Proprietary data (371 patients) | - | For survival PFS: [PFS-pPET-RadScore < 0.09] vs. 4.0 mo [95% CI(Confidence Interval): 2.3–5.7 mo] in high-risk group. median of 11.4 mo [95% CI: 6.3–16.5 mo] in a low-risk group. [OS-pPET-RadScore < 0.11] vs. 7.7 mo [95% CI: 6.0–9.5 mo] in high-risk group.[PFS-pPET-RadScore > 0.09]; p = 0.0004) and OS(Overall Survival): median of 20.3 mo [95% CI: 5.7–35 mo] in low-risk group. [OS-pPET-RadScore > 0.11]; p = 0.007) | Helps in better treatment planning for the patients undergoing transarterial radioembolization using Yttrium-90. |
| [149] | Prediction of overall survival in HCC | Features including maximum diameter, histogram-based texture features | AFP, DCP | Machine learning | 178 patients (Proprietary data | Kaplan-Meier analysis | Random survival forest model’s high and low predicted individual risks are p = 1.1 × 10⁻⁴ for DFS, 4.8 × 10⁻⁷ for OS respectively, and based on the multivariate Cox proportional hazards model, high predicted individual risk (hazard ratio = 1.06 per 1% increase, p = 8.4 × 10⁻⁸) | OS prediction shows a better direction towards the improving survival of the patient. |
| (e) | ||||||||
| [150] | Diagnosis of prostate cancer | Features: Gabor texture, Gleason grade, and gland lumen shape | Gleason score, QH | ML | 54 patients from UPenn and 17 patients from SV | AUC | Prediction of Gleason grade based on Gabor texture features AUC = 69%, prediction of QH based on gland lumen shape features AUC = 0.75 | Relation between in vivo T2w MRI phenotype predicting prostate cancer status. |
| [151] | Prediction of tumor aggressiveness in prostate | Multiparametric (mp) MRI and 68Ga-PSMA-PET/CT phenotypes. | CNAs | - | 5 patients of the University of Heidelberg | - | Highly significant CNAs (≥10 Mbp) were found in 22 of 46 biopsies. | Correlating the most aggressive lesion with imaging features helps in future prostate cancer diagnosis and prognosis. |
| [152] | Diagnosis of prostate cancer | Texture Based features, morphological features | - | LSTM and ResNet101 | 230 for MRI by the Health Insurance Portability. | AUC, SENS ACC, SPEC, NPV, PPV, MCC | LSTM: AUC = 0.9999, ResNet − 101AUC = 100% | Detection of prostate cancer prediction is better on a DL-based model. |
| [153] | CAD for prostate cancer | 564 radiomic features of texture, intensity, shape, and orientation. | - | CNN DL, radiomic model. | 644 patients from healthcare centers in Netherland. | AUC, ACC, SENS, SPEC. | DL: AUC = 89%, Active Surveillance dataset using Radiomic model AUC = 83% | Developed a tool for significant-PCA classification with radiomic model. |
| (f) | ||||||||
| [154] | predicting early recurrence in HGSOC | Radiomic nomogram | - | KNN, SVM, and LR | Proprietary data (256 patients) | AUC, Kaplan-Meier survival analysis and Decision curve analysis | C-index for clinical factors model = 82% [95% CI (0.75–0.88)] (training set) (validation set): 77% [95% CI (0.59–0.90)] Radiomics nomogram C-index = 0.91 [95% CI (0.85–0.95)] (training set),, the C-index = 0.85 [95% CI (0.69–0.95)] (validation set) | Helps in early individualized recurrence prediction in patients with HGSOC |
| [155] | Classification of ovarian cancers (SOCs). | Features include Histogram, Formfactor, GLSZM, RLM. | CEA, CA125 | ML | Proprietary data (110 patients) | AUC, SPEC, SENS | AUC = 85.4% | The model using radiomic features of arterial phase of CT with clinical features is the first study to develop a useful tool for differentiating the POC and SOC. |
| [156] | Prediction of PM in ovarian cancer. | Radiomics features: T2WIs, T2WIs, multi-value DWIs | - | LR | 89 patients Shanxi Medical University | AUC. | AUC = 96.3% (training) AUC of 0.928 (validation) | Treated as a biomarker for risk stratification. |
| [157] | Prediction of PFS in advanced HGSOC. | Imaging features | Pelvic fluid, and CA-125 | 261 patients (Proprietary data) | AUC | AUC = 96.9% | The quantitative solution to predict PM in OC patients. | |
| [158] | Assessments of CT imaging features of HGSOC | Ovarian mass, size of pleural effusions and ascites, mesenteric implants and infiltration, lymphadenopathy, and distant metastases. | - | ML | 92 patients (Proprietary data) | Estimates of Krippendorff α and coverage probabilities | Pleural effusion and Ascites: α = 0.78, Intraparenchymal splenic metastases: α = 0.08 | Experimental results show evidence of the clinical and biological validity of these image features. |
| (g) | ||||||||
| [159] | Prediction of mutation status and prognostic values in colorectal cancer | - | PIK3CA exon 9 and 20, NRAS exon 2 and 3, KRAS exon 2, 3 and 4, and BRAF exon 15 | PCR and direct sequencing | 353 CRC patients at Zhongda Hospital | - | 13.9% (49 out of 353) CRC patients carried mutations at RAS exons outside the KRAS exon 2. | Provides the importance of these novel molecular features in CRCs |
| [160] | Prediction of KRAS/NRAS/BRAF mutations in colorectal cancer (CRC). | Features include shape features, GLCM features, and GLRLM features. | KRAS/NRAS/BRAF | RELIEFF and SVM | 117 patients (Proprietary data) | AUC, SENS, SPEC. | Prediction of KRAS/NRAS/BRAF mutations, AUC = 86.9% | The predicted association is useful for the analysis of tumor genotype in CRC and hence helps in therapeutic strategies. |
| [161] | Prediction of KRAS mutations using MRI | polypoid pattern, axial tumor length | KRAS | - | 275 patients (Proprietary data) | - | The frequency of KRAS mutations was higher in the N2 stage (53.70%), and polypoid tumors (59.09%). | Helps in finding the imaging predictor of KRAS which helps the radiologist to make a better therapy strategy. |
| [162] | Prediction of the mutation status molecular subtype in colorectal cancer. | Features: tumor size, degree of the tumor, C-reactive protein level, differentiation, and TNM stage | KRAS | Machine Learning | 58 patients (Proprietary data) | AUC | AUC on predicting the KRAS mutant = was 86.5% | Provides a higher performance for the prediction of the KRAS mutation status in CRC. |
| [163] | Classification of imaging predictors. | - | KRAS | Naive Bayes classifier | 457 patients (Proprietary data) | - | - | Ability to identify disease course relation with mutated oncogenes and provides a cheaper, quicker substitute for genome sequencing. |
| (h) | ||||||||
| [164] | Predicting of lymph node metastasis. | Features include intensity features, shape, GLZLM, GLRLM, GLCM. | - | SVM | 490 patients (Proprietary data). | AUC | LN+, AUC = 82.4% (training and validation), AUC = 76.4% (test data) | Shows a promising tool for the preoperative prediction of LN status in patients with GC. |
| [115] | Prediction of PD-L1 status in gastric cancer (GC). | - | PD-L1 | SVM and RF | 358 patients of Nanjing Drum Tower Hospital | AUC | Using SVM AUC = 70.4%, 79.9% in primary and validation cohort. | A promising tool to predict PD-L1 status and helps to improve clinical decision-making about immunotherapy. |
| [165] | PET based radiomic model for prediction of PM of gastric cancer. | Features including GLCM, GLZLM, NGLDM, and GLRLM | CA 125, PM, SUVmax. | Multivariate LR | 355 patients (Proprietary data). | AUC | Radiomics model: AUC = 86%, 87%, Clinical prediction model: AUC = 76% and 69% | Provides a novel tool for predicting peritoneal metastasis of gastric cancer. |
| [166] | Prediction and investigation of the efficiency of neoadjuvant chemotherapy in survival stratification. | Texture, filter transformed, and wavelet features. | - | Randomized tree | 106 patients (Proprietary data) | AUC | Rad_score: AUC = 82%, clinical score: AUC = 62% | Effective prediction treatment for neoadjuvant chemotherapy and stratifying patients into various survival groups. |
| [167] | Predict the status of lymph node metastasis (LNM). | Shape-based features, first-order based, texture-based features. | Genome stable, Epstein–Barr virus-positive, chromosomal and microsatellite instability. | Multivariate LR | 768 patients (Proprietary data) | AUC | AUC = 92% (training cohort), AUC = 86% (validation cohort) AUC = 85% (EGC patients) | Serves as a non-invasive tool for preoperative evaluation of LNM in EGC. |
8. Benchmarking: Comparison between Different Radiogenomics Reviews
9. Clinical Challenges and A View for the Future
10. Conclusions
Author Contributions
Funding
Conflicts of Interest
Abbreviations
| ATRX | Alpha-Thalassemia/intellectual Disability syndrome X-linked. |
| AUC | Area under the ROC Curve. |
| BRAF | B-Raf proto-oncogene. |
| BRCA1 | Breast cancer susceptibility gene 1. |
| BRCA2 | Breast cancer susceptibility gene 2. |
| CA125 | Carbohydrate antigen 125). |
| CDKN2A | Cyclin-dependent kinase inhibitor 2A. |
| CEA | Carcinoembryonic antigen. |
| CNN | Convolutional Neural Network. |
| CT | Computed tomography. |
| DCE | Dynamic contrast enhanced. |
| DNA | Deoxyribonucleic acid. |
| ER | Estrogen-receptor. |
| FDG PET-CT | Fluorodeoxyglucose PET/CT. |
| FLAIR | Fluid-attenuated inversion recovery. |
| GBM | Glioblastoma. |
| GSEA | Gene Set Enrichment Analysis. |
| HCC | Hepatocellular carcinoma. |
| HER2 | Human epidermal growth factor receptor 2. |
| HGSOC | High-grade serous ovarian cancer. |
| ICC | Intrahepatic cholangiocarcinoma. |
| INHBB | Inhibin subunit beta B. |
| KRAS | Carcinogenic Kirsten rat sarcoma viral oncogene homolog. |
| KEGG | Kyoto Encyclopedia of Genes and Genomes. |
| MGMT | O6-methylguanine-DNA methyltransferase. |
| NF1 | Neurofibromatosis 1. |
| PDGFRA | Platelet-derived growth factor receptor A. |
| PD-L1 | Programmed death ligand 1. |
| PET | Positron emission tomography. |
| PIK3CA | phosphatidylinositol-4,5-bisphosphate 3-kinase catalytic subunit alpha. |
| PR | Progesterone-receptor. |
| PTEN | Phosphatase and tensin homologue. |
| RB1 | Retinoblastoma protein. |
| SUV | Standardized Uptake Value. |
| TACE | Trans arterial chemoembolization. |
| TNBC | Triple-negative breast cancer. |
| TP53 | Tumor protein p53. |
| US | Ultrasound. |
References
- World Health Organization. Cancer—Key Facts. 2022. Available online: https://www.who.int/news-room/fact-sheets/detail/cancer (accessed on 12 March 2022).
- World Health Organization. The World Health Report 2001. Mental Health: New Understanding, New Hope; World Health Organization: Geneva, Switzerland, 2001. [Google Scholar]
- Jaffe, C.C. Imaging and genomics: Is there a synergy? Radiology 2012, 264, 329–331. [Google Scholar] [CrossRef] [PubMed] [Green Version]
- Bodalal, Z.; Trebeschi, S.; Nguyen-Kim, T.D.L.; Schats, W.; Beets-Tan, R. Radiogenomics: Bridging imaging and genomics. Abdom. Radiol. 2019, 44, 1960–1984. [Google Scholar] [CrossRef] [PubMed] [Green Version]
- Ding, L.; Wendl, M.C.; Koboldt, D.C.; Mardis, E.R. Analysis of next-generation genomic data in cancer: Accomplishments and challenges. Hum. Mol. Genet. 2010, 19, R188–R196. [Google Scholar] [CrossRef] [PubMed] [Green Version]
- Taber, K.A.J.; Dickinson, B.D.; Wilson, M. The promise and challenges of next-generation genome sequencing for clinical care. JAMA Intern. Med. 2014, 174, 275–280. [Google Scholar] [CrossRef]
- McCarthy, J.J.; McLeod, H.L.; Ginsburg, G.S. Genomic medicine: A decade of successes, challenges, and opportunities. Sci. Transl. Med. 2013, 5, 189sr4. [Google Scholar] [CrossRef]
- Kazerooni, A.F.; Bagley, S.J.; Akbari, H.; Saxena, S.; Bagheri, S.; Guo, J.; Chawla, S.; Nabavizadeh, A.; Mohan, S.; Bakas, S.; et al. Applications of radiomics and radiogenomics in high-grade gliomas in the era of precision medicine. Cancers 2021, 13, 5921. [Google Scholar] [CrossRef]
- Saxena, S.; Kazerooni, A.F.; Toorens, E.; Bakas, S.; Akbari, H.; Sako, C.; Mamourian, E.; Koumenis, C.; Mohan, S.; Bagley, S.J.; et al. NIMG-73. Capturing glioblastoma heterogeneity using imaging and deep learning: Application to MGMT promoter methylation. Neuro-Oncology 2021, 23, vi146. [Google Scholar] [CrossRef]
- Alizadeh, A.A.; Aranda, V.; Bardelli, A.; Blanpain, C.; Bock, C.; Borowski, C.; Caldas, C.; Califano, A.; Doherty, M.; Elsner, M.; et al. Toward understanding and exploiting tumor heterogeneity. Nat. Med. 2015, 21, 846–853. [Google Scholar] [CrossRef]
- Marusyk, A.; Polyak, K. Tumor heterogeneity: Causes and consequences. Biochim. Biophys. Acta 2010, 1805, 105–117. [Google Scholar] [CrossRef] [Green Version]
- Fass, L. Imaging and cancer: A review. Mol. Oncol. 2008, 2, 115–152. [Google Scholar] [CrossRef]
- Barrington, S.F.; Mikhaeel, N.G.; Kostakoglu, L.; Meignan, M.; Hutchings, M.; Müeller, S.P.; Schwartz, L.H.; Zucca, E.; Fisher, R.I.; Trotman, J.; et al. Role of imaging in the staging and response assessment of lymphoma: Consensus of the international conference on malignant lymphomas imaging working group. J. Clin. Oncol. 2014, 32, 3048–3058. [Google Scholar] [CrossRef] [PubMed]
- Obeid, J.P.; Stoyanova, R.; Kwon, D.; Patel, M.; Padgett, K.; Slingerland, J.; Takita, C.; Alperin, N.; Yepes, M.; Zeidan, Y.H. Multiparametric evaluation of preoperative MRI in early stage breast cancer: Prognostic impact of peri-tumoral fat. Clin. Transl. Oncol. 2017, 19, 211–218. [Google Scholar] [CrossRef] [PubMed]
- Algohary, A.; Shiradkar, R.; Pahwa, S.; Purysko, A.; Verma, S.; Moses, D.; Shnier, R.; Haynes, A.-M.; Delprado, W.; Thompson, J.; et al. Combination of Peri-Tumoral and Intra-Tumoral Radiomic Features on Bi-Parametric MRI Accurately Stratifies Prostate Cancer Risk: A Multi-Site Study. Cancers 2020, 12, 2200. [Google Scholar] [CrossRef] [PubMed]
- Yip, S.S.F.; Liu, Y.; Parmar, C.; Li, Q.; Liu, S.; Qu, F.; Ye, Z.; Gillies, R.J.; Aerts, H.J.W.L. Associations between radiologist-defined semantic and automatically computed radiomic features in non-small cell lung cancer. Sci. Rep. 2017, 7, 3519. [Google Scholar] [CrossRef] [PubMed]
- Wu, J.; Sun, X.; Wang, J.; Cui, Y.; Kato, F.; Shirato, H.; Ikeda, D.M.; Li, R. Identifying relations between imaging phenotypes and molecular subtypes of breast cancer: Model discovery and external validation. J. Magn. Reson. Imaging 2017, 46, 1017–1027. [Google Scholar] [CrossRef] [PubMed]
- Suri, J.S.; Liu, K. Method and Apparatus for Three-Dimensional Filtering of Angiographic Volume Data. U.S. Patent 7,024,027, 13 November 2001. [Google Scholar]
- El-Baz, A.; Gimel’farb, G.; Suri, J.S. Stochastic Modeling for Medical Image Analysis, 1st ed.; CRC Press: Boca Raton, FL, USA, 2015; ISBN 9780429167720. [Google Scholar]
- El-Baz, A.; Jiang, X.; Suri, J.S. (Eds.) Biomedical Image Segmentation Advances and Trends, 1st ed.; CRC Press: Boca Raton, FL, USA, 2019; ISBN 9780367870867. [Google Scholar]
- Corrias, G.; Micheletti, G.; Barberini, L.; Suri, J.S.; Saba, L. Texture analysis imaging “what a clinical radiologist needs to know”. Eur. J. Radiol. 2022, 146, 110055. [Google Scholar] [CrossRef]
- Acharya, U.R. Data mining framework for fatty liver disease classification in ultrasound: A hybrid feature extraction paradigm. Med. Phys. 2012, 39, 4255–4264. [Google Scholar] [CrossRef] [Green Version]
- Das, S.; Bose, S.; Nayak, G.K.; Satapathy, S.C.; Saxena, S. Brain tumor segmentation and overall survival period prediction in glioblastoma multiforme using radiomic features. Concurr. Comput. Pract. Exp. 2021, e6501. [Google Scholar] [CrossRef]
- Kazerooni, A.F.; Saxena, S.; Tu, D.; Toorens, E.; Bashyam, V.; Akbari, H.; Mamourian, E.; Sako, C.; Koumenis, C.; Shinohara, R.T.; et al. EPCO-25. Multi-Omics disease stratification patients with IDH-wildtype Glioblastoma: Synergistic value of clinical measures, conventional and deep radiomics, and genomics for prediction of overall survival. Neuro-Oncology 2021, 23, vi7. [Google Scholar] [CrossRef]
- Vidyarthi, A.; Mittal, N. Texture based feature extraction method for classification of brain tumor MRI. J. Intell. Fuzzy Syst. 2017, 32, 2807–2818. [Google Scholar] [CrossRef]
- Acharya, U.R.; Faust, O.; Sree, S.V.; Alvin, A.P.C.; Krishnamurthi, G.; Seabra, J.C.R.; Sanches, J.; Suri, J.S. Atheromatic™: Symptomatic vs. asymptomatic classification of carotid ultrasound plaque using a combination of HOS, DWT & texture. In Proceedings of the 2011 Annual International Conference of the IEEE Engineering in Medicine and Biology Society, Boston, MA, USA, 30 August–3 September 2011; IEEE: Piscatway, NJ, USA, 2011; pp. 4489–4492. [Google Scholar]
- Kim, H.; Goo, J.M.; Lee, K.H.; Kim, Y.T.; Park, C.M. Preoperative ct-based deep learning model for predicting disease-free survival in patients with lung adenocarcinomas. Radiology 2020, 296, 216–224. [Google Scholar] [CrossRef] [PubMed]
- Tandel, G.S.; Biswas, M.; Kakde, O.G.; Tiwari, A.; Suri, H.S.; Turk, M.; Laird, J.R.; Asare, C.K.; Ankrah, A.A.; Khanna, N.N.; et al. A review on a deep learning perspective in brain cancer classification. Cancers 2019, 11, 111. [Google Scholar] [CrossRef] [PubMed] [Green Version]
- Biswas, M.; Kuppili, V.; Saba, L.; Edla, D.R.; Suri, H.S.; Cuadrado-Godia, E.; Laird, J.R.; Marinhoe, R.T.; Sanches, J.M.; Nicolaides, A.; et al. State-of-the-art review on deep learning in medical imaging. Front. Biosci.-Landmark 2019, 24, 392–426. [Google Scholar] [CrossRef]
- Rutman, A.M.; Kuo, M.D. Radiogenomics: Creating a link between molecular diagnostics and diagnostic imaging. Eur. J. Radiol. 2009, 70, 232–241. [Google Scholar] [CrossRef]
- Subba Rao, M.; Eswara Reddy, B. Parametric Analysis of Texture Classification Using Modified Weighted Probabilistic Neural Network (MWPNN). In Modern Approaches in Machine Learning and Cognitive Science: A Walkthrough; Springer: Cham, Switzerland, 2021; pp. 459–473. [Google Scholar]
- Acharya, U.R.; Kannathal, N.; Ng, E.Y.K.; Min, L.C.; Suri, J.S. Computer-Based Classification of Eye Diseases. In Proceedings of the 2006 International Conference of the IEEE Engineering in Medicine and Biology Society, New York, NY, USA, 30 August–3 September 2006; IEEE: Piscatway, NJ, USA, 2006; pp. 6121–6124. [Google Scholar]
- Maniruzzaman, M.; Jahanur Rahman, M.; Ahammed, B.; Abedin, M.M.; Suri, H.S.; Biswas, M.; El-Baz, A.; Bangeas, P.; Tsoulfas, G.; Suri, J.S. Statistical characterization and classification of colon microarray gene expression data using multiple machine learning paradigms. Comput. Methods Programs Biomed. 2019, 176, 173–193. [Google Scholar] [CrossRef]
- Avanzo, M.; Wei, L.; Stancanello, J.; Vallières, M.; Rao, A.; Morin, O.; Mattonen, S.A.; El Naqa, I. Machine and deep learning methods for radiomics. Med. Phys. 2020, 47, e185–e202. [Google Scholar] [CrossRef]
- Lao, J.; Chen, Y.; Li, Z.C.; Li, Q.; Zhang, J.; Liu, J.; Zhai, G. A Deep Learning-Based Radiomics Model for Prediction of Survival in Glioblastoma Multiforme. Sci. Rep. 2017, 7, 10353. [Google Scholar] [CrossRef]
- Shrivastava, V.K.; Londhe, N.D.; Sonawane, R.S.; Suri, J.S. Exploring the color feature power for psoriasis risk stratification and classification: A data mining paradigm. Comput. Biol. Med. 2015, 65, 54–68. [Google Scholar] [CrossRef]
- Shrivastava, V.K.; Londhe, N.D.; Sonawane, R.S.; Suri, J.S. Computer-aided diagnosis of psoriasis skin images with HOS, texture and color features: A first comparative study of its kind. Comput. Methods Programs Biomed. 2016, 126, 98–109. [Google Scholar] [CrossRef]
- Araki, T.; Ikeda, N.; Shukla, D.; Jain, P.K.; Londhe, N.D.; Shrivastava, V.K.; Banchhor, S.K.; Saba, L.; Nicolaides, A.; Shafique, S.; et al. PCA-based polling strategy in machine learning framework for coronary artery disease risk assessment in intravascular ultrasound: A link between carotid and coronary grayscale plaque morphology. Comput. Methods Programs Biomed. 2016, 128, 137–158. [Google Scholar] [CrossRef]
- Jamthikar, A.; Gupta, D.; Khanna, N.N.; Saba, L.; Araki, T.; Viskovic, K.; Suri, H.S.; Gupta, A.; Mavrogeni, S.; Turk, M.; et al. A low-cost machine learning-based cardiovascular/stroke risk assessment system: Integration of conventional factors with image phenotypes. Cardiovasc. Diagn. Ther. 2019, 9, 420–430. [Google Scholar] [CrossRef] [PubMed] [Green Version]
- Saba, L.; Agarwal, M.; Sanagala, S.S.; Gupta, S.K.; Sinha, G.R.; Johri, A.M.; Khanna, N.N.; Mavrogeni, S.; Laird, J.R.; Pareek, G.; et al. Brain MRI-based Wilson disease tissue classification: An optimised deep transfer learning approach. Electron. Lett. 2020, 56, 1395–1398. [Google Scholar] [CrossRef]
- Cancer Genome Research And Precision Medicine; National Cancer Institute: Bethesda, MD, USA, 2017.
- What Is Cancer? National Cancer Institute: Bethesda, MD, USA, 2021.
- Baird, P. The human genome project, genetics and health. Public Health Genom. 2001, 4, 77–80. [Google Scholar] [CrossRef] [PubMed]
- Sanches, J.M.; Laine, A.F.; Suri, J.S. (Eds.) Ultrasound Imaging; Springer: Boston, MA, USA, 2012; ISBN 978-1-4614-1179-6. [Google Scholar]
- Molinari, F.; Delsanto, S.; Giustetto, P.; Liboni, W.; Badalamenti, S.; Suri, J.S. Advances in Diagnostic and Therapeutic Ultrasound Imaging; Artech House: Norwood, MA, USA, 2008; ISBN 9781596931442. [Google Scholar]
- Olivier, M.; Hollstein, M.; Hainaut, P. TP53 mutations in human cancers: Origins, consequences, and clinical use. Cold Spring Harb. Perspect. Biol. 2010, 2, a001008. [Google Scholar] [CrossRef] [Green Version]
- Koçak, B.; Durmaz, E.Ş.; Ateş, E.; Kılıçkesmez, Ö. Radiomics with artificial intelligence: A practical guide for beginners. Diagn. Interv. Radiol. 2019, 25, 485–495. [Google Scholar] [CrossRef]
- Khalifa, F.; Beache, G.M.; Gimel’farb, G.; Suri, J.S.; El-Baz, A.S. State-of-the-Art Medical Image Registration Methodologies: A Survey. In Multi Modality State-of-the-Art Medical Image Segmentation and Registration Methodologies; Springer: Boston, MA, USA, 2011; pp. 235–280. [Google Scholar]
- El-Baz, A.S.; Acharya, U.R.; Mirmehdi, M.; Suri, J.S. (Eds.) Multi Modality State-of-the-Art Medical Image Segmentation and Registration Methodologies; Springer: Boston, MA, USA, 2011; ISBN 978-1-4419-8194-3. [Google Scholar]
- Mirmehdi, M. Handbook of Texture Analysis; Imperial College Press: London, UK, 2008; ISBN 1848161166/9781848161160. [Google Scholar]
- Acharya, U.R.; Faust, O.; Sree S, V.; Alvin, A.P.C.; Krishnamurthi, G.; Seabra, J.C.R.; Sanches, J.; Suri, J.S. Understanding symptomatology of atherosclerotic plaque by image-based tissue characterization. Comput. Methods Programs Biomed. 2013, 110, 66–75. [Google Scholar] [CrossRef]
- Sanagala, S.S.; Nicolaides, A.; Gupta, S.K.; Koppula, V.K.; Saba, L.; Agarwal, S.; Johri, A.M.; Kalra, M.S.; Suri, J.S. Ten fast transfer learning models for carotid ultrasound plaque tissue characterization in augmentation framework embedded with heatmaps for stroke risk stratification. Diagnostics 2021, 11, 2109. [Google Scholar] [CrossRef]
- Sanagala, S.S.; Gupta, S.K.; Koppula, V.K.; Agarwal, M. A Fast and Light Weight Deep Convolution Neural Network Model for Cancer Disease Identification in Human Lung(s). In Proceedings of the 2019 18th IEEE International Conference on Machine Learning And Applications (ICMLA), Boca Raton, FL, USA, 16–19 December 2019; IEEE: Piscatway, NJ, USA, 2019; pp. 1382–1387. [Google Scholar]
- Jena, B.; Saxena, S.; Nayak, G.K.; Saba, L.; Sharma, N.; Suri, J.S. Artificial intelligence-based hybrid deep learning models for image classification: The first narrative review. Comput. Biol. Med. 2021, 137, 104803. [Google Scholar] [CrossRef]
- Maniruzzaman, M.; Suri, H.S.; Kumar, N.; Abedin, M.M.; Rahman, M.J.; El-Baz, A.; Bhoot, M.; Teji, J.S.; Suri, J.S. Risk factors of neonatal mortality and child mortality in Bangladesh. J. Glob. Health 2018, 8, 010417. [Google Scholar] [CrossRef]
- Maniruzzaman, M.; Rahman, M.J.; Al-MehediHasan, M.; Suri, H.S.; Abedin, M.M.; El-Baz, A.; Suri, J.S. Accurate Diabetes Risk Stratification Using Machine Learning: Role of Missing Value and Outliers. J. Med. Syst. 2018, 42, 92. [Google Scholar] [CrossRef] [Green Version]
- Maniruzzaman, M.; Kumar, N.; Menhazul Abedin, M.; Shaykhul Islam, M.; Suri, H.S.; El-Baz, A.S.; Suri, J.S. Comparative approaches for classification of diabetes mellitus data: Machine learning paradigm. Comput. Methods Programs Biomed. 2017, 152, 23–34. [Google Scholar] [CrossRef] [PubMed]
- Noor, N.M.; Than, J.C.M.; Rijal, O.M.; Kassim, R.M.; Yunus, A.; Zeki, A.A.; Anzidei, M.; Saba, L.; Suri, J.S. Automatic Lung Segmentation Using Control Feedback System: Morphology and Texture Paradigm. J. Med. Syst. 2015, 39, 22. [Google Scholar] [CrossRef] [PubMed]
- Acharya, R.U.; Faust, O.; Alvin, A.P.C.; Sree, S.V.; Molinari, F.; Saba, L.; Nicolaides, A.; Suri, J.S. Symptomatic vs. Asymptomatic Plaque Classification in Carotid Ultrasound. J. Med. Syst. 2012, 36, 1861–1871. [Google Scholar] [CrossRef] [PubMed]
- Acharya, U.R.; Mookiah, M.R.K.; Vinitha Sree, S.; Afonso, D.; Sanches, J.; Shafique, S.; Nicolaides, A.; Pedro, L.M.; Fernandes e Fernandes, J.; Suri, J.S. Atherosclerotic plaque tissue characterization in 2D ultrasound longitudinal carotid scans for automated classification: A paradigm for stroke risk assessment. Med. Biol. Eng. Comput. 2013, 51, 513–523. [Google Scholar] [CrossRef]
- Molinari, F.; Liboni, W.; Pavanelli, E.; Giustetto, P.; Badalamenti, S.; Suri, J.S. Accurate and Automatic Carotid Plaque Characterization in Contrast Enhanced 2-D Ultrasound Images. In Proceedings of the 2007 29th Annual International Conference of the IEEE Engineering in Medicine and Biology Society, Lyon, France, 22–26 August 2007; IEEE: Piscatway, NJ, USA, 2007; pp. 335–338. [Google Scholar]
- Khanna, N.N.; Jamthikar, A.D.; Gupta, D.; Piga, M.; Saba, L.; Carcassi, C.; Giannopoulos, A.A.; Nicolaides, A.; Laird, J.R.; Suri, H.S.; et al. Rheumatoid Arthritis: Atherosclerosis Imaging and Cardiovascular Risk Assessment Using Machine and Deep Learning–Based Tissue Characterization. Curr. Atheroscler. Rep. 2019, 21, 7. [Google Scholar] [CrossRef]
- Acharya, U.; Vinitha Sree, S.; Mookiah, M.; Yantri, R.; Molinari, F.; Zieleźnik, W.; Małyszek-Tumidajewicz, J.; Stępień, B.; Bardales, R.; Witkowska, A.; et al. Diagnosis of Hashimoto’s thyroiditis in ultrasound using tissue characterization and pixel classification. Proc. Inst. Mech. Eng. Part H J. Eng. Med. 2013, 227, 788–798. [Google Scholar] [CrossRef]
- Biswas, M.; Kuppili, V.; Edla, D.R.; Suri, H.S.; Saba, L.; Marinhoe, R.T.; Sanches, J.M.; Suri, J.S. Symtosis: A liver ultrasound tissue characterization and risk stratification in optimized deep learning paradigm. Comput. Methods Programs Biomed. 2018, 155, 165–177. [Google Scholar] [CrossRef]
- Kuppili, V.; Biswas, M.; Sreekumar, A.; Suri, H.S.; Saba, L.; Edla, D.R.; Marinhoe, R.T.; Sanches, J.M.; Suri, J.S. Extreme Learning Machine Framework for Risk Stratification of Fatty Liver Disease Using Ultrasound Tissue Characterization. J. Med. Syst. 2017, 41, 152. [Google Scholar] [CrossRef]
- Saba, L.; Sanagala, S.S.; Gupta, S.K.; Koppula, V.K.; Johri, A.M.; Khanna, N.N.; Mavrogeni, S.; Laird, J.R.; Pareek, G.; Miner, M.; et al. Multimodality carotid plaque tissue characterization and classification in the artificial intelligence paradigm: A narrative review for stroke application. Ann. Transl. Med. 2021, 9, 1206. [Google Scholar] [CrossRef]
- Banchhor, S.K.; Londhe, N.D.; Araki, T.; Saba, L.; Radeva, P.; Laird, J.R.; Suri, J.S. Wall-based measurement features provides an improved IVUS coronary artery risk assessment when fused with plaque texture-based features during machine learning paradigm. Comput. Biol. Med. 2017, 91, 198–212. [Google Scholar] [CrossRef]
- Acharya, U.R.; Sree, S.V.; Saba, L.; Molinari, F.; Guerriero, S.; Suri, J.S. Ovarian tumor characterization and classification using ultrasound—A new online paradigm. J. Digit. Imaging 2013, 26, 544–553. [Google Scholar] [CrossRef] [PubMed] [Green Version]
- Acharya, U.; Mookiah, M.; Vinitha Sree, S.; Yanti, R.; Martis, R.; Saba, L.; Molinari, F.; Guerriero, S.; Suri, J. Evolutionary Algorithm-Based Classifier Parameter Tuning for Automatic Ovarian Cancer Tissue Characterization and Classification. Ultraschall Med.-Eur. J. Ultrasound 2012, 35, 237–245. [Google Scholar] [CrossRef] [PubMed]
- Acharya, U.R.; Sree, S.V.; Saba, L.; Molinari, F.; Guerriero, S.; Suri, J.S. Ovarian tumor characterization and classification: A class of GyneScanTM systems. In Proceedings of the 2012 Annual International Conference of the IEEE Engineering in Medicine and Biology Society, San Diego, CA, USA, 28 August–1 September 2012; IEEE: Piscatway, NJ, USA, 2012; pp. 4446–4449. [Google Scholar]
- Ayer, T.; Ayvaci, M.U.; Liu, Z.X.; Alagoz, O.; Burnside, E.S. Computer-aided diagnostic models in breast cancer screening. Imaging Med. 2010, 2, 313–323. [Google Scholar] [CrossRef] [PubMed] [Green Version]
- Pareek, G.; Acharya, U.R.; Sree, S.V.; Swapna, G.; Yantri, R.; Martis, R.J.; Saba, L.; Krishnamurthi, G.; Mallarini, G.; El-Baz, A.; et al. Prostate Tissue Characterization/Classification in 144 Patient Population Using Wavelet and Higher Order Spectra Features from Transrectal Ultrasound Images. Technol. Cancer Res. Treat. 2013, 12, 545–557. [Google Scholar] [CrossRef]
- Shrivastava, V.K.; Londhe, N.D.; Sonawane, R.S.; Suri, J.S. Reliable and accurate psoriasis disease classification in dermatology images using comprehensive feature space in machine learning paradigm. Expert Syst. Appl. 2015, 42, 6184–6195. [Google Scholar] [CrossRef]
- Shrivastava, V.K.; Londhe, N.D.; Sonawane, R.S.; Suri, J.S. A novel and robust Bayesian approach for segmentation of psoriasis lesions and its risk stratification. Comput. Methods Programs Biomed. 2017, 150, 9–22. [Google Scholar] [CrossRef]
- Agarwal, M.; Saba, L.; Gupta, S.K.; Johri, A.M.; Khanna, N.N.; Mavrogeni, S.; Laird, J.R.; Pareek, G.; Miner, M.; Sfikakis, P.P.; et al. Wilson disease tissue classification and characterization using seven artificial intelligence models embedded with 3D optimization paradigm on a weak training brain magnetic resonance imaging datasets: A supercomputer application. Med. Biol. Eng. Comput. 2021, 59, 511–533. [Google Scholar] [CrossRef]
- Sharma, A.M.; Gupta, A.; Kumar, P.K.; Rajan, J.; Saba, L.; Nobutaka, I.; Laird, J.R.; Nicolades, A.; Suri, J.S. A Review on Carotid Ultrasound Atherosclerotic Tissue Characterization and Stroke Risk Stratification in Machine Learning Framework. Curr. Atheroscler. Rep. 2015, 17, 55. [Google Scholar] [CrossRef]
- Biswas, M.; Kuppili, V.; Araki, T.; Edla, D.R.; Godia, E.C.; Saba, L.; Suri, H.S.; Omerzu, T.; Laird, J.R.; Khanna, N.N.; et al. Deep learning strategy for accurate carotid intima-media thickness measurement: An ultrasound study on Japanese diabetic cohort. Comput. Biol. Med. 2018, 98, 100–117. [Google Scholar] [CrossRef] [Green Version]
- Yan, H.; Parsons, D.W.; Jin, G.; McLendon, R.; Rasheed, B.A.; Yuan, W.; Kos, I.; Batinic-Haberle, I.; Jones, S.; Riggins, G.J.; et al. IDH1 and IDH2 Mutations in Gliomas. N. Engl. J. Med. 2009, 360, 765–773. [Google Scholar] [CrossRef]
- Arita, H.; Yamasaki, K.; Matsushita, Y.; Nakamura, T.; Shimokawa, A.; Takami, H.; Tanaka, S.; Mukasa, A.; Shirahata, M.; Shimizu, S.; et al. A combination of TERT promoter mutation and MGMT methylation status predicts clinically relevant subgroups of newly diagnosed glioblastomas. Acta Neuropathol. Commun. 2016, 4, 79. [Google Scholar] [CrossRef] [PubMed] [Green Version]
- Liu, W.; James, C.D.; Frederick, L.; Alderete, B.E.; Jenkins, R.B. PTEN/MMAC1 mutations and EGFR amplification in glioblastomas. Cancer Res. 1997, 57, 5254–5257. [Google Scholar] [PubMed]
- Xu, J.; Guo, X.; Jing, M.; Sun, T. Prediction of tumor mutation burden in breast cancer based on the expression of ER, PR, HER-2, and Ki-67. OncoTargets Ther. 2018, 11, 2269–2275. [Google Scholar] [CrossRef] [PubMed] [Green Version]
- Zeng, J.B.; Song, Y.; Wang, Y.; Shi, Y.Y. Rb1 gene mutations in osteosarcoma. Chin. J. Cancer Res. 1999, 11, 217. [Google Scholar] [CrossRef]
- Wan, Y.C.E.; Liu, J.; Chan, K.M. Histone H3 Mutations in Cancer. Curr. Pharmacol. Rep. 2018, 4, 292–300. [Google Scholar] [CrossRef] [Green Version]
- Schenkel, L.C.; Kernohan, K.D.; McBride, A.; Reina, D.; Hodge, A.; Ainsworth, P.J.; Rodenhiser, D.I.; Pare, G.; Bérubé, N.G.; Skinner, C.; et al. Identification of epigenetic signature associated with alpha thalassemia/mental retardation X-linked syndrome. Epigenet. Chromatin 2017, 10, 10. [Google Scholar] [CrossRef] [Green Version]
- Maldonado, J.L.; Fridlyand, J.; Patel, H.; Jain, A.N.; Busam, K.; Kageshita, T.; Ono, T.; Albertson, D.G.; Pinkel, D.; Bastian, B.C. Determinants of BRAF mutations in primary melanomas. J. Natl. Cancer Inst. 2003, 95, 1878–1890. [Google Scholar] [CrossRef] [Green Version]
- Sun, Z.; Shi, Y.; Shen, Y.; Cao, L.; Zhang, W.; Guan, X. Analysis of different HER-2 mutations in breast cancer progression and drug resistance. J. Cell. Mol. Med. 2015, 19, 2691–2701. [Google Scholar] [CrossRef]
- Petrowsky, H.; Sturm, I.; Graubitz, O.; Kooby, D.A.; Staib-Sebler, E.; Gog, C.; Köhne, C.H.; Hillebrand, T.; Daniel, P.T.; Fong, Y.; et al. Relevance of Ki-67 antigen expression and K-ras mutation in colorectal liver metastases. Eur. J. Surg. Oncol. 2001, 27, 80–87. [Google Scholar] [CrossRef]
- Huang, R.S.P.; Haberberger, J.; Severson, E.; Duncan, D.L.; Hemmerich, A.; Edgerly, C.; Ferguson, N.L.; Williams, E.; Elvin, J.; Vergilio, J.A.; et al. A pan-cancer analysis of PD-L1 immunohistochemistry and gene amplification, tumor mutation burden and microsatellite instability in 48,782 cases. Mod. Pathol. 2021, 34, 252–263. [Google Scholar] [CrossRef]
- Rasmussen, S.A.; Friedman, J.M. NF1 gene and neurofibromatosis 1. Am. J. Epidemiol. 2000, 151, 33–40. [Google Scholar] [CrossRef] [PubMed] [Green Version]
- Pattabiraman, D.R.; Gonda, T.J. Role and potential for therapeutic targeting of MYB in leukemia. Leukemia 2013, 27, 269–277. [Google Scholar] [CrossRef] [PubMed] [Green Version]
- Antoniou, A.; Pharoah, P.D.P.; Narod, S.; Risch, H.A.; Eyfjord, J.E.; Hopper, J.L.; Loman, N.; Olsson, H.; Johannsson, O.; Borg, Å.; et al. Average risks of breast and ovarian cancer associated with BRCA1 or BRCA2 mutations detected in case series unselected for family history: A combined analysis of 22 studies. Am. J. Hum. Genet. 2003, 72, 1117–1130. [Google Scholar] [CrossRef] [PubMed] [Green Version]
- Chan, A.K.; Han, S.J.; Choy, W.; Beleford, D.; Aghi, M.K.; Berger, M.S.; Shieh, J.T.; Bollen, A.W.; Perry, A.; Phillips, J.J.; et al. Familial melanoma-astrocytoma syndrome: Synchronous diffuse astrocytoma and pleomorphic xanthoastrocytoma in a patient with germline CDKN2A/B deletion and a significant family history. Clin. Neuropathol. 2017, 36, 213–221. [Google Scholar] [CrossRef] [Green Version]
- Bonadona, V.; Bonaïti, B.; Olschwang, S.; Grandjouan, S.; Huiart, L.; Longy, M.; Guimbaud, R.; Buecher, B.; Bignon, Y.-J.; Caron, O.; et al. Cancer Risks Associated With Germline Mutations in MLH1, MSH2, and MSH6 Genes in Lynch Syndrome. JAMA 2013, 305, 2304–2310. [Google Scholar] [CrossRef]
- Hansford, S.; Kaurah, P.; Li-Chang, H.; Woo, M.; Senz, J.; Pinheiro, H.; Schrader, K.A.; Schaeffer, D.F.; Shumansky, K.; Zogopoulos, G.; et al. Hereditary diffuse gastric cancer syndrome: CDH1 mutations and beyond. JAMA Oncol. 2015, 1, 23–32. [Google Scholar] [CrossRef] [Green Version]
- Karachaliou, N.; Mayo, C.; Costa, C.; Magrí, I.; Gimenez-Capitan, A.; Molina-Vila, M.A.; Rosell, R. KRAS mutations in lung cancer. Clin. Lung Cancer 2013, 14, 205–214. [Google Scholar] [CrossRef]
- Heidenreich, B.; Rachakonda, P.S.; Hemminki, K.; Kumar, R. TERT promoter mutations in cancer development. Curr. Opin. Genet. Dev. 2014, 24, 30–37. [Google Scholar] [CrossRef]
- Mukherjee, S.; Stroberg, E.; Wang, F.; Morales, L.; Shan, Y.; Rao, A.; Huang, J.H.; Wu, E.; Fonkem, E. SMARCB1 gene mutation predisposes to earlier development of glioblastoma: A case report of familial GBM. J. Neuropathol. Exp. Neurol. 2020, 79, 562–565. [Google Scholar] [CrossRef] [Green Version]
- Yamamoto, H.; Miyamoto, Y.; Nishihara, Y.; Kojima, A.; Imamura, M.; Kishikawa, K.; Takase, Y.; Ario, K.; Oda, Y.; Tsuneyoshi, M. Primary gastrointestinal stromal tumor of the liver with PDGFRA gene mutation. Hum. Pathol. 2010, 41, 605–609. [Google Scholar] [CrossRef]
- Pinker, K.; Chin, J.; Melsaether, A.N.; Morris, E.A.; Moy, L. Precision medicine and radiogenomics in breast cancer: New approaches toward diagnosis and treatment. Radiology 2018, 287, 732–747. [Google Scholar] [CrossRef] [PubMed]
- Shui, L.; Ren, H.; Yang, X.; Li, J.; Chen, Z.; Yi, C.; Zhu, H.; Shui, P. The Era of Radiogenomics in Precision Medicine: An Emerging Approach to Support Diagnosis, Treatment Decisions, and Prognostication in Oncology. Front. Oncol. 2021, 10, 3195. [Google Scholar] [CrossRef] [PubMed]
- Porcu, M.; Solinas, C.; Mannelli, L.; Micheletti, G.; Lambertini, M.; Willard-Gallo, K.; Neri, E.; Flanders, A.E.; Saba, L. Radiomics and “radi-…omics” in cancer immunotherapy: A guide for clinicians. Crit. Rev. Oncol./Hematol. 2020, 154, 103068. [Google Scholar] [CrossRef] [PubMed]
- Panayides, A.S.; Pattichis, M.S.; Leandrou, S.; Pitris, C.; Constantinidou, A.; Pattichis, C.S. Radiogenomics for Precision Medicine with a Big Data Analytics Perspective. IEEE J. Biomed. Health Inform. 2019, 23, 2063–2079. [Google Scholar] [CrossRef] [PubMed]
- Hudson, K.; Lifton, R.; Patrick-Lake, B.; Burchard, E.G.; Coles, T.; Collins, R.; Conrad, A. The Precision Medicine Initiative Cohort Program—Building a Research Foundation for 21st Century Medicine. Precision Medicine Initiative (PMI) Working Group Report to the Advisory Committee to the Director. 2015. Available online: https://www.acd.od.nih.gov/documents/presentations/09172015-PMI.pdf (accessed on 12 March 2022).
- Banerjee, S.; Wang, D.S.; Kim, H.J.; Sirlin, C.B.; Chan, M.G.; Korn, R.L.; Rutman, A.M.; Siripongsakun, S.; Lu, D.; Imanbayev, G.; et al. A computed tomography radiogenomic biomarker predicts microvascular invasion and clinical outcomes in hepatocellular carcinoma. Hepatology 2015, 62, 792–800. [Google Scholar] [CrossRef] [PubMed]
- Moussa, A.M.; Ziv, E. Radiogenomics in Interventional Oncology. Curr. Oncol. Rep. 2021, 23, 11912. [Google Scholar] [CrossRef] [PubMed]
- Barnett, G.C.; Coles, C.E.; Elliott, R.M.; Baynes, C.; Luccarini, C.; Conroy, D.; Wilkinson, J.S.; Tyrer, J.; Misra, V.; Platte, R.; et al. Independent validation of genes and polymorphisms reported to be associated with radiation toxicity: A prospective analysis study. Lancet Oncol. 2012, 13, 65–77. [Google Scholar] [CrossRef]
- Pinker, K.; Shitano, F.; Sala, E.; Do, R.K.; Young, R.J.; Wibmer, A.G.; Hricak, H.; Sutton, E.J.; Morris, E.A. Background, current role, and potential applications of radiogenomics. J. Magn. Reson. Imaging 2018, 47, 604–620. [Google Scholar] [CrossRef]
- Esteva, A.; Kuprel, B.; Novoa, R.A.; Ko, J.; Swetter, S.M.; Blau, H.M.; Thrun, S. Dermatologist-level classification of skin cancer with deep neural networks. Nature 2017, 542, 115–118. [Google Scholar] [CrossRef]
- Collins, G.S.; Reitsma, J.B.; Altman, D.G.; Moons, K.G.M. Transparent Reporting of a multivariable prediction model for Individual Prognosis Or Diagnosis (TRIPOD): The TRIPOD Statement. Br. J. Surg. 2015, 102, 148–158. [Google Scholar] [CrossRef] [Green Version]
- Morin, O.; Vallières, M.; Jochems, A.; Woodruff, H.C.; Valdes, G.; Braunstein, S.E.; Wildberger, J.E.; Villanueva-Meyer, J.E.; Kearney, V.; Yom, S.S.; et al. A Deep Look Into the Future of Quantitative Imaging in Oncology: A Statement of Working Principles and Proposal for Change. Int. J. Radiat. Oncol. Biol. Phys. 2018, 102, 1074–1082. [Google Scholar] [CrossRef] [PubMed]
- Boeckhout, M.; Zielhuis, G.A.; Bredenoord, A.L. The FAIR guiding principles for data stewardship: Fair enough? Eur. J. Hum. Genet. 2018, 26, 931–936. [Google Scholar] [CrossRef] [PubMed] [Green Version]
- Liu, Z.; Keller, P.J. Emerging Imaging and Genomic Tools for Developmental Systems Biology. Dev. Cell 2016, 36, 597–610. [Google Scholar] [CrossRef] [PubMed] [Green Version]
- Abdel Razek, A.A.K.; Alksas, A.; Shehata, M.; AbdelKhalek, A.; Abdel Baky, K.; El-Baz, A.; Helmy, E. Clinical applications of artificial intelligence and radiomics in neuro-oncology imaging. Insights Imaging 2021, 12, 152. [Google Scholar] [CrossRef] [PubMed]
- Rudie, J.D.; Rauschecker, A.M.; Bryan, R.N.; Davatzikos, C.; Mohan, S. Emerging Applications of Artificial Intelligence in Neuro-Oncology. Radiology 2019, 290, 607–618. [Google Scholar] [CrossRef] [PubMed]
- Xu, M.; Qiao, X.; Liu, S.; Li, Z.; Ji, C.; Li, H.; Shi, T.; Li, L.; Gu, Q.; Zhou, K.; et al. CT Radiomics for Predicting PD-L1 Expression on Tumor Cells in Gastric Cancer; Research Square: Dehan, NC, USA, 2021; pp. 1–15. [Google Scholar]
- El Naqa, I.; Kerns, S.L.; Coates, J.; Luo, Y.; Speers, C.; West, C.M.L.; Rosenstein, B.S.; Ten Haken, R.K. Radiogenomics and radiotherapy response modeling. Phys. Med. Biol. 2017, 62, R179–R206. [Google Scholar] [CrossRef] [PubMed]
- Mazurowski, M.A. Radiogenomics: What It Is and Why It Is Important. J. Am. Coll. Radiol. 2015, 12, 862–866. [Google Scholar] [CrossRef]
- Posts, R. AI Is Starting to Change Radiology, for Real; Subtle Medical: Menlo Park, CA, USA, 2022; pp. 1–17. [Google Scholar]
- Malhotra, Y. AI, Machine Learning & Deep Learning Risk Management & Controls: Beyond Deep Learning and Generative Adversarial Networks: Model Risk Management in AI, Machine Learning & Deep Learning: Princeton Presentations in AI-ML Risk Management & Control Systems (Presentation Slides). In Proceedings of the 2018 Princeton Fintech & Quant Conference, Princeton University, Princeton, NJ, USA, 21 April 2018. [Google Scholar] [CrossRef]
- Introduction to Machine Learning; MIT Press: Cambridge, MA, USA, 2010; p. 108. ISBN 978-0-262-01243-0.
- Kent, J. In Brain Imaging, Deep Learning Beats Standard Machine Learning; Xtelligent Healthcare Media, LLC.: Danvers, MA, USA, 2021. [Google Scholar]
- Smedley, N.F.; Hsu, W. Using deep neural networks for radiogenomic analysis. In Proceedings of the 2018 IEEE 15th International Symposium on Biomedical Imaging, Washington, DC, USA, 4–7 April 2018; pp. 1529–1533. [Google Scholar] [CrossRef]
- Zhu, Z.; Albadawy, E.; Saha, A.; Zhang, J.; Harowicz, M.R.; Mazurowski, M.A. Deep learning for identifying radiogenomic associations in breast cancer. Comput. Biol. Med. 2019, 109, 85–90. [Google Scholar] [CrossRef] [Green Version]
- Gutman, D.C.; Young, R.J. IDH glioma radiogenomics in the era of deep learning. Neuro-Oncology 2021, 23, 182–183. [Google Scholar] [CrossRef]
- Hatt, M.; Parmar, C.; Qi, J.; El Naqa, I. Machine (Deep) Learning Methods for Image Processing and Radiomics. IEEE Trans. Radiat. Plasma Med. Sci. 2019, 3, 104–108. [Google Scholar] [CrossRef]
- Visvikis, D.; Cheze Le Rest, C.; Jaouen, V.; Hatt, M. Artificial intelligence, machine (deep) learning and radio(geno)mics: Definitions and nuclear medicine imaging applications. Eur. J. Nucl. Med. Mol. Imaging 2019, 46, 2630–2637. [Google Scholar] [CrossRef] [PubMed]
- Van Dijk, L.V.; Fuller, C.D. Artificial Intelligence and Radiomics in Head and Neck Cancer Care: Opportunities, Mechanics, and Challenges. Am. Soc. Clin. Oncol. Educ. Book 2021, 41, e225–e235. [Google Scholar] [CrossRef] [PubMed]
- Sung, H.; Ferlay, J.; Siegel, R.L.; Laversanne, M.; Soerjomataram, I.; Jemal, A.; Bray, F. Global Cancer Statistics 2020: GLOBOCAN Estimates of Incidence and Mortality Worldwide for 36 Cancers in 185 Countries. CA Cancer J. Clin. 2021, 71, 209–249. [Google Scholar] [CrossRef] [PubMed]
- Abajian, A.; Murali, N.; Savic, L.J.; Laage-Gaupp, F.M.; Nezami, N.; Duncan, J.S.; Schlachter, T.; Lin, M.; Geschwind, J.-F.; Chapiro, J. Predicting Treatment Response to Intra-arterial Therapies for Hepatocellular Carcinoma with the Use of Supervised Machine Learning—An Artificial Intelligence Concept. J. Vasc. Interv. Radiol. 2018, 29, 850–857.e1. [Google Scholar] [CrossRef] [PubMed]
- Topol, E.J. High-performance medicine: The convergence of human and artificial intelligence. Nat. Med. 2019, 25, 44–56. [Google Scholar] [CrossRef] [PubMed]
- Ahuja, A.S. The impact of artificial intelligence in medicine on the future role of the physician. PeerJ 2019, 7, e7702. [Google Scholar] [CrossRef]
- Briganti, G.; Le Moine, O. Artificial Intelligence in Medicine: Today and Tomorrow. Front. Med. 2020, 7, 27. [Google Scholar] [CrossRef]
- Li, H.; Giger, M.L.; Huynh, B.Q.; Antropova, N.O. Deep learning in breast cancer risk assessment: Evaluation of convolutional neural networks on a clinical dataset of full-field digital mammograms. J. Med. Imaging 2017, 4, 041304. [Google Scholar] [CrossRef]
- Saha, A.; Harowicz, M.R.; Grimm, L.J.; Kim, C.E.; Ghate, S.V.; Walsh, R.; Mazurowski, M.A. A machine learning approach to radiogenomics of breast cancer: A study of 922 subjects and 529 dce-mri features. Br. J. Cancer 2018, 119, 508–516. [Google Scholar] [CrossRef] [Green Version]
- Park, E.K.; Lee, K.-S.; Seo, B.K.; Cho, K.R.; Woo, O.H.; Son, G.S.; Lee, H.Y.; Chang, Y.W. Machine Learning Approaches to Radiogenomics of Breast Cancer using Low-Dose Perfusion Computed Tomography: Predicting Prognostic Biomarkers and Molecular Subtypes. Sci. Rep. 2019, 9, 17847. [Google Scholar] [CrossRef]
- Yeh, A.C.; Li, H.; Zhu, Y.; Zhang, J.; Khramtsova, G.; Drukker, K.; Edwards, A.; McGregor, S.; Yoshimatsu, T.; Zheng, Y.; et al. Radiogenomics of breast cancer using dynamic contrast enhanced MRI and gene expression profiling. Cancer Imaging 2019, 19, 48. [Google Scholar] [CrossRef] [PubMed] [Green Version]
- Hsieh, K.L.C.; Chen, C.Y.; Lo, C.M. Radiomic model for predicting mutations in the isocitrate dehydrogenase gene in glioblastomas. Oncotarget 2017, 8, 45888–45897. [Google Scholar] [CrossRef] [PubMed] [Green Version]
- Li, Z.; Wang, Y.; Yu, J.; Guo, Y.; Cao, W. Deep Learning based Radiomics (DLR) and its usage in noninvasive IDH1 prediction for low grade glioma. Sci. Rep. 2017, 7, 5467. [Google Scholar] [CrossRef] [PubMed]
- Le, N.Q.K.; Do, D.T.; Chiu, F.Y.; Yapp, E.K.Y.; Yeh, H.Y.; Chen, C.Y. XGBoost improves classification of MGMT promoter methylation status in IDH1 wildtype glioblastoma. J. Pers. Med. 2020, 10, 128. [Google Scholar] [CrossRef]
- Hu, L.S.; Ning, S.; Eschbacher, J.M.; Baxter, L.C.; Gaw, N.; Ranjbar, S.; Plasencia, J.; Dueck, A.C.; Peng, S.; Smith, K.A.; et al. Radiogenomics to characterize regional genetic heterogeneity in glioblastoma. Neuro-Oncology 2017, 19, 128–137. [Google Scholar] [CrossRef] [Green Version]
- Moreno, S.; Bonfante, M.; Zurek, E.; Cherezov, D.; Goldgof, D.; Hall, L.; Schabath, M. A Radiogenomics Ensemble to Predict EGFR and KRAS Mutations in NSCLC. Tomography 2021, 7, 154–168. [Google Scholar] [CrossRef]
- Kirienko, M.; Sollini, M.; Corbetta, M.; Voulaz, E.; Gozzi, N.; Interlenghi, M.; Gallivanone, F.; Castiglioni, I.; Asselta, R.; Duga, S.; et al. Radiomics and gene expression profile to characterise the disease and predict outcome in patients with lung cancer. Eur. J. Nucl. Med. Mol. Imaging 2021, 48, 3643–3655. [Google Scholar] [CrossRef]
- Linning, E.; Lu, L.; Li, L.; Yang, H.; Schwartz, L.H.; Zhao, B. Radiomics for Classification of Lung Cancer Histological Subtypes Based on Nonenhanced Computed Tomography. Acad. Radiol. 2019, 26, 1245–1252. [Google Scholar] [CrossRef]
- Ardila, D.; Kiraly, A.P.; Bharadwaj, S.; Choi, B.; Reicher, J.J.; Peng, L.; Tse, D.; Etemadi, M.; Ye, W.; Corrado, G.; et al. End-to-end lung cancer screening with three-dimensional deep learning on low-dose chest computed tomography. Nat. Med. 2019, 25, 954–961. [Google Scholar] [CrossRef]
- Velazquez, E.R.; Parmar, C.; Liu, Y.; Coroller, T.P.; Cruz, G.; Stringfield, O.; Ye, Z.; Makrigiorgos, M.; Fennessy, F.; Mak, R.H.; et al. Somatic mutations drive distinct imaging phenotypes in lung cancer. Cancer Res. 2017, 77, 3922–3930. [Google Scholar] [CrossRef] [Green Version]
- Zhou, Y.; He, L.; Huang, Y.; Chen, S.; Wu, P.; Ye, W.; Liu, Z.; Liang, C. CT-based radiomics signature: A potential biomarker for preoperative prediction of early recurrence in hepatocellular carcinoma. Abdom. Radiol. 2017, 42, 1695–1704. [Google Scholar] [CrossRef] [PubMed]
- West, D.L.; Kotrotsou, A.; Niekamp, A.S.; Idris, T.; Giniebra Camejo, D.; Mazal, N.J.; Cardenas, N.J.; Goldberg, J.L.; Colen, R.R. CT-based radiomic analysis of hepatocellular carcinoma patients to predict key genomic information. J. Clin. Oncol. 2017, 35, e15623. [Google Scholar] [CrossRef]
- Blanc-Durand, P.; Van Der Gucht, A.; Jreige, M.; Nicod-Lalonde, M.; Silva-Monteiro, M.; Prior, J.O.; Denys, A.; Depeursinge, A.; Schaefer, N. Signature of survival: A 18F-FDG PET based whole-liver radiomic analysis predicts survival after 90Y-TARE for hepatocellular carcinoma. Oncotarget 2018, 9, 4549–4558. [Google Scholar] [CrossRef] [PubMed] [Green Version]
- Akai, H.; Yasaka, K.; Kunimatsu, A.; Nojima, M.; Kokudo, T.; Kokudo, N.; Hasegawa, K.; Abe, O.; Ohtomo, K.; Kiryu, S. Predicting prognosis of resected hepatocellular carcinoma by radiomics analysis with random survival forest. Diagn. Interv. Imaging 2018, 99, 643–651. [Google Scholar] [CrossRef]
- Penzias, G.; Singanamalli, A.; Elliott, R.; Gollamudi, J.; Shih, N.; Feldman, M.; Stricker, P.D.; Delprado, W.; Tiwari, S.; Böhm, M.; et al. Identifying the morphologic basis for radiomic features in distinguishing different Gleason grades of prostate cancer on MRI: Preliminary findings. PLoS ONE 2018, 13, e0200730. [Google Scholar] [CrossRef] [Green Version]
- Kesch, C.; Radtke, J.P.; Wintsche, A.; Wiesenfarth, M.; Luttje, M.; Gasch, C.; Dieffenbacher, S.; Pecqueux, C.; Teber, D.; Hatiboglu, G.; et al. Correlation between genomic index lesions and mpMRI and 68Ga-PSMA-PET/CT imaging features in primary prostate cancer. Sci. Rep. 2018, 8, 16708. [Google Scholar] [CrossRef] [Green Version]
- Iqbal, S.; Siddiqui, G.F.; Rehman, A.; Hussain, L.; Saba, T.; Tariq, U.; Abbasi, A.A. Prostate Cancer Detection Using Deep Learning and Traditional Techniques. IEEE Access 2021, 9, 27085–27100. [Google Scholar] [CrossRef]
- Castillo, T.J.M.; Arif, M.; Starmans, M.P.A.; Niessen, W.J.; Bangma, C.H.; Schoots, I.G.; Veenland, J.F. Classification of Clinically Significant Prostate Cancer on Multi-Parametric MRI: A Validation Study Comparing Deep Learning and Radiomics. Cancers 2021, 14, 12. [Google Scholar] [CrossRef]
- Chen, H.; Wang, X.; Zhao, F.; Chen, X.; Li, X.; Ning, G.; Guo, Y. A CT-based radiomics nomogram for predicting early recurrence in patients with high-grade serous ovarian cancer. Eur. J. Radiol. 2021, 145, 110018. [Google Scholar] [CrossRef]
- Hu, Y.; Weng, Q.; Xia, H.; Chen, T.; Kong, C.; Chen, W.; Pang, P.; Xu, M.; Lu, C.; Ji, J. A radiomic nomogram based on arterial phase of CT for differential diagnosis of ovarian cancer. Abdom. Radiol. 2021, 46, 2384–2392. [Google Scholar] [CrossRef]
- Song, X.L.; Ren, J.L.; Yao, T.Y.; Zhao, D.; Niu, J. Radiomics based on multisequence magnetic resonance imaging for the preoperative prediction of peritoneal metastasis in ovarian cancer. Eur. Radiol. 2021, 31, 8438–8446. [Google Scholar] [CrossRef] [PubMed]
- Wang, X.; Lu, Z. Radiomics Analysis of PET and CT Components of 18F-FDG PET/CT Imaging for Prediction of Progression-Free Survival in Advanced High-Grade Serous Ovarian Cancer. Front. Oncol. 2021, 11, 638124. [Google Scholar] [CrossRef] [PubMed]
- Vargas, H.A.; Huang, E.P.; Lakhman, Y.; Ippolito, J.E.; Bhosale, P.; Mellnick, V.; Shinagare, A.B.; Anello, M.; Kirby, J.; Fevrier-Sullivan, B.; et al. Radiogenomics of high-grade serous ovarian cancer: Multireader multi-institutional study from the cancer genome atlas ovarian cancer imaging research group. Radiology 2017, 285, 482–492. [Google Scholar] [CrossRef] [PubMed] [Green Version]
- Guo, F.; Gong, H.; Zhao, H.; Chen, J.; Zhang, Y.; Zhang, L.; Shi, X.; Zhang, A.; Jin, H.; Zhang, J.; et al. Mutation status and prognostic values of KRAS, NRAS, BRAF and PIK3CA in 353 Chinese colorectal cancer patients. Sci. Rep. 2018, 8, 6076. [Google Scholar] [CrossRef] [Green Version]
- Yang, L.; Dong, D.; Fang, M.; Zhu, Y.; Zang, Y.; Liu, Z.; Zhang, H.; Ying, J.; Zhao, X.; Tian, J. Can CT-based radiomics signature predict KRAS/NRAS/BRAF mutations in colorectal cancer? Eur. Radiol. 2018, 28, 2058–2067. [Google Scholar] [CrossRef]
- Shin, Y.R.; Kim, K.A.; Im, S.; Hwang, S.S.; Kim, K. Prediction of kras mutation in rectal cancer using mri. Anticancer Res. 2016, 36, 4799–4804. [Google Scholar] [CrossRef] [Green Version]
- He, J. Comparison of PET conventional parameters and PET texture parameters for predicting KRAS gene mutation in colorectal cancer. J. Nucl. Med. 2018, 59, 1393. [Google Scholar]
- Pershad, Y.; Govindan, S.; Hara, A.; Borad, M.; Bekaii-Saab, T.; Wallace, A.; Albadawi, H.; Oklu, R. Using Naïve Bayesian Analysis to Determine Imaging Characteristics of KRAS Mutations in Metastatic Colon Cancer. Diagnostics 2017, 7, 50. [Google Scholar] [CrossRef]
- Feng, Q.X.; Liu, C.; Qi, L.; Sun, S.W.; Song, Y.; Yang, G.; Zhang, Y.D.; Liu, X.S. An Intelligent Clinical Decision Support System for Preoperative Prediction of Lymph Node Metastasis in Gastric Cancer. J. Am. Coll. Radiol. 2019, 16, 952–960. [Google Scholar] [CrossRef]
- Xue, B.; Jiang, J.; Chen, L.; Wu, S.; Zheng, X.; Zheng, X.; Tang, K. Development and Validation of a Radiomics Model Based on 18F-FDG PET of Primary Gastric Cancer for Predicting Peritoneal Metastasis. Front. Oncol. 2021, 11, 740111. [Google Scholar] [CrossRef]
- Sun, K.Y.; Hu, H.T.; Chen, S.L.; Ye, J.N.; Li, G.H.; Chen, L.D.; Peng, J.J.; Feng, S.T.; Yuan, Y.J.; Hou, X.; et al. CT-based radiomics scores predict response to neoadjuvant chemotherapy and survival in patients with gastric cancer. BMC Cancer 2020, 20, 1–11. [Google Scholar] [CrossRef] [PubMed] [Green Version]
- Gao, X.; Ma, T.; Cui, J.; Zhang, Y.; Wang, L.; Li, H.; Ye, Z. A radiomics-based model for prediction of lymph node metastasis in gastric cancer. Eur. J. Radiol. 2020, 129, 109069. [Google Scholar] [CrossRef] [PubMed]
- Singh, G.; Manjila, S.; Sakla, N.; True, A.; Wardeh, A.H.; Beig, N.; Vaysberg, A.; Matthews, J.; Prasanna, P.; Spektor, V. Radiomics and radiogenomics in gliomas: A contemporary update. Br. J. Cancer 2021, 125, 641–657. [Google Scholar] [CrossRef] [PubMed]
- Liu, Z.; Wu, K.; Wu, B.; Tang, X.; Yuan, H.; Pang, H.; Huang, Y.; Zhu, X.; Luo, H.; Qi, Y. Imaging genomics for accurate diagnosis and treatment of tumors: A cutting edge overview. Biomed. Pharmacother. 2021, 135, 111173. [Google Scholar] [CrossRef]
- Singh, A.; Chitalia, R.; Kontos, D. Radiogenomics in brain, breast, and lung cancer: Opportunities and challenges. J. Med. Imaging 2021, 8, 031907. [Google Scholar] [CrossRef]
- Wong, C.W.; Chaudhry, A. Radiogenomics of lung cancer. J. Thorac. Dis. 2020, 12, 5104–5109. [Google Scholar] [CrossRef]
- Trivizakis, E.; Papadakis, G.Z.; Souglakos, I.; Papanikolaou, N.; Koumakis, L.; Spandidos, D.A.; Tsatsakis, A.; Karantanas, A.H.; Marias, K. Artificial intelligence radiogenomics for advancing precision and effectiveness in oncologic care (Review). Int. J. Oncol. 2020, 57, 43–53. [Google Scholar] [CrossRef]
- Nougaret, S.; McCague, C.; Tibermacine, H.; Vargas, H.A.; Rizzo, S.; Sala, E. Radiomics and radiogenomics in ovarian cancer: A literature review. Abdom. Radiol. 2021, 46, 2308–2322. [Google Scholar] [CrossRef]
- Lo Gullo, R.; Daimiel, I.; Morris, E.A.; Pinker, K. Combining molecular and imaging metrics in cancer: Radiogenomics. Insights Imaging 2020, 11, 1. [Google Scholar] [CrossRef]
- Ak, M.; Toll, S.A.; Hein, K.Z.; Colen, R.R.; Khatua, S. Evolving Role and Translation of Radiomics and Radiogenomics in Adult and Pediatric Neuro-Oncology. Am. J. Neuroradiol. 2021, 1–10. [Google Scholar] [CrossRef]
- de la Pinta, C.; Castillo, M.E.; Collado, M.; Galindo-Pumariño, C.; Peña, C. Radiogenomics: Hunting down liver metastasis in colorectal cancer patients. Cancers 2021, 13, 5547. [Google Scholar] [CrossRef] [PubMed]
- Sudeep, P.V.; Palanisamy, P.; Rajan, J.; Baradaran, H.; Saba, L.; Gupta, A.; Suri, J.S. Speckle reduction in medical ultrasound images using an unbiased non-local means method. Biomed. Signal Process. Control 2016, 28, 1–8. [Google Scholar] [CrossRef]
- Ger, R.B.; Zhou, S.; Chi, P.C.M.; Lee, H.J.; Layman, R.R.; Jones, A.K.; Goff, D.L.; Fuller, C.D.; Howell, R.M.; Li, H.; et al. Comprehensive Investigation on Controlling for CT Imaging Variabilities in Radiomics Studies. Sci. Rep. 2018, 8, 13047. [Google Scholar] [CrossRef] [PubMed] [Green Version]
- Skandha, S.S.; Nicolaides, A.; Gupta, S.K.; Koppula, V.K.; Saba, L.; Johri, A.M.; Kalra, M.S.; Suri, J.S. A hybrid deep learning paradigm for carotid plaque tissue characterization and its validation in multicenter cohorts using a supercomputer framework. Comput. Biol. Med. 2022, 141, 105131. [Google Scholar] [CrossRef]
- Saba, L.; Sanagala, S.S.; Gupta, S.K.; Koppula, V.K.; Laird, J.R.; Viswanathan, V.; Sanches, M.J.; Kitas, G.D.; Johri, A.M.; Sharma, N.; et al. A Multicenter Study on Carotid Ultrasound Plaque Tissue Characterization and Classification Using Six Deep Artificial Intelligence Models: A Stroke Application. IEEE Trans. Instrum. Meas. 2021, 70, 2505312. [Google Scholar] [CrossRef]
- Tandel, G.S.; Balestrieri, A.; Jujaray, T.; Khanna, N.N.; Saba, L.; Suri, J.S. Multiclass magnetic resonance imaging brain tumor classification using artificial intelligence paradigm. Comput. Biol. Med. 2020, 122, 103804. [Google Scholar] [CrossRef]
- Cuocolo, R.; Caruso, M.; Perillo, T.; Ugga, L.; Petretta, M. Machine Learning in oncology: A clinical appraisal. Cancer Lett. 2020, 481, 55–62. [Google Scholar] [CrossRef]
- Elmore, J.G.; Nelson, H.D.; Pepe, M.S.; Longton, G.M.; Tosteson, A.N.A.; Geller, B.; Onega, T.; Carney, P.A.; Jackson, S.L.; Allison, K.H.; et al. Variability in pathologists’ interpretations of individual breast biopsy slides: A population perspective. Ann. Intern. Med. 2016, 164, 649–655. [Google Scholar] [CrossRef]
- Challen, R.; Denny, J.; Pitt, M.; Gompels, L.; Edwards, T.; Tsaneva-Atanasova, K. Artificial intelligence, bias and clinical safety. BMJ Qual. Saf. 2019, 28, 231–237. [Google Scholar] [CrossRef]


| SN | Cross-Validation Type | Brief Description |
|---|---|---|
| 1 | Leave one out cross-validation | An extreme type of CV that leaves one data sample out of the total data sample, then n − 1 samples are used to train the model and one sample is used as the validation set. |
| 2 | Hold-out cross-validation | This is the usual train/test split of the dataset is a CV technique in which the dataset is arbitrarily partitioned into 2 parts of training and testing (validation). |
| 3 | k-fold cross-validation | In the k-fold cross-validation, the dataset is partitioned into k parts such that each time, one of the k parts is used as the training set and the other k − 1 subsets as the validation set. |
| 4 | Stratified k-fold cross-validation | It is a small variation of k-fold CV, in which each fold contains approximately the same strata of samples. |
| 5 | Nested cross-validation | Otherwise known as double cross-validation, in which k-fold cross-validation is employed within each fold of cross-validation often to tune the hyperparameters during model evaluation. |
| SN | Performance Matrix | Description |
|---|---|---|
| 1 | Accuracy | It is set out as the number of correct predictions made as a ratio of all predictions made. |
| 2 | Sensitivity or Recall | It is defined as the number of positive predictions made. |
| 3 | Specificity | It is defined as the number of negative predictions made. |
| 4 | Precision | It is defined as the number of correct positive results divided by the number of positive results predicted by the classifier. |
| 6 | F1-Score | It is defined as the weighted average of precision and recall. |
| 7 | Area under ROC curve (AUC) | It is a probabilistic measure that defines how much the model is capable of distinguishing between classes. |
| 8 | Kaplan-Meier Curve | It is the visual representation of the function that shows the probability of an event at a respective time interval. |
| 9 | Mean Absolute Error (MAE) | It is defined as the average of the difference between the ground truth and the predicted values by the regression model. |
| 10 | Mean Square Error (MSE) | It is defined as the average of the squared difference between the target value and the predicted value by the regression model. |
| 11 | R2 (R-Squared) | It is defined as the statistical measure of fit that indicates how much total variation of a dependent variable is explained by the independent variable by the regression model. |
| Discussion of Fundamentals of Various AI Components | Radiogenomics Components | ||||||||
|---|---|---|---|---|---|---|---|---|---|
| Citation | Year | Anatomical Cancers Discussed | PM | CV | ML/DL | Conv. Radiomics | Deep Radiomics | Essential Genotypes | Dataset |
| Singh et al. [168] | 2021 | Brain | ✗ | ✗ | ✓ | ✓ | ✓ | ✓ | ✓ |
| Razek et al. [113] | 2021 | Brain | ✗ | ✗ | ✓ | ✓ | ✓ | ✓ | ✓ |
| Liu et al. [169] | 2021 | Gastrointestinal, Lung, Liver, Ovarian, Renal, Head and Neck, | ✗ | ✗ | ✗ | ✓ | ✓ | ✓ | ✗ |
| Singh et al. [170] | 2021 | Brain, Breast, Lung | ✓ | ✗ | ✓ | ✓ | ✓ | ✓ | ✓ |
| Wong et al. [171] | 2020 | Lung | ✗ | ✗ | ✗ | ✓ | ✓ | ✓ | ✗ |
| Trivizakis et al. [172] | 2020 | Breast, Pancreatic, Oral, Bladder, Head and neck, Rhabdomyosarcoma, | ✓ | ✗ | ✗ | ✗ | ✓ | ✓ | ✗ |
| Nougaret et al. [173] | 2020 | Ovarian | ✗ | ✓ | ✓ | ✓ | ✗ | ✓ | ✗ |
| Gullo et al. [174] | 2020 | Breast, Brain, Lung, Gynecological, Liver, Kidney, and Prostate | ✗ | ✗ | ✗ | ✓ | ✗ | ✓ | ✓ |
| Bodalal et al. [4] | 2019 | Brain, Lung, Breast, Ovaries, Liver, Kidney, Colorectal, Prostate | ✗ | ✗ | ✗ | ✓ | ✓ | ✓ | ✗ |
| Pinker et al. [99] | 2018 | Breast | ✗ | ✗ | ✓ | ✓ | ✗ | ✓ | ✗ |
| Proposed Review | Brain, Breast, Lung, Liver, Colorectal, Gastric, Prostrate, Ovarian | ✓ | ✓ | ✓ | ✓ | ✓ | ✓ | ✓ | |
Publisher’s Note: MDPI stays neutral with regard to jurisdictional claims in published maps and institutional affiliations. |
© 2022 by the authors. Licensee MDPI, Basel, Switzerland. This article is an open access article distributed under the terms and conditions of the Creative Commons Attribution (CC BY) license (https://creativecommons.org/licenses/by/4.0/).
Share and Cite
Saxena, S.; Jena, B.; Gupta, N.; Das, S.; Sarmah, D.; Bhattacharya, P.; Nath, T.; Paul, S.; Fouda, M.M.; Kalra, M.; et al. Role of Artificial Intelligence in Radiogenomics for Cancers in the Era of Precision Medicine. Cancers 2022, 14, 2860. https://doi.org/10.3390/cancers14122860
Saxena S, Jena B, Gupta N, Das S, Sarmah D, Bhattacharya P, Nath T, Paul S, Fouda MM, Kalra M, et al. Role of Artificial Intelligence in Radiogenomics for Cancers in the Era of Precision Medicine. Cancers. 2022; 14(12):2860. https://doi.org/10.3390/cancers14122860
Chicago/Turabian StyleSaxena, Sanjay, Biswajit Jena, Neha Gupta, Suchismita Das, Deepaneeta Sarmah, Pallab Bhattacharya, Tanmay Nath, Sudip Paul, Mostafa M. Fouda, Manudeep Kalra, and et al. 2022. "Role of Artificial Intelligence in Radiogenomics for Cancers in the Era of Precision Medicine" Cancers 14, no. 12: 2860. https://doi.org/10.3390/cancers14122860