
Sulforaphane Inhibits the Expression of Long Noncoding RNA H19 and Its Target APOBEC3G and Thereby Pancreatic Cancer Progression


 , and
, and 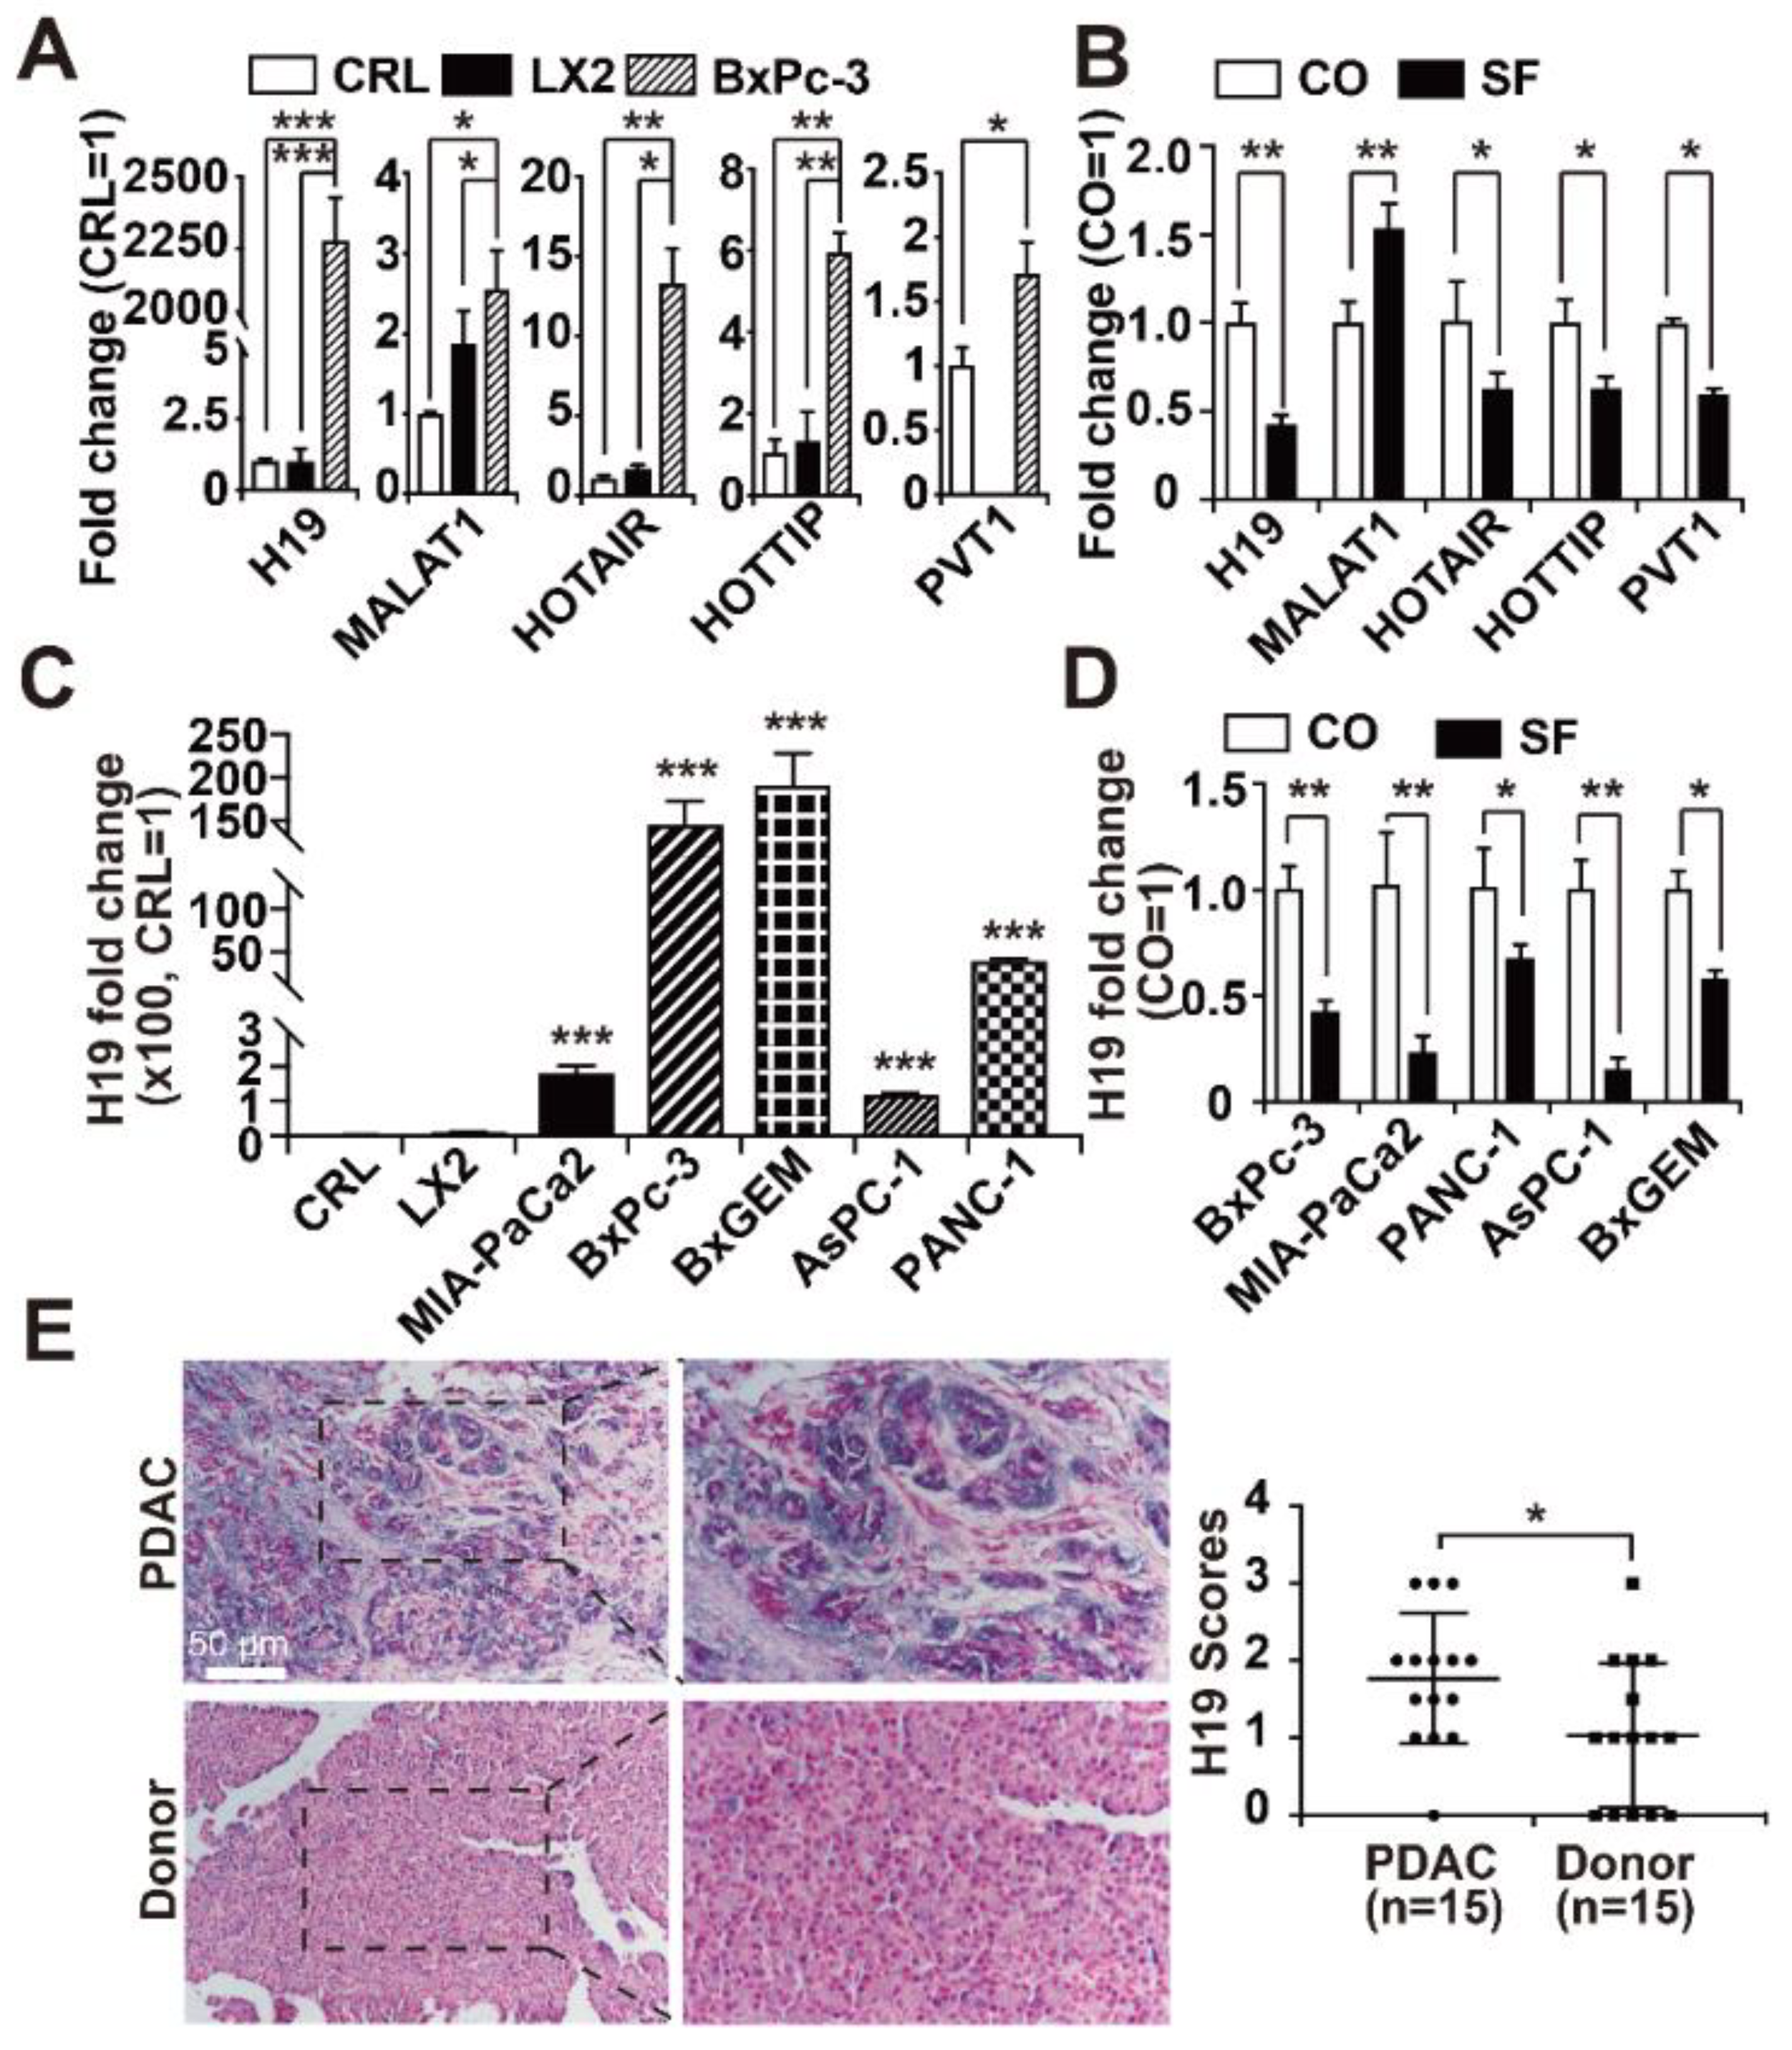
Abstract
:Simple Summary
Abstract
1. Introduction
2. Materials and Methods
2.1. Tumor Cell Lines
2.2. Patient Tissue
2.3. Reagents
2.4. Small Interference RNA Transfection
2.5. Cell Viability Assay
2.6. Transwell Migration Assay
2.7. Colony Forming Assay
2.8. Wound Healing Assay
2.9. Western Blot Analyses
2.10. mRNA Microarray Profiling
2.11. In Silico Analysis
2.12. RNA Extraction and qRT-PCR
2.13. Detection of H19 Expression by In Situ Hybridization
2.14. Immunohistochemical Staining
2.15. Tumor Xenotransplantation on Fertilized Chicken Eggs
2.16. Statistical Analysis
3. Results
3.1. H19 Levels are Enhanced in PDAC and Inhibited by Sulforaphane
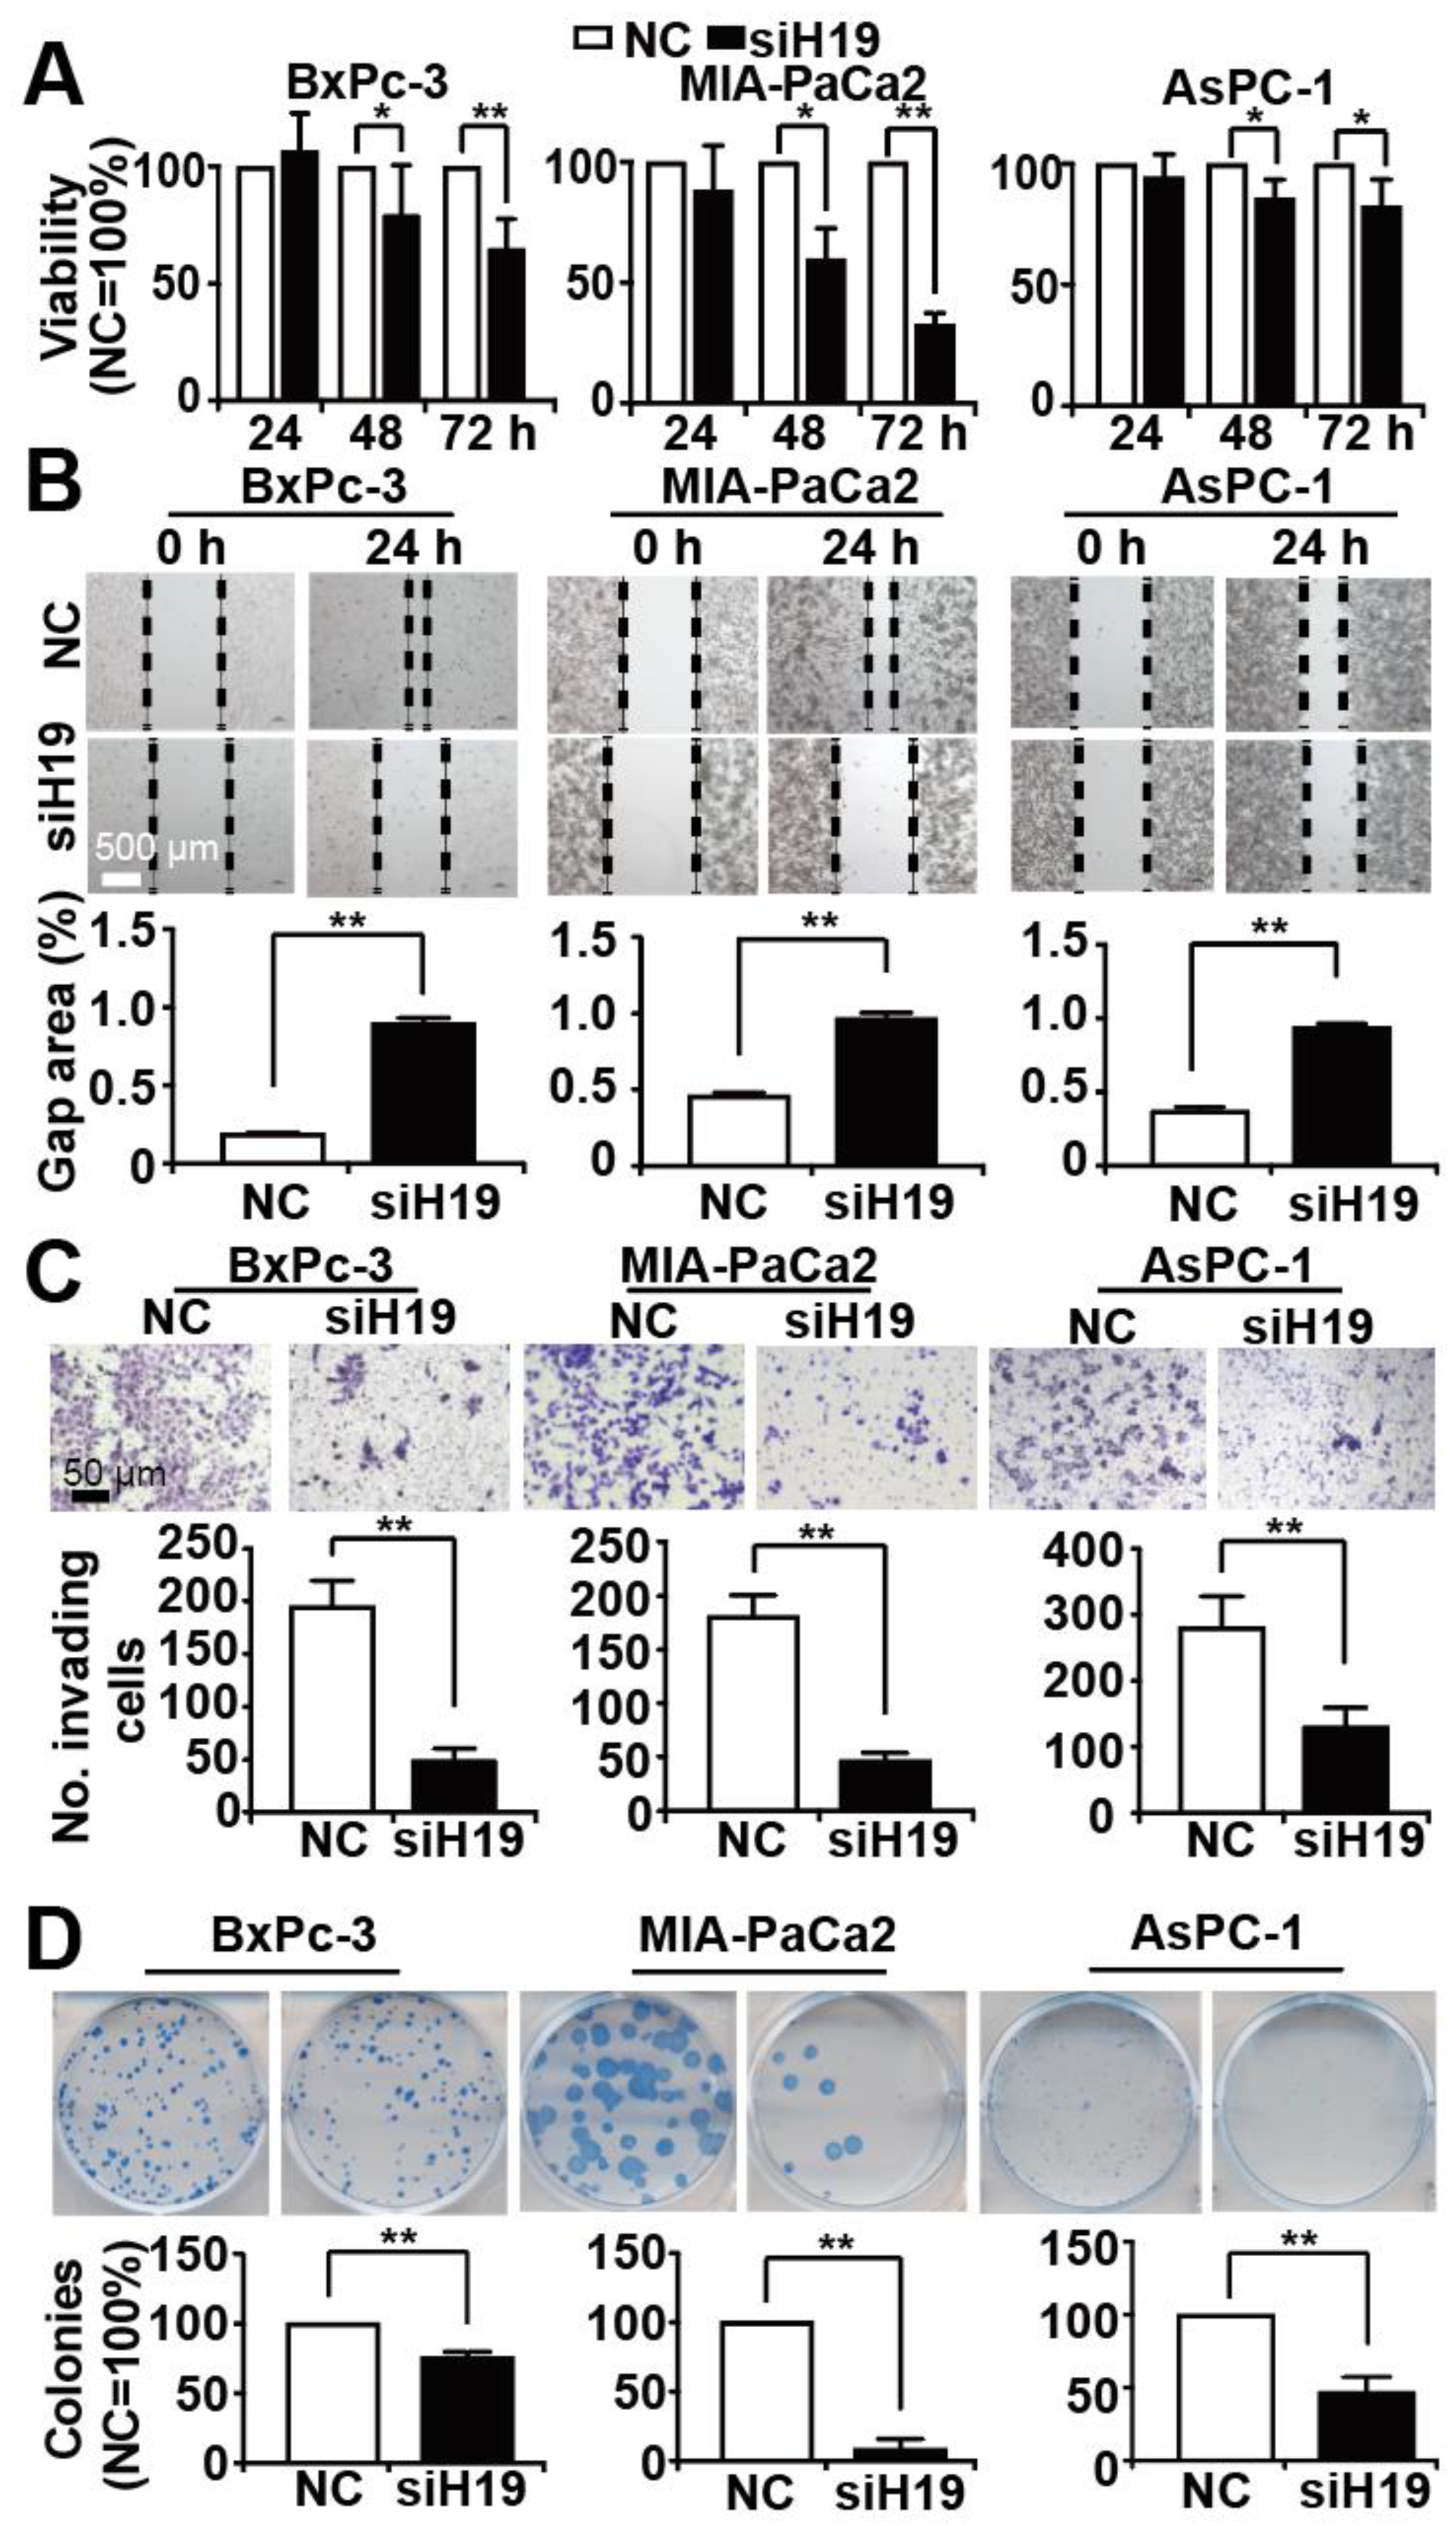
3.2. Knockdown of H19 Inhibits Tumor Progression Features
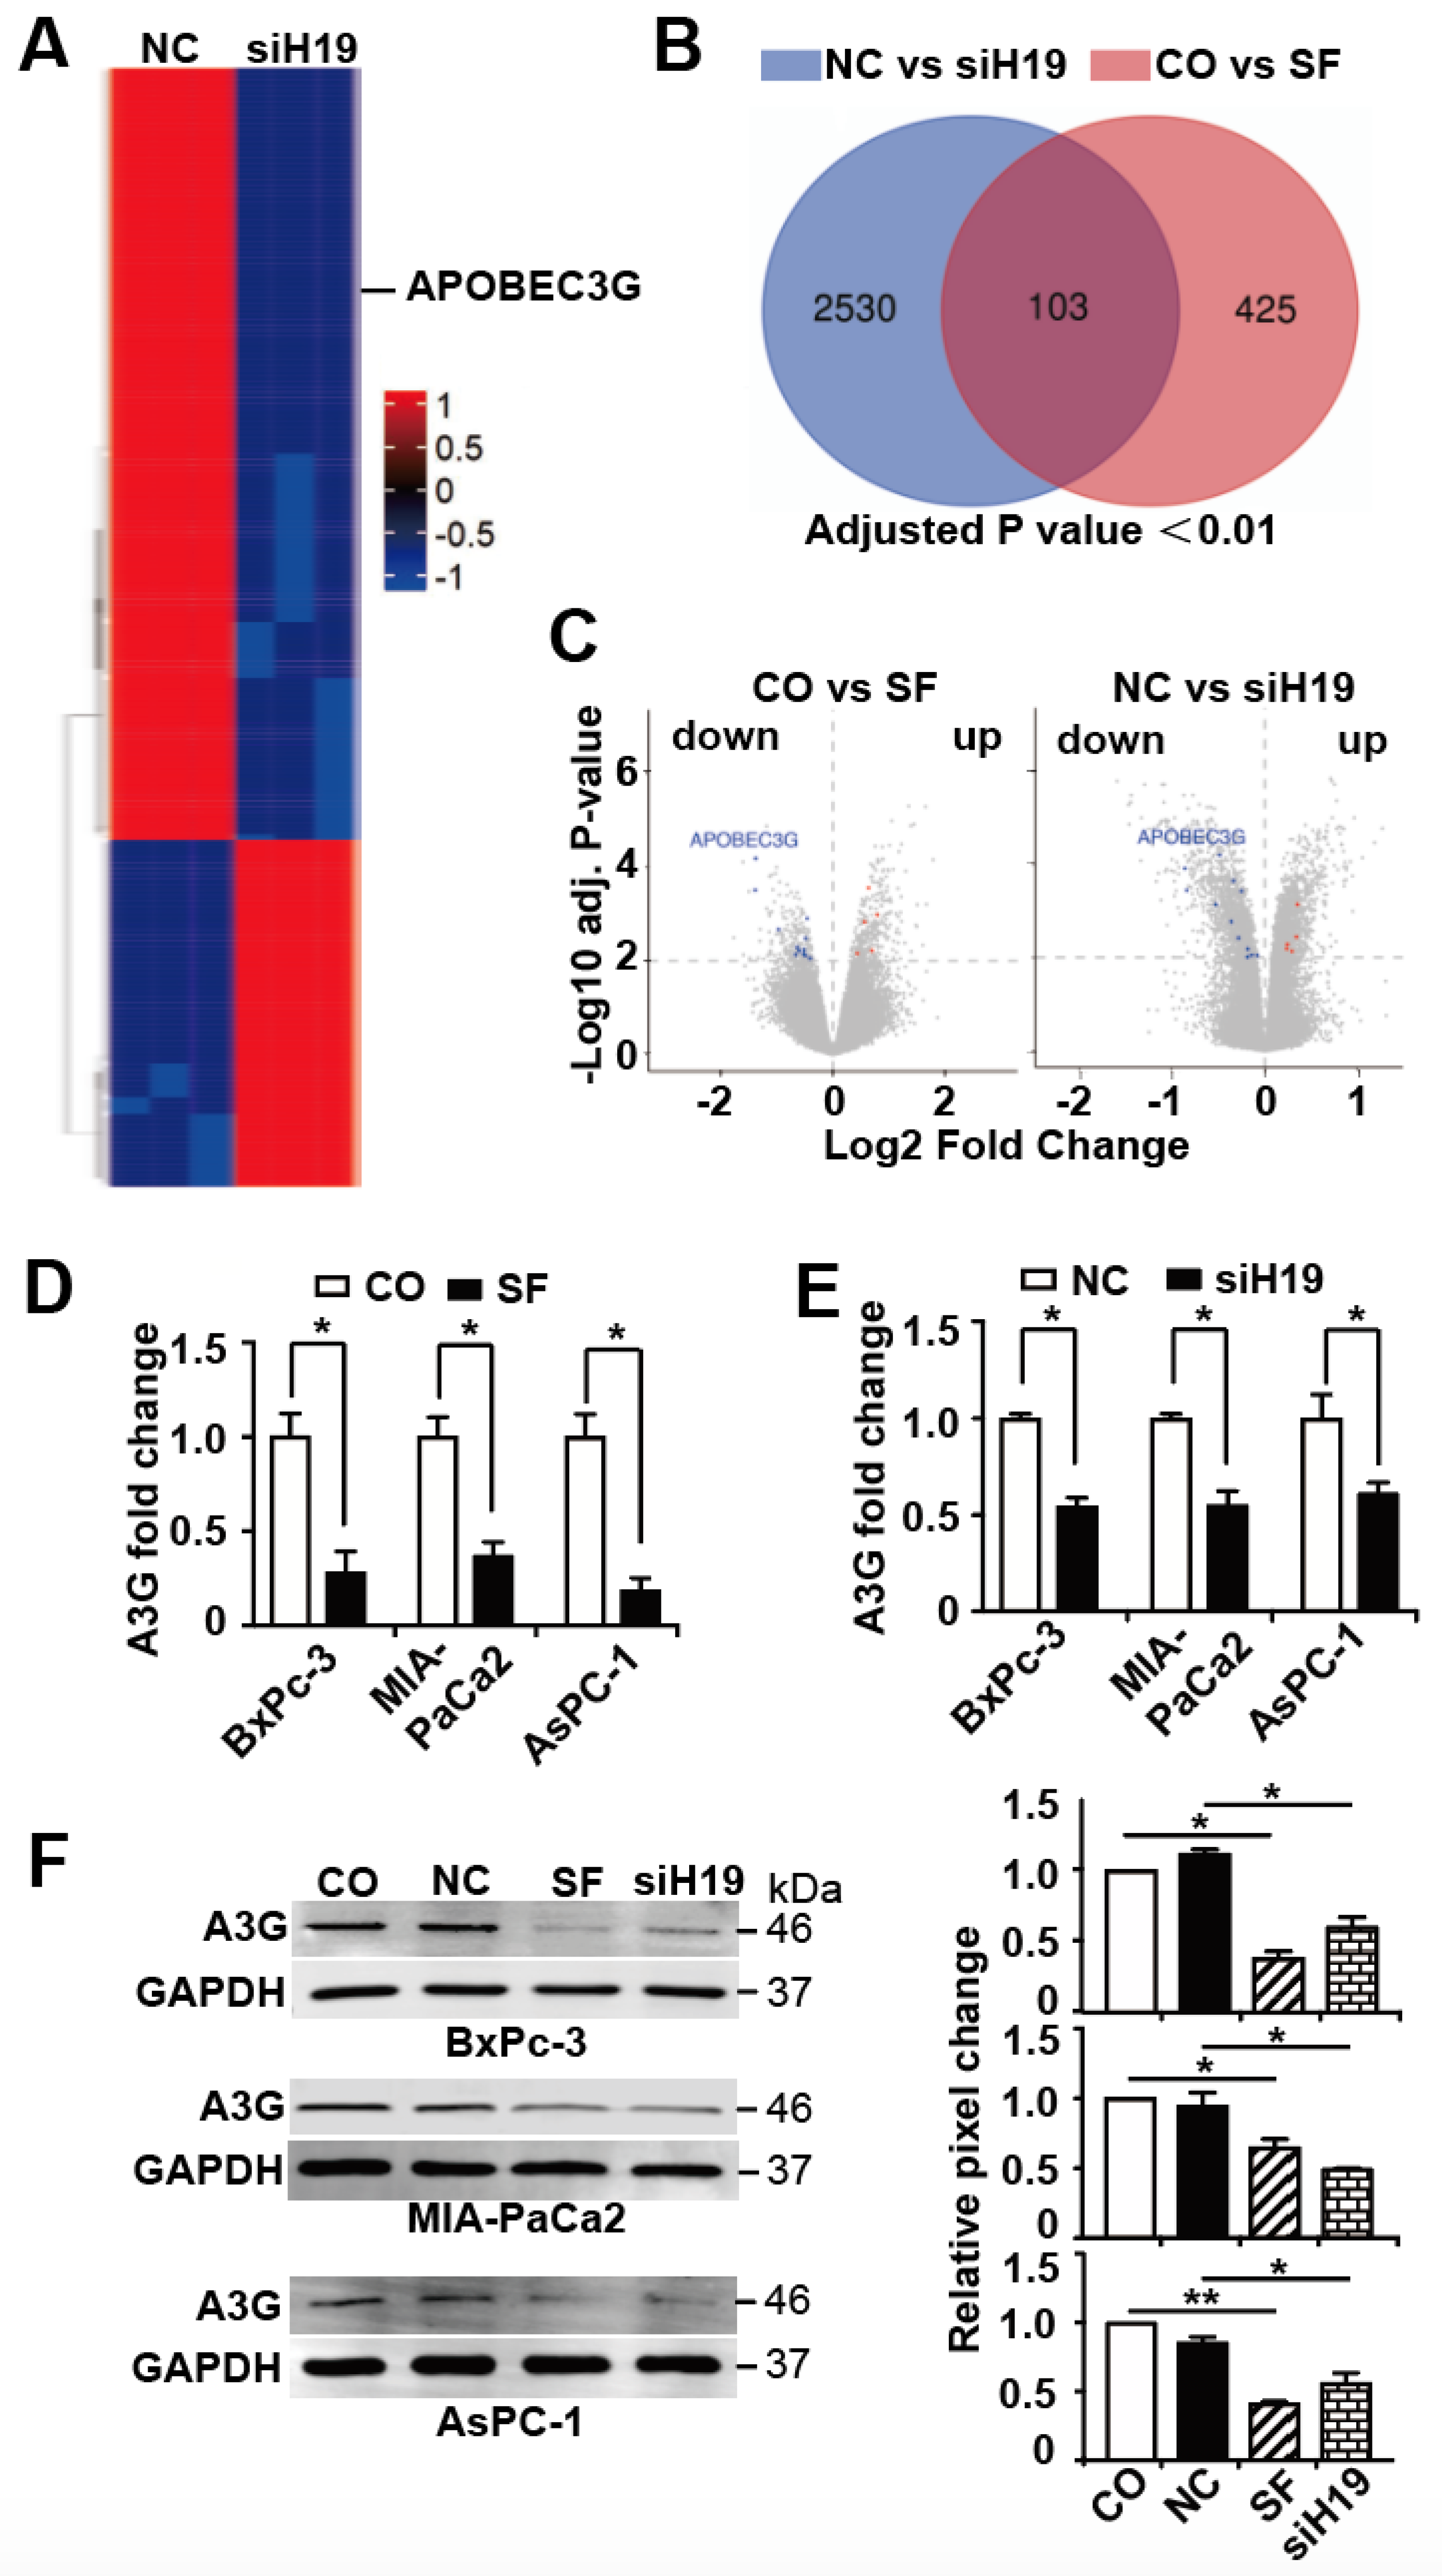
3.3. APOBEC3G is Targeted by H19 and Inhibited by Sulforaphane or H19 Knockdown
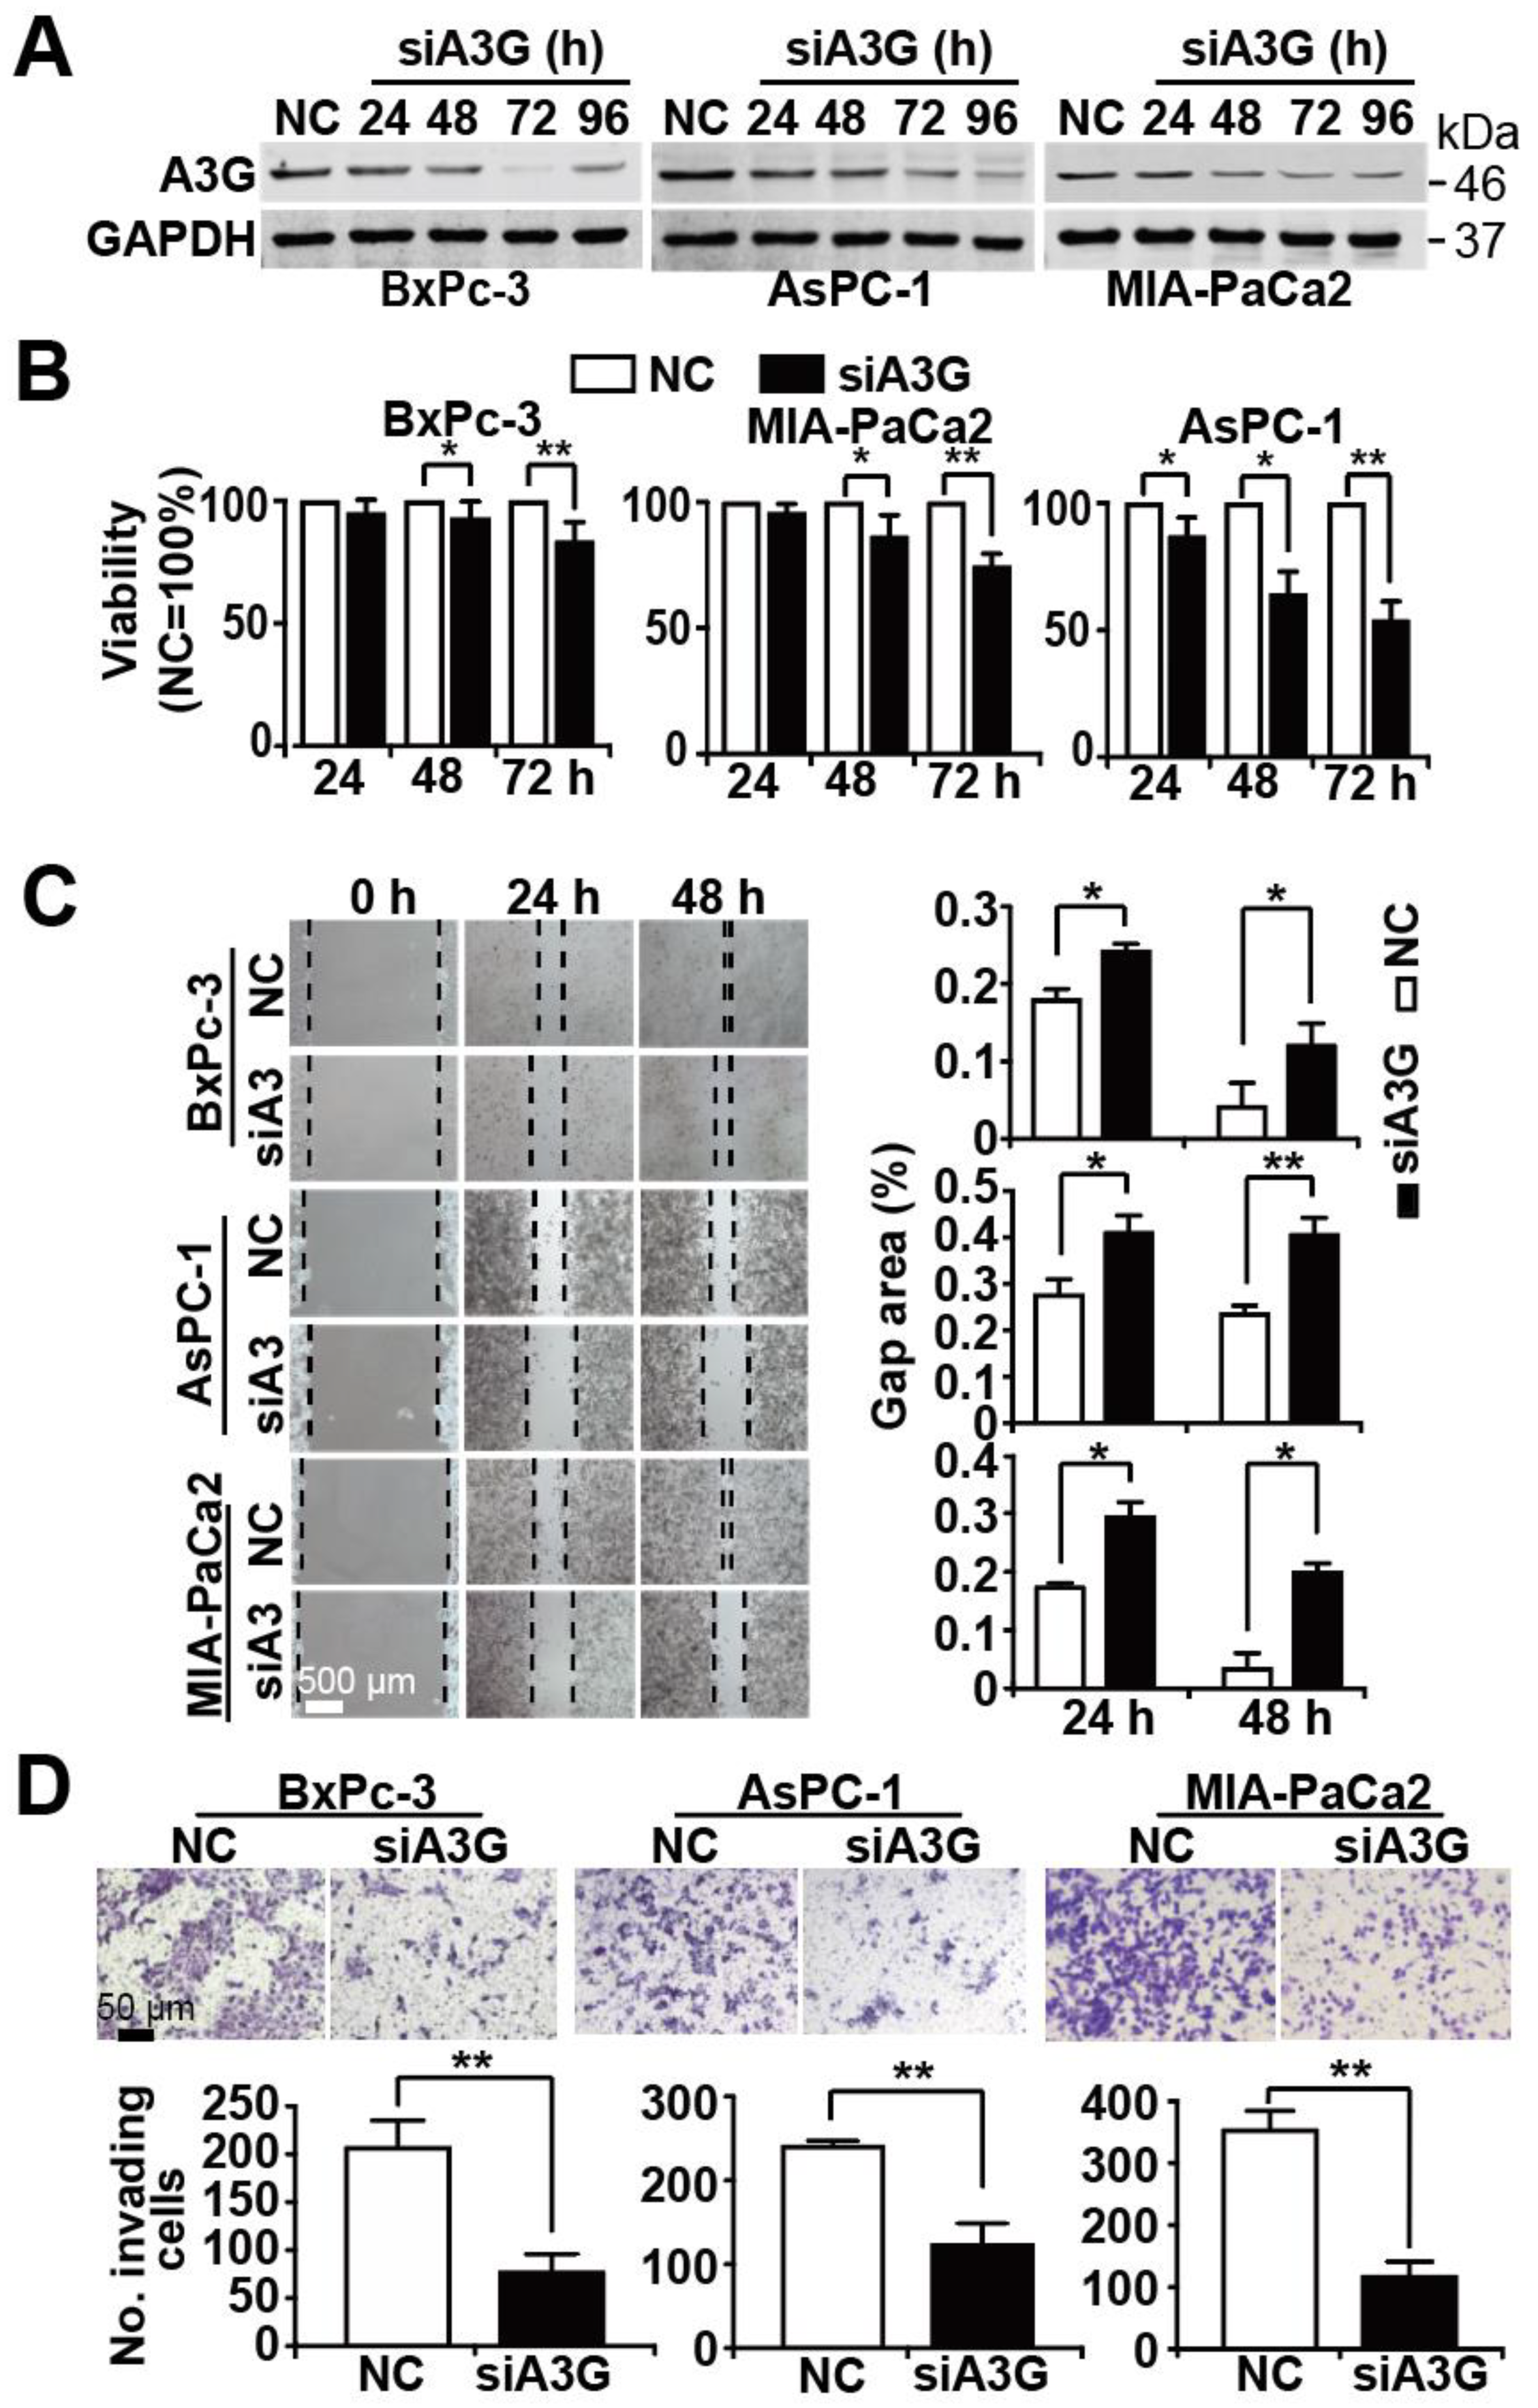
3.4. Knockdown of APOBEC3G Inhibits Tumor Progression Features
3.5. Sulforaphane Mimics the Effects of H19 or A3G Downregulation In Vivo
3.6. APOBEC3G Downregulation Inhibits TGF-β-Induced Smad2 Phosphorylation
4. Discussion
5. Conclusions
Supplementary Materials
Author Contributions
Funding
Institutional Review Board Statement
Informed Consent Statement
Data Availability Statement
Acknowledgments
Conflicts of Interest
Abbreviations
| Apolipoprotein B mRNA editing enzyme catalytic subunit 3G (APOBEC3G); |
| Chorioallantoic membrane (CAM); |
| Epithelial-mesenchymal transition (EMT); |
| Enrichment score (ES); |
| False discovery rate (FDR); |
| Gene Set Enrichment Analysis (GSEA); |
| Gene Set Variation Analysis (GSVA); |
| LncRNA-H19 (H19); |
| Long non-coding RNA (lncRNA); |
| 3-(4,5-dimethylthiazol-2-yl)-2,5-diphenyltetrazolium bromide (MTT); |
| Normalized enrichment score (NES); |
| Pancreatic ductal adenocarcinoma (PDAC). |
References
- Siegel, R.L.; Miller, K.D.; Jemal, A. Cancer statistics, 2020. CA Cancer J. Clin. 2020, 70, 7–30. [Google Scholar] [CrossRef] [PubMed]
- Neoptolemos, J.P.; Kleeff, J.; Michl, P.; Costello, E.; Greenhalf, W.; Palmer, D.H. Therapeutic developments in pancreatic cancer: Current and future perspectives. Nat. Rev. Gastroenterol. Hepatol. 2018, 15, 333–348. [Google Scholar] [CrossRef]
- Kleeff, J.; Korc, M.; Apte, M.; La Vecchia, C.; Johnson, C.D.; Biankin, A.V.; Neale, R.E.; Tempero, M.; Tuveson, D.A.; Hruban, R.H.; et al. Pancreatic cancer. Nat. Rev. Dis. Primers 2016, 2, 16022. [Google Scholar] [CrossRef]
- Hayes, J.D.; Kelleher, M.O.; Eggleston, I.M. The cancer chemopreventive actions of phytochemicals derived from glucosinolates. Eur. J. Nutr. 2008, 47, 73–88. [Google Scholar] [CrossRef]
- Li, L.-Y.; Luo, Y.; Lu, M.-D.; Xu, X.-W.; Lin, H.-D.; Zheng, Z.-Q. Cruciferous vegetable consumption and the risk of pancreatic cancer: A meta-analysis. World J. Surg. Oncol. 2015, 13, 44–48. [Google Scholar] [CrossRef] [PubMed] [Green Version]
- Chan, J.M.; Wang, F.; Holly, E.A. Vegetable and fruit intake and pancreatic cancer in a population-based case-control study in the San Francisco Bay area. Cancer Epidemiol. Biomark. Prev. 2005, 14, 2093–2097. [Google Scholar] [CrossRef] [Green Version]
- Nöthlings, U.; Wilkens, L.R.; Murphy, S.P.; Hankin, J.H.; Henderson, B.E.; Kolonel, L.N. Vegetable intake and pancreatic cancer risk: The Multiethnic Cohort Study. Am. J. Epidemiol. 2006, 165, 138–147. [Google Scholar] [CrossRef] [Green Version]
- Heinen, M.M.; Verhage, B.A.; Goldbohm, R.A.; Brandt, P.A.V.D. Intake of vegetables, fruits, carotenoids and vitamins C and E and pancreatic cancer risk in The Netherlands Cohort Study. Int. J. Cancer 2011, 130, 147–158. [Google Scholar] [CrossRef] [PubMed]
- Larsson, S.C.; Håkansson, N.; Näslund, I.; Bergkvist, L.; Wolk, A. Fruit and vegetable consumption in relation to pancreatic cancer risk: A prospective study. Cancer Epidemiol. Biomark. Prev. 2006, 15, 301–305. [Google Scholar] [CrossRef] [Green Version]
- Kirsh, V.A.; Peters, U.; Mayne, S.T.; Subar, A.F.; Chatterjee, N.; Johnson, C.C.; Hayes, R.B. Prospective study of fruit and vegetable intake and risk of prostate cancer. J. Natl. Cancer Inst. 2007, 99, 1200–1209. [Google Scholar] [CrossRef] [PubMed] [Green Version]
- Han, B.; Li, X.; Yu, T. Cruciferous vegetables consumption and the risk of ovarian cancer: A meta-analysis of observational studies. Diagn. Pathol. 2014, 9, 7. [Google Scholar] [CrossRef] [PubMed] [Green Version]
- Zhao, J.; Zhao, L. Cruciferous vegetables intake is associated with lower risk of renal cell carcinoma: Evidence from a meta-analysis of observational studies. PLoS ONE 2013, 8, e75732. [Google Scholar] [CrossRef] [PubMed]
- Liu, B.; Mao, Q.; Lin, Y.; Zhou, F.; Xie, L. The association of cruciferous vegetables intake and risk of bladder cancer: A meta-analysis. World J. Urol. 2012, 31, 127–133. [Google Scholar] [CrossRef] [PubMed]
- Liu, B.; Mao, Q.; Wang, X.; Zhou, F.; Luo, J.; Wang, C.; Lin, Y.; Zheng, X.; Xie, L. Cruciferous vegetables consumption and risk of renal cell carcinoma: A meta-analysis. Nutr. Cancer 2013, 65, 668–676. [Google Scholar] [CrossRef]
- Liu, X.; Lv, K. Cruciferous vegetables intake is inversely associated with risk of breast cancer: A meta-analysis. Breast 2013, 22, 309–313. [Google Scholar] [CrossRef]
- Lampe, J.W. Sulforaphane: From chemoprevention to pancreatic cancer treatment? Gut 2009, 58, 900–902. [Google Scholar] [CrossRef]
- Shapiro, T.A.; Fahey, J.W.; Dinkova-Kostova, A.T.; Holtzclaw, W.D.; Stephenson, K.K.; Wade, K.L.; Ye, L.; Talalay, P. Safety, tolerance, and metabolism of broccoli sprout glucosinolates and isothiocyanates: A clinical phase I study. Nutr. Cancer 2006, 55, 53–62. [Google Scholar] [CrossRef]
- Lozanovski, V.J.; Polychronidis, G.; Gross, W.; Gharabaghi, N.; Mehrabi, A.; Hackert, T.; Schemmer, P.; Herr, I. Broccoli sprout supplementation in patients with advanced pancreatic cancer is difficult despite positive effects—Results from the POUDER pilot study. Investig. New Drugs 2019, 38, 776–784. [Google Scholar] [CrossRef] [Green Version]
- Alumkal, J.J.; Slottke, R.; Schwartzman, J.; Cherala, G.; Munar, M.; Graff, J.N.; Beer, T.M.; Ryan, C.W.; Koop, D.R.; Gibbs, A.; et al. A phase II study of sulforaphane-rich broccoli sprout extracts in men with recurrent prostate cancer. Investig. New Drugs 2015, 33, 480–489. [Google Scholar] [CrossRef]
- Mokhtari, R.B.; Baluch, N.; Homayouni, T.S.; Morgatskaya, E.; Kumar, S.; Kazemi, P.; Yeger, H. The role of Sulforaphane in cancer chemoprevention and health benefits: A mini-review. J. Cell Commun. Signal. 2017, 12, 91–101. [Google Scholar] [CrossRef]
- Herr, I.; Büchler, M.W. Dietary constituents of broccoli and other cruciferous vegetables: Implications for prevention and therapy of cancer. Cancer Treat. Rev. 2010, 36, 377–383. [Google Scholar] [CrossRef]
- Tortorella, S.M.; Royce, S.G.; Licciardi, P.V.; Karagiannis, T.C. Dietary sulforaphane in cancer chemoprevention: The role of epigenetic regulation and HDAC inhibition. Antioxid. Redox Signal. 2015, 22, 1382–1424. [Google Scholar] [CrossRef] [Green Version]
- Wu, J.; Han, J.; Hou, B.; Deng, C.; Wu, H.; Shen, L. Sulforaphane inhibits TGF-β-induced epithelial-mesenchymal transition of hepatocellular carcinoma cells via the reactive oxygen species-dependent pathway. Oncol. Rep. 2016, 35, 2977–2983. [Google Scholar] [CrossRef] [Green Version]
- Kallifatidis, G.; Labsch, S.; Rausch, V.; Mattern, J.; Gladkich, J.; Moldenhauer, G.; Büchler, M.W.; Salnikov, A.V.; Herr, I. Sulforaphane increases drug-mediated cytotoxicity toward cancer stem-like cells of pancreas and prostate. Mol. Ther. 2011, 19, 188–195. [Google Scholar] [CrossRef] [PubMed]
- Rausch, V.; Liu, L.; Kallifatidis, G.; Baumann, B.; Mattern, J.; Gladkich, J.; Wirth, T.; Schemmer, P.; Büchler, M.W.; Zöller, M.; et al. Synergistic activity of sorafenib and sulforaphane abolishes pancreatic cancer stem cell characteristics. Cancer Res. 2010, 70, 5004–5013. [Google Scholar] [CrossRef] [Green Version]
- Kallifatidis, G.; Rausch, V.; Baumann, B.; Apel, A.; Beckermann, B.M.; Groth, A.; Mattern, J.; Li, Z.; Kolb, A.; Moldenhauer, G.; et al. Sulforaphane targets pancreatic tumour-initiating cells by NF-kappaB-induced antiapoptotic signalling. Gut 2009, 58, 949–963. [Google Scholar] [CrossRef] [PubMed]
- Li, Y.; Zhang, T.; Korkaya, H.; Liu, S.; Lee, H.-F.; Newman, B.; Yu, Y.; Clouthier, S.G.; Schwartz, S.J.; Wicha, M.S.; et al. Sulforaphane, a dietary component of broccoli/broccoli sprouts, inhibits breast cancer stem cells. Clin. Cancer Res. 2010, 16, 2580–2590. [Google Scholar] [CrossRef] [Green Version]
- Li, Y.; Wicha, M.S.; Schwartz, S.J.; Sun, D. Implications of cancer stem cell theory for cancer chemoprevention by natural dietary compounds. J. Nutr. Biochem. 2011, 22, 799–806. [Google Scholar] [CrossRef] [PubMed] [Green Version]
- Yin, L.; Xiao, X.; Georgikou, C.; Yin, Y.; Liu, L.; Karakhanova, S.; Luo, Y.; Gladkich, J.; Fellenberg, J.; Sticht, C.; et al. MicroRNA-365a-3p inhibits c-Rel-mediated NF-kappaB signaling and the progression of pancreatic cancer. Cancer Lett. 2019, 452, 203–212. [Google Scholar] [CrossRef]
- Georgikou, C.; Buglioni, L.; Bremerich, M.; Roubicek, N.; Yin, L.; Gross, W.; Sticht, C.; Bolm, C.; Herr, I. Novel broccoli sulforaphane-based analogues inhibit the progression of pancreatic cancer without side effects. Biomolecules 2020, 10, 769. [Google Scholar] [CrossRef]
- Beaver, L.M.; Kuintzle, R.; Buchanan, A.; Wiley, M.W.; Glasser, S.T.; Wong, C.P.; Johnson, G.S.; Chang, J.H.; Löhr, C.V.; Williams, D.E.; et al. Long noncoding RNAs and sulforaphane: A target for chemoprevention and suppression of prostate cancer. J. Nutr. Biochem. 2017, 42, 72–83. [Google Scholar] [CrossRef] [Green Version]
- Adams, B.D.; Parsons, C.; Walker, L.; Zhang, W.C.; Slack, F.J. Targeting noncoding RNAs in disease. J. Clin. Investig. 2017, 127, 761–771. [Google Scholar] [CrossRef] [PubMed]
- Fatica, A.; Bozzoni, I. Long non-coding RNAs: New players in cell differentiation and development. Nat. Rev. Genet. 2014, 15, 7–21. [Google Scholar] [CrossRef] [PubMed]
- Bhan, A.; Soleimani, M.; Mandal, S.S. Long noncoding RNA and cancer: A new paradigm. Cancer Res. 2017, 77, 3965–3981. [Google Scholar] [CrossRef] [Green Version]
- Zhao, L.; Kong, H.; Sun, H.; Chen, Z.; Chen, B.; Zhou, M. LncRNA-PVT1 promotes pancreatic cancer cells proliferation and migration through acting as a molecular sponge to regulate miR-448. J. Cell. Physiol. 2018, 233, 4044–4055. [Google Scholar] [CrossRef] [PubMed]
- Fu, Z.; Chen, C.; Zhou, Q.; Wang, Y.; Zhao, Y.; Zhao, X.; Li, W.; Zheng, S.; Ye, H.; Wang, L.; et al. LncRNA HOTTIP modulates cancer stem cell properties in human pancreatic cancer by regulating HOXA9. Cancer Lett. 2017, 410, 68–81. [Google Scholar] [CrossRef] [PubMed]
- Kim, K.; Jutooru, I.; Chadalapaka, G.; Johnson, G.; Frank, J.W.; Burghardt, R.C.; Kim, S.; Safe, S. HOTAIR is a negative prognostic factor and exhibits pro-oncogenic activity in pancreatic cancer. Oncogene 2013, 32, 1616–1625. [Google Scholar] [CrossRef] [Green Version]
- Li, L.; Chen, H.; Gao, Y.; Wang, Y.-W.; Zhang, G.-Q.; Pan, S.-H.; Ji, L.; Kong, R.; Wang, G.; Jia, Y.-H.; et al. Long noncoding RNA MALAT1 promotes aggressive pancreatic cancer proliferation and metastasis via the stimulation of autophagy. Mol. Cancer Ther. 2016, 15, 2232–2243. [Google Scholar] [CrossRef] [PubMed] [Green Version]
- Yoshimura, H.; Matsuda, Y.; Yamamoto, M.; Michishita, M.; Takahashi, K.; Sasaki, N.; Ishikawa, N.; Aida, J.; Takubo, K.; Arai, T.; et al. Reduced expression of the H19 long non-coding RNA inhibits pancreatic cancer metastasis. Lab. Investig. 2018, 98, 814–824. [Google Scholar] [CrossRef]
- Han, J.; Han, B.; Wu, X.; Hao, J.; Dong, X.; Shen, Q.; Pang, H. Knockdown of lncRNA H19 restores chemo-sensitivity in paclitaxel-resistant triple-negative breast cancer through triggering apoptosis and regulating Akt signaling pathway. Toxicol. Appl. Pharmacol. 2018, 359, 55–61. [Google Scholar] [CrossRef]
- Li, P.; Tong, L.; Song, Y.; Sun, J.; Shi, J.; Wu, Z.; Diao, Y.; Li, Y.; Wang, Z. Long noncoding RNA H19 participates in metformin-mediated inhibition of gastric cancer cell invasion. J. Cell. Physiol. 2019, 234, 4515–4527. [Google Scholar] [CrossRef]
- Ren, J.; Ding, L.; Zhang, D.; Shi, G.; Xu, Q.; Shen, S.; Wang, Y.; Wang, T.; Hou, Y. Carcinoma-associated fibroblasts promote the stemness and chemoresistance of colorectal cancer by transferring exosomal lncRNA H19. Theranostics 2018, 8, 3932–3948. [Google Scholar] [CrossRef] [PubMed]
- Kitamura, S.; Ode, H.; Nakashima, M.; Imahashi, M.; Naganawa, Y.; Kurosawa, T.; Yokomaku, Y.; Yamane, T.; Watanabe, N.; Suzuki, A.; et al. The APOBEC3C crystal structure and the interface for HIV-1 Vif binding. Nat. Struct. Mol. Biol. 2012, 19, 1005–1010. [Google Scholar] [CrossRef] [PubMed]
- Wu, J.; Pan, T.-H.; Xu, S.; Jia, L.-T.; Zhu, L.-L.; Mao, J.-S.; Zhu, Y.-L.; Cai, J.-T. The virus-induced protein APOBEC3G inhibits anoikis by activation of Akt kinase in pancreatic cancer cells. Sci. Rep. 2015, 5, 12230. [Google Scholar] [CrossRef] [PubMed] [Green Version]
- Lan, H.; Jin, K.; Gan, M.; Wen, S.; Bi, T.; Zhou, S.; Zhu, N.; Teng, L.; Yu, W. APOBEC3G expression is correlated with poor prognosis in colon carcinoma patients with hepatic metastasis. Int. J. Clin. Exp. Med. 2014, 7, 665–672. [Google Scholar]
- Iizuka, T.; Wakae, K.; Nakamura, M.; Kitamura, K.; Ono, M.; Fujiwara, H.; Muramatsu, M. APOBEC3G is increasingly expressed on the human uterine cervical intraepithelial neoplasia along with disease progression. Am. J. Reprod. Immunol. 2017, 78, e12703. [Google Scholar] [CrossRef]
- Fan, P.; Zhang, Y.; Liu, L.; Zhao, Z.; Yin, Y.; Xiao, X.; Bauer, N.; Gladkich, J.; Mattern, J.; Gao, C.; et al. Continuous exposure of pancreatic cancer cells to dietary bioactive agents does not induce drug resistance unlike chemotherapy. Cell Death Dis. 2016, 7, e2246. [Google Scholar] [CrossRef] [Green Version]
- Yin, Y.; Liu, L.; Zhao, Z.; Yin, L.; Bauer, N.; Nwaeburu, C.C.; Gladkich, J.; Gross, W.; Hackert, T.; Sticht, C.; et al. Simvastatin inhibits sonic hedgehog signaling and stemness features of pancreatic cancer. Cancer Lett. 2018, 426, 14–24. [Google Scholar] [CrossRef]
- Georgikou, C.; Yin, L.; Gladkich, J.; Xiao, X.; Sticht, C.; De La Torre, C.; Gretz, N.; Gross, W.; Schäfer, M.; Karakhanova, S.; et al. Inhibition of miR30a-3p by sulforaphane enhances gap junction intercellular communication in pancreatic cancer. Cancer Lett. 2020, 469, 238–245. [Google Scholar] [CrossRef]
- Zhang, Y.; Liu, L.; Fan, P.; Bauer, N.; Gladkich, J.; Ryschich, E.; Bazhin, A.V.; Giese, N.A.; Strobel, O.; Hackert, T.; et al. Aspirin counteracts cancer stem cell features, desmoplasia and gemcitabine resistance in pancreatic cancer. Oncotarget 2015, 6, 9999–10015. [Google Scholar] [CrossRef] [Green Version]
- Zhao, Z.; Bauer, N.; Aleksandrowicz, E.; Yin, L.; Gladkich, J.; Gross, W.; Kaiser, J.; Hackert, T.; Strobel, O.; Herr, I. Intraductal papillary mucinous neoplasm of the pancreas rapidly xenografts in chicken eggs and predicts aggressiveness. Int. J. Cancer 2017, 142, 1440–1452. [Google Scholar] [CrossRef]
- Ding, Q.; Chang, C.-J.; Xie, X.; Xia, W.; Yang, J.-Y.; Wang, S.-C.; Wang, Y.; Xia, J.; Chen, L.; Cai, C.; et al. APOBEC3G promotes liver metastasis in an orthotopic mouse model of colorectal cancer and predicts human hepatic metastasis. J. Clin. Investig. 2011, 121, 4526–4536. [Google Scholar] [CrossRef] [PubMed]
- Fortunato, F.; Naumann, P.; Zentgraf, H.; Büchler, M.W.; Herr, I.; Werner, J. Autophagy and cell death signaling following dietary sulforaphane act independently of each other and require oxidative stress in pancreatic cancer. Int. J. Oncol. 2011, 39, 101–109. [Google Scholar] [CrossRef]
- Shepherd, R.D.; Kos, S.M.; Rinker, K.D. Flow-dependent Smad2 phosphorylation and TGIF nuclear localization in human aortic endothelial cells. Am. J. Physiol. Circ. Physiol. 2011, 301, H98–H107. [Google Scholar] [CrossRef]
- Nakao, A.; Imamura, T.; Souchelnytskyi, S.; Kawabata, M.; Ishisaki, A.; Oeda, E.; Tamaki, K.; Hanai, J.; Heldin, C.; Miyazono, K.; et al. TGF-β receptor-mediated signalling through Smad2, Smad3 and Smad4. EMBO J. 1997, 16, 5353–5362. [Google Scholar] [CrossRef] [Green Version]
- Sun, Y.; Zhu, Q.; Yang, W.; Shan, Y.; Yu, Z.; Zhang, Q.; Wu, H. LncRNA H19/miR-194/PFTK1 axis modulates the cell proliferation and migration of pancreatic cancer. J. Cell. Biochem. 2019, 120, 3874–3886. [Google Scholar] [CrossRef] [PubMed]
- Sasaki, N.; Toyoda, M.; Yoshimura, H.; Matsuda, Y.; Arai, T.; Takubo, K.; Aida, J.; Ishiwata, T. H19 long non-coding RNA contributes to sphere formation and invasion through regulation of CD24 and integrin expression in pancreatic cancer cells. Oncotarget 2018, 9, 34719–34734. [Google Scholar] [CrossRef] [Green Version]
- Ma, C.; Nong, K.; Zhu, H.; Wang, W.; Huang, X.; Yuan, Z.; Ai, K. H19 promotes pancreatic cancer metastasis by derepressing let-7’s suppression on its target HMGA2-mediated EMT. Tumor Biol. 2014, 35, 9163–9169. [Google Scholar] [CrossRef] [PubMed]
- Lv, M.; Zhong, Z.; Huang, M.; Tian, Q.; Jiang, R.; Chen, J. lncRNA H19 regulates epithelial–mesenchymal transition and metastasis of bladder cancer by miR-29b-3p as competing endogenous RNA. Biochim. Biophys. Mol. Cell Res. 2017, 1864, 1887–1899. [Google Scholar] [CrossRef]
- Huang, Z.; Lei, W.; Hu, H.-B.; Zhang, H.; Zhu, Y.-H. H19 promotes non-small-cell lung cancer (NSCLC) development through STAT3 signaling via sponging miR-17. J. Cell. Physiol. 2018, 233, 6768–6776. [Google Scholar] [CrossRef]
- Ding, D.; Li, C.; Zhao, T.; Li, D.; Yang, L.; Zhang, B. LncRNA H19/miR-29b-3p/PGRN axis promoted epithelial-mesenchymal transition of colorectal cancer cells by acting on Wnt signaling. Mol. Cells 2018, 41, 423–435. [Google Scholar] [PubMed]
- Wang, S.-H.; Wu, X.-C.; Zhang, M.-D.; Weng, M.-Z.; Zhou, D.; Quan, Z.-W. Long noncoding RNA H19 contributes to gallbladder cancer cell proliferation by modulated miR-194-5p targeting AKT2. Tumor Biol. 2016, 37, 9721–9730. [Google Scholar] [CrossRef]
- Long, Y.; Wang, X.; Youmans, D.T.; Cech, T.R. How do lncRNAs regulate transcription? Sci. Adv. 2017, 3, eaao2110. [Google Scholar] [CrossRef] [Green Version]
- Wang, Y.; Wu, S.; Zheng, S.; Wang, S.; Wali, A.; Ezhilarasan, R.; Sulman, E.P.; Koul, D.; Yung, W.K.A. APOBEC3G acts as a therapeutic target in mesenchymal gliomas by sensitizing cells to radiation-induced cell death. Oncotarget 2017, 8, 54285–54296. [Google Scholar] [CrossRef] [PubMed] [Green Version]
- Leonard, B.; Starrett, G.J.; Maurer, M.J.; Oberg, A.L.; Van Bockstal, M.; Van Dorpe, J.; De Wever, O.; Helleman, J.; Sieuwerts, A.M.; Berns, E.M.; et al. APOBEC3G expression correlates with T-cell infiltration and improved clinical outcomes in high-grade serous ovarian carcinoma. Clin. Cancer Res. 2016, 22, 4746–4755. [Google Scholar] [CrossRef] [Green Version]
- Xu, Y.; Leng, J.; Xue, F.; Dong, R. Effect of apolipoprotein B mRNA-editing catalytic polypeptide-like protein-3G in cervical cancer. Int. J. Clin. Exp. Pathol. 2015, 8, 12307–12312. [Google Scholar] [PubMed]
- David, C.J.; Huang, Y.H.; Chen, M.; Su, J.; Zou, Y.; Bardeesy, N.; Iacobuzio-Donahue, C.A.; Massague, J. TGF-β tumor suppression through a lethal EMT. Cell 2016, 164, 1015–1030. [Google Scholar] [CrossRef] [PubMed] [Green Version]
- Zhang, L.; Zhou, F.; ten Dijke, P. Signaling interplay between transforming growth factor-β receptor and PI3K/AKT pathways in cancer. Trends Biochem. Sci. 2013, 38, 612–620. [Google Scholar] [CrossRef]
- Yu, M.; Tannock, I.F. Targeting tumor architecture to favor drug penetration: A new weapon to combat chemoresistance in pancreatic cancer? Cancer Cell 2012, 21, 327–329. [Google Scholar] [CrossRef] [PubMed] [Green Version]
- Ribatti, D. The chick embryo chorioallantoic membrane (CAM) assay. Reprod. Toxicol. 2017, 70, 97–101. [Google Scholar] [CrossRef] [PubMed]


Publisher’s Note: MDPI stays neutral with regard to jurisdictional claims in published maps and institutional affiliations. |
© 2021 by the authors. Licensee MDPI, Basel, Switzerland. This article is an open access article distributed under the terms and conditions of the Creative Commons Attribution (CC BY) license (http://creativecommons.org/licenses/by/4.0/).
Share and Cite
Luo, Y.; Yan, B.; Liu, L.; Yin, L.; Ji, H.; An, X.; Gladkich, J.; Qi, Z.; De La Torre, C.; Herr, I. Sulforaphane Inhibits the Expression of Long Noncoding RNA H19 and Its Target APOBEC3G and Thereby Pancreatic Cancer Progression. Cancers 2021, 13, 827. https://doi.org/10.3390/cancers13040827
Luo Y, Yan B, Liu L, Yin L, Ji H, An X, Gladkich J, Qi Z, De La Torre C, Herr I. Sulforaphane Inhibits the Expression of Long Noncoding RNA H19 and Its Target APOBEC3G and Thereby Pancreatic Cancer Progression. Cancers. 2021; 13(4):827. https://doi.org/10.3390/cancers13040827
Chicago/Turabian StyleLuo, Yiqiao, Bin Yan, Li Liu, Libo Yin, Huihui Ji, Xuefeng An, Jury Gladkich, Zhimin Qi, Carolina De La Torre, and Ingrid Herr. 2021. "Sulforaphane Inhibits the Expression of Long Noncoding RNA H19 and Its Target APOBEC3G and Thereby Pancreatic Cancer Progression" Cancers 13, no. 4: 827. https://doi.org/10.3390/cancers13040827