Article

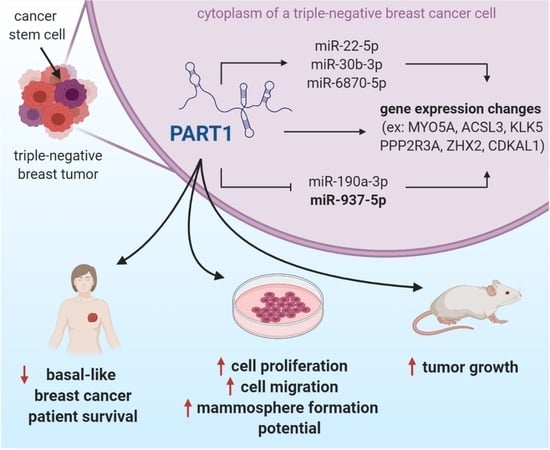
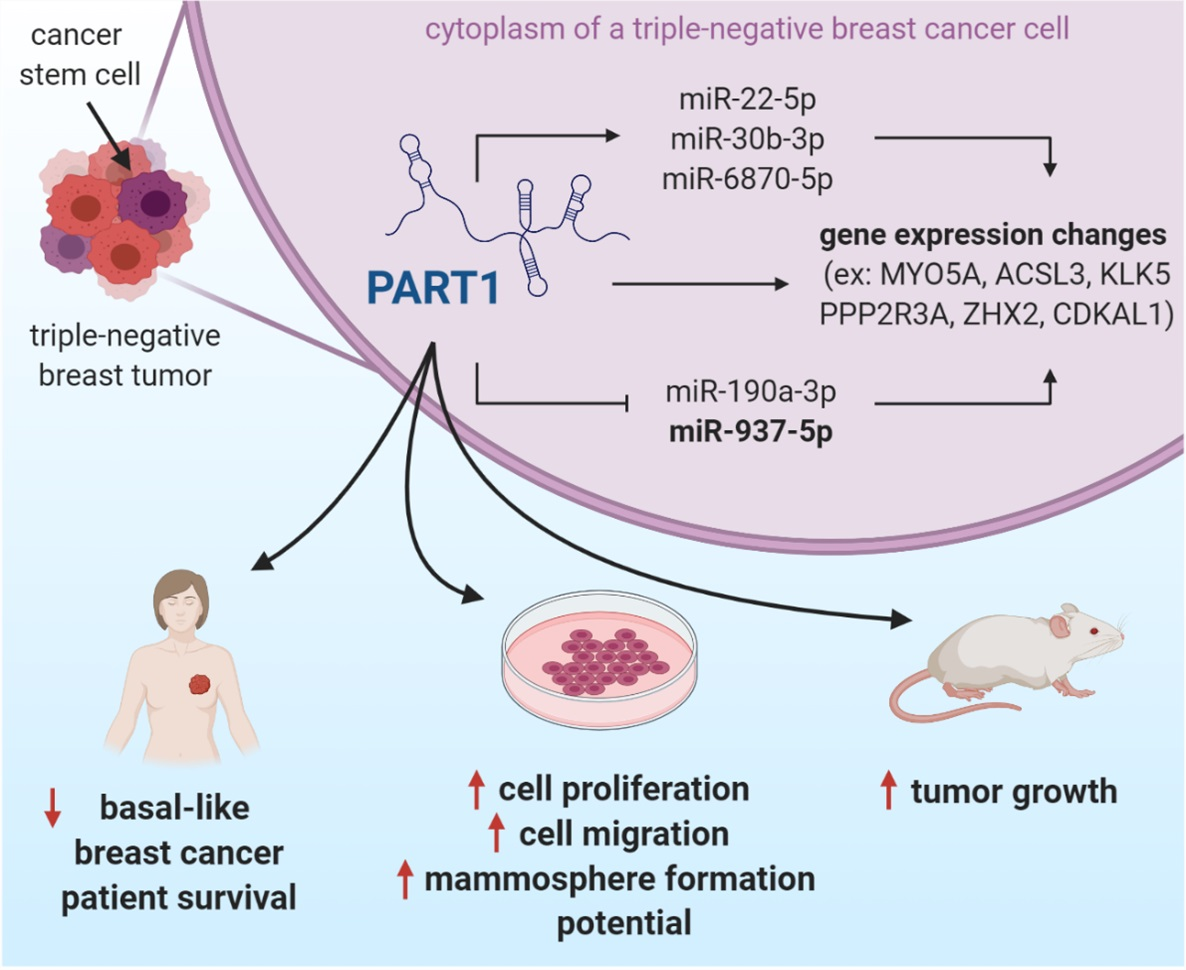
LncRNA PART1 Promotes Proliferation and Migration, Is Associated with Cancer Stem Cells, and Alters the miRNA Landscape in Triple-Negative Breast Cancer

by
Brianne M. Cruickshank
1,†,
Marie-Claire D. Wasson
1,†,
Justin M. Brown
1,
Wasundara Fernando
1,
Jaganathan Venkatesh
1,
Olivia L. Walker
1,
Fiorella Morales-Quintanilla
2,
Margaret L. Dahn
1,
Dejan Vidovic
1,
Cheryl A. Dean
1,
Carter VanIderstine
1,
Graham Dellaire
1,3 and
Paola Marcato
1,4,*
1
Department of Pathology, Faculty of Medicine, Dalhousie University, Halifax, NS B3H 4R2, Canada
2
Department of Biology, Faculty of Science, Saint Mary’s University, Halifax, NS B3H 3C3, Canada
3
Department of Biochemistry and Molecular Biology, Faculty of Medicine, Dalhousie University, Halifax, NS B3H 4R2, Canada
4
Department of Microbiology and Immunology, Faculty of Medicine, Dalhousie University, Halifax, NS B3H 4R2, Canada
*
Author to whom correspondence should be addressed.
These authors contributed equally and are co-first authors.
Cancers 2021, 13(11), 2644; https://doi.org/10.3390/cancers13112644
Submission received: 17 May 2021 / Revised: 22 May 2021 / Accepted: 25 May 2021 / Published: 27 May 2021
(This article belongs to the Collection The Role of Non-coding RNA in Cancer)

Abstract

:

Simple Summary

Long non-coding RNAs (lncRNAs) play an important role in cancer progression. Herein we provide new information regarding the role of prostate androgen regulated transcript 1 (PART1). We show that the lncRNA PART1 is enriched in triple-negative breast cancers and cancer stem cell populations. We demonstrate its role in cancer cell and tumor growth and provide evidence for its association with worse survival in a subset of breast cancer patients. Importantly, our genome-wide analyses have revealed novel insights into the function of this lncRNA, demonstrating how it changes the microRNA (miRNA) landscape leading to genome-wide mRNA expression regulation. Our study suggests that PART1 represents an attractive target for the treatment of triple-negative breast cancers.

Abstract

Triple-negative breast cancers (TNBCs) are aggressive, lack targeted therapies and are enriched in cancer stem cells (CSCs). Novel therapies which target CSCs within these tumors would likely lead to improved outcomes for TNBC patients. Long non-coding RNAs (lncRNAs) are potential therapeutic targets for TNBC and CSCs. We demonstrate that lncRNA prostate androgen regulated transcript 1 (PART1) is enriched in TNBCs and in Aldefluorhigh CSCs, and is associated with worse outcomes among basal-like breast cancer patients. Although PART1 is androgen inducible in breast cancer cells, analysis of patient tumors indicates its androgen regulation has minimal clinical impact. Knockdown of PART1 in TNBC cell lines and a patient-derived xenograft decreased cell proliferation, migration, tumor growth, and mammosphere formation potential. Transcriptome analyses revealed that the lncRNA affects expression of hundreds of genes (e.g., myosin-Va, MYO5A; zinc fingers and homeoboxes protein 2, ZHX2). MiRNA 4.0 GeneChip and TaqMan assays identified multiple miRNAs that are regulated by cytoplasmic PART1, including miR-190a-3p, miR-937-5p, miR-22-5p, miR-30b-3p, and miR-6870-5p. We confirmed the novel interaction between PART1 and miR-937-5p. In general, miRNAs altered by PART1 were less abundant than PART1, potentially leading to cell line-specific effects in terms miRNA-PART1 interactions and gene regulation. Together, the altered miRNA landscape induced by PART1 explains most of the protein-coding gene regulation changes (e.g., MYO5A) induced by PART1 in TNBC.
Keywords:
lncRNA; miRNAs; TNBC; PART1; CSCs

Graphical Abstract

1. Introduction

Accumulating evidence supports a role for long non-coding RNAs (lncRNAs) in the development and progression of cancer and response to therapy. Defined as non-coding transcripts greater than 200 bases in length, the number of lncRNAs identified in humans has surpassed the number of coding genes; however, the function of only a fraction is known. Functionally characterized lncRNAs have been shown to affect gene expression by acting as activators or decoys for transcription factors, recruiters of chromatin-modifying complexes, miRNA sponges, and scaffolds of molecular complexes [1,2,3]. LncRNAs often display tissue-specific expression patterns and selective expression in certain cancers, making them attractive therapeutic targets [4]. In breast cancer for example, lncRNAs nuclear paraspeckle assembly transcript 1 (NEAT1), metastasis-associated lung adenocarcinoma transcript 1 (MALAT1), and non-coding RNA in the aldehyde dehydrogenase 1A pathway (NRAD1), have all been described as oncogenic and dysregulated in breast cancer [5,6,7]. Furthermore, hundreds of lncRNAs (most of which are uncharacterized) are upregulated in triple-negative breast cancers (TNBCs) and represent an area of potential discovery in terms of functionally important players in the progression of this subtype [8].
TNBCs lack the hormone receptors required for endocrine therapy in the treatment of breast cancer [9,10]. Hence, TNBC lacks targeted therapies and is treated with chemotherapy, which contributes to worse outcomes for patients with this subtype. Gene expression analysis of breast tumors revealed five major subtypes; luminal A, luminal B, HER2 overexpressing, basal-like, and claudin-low. The majority of TNBCs are basal-like and claudin-low. TNBC/basal-like breast cancers also have higher percentages of cancer stem cells (CSCs) [11,12,13,14,15,16,17], which may contribute to the aggressiveness of these cancers. CSCs are highly tumorigenic, have stem-like qualities, are resistant to chemo- and radiotherapies, and are commonly defined by increased aldehyde dehydrogenase (ALDH) activity detected by the Aldefluor assay or CD44high/CD24low cell surface marker expression [18]. Given the high abundance of CSCs within TNBC/basal-like breast cancer [11,12,13,14,15,16,17], novel therapies that target CSCs may better reduce the risk of relapse and improve patient outcomes.
One emerging class of therapies for treating TNBCs and CSCs are lncRNA antagonists. For example, targeting tumor-specific lncRNAs with modified antisense oligonucleotides (termed GapmeRs [19]) inhibited tumor progression, metastasis and increased response to other therapies [20,21]. Thus, pharmacological inhibition of lncRNAs may be an effective therapeutic strategy, especially with the FDA’s recent approval of antisense oligonucleotide-based therapies for the treatment of neurodegenerative disorders [22].
One lncRNA of potential interest is prostate androgen regulated transcript 1 (PART1). Discovered in 2000, PART1 is expressed in prostate tissue and is responsive to androgens in prostate cancer cell lines [23]. PART1 promotes prostate cancer cell proliferation and inhibits cell apoptosis, and is associated with more advanced disease and poorer survival among prostate cancer patients [24]. PART1 expression is also associated with worse outcomes and higher stage disease in non-small cell lung cancer [25] and gastric cancer progression [26]. In colorectal cancer, PART1 is oncogenic through possibly acting as miRNA sponge of miR-143 and regulating DNA methyltransferase 3A (DNMT3A) [27]. Similarly, PART1 promotes resistance of epidermal growth factor receptor inhibitor gefitinib in esophageal cancer by possibly acting as a miRNA sponge of miR-129, leading to increased levels of anti-apoptotic BCL2 [28]. In contrast to these studies, PART1 is part of lncRNA signature that predicts lower risk disease in glioblastoma [29] and has been implicated as a tumor suppressor in glioma cells [30]. To date, there has been limited analysis of the role of PART1 in breast cancer with only one study reporting pro-oncogenic activities associated with the lncRNA in MCF7 and BT20 breast cancer cells [31].
Herein, we characterize the expression and function of PART1 in breast cancer using multiple “omics” approaches. First, PART1 expression in patient tumors is predominately in the TNBC/basal-like subtype and is associated with worse outcomes among basal-like breast cancer patients. We report its androgen inducibility in breast cancer cell lines; however, based on gene expression analysis of patient tumors and cells, androgen regulation of PART1 appears to have a minimal clinical impact in breast cancer. We demonstrate that PART1 is oncogenic in TNBC, limiting cell proliferation and decreasing migration when it is knocked down. Furthermore, PART1 expression is associated with stemness gene expression and CSC markers in breast cancer patient tumors, Aldefluorhigh sorted CSC populations, and mammosphere formation potential. Finally, we performed the first unbiased genome-wide analyses of PART1 function, revealing that the cytoplasmic lncRNA regulates expression of hundreds of genes in TNBCs. Most of the changes in protein-coding gene expression are connected to corresponding changes in miRNAs that are predicted to either bind to PART1 or are increased by PART1. Additionally, we confirmed a new miRNA interaction between PART1 and miR-937-5p.

2. Materials and Methods

2.1. Cell Line Models and Tumor Studies

All the breast cancer cell lines were obtained from the American Type Culture Collection (ATCC, Manassas, VA, USA), except for SUM149 and SUM1315 cells, which were obtained from BioIVT (previously Asterandm Westbury, NY, USA). The cell lines were cultured as per ATCC and BioIVT recommendations. The TNBC patient-derived xenograft (PDX) 7482 (originated from a grade 3, stage 2 primary tumor, breast carcinoma) was obtained as a low-passage cryopreserved tumor piece from Dr. Michael T. Lewis and Lacey E. Dobralecki of the Patient-Derived Xenograft and Advanced In Vivo Models (PDX-AIM) Core of Baylor College of Medicine (Houston, TX, USA). All animal experiments have been conducted in accordance with the ethical standards and according to the Declaration of Helsinki and the Canadian Council on Animal Care (CCAC) standards and were approved under animal protocol 17-011.
For isolation of PDX tumor cells, the cryopreserved PDX was first revived by surgical implantation in the mammary fat pad of a NOD/SCID female mouse. The tumor expanded for 5 weeks and was then harvested from the euthanized mouse.
For tumor studies with HCC1806 cells, eight-week-old NOD/SCID female mice were injected with 10,000 HCC1806 shRNA control or PART1 shRNA1 cells admixed 1:1 with matrigel-HC (ThermoFisher Scientific, Waltham, MA, USA) into the mammary fat pad (n = 7). Tumor volumes were quantified with caliper measurements (mm3, length × width × width/2). Mice were grasped, the tumor area was wetted to prevent the fur from obscuring the visibility of the tumor, and the tumor was measured in the longest dimension (length, l) and the second longest dimension (width, w). For the PART1 shRNA1 group, two of the 7 mice did not have detectable tumors, so we scored them as 0 for tumor volume. However, when we performed a necropsy at termination, we detected tumors in all the mice (all 14 mice, 7n per group), hence the final tumor weights were determined for all 14 mice.

2.2. R1881 and D36 Treatment in Cell Culture

For studies assessing the effect of androgens on PART1 induction, cell monolayers were cultured in phenol-red free media and charcoal-stripped FBS (ThermoFisher Scientific) and treated for 24 h with 10 nM R1881 (Sigma-Aldrich, Oakville, ON, Canada) and/or 40 µM D36 (Sigma-Aldrich). Total RNA was extracted and levels of PART1 were assessed by reverse transcription-quantitative PCR (QPCR) as described below.

2.3. Total RNA Extraction and Reverse Transcription-Quantitative PCR

For all transcript expression analyses by QPCR, cells were collected in TRIzol and total RNA was purified using a PureLink RNA kit (Thermo Fisher Scientific) following the manufacturer’s instructions. Equal amounts of harvested RNA were reverse transcribed with the iScript cDNA Synthesis Kit (Bio-Rad, Saint Laurent, QC, Canada) as per the manufacturer’s instructions. QPCR was performed using SsoAdvanced Universal SYBR Supermix (Bio-Rad) and transcript-specific primers (primer sequences are listed in Table S1) as per the manufacturer’s recommended protocol using a CFX96 Touch RealTime PCR Detection System (Bio-Rad). Primer efficiencies, determined by standard curves of diluted cDNA samples, were incorporated into the CFX Manager software (Bio-Rad). Gene expression of all samples was calculated relative to two or three reference genes as indicated in the figure legend and relative to the negative control (Table S1).

2.4. Knockdown of PART1, Cell Proliferation, Migration, Apoptosis, Mammosphere Assays

Stable PART1 short hairpin ribonucleic acid (shRNA) knockdown clones were generated in HCC1806 cells using two separate shRNA clones (shRNA 1, TAGTCGTAATTGAGTTCTGAC; shRNA2, AATAATGGGACATCACTTC, Dharmacon Inc., Lafayette, CO, USA) or scramble shRNA controls in lentiviral vectors pGipZ or pLKO.1. The lentiviral supernatants for transfection were generated in HEK293T cells using standard protocols. The lentiviral supernatants were applied to HCC1806 cells and clones were selected by adding 1.5 µg/mL puromycin containing media for two days and subsequently maintained in 0.25 µg/mL puromycin containing media. Knockdown of PART1 was confirmed by QPCR as described above.
For transient in vitro PART1 knockdown, 15 nM screening-grade modified antisense oligonucleotide GapmeRs (Qiagen, formerly Exiqon, Toronto, ON, Canada) were applied to cells (negative control GapmeR, LG00000002-DDA, AACACGTCTATACGC; PART1 GapmeR 1, LG00211399-DDA, ATTCCAGATAAGTAGA; PART1 GapmeR 2, LG00211400-DDA, GTGATTCCAGAATAAGT). GapmeRs were mixed with OptiMEM reduced serum media (Invitrogen ThermoFisher Scientific) and TransIT-BRCA transfection reagent (MJS Biolynk, Brockville, ON, Canada) and added to subconfluent HCC1806 or HCC1395 cells to a final treatment concentration of 15nM as per the manufacturer’s instructions. To quantify GapmeR-mediated decreases in PART1 expression, QPCR analysis was performed on cells that were treated for 48 h and collected in TRIzol. Total RNA was purified using a PureLink RNA kit (as described above).
Effects on cell proliferation and apoptosis were measured by cell counting via trypan blue exclusion or flow cytometry analysis. Flow cytometry was performed using annexin-V conjugated to APC (Invitrogen Thermo Fisher Scientific) and 7-aminoactinomycin D (7AAD, Biolegend, San Diego, CA, USA) using a FACSCalibur or FACSCelesta (BD BioSciences, San Jose, CA, USA) and FCSExpress flow cytometry analysis software (version 4, De Novo Software, Pasadena, CA, USA).
The motility of cells upon PART1 knockdown was assessed by a gap closure assay. Cells were seeded at 20,000 cells per well in 2-well culture inserts placed in a 6-well plate. After overnight incubation, the cells were treated with 10 μg/mL mitomycin (a cell proliferation inhibitor) and incubated at 37 °C in 5% CO2 in a humidified incubator for 2 h. The cells were then treated with GapmeRs as described above for 24h. The inserts were then removed, and the first microscopic image was captured with a conventional 10× phase-contrast objective lens. A second microscopic image was captured 24 h later. The number of migrated cells in the gap was quantified in the second image.
To assess the effects of PART1 knockdown on mammosphere formation potential, 3000 HCC1806 cells, 4000 HCC1395 cells or 5000 PDX 7482 cells were seeded in complete MammoCult media (Stemcell Technologies, Vancouver, BC, Canada) in technical triplicates in 24-well ultralow adherence plates (ThermoFisher Scientific). The PDX 7482 cells were obtained from tumors which had been expanded in a NOD/SCID mouse as described above. The expanded tumors were minced, treated with 225U/mL collagenase 3 (Bioshop Canada Inc., Burilington, ON, Canada) for 1 h at 37 °C with rotation, and strained through a 70 μM filter. Next, the red blood cells were lysed, washed in PBS and counted with a hemocytometer by trypan blue exclusion. Two hours post seeding, cells were treated with 15 nM GapmeRs as described above. All resulting spheres greater than 50 μm [32,33] (defined using the integrated software of an AE31E microscope (Motic, Richmond, BC, Canada), were counted 5 days later for HCC1806 and HCC1395 cells or 14 days later for PDX 7482 cells.

2.5. Aldefluor Analysis and Sorting

Aldefluorhigh and Aldefluorlow populations of PDX 7482 were isolated using FACSAria (BD Biosciences) based on Aldefluor activity (Aldefluor assay kit, StemCell Technologies) performed as per the manufacturer’s instructions and as previously described [34,35]. Single cell suspensions of PDX 7482 were generated as described above. To remove dead cells and lineage cells of mouse origin, the cells were stained with 7-AAD (Biolegend) and allophycocyanin (APC) conjugated anti-H2Kd antibody (Biolegend), respectively. The pan-ALDH inhibitor diethylaminobenzaldehyde (DEAB) was added to a sample to verify that an Aldefluorhigh population of cells had been identified. RNA extraction and QPCR analysis as described above was performed on the sorted Aldefluorlow and Aldefluorhigh cell populations.
To assess the effect of PART1 knockdown on the percentage of Aldefluor positive cells, we performed the Aldefluor assay as described above but on cells that had been treated with GapmeRs for 48 h prior to collecting cells and performing the assay.

2.6. Western Blotting

HCC1806 cells with PART1 knockdown (through shRNA or GapmeR treatment) for 48h were lysed in RIPA buffer. 50 µg of the cytoplasmic lysate was loaded along with cleaved caspase-3 control cell extracts (#9664, Cell Signaling, New England Biolabs Ltd, Whitby, ON, Canada) in a Mini-PROTEAN TGX Stain-Free Precast Gel (Bio-Rad) and ran for 1 h at 100 V in Tris-Glycine-SDS buffer. The lysates were transferred onto PVDF membranes in a Transblot-Turbo Transfer system (Bio-Rad) and blocked in 5% BSA for 1h at room temperature. The membrane was incubated with cleaved caspase-3 (Asp175, 5A1E) rabbit monoclonal antibody (#9663, Cell Signaling, 1:1000 in 5% BSA) overnight at 4 °C followed by peroxidase affiniPure goat anti-rabbit IgG (H + L, #111-035-144, Jackson Immunoresearch, West Grove, PA, USA) antibody (1:1000 in 5% BSA) for 1 h at room temperature. The chemiluminescence was imaged with the ChemiDoc imaging system (Bio-Rad). Subsequently, the blot was re-probed for actin (#13E5, Cell Signaling) and similarly imaged.

2.7. Subcellular Localization of PART1

The LncATLAS database was accessed to determine the relative concentration index (RCI) of PART1 in the nuclear versus cytoplasmic compartments in a panel of cell lines calculated from RNA-seq [36]. We determined the relative amounts of PART1 in the nucleus versus cytoplasm of HCC1806 cells by subcellular fractionation. HCC1806 cells were collected and lysed in cold hypertonic lysis buffer (10 mM Tris, 10 mM NaCl, 3 mM MgCl2, 0.3% NP-40 and 10% glycerol, pH 7.5, with RNAse inhibitor SUPERase-In, ThermoFisher Scientific) and pelleted by centrifugation. The supernatant (cytoplasmic fraction) was separated from the nuclear fraction pellet. The nuclear pellet was repeatedly washed with the cold hypertonic buffer. The cytoplasmic fraction was precipitated by sodium acetate/ethanol precipitation and pelleted by subsequent highspeed centrifugation. The RNA from both the nuclear and cytoplasmic fractions was extracted as described above. PART1 levels were determined by QPCR and compared to nuclear lncRNA NEAT1 and cytoplasmic lncRNA DANCR [19,37].

2.8. Dataset Analyses

Breast cancer patient clinical data and PART1 stem gene co-expression data were extracted via cBioPortal from The Cancer Genome Atlas (TCGA) PanCancer Atlas and Cell 2015 (RNA-seq data) and the METABRIC (gene chip data) datasets [38,39,40]. Survival analysis was also completed using KMPlotter [41] and from data extracted from cBioportal (TCGA Cell 2015, PanCancer Atlas and METABIC datasets) [38,39,40]. RNA-seq expression of PART1 and androgen receptor (AR) in the CCLE database was retrieved using the CCLE Broad Institute portal (portals.broadinstitute.org/ccle) [42].

2.9. Transcriptome Analysis

HCC1806 and HCC1395 cells were treated with negative control GapmeR, GapmeR#1 or GapmeR #2 for 48 h, collected in TRIzol reagent and RNA purified (as described above). The samples (n = 3) were sent to The Centre for Applied Genomics (TCAG, The Hospital for Sick Kids, Toronto, ON, Canada) for Affymetrix Human Gene 2.0 ST gene chip platform analysis (ThermoFisher Scientific). The data was processed with the Transcriptome Analysis Console (Affymetrix) to reveal differential gene expression. The raw data is deposited on the NCBI Gene Expression Omnibus (GEO) (GSE156114).

2.10. MiRNA Analyses

HCC1806 and HCC1395 cells were treated with negative control GapmeR, GapmeR #1 or GapmeR #2 for 48 h as described above. Total RNA was isolated using the mirVana™ miRNA Isolation Kit (ThermoFisher). Three biological replicates were sent to the TCAG for Affymetrix’s (Applied Bioscience) genechip miRNA 4.0 array analysis, which interrogated all miRNA sequences in miRBase Release 20. The data was processed with the Transcriptome Analysis Console (Affymetrix) to reveal differential gene expression. The raw data is deposited on GEO (GSE163569). Validation of the miRNA gene chip array and individual miRNA quantification was conducted on total RNA (purified using the mirVana miRNA isolation kit) with the pre-formulated primer from the TaqMan miRNA assays (for RNU48, cel-miR-39, miR-129, miR-373-3p, miR-429, miR-635) or TaqMan Advanced miRNA assays (for miR-21-5p, miR-22-5p, miR-26b-5p, miR-30b-3p, miR-190a-3p, miR-937-5p, miR-6870-5p, ThermoFisher Scientific). For the TaqMan miRNA assay, cDNA was synthesized from the total RNA using the pre-formulated reverse transcription primers and the reagents in the TaqMan microRNA reverse transcription kit. For the TaqMan miRNA advanced assays, from the total RNA, the specific mature miRNAs are extended in the 3′ end of the mature transcript through poly(A) addition, then lengthened in the 5′ end by adaptor ligation. The modified miRNAs then underwent universal reverse transcription followed by amplification to uniformly increase the amount of cDNA for all miRNAs (miR-Amp reaction). For both assays, TaqMan Fast Advanced Master Mix (ThermoFisher) was used for the QPCR. MiRNA levels detected using either the TaqMan miRNA assay and TaqMan miRNA advanced assay were calculated relative to the reference miRNAs (miR-221 and RNU48, and miR-21-5p and miR-2b6-5p, respectively) and relative to the negative control.
We utilized the online tool LncBase v2 to identify in silico predicted miRNA target binding sequences on PART1, identified with the DIANA-microT algorithm [43]. TargetScan [44] was accessed to identify the predicted mRNA targets for miRNAs regulated by PART1 in TNBC. The PART1-miRNA-mRNA network was visualized using the Cytoscape platform [45].

2.11. Luciferase Reporter Assay for PART1—miR-937-5p Interaction

Oligos specific to the wildtype (WT) PART1 miRNA 937-5p binding region and the mutated version of the sequence (MUT) are listed in Table S2. To make double stranded sequences for cloning, the oligos were admixed into oligo annealing buffer and heated to 90 °C for 3 min, followed by cooling to 37 °C for 15 min. The WT and MUT annealed oligos (ThermoFisher Scientific) were cloned into the multiple cloning site of the pmirGLO Dual-Luciferase miRNA Target Expression Vector (ThermoFisher Scientific, using SacI and XhoI restriction enzymes (New England Biolabs Ltd.). The confirmed vectors were co-transfected into HCC1806 cells with the pRLTK vector (Promega ThermoFisher Scientific), using TransIT-BRCA transfection reagent. 24 h later the mirVana miRNA negative control mimic or mimic-hsa-miR-937-5p (ThermoFisher Scientific) was transfected into the cells using TransIT-BRCA. The resulting firefly and renilla luciferase activity in the cells were measured 24 h later using the Dual-Glo® Luciferase Assay System (ThermoFisher Scientifc) with a SpectraMax® M3 Multi-Mode Microplate Reader (ThermoFisher Scientific). Binding of the mimic sequence to the luciferase reporter vector would inhibit production of luminescence.

2.12. Statistics

All statistical analyses were performed in the GraphPad Prism software (GraphPad Software, San Diego, CA, USA). In all cases where three or more groups are compared, a one-way or two-way ANOVA was performed (with Dunnett’s or Tukey’s multiple comparisons post-test as indicated in the figure legend). Comparisons between two groups were done using a two-tailed student’s t-test. For co-expression analyses, p values were determined by the cor.test() function with the method argument set to “spearman” in Rv4.2. Significant p values are indicated as follows in the figures: p < 0.05 = *, p < 0.01 = **, p < 0.001 = ***, p < 0.0001 = ****.

3. Results

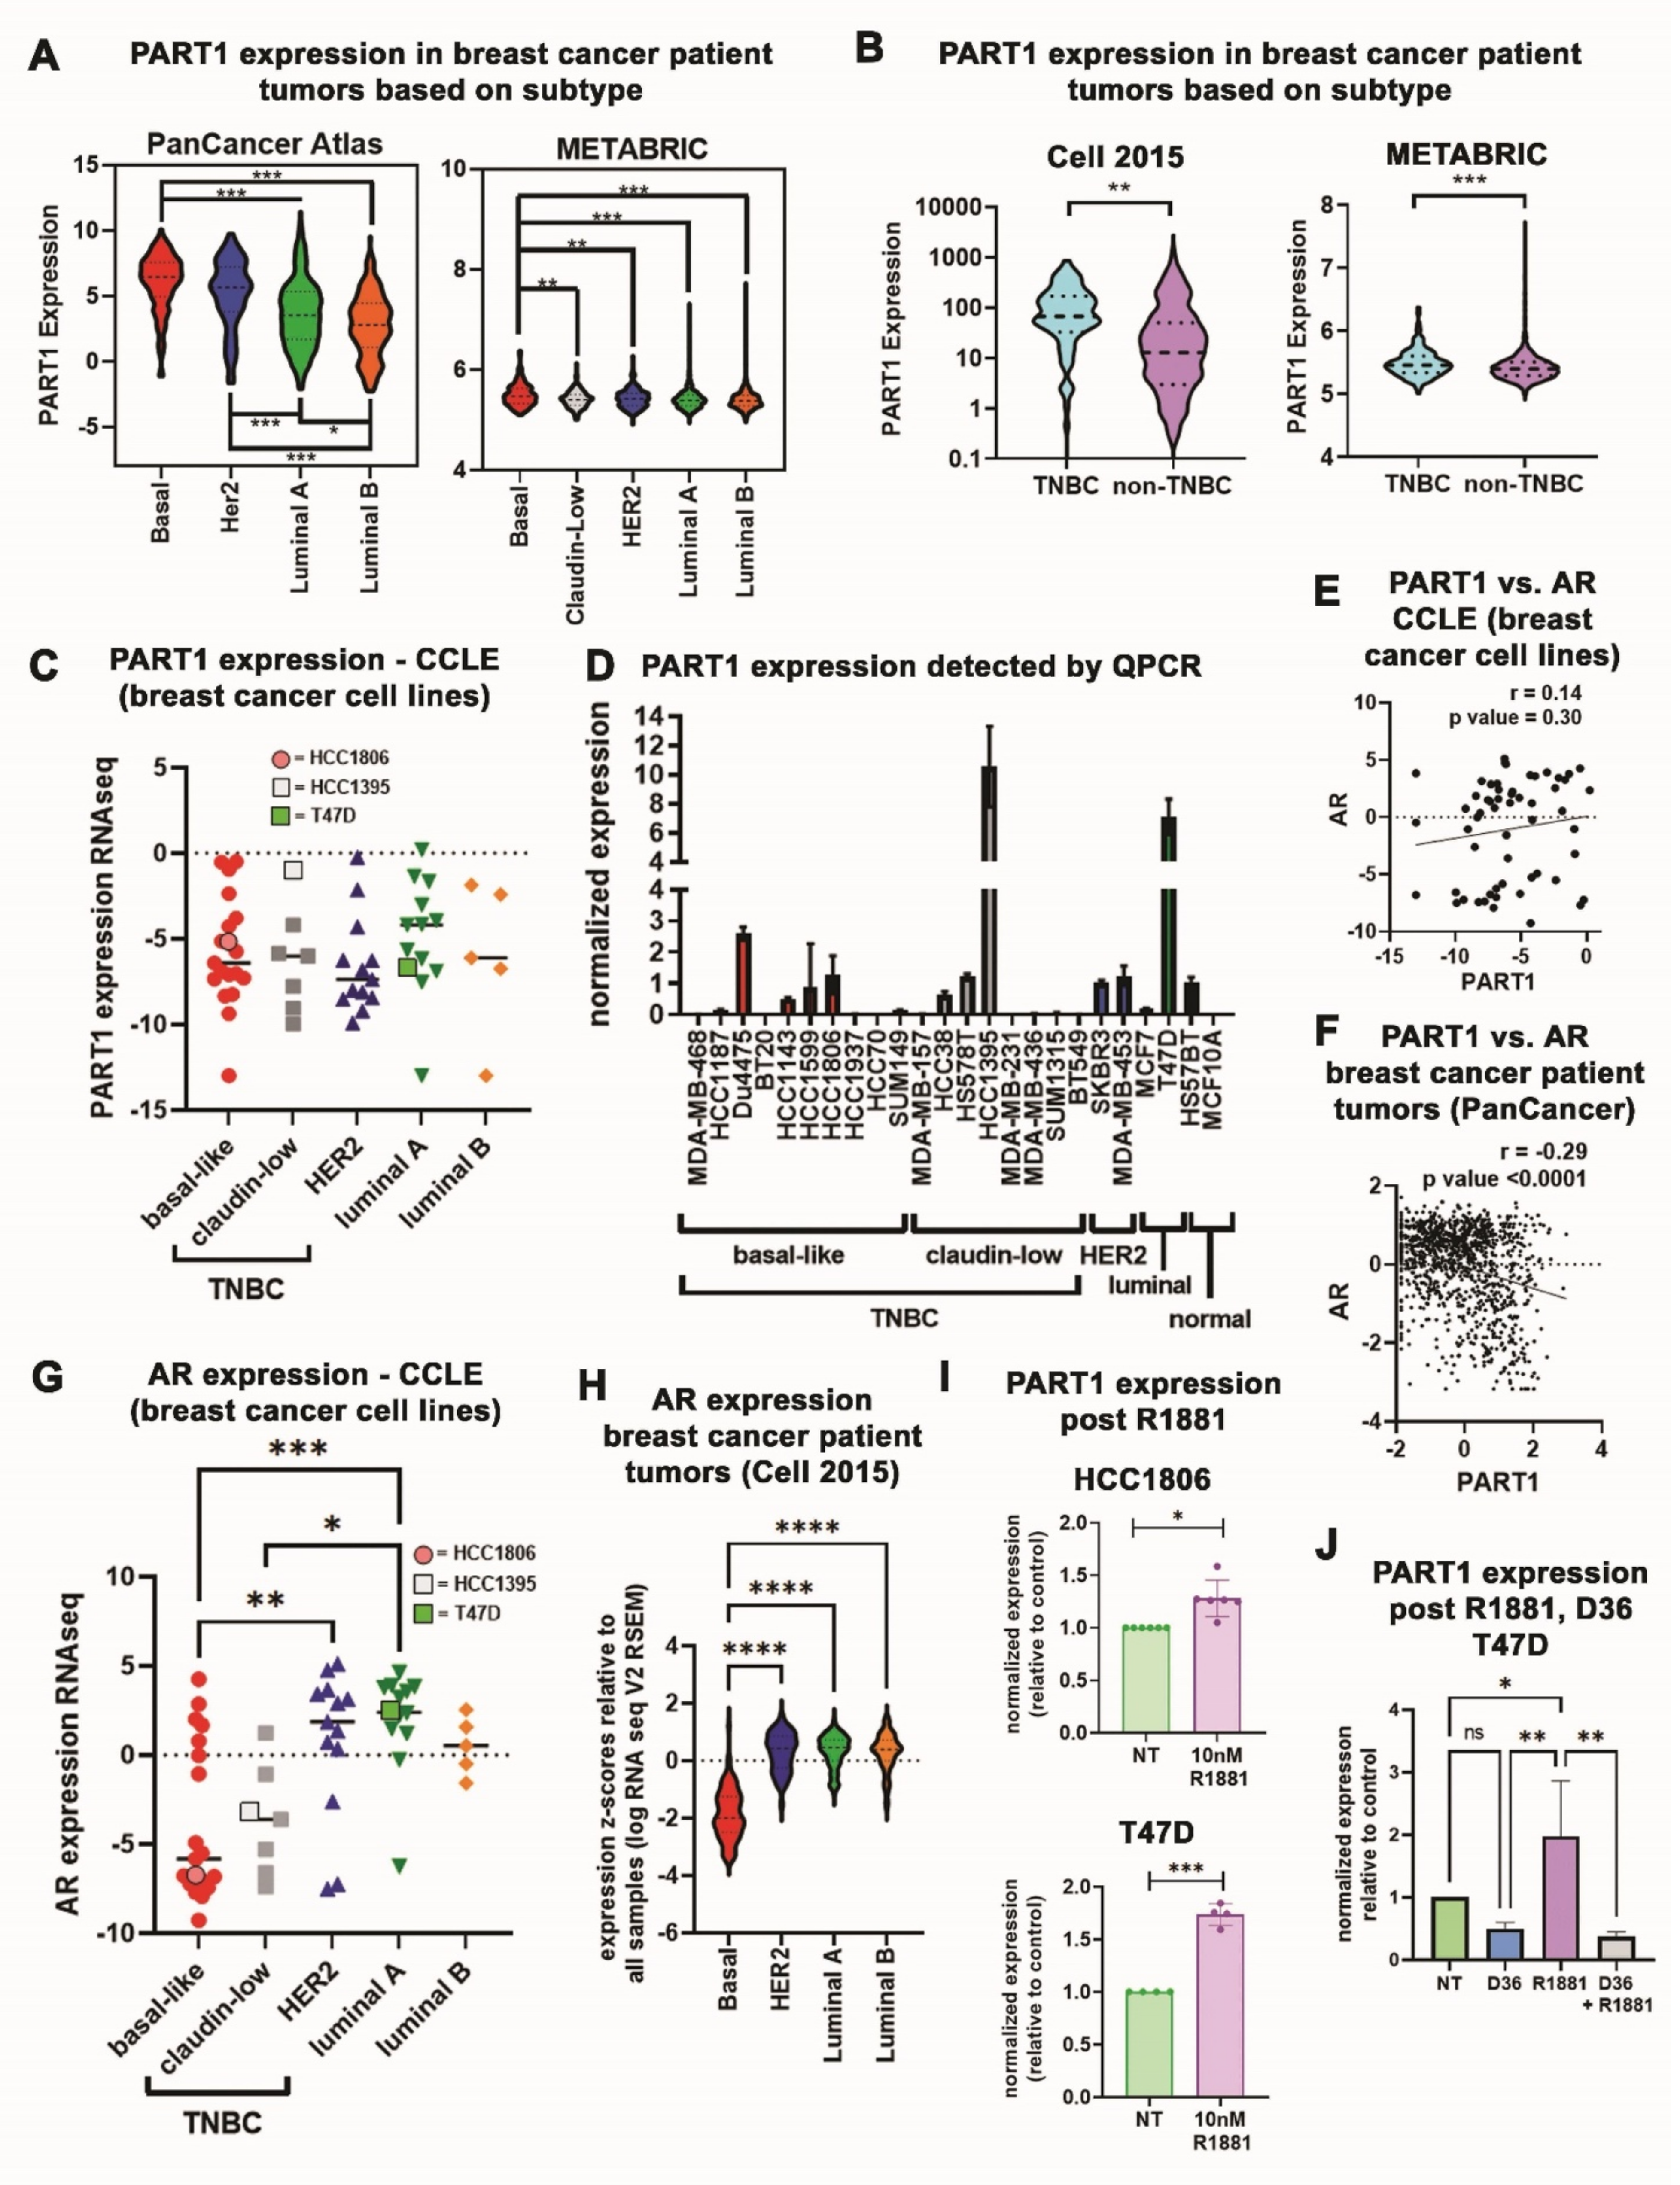
3.1. PART1 Is Enriched in Basal-Like/Triple-Negative Breast Cancer Patient Tumors and Is Androgen Inducible in Breast Cancer Cells

To define the potential role of PART1 in breast cancer, we first analyzed PART1 expression in breast cancer patient tumors of different subtypes (TCGA PanCancer, Cell 2015 and METABRIC datasets), based on intrinsic molecular subtype (basal-like, claudin low, HER2, luminal A and B), and the lack of hormone receptor expression (i.e., TNBC) [46,47]. This revealed that PART1 is most expressed in basal-like tumors (Figure 1A, which are predominately TNBCs [46,47]) and in TNBCs (Figure 1B). To assess if PART1 expression followed the same subtype-specific trends in breast cancer cell lines, we analyzed PART1 expression in a 57-breast cancer cell line panel (Figure 1C, CCLE dataset, RNA-seq) and in our 24-breast cell line panel by QPCR (Figure 1D). Interestingly, in the cell lines PART1 expression was not enriched in the basal-like/TNBC cells (Figure 1C,D) as we had noted in patient tumors (Figure 1A,B).
We wondered if the higher PART1 expression in non-TNBC cell lines is a result of cell culturing conditions (i.e., androgenic signaling molecules are present in the phenol red/FBS containing media). Given that PART1 has been shown to be responsive to androgens in prostate cancer cells [23], we suspected that the androgens in the cell culture media were influencing PART1 expression in breast cancer cells. Notably, in the breast cancer cell lines, androgen receptor (AR) is weakly, positively correlated with PART1, whereas in breast cancer patient tumors, AR is significantly negatively correlated with PART1 (Figure 1E,F), potentially suggesting a cell culturing-dependent effect. AR expression is lowest in basal-like/TNBC cell lines (e.g., HCC1806 and HCC1395) and highest in luminal/estrogen receptor positive (ER+) cell lines (e.g., T47D, Figure 1G).
We similarly noted that basal-like breast cancer patient tumors had the lowest AR expression (Figure 1H). This suggests that in the higher AR expressing ER+ breast cancer cell lines cultured in androgen-containing media, PART1 expression may be at least partially dependent on androgen signaling.
To test this hypothesis, we cultured TNBC HCC1806 cells and ER+ T47D cells in phenol-red free/charcoal-stripped FBS, with or without the addition of 10 nM synthetic androgen R1881. This resulted in a modest induction of PART1 expression in basal-like HCC1806 cells (1.26-fold, Figure 1I), and a much more significant induction of PART1 in T47D cells (1.73-fold, Figure 1I). This is consistent with the higher levels of AR in T47D cells versus HCC1806 cells (Figure 1G). Addition of AR antagonist D36 inhibited the induction of PART1 by R1881, confirming the role of AR on PART1 levels (Figure 1J). Therefore, PART1 expression can be amplified by the presence of androgenic signaling molecules in AR expressing breast cancer cell lines (e.g., ER+ T47D cells). To assess the potential clinical relevance of PART1/AR signaling in breast cancer, we assessed the correlation of PART1 expression with the androgen signaling gene panel (containing 10 genes, from cBioPortal) across breast cancer subtypes in two breast cancer patient tumor datasets (Figure S1). This failed to reveal strong correlations between androgen signaling genes and PART1 in breast cancer patient tumors. Together this data leads us to conclude that in TNBC/basal-like breast cancer, where PART1 expression is highest and most likely clinically relevant, androgens do not play a major role in inducing PART1 expression.

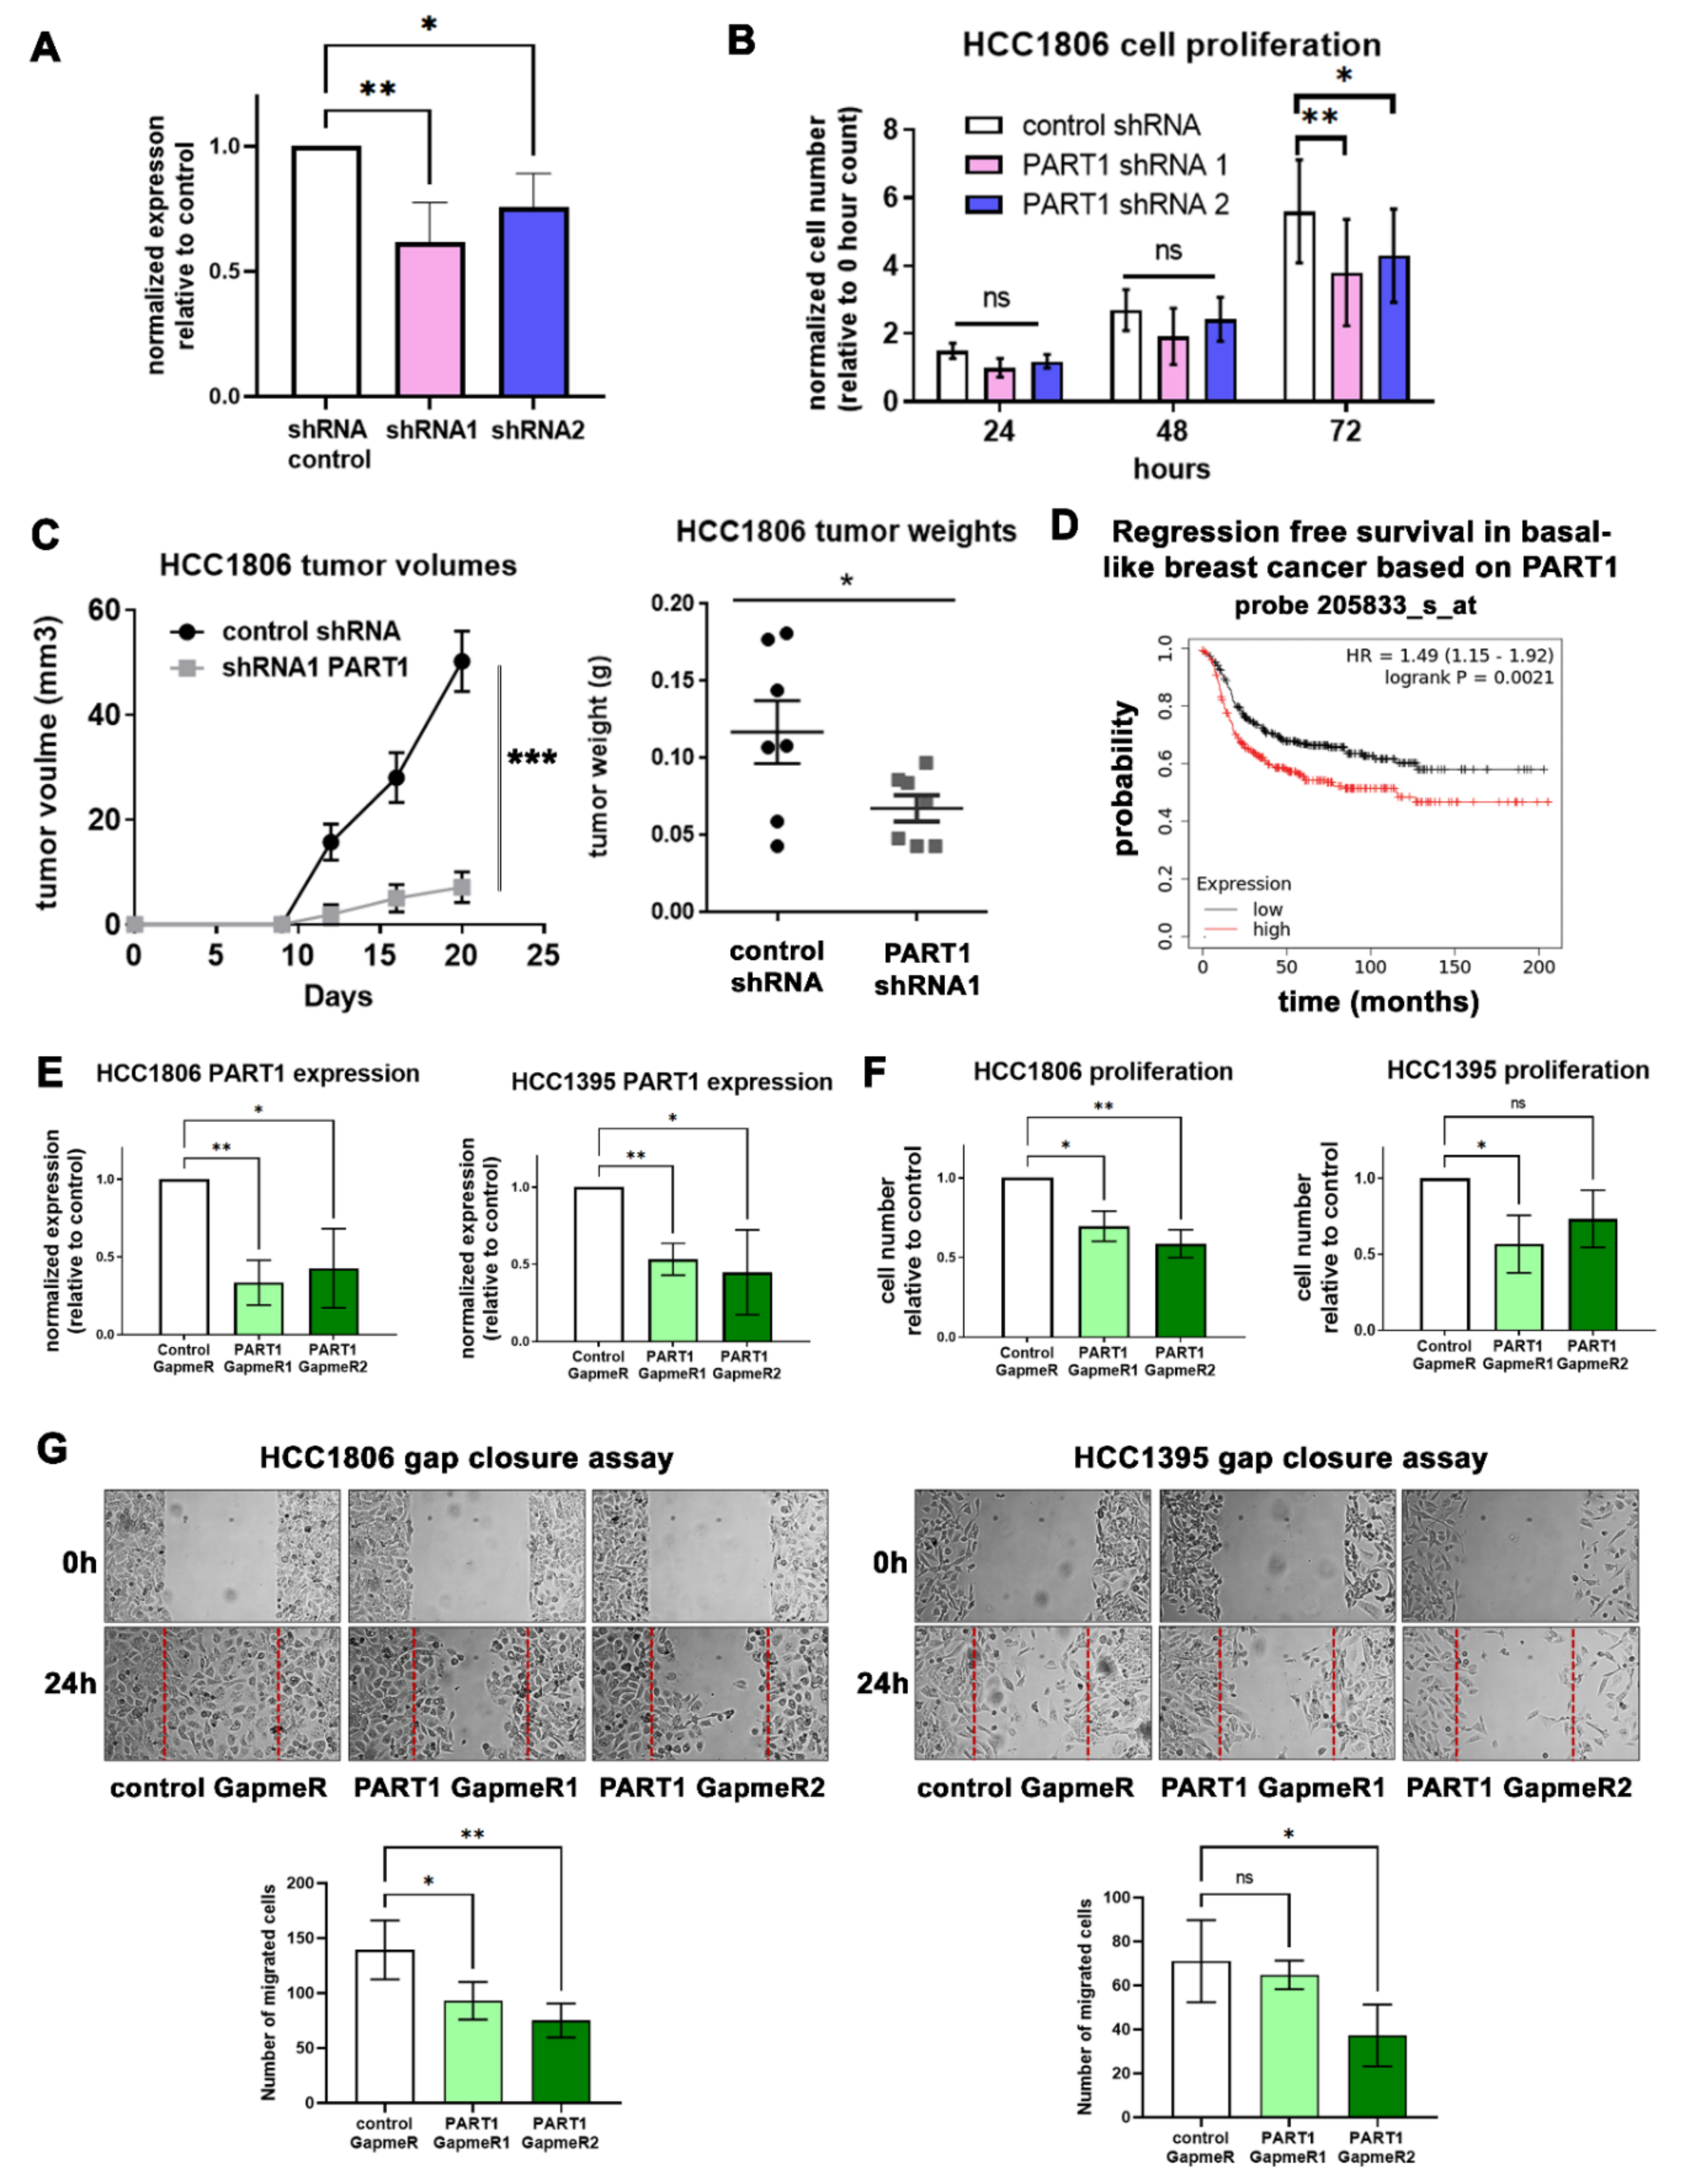
3.2. PART1 Is Oncogenic in Triple-Negative Breast Cancer Cells

Given the predominant expression of PART1 in TNBC patients (Figure 1A,B), we focused our functional analyses to TNBC cell lines. We prioritized adherent TNBC cell lines with the highest PART1 expression (HCC1806 and HCC1395) for our assays. Since the androgen induction response (although significant) is minimal in TNBC cells (Figure 1I), and that there is no connection between androgen signaling and PART1 in breast cancer patient tumors (Figure S1), we opted to not use charcoal-stripped FBS and phenol red-free media for the functional assays.
We were able to generate a modest stable knockdown of PART1 in HCC1806 cells (Figure 2A). We observed that PART1 knockdown decreased HCC1806 cell proliferation (Figure 2B). To assess the role of PART1 in vivo, we injected HCC1806 scramble control and PART1 knockdown cells into the mammary fat pads of several NOD/SCID mice and found that PART1 knockdown significantly decreased tumor volumes and tumor weights (Figure 2C). Consistent with the in vitro and in vivo data, high PART1 expression was generally associated with worse survival in basal-like breast cancers patients based on median cutoffs for high versus low expression (Figure 2D, Table S2).
Given that antisense oligonucleotides (GapmeRs) can also be used to target lncRNAs, we treated HCC1806 and HCC1395 cells with PART1-specific GapmeRs. This resulted in decreased PART1 expression in both cell lines (Figure 2E), and a corresponding decrease in cell proliferation (Figure 2F), and migratory capacity (Figure 2G). We detected some effects on apoptosis in the PART1 shRNA knockdown clones, but none in the GapmeR-treated cells, nor detectable caspase 3 cleavage, leading us to conclude that PART1 inhibition has minimal effects on apoptosis (Figure S2). Together, these results support the hypothesis that PART1 is oncogenic in breast cancer. Furthermore, since PART1-mediated cell proliferation and migration can be reduced using PART1-specific antisense oligonucleotides (which can be applied therapeutically), PART1 may represent a novel therapeutic target for TNBC.

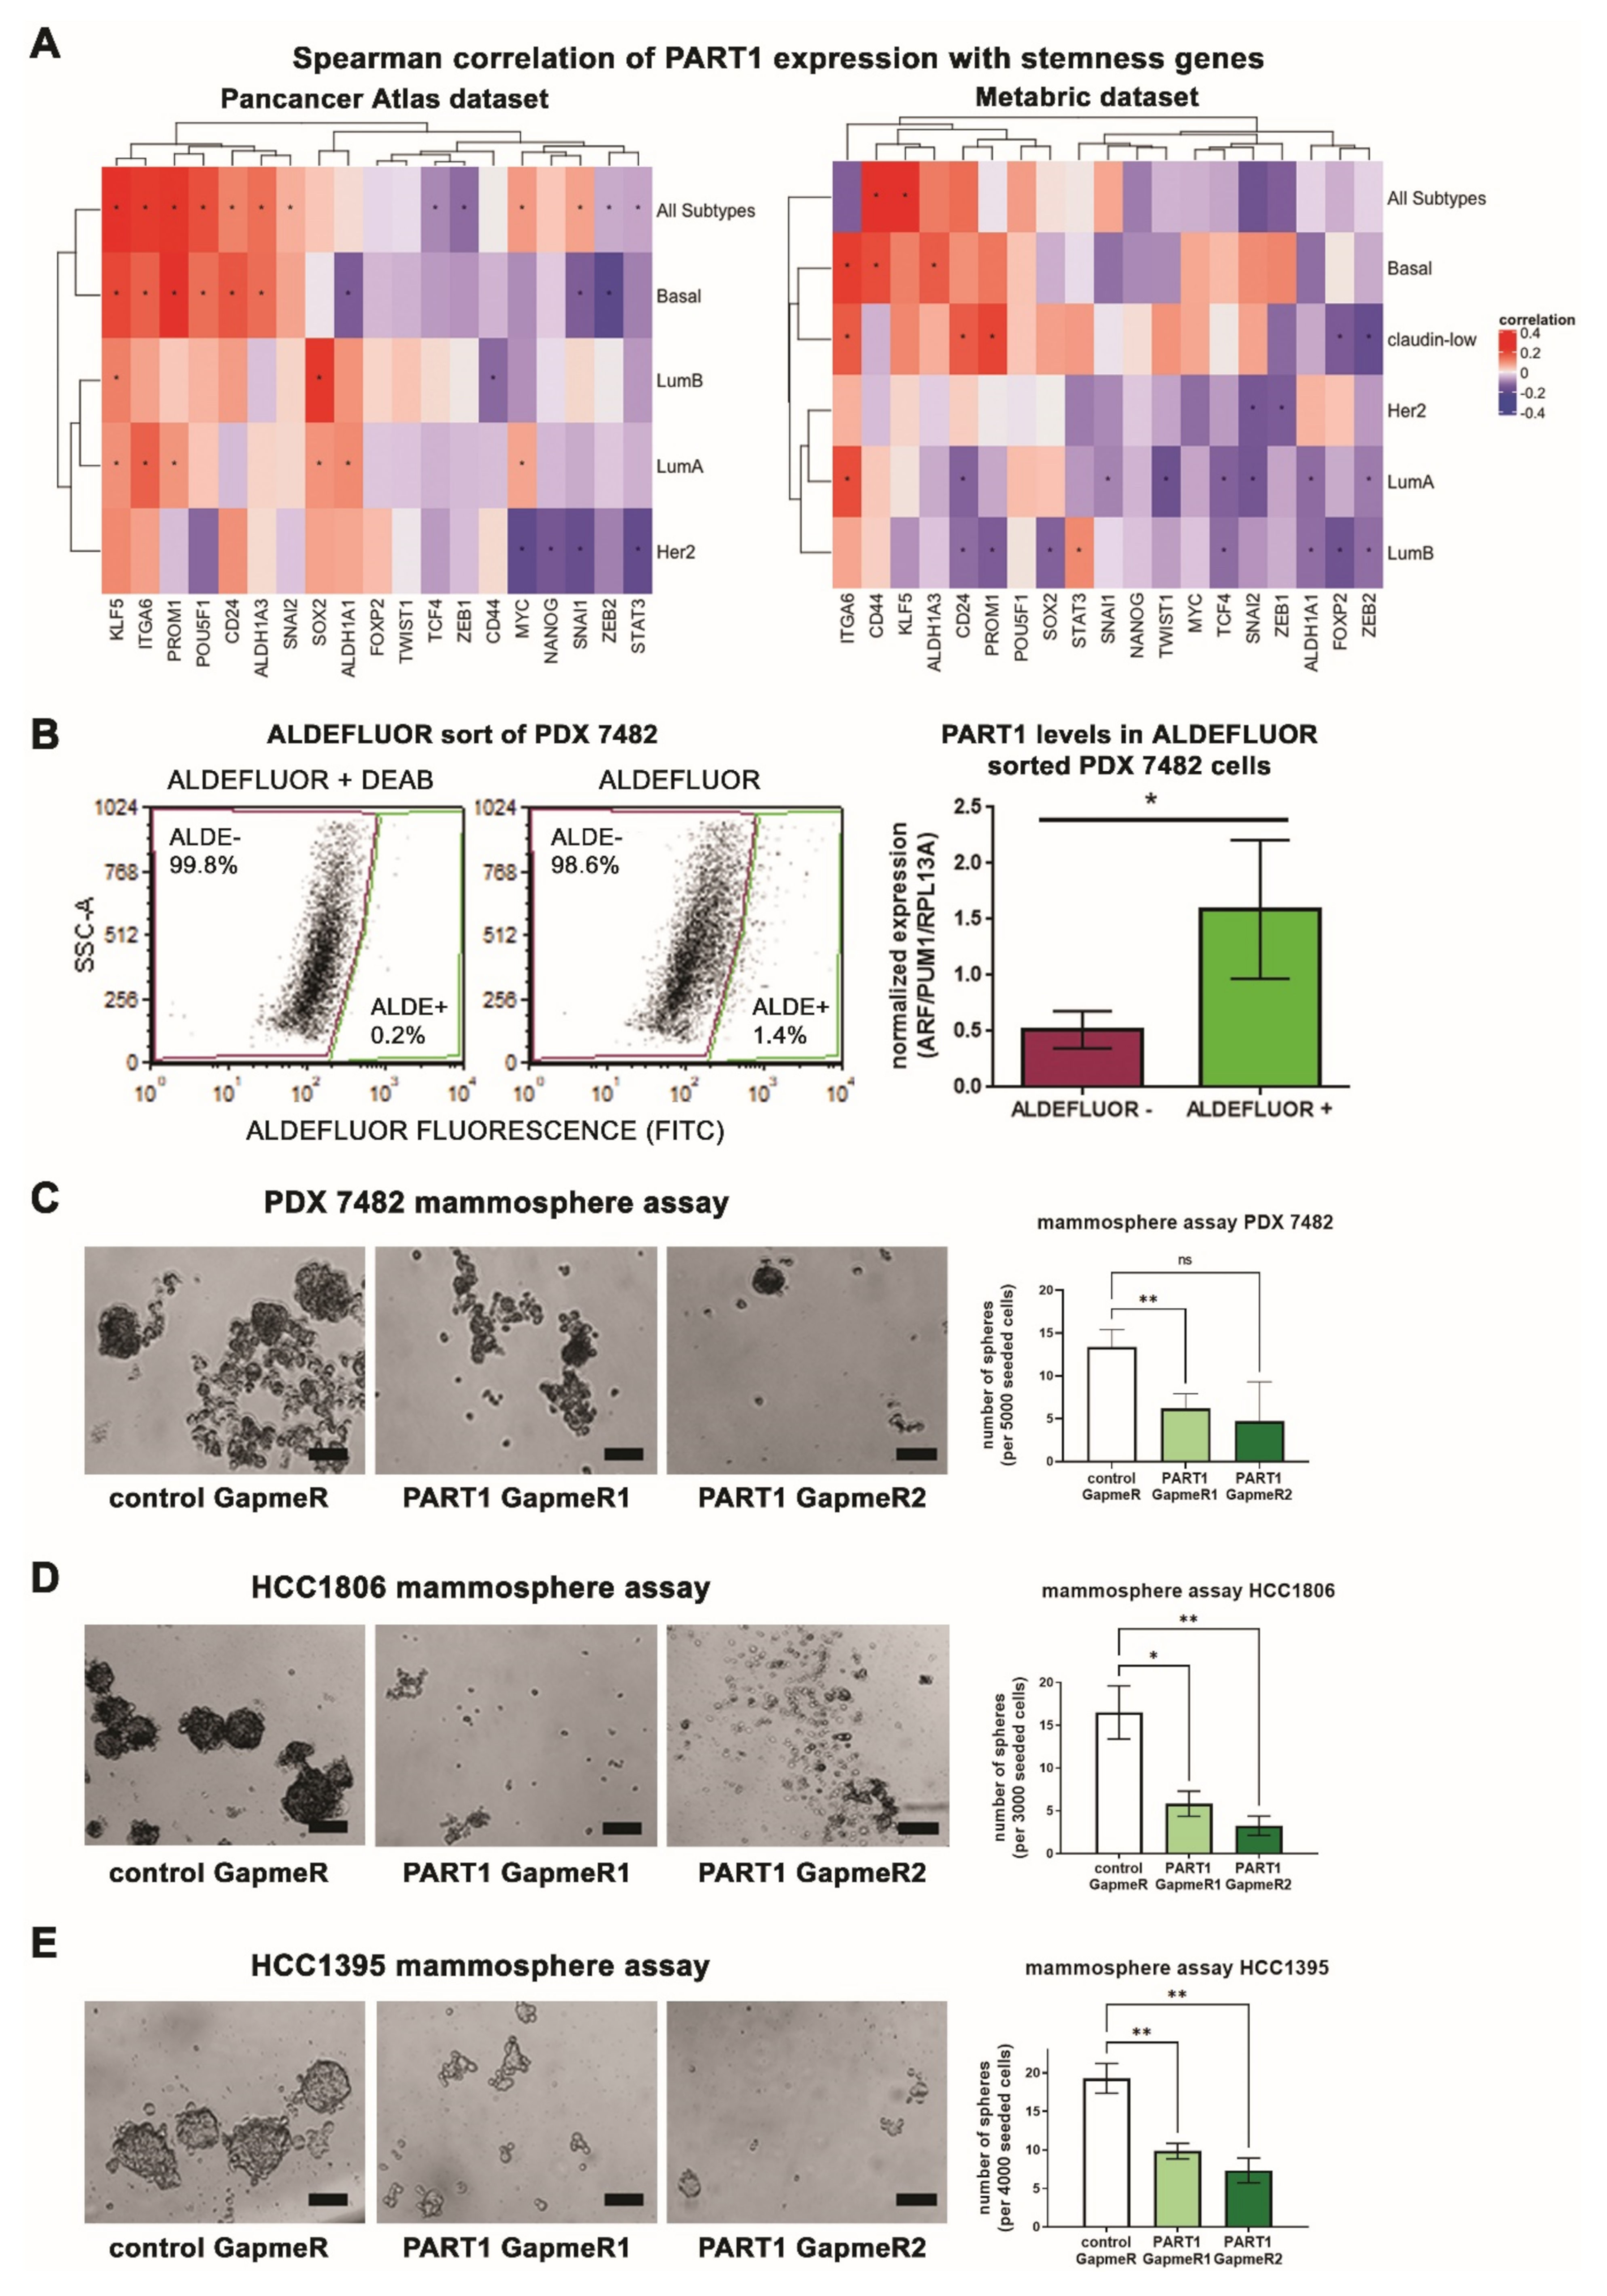
3.3. PART1 Expression Is Associated with Stemness Gene Expression, Aldefluorhigh Cancer Stem Cells, and Contributes to Mammosphere Formation Potential

Given that basal-like/TNBCs have higher proportions of tumor-initiating CSCs relative to other subtypes [11,12,13,14,15,16,17], we wondered if PART1 expression is also associated with CSCs. We assessed the co-expression of PART1 with CSC markers and stemness genes in breast cancer patient tumor datasets (Figure 3A,B, File S1), and noted significant correlations, especially in the basal-like subtype. Across both patient tumors datasets, PART1 expression was significantly positively associated with expression of CSC marker ALDH1A3, the primary cause of the Aldefluor activity in breast CSC cells [34], and CSC-associated gene integrin alpha 6 (ITGA6, also known as CD49f), which is regulated by ALDH1A3 [48].
We used the Aldefluor assay to interrogate the expression of PART1 in Aldefluorhigh sorted cells and in the TNBC patient-derived xenograft (PDX) model 7482. Notably, we have previously determined that the sorted Aldefluorhigh cells of PDX7482 are more tumorigenic in mice than Aldefluorlow cells [5]. Hence the PDX has been validated as having CSC populations defined by high Aldefluor activity. PART1 expression was enriched in the sorted Aldefluorhigh populations (Figure 3C), in agreement with the patient gene expression data (Figure 3A,B).
We assessed if the GapmeR treatment affected the percentage of Aldefluorhigh cells directly (Figure S3). We noted no significant changes on the percentages of Aldefluorhigh cells, suggesting that treatment with PART1 GapmeR does not selectively target Aldefluorhigh cells. Breast CSCs/tumor initiating cells (TICs) have an increased capacity to form mammospheres in non-adherent cell culture conditions and sphere-forming potential is an accepted in vitro readout of tumor forming capacity and stemness [32,48,49]. Thus, we evaluated whether PART1 inhibition affects the mammosphere-forming potential of TNBC PDX 7482, HCC1806, and HCC1395 cells. Treatment of the cells with anti-PART1 GapmeRs decreased the mammosphere forming potential of PDX 7482, HCC1806, and HCC1395 cells (Figure 3C–E). Together these results suggest that PART1 is an Aldefluorhigh/CSC-associated lncRNA, that when inhibited, impairs mammosphere forming potential, thereby marking it as a potential anti-breast CSC target.

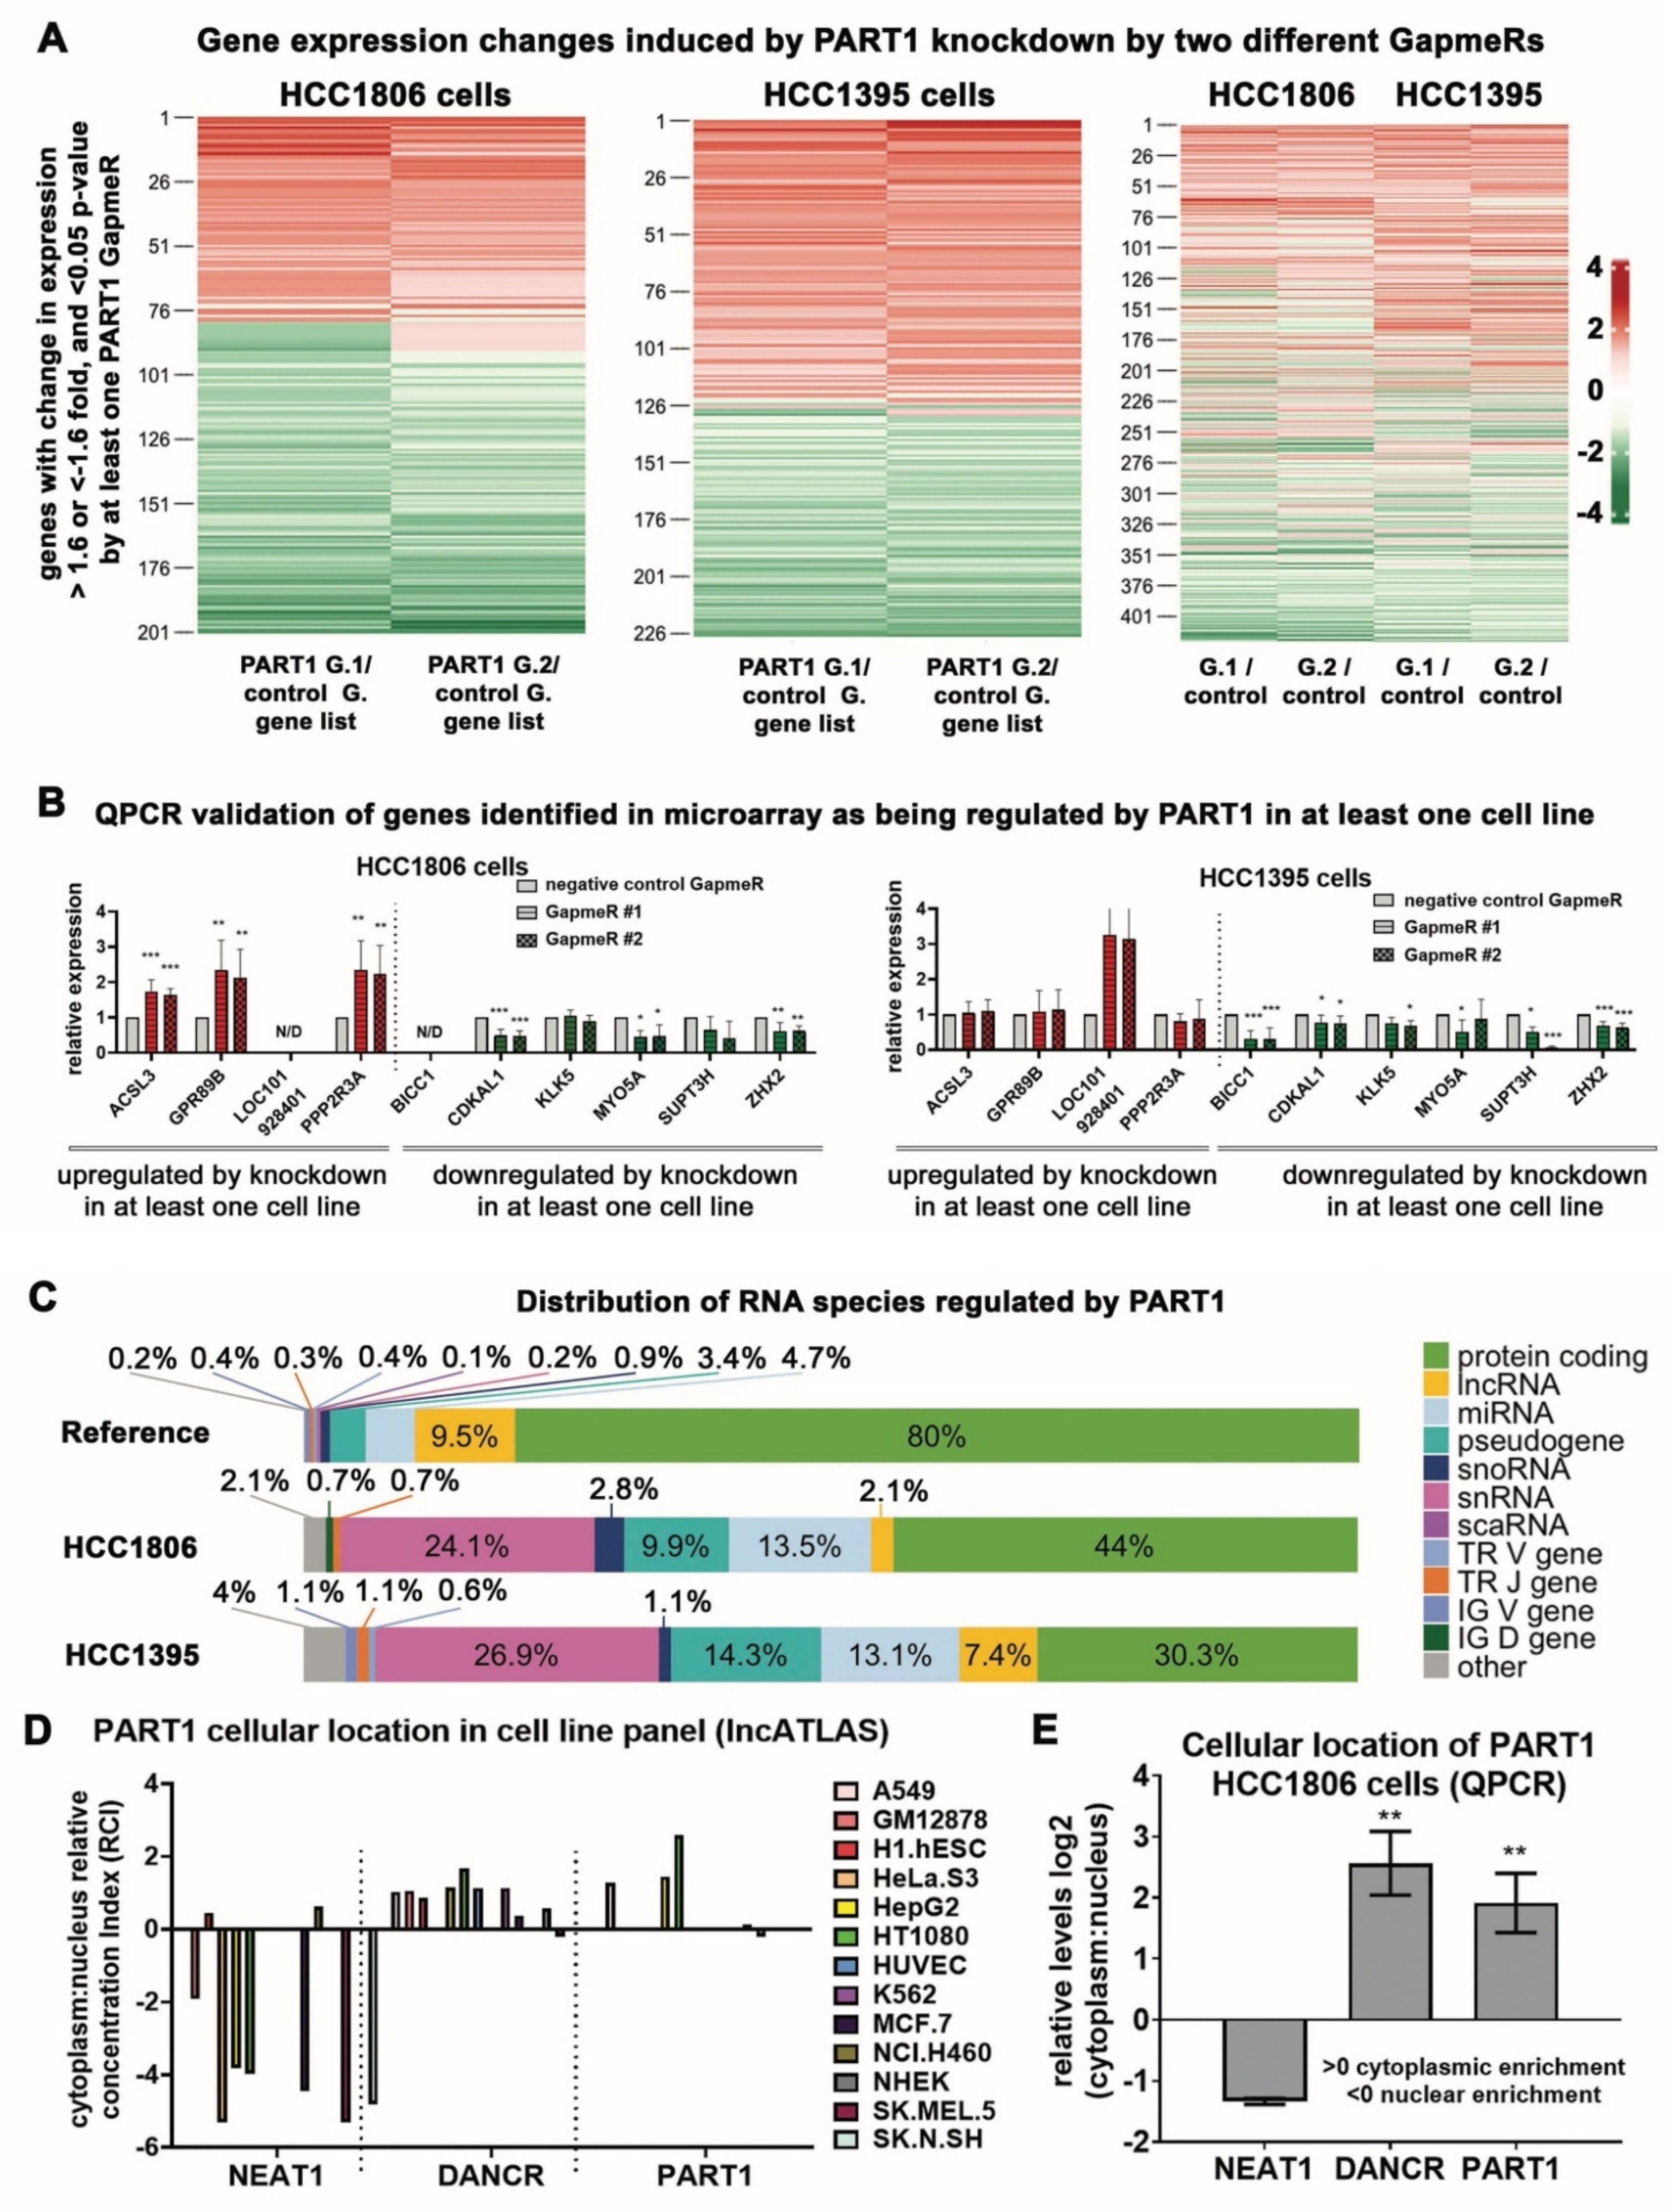
3.4. PART1 Induces Gene Expression Changes in Triple-Negative Breast Cancer Cells and Is Predominately Cytoplasmic

We next wondered how PART1 was mediating these effects in TNBC. Given the predominate role of lncRNAs in gene regulation [37], it is likely that PART1 contributes to gene expression regulation in TNBC cells. The microarray gene chip transcriptome analyses revealed that PART1 knockdown with GapmeRs altered expression of hundreds of genes in HCC1806 and HCC1395 cells (Figure 4A, File S2). The heatmap analysis revealed a high degree of gene expression overlap between the two GapmeRs within the two cell lines, with partial overlap across the cell lines (Figure 4A).
To validate the gene chip array results, we performed QPCR on genes significantly differentially expressed upon PART1 knockdown in one or both cell lines (Figure 4B). This confirmed both common (e.g., myosin-Va, MYO5A; zinc fingers and homeoboxes protein 2, ZHX2) and distinct gene regulation by PART1 across cell lines, or in only HCC1395 (e.g., bicaudal C homolog 1, BICC1) or HCC1806 (e.g., serine/threonine-protein phosphatase 2A regulatory subunit B, PPP2R3A) cells.
Consistent with the oncogenic effects of PART1 in the TNBC cells, PART1 knockdown downregulated MYO5A, ZHX2 and BICC1, which have all been implicated in cancer progression [49,50,51,52]. In contrast, PART1 knockdown upregulated PPP2R3A, which is a suspected tumor suppressor [53]. We detected minimal changes in gene expression of CSC markers, stemness genes and androgen signaling genes (Figure S4 and Figure S5).
It is also notable that most of the transcript changes induced by PART1 in the TNBC cells are in non-coding genes, including other lncRNAs, miRNAs and small nuclear RNAs (Figure 4C). Considering that the Human Gene 2.0 ST Array has more coverage of the coding genome, the transcript changes induced by PART1 are over-represented among non-coding genes in the TNBC cells. Given that regulatory nature of non-coding RNAs, PART1 may be indirectly affecting protein-coding gene expression by modulating these transcripts. This could explain the distinct PART1-mediated gene regulation in the cell lines, which would also depend upon the cell-line specific abundance of these non-coding RNAs.
Sub-cellular fractionization partially defines the mode of gene regulation of a lncRNA, where nuclear lncRNAs are often chromatin modifiers and cytoplasmic lncRNAs may act as miRNA sponges (i.e., competitive endogenous RNAs, ceRNAs) [37]. Thus, to determine how PART1 may be affecting gene expression, we first assessed its cellular localization. The LncATLAS database provides relative cellular fraction concentrations of over 6000 lncRNAs (determined by RNA-seq) across a panel of cell lines, including one breast cancer cell line, ER+/PR+ MCF7 cells [36]. In comparison to highly nuclear lncRNA NEAT1 and cytoplasmic lncRNA DANCR, PART1 is predominately cytoplasmic in the cell lines assessed by LncATLAS (Figure 4D). To validate these findings in TNBC, we performed subcellular fractionation of HCC1806 cells followed by QPCR on the nuclear and cytoplasmic fractions. Similar to the LncATLAS data, we found that PART1 is predominately cytoplasmic in the TNBC cells (Figure 4E). These localization results, in addition to the large portion of non-coding transcripts regulated by PART1 in the gene array, indicate that PART1 may interact with miRNAs to regulate gene expression in TNBC.

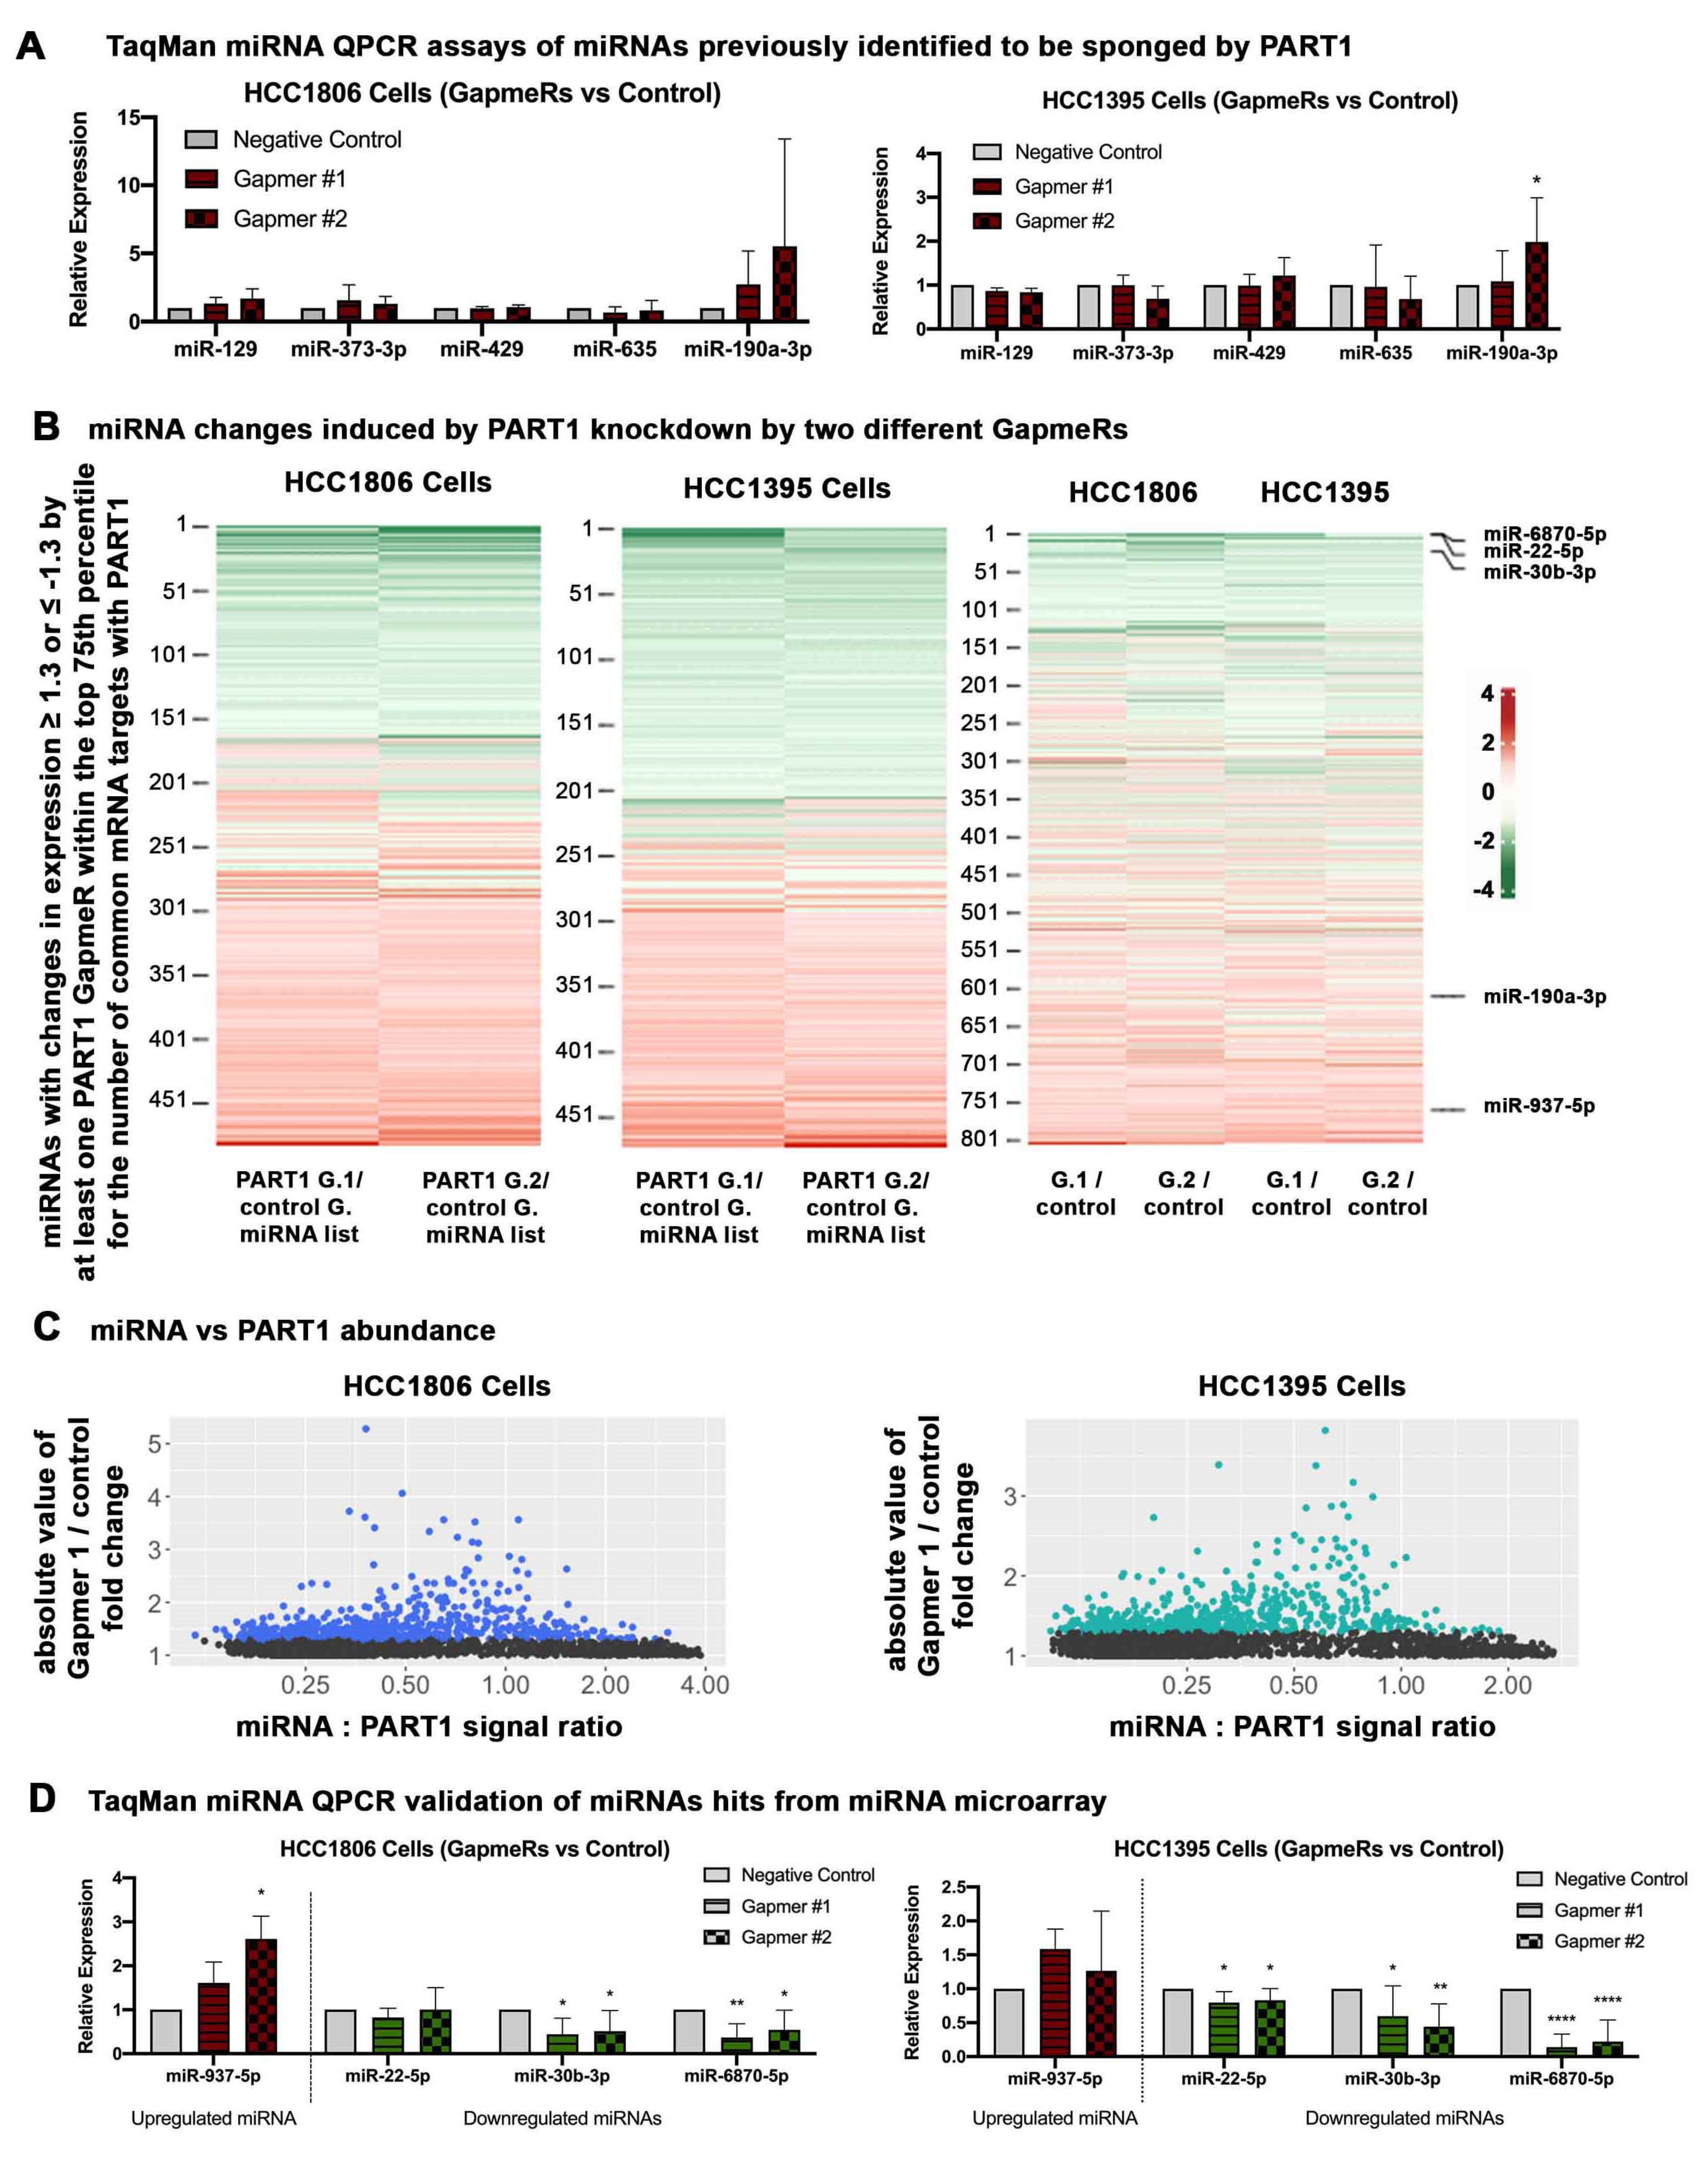
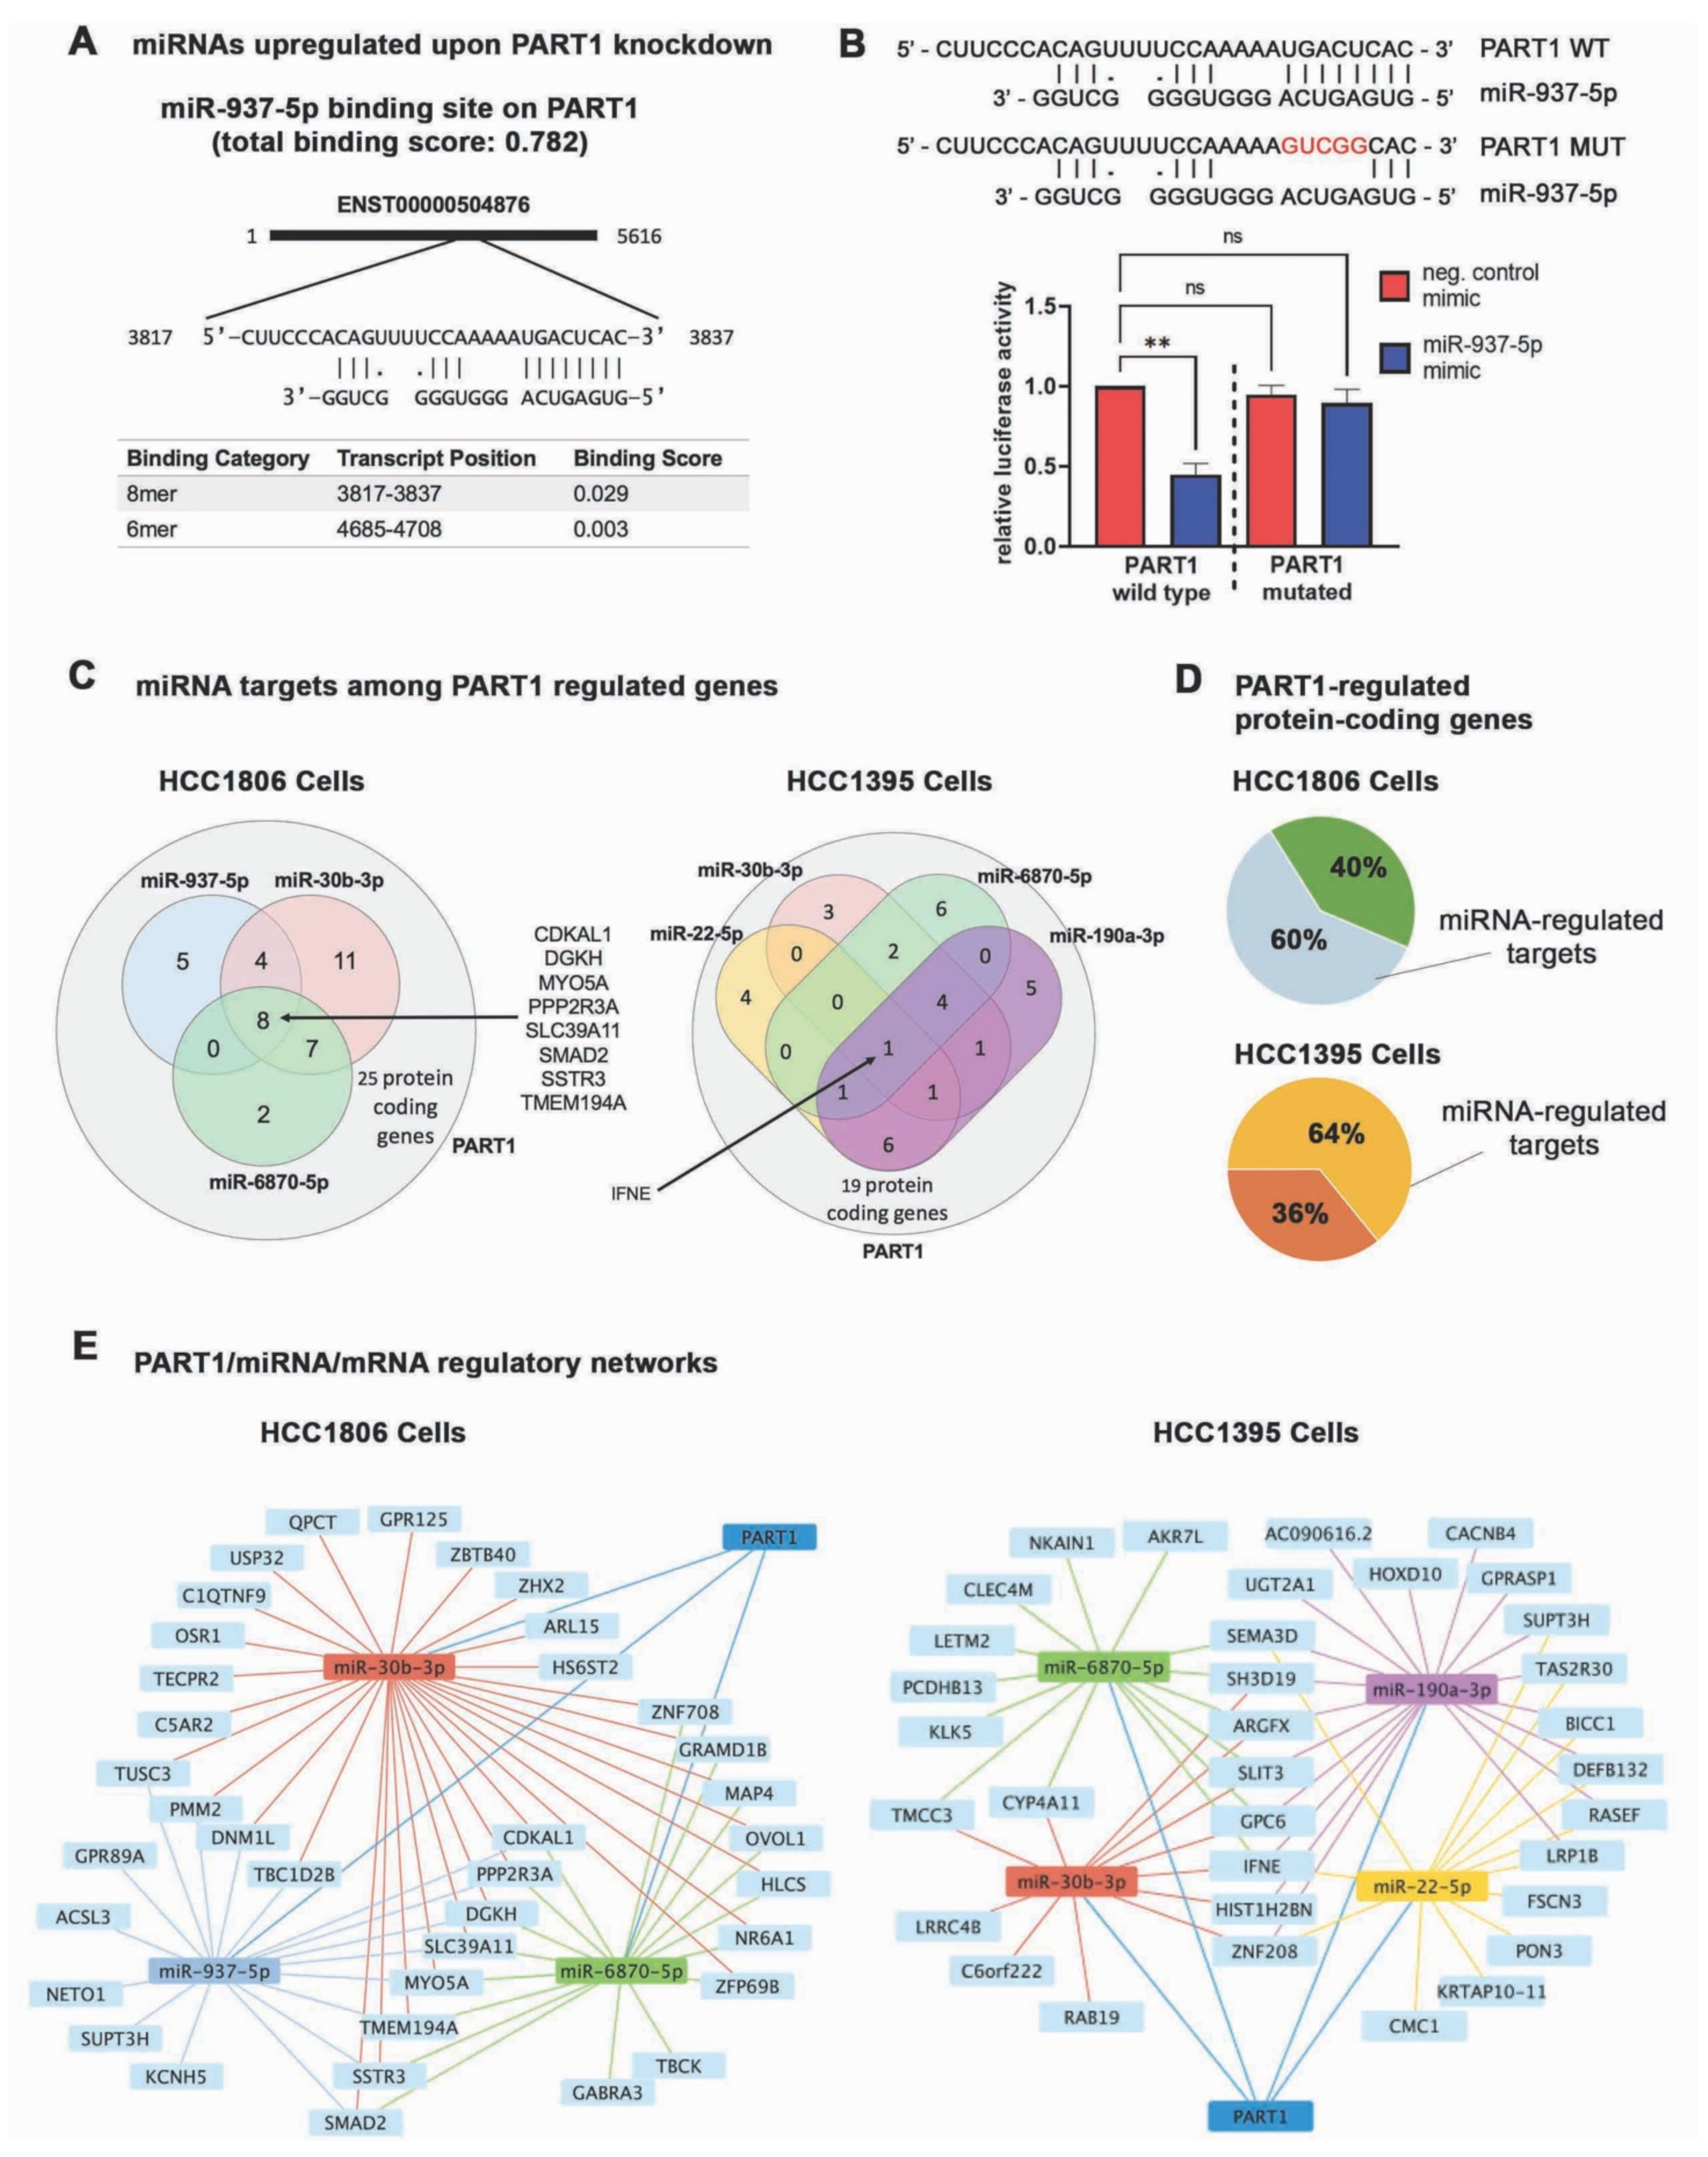
3.5. PART1 Alters the miRNA Landscape in Triple-Negative Breast Cancer Cells

Previous reports have shown that PART1 acts as a ceRNA on seven miRNA targets; miR-635 [54], miR-129 [28], miR-373-3p [55], miR-429 [55], miR-150-5p [56,57], miR-143-3p [27], and miR-190a-3p [30]. We used TargetScan [55] to identify the predicted mRNA targets for each of these seven miRNAs. We then compared these mRNA hits to our list of genes downregulated or upregulated by PART1 knockdown in TNBC cells (thresholds of ±1.6-fold change, p value < 0.05, File S2) to determine which miRNAs are predicted to regulate the same mRNAs as PART1. Of note, miR-190a-3p had the greatest number of predicted mRNA targets among our gene lists (File S3). In contrast, miR-150-5p and miR-143-3p had only one predicted mRNA target within our gene list.
We therefore proceeded with quantifying the levels of the five miRNAs that had at least 4 predicted mRNA hits within our gene list (i.e., miR-190a-3p, miR-635, miR-429, miR-129, miR-373-3p). We isolated mature miRNAs from the TNBC cells using the miRVana kit and quantified the levels of the miRNAs with specific TaqMan miRNA assays. Only miR-190a-3p was increased upon PART1 knockdown in TNBC cells; however, it was significant in only one knockdown in HCC1395 cells (Figure 5A). This suggests that there are likely additional mechanisms contributing to the PART1-mediated gene regulation we describe in Figure 4.
None of the prior studies that identified miRNA targets of PART1 performed an “omics” approach to identify all potential PART1-miRNA interactions (i.e., they focused on characterizing individual miRNA interactions). The DIANA web-based tool LncBase v2 predicts that there are over 400 mature miRNAs that could theoretically be sponged by at least one PART1 transcript (threshold set to 0.7, File S4). This is perhaps not surprising given that PART1 encodes multiple transcripts, the largest one being over 5000 bases in length, giving significant opportunity for miRNA interactions. While the miRNA-binding prediction tool does not consider factors such as PART1 and miRNA abundance, nor the secondary and tertiary structure of the lncRNA (which would physically exclude certain interactions), it does suggest that an omics-based approach is warranted for experimentally identifying miRNAs that may be regulated by PART1. We therefore performed gene chip 4.0 miRNA arrays, designed to interrogate all miRNA sequences in miRBase Release 20 on HCC1806 and HCC1395 cells (File S5).
The miRNA gene chip array analysis revealed that PART1 knockdown both increased and decreased several mature miRNAs in the TNBC cells (Figure 5B; Figure S6, volcano plots). We identified a list of miRNAs potentially regulated by PART1 in TNBC cells that had predicted mRNA targets within our gene lists of PART1-regulated mRNAs (Figure 5B, File S5). The heatmap analysis of the miRNAs revealed a high degree of overlap between the two GapmeR-treated samples with partial overlap across the two cell lines (Figure 5B). We noted that miRNAs that were regulated by PART1 with at least a 1.3-fold change were mostly less abundant than PART1, and generally between a miRNA:PART1 abundance ratio of 0.25 to 1 (Figure 5C, Figure S7). This suggests that miRNA:PART1 abundance is a cell line-specific factor in determining the effect of the lncRNA on a miRNA in a cell, regardless of its potential for interaction (i.e., sequence complementarity). Of note, the miRNAs that were previously described as being sponged by PART1 in other tissues and cancers were lowly expressed in the TNBC cells (File S5). This could explain why we did not detect the regulation of miR-635, miR-429, miR-129, miR-373-3p by PART1. Perhaps most surprising was the number of miRNAs decreased upon PART1 knockdown. Although less commonly described, there are reports of lncRNAs increasing miRNAs (e.g., lncRNA transcripts are processed into mature miRNAs) [58,59], indicating that lncRNAs can also modulate gene expression by inducing miRNAs.
We confirmed the miRNA array results with QPCR using TaqMan advanced miRNA assays on PART1-regulated miRNAs with at least 15 predicted mRNA targets in HCC1806 cells or 9 predicated mRNA targets in HCC1395 cells among our PART1-regulated gene lists (upregulated miR-937-5p upon PART1 knockdown; downregulated miR-22-5p, miR-30b-3p, and miR-6870-5p upon PART1 knockdown; Figure 5D). The miRNAs decreased upon PART1 knockdown (miR-22-5p, miR-30b-3p, and miR-6870-5p) are not predicted to bind PART1. Furthermore, sequence analysis of PART1 suggests that miR-22-5p, miR-30b-3p, and miR-6870-5p are not direct products of PART1, indicating they may be regulated by an indirect mechanism. In contrast, both miR-937-5p and miR-190a-3p, which are increased upon PART1 knockdown, have predicted binding interactions with PART1 transcripts (Figure 6A, Figure S8), suggesting that these miRNAs are sponged by PART1.
In terms of being sponged by PART1, the interaction between PART1 and miR-190a-3p has already been demonstrated [30]; however, the interaction between miR-937-5p and PART1 remains to be experimentally confirmed. As such, we performed a miRNA luciferase reporter assay where the target sequence (or the mutated version) is cloned into the miRNA reporter vector downstream of the luciferase reporter open reading frame [60,61]. The constructs, along with miR-937-5p mimic or negative control mimic, were transfected into HCC1806 cells. A target sequence interaction with miR-937-5p would result in decreased luminescence in the assay. We only observed a significant decrease in luminescence upon miR-937-5p treatment with the wildtype target sequence, confirming the novel interaction between the PART1 sequence and miR-937-5p (Figure 6B).
To gain an appreciation for the full scope of the effects of PART1/miRNA-mediated gene regulation, we used TargetScan [55] to assess which of the mRNAs significantly regulated by PART1 could interact with the TaqMan assay-validated miRNAs in HCC1806 or HCC1395 cells (Figure 5A,D). This revealed that most of the PART1-regulated mRNAs (protein-coding genes that had predicted interactions with the TaqMan assay confirmed-regulated miRNAs) had common hits between the miRNAs (Figure 6C, File S2). Together, these data suggest that an altered miRNA landscape by PART1 affects 60% and 64% of the protein-coding genes regulated by PART1 in HCC1806 and HCC1395 cells, respectively (Figure 6D). In the TNBC cells, PART1 is at the center of a miRNA-mRNA network (Figure 6E). Novel interactions include PART1-miR-937-5p-MYO5A. Notably, we did not specify that upregulated miRNAs be paired with downregulated genes (and vice-versa) in the network, since miRNAs have been reported to induce mRNA transcripts, in contrast to their more commonly described translation inhibition and transcript decay effects [62]. The remaining gene expression changes induced by PART1 that are not directly connected to this network (40% of protein-coding genes in HCC1806 cells and 36% in HCC1395 cells) are hence independent of miRNA regulation changes.

4. Discussion

Next-generation sequencing technologies have provided an alternative glimpse into the mammalian genome, revealing that most genomic products are transcribed into non-coding RNAs such as lncRNAs. Further evaluation of lncRNAs indicated that many are dysregulated in breast cancer, resulting in repercussions for breast cancer cell proliferation, tumor growth and metastasis [63]. For this reason, we explored phenotypic and functional characteristics of lncRNA PART1 in breast cancer, which has been previously implicated in both oncogenic and tumor suppressive function in other cancer types including prostate, esophageal, lung, colorectal and glioblastoma. In esophageal and lung cancers, PART1 is oncogenic [24,25,28,64]. Some evidence suggests that PART1 may play a similar oncogenic role in breast cancer [31].
We used the METABRIC, Cell 2015, and PanCancer Atlas breast cancer datasets (extracted via cBioPortal) and KMplotter to assess PART1 expression in different breast cancer subtypes and its association with clinical data. We show that PART1 is most enriched in basal-like and TNBC patient tumors, although this did not appear to be due to increased AR signaling. There is likely another AR-independent regulation mechanism which leads to increased PART1 in basal-like/TNBC patient tumors.
To clarify the potential role of PART1 in breast cancer, we studied the consequence of its knockdown and inhibition in the TNBC cell lines and a PDX, assessed its expression correlations with breast cancer patient survival, and evaluated its association with CSC populations. More specifically, we revealed associations with ALDH1A3 and Aldefluorhigh CSC populations. This is an important distinction, since breast CSC populations can be defined by Aldefluor activity or CD44high/CD24low cell surface marker expression, and these populations have distinctive features with only partial overlap [65]. Together, our analyses uniformly suggest that PART1 exerts pro-survival/oncogenic effects in the cancer cells, including within CSC populations, likely due to increased PART1 expression within these populations. Further, our use of PART1-specific antisense oligonucleotides suggests that the lncRNA could be targeted in the treatment of breast cancer and targeting of CSCs. In the future, experiments where PART1 transcripts are overexpressed, resulting in increased mammosphere forming potential, proliferation and migration, would substantiate these data further.
In terms of function, the cumulative published data suggests that PART1 regulates gene expression by acting as a miRNA sponge, although these studies were all specifically characterizing a single PART1/miRNA/mRNA axis. In colorectal cancer, PART1 promotes tumor growth by acting as a ceRNA, sponging miR-143 [27]. Similarly, PART1 was shown to promote malignant progression of colorectal cancer through the miR-150-5p/LRG1 axis [56] and by sponging miR-150-5p to up-regulate the expression of CTNNB1 and activate Wnt/β-catenin signaling [57]. Conversely, PART1 has tumor suppressive function in glioma by sponging miR-190a-3p, leading to upregulation miR-190a-3p target PTEN (a tumor suppressor), which subsequently inactivates the PI3K/AKT pathway in glioma cell lines [30]. Our fractionation experiment suggests that PART1 is predominately located in the cytoplasm in TNBC cells, which is consistent with the function of a miRNA sponge. Future analysis by fluorescence in situ hybridization (FISH) would provide further proof and can, in principle, determine absolute numbers of PART1 molecules in the cellular compartments [64,66].
Based on its miRNA sponging activity, it is unsurprising that PART1 can have both oncogenic and tumor suppressive effects. Depending on the function and abundance of the mRNAs targeted by the miRNAs, sponging of miRNAs by PART1 can result oncogenic or tumor suppressive effects. For example, we found evidence of regulation of miR-190a-3p by PART1, but no subsequent effects on PTEN transcript levels, as was reported in the aforementioned glioma study [30]. We noted that PTEN is greater than 10-fold more abundant than miR-190-3p in HCC1806 and HCC1395 cells, which could explain why we failed to detect a corresponding effect on PTEN expression. Indeed, the abundance of mRNAs targeted by the miRNAs is a critical factor when considering the potential effects of a miRNA on mRNAs levels [67].
Our arrays and QPCR analyses revealed that PART1 has genome-wide effects on gene expression in TNBC. PART1 knockdown resulted in downregulation of cancer promoting genes like BICC1, MYO5A and ZHX2. MYO5A is an actin-dependent motor protein contributing to organelle transport. It is elevated in metastatic colorectal cancer and promotes migration and metastasis of lung, breast, and colon cancer cell lines [68]. MYO5A also promotes anchorage-independent growth, invasion and migration in melanoma [50]. The corresponding reduction in motility/migration upon PART1 inhibition is consistent with the reduction MYO5A levels. Putative RNA-binding protein BICC1 contributes to cell viability and is associated with poor prognosis among patients with oral [69] and gastric cancers [49], consistent with proposed oncogenic role of BICC1. Finally, ZHX2 is a transcriptional repressor which promotes clear cell renal cell carcinoma soft-agar and tumor growth [52]. In contrast, PART1 knockdown resulted in the upregulation of suspected tumor suppressor PPP2R3A, which encodes a regulatory subunit of protein phosphatase 2. PPP2R3A is highly methylated T- and B-acute lymphoblastic leukemia [70] and colon cancers [53], resulting in the silencing of this gene in these cancer. Thus, PART1 may be mediating its oncogenic effects through regulation of these genes.
Using target prediction tools, we found that many of the protein-coding gene expression changes induced by PART1 are linked to changes in miRNAs. In addition to known effects on miR-190-3p, we report novel PART1-mediated regulation of miR-937-5p, miR-22-5p, and miR-30b-3p in TNBC; all of which have been implicated in cancer progression in prior studies [71,72,73,74,75]. Additionally, we found that PART1 regulates miR-6870-5p; however, in contrast to the miRNAs listed above, miR-6870-5p has not been studied previously and its function remains uncharacterized.
Our work demonstrates that PART1 decreases and increases miRNAs; however, only some of the changes in miRNAs could be explained by PART1-mediated binding/sponging and none appear directly generated from PART1. This suggests that PART1 is altering the miRNA landscape (at least in part) by indirect mechanisms. Intriguingly, a large portion of the PART1-induced gene expression changes were within the non-coding genome. The changes in expression of non-coding genes suggests indirect PART1-dependent mechanisms which could lead to changes in mature miRNAs and mRNA levels. It would be of interest to perform similar genome-wide analyses on the effects of PART1 in other cancers and tissues to determine if the effects are generally true of PART1, or if they are specific to TNBC. Finally, we have not determined the effect of PART1 on the proteome, which could mediate at least part of the PART1 pro-oncogenic effects through interactions with proteins (e.g., by acting as a molecular scaffold). Hence, while we have advanced the knowledge of the role of this lncRNA in breast cancer, much remains to be studied to fully understand its function. Furthermore, it still needs to be determined if antisense oligonucleotides against PART1 therapeutically reduce TNBC tumors in mice.

5. Conclusions

In recent years, increasing numbers of lncRNAs have been identified as playing important roles in breast cancer progression and some of these have been specifically associated within the CSCs populations of breast cancers. With completion of this study, we now add PART1 to a growing shortlist of lncRNAs that are enriched in TNBC and breast CSCs. The targeting of PART1 with antisense oligonucleotides and resulting negative impact on breast cancer cells suggest that PART1 could be targeted in the treatment of TNBC. Mechanistically, our analyses go beyond characterizing a single mRNA and miRNA-PART1 interaction (e.g., miR-937-5p-PART1) to genome-wide analyses of mRNA transcript and miRNA changes. This reveals new information regarding the many potential effects that the lncRNA has on miRNAs, which are only partly explained by sponging. Genomic analyses on PART1 in other cancers will likely reveal similar effects; however, the miRNAs and mRNAs that are regulated by PART1 will differ and depend upon the cellular context.

Supplementary Materials

The following are available online at https://www.mdpi.com/article/10.3390/cancers13112644/s1, Figure S1. PART1 is associated with androgen response genes, Figure S2. PART1 knockdown induces minimal effects on apoptosis, Figure S3. PART1 GapmeR treatment does not change the percentage of Aldefluorhigh cells in HCC1806 and HCC1395 cells, Figure S4. PART1 knockdown has minimal effects on expression of CSC markers and stemness genes in HCC1806 and HCC1395 TNBC cells, Figure S5. PART1 knockdown induces minimal changes in gene expression of androgen signaling genes in HCC1806 and HCC1395 TNBC cells, Figure S6. Volcano plots of miRNA fold change and p value from 4.0 miRNA gene chip array, Figure S7. miRNA vs. PART1 abundance, Figure S8. The LncBase v2 predicted PART1 binding sites and affinity threshold score of miR-190a-3p, Table S1. Gene-specific primers, Table S2. Oligos for cloning into pmirGLO Dual-Luciferase miRNA Target Expression Vector, Table S3. Associations with PART1 with hazard ratio (HR) in breast cancer patient datasets based on median expression and survival, File S1–S5 are attached separately as Excel files.

Author Contributions

Conceptualization, B.M.C., M.-C.D.W. and P.M.; methodology, B.M.C., M.-C.D.W., C.V. and P.M.; validation, B.M.C. and M.-C.D.W.; formal analysis, B.M.C., M.-C.D.W., J.M.B., W.F., J.V., O.L.W., F.M.-Q., M.L.D., D.V., C.A.D. and P.M.; investigation, B.M.C., M.-C.D.W., J.M.B., W.F., J.V., O.L.W., F.M.-Q., M.L.D., D.V., C.A.D., C.V.; resources, P.M.; data curation, B.M.C., M.-C.D.W., J.M.B., W.F., J.V., O.L.W., F.M.-Q., M.L.D., D.V., C.A.D. and P.M.; writing—original draft preparation, B.M.C., M.-C.D.W., J.M.B. and P.M.; writing—review and editing, B.M.C., M.-C.D.W., J.M.B., W.F., J.V., O.L.W., F.M.-Q., M.L.D., D.V., C.A.D., C.V., G.D. and P.M.; supervision, G.D. and P.M.; project administration, P.M.; funding acquisition, P.M. All authors have read and agreed to the published version of the manuscript.

Funding

This research was funded by the Canadian Institutes of Health Research (CIHR, PJT 162313).

Institutional Review Board Statement

The study was conducted according to the guidelines of the Declaration of Helsinki and approved by the Canadian Council on Animal Care (CCAC) standards and were approved under animal protocol 17-011, March 2017–March 2019 (approved for 1 March 2017), by Dalhousie’s University Committee on Laboratory Animals (UCLA).

Informed Consent Statement

Informed consent was obtained from all subjects involved in the study.

Data Availability Statement

The raw data for the Affymetrix Human Gene 2.0 ST and MiRNA 4.0 gene chips have been deposited on GEO (GSE156114 and GSE163569).

Acknowledgments

P.M. and G.D. are Senior Scientists of the Beatrice Hunter Cancer Research Institute (BHCRI). B.M.C., M.L.D., and were supported by Nova Scotia Research and Innovation Graduate Scholarships and Killam Laureate scholarships. M.L.D. was also supported by CGS-D award from the CIHR. B.M.C. and D.V. were also supported by a Master’s award from the CIHR. M.-C.D.W., J.M.B., O.L.W. are partly supported by Genomics in Medicine scholarships from the Dalhousie Medical Research Foundation (DMRF), Cancer Research Training Program (CRTP) scholarships funded through the BHCRI and the Terry Fox Research Institute, and Scotia Scholars Awards funded through Research Nova Scotia. M.-C.D.W. and O.L.W. are also supported by scholarship from Dalhousie University’s Faculty of Medicine. O.L.W. is also supported by a Nova Scotia Graduate Scholarship. J.V. is supported in part by a postdoctoral fellowship in breast cancer research administered by the DMRF. C.V. was supported by a Scotia Scholars Award funded through the Nova Scotia Health Research Foundation. The PDX-AIM Core of Baylor College of Medicine that supplied the PDX used in this study is supported by institutional funding from both the Advanced Technology Cores and the Dan L. Duncan Cancer Center (P30 Cancer Center Support Grant NCI-CA125123). It is also supported by a Core Facility grant from the Cancer Prevention and Research Institute of Texas (CPRIT Core Facilities Support Grant RP170691). The graphical abstract was created with BioRender.com (accessed on 12 May 2021).

Conflicts of Interest

The authors declare no conflict of interest.

References

  1. Pandya, G.; Kirtonia, A.; Sethi, G.; Pandey, A.K.; Garg, M. The implication of long non-coding RNAs in the diagnosis, pathogenesis and drug resistance of pancreatic ductal adenocarcinoma and their possible therapeutic potential. Biochim. Biophys. Acta Rev. Cancer 2020, 1874, 188423. [Google Scholar] [CrossRef] [PubMed]
  2. Kansara, S.; Pandey, V.; Lobie, P.E.; Sethi, G.; Garg, M.; Pandey, A.K. Mechanistic Involvement of Long Non-Coding RNAs in Oncotherapeutics Resistance in Triple-Negative Breast Cancer. Cells 2020, 9, 1511. [Google Scholar] [CrossRef] [PubMed]
  3. Rinn, J.L.; Chang, H.Y. Genome regulation by long noncoding RNAs. Annu. Rev. Biochem. 2012, 81, 145–166. [Google Scholar] [CrossRef] [PubMed] [Green Version]
  4. Prensner, J.R.; Chinnaiyan, A.M. The Emergence of lncRNAs in Cancer Biology. Cancer Discov. 2011, 1, 391–407. [Google Scholar] [CrossRef] [PubMed] [Green Version]
  5. Vidovic, D.; Huynh, T.T.; Konda, P.; Dean, C.; Cruickshank, B.M.; Sultan, M.; Coyle, K.M.; Gujar, S.; Marcato, P. ALDH1A3-regulated long non-coding RNA NRAD1 is a potential novel target for triple-negative breast tumors and cancer stem cells. Cell Death Differ. 2019. [Google Scholar] [CrossRef] [PubMed]
  6. Pang, Y.; Wu, J.; Li, X.; Wang, C.; Wang, M.; Liu, J.; Yang, G. NEAT1/miR-124/STAT3 feedback loop promotes breast cancer progression. Int. J. Oncol. 2019. [Google Scholar] [CrossRef]
  7. Arun, G.; Spector, D.L. MALAT1 long non-coding RNA and breast cancer. RNA Biol. 2019, 16, 860–863. [Google Scholar] [CrossRef]
  8. Zhang, Y.; He, Q.; Hu, Z.; Feng, Y.; Fan, L.; Tang, Z.; Yuan, J.; Shan, W.; Li, C.; Hu, X.; et al. Long noncoding RNA LINP1 regulates repair of DNA double-strand breaks in triple-negative breast cancer. Nat. Struct. Mol. Biol. 2016, 23, 522–530. [Google Scholar] [CrossRef]
  9. Peddi, P.F.; Ellis, M.J.; Ma, C. Molecular basis of triple negative breast cancer and implications for therapy. Int. J. Breast Cancer 2012, 2012, 217185. [Google Scholar] [CrossRef]
  10. Shipitsin, M.; Campbell, L.L.; Argani, P.; Weremowicz, S.; Bloushtain-Qimron, N.; Yao, J.; Nikolskaya, T.; Serebryiskaya, T.; Beroukhim, R.; Hu, M.; et al. Molecular definition of breast tumor heterogeneity. Cancer Cell 2007, 11, 259–273. [Google Scholar] [CrossRef] [Green Version]
  11. Li, H.; Ma, F.; Wang, H.; Lin, C.; Fan, Y.; Zhang, X.; Qian, H.; Xu, B. Stem cell marker aldehyde dehydrogenase 1 (ALDH1)-expressing cells are enriched in triple-negative breast cancer. Int. J. Biol. Markers 2013, 28, 357–364. [Google Scholar] [CrossRef] [PubMed]
  12. Giatromanolaki, A.; Sivridis, E.; Fiska, A.; Koukourakis, M.I. The CD44+/CD24- phenotype relates to “triple-negative” state and unfavorable prognosis in breast cancer patients. Med. Oncol. 2011, 28, 745–752. [Google Scholar] [CrossRef] [PubMed]
  13. Wu, Y.; Sarkissyan, M.; Elshimali, Y.; Vadgama, J.V. Triple Negative Breast Tumors in African-American and Hispanic/Latina Women Are High in CD44+, Low in CD24+, and Have Loss of PTEN. PLoS ONE 2013, 8, e78259. [Google Scholar] [CrossRef] [PubMed] [Green Version]
  14. Tsang, J.Y.S.; Huang, Y.-H.; Luo, M.-H.; Ni, Y.-B.; Chan, S.-K.; Lui, P.C.W.; Yu, A.M.C.; Tan, P.H.; Tse, G.M. Cancer stem cell markers are associated with adverse biomarker profiles and molecular subtypes of breast cancer. Breast Cancer Res. Treat. 2012, 136, 407–417. [Google Scholar] [CrossRef] [PubMed]
  15. Perrone, G.; Gaeta, L.M.; Zagami, M.; Nasorri, F.; Coppola, R.; Borzomati, D.; Bartolozzi, F.; Altomare, V.; Trodella, L.; Tonini, G.; et al. In Situ Identification of CD44+/CD24− Cancer Cells in Primary Human Breast Carcinomas. PLoS ONE 2012, 7, e43110. [Google Scholar] [CrossRef] [PubMed] [Green Version]
  16. Ricardo, S.; Vieira, A.F.; Gerhard, R.; Leitão, D.; Pinto, R.; Cameselle-Teijeiro, J.F.; Milanezi, F.; Schmitt, F.; Paredes, J.; Leitao, D.; et al. Breast cancer stem cell markers CD44, CD24 and ALDH1: Expression distribution within intrinsic molecular subtype. J. Clin. Pathol. 2011, 64, 937–946. [Google Scholar] [CrossRef]
  17. Idowu, M.O.; Kmieciak, M.; Dumur, C.; Burton, R.S.; Grimes, M.M.; Powers, C.N.; Manjili, M.H. CD44+/CD24−/lowcancer stem/progenitor cells are more abundant in triple-negative invasive breast carcinoma phenotype and are associated with poor outcome. Hum. Pathol. 2012, 43, 364–373. [Google Scholar] [CrossRef]
  18. Ginestier, C.; Hur, M.H.; Charafe-Jauffret, E.; Monville, F.; Dutcher, J.; Brown, M.; Jacquemier, J.; Viens, P.; Kleer, C.G.; Liu, S.; et al. ALDH1 Is a Marker of Normal and Malignant Human Mammary Stem Cells and a Predictor of Poor Clinical Outcome. Cell Stem Cell 2007, 1, 555–567. [Google Scholar] [CrossRef] [PubMed] [Green Version]
  19. Lennox, K.A.; Behlke, M.A. Cellular localization of long non-coding RNAs affects silencing by RNAi more than by antisense oligonucleotides. Nucleic Acids Res. 2016, 44, 863–877. [Google Scholar] [CrossRef] [Green Version]
  20. Gutschner, T.; Hammerle, M.; Eissmann, M.; Hsu, J.; Kim, Y.; Hung, G.; Revenko, A.; Arun, G.; Stentrup, M.; Gross, M.; et al. The Noncoding RNA MALAT1 Is a Critical Regulator of the Metastasis Phenotype of Lung Cancer Cells. Cancer Res. 2013, 73, 1180–1189. [Google Scholar] [CrossRef] [Green Version]
  21. Leucci, E.; Vendramin, R.; Spinazzi, M.; Laurette, P.; Fiers, M.; Wouters, J.; Radaelli, E.; Eyckerman, S.; Leonelli, C.; Vanderheyden, K.; et al. Melanoma addiction to the long non-coding RNA SAMMSON. Nature 2016, 531, 518–522. [Google Scholar] [CrossRef]
  22. Schoch, K.M.; Miller, T.M. Antisense Oligonucleotides: Translation from Mouse Models to Human Neurodegenerative Diseases. Neuron 2017, 94, 1056–1070. [Google Scholar] [CrossRef] [Green Version]
  23. Lin, B.; White, J.T.; Ferguson, C.; Bumgarner, R.; Friedman, C.; Trask, B.; Ellis, W.; Lange, P.; Hood, L.; Nelson, P.S. PART-1: A novel human prostate-specific, androgen-regulated gene that maps to chromosome 5q12. Cancer Res. 2000, 60, 858–863. [Google Scholar] [PubMed]
  24. Sun, M.; Geng, D.; Li, S.; Chen, Z.; Zhao, W. LncRNA PART1 modulates toll-like receptor pathways to influence cell proliferation and apoptosis in prostate cancer cells. Biol. Chem. 2018, 399, 387–395. [Google Scholar] [CrossRef]
  25. Li, M.; Zhang, W.; Zhang, S.; Wang, C.; Lin, Y. PART1 expression is associated with poor prognosis and tumor recurrence in stage I-III non-small cell lung cancer. J. Cancer 2017, 8, 1795–1800. [Google Scholar] [CrossRef] [PubMed]
  26. Gu, W.; Ren, J.; Zheng, X.; Hu, X.; Hu, M. Comprehensive analysis of expression profiles of long non-coding RNAs with associated ceRNA network involved in gastric cancer progression. Mol. Med. Rep. 2019. [Google Scholar] [CrossRef] [PubMed] [Green Version]
  27. Hu, Y.; Ma, Z.; He, Y.; Liu, W.; Su, Y.; Tang, Z. PART-1 functions as a competitive endogenous RNA for promoting tumor progression by sponging miR-143 in colorectal cancer. Biochem. Biophys. Res. Commun. 2017, 490, 317–323. [Google Scholar] [CrossRef] [PubMed]
  28. Kang, M.; Ren, M.; Li, Y.; Fu, Y.; Deng, M.; Li, C. Exosome-mediated transfer of lncRNA PART1 induces gefitinib resistance in esophageal squamous cell carcinoma via functioning as a competing endogenous RNA. J. Exp. Clin. Cancer Res. 2018, 37, 171. [Google Scholar] [CrossRef]
  29. Zhang, X.-Q.; Sun, S.; Lam, K.-F.; Kiang, K.M.-Y.; Pu, J.K.-S.; Ho, A.S.-W.; Lui, W.-M.; Fung, C.-F.; Wong, T.S.; Leung, G.K.K. A long non-coding RNA signature in glioblastoma multiforme predicts survival. Neurobiol. Dis. 2013, 58, 123–131. [Google Scholar] [CrossRef] [PubMed]
  30. Jin, Z.; Piao, L.; Sun, G.; Lv, C.; Jing, Y.; Jin, R. Long Non-Coding RNA PART1 Exerts Tumor Suppressive Functions in Glioma via Sponging miR-190a-3p and Inactivation of PTEN/AKT Pathway. OncoTargets Ther. 2020, 13, 1073–1086. [Google Scholar] [CrossRef] [PubMed] [Green Version]
  31. Wang, Z.; Xu, R. lncRNA PART1 Promotes Breast Cancer Cell Progression by Directly Targeting miR-4516. Cancer Manag. Res. 2020, 12, 7753–7760. [Google Scholar] [CrossRef]
  32. Lombardo, Y.; de Giorgio, A.; Coombes, C.R.; Stebbing, J.; Castellano, L. Mammosphere Formation Assay from Human Breast Cancer Tissues and Cell Lines. J. Vis. Exp. 2015, 97, e52671. [Google Scholar] [CrossRef] [Green Version]
  33. Alam, M.; Rajabi, H.; Ahmad, R.; Jin, C.; Kufe, D. Targeting the MUC1-C oncoprotein inhibits self-renewal capacity of breast cancer cells. Oncotarget 2014, 5, 2622–2634. [Google Scholar] [CrossRef] [Green Version]
  34. Marcato, P.; Dean, C.A.; Pan, D.; Araslanova, R.; Gillis, M.; Joshi, M.; Helyer, L.; Pan, L.; Leidal, A.; Gujar, S.; et al. Aldehyde Dehydrogenase Activity of Breast Cancer Stem Cells Is Primarily Due to Isoform ALDH1A3 and Its Expression Is Predictive of Metastasis. Stem Cells 2011, 29, 32–45. [Google Scholar] [CrossRef] [PubMed]
  35. Sultan, M.; Vidovic, D.; Paine, A.S.; Huynh, T.T.; Coyle, K.M.; Thomas, M.L.; Cruickshank, B.M.; Dean, C.A.; Clements, D.R.; Kim, Y.; et al. Epigenetic Silencing of TAP1 in Aldefluor+Breast Cancer Stem Cells Contributes to Their Enhanced Immune Evasion. Stem Cells 2018, 36, 641–654. [Google Scholar] [CrossRef] [PubMed] [Green Version]
  36. Mas-Ponte, D.; Carlevaro-Fita, J.; Palumbo, E.; Pulido, T.H.; Guigo, R.; Johnson, R. LncATLAS database for subcellular localization of long noncoding RNAs. RNA 2017, 23, 1080–1087. [Google Scholar] [CrossRef] [PubMed] [Green Version]
  37. Rashid, F.; Shah, A.; Shan, G. Long Non-coding RNAs in the Cytoplasm. Genom. Proteom. Bioinform. 2016, 14, 73–80. [Google Scholar] [CrossRef] [PubMed] [Green Version]
  38. Ciriello, G.; Gatza, M.L.; Beck, A.H.; Wilkerson, M.D.; Rhie, S.K.; Pastore, A.; Zhang, H.; McLellan, M.; Yau, C.; Kandoth, C.; et al. Comprehensive Molecular Portraits of Invasive Lobular Breast Cancer. Cell 2015, 163, 506–519. [Google Scholar] [CrossRef] [Green Version]
  39. Cerami, E.; Gao, J.; Dogrusoz, U.; Gross, B.E.; Sumer, S.O.; Aksoy, B.A.; Jacobsen, A.; Byrne, C.J.; Heuer, M.L.; Larsson, E.; et al. The cBio Cancer Genomics Portal: An Open Platform for Exploring Multidimensional Cancer Genomics Data. Cancer Discov. 2012, 2, 401–404. [Google Scholar] [CrossRef] [Green Version]
  40. Gao, J.; Aksoy, B.A.; Dogrusoz, U.; Dresdner, G.; Gross, B.; Sumer, S.O.; Sun, Y.; Jacobsen, A.; Sinha, R.; Larsson, E.; et al. Integrative Analysis of Complex Cancer Genomics and Clinical Profiles Using the cBioPortal. Sci. Signal. 2013, 6, pl1. [Google Scholar] [CrossRef] [PubMed] [Green Version]
  41. Györffy, B.; Lanczky, A.; Eklund, A.C.; Denkert, C.; Budczies, J.; Li, Q.; Szallasi, Z. An online survival analysis tool to rapidly assess the effect of 22,277 genes on breast cancer prognosis using microarray data of 1809 patients. Breast Cancer Res. Treat. 2009, 123, 725–731. [Google Scholar] [CrossRef] [PubMed] [Green Version]
  42. Broad Institute. Cancer Cell Line Encyclopedia (CCLE). Available online: https://portals.broadinstitute.org/ccle (accessed on 12 May 2021).
  43. Paraskevopoulou, M.D.; Vlachos, I.; Karagkouni, D.; Georgakilas, G.; Kanellos, I.; Vergoulis, T.; Zagganas, K.; Tsanakas, P.; Floros, E.; Dalamagas, T.; et al. DIANA-LncBase v2: Indexing microRNA targets on non-coding transcripts. Nucleic Acids Res. 2016, 44, D231–D238. [Google Scholar] [CrossRef] [PubMed] [Green Version]
  44. Agarwal, V.; Bell, G.W.; Nam, J.-W.; Bartel, D.P. Predicting effective microRNA target sites in mammalian mRNAs. eLife 2015, 4, e05005. [Google Scholar] [CrossRef] [PubMed]
  45. Shannon, P.; Markiel, A.; Ozier, O.; Baliga, N.S.; Wang, J.T.; Ramage, D.; Amin, N.; Schwikowski, B.; Ideker, T. Cytoscape: A Software Environment for Integrated Models of Biomolecular Interaction Networks. Genome Res. 2003, 13, 2498–2504. [Google Scholar] [CrossRef] [PubMed]
  46. Lehmann, B.D.; Jovanović, B.; Chen, X.; Estrada, M.V.; Johnson, K.N.; Shyr, Y.; Moses, H.L.; Sanders, M.E.; Pietenpol, J.A. Refinement of Triple-Negative Breast Cancer Molecular Subtypes: Implications for Neoadjuvant Chemotherapy Selection. PLoS ONE 2016, 11, e0157368. [Google Scholar] [CrossRef]
  47. Sabatier, R.; Finetti, P.; Guille, A.; Adélaïde, J.; Chaffanet, M.; Viens, P.; Birnbaum, D.; Bertucci, F. Claudin-low breast cancers: Clinical, pathological, molecular and prognostic characterization. Mol. Cancer 2014, 13, 228. [Google Scholar] [CrossRef] [Green Version]
  48. Thomas, M.L.; De Antueno, R.; Coyle, K.M.; Sultan, M.; Cruickshank, B.M.; Giacomantonio, M.A.; Giacomantonio, C.A.; Duncan, R.; Marcato, P. Citral reduces breast tumor growth by inhibiting the cancer stem cell marker ALDH1A3. Mol. Oncol. 2016, 10, 1485–1496. [Google Scholar] [CrossRef] [Green Version]
  49. Zhao, R.; Peng, C.; Song, C.; Zhao, Q.; Rong, J.; Wang, H.; Ding, W.; Wang, F.; Xie, Y. BICC1 as a novel prognostic biomarker in gastric cancer correlating with immune infiltrates. Int. Immunopharmacol. 2020, 87, 106828. [Google Scholar] [CrossRef]
  50. Alves, C.; Moraes, M.H.; Sousa, J.F.; Pontes, C.L.S.; Ramão, A.; Yokoyama, S.; Trindade, D.M.; Fisher, D.E.; Espreafico, E.M. Myosin-Va Contributes to Manifestation of Malignant-Related Properties in Melanoma Cells. J. Investig. Dermatol. 2013, 133, 2809–2812. [Google Scholar] [CrossRef] [Green Version]
  51. Zhao, X.; Zhang, W.; Ji, W. MYO5A inhibition by miR-145 acts as a predictive marker of occult neck lymph node metastasis in human laryngeal squamous cell carcinoma. OncoTargets Ther. 2018, 11, 3619–3635. [Google Scholar] [CrossRef] [Green Version]
  52. Jin, X.; Yan, Y.; Wang, D. ZHX2 is an oncogenic driver of kidney cancer. Cancer Discov. 2018, 8, 1057. [Google Scholar]
  53. Dmitriev, A.A.; Beniaminov, A.D.; Melnikova, N.V.; Pushkova, E.N.; Gerashchenko, G.V.; Kudryavtseva, A.V.; Kashuba, V.I. Functional Hypermethylation of ALDH1L1, PLCL2, and PPP2R3A in Colon Cancer. Mol. Biol. 2020, 54, 204–211. [Google Scholar] [CrossRef]
  54. Zhu, D.; Yu, Y.; Wang, W.; Wu, K.; Liu, D.; Yang, Y.; Zhang, C.; Qi, Y.; Zhao, S. Long noncoding RNA PART1 promotes progression of non-small cell lung cancer cells via JAK-STAT signaling pathway. Cancer Med. 2019, 8, 6064–6081. [Google Scholar] [CrossRef] [Green Version]
  55. Zhu, Y.-J.; Jiang, D.-M. LncRNA PART1 modulates chondrocyte proliferation, apoptosis, and extracellular matrix degradation in osteoarthritis via regulating miR-373-3p/SOX4 axis. Eur. Rev. Med. Pharmacol. Sci. 2019, 23, 8175–8185. [Google Scholar] [CrossRef]
  56. Lou, T.; Ke, K.; Zhang, L.; Miao, C.; Liu, Y. LncRNA PART1 facilitates the malignant progression of colorectal cancer via miR-150-5p/LRG1 axis. J. Cell. Biochem. 2020, 121, 4271–4281. [Google Scholar] [CrossRef]
  57. Zhou, T.; Wu, L.; Ma, N.; Tang, F.; Zong, Z.; Chen, S. LncRNA PART1 regulates colorectal cancer via targeting miR-150-5p/miR-520h/CTNNB1 and activating Wnt/β-catenin pathway. Int. J. Biochem. Cell Biol. 2020, 118, 105637. [Google Scholar] [CrossRef]
  58. Yoon, J.-H.; Abdelmohsen, K.; Gorospe, M. Functional interactions among microRNAs and long noncoding RNAs. Semin. Cell Dev. Biol. 2014, 34, 9–14. [Google Scholar] [CrossRef] [Green Version]
  59. Venkatesh, J.; Wasson, M.-C.D.; Brown, J.M.; Fernando, W.; Marcato, P. LncRNA-miRNA axes in breast cancer: Novel points of interaction for strategic attack. Cancer Lett. 2021, 509, 81–88. [Google Scholar] [CrossRef]
  60. Clément, T.; Salone, V.; Rederstorff, M. Dual Luciferase Gene Reporter Assays to Study miRNA Function. Methods Mol. Biol. 2015, 1296, 187–198. [Google Scholar] [CrossRef] [PubMed]
  61. Zeng, Y. Sequence requirements for micro RNA processing and function in human cells. RNA 2003, 9, 112–123. [Google Scholar] [CrossRef] [Green Version]
  62. Ni, W.J.; Leng, X.M. Dynamic miRNA-mRNA paradigms: New faces of miRNAs. Biochem. Biophys. Rep. 2015, 4, 337–341. [Google Scholar] [CrossRef] [Green Version]
  63. Zhou, S.; He, Y.; Yang, S.; Hu, J.; Zhang, Q.; Chen, W.; Xu, H.; Zhang, H.; Zhong, S.; Zhao, J.; et al. The regulatory roles of lncRNAs in the process of breast cancer invasion and metastasis. Biosci. Rep. 2018, 38, BSR20180772. [Google Scholar] [CrossRef] [Green Version]
  64. Walsh, H.R.; Cruickshank, B.M.; Brown, J.M.; Marcato, P. The Flick of a Switch: Conferring Survival Advantage to Breast Cancer Stem Cells Through Metabolic Plasticity. Front. Oncol. 2019, 9, 753. [Google Scholar] [CrossRef] [PubMed]
  65. Cabili, M.N.; Dunagin, M.C.; McClanahan, P.D.; Biaesch, A.; Padovan-Merhar, O.; Regev, A.; Rinn, J.L.; Raj, A. Localization and abundance analysis of human lncRNAs at single-cell and single-molecule resolution. Genome Biol. 2015, 16, 20. [Google Scholar] [CrossRef] [Green Version]
  66. Dunagin, M.; Cabili, M.N.; Rinn, J.; Raj, A. Visualization of lncRNA by Single-Molecule Fluorescence In Situ Hybridization. Methods Mol. Biol. 2014, 1262, 3–19. [Google Scholar] [CrossRef]
  67. Arvey, A.; Larsson, E.; Sander, C.; Leslie, C.S.; Marks, D.S. Target mRNA abundance dilutes microRNA and siRNA activity. Mol. Syst. Biol. 2010, 6, 363. [Google Scholar] [CrossRef] [PubMed]
  68. Lan, L.; Han, H.; Zuo, H.; Chen, Z.; Du, Y.; Zhao, W.; Gu, J.; Zhang, Z. Upregulation of myosin Va by Snail is involved in cancer cell migration and metastasis. Int. J. Cancer 2009, 126, 53–64. [Google Scholar] [CrossRef]
  69. Wang, H.; Guo, Y.; Mi, N.; Zhou, L. miR-101-3p and miR-199b-5p promote cell apoptosis in oral cancer by targeting BICC1. Mol. Cell. Probes 2020, 52, 101567. [Google Scholar] [CrossRef]
  70. Dunwell, T.L.; Hesson, L.B.; Pavlova, T.V.; Zabarovska, V.; Kashuba, V.I.; Catchpoole, D.; Chiaramonte, R.; Brini, A.T.; Griffiths, M.; Maher, E.R.; et al. Epigenetic analysis of childhood acute lymphoblastic leukemia. Epigenetics 2009, 4, 185–193. [Google Scholar] [CrossRef] [Green Version]
  71. Wang, S.; Liu, F.; Ma, H.; Cui, X.; Yang, S.; Qin, R. circCDYL Acts as a Tumor Suppressor in Triple Negative Breast Cancer by Sponging miR-190a-3p and Upregulating TP53INP1. Clin. Breast Cancer 2020, 20, 422–430. [Google Scholar] [CrossRef]
  72. Kumar, B.; Khaleghzadegan, S.; Mears, B.; Hatano, K.; Kudrolli, T.A.; Chowdhury, W.H.; Yeater, D.B.; Ewing, C.M.; Luo, J.; Isaacs, W.B.; et al. Identification of miR-30b-3p and miR-30d-5p as direct regulators of androgen receptor signaling in prostate cancer by complementary functional microRNA library screening. Oncotarget 2016, 7, 72593–72607. [Google Scholar] [CrossRef] [PubMed] [Green Version]
  73. Han, M.; Wang, S.; Fritah, S.; Wang, X.; Zhou, W.; Yang, N.; Ni, S.; Huang, B.; Chen, A.; Li, G.; et al. Interfering with long non-coding RNA MIR22HG processing inhibits glioblastoma progression through suppression of Wnt/β-catenin signalling. Brain 2020, 143, 512–530. [Google Scholar] [CrossRef] [Green Version]
  74. Xiong, X.; Xu, W.; Gong, J.; Wang, L.; Dai, M.; Chen, G.; Yuan, L. miR-937-5p targets SOX17 to modulate breast cancer cell cycle and cell proliferation through the Wnt signaling pathway. Cell. Signal. 2021, 77, 109818. [Google Scholar] [CrossRef]
  75. Zeng, W.; Liu, Y.; Li, W.; Zhu, J. CircFNDC3B sequestrates miR-937-5p to derepress TIMP3 and inhibit colorectal cancer progression. Mol. Oncol. 2020, 14, 2960–2984. [Google Scholar] [CrossRef]
Figure 1. PART1 expression is enriched in TNBC patient tumors and is induced by androgenic molecules in breast cancer cells. (A,B) PART1 expression in breast cancer patient tumor cohorts based on molecular intrinsic subtypes, PAM50 or claudin-low (A) or TNBC status (B). Gene expression information was extracted from the TCGA PanCancer Atlas and Cell 2015 (RNA-seq) and the METABRIC (microarray) datasets via cBioPortal (1 May 2020). Significance comparing TNBC versus non-TNBC groups was determined using an unpaired two-tailed t-test, while comparisons of multiple groups determined with a one-way ANOVA followed by Tukey’s multiple comparison post-test. (C) Expression of PART1 in 57 breast cancer cell lines (RNA-seq) was extracted from the CCLE and grouped based on molecular intrinsic subtypes, significance assessed with a one-way ANOVA followed by Tukey’s multiple comparison post-test (no comparison was significant). (D) Expression of PART1 (QPCR) in 22 different breast cancer cell lines and two normal immortalized breast cell lines. Expression is relative to reference genes ADP-ribosylation factor 1 (ARF1) and pumilio RNA binding family member 1 (PUM1) (n = 4). Error bars represent standard error of the mean (SEM). (E) Expression of PART1 versus AR in 57 breast cancer cell lines (RNA-seq) was extracted from the CCLE. The correlation (r) and p-value were determined by Pearson’s correlation coefficient. (F) Expression of PART1 versus AR in breast cancer patient tumors from the Cell 2015 (RNA-seq) dataset was extracted via cBioPortal and the correlation (r) and p-value determine by Pearson’s correlation coefficient. (G) Expression of AR in 57 breast cancer cell lines (RNA-seq) was extracted from the CCLE and grouped based on molecular intrinsic subtypes, significance assessed with a one-way ANOVA followed by Tukey’s multiple comparisons post-test. (H) Expression of AR in breast cancer patient tumors based on molecular intrinsic subtypes was extracted from the Cell 2015 (RNA-seq) dataset via cBioPortal and a one-way ANOVA followed by Tukey’s multiple comparisons post-test was performed to determine significance. (I) The effect of R1881 synthetic androgen on PART1 expression in HCC1806 and T47D cells was assessed by QPCR and is reported relative to reference genes (PUM1 and ARF1) and control no treatment cells (n = 4–6). Significance was determined by a paired two-tailed t-test (error bars represent standard deviation, SD). (J) The effect of R1881 and AR antagonist D36 on PART1 expression in T47D cells was assessed by QPCR and is reported relative to reference genes (PUM1, ARF1, and beta-2 microglobulin (B2M)) and control no treatment cells (n = 4). Significance was determined by two-way ANOVA followed by Tukey’s multiple comparisons post-test. Significant p values are indicated as follows in the figures: p < 0.05 = *, p < 0.01 = **, p < 0.001 = ***, p < 0.0001 = ****. Non-significant p values are either indicated as ns, or not noted.
Cancers 13 02644 g001
Figure 2. PART1 expression promotes proliferation, migration, and tumor growth in TNBC cells. (A) PART1 expression (QPCR) following shRNA-induced knockdown in HCC1806 cells (n = 4). Expression is shown normalized to reference genes ARF1 and PUM1 and control cells. Significance was determined by a one-way ANOVA, followed by Dunnett’s post-test for multiple comparisons). Error bars represent SD. (B) The effect of PART1 knockdown on cell proliferation was quantified by counting the relative number of viable cells after 24, 48, and 72 h, using a trypan blue exclusion assay (n = 5, significance determined by a one-way ANOVA, followed by Dunnett’s post-test for multiple comparisons). Error bars represent SEM. (C) NOD/SCID mice were injected with either 10,000 HCC1806 scramble control shRNA clones or HCC1806 PART1 shRNA 1 clone cells (n = 7). Tumor volumes were determined with caliper measurements (l × w2/2) and final tumor weights were determined at termination (significance determined by an unpaired t-test). Error bars represent SEM. (D) Kaplan-Meier survival curves generated by KMplotter. Survival was compared between high vs. low PART1 (probe 205833_s_at) expression groups (where patients were stratified by median expression) in basal-like breast cancer (HR = hazard ratio). (E) QPCR analysis of PART1 expression following PART1-specific GapmeR-mediated knockdown (GapmeR #1 and #2) relative to control GapmeR and reference genes in HCC1806 (ARF1 and PUM1) and in HCC1395 cells (glyceraldehyde-3-phosphate dehydrogenase, GAPDH; beta-2 microglobulin, B2M) (n = 4, error bars represent SD). (F) The effect of GapmeR-mediated PART1 inhibition on cell proliferation was assessed by counting the relative number of viable cells 2 days after treatment using a trypan blue exclusion assay (n = 4, error bars represent SD). (G) The effect of GapmeR-mediated PART1 inhibition on cell migration was assessed by gap closure assay (n = 4). Significance was determined by one-way ANOVA, followed by Dunnett’s post-test for multiple comparisons. Significant p values are indicated as follows in the figures: p < 0.05 = *, p < 0.01 = **. Non-significant p values are either indicated as ns, or not noted.
Cancers 13 02644 g002
Figure 3. PART1 is associated with Aldefluorhigh breast CSC populations and its knockdown inhibits mammosphere formation in TNBC. (A) Spearman correlations of PART1 expression with expression of stemness and CSC-associated genes in breast cancer patient tumors in two datasets (TCGA PanCancer Atlas and METABRIC). p values were determined by the cor.test() function with the method argument set to Spearman in Rv4.2. * indicates p value < 0.05. (B) Representative flow cytometry plots of the Aldefluor assay completed on PDX 7482 cells. The Aldefluorhigh (ALDE+) and Aldefluorlow (ALDE-) were sorted. One sample had DEAB (an ALDH inhibitor) to ensure proper identification of the Aldefluorhigh population. PART1 expression in the sorted populations was determined by QPCR and made relative to the Aldefluorlow expression and normalized to reference genes (n = 3, significance was determined using a student’s t-test, error bars represent SD). (CE) PDX 7482 (C), HCC1806 (D), and HCC1395 cells (E) were treated with 15 nM GapmeR in technical triplicates (negative control or PART1-specific GapmeR #1 and 2) and seeded at 5000 cells/well (PDX 7482, n = 3), 3000 cells/well (HCC1806, n = 4), or 4000 cells/well (HCC1395, n = 4) in ultra-low adherence plates. The average number of resulting spheres greater than 50 μm (the length of the scale bar) in diameter per well were counted (representative images are shown). Significance was determined using a one-way ANOVA, followed by Dunnett’s post-test for multiple comparisons (error bars represent SEM). Significant p values are indicated as follows in the figures: p < 0.05 = *, p < 0.01 = **. Non-significant p values are either indicated as ns, or not noted.
Cancers 13 02644 g003
Figure 4. PART1 induces gene expression changes in HCC1806 and HCC1395 TNBC cells and is cytoplasmic. (A) Transcriptome changes induced by PART1 knockdown (Gapmer1 (G.1) or Gapmer2 (G.2) versus control GapmeR (control G.) were quantified in HCC1806 and HCC1395 cells using the Affymetrix Human Gene 2.0 ST microarray platform (n = 3). The heatmaps show genes with an expression fold change >1.6 or <−1.6 and a p-value < 0.05 induced by at least one PART1-specific GapmeR. (B) QPCR validation of some genes identified as upregulated by PART1 knockdown (green bars) or downregulated (red bars) by PART1 in (A) (n = 4–7, significance determined by one-way ANOVA, followed by Dunnett’s post-test for multiple comparisons). Error bars represent SD. Expression is normalized relative to the negative control and to reference genes PUM1 and ARF1. (C) The portion of genes (protein coding and non-coding (lncRNA, miRNA, snRNA, pseudogene, misc RNA, snoRNA) covered by the microarray (top) and the portion of genes regulated by PART1 that are in HCC1806 (middle) and HCC1395 (bottom) cells. (D) The LncATLAS [36] database was accessed to determine the relative concentration index (RCI) of PART1 in the nuclear versus cytoplasmic compartments in a panel of cell lines by RNA-seq. Well-established nuclear-localized lncRNA NEAT1 and cytoplasmic-localized lncRNA DANCR are included for comparison. (E) QPCR analysis of lncRNAs DANCR, NEAT1, and PART1 abundance in nuclear and cytoplasmic fractions of HCC1806 cells. Relative expression versus GAPDH is shown (n = 3, significance was determined using student’s t-test). Significant p values are indicated as follows in the figures: p < 0.05 = *, p < 0.01 = **, p < 0.001 = ***. N/D signifies not detected.
Cancers 13 02644 g004
Figure 5. PART1 knockdown alters the miRNA landscape in HCC1806 and HCC1935 TNBC cells. (A) TaqMan miRNA assays of miRNAs previously implicated as being sponged by PART1 in non-breast cancer cells were assessed in HCC1806 and HCC1935 cells with or without GapmeR-induced knockdown of PART1 (Gapmer1 (G.1) or Gapmer2 (G.2) versus control GapmeR (control G.) (n = 4–8, significance determined by one-way ANOVA, followed by Dunnett’s post-test for multiple comparisons). Error bars represent SD. miR-129, miR-373-3p, miR-429 and miR-635 levels were quantified by the TaqMan miRNA assays and the expression is normalized to reference miRNAs RNU48 and miR-221. miR-190a-3p levels were quantified by the TaqMan miRNA Advanced assays and expression is normalized to reference miRNAs miR-21-5p and miR-26b-5p. (B) The heatmaps show miRNAs with an expression fold change ≥1.3 or ≤−1.3 and within the top 75th percentile for the number of common mRNA targets with PART1 regulated mRNAs (corresponding to at least 15 common genes in HCC1806s cells and 9 in HCC1395 cells) induced by at least one PART1-specific GapmeR. (C) The abundance of all the miRNAs in the 4.0 miRNA gene chip array relative to PART1 (abundance extrapolated from File S2) detected in the in the negative control samples were calculated for HCC1806 and HCC1395 cells (average of 3n). (D) TaqMan miRNA advanced assays of some of the miRNAs identified as being upregulated or downregulated by PART1 knockdown in HCC1806 of HCC1935 cells in the gene chip array in (C) (n = 7–8, significance determined by one-way ANOVA, followed by Dunnett’s post-test for multiple comparisons, and expression is normalized to reference miRNAs miR-21-5p and miR-26b-5p). Significant p values are indicated as follows in the figures: p < 0.05 = *, p < 0.01 = **, p < 0.0001 = ****.
Cancers 13 02644 g005
Figure 6. The PART1-miRNA-mRNA network in TNBC cells. (A) The LncBase v2 predicted PART1 binding sites and affinity threshold score of miR-937-5p. (B) Relative luciferase activity generated by HCC1806 cells transfected with pmirGLO dual-luciferase miRNA target expression vector bearing the predicted PART1 target sequence for miR-937-5p (wildtype, WT) or a mutated version (MUT), and also treated with mimic-hsa-miR-937-5p or mimic negative control (n = 3, significance determined by one-way ANOVA, followed by Dunnett’s post-test for multiple comparisons). Luciferase activity is made relative to the cells treated with the mimic negative control and bearing the WT sequence vector. (C) Venn diagrams visualize the number of PART1 regulated genes that are predicted miRNA targets. (D) Pie charts depict the proportion of PART1 regulated mRNAs that are potentially regulated by the miRNAs identified to interact with PART1. (E) The network node analysis visualizes the PART1-regulated miRNAs miR-937-5p, miR-30b-3p and miR-6870-5p in HCC1806 cells and miR-190a-3p, miR-22-5p, miR-30b-3p and miR-6870-5p in HCC1395 cells connected with PART1-regulated mRNAs. Significant p values are indicated as follows in the figures: p < 0.01 = **. Non-significant p values are either indicated as ns, or not noted.
Cancers 13 02644 g006
Publisher’s Note: MDPI stays neutral with regard to jurisdictional claims in published maps and institutional affiliations.

