L-Arginine/Nitric Oxide Pathway Is Altered in Colorectal Cancer and Can Be Modulated by Novel Derivatives from Oxicam Class of Non-Steroidal Anti-Inflammatory Drugs

 , , , ,
  , , , , ,
Abstract
:Simple Summary
Abstract
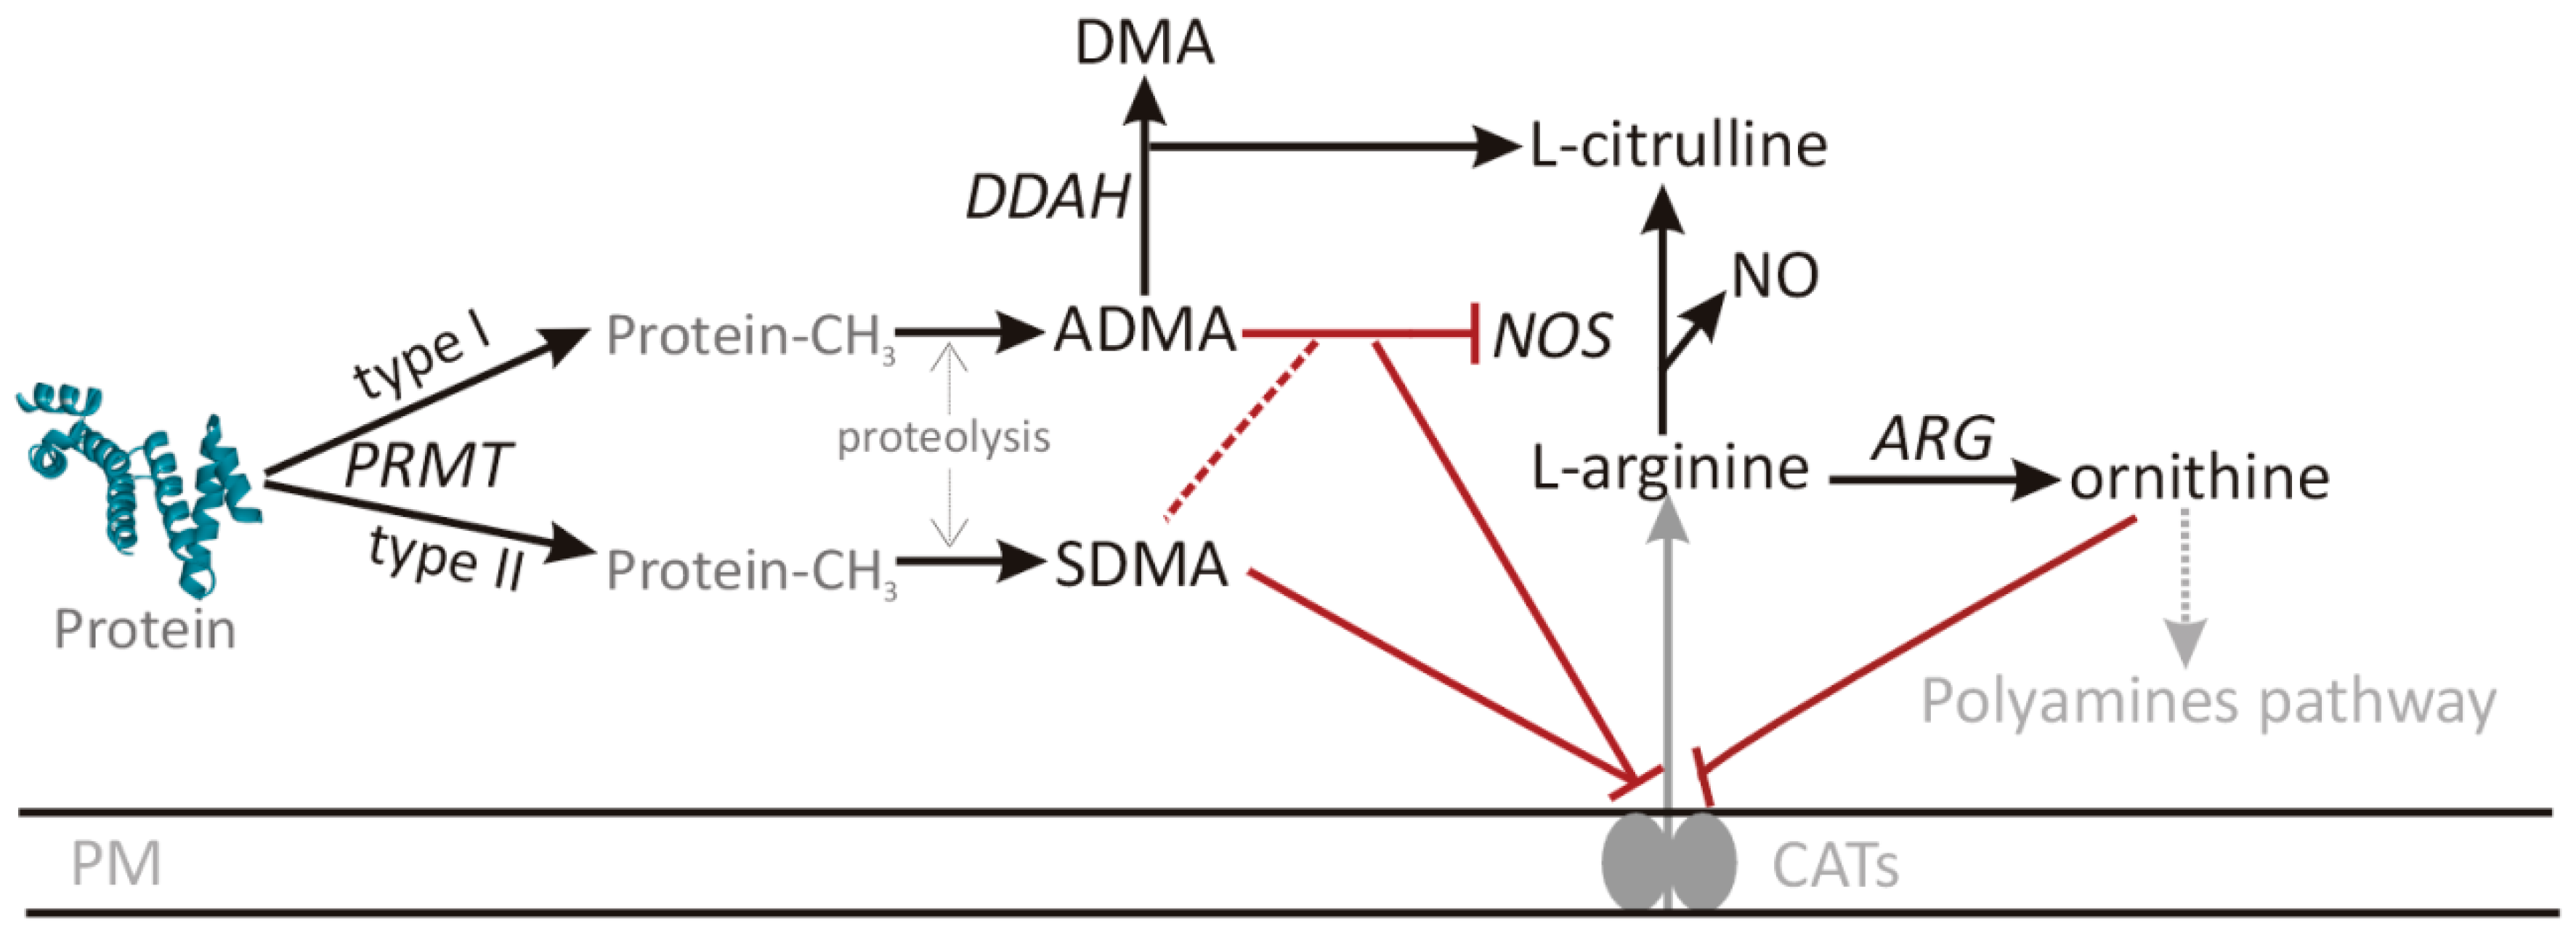
1. Introduction
2. Results
2.1. Arginine/No Pathway Enzymes in CRC Patients
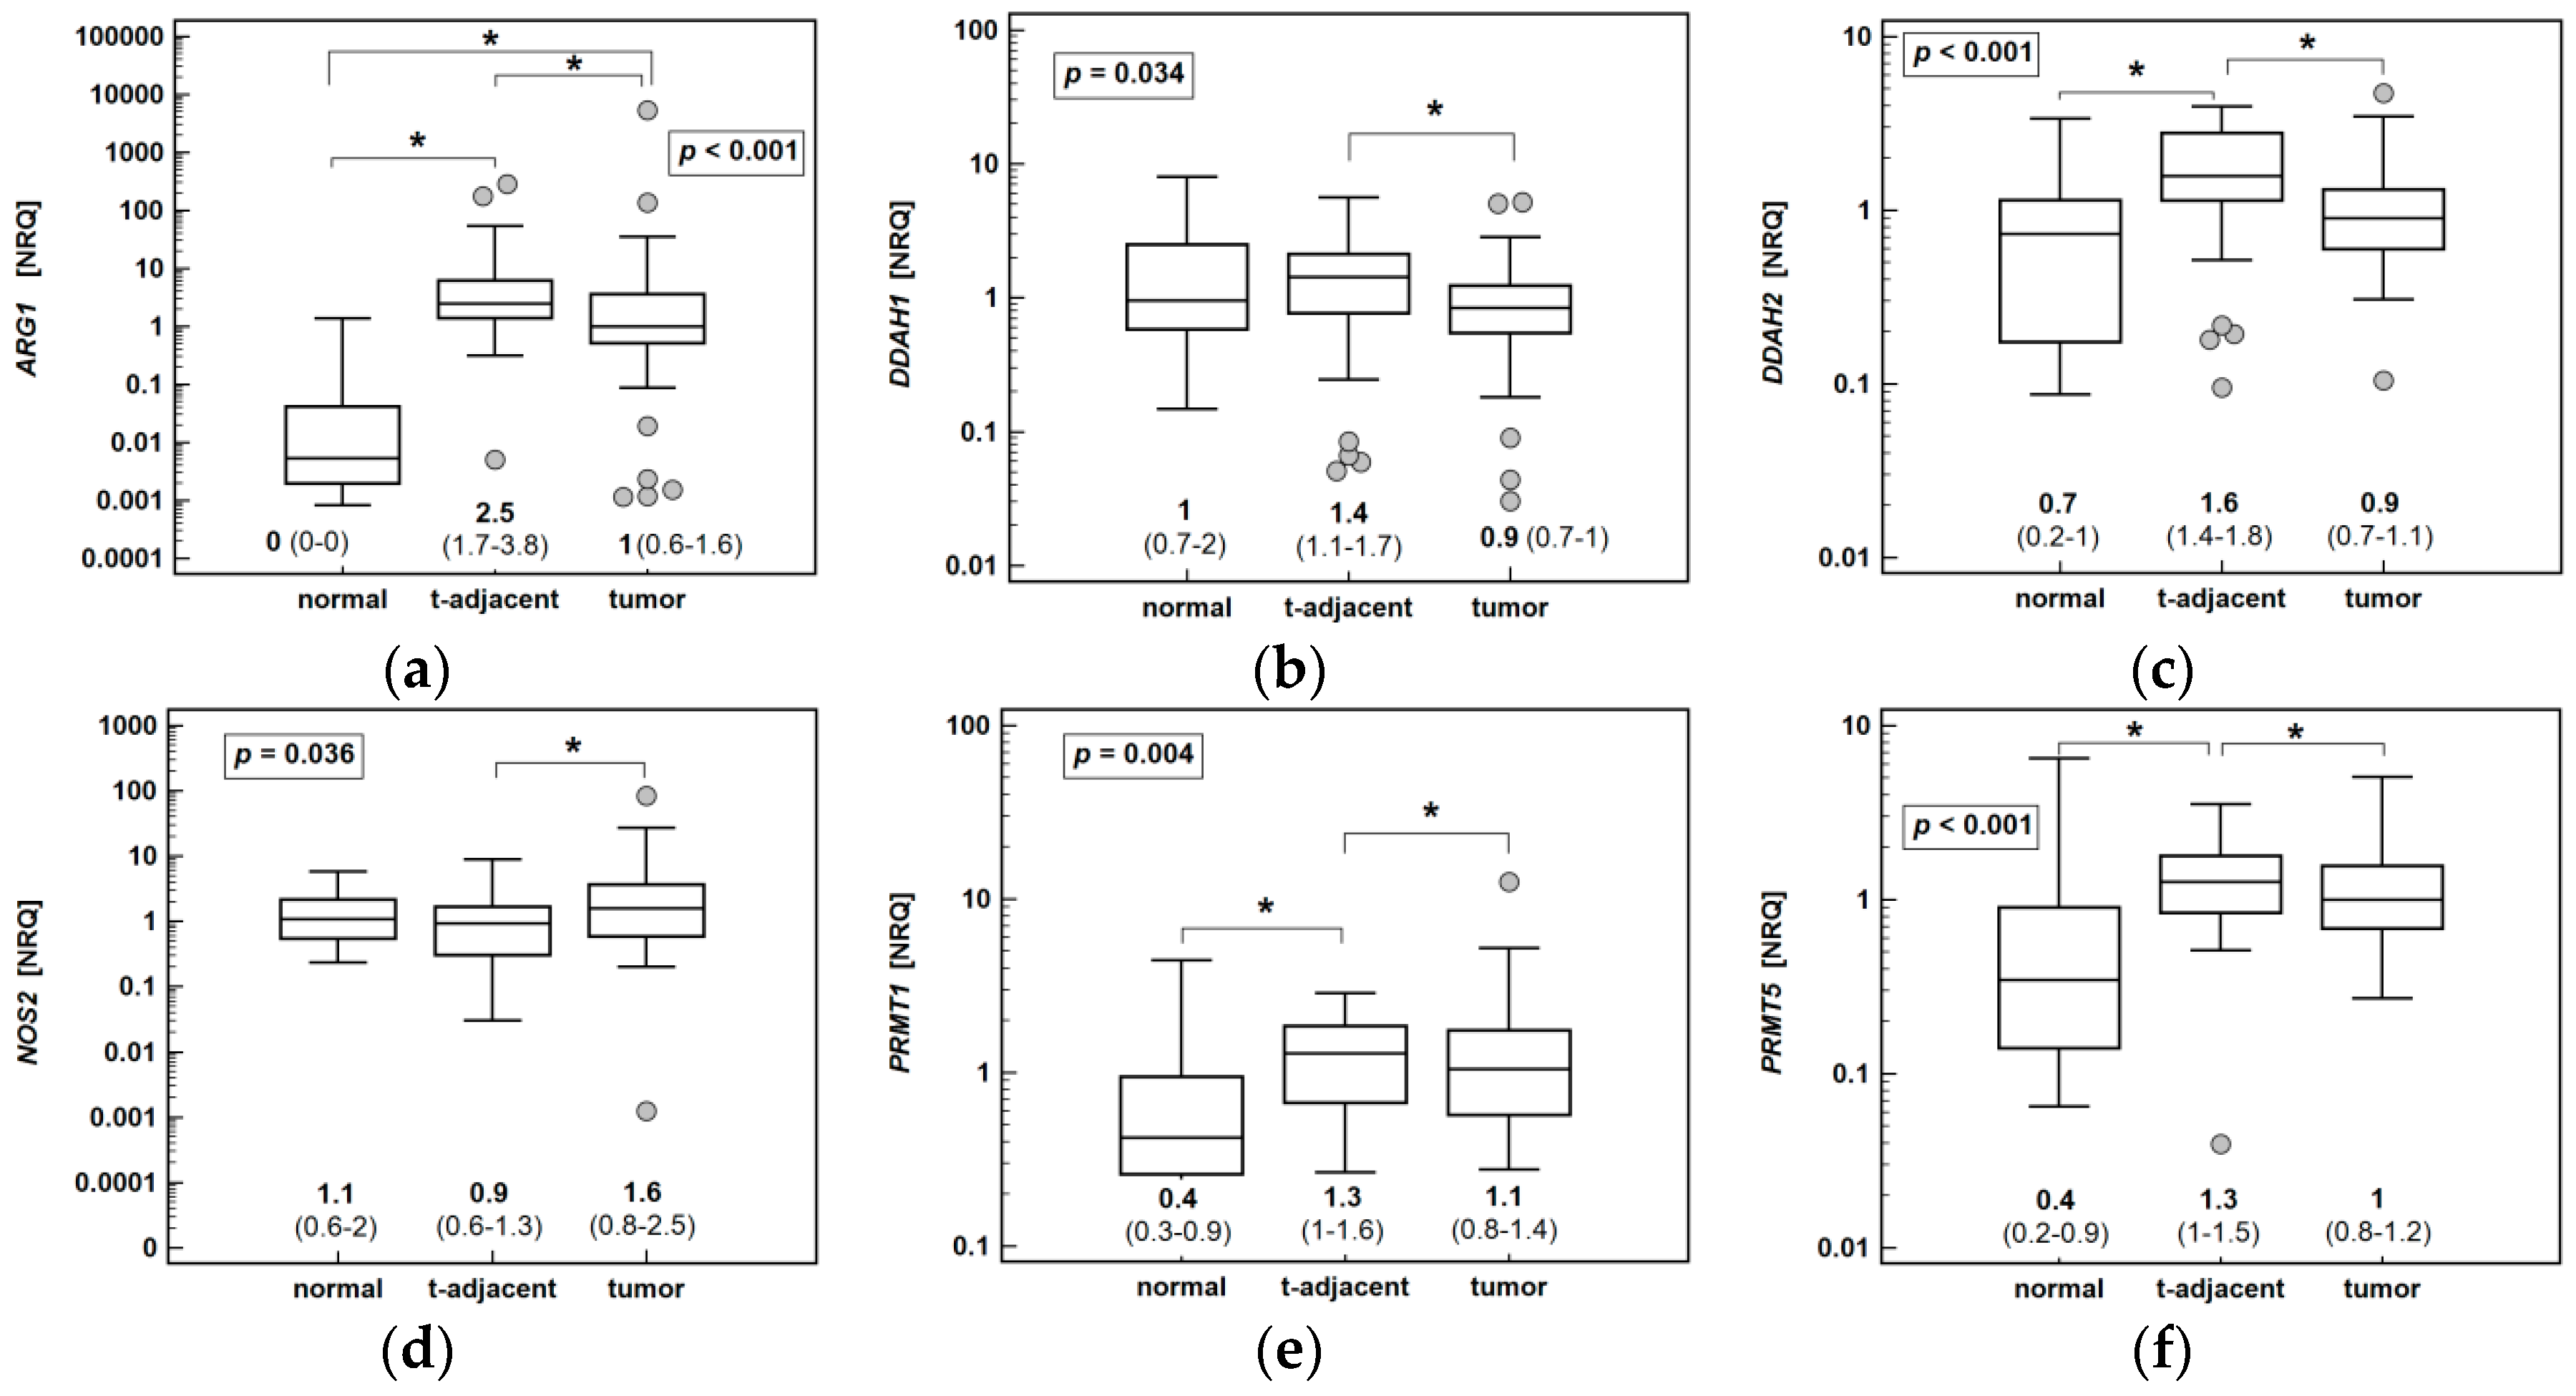
2.1.1. Pathway Enzymes in Patient-Matched Tumors and Non-Cancerous Tumor-Adjacent Tissue
2.1.2. Association of Enzyme Expression Level with Cancer Pathology
2.1.3. The Pathway Enzyme Expression in Colonic Mucosa from CRC Patients and Normal Colonic Tissue
2.2. Impact of Classic and Novel Oxicam Analogues on Arginine/NO Pathway
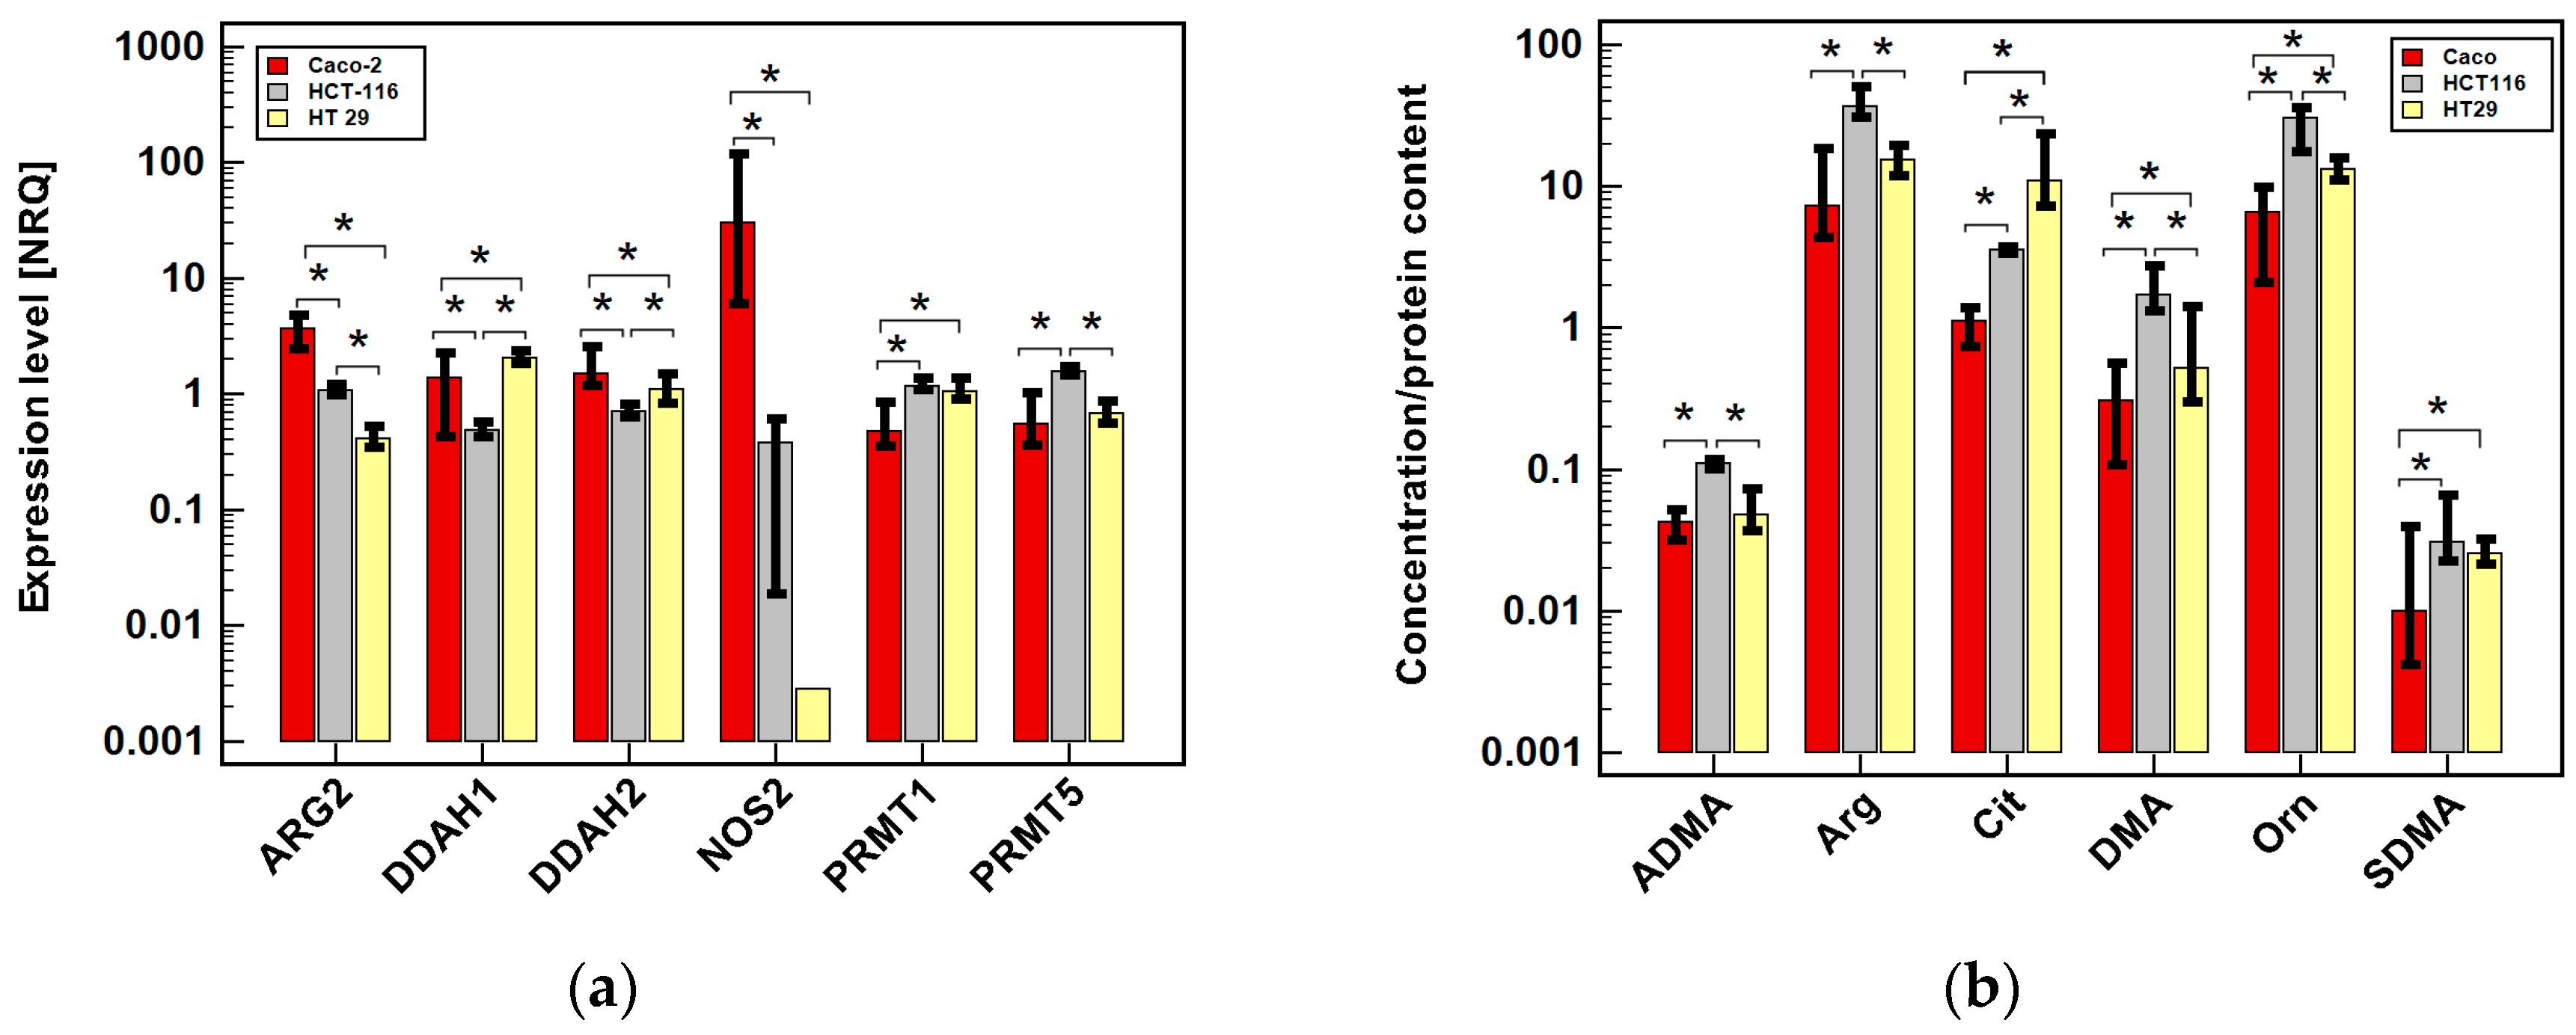
2.2.1. Arginine/NO Pathway Status in Colonic Adenocarcinoma Cell Lines
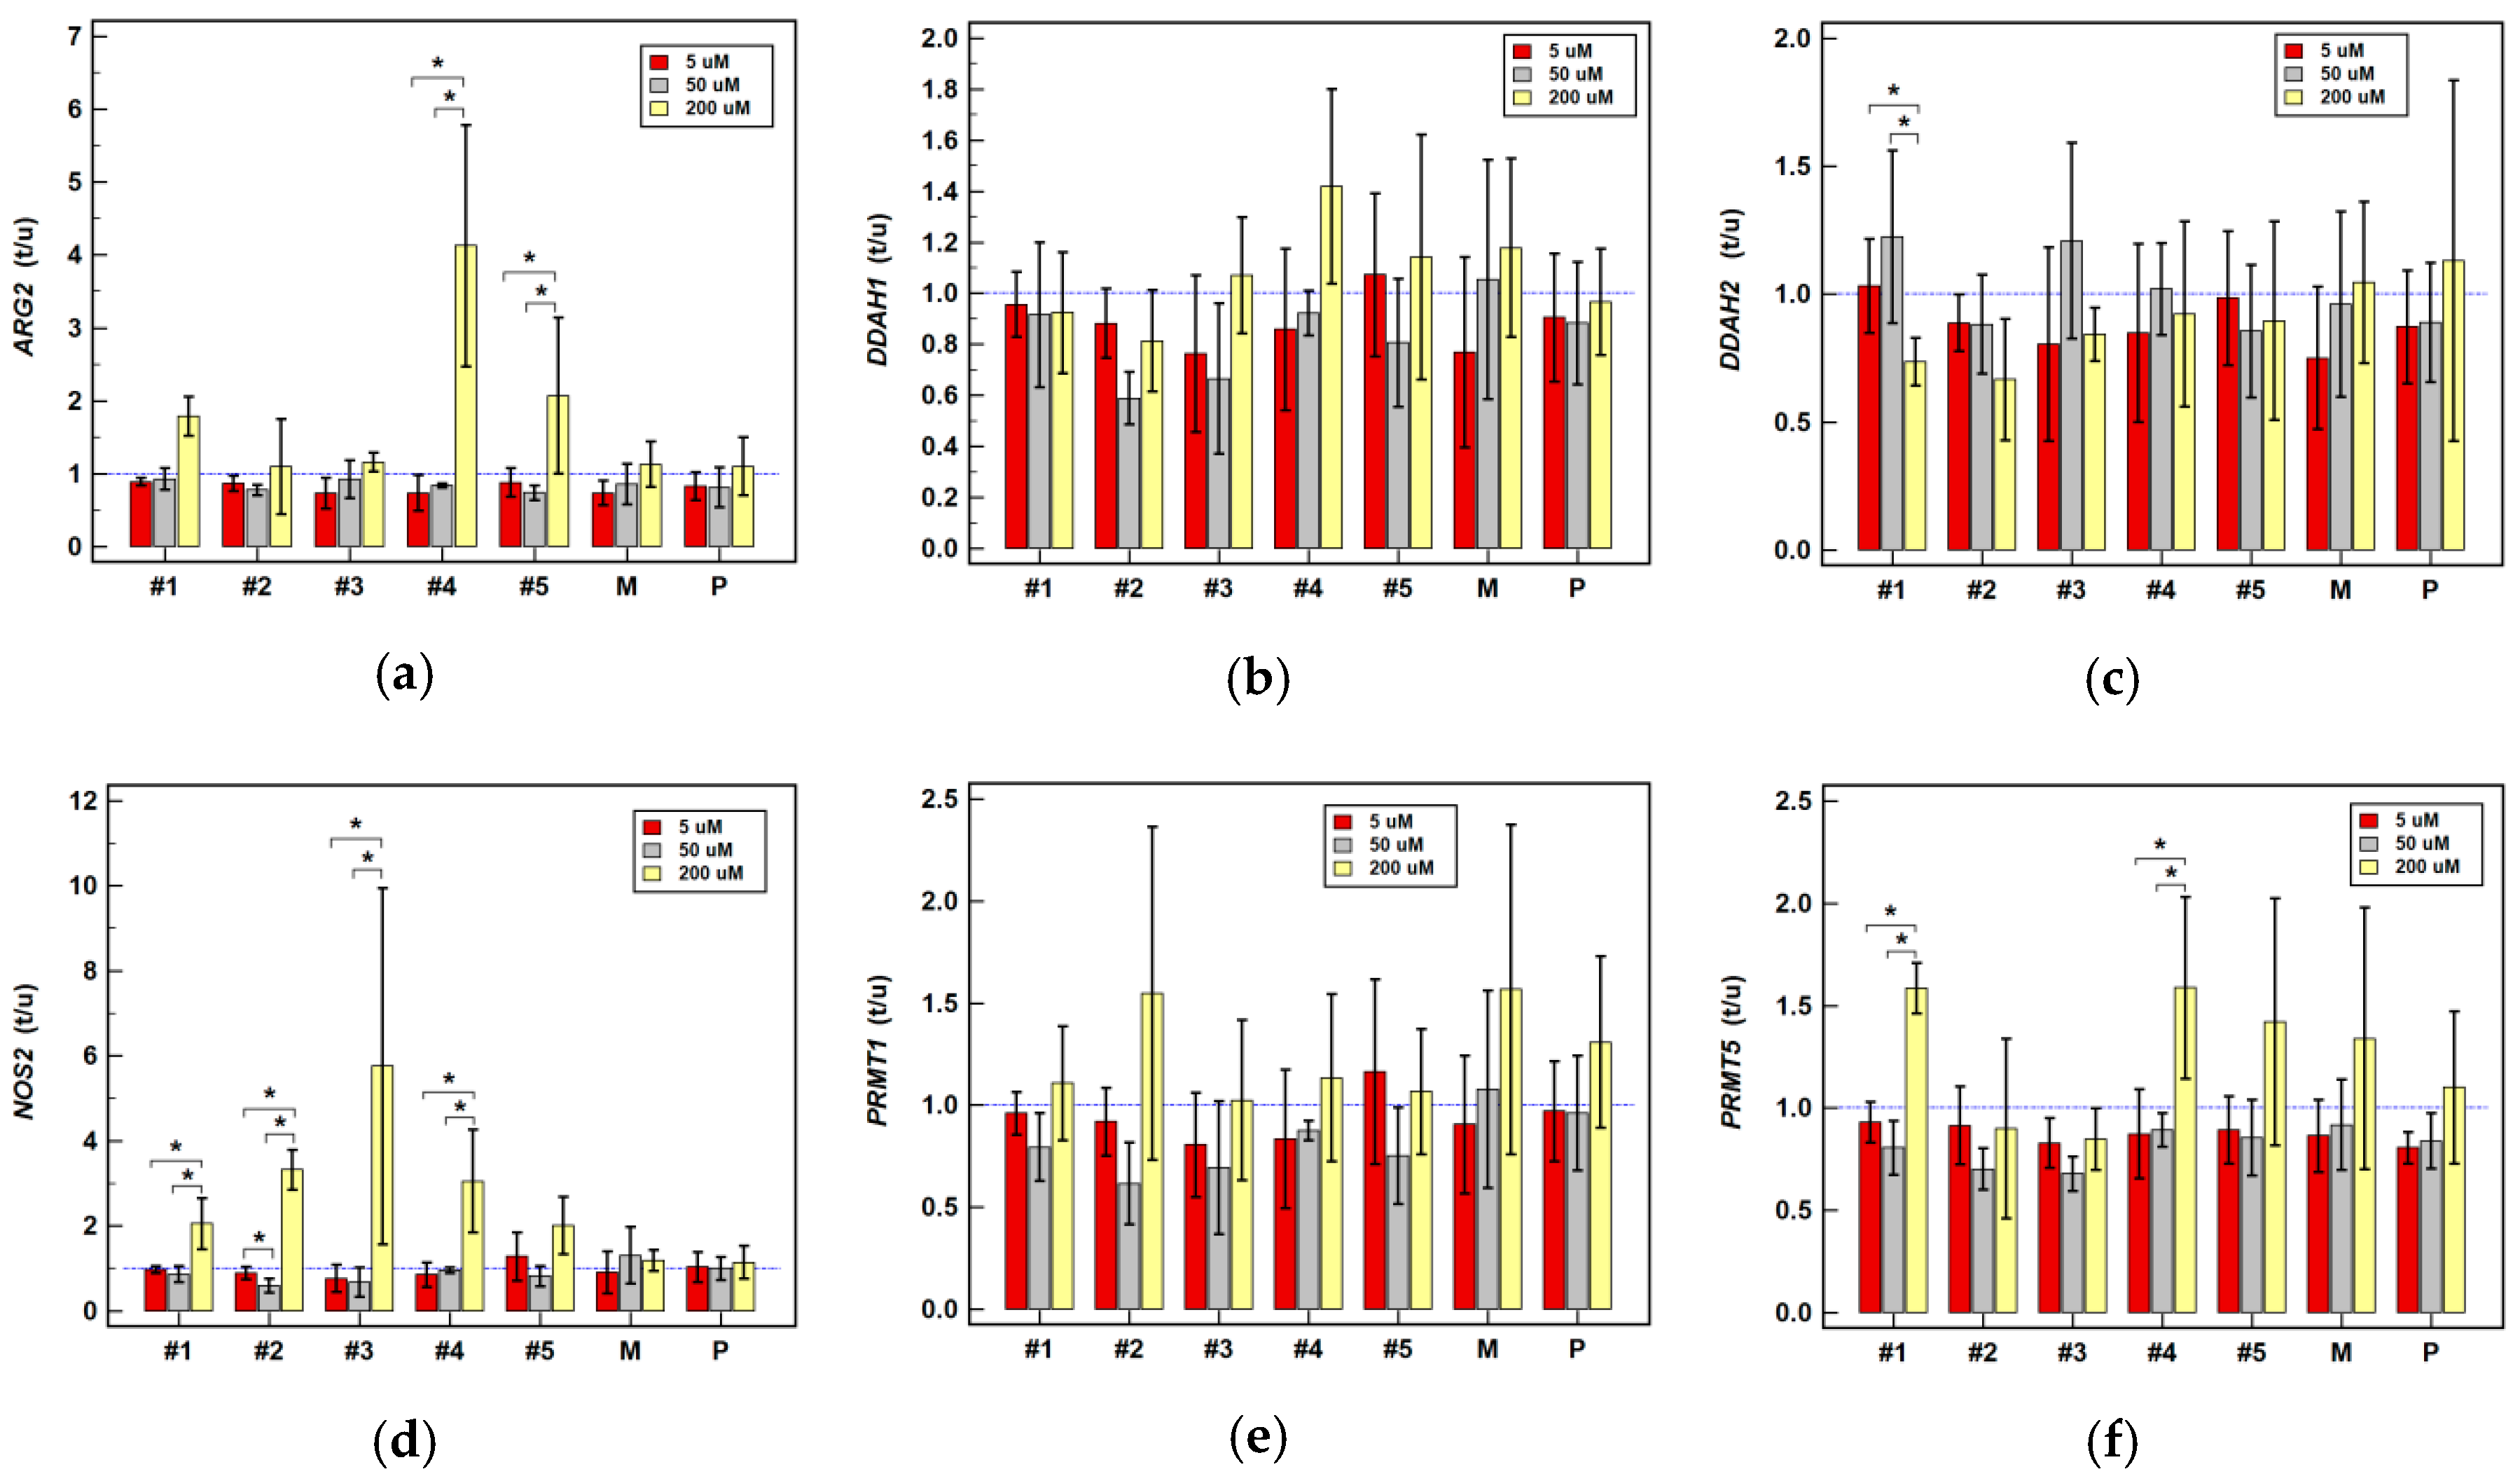
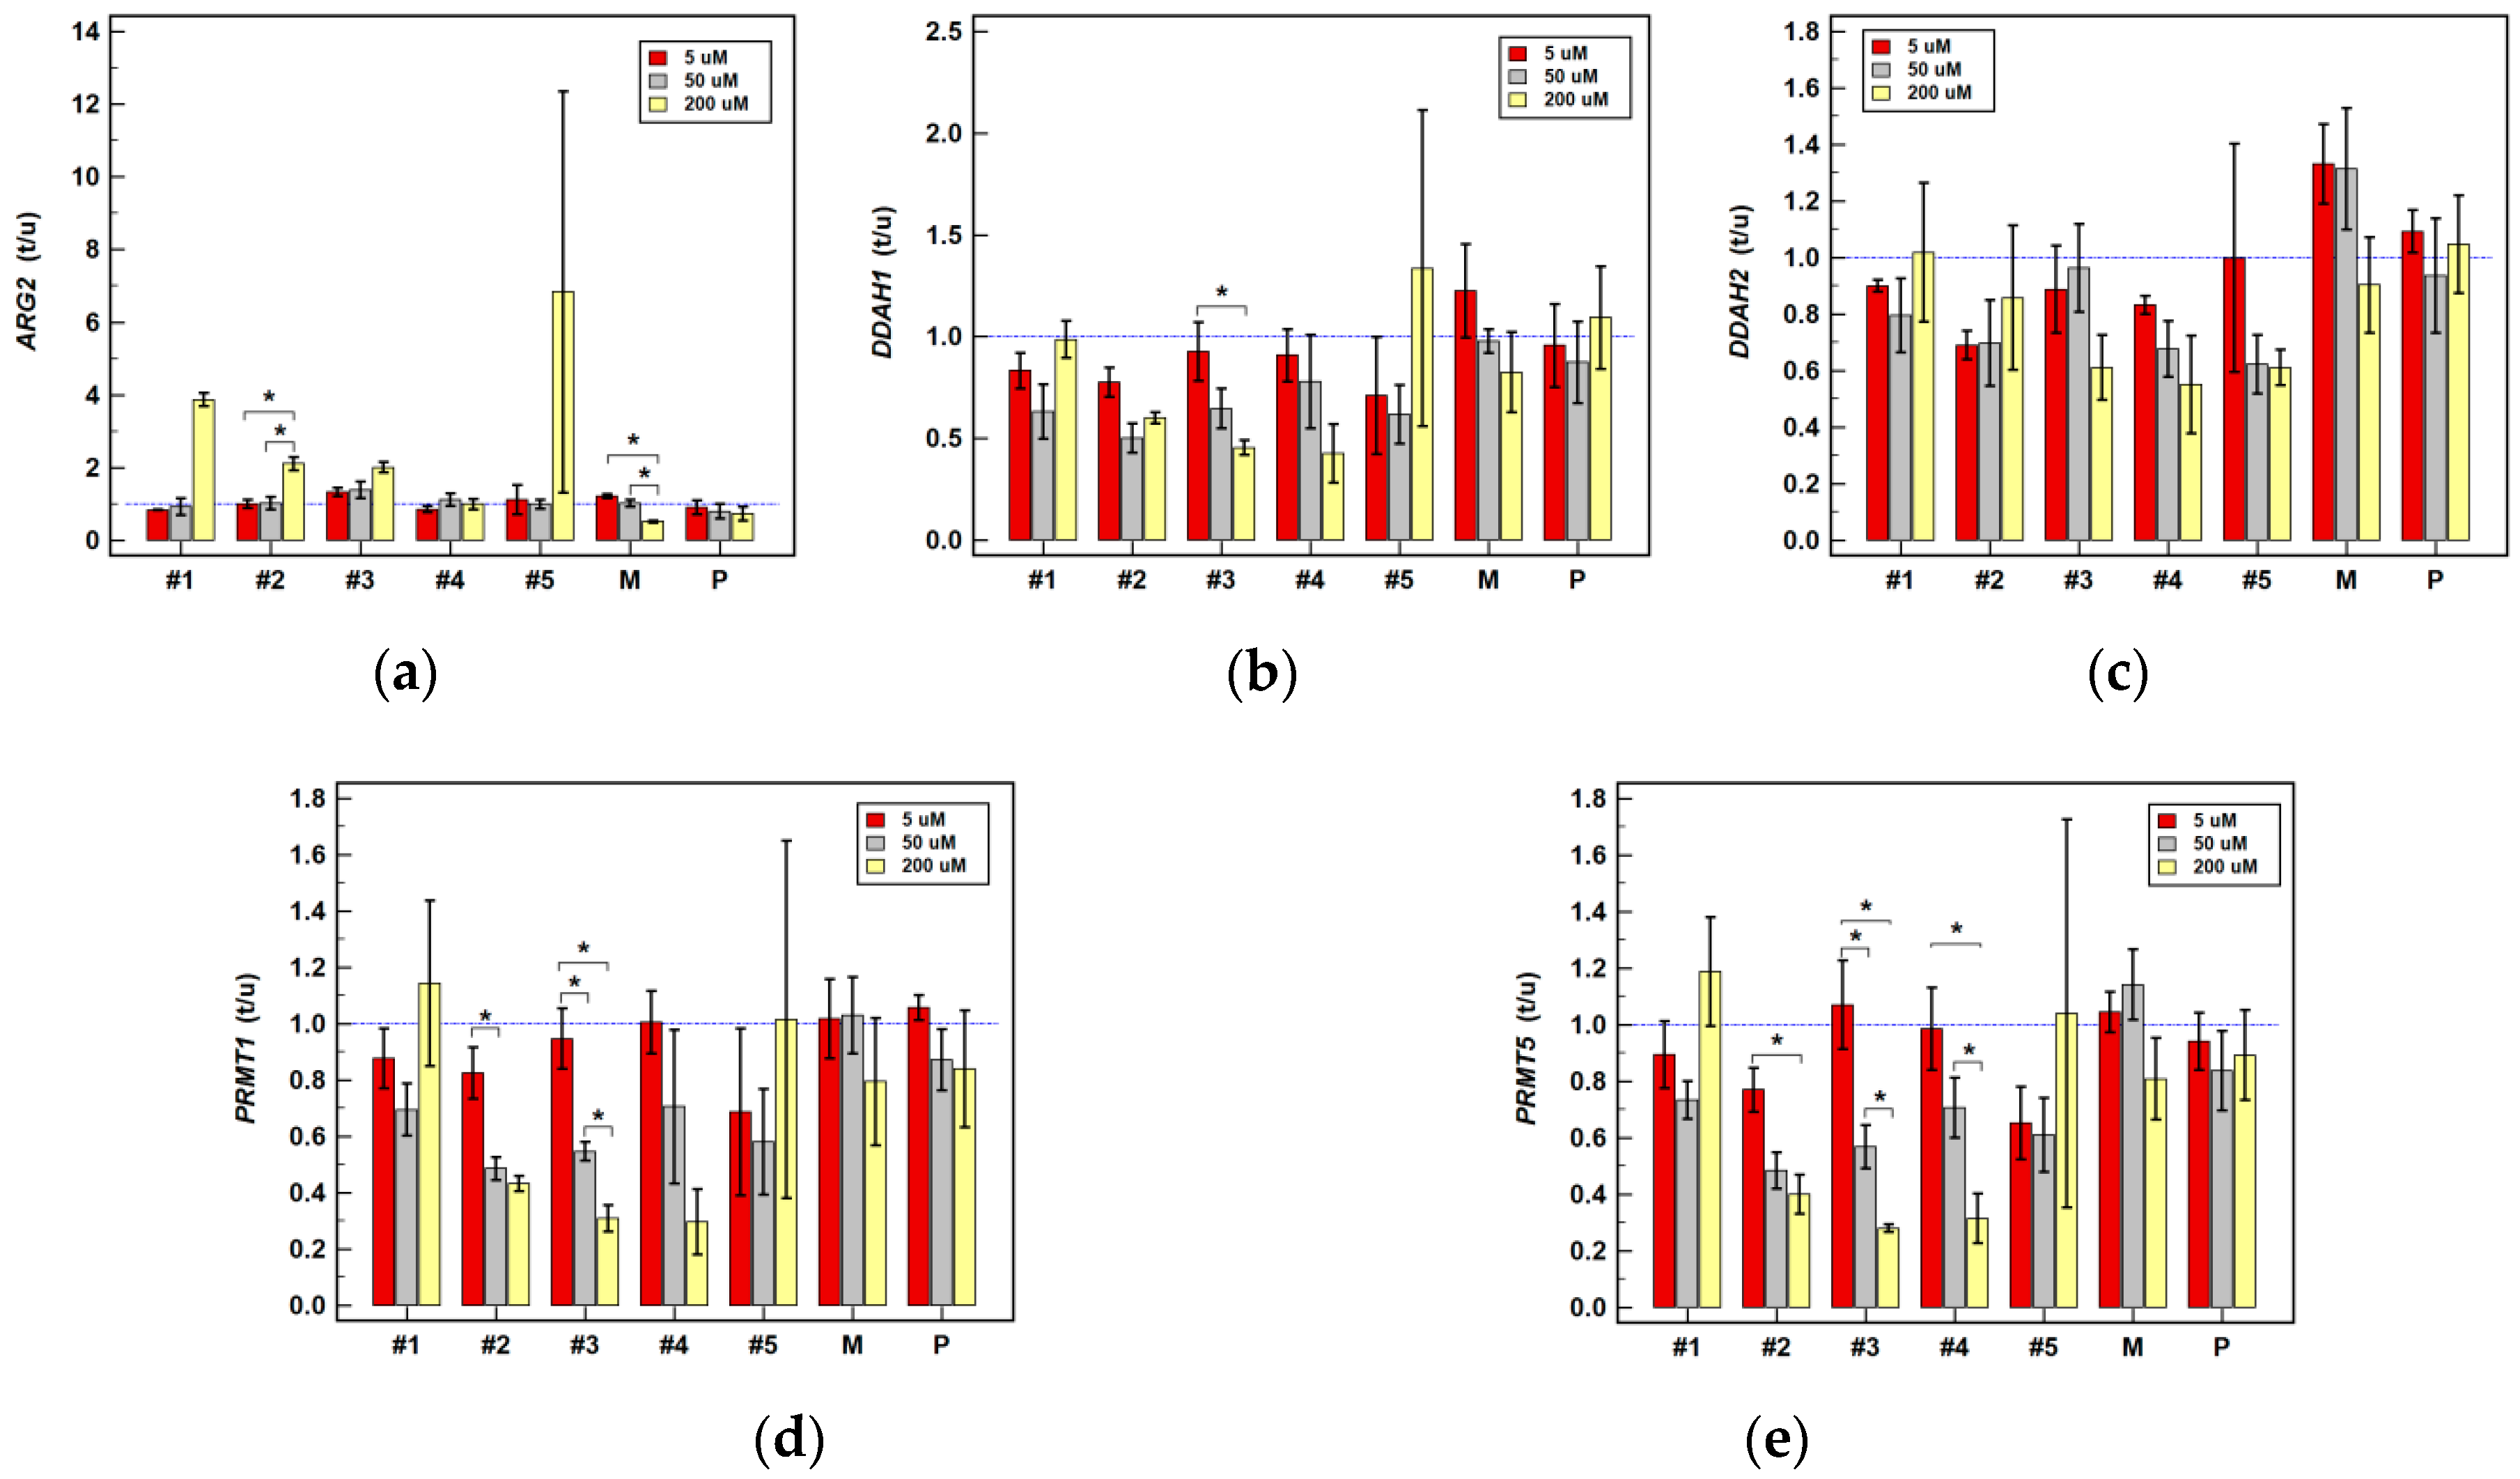
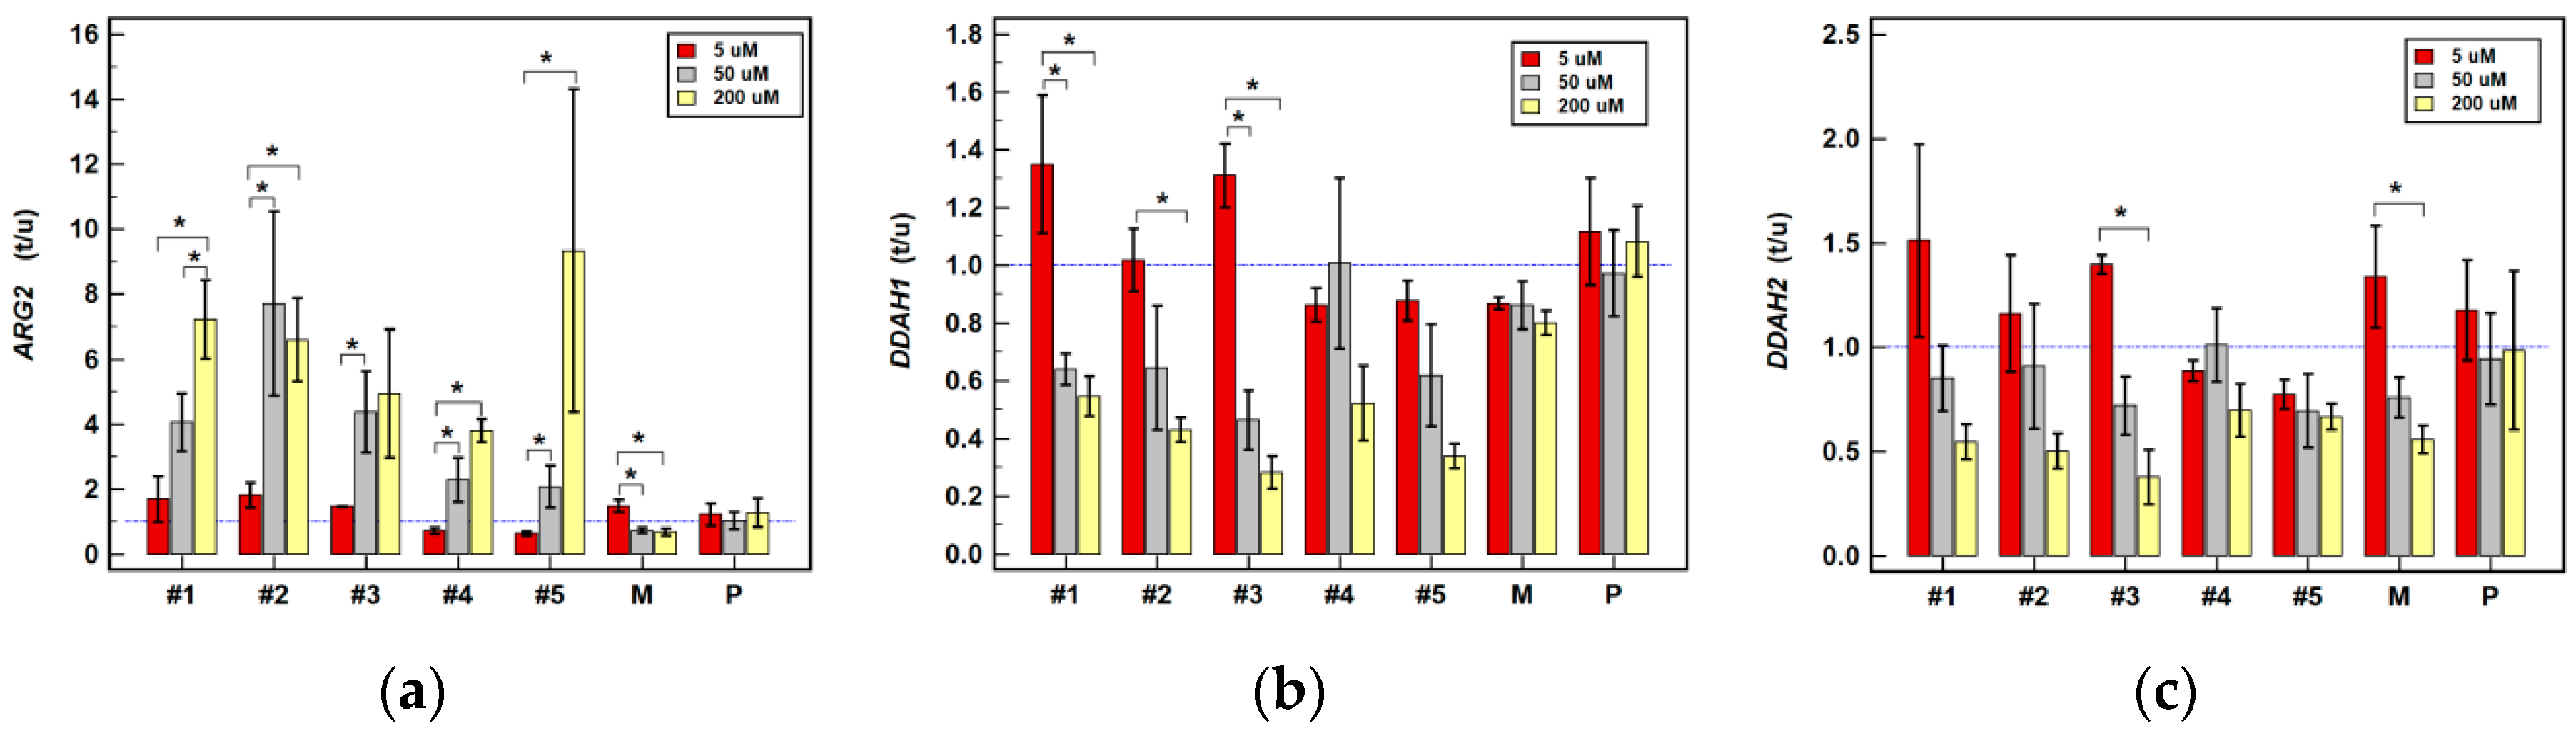
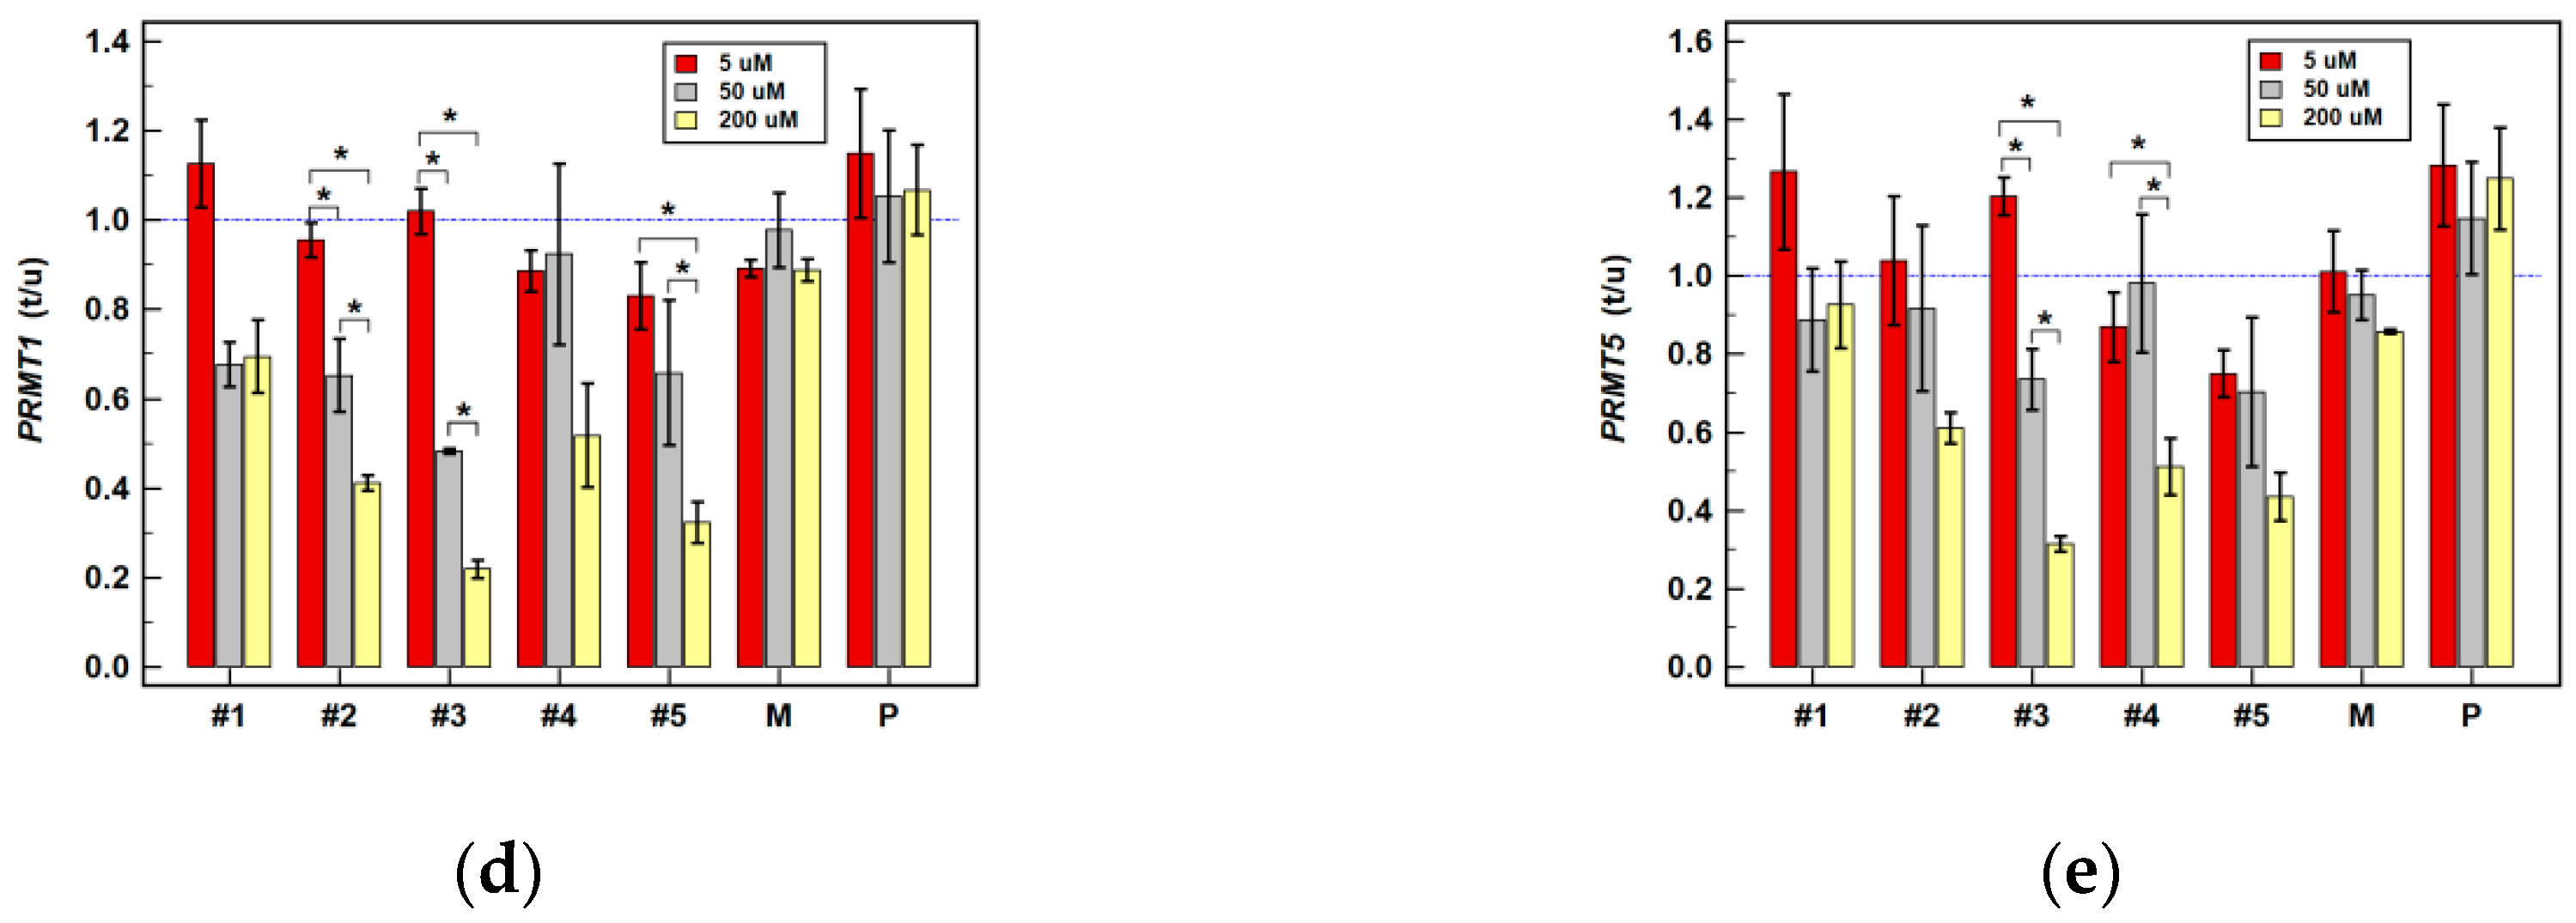
2.2.2. Effect of Oxicam Drugs on Gene Expression of Key Pathway Enzymes
2.2.3. Effect of Oxicam Drugs on Enzyme Protein Expression in HT-29 Cells
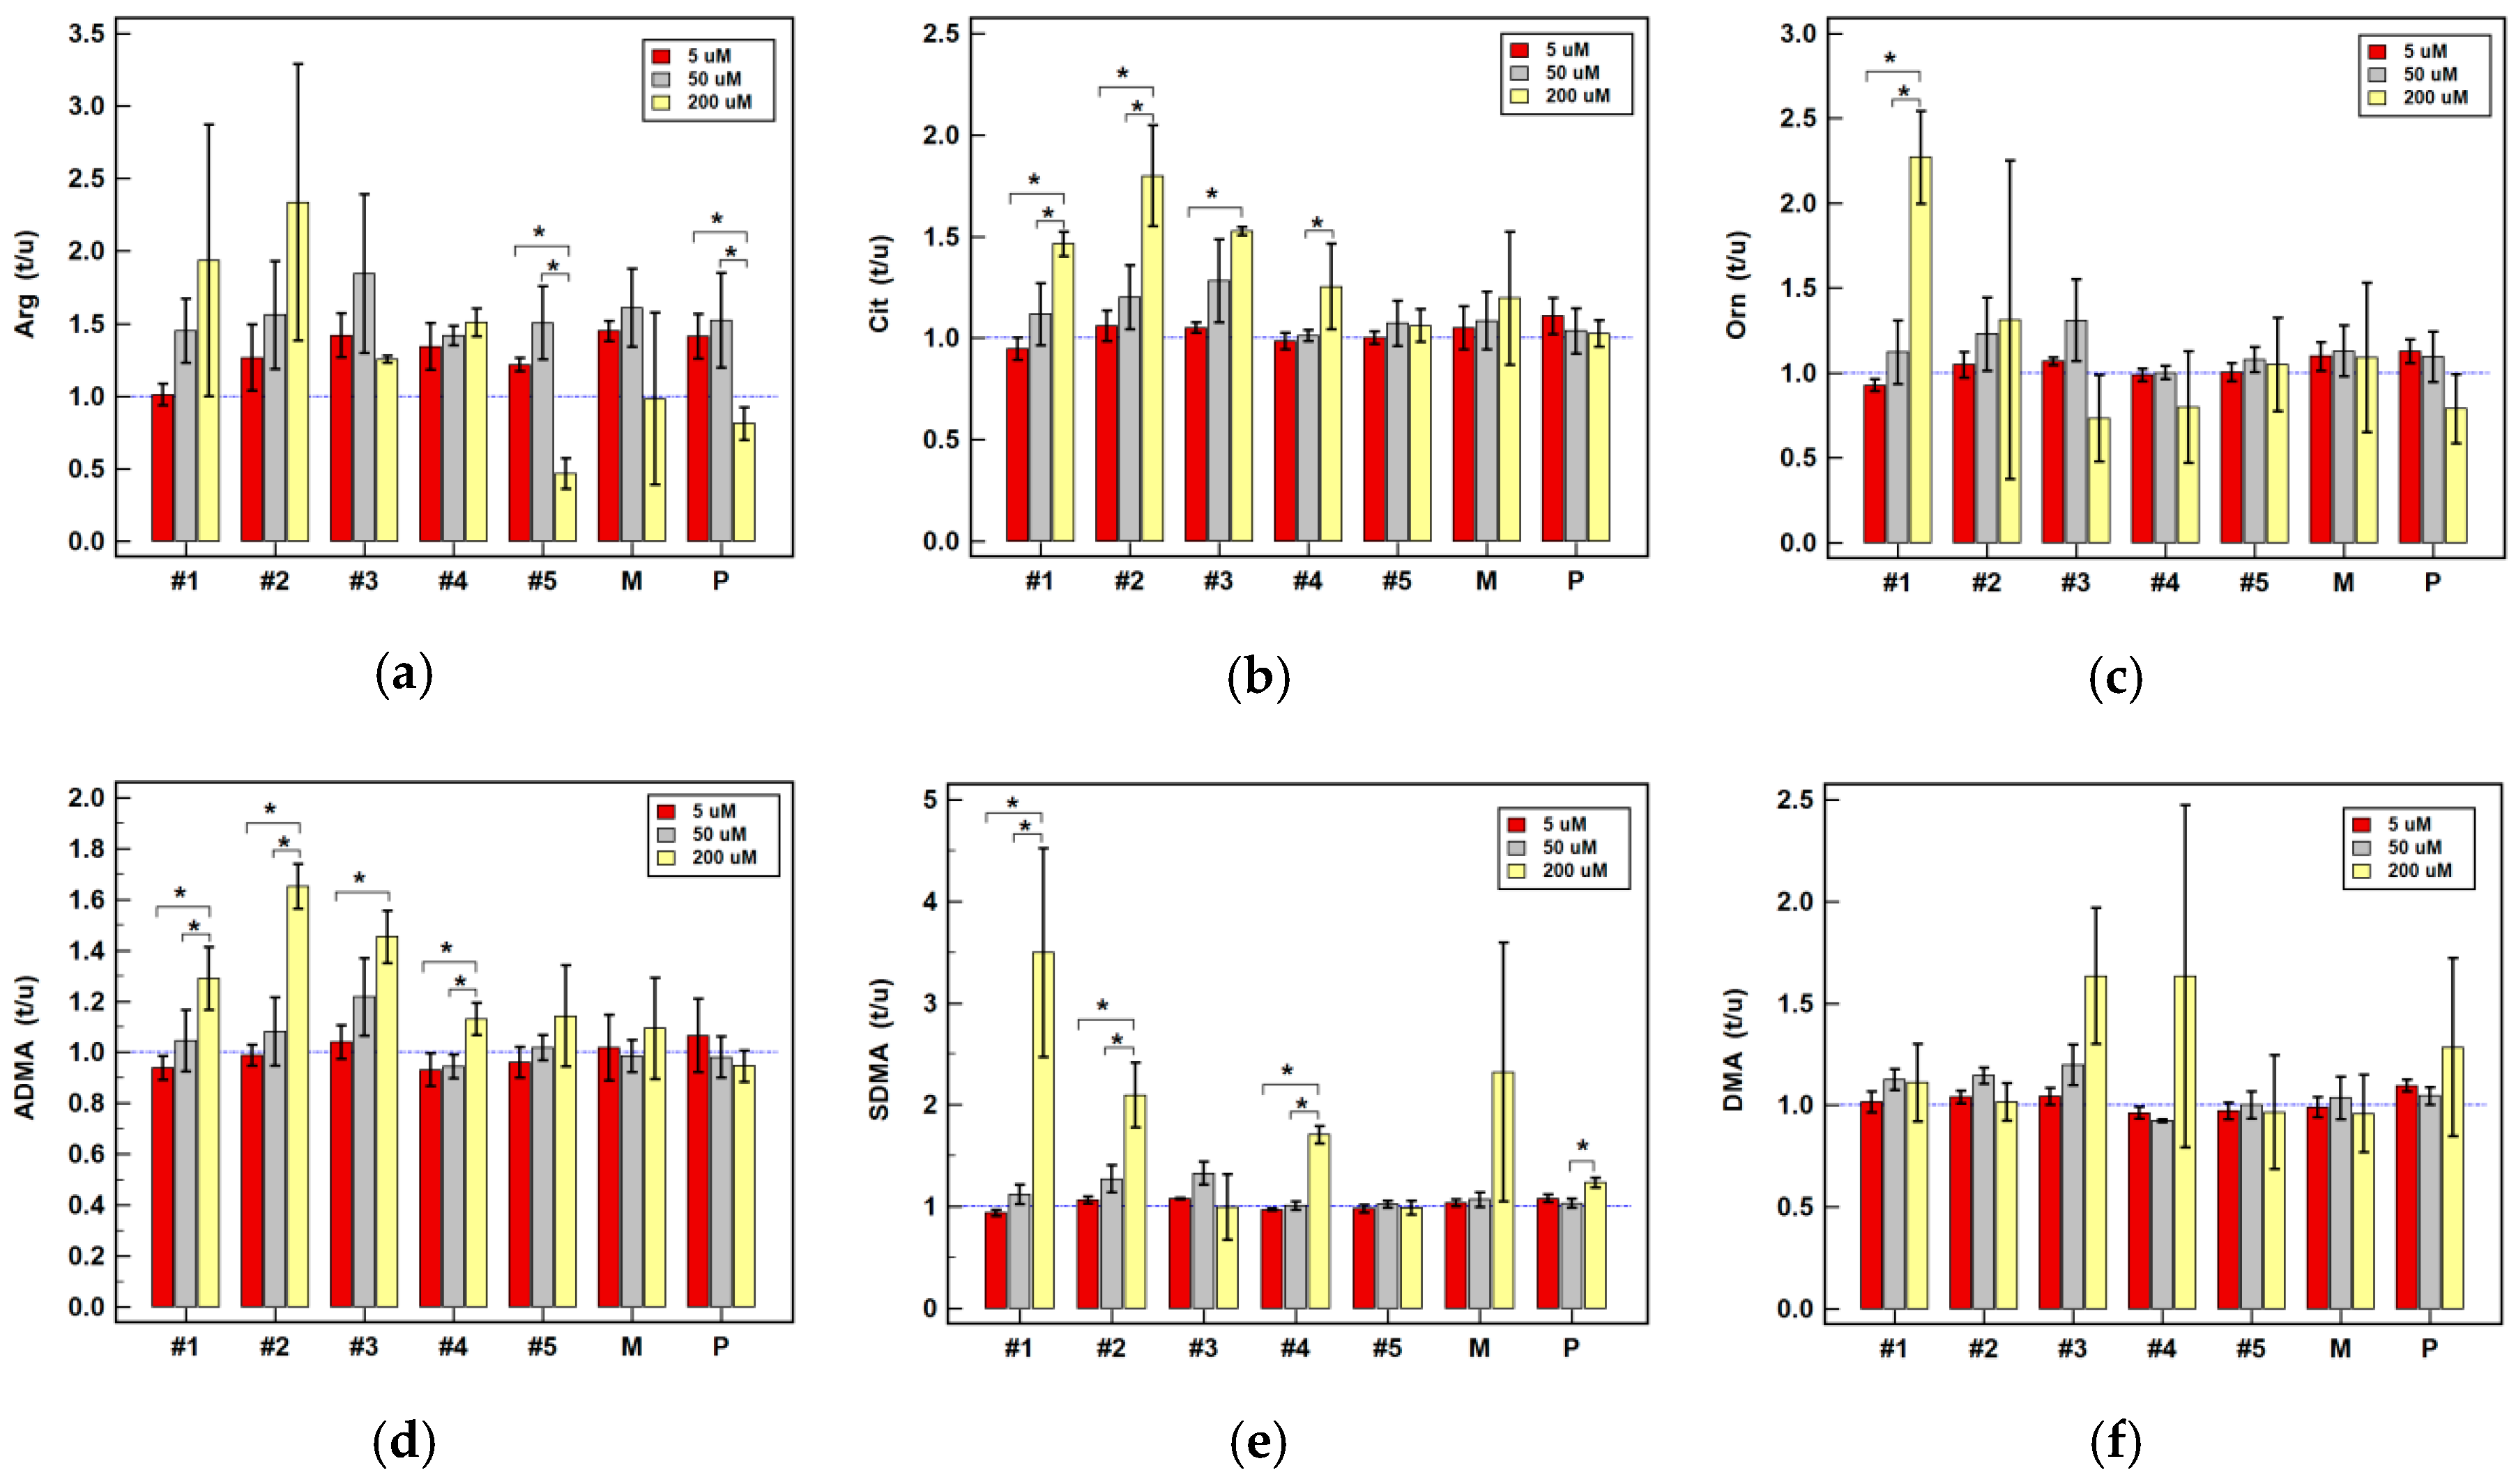
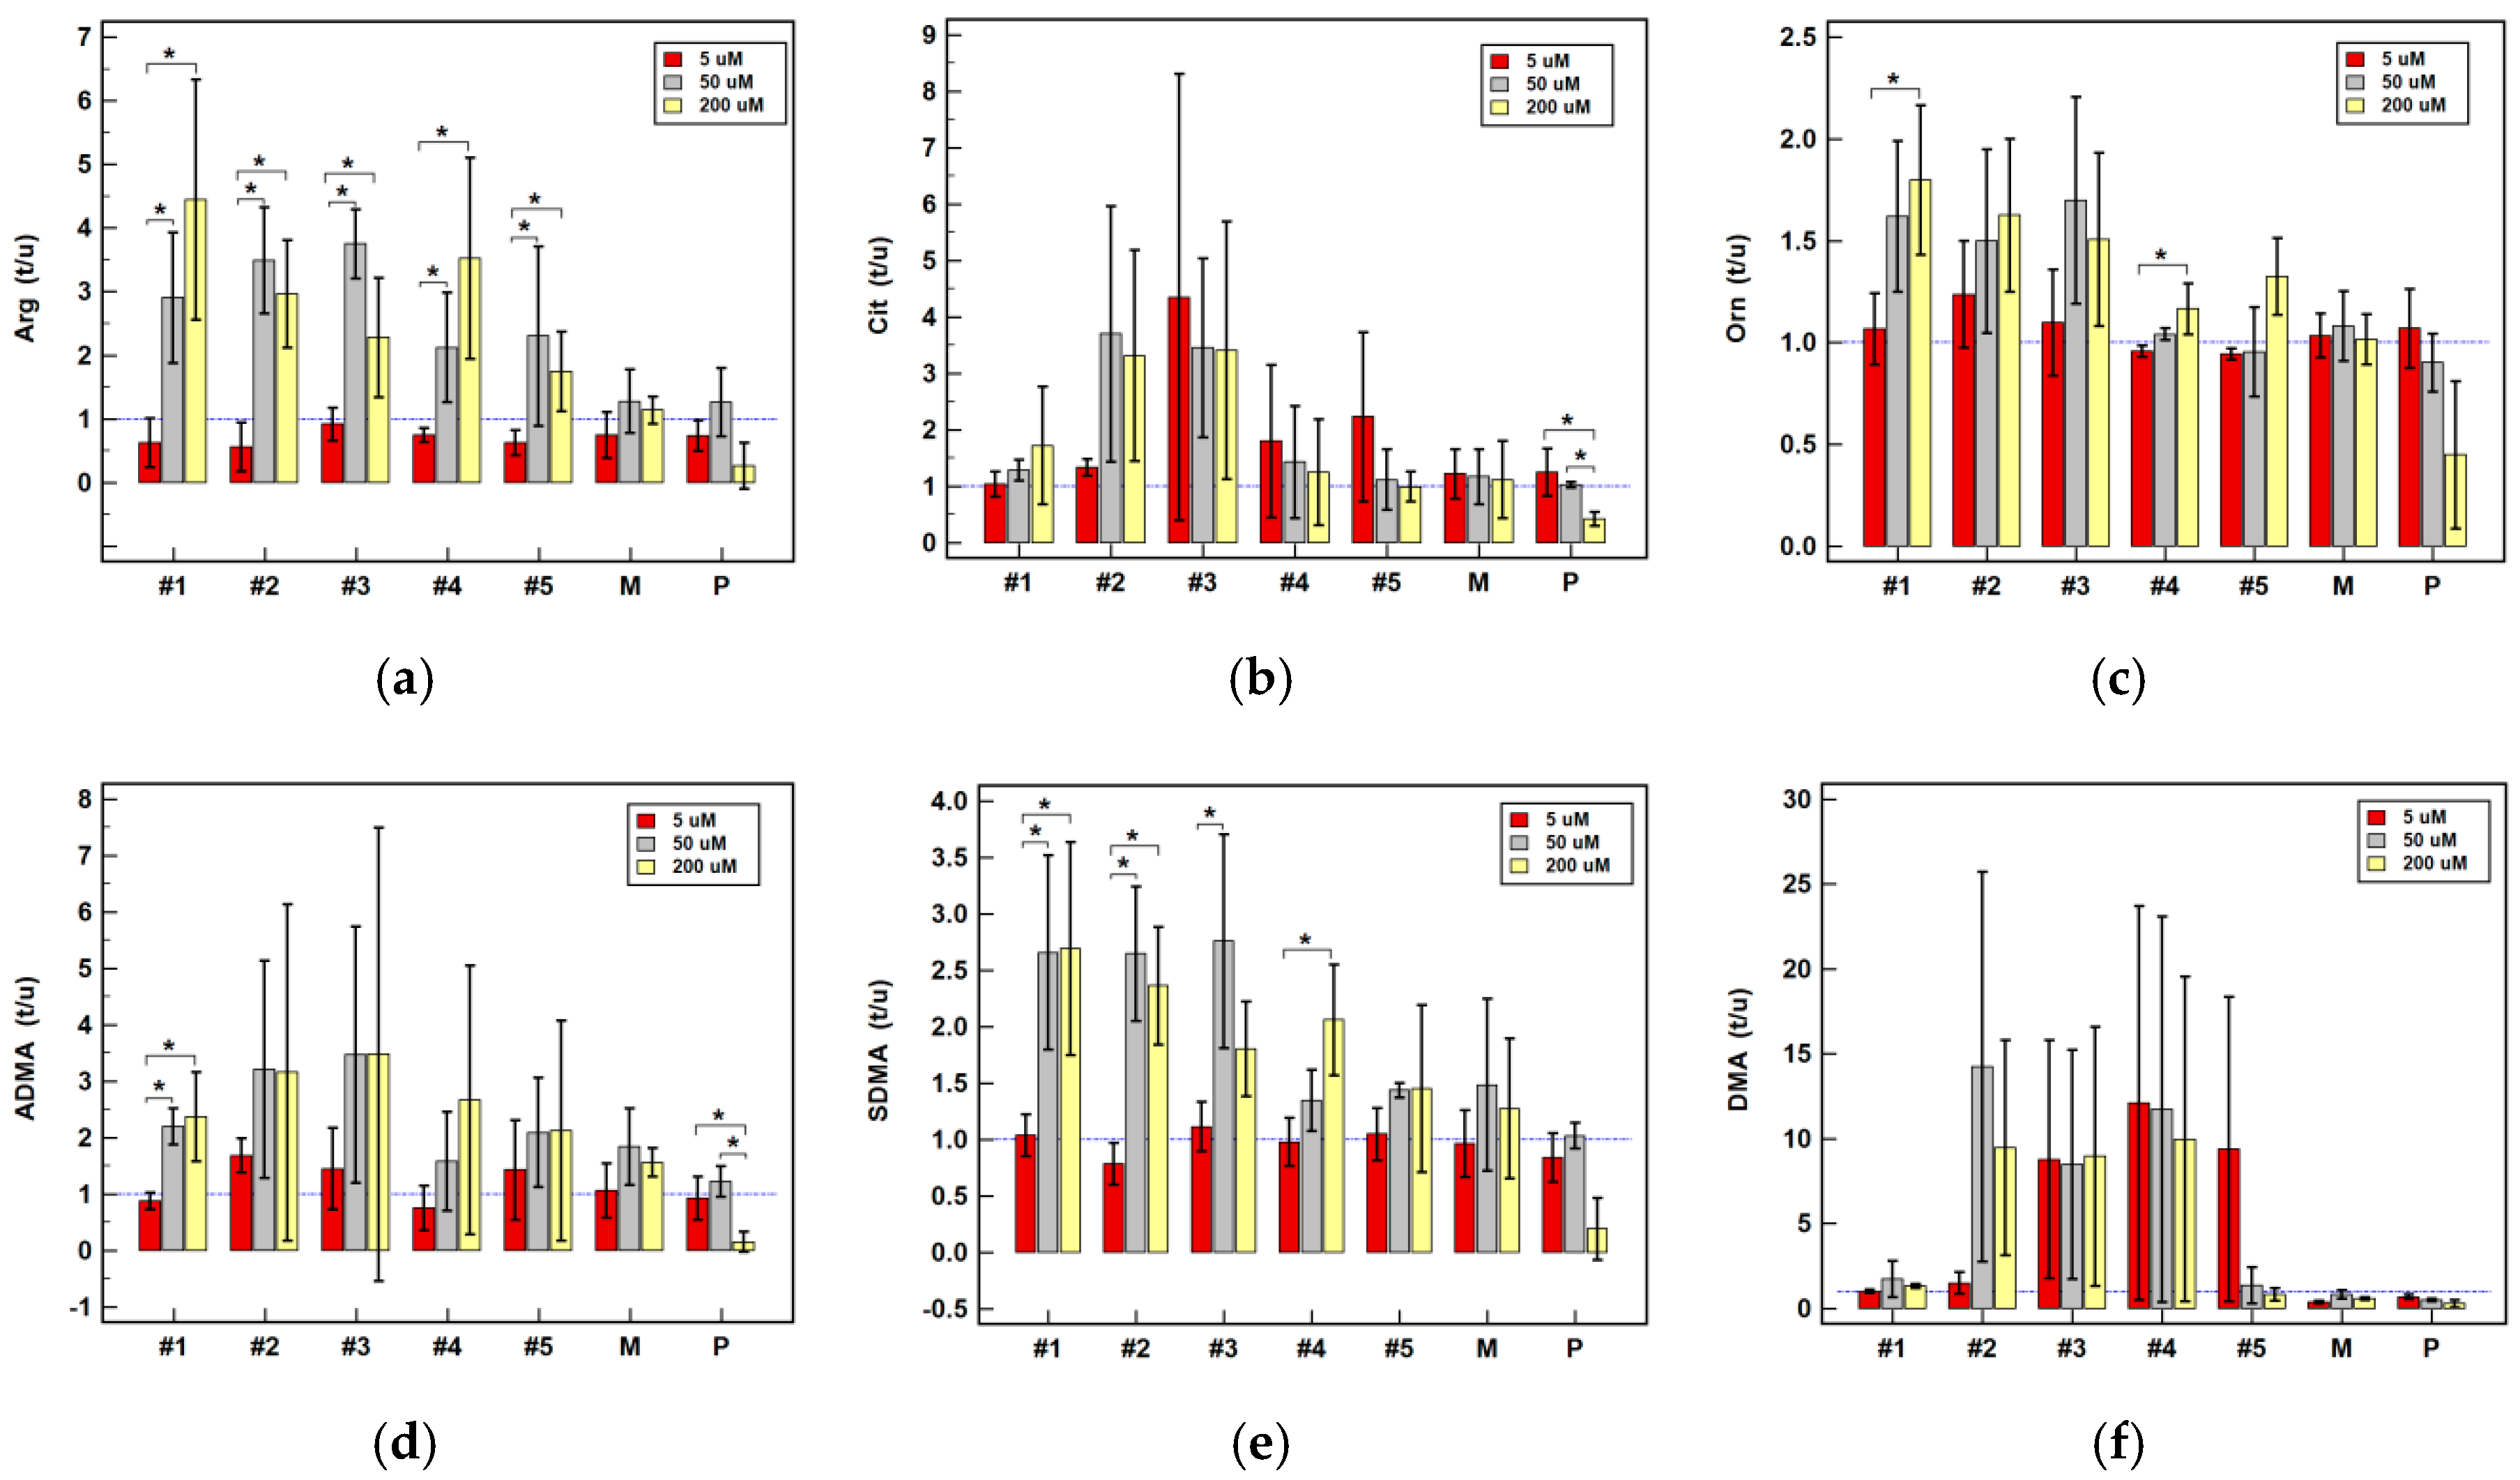
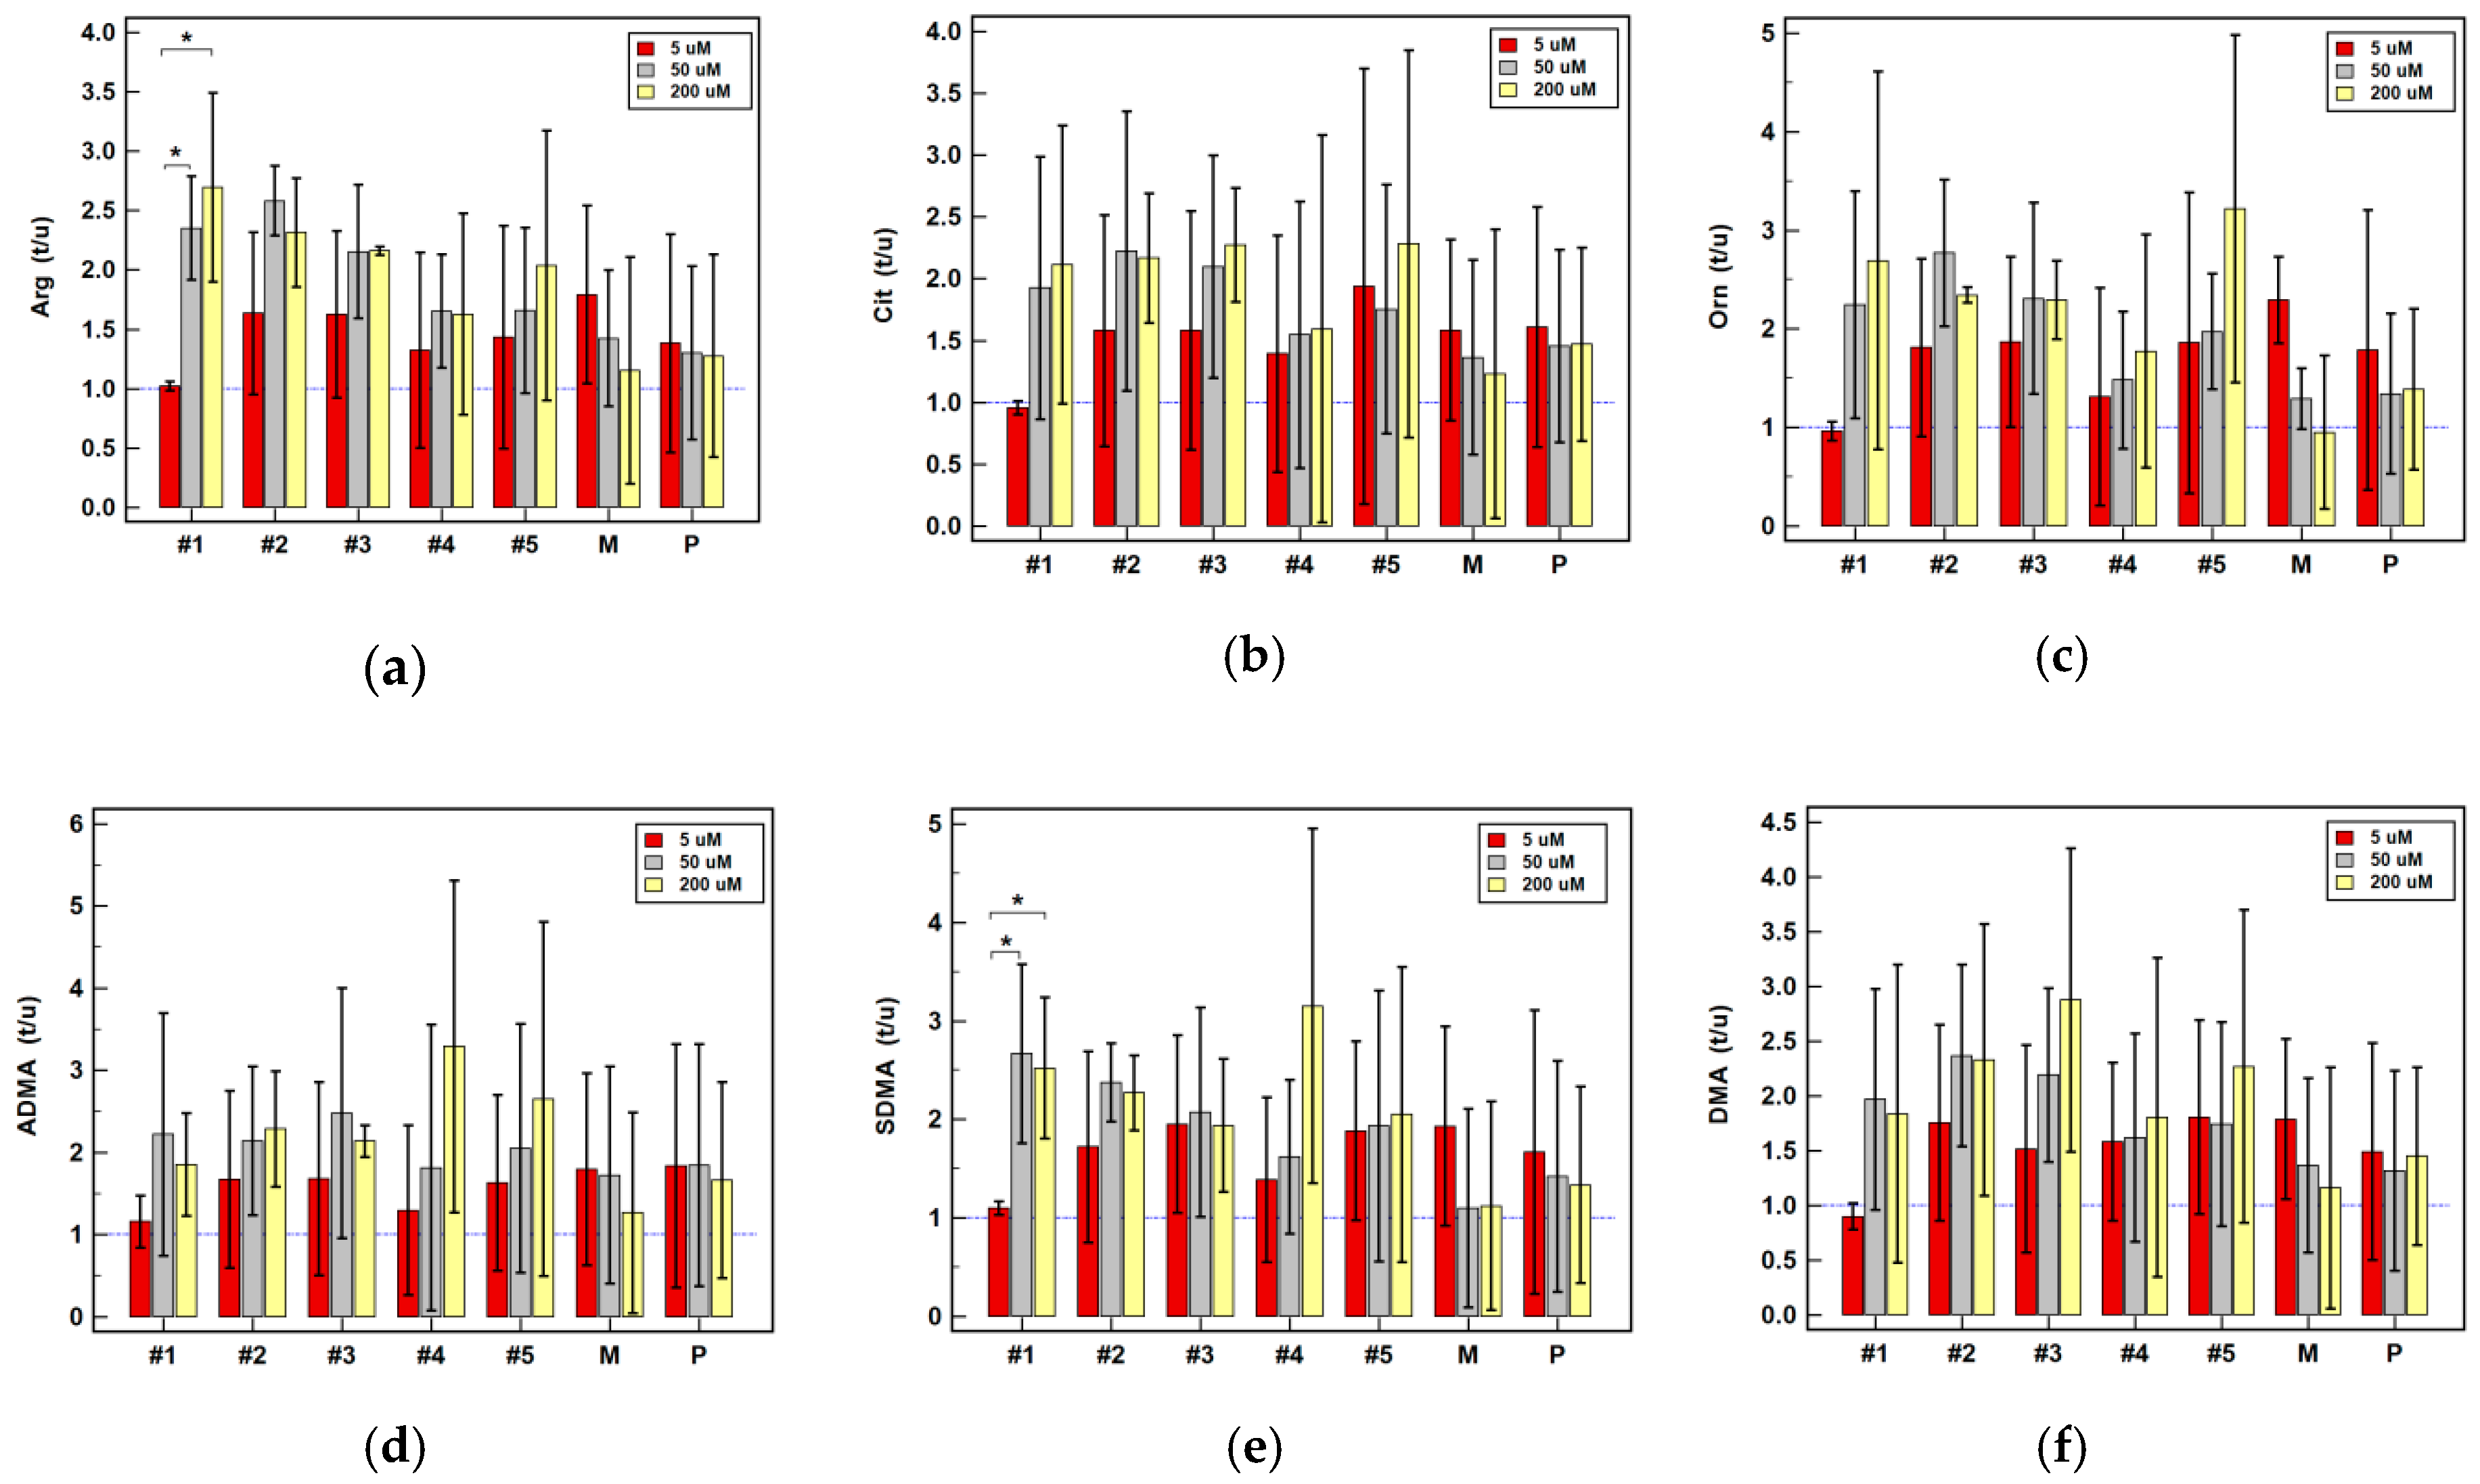
2.2.4. Effect of Oxicam Drugs on Intracellular Concentrations of Key Pathway Metabolites
2.2.5. Effect of Oxicam Drugs on Nitrite and Nitrate Concentrations in Conditioned Media
3. Discussion
4. Materials and Methods
4.1. Patients
4.2. Ethical Approval
4.3. Cell Cultures
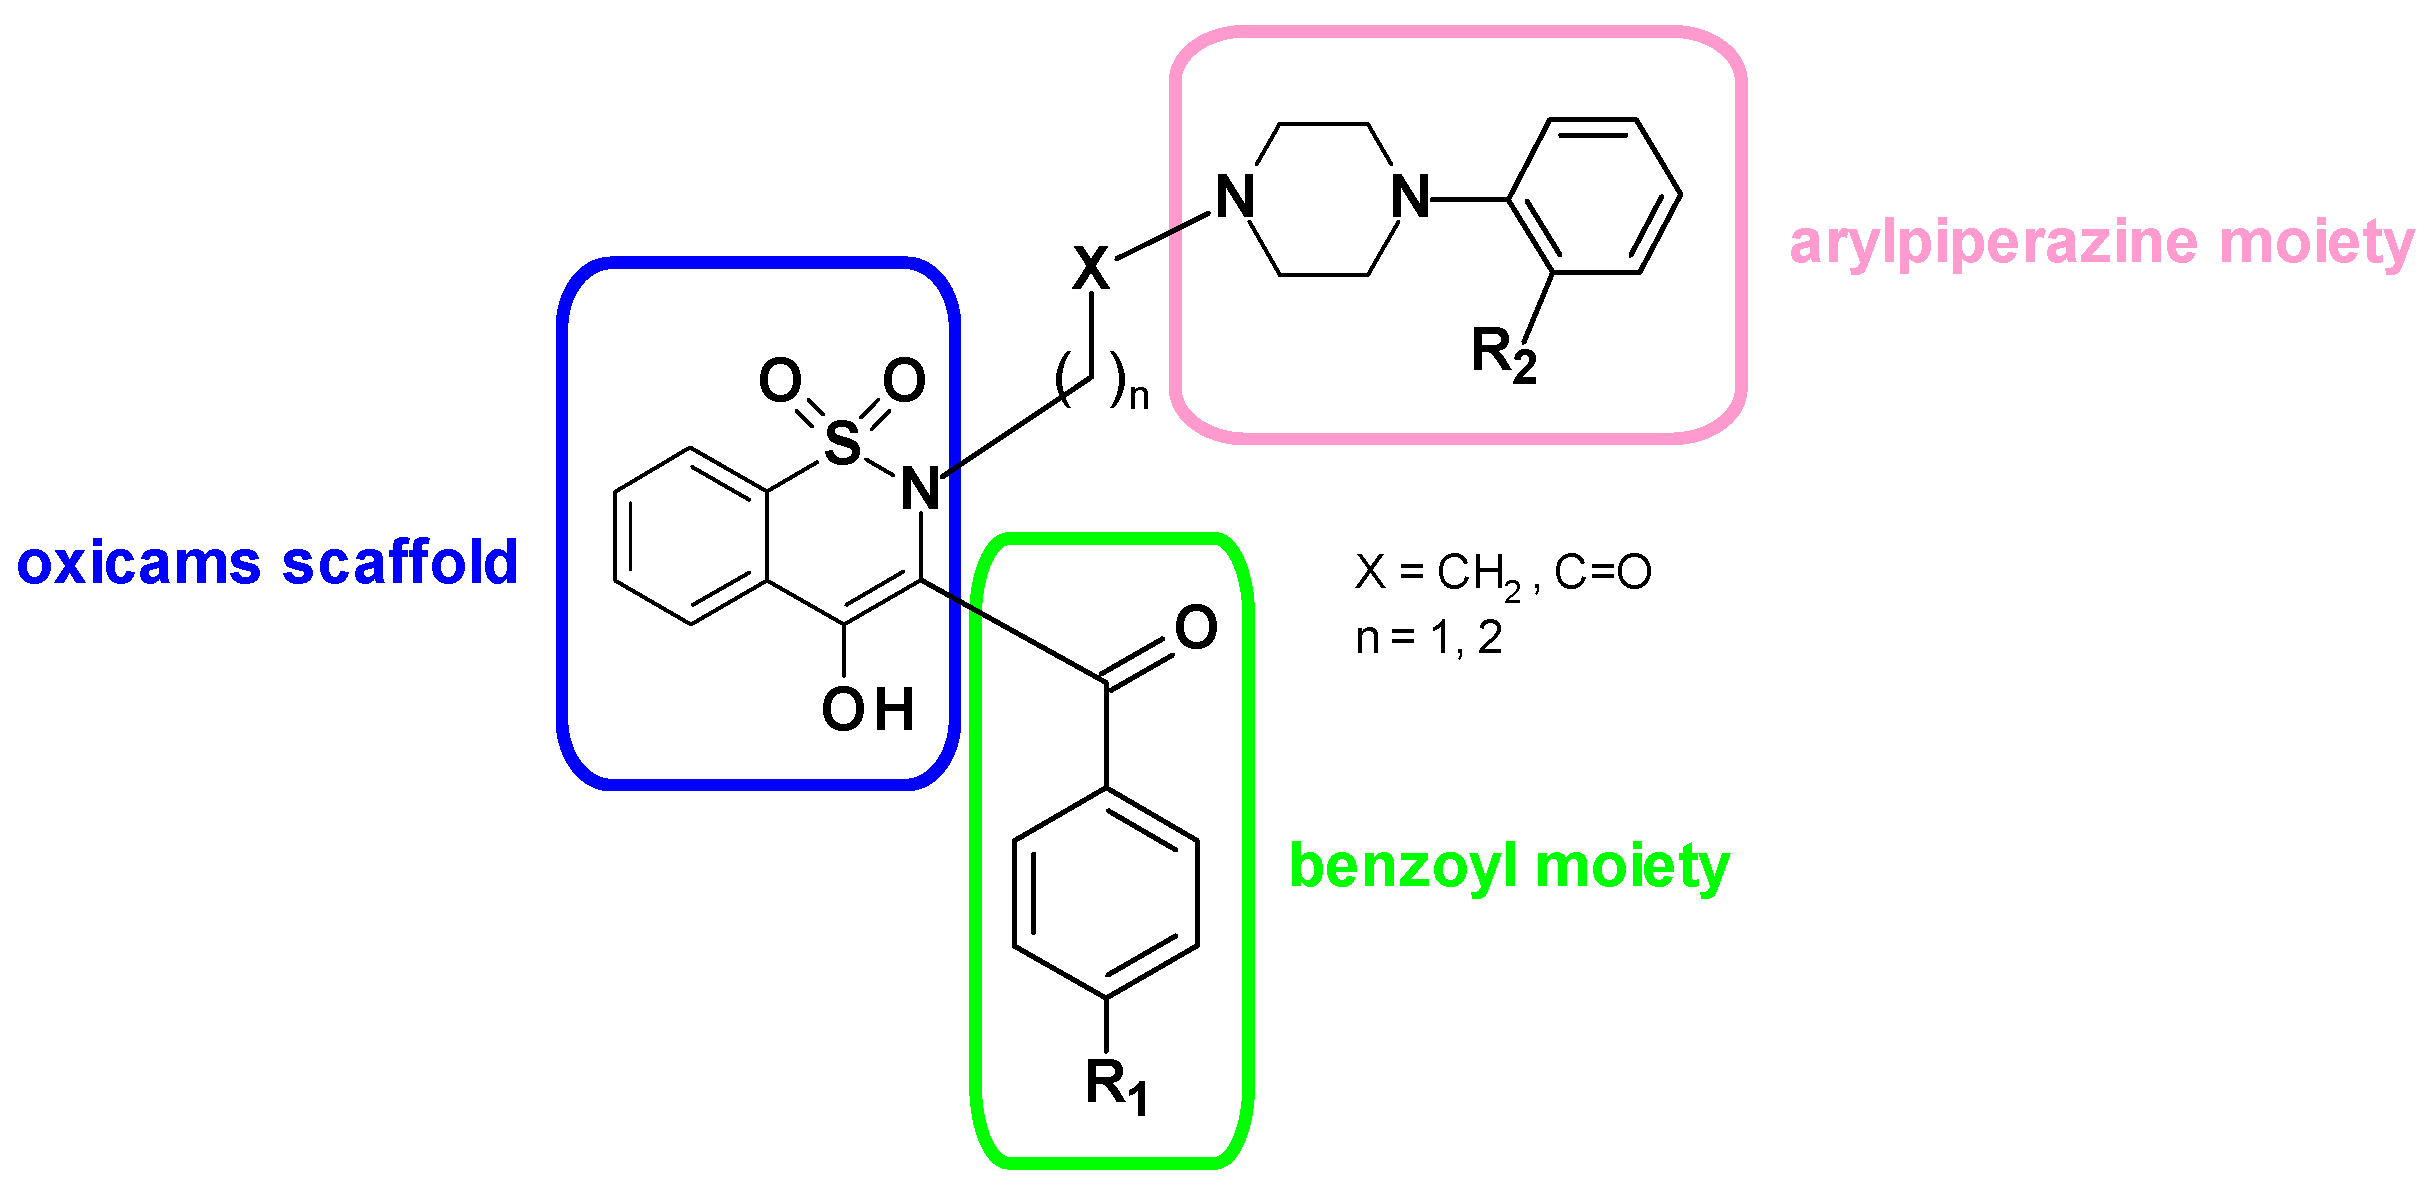
4.4. Synthesis of the Novel Oxicam Drugs
4.5. Analytical Methods
4.5.1. Transcriptomic Analysis
RNA Extraction and Purification
Reverse Transcription
Real-Time (Quantitative) PCR
Normalization Strategy
4.5.2. Liquid Chromatography Coupled with Tandem Mass Spectrometry (LC-MS/MS)
Sample Preparation
Chromatographic and Mass Spectrometry Analysis
Sulforhodamine B (SRB) Assay
4.5.3. Nitrate/Nitrite Determination
4.5.4. Determination of Protein Expression
4.6. Statistical Analysis
5. Conclusions
Supplementary Materials
Author Contributions
Funding
Acknowledgments
Conflicts of Interest
References
- Bray, F.; Ferlay, J.; Soerjomataram, I.; Siegel, R.L.; Torre, L.A.; Jemal, A. Global cancer statistics 2018: GLOBOCAN estimates of incidence and mortality worldwide for 36 cancers in 185 countries. CA Cancer J. Clin. 2018, 68, 394–424. [Google Scholar] [CrossRef] [PubMed] [Green Version]
- Alves Martins, B.A.; de Bulhões, G.F.; Cavalcanti, I.N.; Martins, M.M.; de Oliveira, P.G.; Martins, A.M.A. Biomarkers in Colorectal Cancer: The Role of Translational Proteomics Research. Front. Oncol. 2019, 9, 1284. [Google Scholar] [CrossRef] [PubMed]
- Hanahan, D.; Weinberg, R.A. Hallmarks of cancer: The next generation. Cell 2011, 144, 646–674. [Google Scholar] [CrossRef] [PubMed] [Green Version]
- Faubert, B.; Solmonson, A.; DeBerardinis, R.J. Metabolic reprogramming and cancer progression. Science 2020, 368, eaaw5473. [Google Scholar] [CrossRef] [PubMed]
- Torresano, L.; Nuevo-Tapioles, C.; Santacatterina, F.; Cuezva, J.M. Metabolic reprogramming and disease progression in cancer patients. Biochim. Biophys. Acta Mol. Basis Dis. 2020, 1866, 165721. [Google Scholar] [CrossRef] [PubMed]
- Krzystek-Korpacka, M.; Fleszar, M.G.; Bednarz-Misa, I.; Lewandowski, Ł.; Szczuka, I.; Kempiński, R.; Neubauer, K. Transcriptional and metabolomic analysis of L-arginine/nitric oxide pathway in inflammatory bowel disease and its association with local inflammatory and angiogenic response: Preliminary findings. Int. J. Mol. Sci. 2020, 21, 1641. [Google Scholar] [CrossRef] [PubMed] [Green Version]
- Bednarz-Misa, I.; Fleszar, M.G.; Zawadzki, M.; Kapturkiewicz, B.; Kubiak, A.; Neubauer, K.; Witkiewicz, W.; Krzystek-Korpacka, M. L-Arginine/NO Pathway Metabolites in Colorectal Cancer: Relevance as Disease Biomarkers and Predictors of Adverse Clinical Outcomes Following Surgery. J. Clin. Med. 2020, 9, 1782. [Google Scholar] [CrossRef]
- Albaugh, V.L.; Pinzon-Guzman, C.; Barbul, A. Arginine Metabolism and Cancer. Surg. Oncol. 2017, 115, 273–280. [Google Scholar] [CrossRef]
- Keshet, R.; Erez, A. Arginine and the metabolic regulation of nitric oxide synthesis in cancer. Dis. Model. Mech. 2018, 11, dmm033332. [Google Scholar] [CrossRef] [Green Version]
- Lu, Y.; Wang, W.; Wang, J.; Yang, C.; Mao, H.; Fu, X.; Wu, Y.; Cai, J.; Han, J.; Xu, Z.; et al. Overexpression of arginine transporter CAT-1 is associated with accumulation of L-arginine and cell growth in human colorectal cancer tissue. PLoS ONE 2013, 8, e73866. [Google Scholar] [CrossRef]
- Paz, E.A.; LaFleur, B.; Gerner, E.W. Polyamines are oncometabolites that regulate the LIN28/let-7 pathway in colorectal cancer cells. Mol. Carcinog. 2014, 53 (Suppl. 1), E96–E106. [Google Scholar] [CrossRef]
- Poisson, L.M.; Munkarah, A.; Madi, H.; Datta, I.; Hensley-Alford, S.; Tebbe, C.; Buekers, T.; Giri, S.; Rattan, R. A metabolomic approach to identifying platinum resistance in ovarian cancer. J. Ovarian Res. 2015, 8, 13. [Google Scholar] [CrossRef] [PubMed] [Green Version]
- Szefel, J.; Danielak, A.; Kruszewski, W.J. Metabolic pathways of L-arginine and therapeutic consequences in tumors. Adv. Med. Sci. 2019, 64, 104–110. [Google Scholar] [CrossRef] [PubMed]
- Zou, S.; Wanga, X.; Liua, P.; Kea, C.; Xu, S. Arginine metabolism and deprivation in cancer therapy. Biomed. Pharmacother. 2019, 118, 109210. [Google Scholar] [CrossRef]
- LoGiudice, N.; Le, L.; Abuan, I.; Leizorek, Y.; Roberts, S.C. Alpha-difluoromethylornithine, an irreversible inhibitor of polyamine biosynthesis, as a therapeutic strategy against hyperproliferative and infectious diseases. Med. Sci. 2018, 6, 12. [Google Scholar] [CrossRef] [PubMed] [Green Version]
- Meyskens, F.L., Jr.; McLaren, C.E.; Pelot, D.; Fujikawa-Brooks, S.; Carpenter, P.M.; Hawk, E.; Kelloff, G.; Lawson, M.J.; Kidao, J.; McCracken, J.; et al. Difluoromethylornithine plus sulindac for the prevention of sporadic colorectal adenomas: A randomized placebo-controlled, double-blind trial. Cancer Prev. Res. 2008, 1, 32–38. [Google Scholar] [CrossRef] [PubMed] [Green Version]
- Burke, C.A.; Dekker, E.; Samadder, N.J.; Stoffel, E.; Cohen, A. Efficacy and safety of eflornithine (CPP-1X)/sulindac combination therapy versus each as monotherapy in patients with familial adenomatous polyposis (FAP): Design and rationale of a randomized, double-blind, Phase III trial. BMC Gastroenterol. 2016, 16, 87. [Google Scholar] [CrossRef] [Green Version]
- Gurpinar, E.; Grizzle, W.E.; Piazza, G.A. COX-Independent Mechanisms of Cancer Chemoprevention by Anti-Inflammatory Drugs. Front. Oncol. 2013, 3, 181. [Google Scholar] [CrossRef] [Green Version]
- Gerner, E.W.; Bruckheimer, E.; Cohen, A. Cancer pharmacoprevention: Targeting polyamine metabolism to manage risk factors for colon cancer. J. Biol. Chem. 2018, 293, 18770–18778. [Google Scholar] [CrossRef] [Green Version]
- Obach, R.S.; Lombardo, F.; Waters, N.J. Trend Analysis of a Database of Intravenous Pharmacokinetic Parameters in Humans for 670 Drug Compounds. Drug Metab. Dispos. 2008, 36, 1385–1405. [Google Scholar] [CrossRef] [Green Version]
- Ding, H.; Han, C.; Gibson-D’Ambrosio, R.; Steele, V.E.; D’Ambrosio, S.M. Piroxicam selectively inhibits the growth of premalignant and malignant human oral cell lines by limiting their progression through the S phase and reducing the levels of cyclins and AP-1. Int. J. Cancer 2003, 107, 830–836. [Google Scholar] [CrossRef]
- Khodaie, F.; Khazaei-Poul, Y.; Moini-Zanjani, T. Anti-proliferative effects of piroxicam and nimesulide on A431 human squamous carcinoma cell line. Int. J. Cancer Manag. 2017, 10, e7565. [Google Scholar] [CrossRef]
- Goldman, A.P.; Williams, C.S.; Sheng, H.; Lamps, L.W.; Williams, V.P.; Pairet, M.; Morrow, J.D.; DuBois, R.N. Meloxicam inhibits the growth of colorectal cancer cells. Carcinogenesis 1998, 19, 2195–2199. [Google Scholar] [CrossRef] [PubMed]
- Ayakawa, S.; Shibamoto, Y.; Sugie, C.; Ito, M.; Ogino, H.; Tomita, N.; Kumagai, M.; Murakami, H.; Sawa, H. Antitumor effects of a cyclooxygenase-2 inhibitor, meloxicam, alone and in combination with radiation and/or 5-fluorouracil in cultured tumor cells. Mol. Med. Rep. 2009, 2, 621–625. [Google Scholar] [CrossRef] [PubMed] [Green Version]
- Hanif, R.; Pittas, A.; Feng, Y.; Koutsos, M.I.; Qiao, L.; Staiano-Coico, L.; Shiff, S.I.; Rigas, B. Effects of nonsteroidal anti-inflammatory drugs on proliferation and on induction of apoptosis in colon cancer cells by a prostaglandin-independent pathway. Biochem. Pharmacol. 1996, 52, 237–245. [Google Scholar] [CrossRef]
- Saini, M.K.; Sanya, S.N. Targeting angiogenic pathway for chemoprevention of experimental colon cancer using C-phycocyanin as cyclooxygenase-2 inhibitor. Biochem. Cell Biol. 2014, 92, 206–218. [Google Scholar] [CrossRef]
- Krall, J.A.; Reinhardt, F.; Mercury, O.A.; Pattabiraman, D.R.; Brooks, M.W.; Dougan, M.; Lambert, A.W.; Bierie, B.; Ploegh, H.L.; Dougan, S.K.; et al. The systemic response to surgery triggers the outgrowth of distant immune-controlled tumors in mouse models of dormancy. Sci. Transl. Med. 2018, 10, eaan3464. [Google Scholar] [CrossRef] [Green Version]
- Szczęśniak-Sięga, B.M.; Mogilski, S.; Wiglusz, R.J.; Janczak, J.; Maniewska, J.; Malinka, W.; Filipek, B. Synthesis and pharmacological evaluation of novel arylpiperazine oxicams derivatives as potent analgesics without ulcerogenicity. Bioorg. Med. Chem. 2019, 27, 1619–1628. [Google Scholar] [CrossRef]
- Dakubo, G.D.; Jakupciak, J.P.; Birch-Machin, M.A.; Parr, R.L. Clinical implications and utility of field cancerization. Cancer Cell Int. 2007, 7, 2. [Google Scholar] [CrossRef] [Green Version]
- Patel, A.; Tripathi, G.; Gopalakrishnan, K.; Williams, N.; Arasaradnam, R.P. Field cancerisation in colorectal cancer: A new frontier or pastures past? World J. Gastroenterol. 2015, 21, 3763–3772. [Google Scholar] [CrossRef] [PubMed]
- Yamazaki, R.; Kusunoki, N.; Matsuzaki, T.; Hashimoto, S.; Kawai, S. Selective cyclooxygenase-2 inhibitors show a deferential ability to inhibit proliferation and induce apoptosis of colon adenocarcinoma cells. FEBS Lett. 2002, 531, 278–284. [Google Scholar] [CrossRef]
- Tsikas, D.; Gutzki, F.M.; Stichtenoth, D.O. Circulating and excretory nitrite and nitrate as indicators of nitric oxide synthesis in humans: Methods of analysis. Eur. J. Clin. Pharmacol. 2006, 62, 51–59. [Google Scholar] [CrossRef]
- Brankovic, B.; Stanojevic, G.; Stojanovic, I.; Veljkovic, A.; Kocic, G.; Janosevic, P.; Nestorovic, M.; Petrovic, D.; Djindjic, B.; Pavlovic, D.; et al. Nitric oxide synthesis modulation—A possible diagnostic and therapeutic target in colorectal cancer. J. BUON 2017, 22, 162–169. [Google Scholar] [PubMed]
- Manna, S.K.; Tanaka, N.; Krausz, K.W.; Haznadar, M.; Xue, X.; Matsubara, T.; Bowman, E.D.; Fearon, E.R.; Harris, C.C.; Shah, Y.M.; et al. Biomarkers of coordinate metabolic reprogramming in colorectal tumors in mice and humans. Gastroenterology 2014, 146, 1313–1324. [Google Scholar] [CrossRef] [Green Version]
- Salimian Rizi, B.; Achreja, A.; Nagrath, D. Nitric oxide: The forgotten child of tumor metabolism. Trends Cancer 2017, 3, 659–672. [Google Scholar] [CrossRef]
- Radi, R. Oxygen radicals, nitric oxide, and peroxynitrite: Redox pathways in molecular medicine. Proc. Natl. Acad. Sci. USA 2018, 115, 5839–5848. [Google Scholar] [CrossRef] [Green Version]
- Hulin, J.A.; Gubareva, E.A.; Jarzebska, N.; Rodionov, R.N.; Mangoni, A.A.; Tommasi, S. Inhibition of Dimethylarginine Dimethylaminohydrolase (DDAH) Enzymes as an Emerging Therapeutic Strategy to Target Angiogenesis and Vasculogenic Mimicry in Cancer. Front. Oncol. 2020, 9, 1455. [Google Scholar] [CrossRef]
- Saini, M.K.; Vaish, V.; Sanyal, S.N. Role of cytokines and Jak3/Stat3 signaling in the 1,2-dimethylhydrazine dihydrochloride-induced rat model of colon carcinogenesis: Early target in the anticancer strategy. Eur. J. Cancer Prev. 2013, 22, 215–228. [Google Scholar] [CrossRef]
- Li, H.; Zhou, Y.; Zhao, A.; Qiu, Y.; Xie, G.; Jiang, Q.; Zheng, X.; Zhong, W.; Sun, X.; Zhou, Z.; et al. Asymmetric dimethylarginine attenuates serum starvation-induced apoptosis via suppression of the Fas (APO-1/CD95)/JNK (SAPK) pathway. Cell Death Dis. 2013, 4, e830. [Google Scholar] [CrossRef] [Green Version]
- Kostourou, V.; Robinson, S.P.; Cartwright, J.E.; Whitley, G.S. Dimethylarginine dimethylaminohydrolase I enhances tumour growth and angiogenesis. Br. J. Cancer 2002, 87, 673–680. [Google Scholar] [CrossRef]
- Vanella, L.; Di Giacomo, C.; Acquaviva, R.; Santangelo, R.; Cardile, V.; Barbagallo, I.; Abraham, N.G.; Sorrenti, V. The DDAH/NOS pathway in human prostatic cancer cell lines: Antiangiogenic effect of L-NAME. Int. J. Oncol. 2011, 39, 1303–1310. [Google Scholar] [CrossRef] [PubMed]
- Hulin, J.A.; Tommasi, S.; Elliot, D.; Hu, D.G.; Lewis, B.C.; Mangoni, A.A. MiR-193b regulates breast cancer cell migration and vasculogenic mimicry by targeting dimethylarginine dimethylaminohydrolase 1. Sci. Rep. 2017, 7, 1–15. [Google Scholar] [CrossRef] [PubMed]
- Reddy, K.R.K.; Dasari, C.; Duscharla, D.; Supriya, B.; Ram, N.S.; Surekha, M.V.; Kumar, J.M.; Ummanni, R. Dimethylarginine dimethylaminohydrolase-1 (DDAH1) is frequently upregulated in prostate cancer, and its overexpression conveys tumor growth and angiogenesis by metabolizing asymmetric dimethylarginine (ADMA). Angiogenesis 2018, 21, 79–94. [Google Scholar] [CrossRef] [PubMed]
- Shiozawa, T.; Iyama, S.; Toshima, S.; Sakata, A.; Usui, S.; Minami, Y.; Sato, Y.; Hizawa, N.; Noguchi, M. Dimethylarginine dimethylaminohydrolase 2 promotes tumor angiogenesis in lung adenocarcinoma. Virchows Arch. 2016, 468, 179–190. [Google Scholar] [CrossRef] [Green Version]
- Smith, C.L.; Birdsey, G.M.; Anthony, S.; Arrigoni, F.I.; Leiper, J.M.; Vallance, P. Dimethylarginine dimethylaminohydrolase activity modulates ADMA levels, VEGF expression, and cell phenotype. Biochem. Biophys. Res. Commun. 2003, 308, 984–989. [Google Scholar] [CrossRef] [Green Version]
- Wojciak-Stothard, B.; Torondel, B.; Tsang, L.Y.; Fleming, I.; Fisslthaler, B.; Leiper, J.M.; Vallance, P. The ADMA/DDAH pathway is a critical regulator of endothelial cell motility. J. Cell Sci. 2007, 120, 929–942. [Google Scholar] [CrossRef] [Green Version]
- Liu, X.J.; Hong, Q.; Wang, Z.; Yu, Y.Y.; Zou, X.; Xu, L.H. MicroRNA21 promotes interstitial fibrosis via targeting DDAH1: A potential role in renal fibrosis. Mol. Cell. Biochem. 2016, 411, 181–189. [Google Scholar] [CrossRef]
- Ye, J.; Xu, J.; Li, Y.; Huang, Q.; Huang, J.; Wang, J.; Zhong, W.; Lin, X.; Chen, W.; Lin, X. DDAH1 mediates gastric cancer cell invasion and metastasis via Wnt/b-catenin signaling pathway. Mol. Oncol. 2017, 11, 1208–1224. [Google Scholar] [CrossRef] [Green Version]
- Neubauer, K.; Bednarz-Misa, I.; Diakowska, D.; Kapturkiewicz, B.; Gamian, A.; Krzystek-Korpacka, M. Nampt/PBEF/visfatin upregulation in colorectal tumors, mirrored in normal tissue and whole blood of colorectal cancer patients, is associated with metastasis, hypoxia, IL1β, and anemia. BioMed Res. Int. 2015, 2015, 523930. [Google Scholar] [CrossRef] [Green Version]
- Krzystek-Korpacka, M.; Gorska, S.; Diakowska, D.; Kapturkiewicz, B.; Podkowik, M.; Gamian, A.; Bednarz-Misa, I. Midkine is up-regulated in both cancerous and inflamed bowel, reflecting lymph node metastasis in colorectal cancer and clinical activity of ulcerative colitis. Cytokine 2017, 89, 68–75. [Google Scholar] [CrossRef]
- Bednarz-Misa, I.; Diakowska, D.; Krzystek-Korpacka, M. Local and systemic IL-7 concentration in gastrointestinal-tract cancers. Medicina 2019, 55, 262. [Google Scholar] [CrossRef] [Green Version]
- Yang, Y.; Bedford, M.T. Protein arginine methyltransferases and cancer. Nat. Rev. Cancer 2013, 13, 37–50. [Google Scholar] [CrossRef]
- Wei, H.H.; Fan, X.J.; Hu, Y.; Guo, M.; Fang, Z.Y.; Wu, P.; Tian, X.X.; Gao, S.X.; Peng, C.; Yang, Y.; et al. A systematic survey of PRMT interactomes reveals the key roles of arginine methylation in the global control of RNA splicing and translation. bioRxiv 2019, 746529. [Google Scholar] [CrossRef] [Green Version]
- Li, X.; Wang, C.; Jiang, H.; Luo, C. A patent review of arginine methyltransferase inhibitors (2010–2018). Expert Opin. Ther. Pat. 2019, 29, 97–114. [Google Scholar] [CrossRef]
- Baldwin, R.M.; Morettin, A.; Côté, J. Role of PRMTs in cancer: Could minor isoforms be leaving a mark? World J. Biol. Chem. 2014, 5, 115–129. [Google Scholar] [CrossRef]
- Mathioudaki, K.; Papadokostopoulou, A.; Scorilas, A.; Xynopoulos, D.; Agnanti, N.; Talieri, M. The PRMT1 gene expression pattern in colon cancer. Br. J. Cancer 2008, 99, 2094–2099. [Google Scholar] [CrossRef] [Green Version]
- Lattouf, H.; Poulard, C.; Le Romancer, M. PRMT5 prognostic value in cancer. Oncotarget 2019, 10, 3151–3153. [Google Scholar] [CrossRef] [Green Version]
- Ichikawa, T.; Shanab, O.; Nakahata, S.; Shimosaki, S.; Manachai, N.; Ono, M.; Iha, H.; Shimoda, K.; Morishita, K. Novel PRMT5-mediated arginine methylations of HSP90A are essential for maintenance of HSP90A function in NDRG2low ATL and various cancer cells. Biochim. Biophys. Acta Mol. Cell Res. 2020, 1867, 118615. [Google Scholar] [CrossRef]
- Thun, M.J.; Henley, S.J.; Patrono, C. Nonsteroidal Anti-inflammatory Drugs as Anticancer Agents: Mechanistic, Pharmacologic, and Clinical Issues. J. Nat. Cancer Inst. 2002, 94, 252–266. [Google Scholar] [CrossRef] [Green Version]
- Tao, L.; Kramer, P.M.; Wang, W.; Yang, S.; Lubet, R.A.; Steele, V.E.; Pereira, M.A. Altered expression of c-myc, p16 and p27 in rat colon tumors and its reversal by short-term treatment with chemopreventive agents. Carcinogenesis 2002, 23, 1447–1454. [Google Scholar] [CrossRef] [Green Version]
- Carbone, P.P.; Douglas, J.A.; Larson, P.O.; Verma, A.K.; Blair, I.A.; Pomplun, M.; Tutsch, K.D. Phase I chemoprevention study of piroxicam and alphadifluoromethylornithine. Cancer Epidemiol. Biomark. Prev. 1998, 7, 907–912. [Google Scholar]
- Calaluce, R.; Earnest, D.L.; Heddens, D.; Einspahr, J.G.; Roe, D.; Bogert, C.L.; Marshall, J.R.; Alberts, D.S. Effects of piroxicam on prostaglandin E2 levels in rectal mucosa of adenomatous polyp patients: A randomized phase IIb trial. Cancer Epidemiol. Biomark. Prev. 2000, 9, 1287–1292. [Google Scholar]
- Finley, P.R.; Bogert, C.L.; Alberts, D.S.; Einspahr, J.; Earnest, D.L.; Blackwell, G.; Girodias, K. Measurement of prostaglandin E2 in rectal mucosa in human subjects: A method study. Cancer Epidemiol. Biomark. Prev. 1995, 4, 239–244. [Google Scholar]
- Hatnapure, G.D.; Keche, A.P.; Rodge, A.H.; Birajdar, S.S.; Tale, R.H.; Kamble, V.M. Synthesis and biological evaluation of novel piperazine derivatives of flavone as potent anti-inflammatory and antimicrobial agent. Bioorg. Med. Chem. Lett. 2012, 22, 6385–6390. [Google Scholar] [CrossRef]
- Malinka, W.; Kaczmarz, M.; Filipek, B.; Sapa, J.; Glod, B. Preparation of novel derivatives of pyridothiazine-1,1-dioxide and their CNS and antioxidant properties. Farmaco 2002, 57, 737–746. [Google Scholar] [CrossRef]
- Dogruer, D.; Kupeli, E.; Yesilada, E.; Sahin, M.F. Synthesis of New 2-[1(2H)-Phthalazinon-2-yl]-acetamide and 3-[1(2H)-Phthalazinon-2-yl]-propanamide Derivatives as Antinociceptive and Anti-inflammatory Agents. Arch. Pharm. Med. Chem. 2004, 337, 303–310. [Google Scholar] [CrossRef]
- Kus, K.; Kij, A.; Zakrzewska, A.; Jasztal, A.; Stojak, M.; Walczak, M.; Chlopicki, S. Alterations in arginine and energy metabolism, structural and signalling lipids in metastatic breast cancer in mice detected in plasma by targeted metabolomics and lipidomics. Breast Cancer Res. 2018, 20, 1–13. [Google Scholar] [CrossRef]
- Wu, Y.; He, C.; Hu, S.; Hu, Z.; Li, Y.; Xing, X.; Du, X. Downregulation of ARG2 inhibits growth of colorectal cancer cells and increases expression of the CD3ζ chain in co-cultured T-cells. Int. J. Clin. Exp. Med. 2019, 12, 6946–6957. [Google Scholar]
- Pedrosa, L.; Esposito, F.; Thomson, T.M.; Maurel, J. The Tumor Microenvironment in Colorectal Cancer Therapy. Cancers 2019, 11, 1172. [Google Scholar] [CrossRef] [Green Version]
- Miret, J.J.; Kirschmeier, P.; Koyama, S.; Zhu, M.; Li, Y.Y.; Naito, Y.; Wu, M.; Malladi, V.S.; Huang, W.; Walker, W.; et al. Suppression of Myeloid Cell Arginase Activity leads to Therapeutic Response in a NSCLC Mouse Model by Activating Anti-Tumor Immunity. J. Immunother. Cancer 2019, 7, 32. [Google Scholar] [CrossRef]
- Morris, S.M. Arginine metabolism: Boundaries of our knowledge. J. Nutr. 2007, 137, 1602S–1609S. [Google Scholar] [CrossRef] [PubMed] [Green Version]
- Porembska, Z.; Za̧bek, J.; Graboń, W.; Rahden-Staroń, I.; Barańczyk-Kuźma, A. Arginase isoforms in human colorectal cancer. Clin. Chim. Acta 2001, 305, 157–165. [Google Scholar] [CrossRef]
- Mielczarek-Puta, M.; Graboń, W.; Chrzanowska, A.; Barańczyk-Kuźma, A. Arginase and arginine in diagnostics of patients with colorectal cancer and patients with colorectal cancer liver metastases. Contemp. Oncol. Wspolczesna Onkol. 2008, 12, 51–55. [Google Scholar]
- Ma, Z.; Lian, J.; Yang, M.; Wuyang, J.; Zhao, C.; Chen, W.; Liu, C.; Zhao, Q.; Lou, C.; Han, J.; et al. Overexpression of Arginase-1 is an indicator of poor prognosis in patients with colorectal cancer. Pathol. Res. Pract. 2019, 215, 152383. [Google Scholar] [CrossRef]
- Czystowska-Kuzmicz, M.; Sosnowska, A.; Nowis, D.; Ramji, K.; Szajnik, M.; Chlebowska-Tuz, J.; Wolinska, E.; Gaj, P.; Grazul, M.; Pilch, Z.; et al. Small extracellular vesicles containing arginase-1 suppress T-cell responses and promote tumor growth in ovarian carcinoma. Nat. Commun. 2019, 10, 3000. [Google Scholar] [CrossRef]
- Ma, Z.; Zhen, Y.; Hu, C.; Yi, H. Myeloid-Derived Suppressor Cell-Derived Arginase-1 Oppositely Modulates IL-17A and IL-17F through the ESR/STAT3 Pathway during Colitis in Mice. Front. Immunol. 2020, 11, 687. [Google Scholar] [CrossRef] [Green Version]
- Mayorek, N.; Naftali-Shani, N.; Grunewald, M. Diclofenac Inhibits Tumor Growth in a Murine Model of Pancreatic Cancer by Modulation of VEGF Levels and Arginase Activity. PLoS ONE 2010, 5, e12715. [Google Scholar] [CrossRef] [Green Version]
- Verma, A.K.; Ashendel, C.L.; Boutwell, R.K. Inhibition by prostaglandin synthesis inhibitors of the induction of epidermal ornithine decarboxylase activity, the accumulation of prostaglandins, and tumor promotion caused by 12-O-tetradecanoylphorbol-13-acetate. Cancer Res. 1980, 40, 308–315. [Google Scholar]
- Closs, E.I.; Simon, A.; Vekony, N.; Rotmann, A. Plasma membrane transporters for arginine. J. Nutr. 2004, 134, 2752S–2759S. [Google Scholar] [CrossRef]
- Krzyżak, E.; Szczęśniak-Sięga, B.; Malinka, W. Synthesis and thermal behaviour of new benzo-1,2-thiazine long-chain aryl-piperazine derivatives. J. Therm. Anal. Calorim. 2014, 115, 793–802. [Google Scholar] [CrossRef] [Green Version]
- Szczęśniak-Sięga, B.; Maniewska, J.; Poła, A.; Środa-Pomianek, K.; Malinka, W.; Michalak, K. Synthesis of new Piroxicam analogues and their influence on lipid bilayers. Acta Pol. Pharm. Drug Res. 2014, 71, 1045–1050. [Google Scholar] [CrossRef]
- Maniewska, J.; Szczęśniak-Sięga, B.; Poła, A.; Środa-Pomianek, K.; Malinka, W.; Michalak, K. The interaction of new piroxicam analogues with lipid bilayers—a calorimetric and fluorescence spectroscopic study. Acta Pol. Pharm. Drug Res. 2014, 71, 1004–1012. [Google Scholar] [CrossRef]
- Krzystek-Korpacka, M.; Diakowska, D.; Bania, J.; Gamian, A. Expression stability of common housekeeping genes is differently affected by bowel inflammation and cancer: Implications for finding suitable normalizers for inflammatory bowel disease studies. Inflamm. Bowel Dis. 2014, 20, 1147–1156. [Google Scholar] [CrossRef]
- Vandesompele, J.; De Preter, K.; Pattyn, F.; Poppe, B.; Van Roy, N.; De Paepe, A.; Speleman, F. Accurate normalization of real-time quantitative RT-PCR data by geometric averaging of multiple internal control genes. Genome Biol. 2002, 3, Research0034. [Google Scholar] [CrossRef] [Green Version]
- Fleszar, M.G.; Wiśniewski, J.; Krzystek-Korpacka, M.; Misiak, B.; Frydecka, D.; Piechowicz, J.; Lorenc-Kukuła, K.; Gamian, A. Quantitative analysis of L-arginine, dimethylated arginine derivatives, l-citrulline, and dimethylamine in human serum using liquid chromatography–mass spectrometric method. Chromatographia 2018, 81, 911–921. [Google Scholar] [CrossRef] [Green Version]
- Chachaj, A.; Wiśniewski, J.; Rybka, J.; Butrym, A.; Biedroń, M.; Krzystek-Korpacka, M.; Fleszar, M.G.; Karczewski, M.; Wróbel, T.; Mazur, G.; et al. Asymmetric and symmetric dimethylarginines and mortality in patients with hematological malignancies—A prospective study. PLoS ONE 2018, 13, e0197148. [Google Scholar] [CrossRef] [PubMed] [Green Version]
- Krzystek-Korpacka, M.; Wiśniewski, J.; Fleszar, M.G.; Bednarz-Misa, I.; Bronowicka-Szydełko, A.; Gacka, M.; Masłowski, L.; Kędzior, K.; Witkiewicz, W.; Gamian, A. Metabolites of the nitric oxide (NO) pathway are altered and indicative of reduced NO and arginine bioavailability in patients with cardiometabolic diseases complicated with chronic wounds of lower extremities: Targeted metabolomics approach (LC-MS/MS). Oxid. Med. Cell. Longev. 2019, 2019, 5965721. [Google Scholar] [CrossRef] [PubMed] [Green Version]
- Fleszar, M.G.; Wiśniewski, J.; Zboch, M.; Diakowska, D.; Gamian, A.; Krzystek-Korpacka, M. Targeted metabolomic analysis of nitric oxide/L-arginine pathway metabolites in dementia: Association with pathology, severity, and structural brain changes. Sci. Rep. 2019, 9, 13764. [Google Scholar] [CrossRef]
- Smith, P.K.; Krohn, R.I.; Hermanson, G.T.; Mallia, A.K.; Gartner, F.H.; Provenzano, M.D.; Fujimoto, E.K.; Goeke, N.M.; Olson, B.J.; Klenk, D.C. Measurement of protein using bicinchoninic acid. Anal. Biochem. 1985, 150, 76–85. [Google Scholar] [CrossRef]
- Laemmli, U.K. Cleavage of structural proteins during the assembly of the head of bacteriophage T4. Nature 1970, 227, 680–685. [Google Scholar] [CrossRef]


| Gene | Comp. | 5 µM | 50 µM | 200 µM | ||||||
|---|---|---|---|---|---|---|---|---|---|---|
| Caco2 | HCT | HT29 | Caco2 | HCT | HT29 | Caco2 | HCT | HT29 | ||
| ARG2 | #1 | ↓(1.1) | ↓1.2 2 | = | = | = | ↑3.8 1 | ↑1.8 1 | ↑3.9 2 | ↑7.0 2 |
| #2 | = | = | = | ↓1.3 1 | = | ↑6.7 1 | = | ↑2.1 1 | ↑6.4 2 | |
| #3 | = | ↓(1.3) | ↑1.5 2 | = | = | ↑4.0 1 | = | ↑2.0 1 | ↑(4.3) | |
| #4 | = | = | = | ↓1.2 1 | = | = | ↑3.9 1 | = | ↑3.8 2 | |
| #5 | = | = | ↓(1.6) | ↓(1.4) | = | = | = | = | ↑(7.0) | |
| P | = | = | = | = | = | = | = | = | = | |
| M | = | ↑1.2 1 | = | = | = | = | = | ↓2.0 2 | = | |
| DDAH1 | #1 | = | = | = | = | = | ↓1.9 1 | = | = | ↓1.9 1 |
| #2 | = | = | = | ↓1.7 1 | ↓2.0 1 | = | = | ↓1.7 2 | ↓2.4 1 | |
| #3 | = | = | ↑(1.3) | = | ↓(1.6) | ↓(2.3) | = | ↓2.2 1 | ↓3.7 1 | |
| #4 | = | = | = | = | = | = | = | = | = | |
| #5 | = | = | = | = | = | = | = | = | ↓3.0 1 | |
| P | = | = | = | = | = | = | = | = | = | |
| M | = | = | ↓1.2 1 | = | = | = | = | = | ↓(1.3) | |
| DDAH2 | #1 | = | ↓1.1 1 | = | = | = | ↓1.5 1 | ↓1.4 1 | = | ↓(1.9) |
| #2 | = | ↓1.5 1 | = | = | = | = | = | = | ↓2.1 1 | |
| #3 | = | = | ↑1.4 2 | = | = | = | = | = | ↓(3.0) | |
| #4 | = | ↓1.2 1 | = | = | ↓1.6 1 | = | = | = | = | |
| #5 | = | = | ↓(1.3) | = | = | = | = | = | ↓1.5 1 | |
| P | = | = | = | = | = | = | = | = | = | |
| M | = | = | = | = | = | = | = | = | ↓1.8 1 | |
| NOS2 | #1 | = | - | - | = | - | - | ↑2.2 1 | - | - |
| #2 | = | - | - | ↓(1.7) | - | - | ↑3.3 2 | - | - | |
| #3 | = | - | - | = | - | - | = | - | - | |
| #4 | = | - | - | = | - | - | ↑2.9 1 | - | - | |
| #5 | = | - | - | = | - | - | ↑(1.9) | - | - | |
| P | = | - | - | = | - | - | = | - | - | |
| M | = | - | - | = | - | - | = | - | - | |
| PRMT1 | #1 | = | = | ↑1.8 2 | = | = | = | = | = | ↓(1.5) |
| #2 | = | = | = | ↓(1.7) | ↓2.1 1 | ↓(1.6) | = | ↓2.3 2 | ↓2.4 2 | |
| #3 | = | = | = | = | ↓1.8 1 | ↓2.1 2 | = | ↓3.3 1 | ↓4.6 2 | |
| #4 | = | = | = | ↓1.2 1 | = | = | = | = | ↓(2.0) | |
| #5 | = | = | = | = | = | = | = | = | ↓3.2 1 | |
| P | = | = | = | = | = | = | = | = | = | |
| M | = | = | ↓1.1 1 | = | = | = | = | = | ↓(1.1) | |
| PRMT5 | #1 | = | = | ↑1.5 1 | = | ↓(1.4) | = | ↑1.6 2 | = | = |
| #2 | = | = | = | ↓1.4 1 | ↓2.1 1 | = | = | ↓2.6 1 | ↓1.7 1 | |
| #3 | = | = | ↑1.2 1 | ↓1.5 1 | ↓1.9 1 | = | = | ↓3.6 2 | ↓3.2 2 | |
| #4 | = | = | = | = | = | = | = | ↓3.8 1 | ↓2.0 1 | |
| #5 | = | = | ↓(1.3) | = | = | = | = | = | ↓2.4 1 | |
| P | ↓(1.3) | = | = | = | = | = | = | = | = | |
| M | = | = | = | = | = | = | = | = | ↓1.2 2 | |
| Gene | Comp. | 5 µM | 50 µM | 200 µM | ||||||
|---|---|---|---|---|---|---|---|---|---|---|
| Caco2 | HCT | HT29 | Caco2 | HCT | HT29 | Caco2 | HCT | HT29 | ||
| Arg | #1 | = | = | = | ↑(1.4) | ↑2.3 1 | ↑2.8 1 | = | ↑2.6 1 | ↑4.2 1 |
| #2 | = | = | = | ↑(1.5) | ↑2.6 2 | ↑3.4 1 | ↑(2.2) | ↑2.3 1 | ↑2.9 1 | |
| #3 | ↑1.4 1 | = | = | ↑(1.8) | ↑2.1 1 | ↑3.7 2 | ↑1.3 2 | ↑2.2 2 | ↑(2.1) | |
| #4 | ↑(1.3) | = | ↓(1.4) | ↑1.4 2 | ↑(1.6) | ↑(2.0) | ↑1.5 2 | = | ↑3.3 1 | |
| #5 | ↑1.2 1 | = | ↓(1.7) | ↑(1.5) | = | = | ↓2.2 1 | = | = | |
| P | ↑1.4 1 | = | = | ↑(1.5) | = | = | = | = | = | |
| M | ↑1.5 2 | = | = | ↑1.6 1 | = | = | = | = | = | |
| Cit | #1 | = | = | = | = | = | = | ↑1.5 2 | = | = |
| #2 | = | = | ↑1.3 1 | = | = | = | ↑1.8 1 | ↑2.1 1 | = | |
| #3 | ↑(1.1) | = | = | = | ↑(2.0) | ↑(3.2) | ↑1.5 2 | ↑2.2 1 | = | |
| #4 | = | = | = | = | = | = | = | = | = | |
| #5 | = | = | = | = | = | = | = | = | = | |
| P | = | = | = | = | = | = | = | = | = | |
| M | = | = | = | = | = | = | = | = | = | |
| Orn | #1 | ↓(1.1) | = | = | = | = | ↑(1.6) | ↑2.3 2 | = | ↑1.8 1 |
| #2 | = | = | = | = | ↑2.7 1 | = | = | ↑2.3 2 | ↑(1.6) | |
| #3 | ↑1.1 1 | = | = | = | ↑(2.2) | ↑(1.6) | = | ↑2.3 1 | = | |
| #4 | = | = | = | = | = | = | = | = | = | |
| #5 | = | = | = | = | ↑(1.9) | = | = | ↑(2.9) | ↑(1.3) | |
| P | ↑(1.1) | = | ↓(1.1) | = | = | = | = | = | = | |
| M | = | ↑2.3 1 | = | = | = | = | = | = | = | |
| ADMA | #1 | = | = | = | = | = | ↑2.2 2 | ↑1.3 1 | ↑(1.8) | ↑(2.3) |
| #2 | = | = | ↑1.7 1 | = | ↑(2.2) | ↑(2.9) | ↑1.7 2 | ↑2.2 1 | = | |
| #3 | = | = | = | = | = | ↑(3.0) | ↑1.5 1 | ↑2.1 2 | = | |
| #4 | = | = | = | = | = | = | ↑(1.1) | = | = | |
| #5 | = | = | = | = | = | = | = | = | = | |
| P | = | = | = | = | = | = | = | = | = | |
| M | = | = | = | = | = | = | = | = | ↑1.7 1 | |
| SDMA | #1 | = | = | = | = | ↑2.6 1 | ↑2.6 1 | ↑3.2 1 | ↑2.5 1 | ↑2.6 1 |
| #2 | = | = | = | = | ↑2.4 1 | ↑2.6 1 | ↑2.0 1 | ↑2.2 1 | ↑2.3 1 | |
| #3 | ↑1.1 2 | = | = | ↑(1.3) | = | ↑2.6 1 | = | ↑(1.9) | ↑(1.8) | |
| #4 | = | = | = | = | = | = | ↑1.7 2 | = | ↑2.0 1 | |
| #5 | = | = | = | = | = | ↑1.4 2 | = | = | = | |
| P | = | = | = | = | = | = | ↑1.2 1 | = | = | |
| M | = | = | = | = | = | = | = | = | = | |
| DMA | #1 | = | = | = | = | = | = | = | = | ↑(1.3) |
| #2 | = | = | = | ↑(1.1) | ↑(2.3) | = | = | = | = | |
| #3 | = | = | = | = | ↑(2.1) | = | = | ↑(2.7) | = | |
| #4 | = | = | = | ↓1.1 1 | = | = | = | = | = | |
| #5 | = | = | = | = | = | = | = | = | = | |
| P | ↑(1.1) | = | = | = | = | ↓2.1 1 | = | = | = | |
| M | = | = | ↓2.9 1 | = | = | = | = | = | ↓(1.8) | |
| Parameter | CRC |
|---|---|
| N | 55 |
| Sex (F/M), n | 22/33 |
| Age [yrs.], median (range) | 68 (28–84) |
| Stage (0/I/II/III/IV) | 8/6/14/23/4 |
| Primary tumor, T (Tis/1/2/3/4) | 8/2/7/30/8 |
| Lymph node metastasis, N (0/1/2) | 28/14/13 |
| Distant metastasis, M (no/yes) | 51/4 |
| Grade, G (1/2/3/x) | 8/36/7/4 |
| Tumor location (left-side/right-side/rectum) | 17/17/21 |
| Gene Symbol | Full Name | Accession No. | Sequence 5′→3′ | Size [bp] |
|---|---|---|---|---|
| PPIA1 | Peptidylprolyl isomerase A | NM_021130.3 | F: ggcaaatgctggacccaacaca R: tgctggtcttgccattcctgga | 161 |
| RPLP01 | Ribosomal protein, large, P0 | NM_001002.3 | F: tcacaacaagcataccaagaagc R: gtatccgatgtccacaatgtcaag | 263 |
| ARG12 | Arginase-1 | NM_001244438.2 | F: tcatctgggtggatgctcacac R: gagaatcctggcacatcgggaa | 130 |
| ARG21 | Arginase-2 | NM_001172.4 | F: ctggcttgatgaaaaggctctcc R: tgagcgtggattcactatcaggt | 119 |
| NOS21 | Inducible nitric oxide synthase | NM_000625.4 | F: gctctacacctccaatgtgacc R: ctgccgagatttgagcctcatg | 136 |
| PRMT11 | Arginine N-methyltransferase-1 | NM_001536.5 | F: tgcggtgaagatcgtcaaagcc R: ggactcgtagaagaggcagtag | 142 |
| PRMT51 | Arginine N-methyltransferase-5 | NM_006109.5 | F: ctagaccgagtaccagaagagg R: cagcatacagctttatccgccg | 136 |
| DDAH11 | Dimethylarginine dimethylaminohydrolase-1 | NM_012137.4 | F: atgcagtctccacagtgccagt R: ttgtcgtagcggtggtcactca | 151 |
| DDAH21 | Dimethylarginine dimethylaminohydrolase-2 | NM_001303007.2 | F: ctttcttcgtcctgggttgcct R: ctccagttctgagcaggacaca | 136 |
| GAPDH2 | Glyceraldehyde-3-phosphate dehydrogenase | NM_001256799.3 | F: tagattattctctgatttggtcgtattgg R: gctcctggaagatggtgatgg | 223 |
© 2020 by the authors. Licensee MDPI, Basel, Switzerland. This article is an open access article distributed under the terms and conditions of the Creative Commons Attribution (CC BY) license (http://creativecommons.org/licenses/by/4.0/).
Share and Cite
Krzystek-Korpacka, M.; Szczęśniak-Sięga, B.; Szczuka, I.; Fortuna, P.; Zawadzki, M.; Kubiak, A.; Mierzchała-Pasierb, M.; Fleszar, M.G.; Lewandowski, Ł.; Serek, P.; et al. L-Arginine/Nitric Oxide Pathway Is Altered in Colorectal Cancer and Can Be Modulated by Novel Derivatives from Oxicam Class of Non-Steroidal Anti-Inflammatory Drugs. Cancers 2020, 12, 2594. https://doi.org/10.3390/cancers12092594
Krzystek-Korpacka M, Szczęśniak-Sięga B, Szczuka I, Fortuna P, Zawadzki M, Kubiak A, Mierzchała-Pasierb M, Fleszar MG, Lewandowski Ł, Serek P, et al. L-Arginine/Nitric Oxide Pathway Is Altered in Colorectal Cancer and Can Be Modulated by Novel Derivatives from Oxicam Class of Non-Steroidal Anti-Inflammatory Drugs. Cancers. 2020; 12(9):2594. https://doi.org/10.3390/cancers12092594
Chicago/Turabian StyleKrzystek-Korpacka, Małgorzata, Berenika Szczęśniak-Sięga, Izabela Szczuka, Paulina Fortuna, Marek Zawadzki, Agnieszka Kubiak, Magdalena Mierzchała-Pasierb, Mariusz G. Fleszar, Łukasz Lewandowski, Paweł Serek, and et al. 2020. "L-Arginine/Nitric Oxide Pathway Is Altered in Colorectal Cancer and Can Be Modulated by Novel Derivatives from Oxicam Class of Non-Steroidal Anti-Inflammatory Drugs" Cancers 12, no. 9: 2594. https://doi.org/10.3390/cancers12092594