Quantifying PD-L1 Expression to Monitor Immune Checkpoint Therapy: Opportunities and Challenges


1
The Russell H. Morgan Department of Radiology and Radiological Science, Johns Hopkins University School of Medicine, Baltimore, MD 21287, USA
2
Division of Clinical Pharmacology, Department of Medicine, Johns Hopkins University School of Medicine, Baltimore, MD 21287, USA
3
Department of Pharmacology and Molecular Science, Johns Hopkins University School of Medicine, Baltimore, MD 21205, USA
4
Bloomberg–Kimmel Institute for Cancer Immunotherapy, Johns Hopkins University School of Medicine, Baltimore, MD 21287, USA
5
The Sidney Kimmel Comprehensive Cancer Center, Johns Hopkins University School of Medicine, Baltimore, MD 21287, USA
Cancers 2020, 12(11), 3173; https://doi.org/10.3390/cancers12113173
Submission received: 14 September 2020
/
Accepted: 19 October 2020
/
Published: 29 October 2020
(This article belongs to the Special Issue Cancer Molecular Imaging)
Abstract
:Simple Summary
Malignant cells hijack the regulatory roles of immune checkpoint proteins for immune evasion and survival. Therapeutics blocking those proteins can restore the balance of the immune system and lead to durable responses in cancer patients. Although a subset of patients derive benefit, there are few non-invasive technologies to guide and monitor those therapies to improve success rates. This is a review of the advancements in non-invasive methods for quantification of immune checkpoint protein programmed death ligand 1 expression, a biomarker detected by immunohistochemistry and widely used for guiding immune checkpoint therapy.
Abstract
Therapeutics targeting programmed death ligand 1 (PD-L1) protein and its receptor PD-1 are now dominant players in restoring anti-tumor immune responses. PD-L1 detection by immunohistochemistry (IHC) is emerging as a reproducible biomarker for guiding patient stratification for those therapies in some cancers. However, PD-L1 expression in the tumor microenvironment is highly complex. It is upregulated by aberrant genetic alterations, and is highly regulated at the transcriptional, posttranscriptional, and protein levels. Thus, PD-L1 IHC is inadequate to fully understand the relevance of PD-L1 levels in the whole body and their dynamics to improve therapeutic outcomes. Imaging technologies could potentially assist in meeting that need. Early clinical investigations show promising results in quantifying PD-L1 expression in the whole body by positron emission tomography (PET). Within this context, this review summarizes advancements in regulation of PD-L1 expression and imaging agents, and in PD-L1 PET for drug development, and discusses opportunities and challenges presented by these innovations for guiding immune checkpoint therapy (ICT).
1. Introduction
Tumors evolve to foster an immunosuppressive microenvironment and evade the immune system’s innate ability to recognize and eliminate malignant cells. To induce immunosuppression, tumors co-opt immune checkpoint proteins that otherwise regulate central and peripheral tolerance [1]. Monoclonal antibody (mAb) therapeutics that inhibit those immune checkpoints have resulted in impressive clinical success in a variety of cancers with durable survival rates [2]. However, most patients receiving ICT do not derive long-term benefits [3], necessitating the development of tools and techniques to better understand the immune effects of therapy [3].
PD-L1 and its receptor PD-1 have emerged as key cancer therapeutic targets amongst the many immune checkpoints that regulate host immunity [1]. PD-1 is an inhibitory receptor that is rapidly induced on naïve T cells to counteract T cell activation. PD-1 plays important roles in regulating T cell activation, tolerance, and exhaustion, and effector T cell responses [4]. PD-1 is expressed by several immune cell subtypes, including CD4+ and CD8+ T cells, regulatory T cells, B cells, and natural killer (NK) cells. PD-1 mediates regulatory functions through interaction with two ligands, PD-L1 and PD-L2. Many types of immune cells express PD-L1, including T cells, B cells, macrophages, dendritic cells (DCs), epithelial cells, stromal cells, endothelial cells, and tumor cells [4]. PD-L2 possesses high affinity for PD-1, and is expressed by DCs, macrophages, B cells, Th2 cells, and some lung epithelial cells. The interaction between PD-1 and its ligands leads to immunological ignorance in normal tissues and tumors. PD-1 ligands are induced in tissues or on tumor cells by proinflammatory stimuli. Those ligands then dampen PD-1 expressing effector T cell responses via a negative feedback mechanism, promote “adaptive immune resistance,” and protect tumors from immune attack [5]. PD-1 engagement with its ligands leads to diminished downstream signaling mediated through PI3K-AKT and Ras-MEK-ERK pathways, mitigation of T cell activation, and reduced killing capacity [3]. The observation that the majority of PD-1 activity is mediated through the widely expressed PD-L1 has led to the development of therapeutics targeting the PD(L)-1 axis, including multiple agents receiving FDA approval [3,6,7].
Three PD-1 (nivolumab, pembrolizumab, and tremelimumab) and three PD-L1 (atezolizumab, avelumab, and durvalumab) targeting monoclonal antibody (mAb) therapeutics have been approved as monotherapies or as therapies in combination with other immune checkpoint inhibitors, chemotherapeutics, or radiation. Comprehensive analyses of the clinical evaluation, therapeutic outcomes, pharmacokinetics (PK), and pharmacodynamic (PD) relationships of those antibodies have been extensively reviewed [6,7,8]. Given the success of those therapeutics, many candidate drugs and therapy combinations, in different development stages, are in need of robust biomarkers for therapy response assessment [9]. Although PD-L1 IHC is an FDA approved biomarker and remains the backbone of ICT development [3,8] significant efforts have also been made in identifying other biomarkers for response assessment [10,11,12]. Here, emphasis is placed on assessing the role of non-invasive quantification of PD-L1 levels in guiding future ICT development.
2. Regulation of PD-L1 in the Tumor Microenvironment
PD-L1-directed resistance to ICT is regulated by two general mechanisms [13]. In the tumor microenvironment (TME), innate immune resistance is driven by constitutively expressed PD-L1 on tumor cells that is mediated by genetic alterations (gene amplification [14], translocations [15], and disruption of 3′ UTR region [16]), aberrant oncogenic signaling, and hypoxia through hypoxia-inducible factor-1α [17]. PD-L1 expression in the TME is induced by activation of different oncogenic signaling pathways: in T cell lymphoma by ALK/STAT3 axis [18], in classical Hodgkin lymphoma by AP-1/JAK/STAT [19], in non-small-cell lung cancer (NSCLC) by EGFR [20], in BRAF inhibitor-resistant melanoma by c-jun/STAT3 [21], and in glioma by PI3K [22] to name a few. Myc, an oncogene that is aberrantly upregulated in a variety of cancers and tumorigenic [23], also mediates innate and adaptive immune resistance through the gene encoding for PD-L1 protein [24]. Major regulators of PD-L1 are summarized in Table 1 and were comprehensively reviewed by others [25].
PD-L1 expression is also induced in response to inflammatory stimuli on tumor cells, stromal cells, endothelial cells, T cells, APCs, and myeloid cells, and promotes adaptive immune resistance [26,27,28,29]. While tumor cell-derived PD-L1 is established as a requirement for neutralizing T-cell activity, recent studies suggest that host-derived immune cell PD-L1 is also essential for the PD(L)-1 blockade-mediated response [30,31,32]. It is possible that inherent immunogenicity of tumors could determine the relative contributions of these compartments in defining anti-tumor responses. Further studies are needed to delineate the relative contributions of tumor and host derived PD-L1 to anti-tumor immunity. Inflammatory signaling also regulates PD-L1 levels in the TME [27]. The predominant cytokine involved in upregulation of PD-L1 is IFNγ, which is secreted by immune cells homed to the TME during an antitumor immune response [5,29]. IFN-γ-induced surface PD-L1 is regulated by JAK 1 and 2 [33], STAT1, and STAT3, and the downstream transcription factor IRF1 [28]. Several cytokines, including IL-1α, IL-2, IL-7, IL-10, IL-21 IL-27, IL-32-γ, TNFα, and VEGF are inducers of PD-L1 expression on immune and tumor cells in the TME [5,34,35]. Proteins of several human endogenous retroviruses, including Epstein–Barr, hepatitis B, hepatitis C, human papillomavirus, and Merkel cell polyomavirus, are sources of inflamed tumors and high PD-L1 expression [36,37,38]. Chemotherapy and radiotherapy also influence PD-L1 expression in the TME [39,40]. Chemotherapeutics such as oxaliplatin, cyclophosphamide, doxorubicin, and paclitaxel have been shown to exert immunomodulatory functions through enhancement of antigen presentation or inhibition of immune suppressive mechanisms, thereby creating an inflammatory environment that can be invigorated by ICT [39]. Similarly, radiation induced cell death is followed by increased antigen presentation, IFN-γ response, and pro-inflammatory chemokine production that facilitate increased T cell trafficking to the tumors [41]. The immunostimulatory effects of radiotherapy lead to increased PD-L1 expression in the tumors that could synergize with ICT and develop as a systemic antitumor immunity [42,43].
PD-L1 is also regulated epigenetically at the mRNA levels by microRNAs (miRNAs). The observation that PD-L1 mRNA is readily detectable in many cell types but not at the protein level led to investigations on the role of miRNAs in regulating PD-L1 expression [29,44]. miRNAs are non-coding single stranded RNAs of 22–24 nucleotide length, which regulate gene expression either by inducing target mRNA degradation or by inhibiting translation. Nearly 20 miRNAs are known to regulate PD-L1 expression in several cancers, including NSCLC, pancreatic cancer, acute myeloid leukemia (AML), and colorectal cancer (CRC) [45]. Several miRNAs, including miR-513, miR-155, miR-570, miR-34a, and miR-200, have been described as suppressors of PD-L1 expression by direct binding to the 3′ UTR of PD-L1 mRNA [45]. Other miRNAs, including miR-20, miR-21, miR-130b, have been shown to repress PTEN causing increased PD-L1 expression [45].
The abundance and stability of PD-L1 expression on cancer cells are also stringently regulated by ubiquitination, N-glycosylation, and palmitoylation. Multiple studies have shown the role of cyclin D–CDK4 axis in the regulation of immune evasion mechanism by cancers and have established a link between cell cycle and immune evasion [46,47,48]. The cell cycle kinase CDK4 regulates PD-L1 expression via proteasome mediated degradation. Increased CDK4 expression is also associated with an inherent resistance program to anti PD-1 therapies that is driven by overexpression of IFN, Myc, and CDK4 signaling that leads to immune cell exclusion from the TME. When given alone, CDK4 inhibitors increase PD-L1 levels, reduce immune cell accumulation in tumors, and show synergism when given in combination with anti-PD-1 therapy. Furthermore, CDK4 inhibitors also enable the recruitment of NK cells to the tumors when given in combination with MEK inhibitor [48]. Another kinase, glycogen synthase kinase 3 beta (GSK3β), was shown to interact with PD-L1 and induce phosphorylation-dependent proteasomal degradation. That degradation can be antagonized by asparagine glycosylation (N192, N200, and N219) on PD-L1 [49]. In contrast, growth factors such as EGF are known to induce and stabilize PD-L1 in cells via GSK3β inactivation [49]. Supporting those in vitro observations, a strong correlation between phospho-EGFR and PD-L1 expression was observed, indicating that activation of EGFR contributes to an immunosuppressive TME by stabilizing PD-L1 expression [20,50,51]. Confirming those findings, EGFR inhibition by gefitinib leads to improved responses to antiPD-1 therapy by destabilizing PD-L1 [52]. Other cytokines, such as TNFα, that often play a major role in chronic inflammation also trigger immune escape from T-cell surveillance. However, while TNFα was shown to upregulate PD-L1 expression, TNFα induced miR155 was shown to suppress PD-L1 in human dermal lymphatic endothelial cells [53]. In cancer cells, PD-L1 stabilization is driven by TNF-1/p65/Cop9 signalosome 5 axis via deubiquitination activity of CSN5 [54]. CSN5 is an oncogenic protein that is essential for cell survival and plays a key role in adaptive immunity [55].
Protein pool and cell surface expression of PD-L1 are also regulated without changes in transcription levels. Two closely related members of the CKLF like MARVEL transmembrane domain containing proteins (CMTM4/6) contribute to increased PD-L1 protein levels [56,57]. CMTM6 co-localizes with PD-L1 on the plasma membrane, and binds and stabilizes PD-L1 at the cell-surface and in recycling endosomes, thereby protecting PD-L1 from lysosomal mediated degradation. CMTM6 also increases PD-L1 half-life by reducing ubiquitination [57]. Supporting the importance of surface stabilized PD-L1 levels in immune evasion, longer overall survival was seen in patients receiving ICT with high co-expression of CMTM6 and PD-L1 in stromal and immune cells (macrophages), but not tumor cells [57]. Another post-translational mechanism that regulates membranous expression of PD-L1 is lipid modification. Many of the protein functions involved with membrane association such as protein trafficking, activity, stability, and protein–protein interactions are controlled by palmitoylation, a reversible lipid modification process that involves the attachment of a 16-carbon fatty acid palmitate to proteins. In the case of PD-L1, palmitoylation occurs at Cys272 and blocks the ubiquitination required for PD-L1 degradation in the lysosomes [58]. As a consequence, palmitoylation increases the membranous half-life of PD-L1 and has been shown to promote breast tumor growth [59]. Blocking palmitoylation decreases interaction of PD-L1 with PD-1 and results in enhanced tumor immunity [58]. It is not known how those dynamic changes in PD-L1 expression influence tumor response to approved therapeutics. Thus, there is a pressing need to develop new approaches for non-invasive quantification of PD-L1 dynamics in real-time.
Similarly to PD-L1, PD-L2 is induced on tumor and immune cells upon exposure to IFN-γ. However, PD-L1 and PD-L2 are differentially regulated [28]. PD-L2 is mostly induced by IL-4 and GM-CSF in addition to IFNα and IFNβ with STAT3 and IRF1 transcription factors [28,60]. The differential regulation of PD-L1 and PD-L2 by cytokine signals indicates potential for molecular targeting and modulation of signaling pathways specific to either PD-L1 or PD-L2 in the context of cancer treatment, autoimmunity, or transplant tolerance. Detailed understanding of the signaling pathways used by cancer cells to counter the antitumor immune response could lead to development of improved prognostic markers that could be integrated with imaging studies.
3. PD-L1 IHC as a Biomarker for Guiding ICT
Molecular profiling and therapeutic selection centered on tumor-based biomarkers have transformed in delineating who should (or should not) receive a given therapy, resulting in an improvement of therapeutic outcomes in several cancers [65]. However, biomarker-based stratification has not been so straight forward for delivering ICT [66,67]. PD-L1 IHC is the most widely used biomarker for selecting patients to ICT [68,69]. Companion PD-L1 testing is approved for bladder, breast, cervical, gastric/gastroesophageal cancers, and NSCLC, and has proven useful in predicting the response in NSCLC with promising data emerging in bladder and gastric/gastroesophageal cancers [70,71,72,73,74,75,76,77,78,79,80,81,82,83,84,85]. Across those approvals, PD-L1 IHC is predictive of response in ≈29% of cases and not predictive in nearly 53% of cases [86]. Currently, it is unclear whether this is mostly due to artifacts related to IHC and tissue sampling or under-appreciated PD-L1 biology.
To define a PD-L1 positive or negative TME, tumors are broadly categorized into four types based on PD-L1 expression on the tumor cells and the presence of tumor infiltrating lymphocytes [87]: (1) PD-L1 positive and T cell positive; (2) PD-L1 negative and T cell negative; (3) PD-L1 positive and T cell negative; (4) PD-L1 negative and T cell positive. Earlier work in the evaluation of antiPD-1 therapeutics has focused on using PD-L1 expression as a biomarker to guide patient stratification based on the notion that those therapeutics block the interaction between immune cell PD-1 and tumor/immune cell PD-L1 [75,88,89]. Thus, the percentage of PD-L1 positive tumor or immune cells detected in the TME by IHC is termed as PD-L1 tumor proportion score (TPS) or immune proportion score (IPS), respectively [86]. Early clinical evaluation of nivolumab in solid tumors showed an improved overall survival in patients with high intratumoral PD-L1 expression [90]. In the KEYNOTE-001 clinical trial, TPS was the most robust biomarker associated with long-term survival with ≥50%TPS patients showing the most 5-year overall survival (OS) (29.6%) in advanced NSCLC patients treated with single-agent antiPD-1 therapeutic pembrolizumab [75]. Those findings led to FDA approval of PD-L1 detection by IHC as a companion diagnostic for receiving pembrolizumab [91]. Current evidence indicates that PD-L1 levels in the TME correlate with the magnitude of efficacy in NSCLC, although that association is not absolute [76,77,92,93]. In other cancers including Merkel cell carcinoma and triple negative breast cancer (TNBC), a correlation between response rate and IPS but not TPS was observed [86]. In few others, including cervical cancer, the combined positive score of PD-L1 (CPS) that accounts for TPS and IPS has been used to define PD-L1 positivity. That large variability in PD-L1 expression cutoffs, and the types of cells tested for PD-L1 expression, present significant challenges for PD-L1 IHC use in clinical practice [76,77,92,93].
The caveat of the PD-L1-based stratification is that not all the patients testing positive for PD-L1 respond. In addition to the technical aspects that are discussed in the following section, several biological factors also contribute to those differences. While PD-L1 levels in type 1 TME described earlier are driven by adaptive immune resistance, constitutive PD-L1 levels in type III tumors such as in NSCLC are driven by genetic alterations. Those PD-L1 positive tumors develop immune resistance to therapy through multiple mechanisms, including immunoediting, increased metabolism, and release of suppressive interluekins [94]. Some PD-L1 positive tumor types, as illustrated in the case of multiple myeloma (MM), also do not respond to ICT [95]. MM is a hematological malignancy of terminally differentiated plasma cells in the bone marrow [96]. PD-L1 is highly expressed in plasma cells of MM patients and associated with disease progression, as a further increase is observed in refractory and relapsed patients [95,97]. However, clinical evidence indicates that single agent anti-PD1 therapy is ineffective in MM [95]. Recent reports suggest that intrinsic heterogeneity of MM tumors, clonal expansion of tumor reactive PD-1low T cells with a senescent phenotype, and expression of multiple immune checkpoint molecules in the TME could be some of the factors contributing to poor response [95].
Another caveat of PD-L1-based stratification is that some patients who tested negative for PD-L1 responded. Type II tumors often do not respond to PD(L)-1 therapeutics, as they are devoid of tumor intrinsic PD-L1 expression and adaptive immune resistance due to lack of T cells. However, it is conceivable that a PD-L1 negative state can be reversed by combination therapies that direct T cell accumulation in the tumors. Additionally, tumors with high mutational burden (TMB), virus driven cancers such as Merkel cell carcinoma (MCC), and tumor types with increased abundances of neoantigens—in the case of RCC, are highly immunogenic and known to respond to ICT in spite of PD-L1 negative status [80,98,99,100]. In some PD-L1 negative tumors, PD-L1 is induced on NK cells by the tumors via AKT signaling that can be activated by PD-L1 mAbs to control tumor growth [101]. Collectively, preclinical and clinical data suggest that understanding the relevance and regulation of PD-L1 in a particular tumor type is important for enhancing the utility of IHC and imaging assays.
Emerging data show that two highly used biomarkers, TMB and PD-L1, have non-overlapping effects on response to PD(L)-1 therapeutics and can be used as independent biomarkers for guiding ICT [83]. However, more recent studies in bladder cancer indicate an interplay between TMB and tumor PD-L1 levels, suggesting a need for deeper understanding of relationship between TMB and tumor PD-L1 levels. In the PURE-01 clinical trial in bladder cancer patients, a pathologic complete response in tumors with high TMB was closely associated with higher CPS, but no such association between response and CPS was observed in tumors with low TMB. Those observations lead to the development of a composite biomarker-based calculator that incorporates TMB and PD-L1 levels for guiding therapy [73]. Similar application-based approaches could enable the integration of imaging data for ICT response assessment.
In spite of clinical utility, several limitations associated with early PD-L1 diagnostic assays have contributed to challenges in equivalent interpretation of data across cancers and therapeutics [102]. Four IHC assays have now been approved by the FDA as a companion and complementary diagnostic for delivering PD-1 and PD-L1 therapeutics, and a fifth IHC assay is under development [103]. The following issues have to some extent compromised the accuracy and reliability of early IHC assays: Different mAb clones (22C3, 28-8, SP263, SP142, and 73-10), and different detection systems and technologies have been used for the assays, posing a challenge to the clinical application of these tests for therapeutic decision making. Three assays used TPS only, and the fourth assay used both TPS and IPS to stratify patients for therapy, thereby creating a scoring approach that is unique for each test and the drug. The pre-treatment or archival tumor tissue samples used to assess PD-L1 status may or may not have represented the tumor immune status at the start of the treatment. Small single biopsies or pleural effusions used for IHC assays represent a small fraction of the tumor, and are not reflective of the inter- and intra-tumoral heterogeneity. Alternative definitions of TPS cut off used for patient selection, ranging from ≥1% to ≥50%, inevitably lead to differences in clinical status classification and data interpretation [103,104,105]. To bring reproducibility in the application of PD-L1 tests, the blueprint project has performed analytical comparisons between the five mAbs used for IHC. Results of the project brought a consensus that 22C3, 28-8, and SP263 tests have sufficient analytical evidence for interchangeability, and the 73-10 assay has greater sensitivity than the other four tests [104,105]. However, many questions pertaining to the heterogeneity and PD-L1 dynamics remain unanswered and would benefit from the availability of non-invasive imaging.
It is not uncommon to observe heterogeneity in PD-L1 levels, both within and across lesions collected over time and/or from different anatomical sites in a single patient [106,107,108]. The observation that degree of PD-L1 positivity in one lesion does not predict the degree of positivity in another lesion, as in the case of NSCLCs, has significant therapeutic implications [107,109], and underscores the need for new methods for quantifying PD-L1 levels. Additionally, the location of the lesion is an important component associated with the immune response or lack thereof [110]. In urothelial cancers, NSCLCs, and melanomas, tumors that metastasize to the liver often result in poor prognosis and those that metastasize to lymph nodes demonstrate improved response rates [92,111,112]. Those results suggest that deeper understanding of tissue-specific immunoregulation is essential to developing effective immunotherapies tailored to tissue microenvironment [113]. Availability of highly specific high image contrast affording PET imaging agents that can quantify PD-L1 levels in the majority of the tissues and integrated into clinical workflow could assist in those endeavors.
Biopsy samples are often limited and needed for molecular tests that may confer sensitivity or resistance to other therapies. These issues are further compounded in cancers such as NSCLC and pancreatic cancers, which are difficult to obtain biopsies for and have patients with advanced stages of disease. For example, NSCLC tissue samples are needed for molecular tests for EGFR, ALK, and DNA repair genes that may confer sensitivity or resistance to other therapies, or for assessing tumor mutational burden (TMB) [114]. Furthermore, treatment options are impacted by PD-L1 expression levels in the first-line setting for NSCLC patients lacking targetable genomic alterations [114]. For those patients with multiple treatment options, treatment sequencing may be prioritized based on PD-L1 expression quantified by PET. For instance, patients with PD-L1 positive tumors might be advised to receive antiPD(L)-1 as first-line therapy, whereas patients with PD-L1 negative tumors could receive it as second-or later-line therapy [115,116,117,118]. Access to PD-L1 PET would enable a multiple biomarker strategy and better use of biopsies.
4. PD-L1 Imaging Agents
4.1. Monoclonal Antibodies and Small Proteins
When suitable radiotracers are available, use of nuclear imaging techniques, such as PET and single photon emission computed tomography (SPECT), is an advantageous strategy for non-invasive quantification of proteins and biochemical processes in vivo. PET has been found very effective for repeated measurements of target expression in tumors [119], predicting responses to therapy and progression-free survival, and aiding in drug development and evaluation [120,121]. To address the need to quantify PD-L1 levels non-invasively, an array of imaging agents, including mAbs [122,123,124,125,126,127,128,129], mAb fragments [130,131,132], a small protein [133], and peptides [134,135], have been developed and investigated in preclinical models. A few of those agents are in early clinical investigations and have shown promising results.
The majority of the reported studies have taken advantage of the high specificity, affinity, and ready availability of mAbs targeting PD-L1. The accessible ε-amino groups of lysine residues of mAbs are amenable to modification with various bifunctional chelators. Those mAb conjugates are then chelated with radiometals with long halve-lives that match the pharmacokinetics of antibodies. 89Zr (t1/2, 3.27 d) and 111In (t1/2, 2.8 d) are two of the most commonly used radionuclides for PET and SPECT imaging respectively. Another radionuclide, 64Cu (t1/2, 12.7 h) is also becoming a radiolabel of choice for antibodies [136]. The challenge posed by the short half-life of 64Cu is to some extent offset by the sensitivity and resolution afforded by PET. Direct radiolabeling of antibodies is also accomplished using radiohalogenation of tyrosine with PET radionuclide I-124 or SPECT radionuclides I-123/125.
A diverse selection of mouse (mPD-L1) [126,127,137] or human PD-L1 reactive (hPD-L1) [122,123,128,129,136,138,139,140,141,142] mAbs have been investigated for their potential to detect PD-L1 levels in vivo. Most of those studies were conducted in immune compromised mice with human tumor xenografts, or in immunocompetent mice with syngeneic tumors. Studies by Heskamp et al. demonstrated the feasibility of imaging PD-L1 levels in vivo using an anti-hPD-L1 mAb labeled with 111In [129]. SPECT imaging and biodistribution studies showed high uptake and retention of [111In]mAb in human breast cancer xenografts with high PD-L1 expression but not in tumors with low PD-L1 expression. In early evaluations of a target or imaging agent experiments, using knockout mouse models provides a unique advantage for delineating the target uptake specificity. Evaluation of 64Cu-labeled anti-mPD-L1 mAb in wild type and PD-L1 deficient mice offered insights into the PD-L1 levels in the whole body. High uptake of radioactivity seen in lungs of WT type but not in PD-L1 deficient mice could perhaps explain the lung related toxicities associated with ICT and the role PD(L)-1 axis plays in restraining immune responses in the lung [127]. A significant reduction in uptake was also seen in secondary lymphoid organs (spleen and lymph nodes), known for physiological expression of PD-L1, in PD-L1 deficient mice [127]. Those observations indicate the opportunities for the use of PET to evaluate changes PD-L1 levels in tissues that play an essential role in immune priming.
Almost all newly developed therapeutic mAbs are humanized or fully human mAbs. Evaluations of radiolabeled versions of these agents in vivo using imaging provides unique insights into the PK and PD of the corresponding therapeutic agents. To characterize those PK/PD changes, we investigated [111In] labeled atezolizumab ([111In]atezolizumab) [128]. Atezolizumab is a PD-L1 mAb that is approved to treat NSCLC, RCC, and Head and neck squamous cell carcinoma (HNSCC). [111In]atezolizumab uptake in multiple human tumor xenografts reflected the graded levels of PD-L1 expression characterized ex vivo by IHC. In those studies, increased protein dose resulted in increased accumulation of [111In]atezolizumab in the tumors and reduced uptake in non-specific tissues [128]. Although low doses of mAbs are often used in imaging studies, dose-dependent tumor accumulation is not uncommon with mAbs, particularly when the target is internalized. At a low protein dose, low target binding and accumulation can be observed in the tumor due to non-target-specific and nontumor but target-specific uptake of mAb in other tissues that could drastically reduce serum mAb concentration and target-specific tumor accumulation. This phenomenon is termed targeted-mediated drug disposition (TMDD) [143,144]. Nonspecific binding sites are saturated when higher mAb doses are used, resulting in higher systemic exposure and increased binding to the target in the tumors. Studies with atezolizumab chimera have also shown that increased mAb dose could facilitate deeper penetration of the mAb into the tumors [138]. These studies support identifying an optimal protein dose required to maintain mAb pharmacokinetics to achieve high contrast images.
Immune system targets pose unique challenges for in vivo evaluation. Cancer research relies on preclinical models for drug development; however, immune biology of human cancers is not always well reflected in the routinely used syngeneic mouse tumor models. Therapeutics developed to bind human PD-L1 for clinical translation do not always possess cross-reactivity with murine PD-L1. That lack of cross reactivity constrains drug candidate evaluation in immunocompetent mouse models to assess immune system induced changes in the tumor. Thus, mAbs with cross reactivity to both mouse and human orthologs can provide unique insights into mAb distribution in vivo and a bridge between preclinical and clinical studies and observations. The advantage of using such agents with human and mouse cross reactivity was reflected in radiolabeled atezolizumab and avelumab biodistribution in vivo [122,125,128,145]. Atezolizumab and avelumab bind both human and mouse PD-L1, although with differences in affinity. Increased accumulation of radiolabeled atezolizumab was observed in brown adipose tissue (BAT) in mouse models [128], a novel finding that has also been observed with anti-mouse PD-L1 mAbs but not with anti-hPD-L1 mAbs [127,128,129].
mAbs have proven to be a highly reliable resource for imaging agent development. However, their large sizes and longer half-lives require several days of washout to generate high contrast images. Hence, there is a significant interest in developing imaging agents with faster PKs that would provide high contrast images within few hours post-injection [146]. Several mAb fragments, including single domain antibodies (sdAb) [147,148], nanobodies [149], small proteins derived from adnectin [133], and PD-1 external domains [150], have been developed and investigated for their potential to detect graded levels of PD-L1 expression [150]. Most of those agents have demonstrated faster clearance and provided high contrast images within several hours of administration. For example, high contrast PD-L1 specific images can be obtained with the adnectin-derived PD-L1 imaging agent, 18F-BMS-986192, within 120 min of injection [133]. Notably, observations made using mAbs are also reproduced using these small proteins. PD-L1 PET imaging is also finding new uses in other diseases, like metabolic disorders. BAT is involved in metabolic and temperature maintenance, and the metabolic activity of BAT is often measured using 18F-FDG, a radiotracer for glucose metabolism. Studies using radiolabeled vHH domains have established that PD-L1 is expressed by BAT cells in murine models independent of metabolic state of BAT, providing a new way for non-invasive quantification of BAT activity [132].
4.2. Peptides and Low Molecular Weight Agents
mAbs and mAb fragments are less efficient than low molecular weight agents (LMWs), such as small-molecules and peptides for tissue penetration, tumor retention, and blood clearance, owing to their large size [151]. Therefore, our group has focused on LMWs that often have faster PK. High affinity peptide inhibitors of PD-L1 (<10 nM) were reported only within the last few years [152]. We selected a peptide, WL12 (Figure 1A), that is most suitable for conjugation and possessed a single primary amine from the reported peptide library [153]. Next, we assessed its binding mode to PD-L1 (PDB ID: 4ZQK) [154] by docking studies, wherein we superimposed WL12 with PD-1. Our model showed that WL12 forms a beta sheet-like structure, and binds in a similar mode to that of PD-1 (Figure 1B). Importantly, the primary amine of the 13Orn residue is exposed and does not participate in binding with PD-L1. That finding led us to develop a 64Cu-labeled DOTAGA conjugated peptide, [64Cu]WL12, which demonstrated high affinity (2.9 nM), and in vitro and in vivo specificity to PD-L1 in Chinese hamster ovary cell line stably expressing PD-L1 (hPD-L1) and in TNBC MDAMB231 cells with high PD-L1 expression, compared to controls (CHO and SUM149). [64Cu]WL12 also demonstrated specific uptake in PD-L1 positive tumors (Figure 1C,D), high tumor-to-muscle and tumor-to-blood ratios by 60 min, and the PD-L1 specific binding could be blocked by saturable concentrations of cold peptide [153]. Importantly, the high specificity and high contrast images provided by [64Cu]WL12-PET also enabled the quantification of dynamic changes in PD-L1 levels in the tumors, indicating potential to quantify therapy induced changes in PD-L1 levels. LMWs also offer synthetic tractability and are also easily amenable to structural changes to modulate the PK to meet the needs of imaging modality and application. WL12 labeled with 68Ga demonstrated increased clearance from non-specific tissues and provided images with improved contrast than the 64Cu-analog [135]. In contrast, replacing DOTAGA with 18F-fluoro nicotinic acid for radiolabeling with 18F reduced the hydrophilicity of the molecule. Although the [18F]WL12 showed PD-L1 specific uptake in tumors, the tumor-to-background ratios were low and higher radioactivity uptake was seen in non-specific tissues [134]. These studies exemplified the tractability of LMWs for modification to affect in vivo distribution to optimize the image contrast.
4.3. PD-L1 PET in Patients
Quantification of PD-L1 levels in patients was reported in three first-in-human studies using three distinct molecular entities (mAb, adnectin, and sdAb) [155,156,157] labeled with three different radionuclides (89Zr, 18F, and 99mTc). All three agents were found to be safe and effective and showed promise in detecting PD-L1 levels in vivo. In spite of the distinct nature of the imaging agents, a few common features in distribution among the radiotracers can be derived. High uptake in tumors, metastases, and secondary lymphoid organs, and heterogeneity in tumor uptake between and within patients were observed with all the three agents. Distribution in other tissues was different between radiotracers due to the nature of metabolism and clearance of different molecular entities. Collectively, these studies indicate that PD-L1 PET imaging can provide insights into PD-L1 levels and dynamics to guide clinical management for patients receiving ICT.
The feasibility of quantifying PD-L1 levels in the whole body by PET was demonstrated using 89Zr-labeled atezolizumab (Figure 2). Investigations of [89Zr]atezolizumab in patients with NSCLC, TNBC, and bladder cancers have captured the PD-L1 levels in all the lesions in entirety and the inter and intra-tumoral heterogeneity in PD-L1 expression. Differences in uptake were also observed between different cancer types, with bladder cancers showing the highest uptake of [89Zr]atezolizumab followed by NSCLC and TNBC. [89Zr]atezolizumab uptake was related to size change in target lesion and higher in patients who showed better responses, warranting further investigation. In the small number of patients investigated, it was not PD-L1 IHC or RNA-sequence-based predictive biomarkers but baseline standard uptake values (SUVmax) of [89Zr]atezolizumab that indicated a better outcome for patients. High [89Zr]atezolizumab uptake was observed in lymph nodes and the spleen, reflecting the physiological expression of PD-L1. High [89Zr]atezolizumab uptake in sites of inflammation was also noted, indicating the possibility for false positives and the necessity for cross-correlation of imaging findings with IHC. [89Zr]atezolizumab uptake was high in the liver, intestines, and kidneys, possibly reflecting the metabolism and clearance of mAbs.
Early studies with another PD-L1 imaging agent, 18F-BMS-986192, have also shown promising results in NSCLC patients [156] (Figure 3). 18F-BMS-986192 uptake in the NSCLC lesions was heterogeneous within and between patients and the median uptake (SUVpeak) was higher in patients with >50% TPS compared to patients <50% TPS. 18F-BMS-986192 uptake was also observed in spleen and lymphoid tissues, similarly to the other preclinical and clinical studies. In addition, non-specific uptake was observed in liver due to catabolism, and in kidneys and GI tract due renal and biliary clearance. The small size of 18F-BMS-986192 also facilitated image acquisition within 60–90 min.
An sdAb with a histidine tag, NM-01, was labeled with SPECT radionuclide 99mTc and investigated in NSCLC patients for safety, imaging characteristics, and dosimetry [157]. 99mTc-NM-01 uptake in NSCLC lesions could be clearly seen in SPECT images and showed heterogeneity in uptake within and between patients. A modest correlation was observed between PD-L1 immunoreactivity by IHC in biopsies and 99mTc-NM-01 uptake measured as tumor-to-blood pool activity ratio. While 99mTc is advantageous due to its long half-life and ready availability, the low spatial resolution (1.8 mm for PET vs. 10 mm for SPECT) and lack of quantitation with SPECT could pose challenges in quantifying the PD-L1 levels in small lesions and therapy induced PD-L1 dynamics.
5. PD-L1 PET for Non-Invasive Quantification of PD-L1 Dynamics
Beyond detecting PD-L1 expression in malignant and normal tissues, mAb-based PD-L1 PET has also been investigated to detect PD-L1 dynamics induced by chemotherapy and radiotherapy. Significantly higher uptake of 89Zr-radiolabed mAbs in human tumor xenografts reflected paclitaxel-induced PD-L1 expression [123]. Radiotherapy is also known to induce PD-L1 expression in the TME, primarily due to the increased accumulation of immune cells in response to radiation-induced inflammation. However, enhanced PD-L1 expression is not observed in every tumor. Thus, identifying those tumors with enhanced immune response to radiotherapy could improve the potential to harness those responses for tumor control by ICT. Increased PD-L1 expression was observed in tumors of mice receiving fractionated radiation doses. Studies using [89Zr]atezolizumab and other anti-mouse PD-L1 mAbs have demonstrated enhanced uptake in irradiated human tumor xenografts in immunocompromised mice and in syngeneic B16F10 melanoma tumors in immunocompetent mice [124,145]. These studies demonstrated the potential of radiolabeled mAbs to quantify radiotherapy induced changes for therapy guidance.
The rapid clearance and high sensitivity of small proteins have also allowed for quantification of molecular therapy induced changes in PD-L1 levels in tumors. MEK inhibitor treatment leads to downregulation of PD-L1 expression in tumors that could potentially be quantified using PET. Studies with [18F]BMS-986192 have demonstrated a significant reduction in imaging agent uptake reflecting the 50% down regulation in PD-L1 levels following treatment with MEK inhibitor selumetinib for 24 h [158]. Additionally, EGFR inhibitor induced changes in PD-L1 downregulation were quantified using 89Zr-Df-KN035, a nanobody derived radiotracer [159]. These preclinical observations have the potential to be validated in a clinical setting as the therapeutics used have been approved or are undergoing clinical investigation.
6. PD-L1 PET for Dose Optimization and Drug Development
To date, all approved PD-L1 drugs have been mAbs. Atezolizumab (non-glycosylated IgG1κ, t1/2 27 d) is approved for liver cancer [160], metastatic NSCLC [2], extensive stage small-cell lung cancer, metastatic TNBC [161] and advanced urothelial cancers [162]. Avelumab (IgG1λ, t1/2 6.1 d) is approved to treat metastatic Merkel-cell carcinoma [163] and advanced or metastatic urothelial carcinoma [164]. Durvalumab (IgG1κ, t1/2 17 d) is used to treat advanced or metastatic urothelial cancers [165] and unresectable stage-III NSCLC [166]. Concentrations and target engagement potential of these therapeutics at the tumor remain unknown and are influenced by PD-L1 levels. This is an area of investigation that could benefit from non-invasive technologies and better understanding of PD-L1 regulation. The therapeutic effect of those drugs is achieved through direct binding of the drug to the target. This binding often occurs at a functional site, and for PD-L1 therapeutics this is where PD-1 binds. Thus, efficacy of a PD-L1 mAb is critically dependent on the extent of its target engagement.
Unlike small molecule drugs, interactions of PD-L1 mAbs with the target often affect the PK of the mAb [143]. TMDD is common for mAb therapeutics directed against proteins expressed on cell membranes and receptor-mediated endocytosis results in drug elimination. PD-L1 internalization presents an important clearance pathway for PD-L1 antibodies. Therefore, modulation of PD-L1 by mAbs, other regulators, concomitant treatments, or disease progression can result in changes in the PK, and subsequently, the PD effects of the mAb. Occupancy data for PD-L1 therapeutics, reported in only a limited number of trials, are obtained using peripheral blood mononuclear cells (PBMCs) [167], and occupancy at the tumor is almost always predicted by in silico modeling. The technologies for real-time assessments of drug-target engagement in vivo are too few to incorporate real-time data into those models [168,169]. Often, an mAb disposition in vivo is obtained in preclinical and clinical studies using radiolabeled antibodies, such as atezolizumab. A limitation of using radiolabeled mAbs is that observations made are highly specific to the mAb under investigation, and depend on mAb properties such as valency, shape, size, isoelectric point, and dosage, each of which influences the mAb’s PK [155,170,171]. Additionally, radiolabeled-mAbs provide a cumulative measure of exposure at the tumor and target expression, and have low sensitivity to capture therapy induced changes in PD-L1 levels [1,172]. This is further complicated by the thousands of combination therapies that are being investigated with few technologies available to determine drug concentrations at the tumor and to evaluate their relevance to therapeutic outcomes [9].
In molecular modeling studies, we observed that WL12 interaction surface on PD-L1 overlapped with that of PD-1 and PD-L1 mAb interaction surfaces on PD-L1 [173] (Figure 1B). The low affinity of WL12 compared to antiPD-L1 mAbs (>2 nM vs. <2 nM) led us to postulate that peptide-based PET could be used to quantify accessible PD-L1 levels during treatment with a PD-L1 mAb. Such quantitative measurements can inform the target engagement potential of any mAb at the tumor. To test this, several PD-L1 expressing cancer cell lines were incubated with [64Cu]WL12 with and without antiPD-L1 mAbs. The bound radioactivity measurements showed significantly less cell bound [64Cu]WL12 in the presence of mAbs indicating fewer accessible PD-L1 levels [173]. We then tested if those observations could be reproduced in vivo. In NSCLC and TNBC human tumor xenograft-bearing mice treated with a saturating dose of all anti-PD-L1 mAbs (atezolizumab, avelumab, and durvalumab), a significantly reduced [64Cu]WL12 uptake was observed compared to saline treated controls (Figure 4). These results established that target engagement of any anti-PD-L1 mAb that inhibits PD-L1:PD-1 interaction can be quantified using [64Cu]WL12. Furthermore, these studies laid the foundations for defining the effect of mAb dose on target engagement in the tumor to define the dose required for saturating PD-L1 levels in the tumor [173]. Such measurements have the potential to guide future drug dosing and optimization and could become critical in identifying the dosage for novel class of mAb therapeutics such as probodies [174] and bispecific mAbs.
7. Future Considerations
Impressive clinical results seen over the last decade clearly established the role of the immune checkpoint blockade in restoring anti-tumor immunity. The durable and dynamic immunity observed does not benefit all the patients receiving those therapies. To further enhance those therapeutic outcomes, there is a growing interest in identifying on-treatment and post-treatment biomarkers, applicable to a variety of cancers, that could guide therapy. In addition to PD-L1 IHC, several other leads, including TMB, aberrant oncogenic signaling, and immune regulatory molecules, are also being investigated. PD-L1 IHC is arguably the most validated biomarker that is amenable for imaging agent development. Evaluation of PD-L1 levels by PD-L1-PET imaging is expected to provide a better understanding of response to ICT; however, several challenges need to be addressed. Specifically:
Imaging agents with better PK: All three agents in early clinical evaluations are proteins. In spite of the promising results seen, these molecular entities generally produce inferior contrast compared to peptides or small molecules. Additionally, the distribution of the evaluated imaging agents indicates non-specific uptake in liver, kidneys, and intestines that could further limit their applicability for malignancies originated in those tissues. Considering that PD-L1 density is a few hundred thousand ligands/cell, imaging agents with improved contrast and high target-to-background ratios are essential for successful and broader application of PD-L1 PET to guide ICT.
Specific activity of imaging agents: High specific activity is crucial for quantifying low density targets such as PD-L1. All the agents tested in clinical trials are biologicals and require a high protein dose to achieve optimal image contrast. The sizes of the molecules (>10 kDa size) also make it difficult to achieve separation of radiolabeled agents from non-radiolabeled precursors. These factors result in an effective specific activity of few hundred mCi/μmole for these agents. Such low specific activities could limit our ability to quantify changes in PD-L1 levels below a certain threshold and needs to be investigated. Those limitations can be addressed by peptides or small molecule-based agents that can be synthesized with high specific activities of several thousand mCi/μmole.
Time of PD-L1 PET sampling: Immune responses to ICT are unpredictable and vary by the type of tumor and individual immune fitness. Thus, the optimal time for imaging during on-treatment and post-treatment may need to be determined for each tumor type and may have an impact on defining PD-L1 signal cut-off for positivity.
PD-L1 expression as a continuous variable: It is becoming evident that differences in outcomes in some of the prior studies may be the result of imbalances in PD-L1 distribution during patient randomization rather than the treatment intervention [117]. A retrospective analysis of NSCLC clinical trial data indicated that PD-L1 levels need to be interpreted as a continuous variable instead of the a priori cut points now used to define PD-L1 high vs. low populations. Those lessons need to be incorporated into PET imaging measures for making treatment decisions.
Correlation of PET measures with CPS: In recent years, there has been a shift towards using CPS to correlate with response. PET measurements provide total PD-L1 levels in the tumors that cannot be separated into the contributions from TPS and IPS. CPS has shown promise in some cancers, including bladder and gastroesophageal cancers, although its relevance needs to be established for every tumor type. Total PD-L1 levels measured as CPS are more relevant than TPS and IPS to correlate with PET measures.
Integration of PET with genomic data: As discussed in the previous sections, PD-L1 is regulated at multiple levels and their contribution is difficult to discern. Thus, integration of PET data with serum or tissue-based biomarkers could assist in delineating the underlying biology and improve the diagnostic accuracy of PET measures.
Uptake in autoimmune and infectious diseases: The PD(L)-1 axis is central to regulating the auto-reactive T-cell responses and mediates tissue tolerance and immune-cell mediated damage during viral infections [175]. Elevated PD-L1 levels were observed on disease tissue cells in several autoimmune diseases, including IBD, Sjögren’s syndrome, and on activated T cells of rheumatoid arthritis patients [176,177,178]. Elevated PD-L1 levels were observed in the livers of patients with hepatitis C infections and in the splenic cells of patients with LCMV infections [178]. The importance of PD (L)-1 in dysregulated immune homeostasis and increased accumulation of [89Zr]atezolizumab in inflammatory lesions underscore that patterns of uptake in tissues not directly related to patients cancer need to be carefully considered during interpretation.
8. Conclusions
Recent first-in-human evaluations of PD-L1 imaging agents have brought molecularly targeted, non-invasive quantitative measures to guide and assess the immune response to ICT. Many challenges pertaining to interpretation and integration of PET data still need to be resolved. It is becoming clear that there is no “one biomarker fits all” approach for monitoring immunotherapy. Thus, a composite application/score that incorporates multiple biomarkers, including imaging data, will be highly valuable. Such novel approaches that incorporate adaptive components present burgeoning opportunities for timely treatment planning to achieve durable responses in cancer patients.
Funding
This research was funded by Allegheny Health Network-Johns Hopkins Cancer Research Fund (SN), National Institutes of Health: NIH 1R01CA236616 and NIH P41EB024495. This work was also supported by the Office of the Assistant Secretary of Defense for Health Affairs, through the Breast Cancer Research Program, under Award No. W81XWH-16-1-0323. Opinions, interpretations, conclusions and recommendations are those of the author and are not necessarily endorsed by the Department of Defense.
Acknowledgments
I would like to thank Marie-France Penet for critical reading of the manuscript.
Conflicts of Interest
S.N. is a co-inventor on a pending U.S. patent covering WL12 and as such is entitled to a portion of any licensing fees and royalties generated by this technology. This arrangement has been reviewed and approved by the Johns Hopkins University in accordance with its conflict-of-interest policies. S.N. owns equity in and serves as a consultant to Precision Molecular, Inc.
Abbreviations
| AKT/PKB | Protein kinase B |
| ALK | Anaplastic lymphoma kinase |
| AML | Acute myeloid leukemia |
| AP-1 | Activator Protein 1 |
| APCs | Antigen presenting cells |
| CDK4 | Cyclin-dependent kinase 4 |
| CMTM4/6 | CKLF like MARVEL transmembrane domain containing protein 4/6 |
| CRC | Colorectal cancer |
| CSN5 | Signalosome 5 |
| DCs | Dendritic cells |
| DOTAGA | 2,2′,2′′-(10-(2,6-dioxotetrahydro-2H-pyran-3-yl)-1,4,7,10-tetraazacyclododecane-1,4,7-triyl)triacetic acid |
| EGF | Epidermal growth factor |
| EGFR | Epidermal growth factor receptor |
| ERK | Extracellular signal-regulated kinase |
| GM-CSF | Granulocyte-macrophage colony-stimulating factor |
| GSK3β | Glycogen synthase kinase 3 beta |
| HNSCC | Head and neck squamous cell carcinoma |
| IBD | Inflammatory bowel disease |
| ICT | Immune checkpoint therapy |
| IFNγ | Interferon gamma |
| IHC | Immunohistochemistry |
| IL-x | Interleukin proteins |
| IRF1 | Interferon Regulatory Factor 1 |
| JAK | Janus kinase |
| LCMV | Lymphocytic choriomeningitis virus |
| mAb | Monoclonal antibody |
| MEK | Mitogen-activated protein kinase kinase |
| miR | MicroRNA |
| NKs | Natural killer cells |
| NSCLC | Non-small cell lung cancer |
| PD-1 | Programmed death 1 |
| PD-L1 | Programmed death ligand 1 |
| PD-L2 | Programmed death ligand 2 |
| PET | Positron emission tomography |
| PI3K | Phosphoinositide 3-kinase |
| RCC | Renal cell carcinoma |
| SPECT | Single photon emission computed tomography |
| STAT3 | Signal transducer and activator of transcription |
| TMDD | Target-mediated drug disposition |
| TME | Tumor microenvironment |
| TNBC | Triple negative breast cancer |
| TNFα | Tumor necrosis factor alpha |
| VEGF | Vascular endothelial growth factor |
References
- Topalian, S.L.; Drake, C.G.; Pardoll, D.M. Immune checkpoint blockade: A common denominator approach to cancer therapy. Cancer Cell 2015, 27, 450–461. [Google Scholar] [CrossRef] [PubMed] [Green Version]
- Topalian, S.L.; Hodi, F.S.; Brahmer, J.R.; Gettinger, S.N.; Smith, D.C.; McDermott, D.F.; Powderly, J.D.; Sosman, J.A.; Atkins, M.B.; Leming, P.D.; et al. Five-Year Survival and Correlates Among Patients with Advanced Melanoma, Renal Cell Carcinoma, or Non-Small Cell Lung Cancer Treated with Nivolumab. JAMA Oncol. 2019. [Google Scholar] [CrossRef] [PubMed] [Green Version]
- Nowicki, T.S.; Hu-Lieskovan, S.; Ribas, A. Mechanisms of Resistance to PD-1 and PD-L1 Blockade. Cancer J. 2018, 24, 47–53. [Google Scholar] [CrossRef] [PubMed]
- Okazaki, T.; Honjo, T. PD-1 and PD-1 ligands: From discovery to clinical application. Int. Immunol. 2007, 19, 813–824. [Google Scholar] [CrossRef] [Green Version]
- Taube, J.M.; Anders, R.A.; Young, G.D.; Xu, H.; Sharma, R.; McMiller, T.L.; Chen, S.; Klein, A.P.; Pardoll, D.M.; Topalian, S.L.; et al. Colocalization of inflammatory response with B7-h1 expression in human melanocytic lesions supports an adaptive resistance mechanism of immune escape. Sci. Transl. Med. 2012, 4, 127ra137. [Google Scholar] [CrossRef] [Green Version]
- Duan, J.; Cui, L.; Zhao, X.; Bai, H.; Cai, S.; Wang, G.; Zhao, Z.; Zhao, J.; Chen, S.; Song, J.; et al. Use of Immunotherapy with Programmed Cell Death 1 vs Programmed Cell Death Ligand 1 Inhibitors in Patients with Cancer: A Systematic Review and Meta-analysis. JAMA Oncol. 2019. [Google Scholar] [CrossRef]
- Ribas, A.; Wolchok, J.D. Cancer immunotherapy using checkpoint blockade. Science 2018, 359, 1350–1355. [Google Scholar] [CrossRef] [Green Version]
- Desnoyer, A.; Broutin, S.; Delahousse, J.; Maritaz, C.; Blondel, L.; Mir, O.; Chaput, N.; Paci, A. Pharmacokinetic/pharmacodynamic relationship of therapeutic monoclonal antibodies used in oncology: Part 2, immune checkpoint inhibitor antibodies. Eur. J. Cancer 2020, 128, 119–128. [Google Scholar] [CrossRef]
- Tang, J.; Yu, J.X.; Hubbard-Lucey, V.M.; Neftelinov, S.T.; Hodge, J.P.; Lin, Y. Trial watch: The clinical trial landscape for PD1/PDL1 immune checkpoint inhibitors. Nat. Rev. Drug Discov. 2018, 17, 854–855. [Google Scholar] [CrossRef]
- Nishino, M.; Ramaiya, N.H.; Hatabu, H.; Hodi, F.S. Monitoring immune-checkpoint blockade: Response evaluation and biomarker development. Nat. Rev. Clin. Oncol. 2017, 14, 655–668. [Google Scholar] [CrossRef]
- Havel, J.J.; Chowell, D.; Chan, T.A. The evolving landscape of biomarkers for checkpoint inhibitor immunotherapy. Nat. Rev. Cancer 2019, 19, 133–150. [Google Scholar] [CrossRef] [PubMed]
- van der Veen, E.L.; Bensch, F.; Glaudemans, A.; Lub-de Hooge, M.N.; de Vries, E.G.E. Molecular imaging to enlighten cancer immunotherapies and underlying involved processes. Cancer Treat. Rev. 2018, 70, 232–244. [Google Scholar] [CrossRef] [PubMed]
- Topalian, S.L.; Taube, J.M.; Anders, R.A.; Pardoll, D.M. Mechanism-driven biomarkers to guide immune checkpoint blockade in cancer therapy. Nat. Rev. Cancer 2016, 16, 275–287. [Google Scholar] [CrossRef]
- Green, M.R.; Monti, S.; Rodig, S.J.; Juszczynski, P.; Currie, T.; O’Donnell, E.; Chapuy, B.; Takeyama, K.; Neuberg, D.; Golub, T.R.; et al. Integrative analysis reveals selective 9p24.1 amplification, increased PD-1 ligand expression, and further induction via JAK2 in nodular sclerosing Hodgkin lymphoma and primary mediastinal large B-cell lymphoma. Blood 2010, 116, 3268–3277. [Google Scholar] [CrossRef] [Green Version]
- Twa, D.D.; Chan, F.C.; Ben-Neriah, S.; Woolcock, B.W.; Mottok, A.; Tan, K.L.; Slack, G.W.; Gunawardana, J.; Lim, R.S.; McPherson, A.W.; et al. Genomic rearrangements involving programmed death ligands are recurrent in primary mediastinal large B-cell lymphoma. Blood 2014, 123, 2062–2065. [Google Scholar] [CrossRef] [PubMed] [Green Version]
- Kataoka, K.; Shiraishi, Y.; Takeda, Y.; Sakata, S.; Matsumoto, M.; Nagano, S.; Maeda, T.; Nagata, Y.; Kitanaka, A.; Mizuno, S.; et al. Aberrant PD-L1 expression through 3’-UTR disruption in multiple cancers. Nature 2016, 534, 402–406. [Google Scholar] [CrossRef]
- Barsoum, I.B.; Smallwood, C.A.; Siemens, D.R.; Graham, C.H. A mechanism of hypoxia-mediated escape from adaptive immunity in cancer cells. Cancer Res. 2014, 74, 665–674. [Google Scholar] [CrossRef] [PubMed] [Green Version]
- Marzec, M.; Zhang, Q.; Goradia, A.; Raghunath, P.N.; Liu, X.; Paessler, M.; Wang, H.Y.; Wysocka, M.; Cheng, M.; Ruggeri, B.A.; et al. Oncogenic kinase NPM/ALK induces through STAT3 expression of immunosuppressive protein CD274 (PD-L1, B7-H1). Proc. Natl. Acad. Sci. USA 2008, 105, 20852–20857. [Google Scholar] [CrossRef] [Green Version]
- Green, M.R.; Rodig, S.; Juszczynski, P.; Ouyang, J.; Sinha, P.; O’Donnell, E.; Neuberg, D.; Shipp, M.A. Constitutive AP-1 activity and EBV infection induce PD-L1 in Hodgkin lymphomas and posttransplant lymphoproliferative disorders: Implications for targeted therapy. Clin. Cancer Res. 2012, 18, 1611–1618. [Google Scholar] [CrossRef] [Green Version]
- Akbay, E.A.; Koyama, S.; Carretero, J.; Altabef, A.; Tchaicha, J.H.; Christensen, C.L.; Mikse, O.R.; Cherniack, A.D.; Beauchamp, E.M.; Pugh, T.J.; et al. Activation of the PD-1 pathway contributes to immune escape in EGFR-driven lung tumors. Cancer Discov. 2013, 3, 1355–1363. [Google Scholar] [CrossRef] [Green Version]
- Jiang, X.; Zhou, J.; Giobbie-Hurder, A.; Wargo, J.; Hodi, F.S. The activation of MAPK in melanoma cells resistant to BRAF inhibition promotes PD-L1 expression that is reversible by MEK and PI3K inhibition. Clin. Cancer Res. 2013, 19, 598–609. [Google Scholar] [CrossRef] [PubMed] [Green Version]
- Crane, C.; Panner, A.; Pieper, R.O.; Arbiser, J.; Parsa, A.T. Honokiol-mediated inhibition of PI3K/mTOR pathway: A potential strategy to overcome immunoresistance in glioma, breast, and prostate carcinoma without impacting T cell function. J. Immunother. 2009, 32, 585–592. [Google Scholar] [CrossRef] [PubMed] [Green Version]
- Pelengaris, S.; Khan, M.; Evan, G. c-MYC: More than just a matter of life and death. Nat. Rev. Cancer 2002, 2, 764–776. [Google Scholar] [CrossRef]
- Casey, S.C.; Tong, L.; Li, Y.; Do, R.; Walz, S.; Fitzgerald, K.N.; Gouw, A.M.; Baylot, V.; Gutgemann, I.; Eilers, M.; et al. MYC regulates the antitumor immune response through CD47 and PD-L1. Science 2016, 352, 227–231. [Google Scholar] [CrossRef] [PubMed] [Green Version]
- Sun, C.; Mezzadra, R.; Schumacher, T.N. Regulation and Function of the PD-L1 Checkpoint. Immunity 2018, 48, 434–452. [Google Scholar] [CrossRef] [Green Version]
- Tumeh, P.C.; Harview, C.L.; Yearley, J.H.; Shintaku, I.P.; Taylor, E.J.; Robert, L.; Chmielowski, B.; Spasic, M.; Henry, G.; Ciobanu, V.; et al. PD-1 blockade induces responses by inhibiting adaptive immune resistance. Nature 2014, 515, 568–571. [Google Scholar] [CrossRef]
- Ribas, A. Adaptive Immune Resistance: How Cancer Protects from Immune Attack. Cancer Discov. 2015, 5, 915–919. [Google Scholar] [CrossRef] [Green Version]
- Garcia-Diaz, A.; Shin, D.S.; Moreno, B.H.; Saco, J.; Escuin-Ordinas, H.; Rodriguez, G.A.; Zaretsky, J.M.; Sun, L.; Hugo, W.; Wang, X.; et al. Interferon Receptor Signaling Pathways Regulating PD-L1 and PD-L2 Expression. Cell Rep. 2017, 19, 1189–1201. [Google Scholar] [CrossRef] [Green Version]
- Dong, H.; Strome, S.E.; Salomao, D.R.; Tamura, H.; Hirano, F.; Flies, D.B.; Roche, P.C.; Lu, J.; Zhu, G.; Tamada, K.; et al. Tumor-associated B7-H1 promotes T-cell apoptosis: A potential mechanism of immune evasion. Nat. Med. 2002, 8, 793–800. [Google Scholar] [CrossRef]
- Lin, H.; Wei, S.; Hurt, E.M.; Green, M.D.; Zhao, L.; Vatan, L.; Szeliga, W.; Herbst, R.; Harms, P.W.; Fecher, L.A.; et al. Host expression of PD-L1 determines efficacy of PD-L1 pathway blockade-mediated tumor regression. J. Clin. Investig. 2018, 128, 805–815. [Google Scholar] [CrossRef] [Green Version]
- Tang, H.; Liang, Y.; Anders, R.A.; Taube, J.M.; Qiu, X.; Mulgaonkar, A.; Liu, X.; Harrington, S.M.; Guo, J.; Xin, Y.; et al. PD-L1 on host cells is essential for PD-L1 blockade-mediated tumor regression. J. Clin. Investig. 2018, 128, 580–588. [Google Scholar] [CrossRef] [PubMed] [Green Version]
- Juneja, V.R.; McGuire, K.A.; Manguso, R.T.; LaFleur, M.W.; Collins, N.; Haining, W.N.; Freeman, G.J.; Sharpe, A.H. PD-L1 on tumor cells is sufficient for immune evasion in immunogenic tumors and inhibits CD8 T cell cytotoxicity. J. Exp. Med. 2017, 214, 895–904. [Google Scholar] [CrossRef]
- Shin, D.S.; Zaretsky, J.M.; Escuin-Ordinas, H.; Garcia-Diaz, A.; Hu-Lieskovan, S.; Kalbasi, A.; Grasso, C.S.; Hugo, W.; Sandoval, S.; Torrejon, D.Y.; et al. Primary Resistance to PD-1 Blockade Mediated by JAK1/2 Mutations. Cancer Discov. 2017, 7, 188–201. [Google Scholar] [CrossRef] [Green Version]
- Taube, J.M.; Young, G.D.; McMiller, T.L.; Chen, S.; Salas, J.T.; Pritchard, T.S.; Xu, H.; Meeker, A.K.; Fan, J.; Cheadle, C.; et al. Differential Expression of Immune-Regulatory Genes Associated with PD-L1 Display in Melanoma: Implications for PD-1 Pathway Blockade. Clin. Cancer Res. 2015, 21, 3969–3976. [Google Scholar] [CrossRef] [Green Version]
- Duffield, A.S.; Ascierto, M.L.; Anders, R.A.; Taube, J.M.; Meeker, A.K.; Chen, S.; McMiller, T.L.; Phillips, N.A.; Xu, H.; Ogurtsova, A.; et al. Th17 immune microenvironment in Epstein-Barr virus-negative Hodgkin lymphoma: Implications for immunotherapy. Blood Adv. 2017, 1, 1324–1334. [Google Scholar] [CrossRef] [PubMed] [Green Version]
- Simoni, Y.; Becht, E.; Fehlings, M.; Loh, C.Y.; Koo, S.L.; Teng, K.W.W.; Yeong, J.P.S.; Nahar, R.; Zhang, T.; Kared, H.; et al. Bystander CD8(+) T cells are abundant and phenotypically distinct in human tumour infiltrates. Nature 2018, 557, 575–579. [Google Scholar] [CrossRef] [PubMed]
- Smith, C.C.; Beckermann, K.E.; Bortone, D.S.; De Cubas, A.A.; Bixby, L.M.; Lee, S.J.; Panda, A.; Ganesan, S.; Bhanot, G.; Wallen, E.M.; et al. Endogenous retroviral signatures predict immunotherapy response in clear cell renal cell carcinoma. J. Clin. Investig. 2018, 128, 4804–4820. [Google Scholar] [CrossRef] [PubMed] [Green Version]
- Cherkasova, E.; Weisman, Q.; Childs, R.W. Endogenous retroviruses as targets for antitumor immunity in renal cell cancer and other tumors. Front. Oncol. 2013, 3, 243. [Google Scholar] [CrossRef] [Green Version]
- Galluzzi, L.; Buque, A.; Kepp, O.; Zitvogel, L.; Kroemer, G. Immunological Effects of Conventional Chemotherapy and Targeted Anticancer Agents. Cancer Cell 2015, 28, 690–714. [Google Scholar] [CrossRef] [Green Version]
- Formenti, S.C.; Demaria, S. Combining radiotherapy and cancer immunotherapy: A paradigm shift. J. Natl. Cancer Inst. 2013, 105, 256–265. [Google Scholar] [CrossRef] [Green Version]
- Rodriguez-Ruiz, M.E.; Vanpouille-Box, C.; Melero, I.; Formenti, S.C.; Demaria, S. Immunological Mechanisms Responsible for Radiation-Induced Abscopal Effect. Trends Immunol. 2018, 39, 644–655. [Google Scholar] [CrossRef] [PubMed]
- Kang, J.; Demaria, S.; Formenti, S. Current clinical trials testing the combination of immunotherapy with radiotherapy. J. Immunother. Cancer 2016, 4, 51. [Google Scholar] [CrossRef] [PubMed] [Green Version]
- Ko, E.C.; Benjamin, K.T.; Formenti, S.C. Generating antitumor immunity by targeted radiation therapy: Role of dose and fractionation. Adv. Radiat. Oncol. 2018, 3, 486–493. [Google Scholar] [CrossRef] [Green Version]
- Dong, H.; Zhu, G.; Tamada, K.; Chen, L. B7-H1, a third member of the B7 family, co-stimulates T-cell proliferation and interleukin-10 secretion. Nat. Med. 1999, 5, 1365–1369. [Google Scholar] [CrossRef] [PubMed]
- Yi, M.; Xu, L.; Jiao, Y.; Luo, S.; Li, A.; Wu, K. The role of cancer-derived microRNAs in cancer immune escape. J. Hematol. Oncol. 2020, 13, 25. [Google Scholar] [CrossRef] [PubMed] [Green Version]
- Jerby-Arnon, L.; Shah, P.; Cuoco, M.S.; Rodman, C.; Su, M.J.; Melms, J.C.; Leeson, R.; Kanodia, A.; Mei, S.; Lin, J.R.; et al. A Cancer Cell Program Promotes T Cell Exclusion and Resistance to Checkpoint Blockade. Cell 2018, 175, 984–997.e924. [Google Scholar] [CrossRef] [PubMed] [Green Version]
- Ruscetti, M.; Leibold, J.; Bott, M.J.; Fennell, M.; Kulick, A.; Salgado, N.R.; Chen, C.C.; Ho, Y.J.; Sanchez-Rivera, F.J.; Feucht, J.; et al. NK cell-mediated cytotoxicity contributes to tumor control by a cytostatic drug combination. Science 2018, 362, 1416–1422. [Google Scholar] [CrossRef] [Green Version]
- Zhang, J.; Bu, X.; Wang, H.; Zhu, Y.; Geng, Y.; Nihira, N.T.; Tan, Y.; Ci, Y.; Wu, F.; Dai, X.; et al. Cyclin D-CDK4 kinase destabilizes PD-L1 via cullin 3-SPOP to control cancer immune surveillance. Nature 2018, 553, 91–95. [Google Scholar] [CrossRef] [Green Version]
- Li, C.W.; Lim, S.O.; Xia, W.; Lee, H.H.; Chan, L.C.; Kuo, C.W.; Khoo, K.H.; Chang, S.S.; Cha, J.H.; Kim, T.; et al. Glycosylation and stabilization of programmed death ligand-1 suppresses T-cell activity. Nat. Commun. 2016, 7, 12632. [Google Scholar] [CrossRef] [Green Version]
- Chen, N.; Fang, W.; Zhan, J.; Hong, S.; Tang, Y.; Kang, S.; Zhang, Y.; He, X.; Zhou, T.; Qin, T.; et al. Upregulation of PD-L1 by EGFR Activation Mediates the Immune Escape in EGFR-Driven NSCLC: Implication for Optional Immune Targeted Therapy for NSCLC Patients with EGFR Mutation. J. Thorac. Oncol. 2015, 10, 910–923. [Google Scholar] [CrossRef] [Green Version]
- Azuma, K.; Ota, K.; Kawahara, A.; Hattori, S.; Iwama, E.; Harada, T.; Matsumoto, K.; Takayama, K.; Takamori, S.; Kage, M.; et al. Association of PD-L1 overexpression with activating EGFR mutations in surgically resected nonsmall-cell lung cancer. Ann. Oncol. 2014, 25, 1935–1940. [Google Scholar] [CrossRef] [PubMed]
- D’Incecco, A.; Andreozzi, M.; Ludovini, V.; Rossi, E.; Capodanno, A.; Landi, L.; Tibaldi, C.; Minuti, G.; Salvini, J.; Coppi, E.; et al. PD-1 and PD-L1 expression in molecularly selected non-small-cell lung cancer patients. Br. J. Cancer 2015, 112, 95–102. [Google Scholar] [CrossRef] [PubMed] [Green Version]
- Yee, D.; Shah, K.M.; Coles, M.C.; Sharp, T.V.; Lagos, D. MicroRNA-155 induction via TNF-alpha and IFN-gamma suppresses expression of programmed death ligand-1 (PD-L1) in human primary cells. J. Biol. Chem. 2017, 292, 20683–20693. [Google Scholar] [CrossRef] [PubMed] [Green Version]
- Lim, S.O.; Li, C.W.; Xia, W.; Cha, J.H.; Chan, L.C.; Wu, Y.; Chang, S.S.; Lin, W.C.; Hsu, J.M.; Hsu, Y.H.; et al. Deubiquitination and Stabilization of PD-L1 by CSN5. Cancer Cell 2016, 30, 925–939. [Google Scholar] [CrossRef] [Green Version]
- Cope, G.A.; Deshaies, R.J. COP9 signalosome: A multifunctional regulator of SCF and other cullin-based ubiquitin ligases. Cell 2003, 114, 663–671. [Google Scholar] [CrossRef] [Green Version]
- Mezzadra, R.; Sun, C.; Jae, L.T.; Gomez-Eerland, R.; de Vries, E.; Wu, W.; Logtenberg, M.E.W.; Slagter, M.; Rozeman, E.A.; Hofland, I.; et al. Identification of CMTM6 and CMTM4 as PD-L1 protein regulators. Nature 2017, 549, 106–110. [Google Scholar] [CrossRef]
- Burr, M.L.; Sparbier, C.E.; Chan, Y.C.; Williamson, J.C.; Woods, K.; Beavis, P.A.; Lam, E.Y.N.; Henderson, M.A.; Bell, C.C.; Stolzenburg, S.; et al. CMTM6 maintains the expression of PD-L1 and regulates anti-tumour immunity. Nature 2017, 549, 101–105. [Google Scholar] [CrossRef] [Green Version]
- Yao, H.; Lan, J.; Li, C.; Shi, H.; Brosseau, J.P.; Wang, H.; Lu, H.; Fang, C.; Zhang, Y.; Liang, L.; et al. Inhibiting PD-L1 palmitoylation enhances T-cell immune responses against tumours. Nat. Biomed. Eng. 2019, 3, 306–317. [Google Scholar] [CrossRef]
- Yang, Y.; Hsu, J.M.; Sun, L.; Chan, L.C.; Li, C.W.; Hsu, J.L.; Wei, Y.; Xia, W.; Hou, J.; Qiu, Y.; et al. Palmitoylation stabilizes PD-L1 to promote breast tumor growth. Cell Res. 2019, 29, 83–86. [Google Scholar] [CrossRef] [Green Version]
- Latchman, Y.; Wood, C.R.; Chernova, T.; Chaudhary, D.; Borde, M.; Chernova, I.; Iwai, Y.; Long, A.J.; Brown, J.A.; Nunes, R.; et al. PD-L2 is a second ligand for PD-1 and inhibits T cell activation. Nat. Immunol. 2001, 2, 261–268. [Google Scholar] [CrossRef]
- Dorand, R.D.; Nthale, J.; Myers, J.T.; Barkauskas, D.S.; Avril, S.; Chirieleison, S.M.; Pareek, T.K.; Abbott, D.W.; Stearns, D.S.; Letterio, J.J.; et al. Cdk5 disruption attenuates tumor PD-L1 expression and promotes antitumor immunity. Science 2016, 353, 399–403. [Google Scholar] [CrossRef] [PubMed] [Green Version]
- Sumimoto, H.; Takano, A.; Teramoto, K.; Daigo, Y. RAS-Mitogen-Activated Protein Kinase Signal Is Required for Enhanced PD-L1 Expression in Human Lung Cancers. PLoS ONE 2016, 11, e0166626. [Google Scholar] [CrossRef]
- Ota, K.; Azuma, K.; Kawahara, A.; Hattori, S.; Iwama, E.; Tanizaki, J.; Harada, T.; Matsumoto, K.; Takayama, K.; Takamori, S.; et al. Induction of PD-L1 Expression by the EML4-ALK Oncoprotein and Downstream Signaling Pathways in Non-Small Cell Lung Cancer. Clin. Cancer Res. 2015, 21, 4014–4021. [Google Scholar] [CrossRef] [PubMed] [Green Version]
- Mariathasan, S.; Turley, S.J.; Nickles, D.; Castiglioni, A.; Yuen, K.; Wang, Y.; Kadel, E.E., III; Koeppen, H.; Astarita, J.L.; Cubas, R.; et al. TGFbeta attenuates tumour response to PD-L1 blockade by contributing to exclusion of T cells. Nature 2018, 554, 544–548. [Google Scholar] [CrossRef]
- Lopez-Chavez, A.; Thomas, A.; Rajan, A.; Raffeld, M.; Morrow, B.; Kelly, R.; Carter, C.A.; Guha, U.; Killian, K.; Lau, C.C.; et al. Molecular profiling and targeted therapy for advanced thoracic malignancies: A biomarker-derived, multiarm, multihistology phase II basket trial. J. Clin. Oncol. 2015, 33, 1000–1007. [Google Scholar] [CrossRef] [PubMed]
- Mansfield, A.S.; Dong, H. Implications of Programmed Cell Death 1 Ligand 1 Heterogeneity in the Selection of Patients with Non-Small Cell Lung Cancer to Receive Immunotherapy. Clin. Pharmacol. Ther. 2016, 100, 220–222. [Google Scholar] [CrossRef] [PubMed]
- Gniadek, T.J.; Li, Q.K.; Tully, E.; Chatterjee, S.; Nimmagadda, S.; Gabrielson, E. Heterogeneous expression of PD-L1 in pulmonary squamous cell carcinoma and adenocarcinoma: Implications for assessment by small biopsy. Mod. Pathol. 2017, 30, 530–538. [Google Scholar] [CrossRef] [PubMed] [Green Version]
- Roach, C.; Zhang, N.; Corigliano, E.; Jansson, M.; Toland, G.; Ponto, G.; Dolled-Filhart, M.; Emancipator, K.; Stanforth, D.; Kulangara, K. Development of a Companion Diagnostic PD-L1 Immunohistochemistry Assay for Pembrolizumab Therapy in Non-Small-cell Lung Cancer. Appl. Immunohistochem. Mol. Morphol. 2016, 24, 392–397. [Google Scholar] [CrossRef] [Green Version]
- Patel, S.P.; Kurzrock, R. PD-L1 Expression as a Predictive Biomarker in Cancer Immunotherapy. Mol. Cancer Ther. 2015, 14, 847–856. [Google Scholar] [CrossRef] [PubMed]
- Kim, S.T.; Cristescu, R.; Bass, A.J.; Kim, K.M.; Odegaard, J.I.; Kim, K.; Liu, X.Q.; Sher, X.; Jung, H.; Lee, M.; et al. Comprehensive molecular characterization of clinical responses to PD-1 inhibition in metastatic gastric cancer. Nat. Med. 2018, 24, 1449–1458. [Google Scholar] [CrossRef]
- Vuky, J.; Balar, A.V.; Castellano, D.; O’Donnell, P.H.; Grivas, P.; Bellmunt, J.; Powles, T.; Bajorin, D.; Hahn, N.M.; Savage, M.J.; et al. Long-Term Outcomes in KEYNOTE-052: Phase II Study Investigating First-Line Pembrolizumab in Cisplatin-Ineligible Patients with Locally Advanced or Metastatic Urothelial Cancer. J. Clin. Oncol. 2020, 38, 2658–2666. [Google Scholar] [CrossRef]
- Necchi, A.; Anichini, A.; Raggi, D.; Briganti, A.; Massa, S.; Luciano, R.; Colecchia, M.; Giannatempo, P.; Mortarini, R.; Bianchi, M.; et al. Pembrolizumab as Neoadjuvant Therapy Before Radical Cystectomy in Patients with Muscle-Invasive Urothelial Bladder Carcinoma (PURE-01): An Open-Label, Single-Arm, Phase II Study. J. Clin. Oncol. 2018, 36, 3353–3360. [Google Scholar] [CrossRef] [PubMed] [Green Version]
- Bandini, M.; Ross, J.S.; Raggi, D.; Gallina, A.; Colecchia, M.; Luciano, R.; Giannatempo, P.; Fare, E.; Pederzoli, F.; Bianchi, M.; et al. Predicting the pathologic complete response after neoadjuvant pembrolizumab in muscle-invasive bladder cancer. J. Natl. Cancer Inst. 2020. [Google Scholar] [CrossRef] [PubMed]
- Kelly, R.J. The emerging role of immunotherapy for esophageal cancer. Curr. Opin. Gastroenterol. 2019. [Google Scholar] [CrossRef]
- Garon, E.B.; Rizvi, N.A.; Hui, R.; Leighl, N.; Balmanoukian, A.S.; Eder, J.P.; Patnaik, A.; Aggarwal, C.; Gubens, M.; Horn, L.; et al. Pembrolizumab for the treatment of non-small-cell lung cancer. N. Engl. J. Med. 2015, 372, 2018–2028. [Google Scholar] [CrossRef] [PubMed]
- Reck, M.; Rodriguez-Abreu, D.; Robinson, A.G.; Hui, R.; Csoszi, T.; Fulop, A.; Gottfried, M.; Peled, N.; Tafreshi, A.; Cuffe, S.; et al. Pembrolizumab versus Chemotherapy for PD-L1-Positive Non-Small-Cell Lung Cancer. N. Engl. J. Med. 2016, 375, 1823–1833. [Google Scholar] [CrossRef] [PubMed] [Green Version]
- Reck, M.; Rodriguez-Abreu, D.; Robinson, A.G.; Hui, R.; Csoszi, T.; Fulop, A.; Gottfried, M.; Peled, N.; Tafreshi, A.; Cuffe, S.; et al. Updated Analysis of KEYNOTE-024: Pembrolizumab Versus Platinum-Based Chemotherapy for Advanced Non-Small-Cell Lung Cancer With PD-L1 Tumor Proportion Score of 50% or Greater. J. Clin. Oncol. 2019, 37, 537–546. [Google Scholar] [CrossRef]
- Herbst, R.S.; Lopes, G.; Kowalski, D.M.; Nishio, M.; Wu, Y.L.; de Castro Junior, G.; Baas, P.; Kim, D.W.; Gubens, M.A.; Cristescu, R.; et al. LBA79—Association between tissue TMB (tTMB) and clinical outcomes with pembrolizumab monotherapy (pembro) in PD-L1-positive advanced NSCLC in the KEYNOTE-010 and -042 trials. Ann. Oncol. 2019, 30, v916–v917. [Google Scholar] [CrossRef]
- Hellmann, M.D.; Nathanson, T.; Rizvi, H.; Creelan, B.C.; Sanchez-Vega, F.; Ahuja, A.; Ni, A.; Novik, J.B.; Mangarin, L.M.B.; Abu-Akeel, M.; et al. Genomic Features of Response to Combination Immunotherapy in Patients with Advanced Non-Small-Cell Lung Cancer. Cancer Cell 2018, 33, 843–852.e4. [Google Scholar] [CrossRef] [Green Version]
- Hellmann, M.D.; Ciuleanu, T.E.; Pluzanski, A.; Lee, J.S.; Otterson, G.A.; Audigier-Valette, C.; Minenza, E.; Linardou, H.; Burgers, S.; Salman, P.; et al. Nivolumab plus Ipilimumab in Lung Cancer with a High Tumor Mutational Burden. N. Engl. J. Med. 2018, 378, 2093–2104. [Google Scholar] [CrossRef] [PubMed]
- Peters, S.; Ramalingam, S.S.; Paz-Ares, L.; Bernabe Caro, R.; Zurawski, B.; Kim, S.W.; Alexandru, A.; Lupinacci, L.; de la Mora Jimenez, E.; Sakai, H.; et al. LBA4_PR—Nivolumab (NIVO) + low-dose ipilimumab (IPI) vs platinum-doublet chemotherapy (chemo) as first-line (1L) treatment (tx) for advanced non-small cell lung cancer (NSCLC): CheckMate 227 part 1 final analysis. Ann. Oncol. 2019, 30, v913–v914. [Google Scholar] [CrossRef]
- Spigel, D.; de Marinis, F.; Giaccone, G.; Reinmuth, N.; Vergnenegre, A.; Barrios, C.H.; Morise, M.; Felip, E.; Andric, Z.G.; Geater, S.; et al. LBA78—IMpower110: Interim overall survival (OS) analysis of a phase III study of atezolizumab (atezo) vs platinum-based chemotherapy (chemo) as first-line (1L) treatment (tx) in PD-L1–selected NSCLC. Ann. Oncol. 2019, 30, v915. [Google Scholar] [CrossRef]
- Yarchoan, M.; Albacker, L.A.; Hopkins, A.C.; Montesion, M.; Murugesan, K.; Vithayathil, T.T.; Zaidi, N.; Azad, N.S.; Laheru, D.A.; Frampton, G.M.; et al. PD-L1 expression and tumor mutational burden are independent biomarkers in most cancers. JCI Insight 2019, 4. [Google Scholar] [CrossRef] [Green Version]
- Melosky, B.; Chu, Q.; Juergens, R.A.; Leighl, N.; Ionescu, D.; Tsao, M.S.; McLeod, D.; Hirsh, V. Breaking the biomarker code: PD-L1 expression and checkpoint inhibition in advanced NSCLC. Cancer Treat. Rev. 2018, 65, 65–77. [Google Scholar] [CrossRef] [PubMed]
- Cottrell, T.R.; Taube, J.M. PD-L1 and Emerging Biomarkers in Immune Checkpoint Blockade Therapy. Cancer J. 2018, 24, 41–46. [Google Scholar] [CrossRef]
- Davis, A.A.; Patel, V.G. The role of PD-L1 expression as a predictive biomarker: An analysis of all US Food and Drug Administration (FDA) approvals of immune checkpoint inhibitors. J. Immunother. Cancer 2019, 7, 278. [Google Scholar] [CrossRef] [PubMed]
- Teng, M.W.; Ngiow, S.F.; Ribas, A.; Smyth, M.J. Classifying Cancers Based on T-cell Infiltration and PD-L1. Cancer Res. 2015, 75, 2139–2145. [Google Scholar] [CrossRef] [PubMed] [Green Version]
- Hamid, O.; Robert, C.; Daud, A.; Hodi, F.S.; Hwu, W.J.; Kefford, R.; Wolchok, J.D.; Hersey, P.; Joseph, R.W.; Weber, J.S.; et al. Safety and tumor responses with lambrolizumab (anti-PD-1) in melanoma. N. Engl. J. Med. 2013, 369, 134–144. [Google Scholar] [CrossRef] [Green Version]
- Daud, A.I.; Wolchok, J.D.; Robert, C.; Hwu, W.J.; Weber, J.S.; Ribas, A.; Hodi, F.S.; Joshua, A.M.; Kefford, R.; Hersey, P.; et al. Programmed Death-Ligand 1 Expression and Response to the Anti-Programmed Death 1 Antibody Pembrolizumab in Melanoma. J. Clin. Oncol. 2016, 34, 4102–4109. [Google Scholar] [CrossRef]
- Brahmer, J.R.; Drake, C.G.; Wollner, I.; Powderly, J.D.; Picus, J.; Sharfman, W.H.; Stankevich, E.; Pons, A.; Salay, T.M.; McMiller, T.L.; et al. Phase I study of single-agent anti-programmed death-1 (MDX-1106) in refractory solid tumors: Safety, clinical activity, pharmacodynamics, and immunologic correlates. J. Clin. Oncol. 2010, 28, 3167–3175. [Google Scholar] [CrossRef]
- Garon, E.B.; Hellmann, M.D.; Rizvi, N.A.; Carcereny, E.; Leighl, N.B.; Ahn, M.J.; Eder, J.P.; Balmanoukian, A.S.; Aggarwal, C.; Horn, L.; et al. Five-Year Overall Survival for Patients with Advanced NonSmall-Cell Lung Cancer Treated with Pembrolizumab: Results From the Phase I KEYNOTE-001 Study. J. Clin. Oncol. 2019, 37, 2518–2527. [Google Scholar] [CrossRef] [PubMed]
- Rosenberg, J.E.; Hoffman-Censits, J.; Powles, T.; van der Heijden, M.S.; Balar, A.V.; Necchi, A.; Dawson, N.; O’Donnell, P.H.; Balmanoukian, A.; Loriot, Y.; et al. Atezolizumab in patients with locally advanced and metastatic urothelial carcinoma who have progressed following treatment with platinum-based chemotherapy: A single-arm, multicentre, phase 2 trial. Lancet 2016, 387, 1909–1920. [Google Scholar] [CrossRef] [Green Version]
- Taube, J.M.; Klein, A.P.; Brahmer, J.R.; Xu, H.; Pan, X.; Kim, J.H.; Chen, L.; Pardoll, D.M.; Topalian, S.L.; Anders, R.A. Association of PD-1, PD-1 ligands, and other features of the tumor immune microenvironment with response to anti-PD-1 therapy. Clin. Cancer Res. 2014, 20, 5064–5074. [Google Scholar] [CrossRef] [Green Version]
- Mascaux, C.; Angelova, M.; Vasaturo, A.; Beane, J.; Hijazi, K.; Anthoine, G.; Buttard, B.; Rothe, F.; Willard-Gallo, K.; Haller, A.; et al. Immune evasion before tumour invasion in early lung squamous carcinogenesis. Nature 2019, 571, 570–575. [Google Scholar] [CrossRef] [PubMed]
- Lesokhin, A.M.; Bal, S.; Badros, A.Z. Lessons Learned from Checkpoint Blockade Targeting PD-1 in Multiple Myeloma. Cancer Immunol. Res. 2019, 7, 1224–1229. [Google Scholar] [CrossRef] [PubMed]
- Kumar, S.K.; Rajkumar, V.; Kyle, R.A.; van Duin, M.; Sonneveld, P.; Mateos, M.V.; Gay, F.; Anderson, K.C. Multiple myeloma. Nat. Rev. Dis. Primers 2017, 3, 17046. [Google Scholar] [CrossRef]
- Tamura, H.; Ishibashi, M.; Yamashita, T.; Tanosaki, S.; Okuyama, N.; Kondo, A.; Hyodo, H.; Shinya, E.; Takahashi, H.; Dong, H.; et al. Marrow stromal cells induce B7-H1 expression on myeloma cells, generating aggressive characteristics in multiple myeloma. Leukemia 2013, 27, 464–472. [Google Scholar] [CrossRef] [Green Version]
- Samstein, R.M.; Lee, C.H.; Shoushtari, A.N.; Hellmann, M.D.; Shen, R.; Janjigian, Y.Y.; Barron, D.A.; Zehir, A.; Jordan, E.J.; Omuro, A.; et al. Tumor mutational load predicts survival after immunotherapy across multiple cancer types. Nat. Genet. 2019, 51, 202–206. [Google Scholar] [CrossRef]
- Snyder, A.; Makarov, V.; Merghoub, T.; Yuan, J.; Zaretsky, J.M.; Desrichard, A.; Walsh, L.A.; Postow, M.A.; Wong, P.; Ho, T.S.; et al. Genetic basis for clinical response to CTLA-4 blockade in melanoma. N. Engl. J. Med. 2014, 371, 2189–2199. [Google Scholar] [CrossRef]
- Turajlic, S.; Litchfield, K.; Xu, H.; Rosenthal, R.; McGranahan, N.; Reading, J.L.; Wong, Y.N.S.; Rowan, A.; Kanu, N.; Al Bakir, M.; et al. Insertion-and-deletion-derived tumour-specific neoantigens and the immunogenic phenotype: A pan-cancer analysis. Lancet Oncol. 2017, 18, 1009–1021. [Google Scholar] [CrossRef] [Green Version]
- Dong, W.; Wu, X.; Ma, S.; Wang, Y.; Nalin, A.P.; Zhu, Z.; Zhang, J.; Benson, D.M.; He, K.; Caligiuri, M.A.; et al. The Mechanism of Anti-PD-L1 Antibody Efficacy against PD-L1-Negative Tumors Identifies NK Cells Expressing PD-L1 as a Cytolytic Effector. Cancer Discov. 2019, 9, 1422–1437. [Google Scholar] [CrossRef] [PubMed] [Green Version]
- Kulangara, K.; Hanks, D.A.; Waldroup, S.; Peltz, L.; Shah, S.; Roach, C.; Juco, J.W.; Emancipator, K.; Stanforth, D. Development of the combined positive score (CPS) for the evaluation of PD-L1 in solid tumors with the immunohistochemistry assay PD-L1 IHC 22C3 pharmDx. J. Clin. Oncol. 2017, 35, e14589. [Google Scholar] [CrossRef]
- Buttner, R.; Gosney, J.R.; Skov, B.G.; Adam, J.; Motoi, N.; Bloom, K.J.; Dietel, M.; Longshore, J.W.; Lopez-Rios, F.; Penault-Llorca, F.; et al. Programmed Death-Ligand 1 Immunohistochemistry Testing: A Review of Analytical Assays and Clinical Implementation in Non-Small-Cell Lung Cancer. J. Clin. Oncol. 2017, 35, 3867–3876. [Google Scholar] [CrossRef] [PubMed]
- Hirsch, F.R.; McElhinny, A.; Stanforth, D.; Ranger-Moore, J.; Jansson, M.; Kulangara, K.; Richardson, W.; Towne, P.; Hanks, D.; Vennapusa, B.; et al. PD-L1 Immunohistochemistry Assays for Lung Cancer: Results from Phase 1 of the Blueprint PD-L1 IHC Assay Comparison Project. J. Thorac. Oncol. 2017, 12, 208–222. [Google Scholar] [CrossRef]
- Tsao, M.S.; Kerr, K.M.; Kockx, M.; Beasley, M.B.; Borczuk, A.C.; Botling, J.; Bubendorf, L.; Chirieac, L.; Chen, G.; Chou, T.Y.; et al. PD-L1 Immunohistochemistry Comparability Study in Real-Life Clinical Samples: Results of Blueprint Phase 2 Project. J. Thorac. Oncol. 2018, 13, 1302–1311. [Google Scholar] [CrossRef] [Green Version]
- Topalian, S.L.; Hodi, F.S.; Brahmer, J.R.; Gettinger, S.N.; Smith, D.C.; McDermott, D.F.; Powderly, J.D.; Carvajal, R.D.; Sosman, J.A.; Atkins, M.B.; et al. Safety, activity, and immune correlates of anti-PD-1 antibody in cancer. N. Engl. J. Med. 2012, 366, 2443–2454. [Google Scholar] [CrossRef]
- McGranahan, N.; Swanton, C. Biological and therapeutic impact of intratumor heterogeneity in cancer evolution. Cancer Cell 2015, 27, 15–26. [Google Scholar] [CrossRef] [Green Version]
- Madore, J.; Vilain, R.E.; Menzies, A.M.; Kakavand, H.; Wilmott, J.S.; Hyman, J.; Yearley, J.H.; Kefford, R.F.; Thompson, J.F.; Long, G.V.; et al. PD-L1 expression in melanoma shows marked heterogeneity within and between patients: Implications for anti-PD-1/PD-L1 clinical trials. Pigment. Cell Melanoma Res. 2015, 28, 245–253. [Google Scholar] [CrossRef] [PubMed]
- Mansfield, A.S.; Murphy, S.J.; Peikert, T.; Yi, E.S.; Vasmatzis, G.; Wigle, D.A.; Aubry, M.C. Heterogeneity of Programmed Cell Death Ligand 1 Expression in Multifocal Lung Cancer. Clin. Cancer Res. 2016, 22, 2177–2182. [Google Scholar] [CrossRef] [Green Version]
- Salmon, H.; Remark, R.; Gnjatic, S.; Merad, M. Host tissue determinants of tumour immunity. Nat. Rev. Cancer 2019, 19, 215–227. [Google Scholar] [CrossRef]
- Massard, C.; Gordon, M.S.; Sharma, S.; Rafii, S.; Wainberg, Z.A.; Luke, J.; Curiel, T.J.; Colon-Otero, G.; Hamid, O.; Sanborn, R.E.; et al. Safety and Efficacy of Durvalumab (MEDI4736), an Anti-Programmed Cell Death Ligand-1 Immune Checkpoint Inhibitor, in Patients with Advanced Urothelial Bladder Cancer. J. Clin. Oncol. 2016, 34, 3119–3125. [Google Scholar] [CrossRef] [PubMed]
- Tumeh, P.C.; Hellmann, M.D.; Hamid, O.; Tsai, K.K.; Loo, K.L.; Gubens, M.A.; Rosenblum, M.; Harview, C.L.; Taube, J.M.; Handley, N.; et al. Liver Metastasis and Treatment Outcome with Anti-PD-1 Monoclonal Antibody in Patients with Melanoma and NSCLC. Cancer Immunol. Res. 2017, 5, 417–424. [Google Scholar] [CrossRef] [Green Version]
- Pao, W.; Ooi, C.H.; Birzele, F.; Ruefli-Brasse, A.; Cannarile, M.A.; Reis, B.; Scharf, S.H.; Schubert, D.A.; Hatje, K.; Pelletier, N.; et al. Tissue-Specific Immunoregulation: A Call for Better Understanding of the "Immunostat" in the Context of Cancer. Cancer Discov. 2018, 8, 395–402. [Google Scholar] [CrossRef] [Green Version]
- Martinez, P.; Peters, S.; Stammers, T.; Soria, J.C. Immunotherapy for the First-Line Treatment of Patients with Metastatic Non-Small Cell Lung Cancer. Clin. Cancer Res. 2019, 25, 2691–2698. [Google Scholar] [CrossRef] [PubMed] [Green Version]
- Garon, E.B. Cancer Immunotherapy Trials Not Immune from Imprecise Selection of Patients. N. Engl. J. Med. 2017, 376, 2483–2485. [Google Scholar] [CrossRef] [PubMed]
- Remon, J.; Besse, B.; Soria, J.C. Successes and failures: What did we learn from recent first-line treatment immunotherapy trials in non-small cell lung cancer? BMC Med. 2017, 15, 55. [Google Scholar] [CrossRef] [Green Version]
- Aguilar, E.J.; Ricciuti, B.; Gainor, J.F.; Kehl, K.L.; Kravets, S.; Dahlberg, S.; Nishino, M.; Sholl, L.M.; Adeni, A.; Subegdjo, S.; et al. Outcomes to first-line pembrolizumab in patients with non-small-cell lung cancer and very high PD-L1 expression. Ann. Oncol. 2019, 30, 1653–1659. [Google Scholar] [CrossRef] [Green Version]
- Ott, P.A.; Hodi, F.S.; Kaufman, H.L.; Wigginton, J.M.; Wolchok, J.D. Combination immunotherapy: A road map. J. Immunother. Cancer 2017, 5, 16. [Google Scholar] [CrossRef] [Green Version]
- Willmann, J.K.; van Bruggen, N.; Dinkelborg, L.M.; Gambhir, S.S. Molecular imaging in drug development. Nat. Rev. Drug Discov. 2008, 7, 591–607. [Google Scholar] [CrossRef]
- Peterson, L.M.; Mankoff, D.A.; Lawton, T.; Yagle, K.; Schubert, E.K.; Stekhova, S.; Gown, A.; Link, J.M.; Tewson, T.; Krohn, K.A. Quantitative imaging of estrogen receptor expression in breast cancer with PET and 18F-fluoroestradiol. J. Nucl. Med. Off. Publ. Soc. Nucl. Med. 2008, 49, 367–374. [Google Scholar] [CrossRef] [Green Version]
- Linden, H.M.; Stekhova, S.A.; Link, J.M.; Gralow, J.R.; Livingston, R.B.; Ellis, G.K.; Petra, P.H.; Peterson, L.M.; Schubert, E.K.; Dunnwald, L.K.; et al. Quantitative fluoroestradiol positron emission tomography imaging predicts response to endocrine treatment in breast cancer. J. Clin. Oncol. Off. J. Am. Soc. Clin. Oncol. 2006, 24, 2793–2799. [Google Scholar] [CrossRef] [PubMed]
- Jagoda, E.M.; Vasalatiy, O.; Basuli, F.; Opina, A.C.L.; Williams, M.R.; Wong, K.; Lane, K.C.; Adler, S.; Ton, A.T.; Szajek, L.P.; et al. Immuno-PET Imaging of the Programmed Cell Death-1 Ligand (PD-L1) Using a Zirconium-89 Labeled Therapeutic Antibody, Avelumab. Mol. Imaging 2019, 18, 1536012119829986. [Google Scholar] [CrossRef] [Green Version]
- Truillet, C.; Oh, H.L.J.; Yeo, S.P.; Lee, C.Y.; Huynh, L.T.; Wei, J.; Parker, M.F.L.; Blakely, C.M.; Sevillano, N.; Wang, Y.H.; et al. Imaging PD-L1 expression with immunoPET. Bioconjug. Chem. 2017. [Google Scholar] [CrossRef] [PubMed]
- Kikuchi, M.; Clump, D.A.; Srivastava, R.M.; Sun, L.; Zeng, D.; Diaz-Perez, J.A.; Anderson, C.J.; Edwards, W.B.; Ferris, R.L. Preclinical immunoPET/CT imaging using Zr-89-labeled anti-PD-L1 monoclonal antibody for assessing radiation-induced PD-L1 upregulation in head and neck cancer and melanoma. Oncoimmunology 2017, 6, e1329071. [Google Scholar] [CrossRef] [PubMed] [Green Version]
- Chatterjee, S.; Lesniak, W.G.; Nimmagadda, S. Noninvasive Imaging of Immune Checkpoint Ligand PD-L1 in Tumors and Metastases for Guiding Immunotherapy. Mol. Imaging 2017, 16, 1536012117718459. [Google Scholar] [CrossRef]
- Josefsson, A.; Nedrow, J.R.; Park, S.; Banerjee, S.R.; Rittenbach, A.; Jammes, F.; Tsui, B.; Sgouros, G. Imaging, Biodistribution, and Dosimetry of Radionuclide-Labeled PD-L1 Antibody in an Immunocompetent Mouse Model of Breast Cancer. Cancer Res. 2016, 76, 472–479. [Google Scholar] [CrossRef] [Green Version]
- Hettich, M.; Braun, F.; Bartholoma, M.D.; Schirmbeck, R.; Niedermann, G. High-Resolution PET Imaging with Therapeutic Antibody-based PD-1/PD-L1 Checkpoint Tracers. Theranostics 2016, 6, 1629–1640. [Google Scholar] [CrossRef]
- Chatterjee, S.; Lesniak, W.G.; Gabrielson, M.; Lisok, A.; Wharram, B.; Sysa-Shah, P.; Azad, B.B.; Pomper, M.G.; Nimmagadda, S. A humanized antibody for imaging immune checkpoint ligand PD-L1 expression in tumors. Oncotarget 2016, 7, 10215–10227. [Google Scholar] [CrossRef] [Green Version]
- Heskamp, S.; Hobo, W.; Molkenboer-Kuenen, J.D.; Olive, D.; Oyen, W.J.; Dolstra, H.; Boerman, O.C. Noninvasive Imaging of Tumor PD-L1 Expression Using Radiolabeled Anti-PD-L1 Antibodies. Cancer Res. 2015, 75, 2928–2936. [Google Scholar] [CrossRef] [Green Version]
- Broos, K.; Keyaerts, M.; Lecocq, Q.; Renmans, D.; Nguyen, T.; Escors, D.; Liston, A.; Raes, G.; Breckpot, K.; Devoogdt, N. Non-invasive assessment of murine PD-L1 levels in syngeneic tumor models by nuclear imaging with nanobody tracers. Oncotarget 2017, 8, 41932–41946. [Google Scholar] [CrossRef] [Green Version]
- Wissler, H.L.; Ehlerding, E.B.; Lyu, Z.; Zhao, Y.; Zhang, S.; Eshraghi, A.; Buuh, Z.Y.; McGuth, J.C.; Guan, Y.; Engle, J.W.; et al. Site-Specific Immuno-PET Tracer to Image PD-L1. Mol. Pharm 2019, 16, 2028–2036. [Google Scholar] [CrossRef]
- Ingram, J.R.; Dougan, M.; Rashidian, M.; Knoll, M.; Keliher, E.J.; Garrett, S.; Garforth, S.; Blomberg, O.S.; Espinosa, C.; Bhan, A.; et al. PD-L1 is an activation-independent marker of brown adipocytes. Nat. Commun. 2017, 8, 647. [Google Scholar] [CrossRef] [PubMed]
- Donnelly, D.J.; Smith, R.A.; Morin, P.; Lipovsek, D.; Gokemeijer, J.; Cohen, D.; Lafont, V.; Tran, T.; Cole, E.L.; Wright, M.; et al. Synthesis and Biologic Evaluation of a Novel (18)F-Labeled Adnectin as a PET Radioligand for Imaging PD-L1 Expression. J. Nucl. Med. 2018, 59, 529–535. [Google Scholar] [CrossRef] [PubMed] [Green Version]
- Lesniak, W.G.; Mease, R.C.; Chatterjee, S.; Kumar, D.; Lisok, A.; Wharram, B.; Kalagadda, V.R.; Emens, L.A.; Pomper, M.G.; Nimmagadda, S. Development of [(18)F]FPy-WL12 as a PD-L1 Specific PET Imaging Peptide. Mol. Imaging 2019, 18, 1536012119852189. [Google Scholar] [CrossRef] [PubMed] [Green Version]
- De Silva, R.A.; Kumar, D.; Lisok, A.; Chatterjee, S.; Wharram, B.; Venkateswara Rao, K.; Mease, R.; Dannals, R.F.; Pomper, M.G.; Nimmagadda, S. Peptide-Based (68)Ga-PET Radiotracer for Imaging PD-L1 Expression in Cancer. Mol. Pharm. 2018, 15, 3946–3952. [Google Scholar] [CrossRef] [Green Version]
- Lesniak, W.G.; Chatterjee, S.; Gabrielson, M.; Lisok, A.; Wharram, B.; Pomper, M.G.; Nimmagadda, S. PD-L1 Detection in Tumors Using [(64)Cu]Atezolizumab with PET. Bioconjug. Chem. 2016, 27, 2103–2110. [Google Scholar] [CrossRef] [Green Version]
- Nedrow, J.R.; Josefsson, A.; Park, S.; Back, T.; Hobbs, R.F.; Brayton, C.; Bruchertseifer, F.; Morgenstern, A.; Sgouros, G. Pharmacokinetics, microscale distribution, and dosimetry of alpha-emitter-labeled anti-PD-L1 antibodies in an immune competent transgenic breast cancer model. EJNMMI Res. 2017, 7, 57. [Google Scholar] [CrossRef] [PubMed] [Green Version]
- Deng, R.; Bumbaca, D.; Pastuskovas, C.V.; Boswell, C.A.; West, D.; Cowan, K.J.; Chiu, H.; McBride, J.; Johnson, C.; Xin, Y.; et al. Preclinical pharmacokinetics, pharmacodynamics, tissue distribution, and tumor penetration of anti-PD-L1 monoclonal antibody, an immune checkpoint inhibitor. MAbs 2016, 8, 593–603. [Google Scholar] [CrossRef]
- Rubins, D.J.; Meng, X.; McQuade, P.; Klimas, M.; Getty, K.; Lin, S.-A.; Connolly, B.M.; O’Malley, S.S.; Haley, H.; Purcell, M.; et al. In Vivo Evaluation and Dosimetry Estimate for a High Affinity Affibody PET Tracer Targeting PD-L1. Mol. Imag. Biol. 2020. [Google Scholar] [CrossRef]
- Moroz, A.; Lee, C.Y.; Wang, Y.H.; Hsiao, J.C.; Sevillano, N.; Truillet, C.; Craik, C.S.; Fong, L.; Wang, C.I.; Evans, M.J. A Preclinical Assessment of (89)Zr-atezolizumab Identifies a Requirement for Carrier Added Formulations Not Observed with (89)Zr-C4. Bioconjug. Chem. 2018, 29, 3476–3482. [Google Scholar] [CrossRef]
- Heskamp, S.; Wierstra, P.J.; Molkenboer-Kuenen, J.D.M.; Sandker, G.W.; Thordardottir, S.; Cany, J.; Olive, D.; Bussink, J.; Boerman, O.C.; Dolstra, H.; et al. PD-L1 microSPECT/CT Imaging for Longitudinal Monitoring of PD-L1 Expression in Syngeneic and Humanized Mouse Models for Cancer. Cancer Immunol. Res. 2019, 7, 150–161. [Google Scholar] [CrossRef] [PubMed]
- Vento, J.; Mulgaonkar, A.; Woolford, L.; Nham, K.; Christie, A.; Bagrodia, A.; de Leon, A.D.; Hannan, R.; Bowman, I.; McKay, R.M.; et al. PD-L1 detection using (89)Zr-atezolizumab immuno-PET in renal cell carcinoma tumorgrafts from a patient with favorable nivolumab response. J. Immunother. Cancer 2019, 7, 144. [Google Scholar] [CrossRef]
- Tabrizi, M.A.; Tseng, C.M.; Roskos, L.K. Elimination mechanisms of therapeutic monoclonal antibodies. Drug Discov. Today 2006, 11, 81–88. [Google Scholar] [CrossRef]
- Glassman, P.M.; Balthasar, J.P. Physiologically-based pharmacokinetic modeling to predict the clinical pharmacokinetics of monoclonal antibodies. J. Pharmacokinet. Pharmacodyn. 2016, 43, 427–446. [Google Scholar] [CrossRef] [PubMed]
- Ehlerding, E.B.; Lee, H.J.; Barnhart, T.E.; Jiang, D.; Kang, L.; McNeel, D.G.; Engle, J.W.; Cai, W. Noninvasive Imaging and Quantification of Radiotherapy-Induced PD-L1 Upregulation with (89)Zr-Df-Atezolizumab. Bioconjug. Chem. 2019, 30, 1434–1441. [Google Scholar] [CrossRef] [PubMed]
- Wu, A.M. Engineered antibodies for molecular imaging of cancer. Methods 2014, 65, 139–147. [Google Scholar] [CrossRef] [Green Version]
- Li, D.; Cheng, S.; Zou, S.; Zhu, D.; Zhu, T.; Wang, P.; Zhu, X. Immuno-PET Imaging of (89)Zr Labeled Anti-PD-L1 Domain Antibody. Mol. Pharm. 2018, 15, 1674–1681. [Google Scholar] [CrossRef]
- Lv, G.; Sun, X.; Qiu, L.; Sun, Y.; Li, K.; Liu, Q.; Zhao, Q.; Qin, S.; Lin, J. PET Imaging of Tumor PD-L1 Expression with a Highly Specific Nonblocking Single-Domain Antibody. J. Nucl. Med. 2020, 61, 117–122. [Google Scholar] [CrossRef]
- Gonzalez Trotter, D.E.; Meng, X.; McQuade, P.; Rubins, D.; Klimas, M.; Zeng, Z.; Connolly, B.M.; Miller, P.J.; O’Malley, S.S.; Lin, S.A.; et al. In Vivo Imaging of the Programmed Death Ligand 1 by (18)F PET. J. Nucl. Med. 2017, 58, 1852–1857. [Google Scholar] [CrossRef] [Green Version]
- Maute, R.L.; Gordon, S.R.; Mayer, A.T.; McCracken, M.N.; Natarajan, A.; Ring, N.G.; Kimura, R.; Tsai, J.M.; Manglik, A.; Kruse, A.C.; et al. Engineering high-affinity PD-1 variants for optimized immunotherapy and immuno-PET imaging. Proc. Natl. Acad. Sci. USA 2015, 112, E6506–E6514. [Google Scholar] [CrossRef] [Green Version]
- Jain, R.K. Transport of molecules in the tumor interstitium: A review. Cancer Res. 1987, 47, 3039–3051. [Google Scholar] [PubMed]
- Miller, M.M.; Mapelli, C.; Allen, M.P.; Bowsher, M.S.; Gillis, E.P.; Langley, D.R.; Mull, E.; Poirier, M.A.; Sanghvi, N.; Sun, L.-Q.; et al. Macrocyclic Inhibitors of the PD1/PDL1 and CD80 (B7-1)/PD-L1 Protein/Protein Interactions. WO2016039749A1, 11 September 2014. [Google Scholar]
- Chatterjee, S.; Lesniak, W.G.; Miller, M.S.; Lisok, A.; Sikorska, E.; Wharram, B.; Kumar, D.; Gabrielson, M.; Pomper, M.G.; Gabelli, S.B.; et al. Rapid PD-L1 detection in tumors with PET using a highly specific peptide. Biochem. Biophys. Res. Commun. 2017, 483, 258–263. [Google Scholar] [CrossRef] [Green Version]
- Zak, K.M.; Grudnik, P.; Guzik, K.; Zieba, B.J.; Musielak, B.; Domling, A.; Dubin, G.; Holak, T.A. Structural basis for small molecule targeting of the programmed death ligand 1 (PD-L1). Oncotarget 2016, 7, 30323–30335. [Google Scholar] [CrossRef] [Green Version]
- Bensch, F.; van der Veen, E.L.; Lub-de Hooge, M.N.; Jorritsma-Smit, A.; Boellaard, R.; Kok, I.C.; Oosting, S.F.; Schroder, C.P.; Hiltermann, T.J.N.; van der Wekken, A.J.; et al. (89)Zr-atezolizumab imaging as a non-invasive approach to assess clinical response to PD-L1 blockade in cancer. Nat. Med. 2018, 24, 1852–1858. [Google Scholar] [CrossRef]
- Niemeijer, A.N.; Leung, D.; Huisman, M.C.; Bahce, I.; Hoekstra, O.S.; van Dongen, G.; Boellaard, R.; Du, S.; Hayes, W.; Smith, R.; et al. Whole body PD-1 and PD-L1 positron emission tomography in patients with non-small-cell lung cancer. Nat. Commun. 2018, 9, 4664. [Google Scholar] [CrossRef] [PubMed]
- Xing, Y.; Chand, G.; Liu, C.; Cook, G.J.R.; O’Doherty, J.; Zhao, L.; Wong, N.C.L.; Meszaros, L.K.; Ting, H.H.; Zhao, J. Early Phase I Study of a (99m)Tc-Labeled Anti-Programmed Death Ligand-1 (PD-L1) Single-Domain Antibody in SPECT/CT Assessment of PD-L1 Expression in Non-Small Cell Lung Cancer. J. Nucl. Med. 2019, 60, 1213–1220. [Google Scholar] [CrossRef] [PubMed] [Green Version]
- Stutvoet, T.S.; van der Veen, E.L.; Kol, A.; Antunes, I.F.; de Vries, E.F.J.; Hospers, G.A.P.; de Vries, E.G.E.; de Jong, S.; Lub-de Hooge, M.N. Molecular imaging of PD-L1 expression and dynamics with the adnectin-based PET tracer (18)F-BMS-986192. J. Nucl. Med. 2020. [Google Scholar] [CrossRef] [PubMed]
- Li, D.; Zou, S.; Cheng, S.; Song, S.; Wang, P.; Zhu, X. Monitoring the Response of PD-L1 Expression to Epidermal Growth Factor Receptor Tyrosine Kinase Inhibitors in Nonsmall-Cell Lung Cancer Xenografts by Immuno-PET Imaging. Mol. Pharm. 2019, 16, 3469–3476. [Google Scholar] [CrossRef] [PubMed]
- Finn, R.S.; Qin, S.; Ikeda, M.; Galle, P.R.; Ducreux, M.; Kim, T.Y.; Kudo, M.; Breder, V.; Merle, P.; Kaseb, A.O.; et al. Atezolizumab plus Bevacizumab in Unresectable Hepatocellular Carcinoma. N. Engl. J. Med. 2020, 382, 1894–1905. [Google Scholar] [CrossRef]
- Narayan, P.; Wahby, S.; Gao, J.J.; Amiri-Kordestani, L.; Ibrahim, A.; Bloomquist, E.; Tang, S.; Xu, Y.; Liu, J.; Fu, W.; et al. FDA Approval Summary: Atezolizumab Plus Paclitaxel Protein-bound for the Treatment of Patients with Advanced or Metastatic TNBC Whose Tumors Express PD-L1. Clin. Cancer Res. 2020, 26, 2284–2289. [Google Scholar] [CrossRef] [Green Version]
- Suzman, D.L.; Agrawal, S.; Ning, Y.M.; Maher, V.E.; Fernandes, L.L.; Karuri, S.; Tang, S.; Sridhara, R.; Schroeder, J.; Goldberg, K.B.; et al. FDA Approval Summary: Atezolizumab or Pembrolizumab for the Treatment of Patients with Advanced Urothelial Carcinoma Ineligible for Cisplatin-Containing Chemotherapy. Oncologist 2019, 24, 563–569. [Google Scholar] [CrossRef] [Green Version]
- Kaufman, H.L.; Russell, J.; Hamid, O.; Bhatia, S.; Terheyden, P.; D’Angelo, S.P.; Shih, K.C.; Lebbe, C.; Linette, G.P.; Milella, M.; et al. Avelumab in patients with chemotherapy-refractory metastatic Merkel cell carcinoma: A multicentre, single-group, open-label, phase 2 trial. Lancet Oncol. 2016, 17, 1374–1385. [Google Scholar] [CrossRef] [Green Version]
- Patel, M.R.; Ellerton, J.; Infante, J.R.; Agrawal, M.; Gordon, M.; Aljumaily, R.; Britten, C.D.; Dirix, L.; Lee, K.W.; Taylor, M.; et al. Avelumab in metastatic urothelial carcinoma after platinum failure (JAVELIN Solid Tumor): Pooled results from two expansion cohorts of an open-label, phase 1 trial. Lancet Oncol. 2018, 19, 51–64. [Google Scholar] [CrossRef]
- Powles, T.; O’Donnell, P.H.; Massard, C.; Arkenau, H.T.; Friedlander, T.W.; Hoimes, C.J.; Lee, J.L.; Ong, M.; Sridhar, S.S.; Vogelzang, N.J.; et al. Efficacy and Safety of Durvalumab in Locally Advanced or Metastatic Urothelial Carcinoma: Updated Results From a Phase 1/2 Open-label Study. JAMA Oncol. 2017, 3, e172411. [Google Scholar] [CrossRef] [PubMed]
- Antonia, S.J.; Villegas, A.; Daniel, D.; Vicente, D.; Murakami, S.; Hui, R.; Yokoi, T.; Chiappori, A.; Lee, K.H.; de Wit, M.; et al. Durvalumab after Chemoradiotherapy in Stage III Non-Small-Cell Lung Cancer. N. Engl. J. Med. 2017, 377, 1919–1929. [Google Scholar] [CrossRef] [PubMed]
- Brahmer, J.R.; Tykodi, S.S.; Chow, L.Q.; Hwu, W.J.; Topalian, S.L.; Hwu, P.; Drake, C.G.; Camacho, L.H.; Kauh, J.; Odunsi, K.; et al. Safety and activity of anti-PD-L1 antibody in patients with advanced cancer. N. Engl. J. Med. 2012, 366, 2455–2465. [Google Scholar] [CrossRef] [Green Version]
- Simon, G.M.; Niphakis, M.J.; Cravatt, B.F. Determining target engagement in living systems. Nat. Chem. Biol. 2013, 9, 200–205. [Google Scholar] [CrossRef] [Green Version]
- Dubach, J.M.; Kim, E.; Yang, K.; Cuccarese, M.; Giedt, R.J.; Meimetis, L.G.; Vinegoni, C.; Weissleder, R. Quantitating drug-target engagement in single cells in vitro and in vivo. Nat. Chem. Biol. 2017, 13, 168–173. [Google Scholar] [CrossRef]
- Agoram, B.M. Use of pharmacokinetic/ pharmacodynamic modelling for starting dose selection in first-in-human trials of high-risk biologics. Br. J. Clin. Pharmacol. 2009, 67, 153–160. [Google Scholar] [CrossRef] [Green Version]
- Agoram, B.M.; Martin, S.W.; van der Graaf, P.H. The role of mechanism-based pharmacokinetic-pharmacodynamic (PK-PD) modelling in translational research of biologics. Drug Discov. Today 2007, 12, 1018–1024. [Google Scholar] [CrossRef]
- Topalian, S.L. Targeting Immune Checkpoints in Cancer Therapy. JAMA 2017, 318, 1647–1648. [Google Scholar] [CrossRef]
- Kumar, D.; Lisok, A.; Dahmane, E.; McCoy, M.; Shelake, S.; Chatterjee, S.; Allaj, V.; Sysa-Shah, P.; Wharram, B.; Lesniak, W.G.; et al. Peptide-based PET quantifies target engagement of PD-L1 therapeutics. J. Clin. Investig. 2019, 129, 616–630. [Google Scholar] [CrossRef] [Green Version]
- Giesen, D.; Broer, L.N.; Lub-de Hooge, M.N.; Popova, I.; Howng, B.; Nguyen, M.; Vasiljeva, O.; de Vries, E.G.E.; Pool, M. Probody therapeutic design of 89Zr-CX-072 promotes accumulation in PD-L1 expressing tumors compared to normal murine lymphoid tissue. Clin. Cancer Res. 2020. [Google Scholar] [CrossRef]
- Francisco, L.M.; Sage, P.T.; Sharpe, A.H. The PD-1 pathway in tolerance and autoimmunity. Immunol. Rev. 2010, 236, 219–242. [Google Scholar] [CrossRef]
- Dong, H.; Strome, S.E.; Matteson, E.L.; Moder, K.G.; Flies, D.B.; Zhu, G.; Tamura, H.; Driscoll, C.L.; Chen, L. Costimulating aberrant T cell responses by B7-H1 autoantibodies in rheumatoid arthritis. J. Clin. Investig. 2003, 111, 363–370. [Google Scholar] [CrossRef] [Green Version]
- Nakazawa, A.; Dotan, I.; Brimnes, J.; Allez, M.; Shao, L.; Tsushima, F.; Azuma, M.; Mayer, L. The expression and function of costimulatory molecules B7H and B7-H1 on colonic epithelial cells. Gastroenterology 2004, 126, 1347–1357. [Google Scholar] [CrossRef]
- Muhlbauer, M.; Fleck, M.; Schutz, C.; Weiss, T.; Froh, M.; Blank, C.; Scholmerich, J.; Hellerbrand, C. PD-L1 is induced in hepatocytes by viral infection and by interferon-alpha and -gamma and mediates T cell apoptosis. J. Hepatol. 2006, 45, 520–528. [Google Scholar] [CrossRef]
Figure 1.
WL12 binding interactions with PD-L1 overlap with those of PD-1. (A) Structural representation of WL12 and its analogs; (B) predicted binding mode of WL12 to PD-L1. WL12 forms a beta sheet-like structure in the groove of PD-L1. WL12 is shown in cyan. The surface representation of PD-L1 is shown in gray, with the ribbons and key side chains shown in magenta; WL12 mimics PD-1 binding to PD-L1. The structure of PD-1 is shown in teal. The two main interacting beta strands of PD-1 overlap well with the conformation adopted by WL12 bound to PD-L1. (C) NSG mice with hPD-L1 (red arrow) and CHO tumors (blue arrow) were administered intravenously with 150 μCi of [64Cu]WL12 and images were acquired at 10, 60, and 120 min after the injection of the radiotracer. 3D volume rendered images show specific accumulation of [64Cu]WL12 in hPD-L1 tumors. (D) PD-L1 IHC shows strong immunoreactivity (brown color) in hPD-L1 tumors (from [153]).

Figure 2.
89Zr-atezolizumab tumor uptake. (a) Examples of PET/CT images of four patients illustrating 89Zr-atezolizumab tumor uptake in five different locations on day 7 post injection (white arrows indicate tumor lesions; PET scans were performed once per patient and time point). Images (i) and (ii) are from the same patient, whereas images (iii), (iv), and (v) are from a separate patients. (b) Overview of 89Zr-atezolizumab uptake as SUVmax at day 7 post injection in 196 tumor lesions with a diameter >2 cm grouped per tumor type and ordered by increasing geometric mean SUVmax per patient, visualizing tumor size and site, and with blood pool background uptake as reference. Horizontal bar indicates geometric mean SUVmax per patient. (c) Violin plot of actual distribution of SUVmax in lesions per site of lesion with bottom and top 1% of SUVmax values truncated (first, fiftieth, and ninety-ninth SUVmax percentiles: 1.7, 7.9, 19.6 for lung; 3.9, 5.6, 16.4 for bone; 4.6, 9.7, 40.1 for lymph node; 16.1, 23.3, 34.1 for liver); black vertical lines are 95% CIs of geometric mean SUVmax; white dots within black lines and values below the violin plot are the actual geometric means, all based on a linear mixed regression model with two-sided Wald p values using Satterthwaite approximations to degrees of freedom under restricted maximum likelihood, shown above the graph; nlung = 44 in ten patients, nbone = 62 in nine patients, nlymph node = 54 in 20 patients, nliver = 19 in one patient. (d) Violin plot of SUVmax in lesions per tumor type with bottom and top 1% of SUVmax values truncated (first, fiftieth, and ninety-ninth SUVmax percentiles: 3.6, 10.9, 38.0 for bladder; 1.7, 9.7, 19.6 for NSCLC; 3.4, 5.6, 11.7 for TNBC); black vertical lines are 95% CIs of geometric mean SUVmax; white dots within black lines and values below the violin plot are the actual geometric means, all based on a linear mixed regression model with two-sided Wald p values using Satterthwaite approximations to degrees of freedom under restricted maximum likelihood, shown above the graph; nbladder = 85 in nine patients, nNSCLC = 43 in nine patients, nTNBC = 68 in four patients from [155].

Figure 3.
18F-BMS-986192 tumor uptake in patients. Patient 2 with tumor with PD-L1 expression > 95% (left panel). 18F-BMS-986192 PET (145.7 MBq, imaging time point 1 h post injection (p.i.)) demonstrates heterogeneous tracer uptake within and between tumors. Patient 3 with tumor PD-L1 expression < 1% (right panel). 18F-BMS-986192 PET (214.62 MBq, 1 h p.i.) demonstrates low tumor tracer uptake. Physiological expression=driven uptake in the spleen and non-specific uptake in the liver were observed with 18F-BMS-986192. Red and blue in the images represent maximum and minimum accumulated radioactivity, respectively, if a rainbow color scale is used(from [156]).

Figure 4.
Tumor PD-L1 engagement by 3 distinct PD-L1 therapeutic antibodies quantified using [64Cu] WL12. (A–E) [64Cu]WL12 uptake in MDA-MB-231 xenografts is significantly reduced in mice receiving AtzMab (20 mg/kg), AveMab (10 mg/kg), or DurMab (10 mg/kg) 24 h prior to radiotracer injection. Whole-body volume-rendered [64Cu]WL12 PET-CT images of saline- (A) AtzMab- (B) AveMab- (C) and DurMab-treated (D) mice, and ex vivo biodistribution (E) at 2 h after [64Cu]WL12 injection (n = 6–9/group). (F) IHC staining for PD-L1 in the corresponding tumor. Scale bars: 100 μm. Box-and-whisker graphs showing minimum to maximum and all data points, with the horizontal line representing the median. **** p < 0.0001; NS, not significant, by 1-way ANOVA and Dunnett’s multiple comparisons test in E (From [173]).


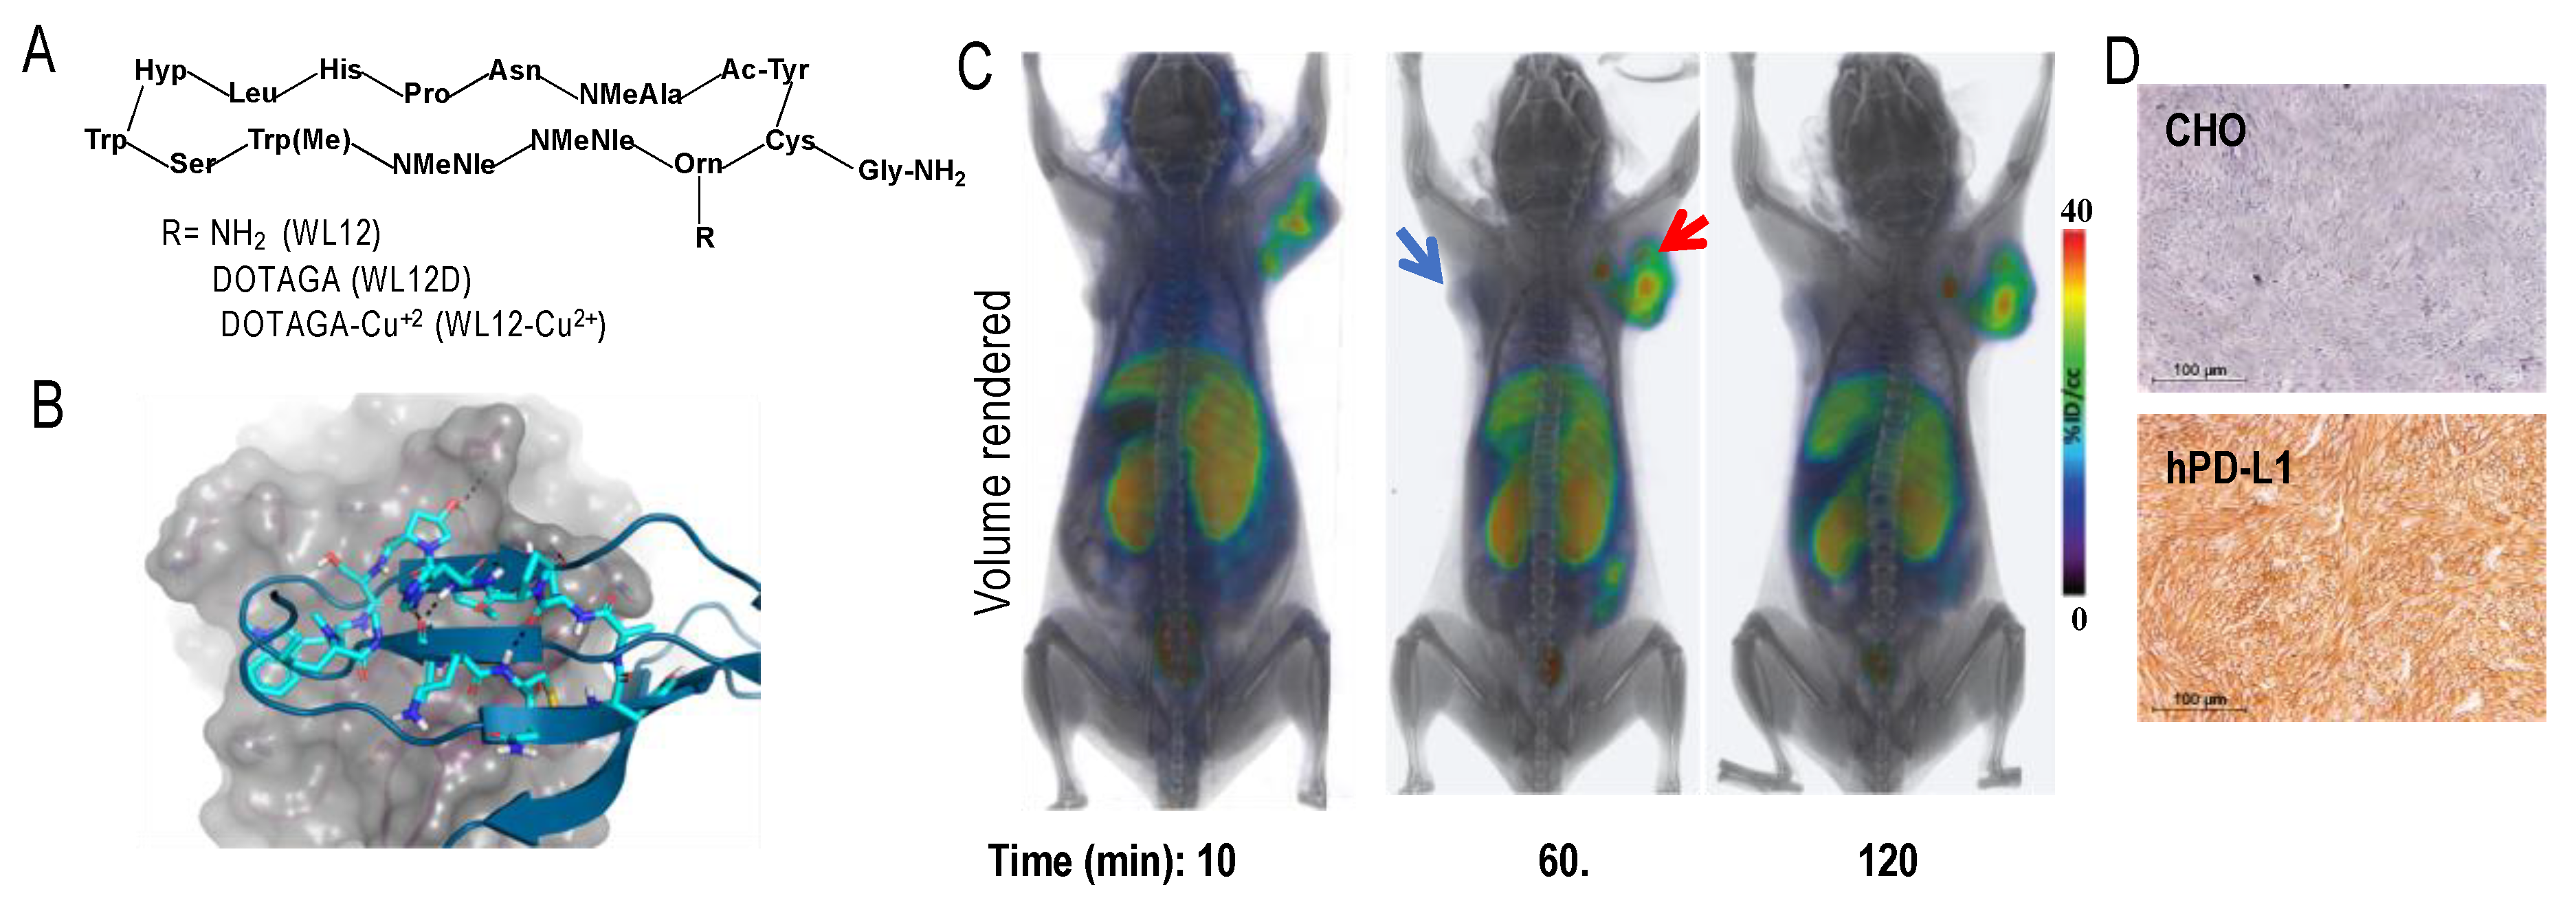
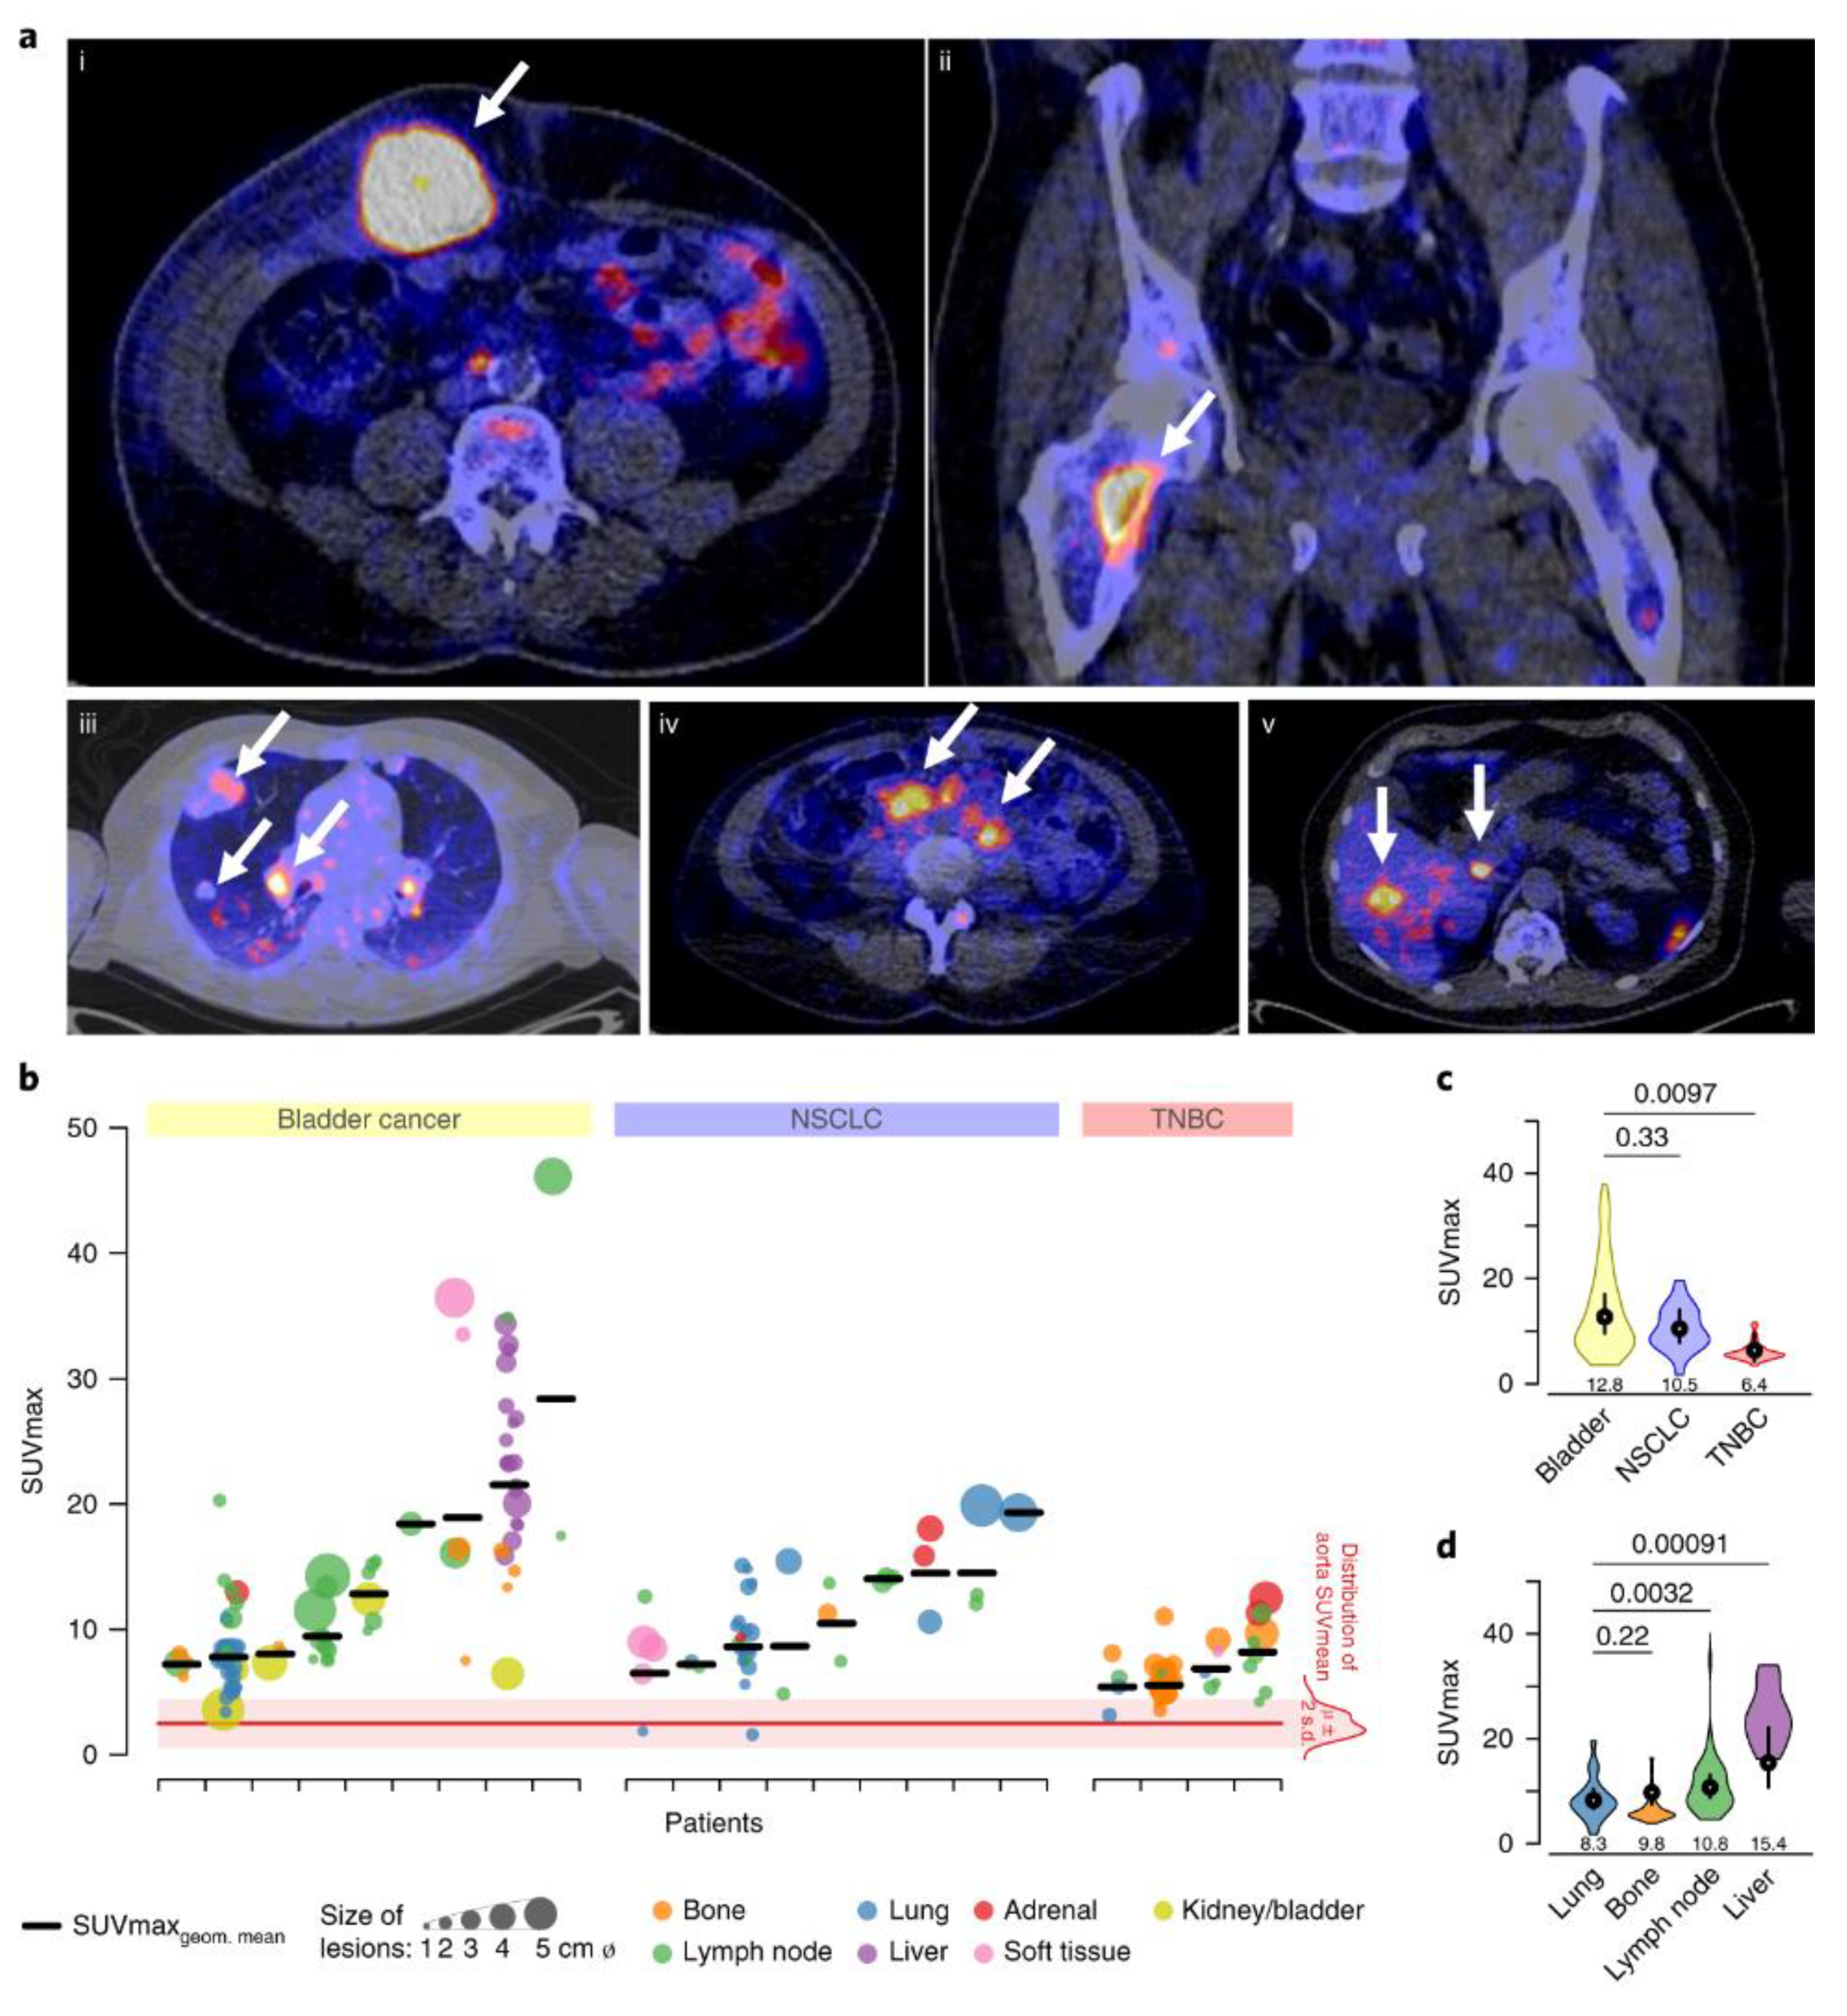
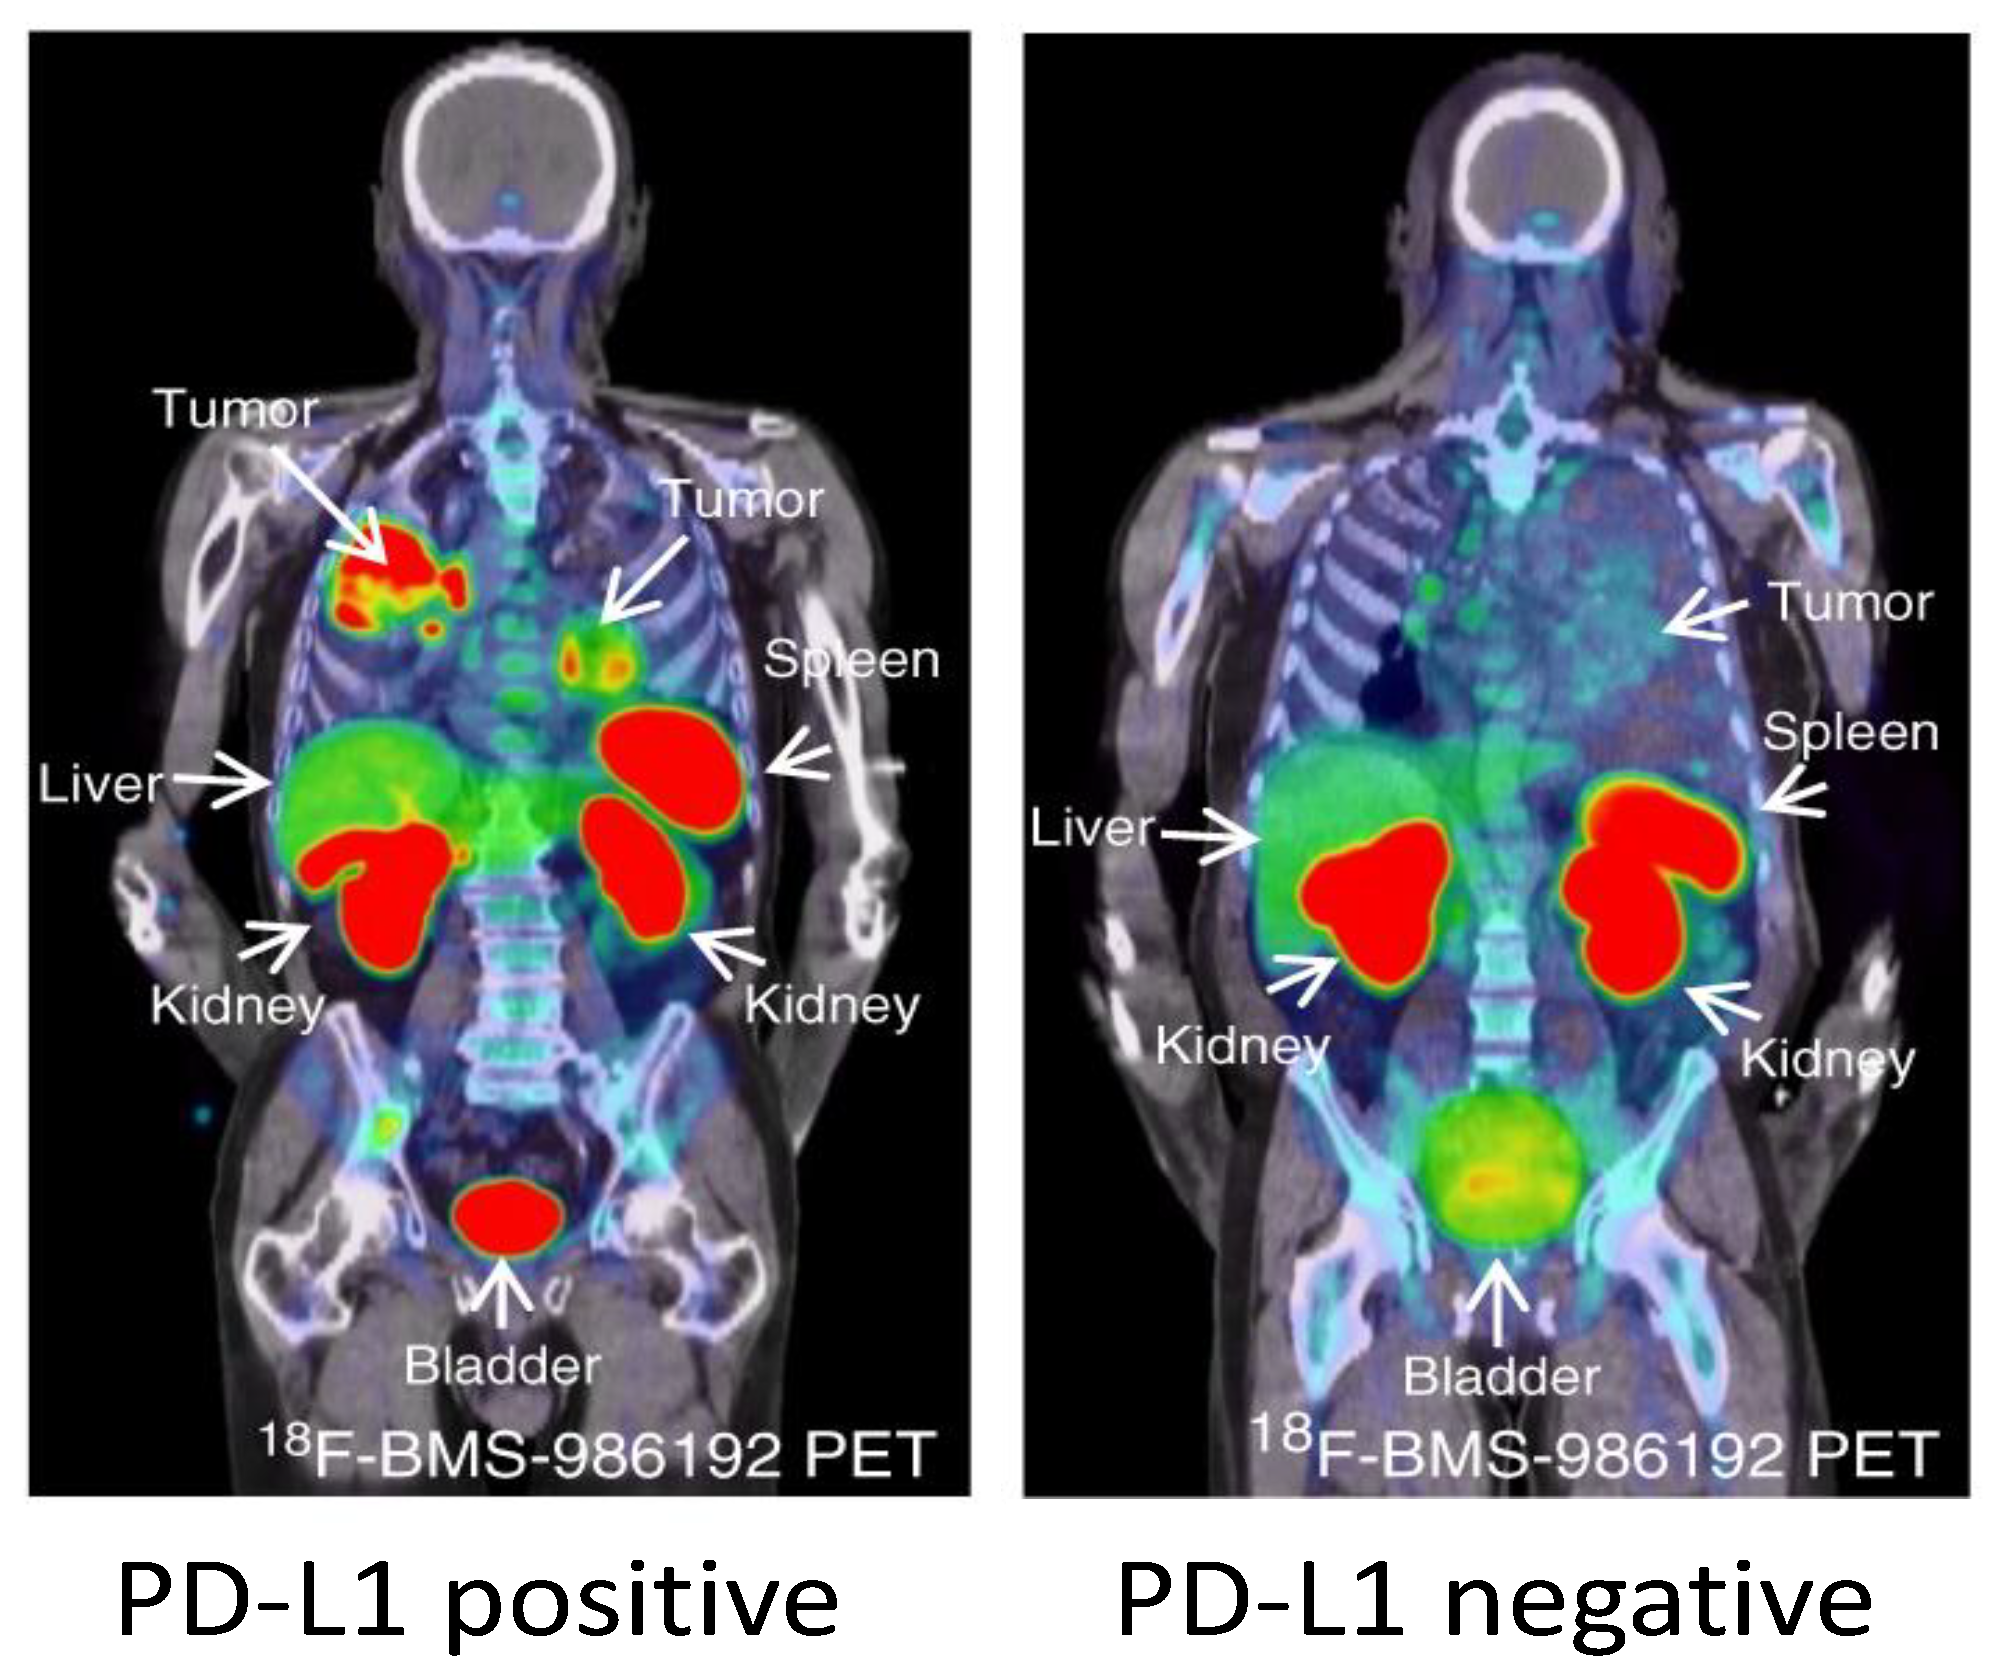
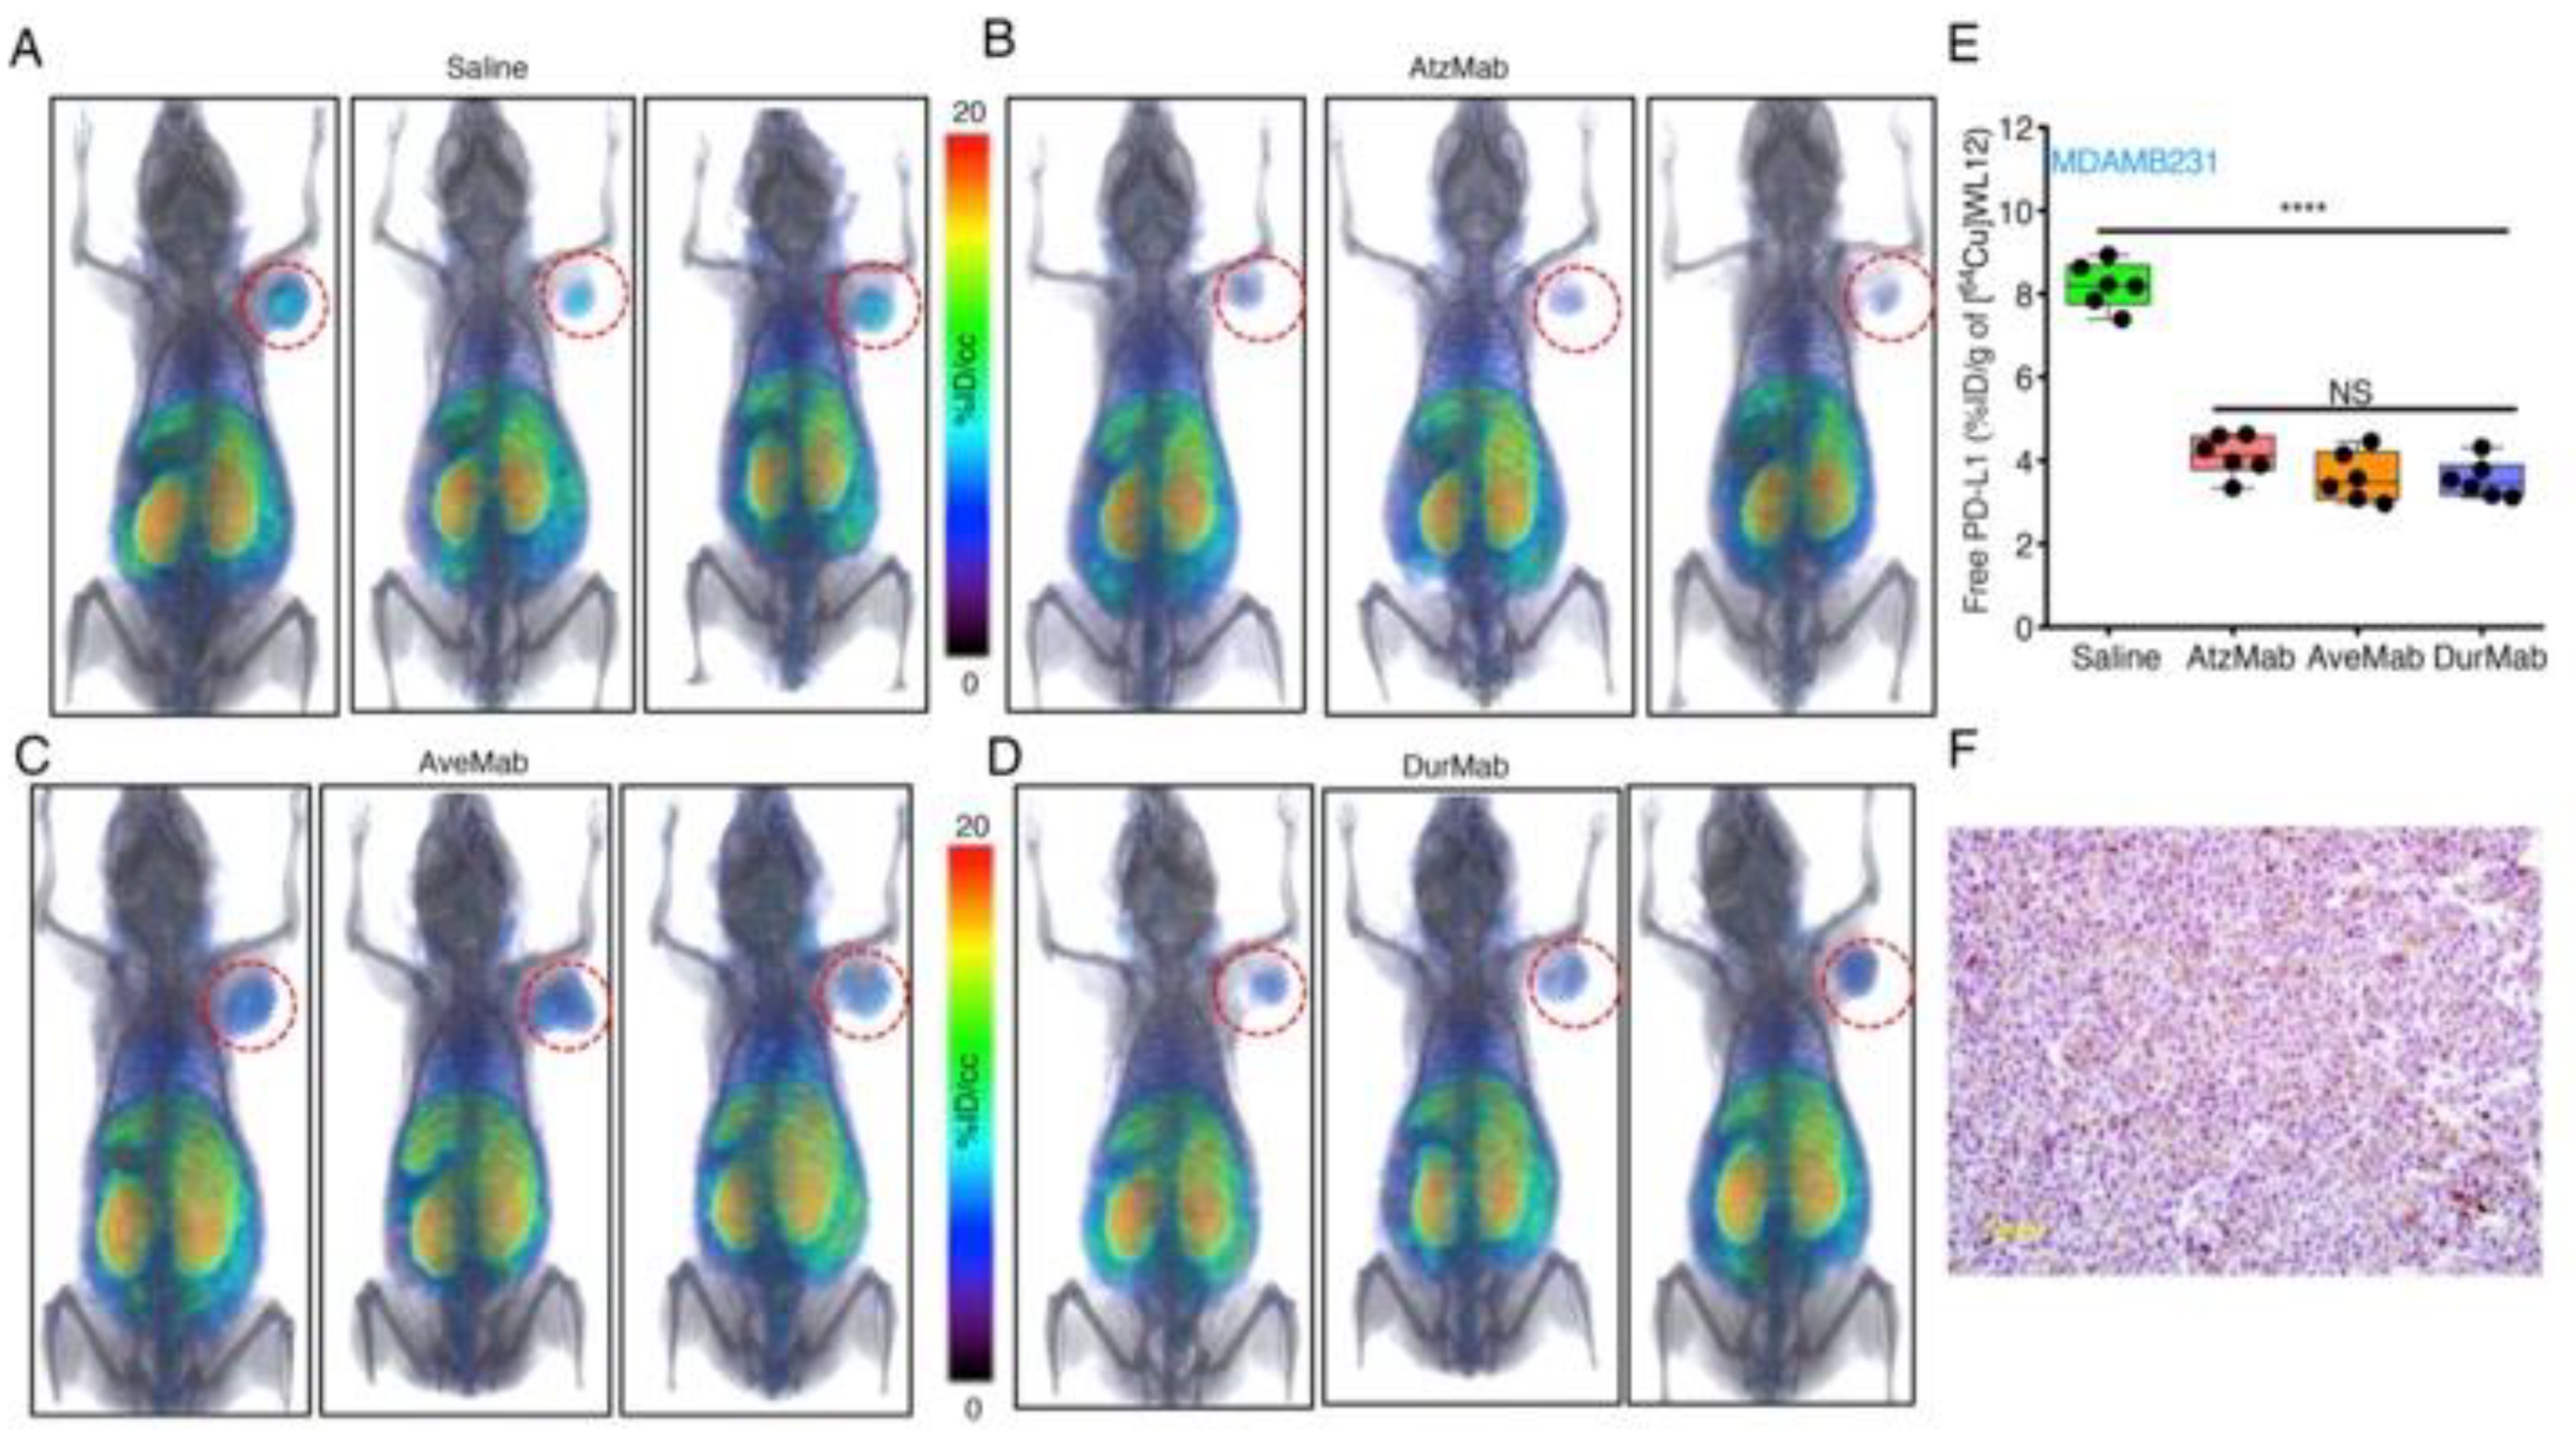
Table 1.
Regulators of PD-L1.
| Type | Regulators of PD-L1 | Change in PD-L1 Levels | References |
|---|---|---|---|
| Genetic alteration | amplifications translocations disruption of 3′ UTR region | ↑ | [14,15,16] |
| Oncogenic signaling | CDK5 STAT3 PTEN loss MEK RAS EGFR ALK MYC | ↑ | [18,20,21,24,61,62,63] |
| Inflammatory signaling | INF-γ INF-α IFN-β TNFα TGF-β | ↑ | [5,28,29,54,64] |
| Post-translational modifications | CMTM6 CMTM4 CSN5 palmitoylation | ↑ | [48,49,54,56,57,58] |
| GSK3-β CDK4 | ↓ |
Publisher’s Note: MDPI stays neutral with regard to jurisdictional claims in published maps and institutional affiliations. |
© 2020 by the author. Licensee MDPI, Basel, Switzerland. This article is an open access article distributed under the terms and conditions of the Creative Commons Attribution (CC BY) license (http://creativecommons.org/licenses/by/4.0/).
Share and Cite
MDPI and ACS Style
Nimmagadda, S. Quantifying PD-L1 Expression to Monitor Immune Checkpoint Therapy: Opportunities and Challenges. Cancers 2020, 12, 3173. https://doi.org/10.3390/cancers12113173
AMA Style
Nimmagadda S. Quantifying PD-L1 Expression to Monitor Immune Checkpoint Therapy: Opportunities and Challenges. Cancers. 2020; 12(11):3173. https://doi.org/10.3390/cancers12113173
Chicago/Turabian StyleNimmagadda, Sridhar. 2020. "Quantifying PD-L1 Expression to Monitor Immune Checkpoint Therapy: Opportunities and Challenges" Cancers 12, no. 11: 3173. https://doi.org/10.3390/cancers12113173
Note that from the first issue of 2016, this journal uses article numbers instead of page numbers. See further details here.