
Effect of Laser-Induced Heating on Raman Measurement within a Silicon Microfluidic Channel

Abstract
:1. Introduction
2. Numerical Simulations
2.1. Preliminaries Prior to Modeling
2.2. Physical Model, Computational Equations and Boundary Conditions
- (1)
- Steady-state (its reasonableness is discussed in Section 4.4), laminar and incompressible flow;
- (2)
- Negligible radiation heat transfer;
- (3)
- Negligible buoyancy;
- (4)
- Constant fluid and solid (silicon) properties;
- (5)
- Negligible viscous heating;
- (6)
- Pyrex glass layer was not explicitly modeled due to its low thermal conductivity;
- (7)
- Only half of the geometry was represented due to the symmetry of the domain;
- (8)
- Gaussian laser beam profile.

- Uniform velocity profile at the inlet (the difference between the uniform and parabolic assumption has been proven to be negligible in our case);
- Constant pressure of 1 bar at the outlet;
- Non-Slip boundary conditions at all walls.
- Constant temperature (T = 296.15 K) at the inlet and dT/dx = 0 at the outlet;
- Adiabatic condition at the fluid-Pyrex boundary (top of the chip);
- The continuity of the temperature and heat flux is automatically used in the CFX code as conjugate boundary conditions to couple the energy equations for the fluid and solid phases. It is defined as Equation (5) at the fluid–solid interface.
- Heat source: a heat flux centered on the solid side of the fluid-solid interface (marked in Figure 1). The heat flux was specified as the absorbed energy with a function of r. The function was conducted from the laser beam intensity form with Gaussian profile:where ω0 is defined by I(ω0) = I0/e, and the diameter of illuminated area defined in our study is d = 2ω0. Then, the total laser power at the surface is:
- The energy absorbed in the solid is:
- Adiabatic condition at the silicon-Pyrex boundary;
- Free convective heat transfer with surrounding air at the lateral walls and underside of the solid. Both the ambient and initial solid temperature was 296.15 K. The free convective heat transfer coefficient hfc was estimated at 10 W·m−2·K−1. This hfc value is close enough due to the relatively minor effect of the heat loss [33].
2.3. Methodology of Orthogonal Array (OA) Analysis

| Simulations | Factors | Simulations | Factors | ||||||||||||||||||||
|---|---|---|---|---|---|---|---|---|---|---|---|---|---|---|---|---|---|---|---|---|---|---|---|
| A | B | C | D | E | F | G | H | I | J | K | A | B | C | D | E | F | G | H | I | J | K | ||
| No. 1 | 1 | 1 | 1 | 1 | 1 | 1 | 1 | 1 | 1 | 1 | 1 | No. 26 | 1 | 1 | 1 | 4 | 5 | 4 | 3 | 2 | 5 | 2 | 3 |
| No. 2 | 1 | 2 | 2 | 2 | 2 | 2 | 2 | 2 | 2 | 2 | 2 | No. 27 | 1 | 2 | 2 | 5 | 1 | 5 | 4 | 3 | 1 | 3 | 4 |
| No. 3 | 1 | 3 | 3 | 3 | 3 | 3 | 3 | 3 | 3 | 3 | 3 | No. 28 | 1 | 3 | 3 | 1 | 2 | 1 | 5 | 4 | 2 | 4 | 5 |
| No. 4 | 1 | 4 | 4 | 4 | 4 | 4 | 4 | 4 | 4 | 4 | 4 | No. 29 | 1 | 4 | 4 | 2 | 3 | 2 | 1 | 5 | 3 | 5 | 1 |
| No. 5 | 1 | 5 | 5 | 5 | 5 | 5 | 5 | 5 | 5 | 5 | 5 | No. 30 | 1 | 5 | 5 | 3 | 4 | 3 | 2 | 1 | 4 | 1 | 2 |
| No. 6 | 2 | 1 | 2 | 3 | 4 | 5 | 1 | 2 | 3 | 4 | 5 | No. 31 | 2 | 1 | 2 | 1 | 3 | 3 | 2 | 4 | 5 | 5 | 4 |
| No. 7 | 2 | 2 | 3 | 4 | 5 | 1 | 2 | 3 | 4 | 5 | 1 | No. 32 | 2 | 2 | 3 | 2 | 4 | 4 | 3 | 5 | 1 | 1 | 5 |
| No. 8 | 2 | 3 | 4 | 5 | 1 | 2 | 3 | 4 | 5 | 1 | 2 | No. 33 | 2 | 3 | 4 | 3 | 5 | 5 | 4 | 1 | 2 | 2 | 1 |
| No. 9 | 2 | 4 | 5 | 1 | 2 | 3 | 4 | 5 | 1 | 2 | 3 | No. 34 | 2 | 4 | 5 | 4 | 1 | 1 | 5 | 2 | 3 | 3 | 2 |
| No. 10 | 2 | 5 | 1 | 2 | 3 | 4 | 5 | 1 | 2 | 3 | 4 | No. 35 | 2 | 5 | 1 | 5 | 2 | 2 | 1 | 3 | 4 | 4 | 3 |
| No. 11 | 3 | 1 | 3 | 5 | 2 | 4 | 4 | 1 | 3 | 5 | 2 | No. 36 | 3 | 1 | 3 | 3 | 1 | 2 | 5 | 5 | 4 | 2 | 4 |
| No. 12 | 3 | 2 | 4 | 1 | 3 | 5 | 5 | 2 | 4 | 1 | 3 | No. 37 | 3 | 2 | 4 | 4 | 2 | 3 | 1 | 1 | 5 | 3 | 5 |
| No. 13 | 3 | 3 | 5 | 2 | 4 | 1 | 1 | 3 | 5 | 2 | 4 | No. 38 | 3 | 3 | 5 | 5 | 3 | 4 | 2 | 2 | 1 | 4 | 1 |
| No. 14 | 3 | 4 | 1 | 3 | 5 | 2 | 2 | 4 | 1 | 3 | 5 | No. 39 | 3 | 4 | 1 | 1 | 4 | 5 | 3 | 3 | 2 | 5 | 2 |
| No. 15 | 3 | 5 | 2 | 4 | 1 | 3 | 3 | 5 | 2 | 4 | 1 | No. 40 | 3 | 5 | 2 | 2 | 5 | 1 | 4 | 4 | 3 | 1 | 3 |
| No. 16 | 4 | 1 | 4 | 2 | 5 | 3 | 5 | 3 | 1 | 4 | 2 | No. 41 | 4 | 1 | 4 | 5 | 4 | 1 | 2 | 5 | 2 | 3 | 3 |
| No. 17 | 4 | 2 | 5 | 3 | 1 | 4 | 1 | 4 | 2 | 5 | 3 | No. 42 | 4 | 2 | 5 | 1 | 5 | 2 | 3 | 1 | 3 | 4 | 4 |
| No. 18 | 4 | 3 | 1 | 4 | 2 | 5 | 2 | 5 | 3 | 1 | 4 | No. 43 | 4 | 3 | 1 | 2 | 1 | 3 | 4 | 2 | 4 | 5 | 5 |
| No. 19 | 4 | 4 | 2 | 5 | 3 | 1 | 3 | 1 | 4 | 2 | 5 | No. 44 | 4 | 4 | 2 | 3 | 2 | 4 | 5 | 3 | 5 | 1 | 1 |
| No. 20 | 4 | 5 | 3 | 1 | 4 | 2 | 4 | 2 | 5 | 3 | 1 | No. 45 | 4 | 5 | 3 | 4 | 3 | 5 | 1 | 4 | 1 | 2 | 2 |
| No. 21 | 5 | 1 | 5 | 4 | 3 | 2 | 4 | 3 | 2 | 1 | 5 | No. 46 | 5 | 1 | 5 | 2 | 2 | 5 | 3 | 4 | 4 | 3 | 1 |
| No. 22 | 5 | 2 | 1 | 5 | 4 | 3 | 5 | 4 | 3 | 2 | 1 | No. 47 | 5 | 2 | 1 | 3 | 3 | 1 | 4 | 5 | 5 | 4 | 2 |
| No. 23 | 5 | 3 | 2 | 1 | 5 | 4 | 1 | 5 | 4 | 3 | 2 | No. 48 | 5 | 3 | 2 | 4 | 4 | 2 | 5 | 1 | 1 | 5 | 3 |
| No. 24 | 5 | 4 | 3 | 2 | 1 | 5 | 2 | 1 | 5 | 4 | 3 | No. 49 | 5 | 4 | 3 | 5 | 5 | 3 | 1 | 2 | 2 | 1 | 4 |
| No. 25 | 5 | 5 | 4 | 3 | 2 | 1 | 3 | 2 | 1 | 5 | 4 | No. 50 | 5 | 5 | 4 | 1 | 1 | 4 | 2 | 3 | 3 | 2 | 5 |
| Level | Factors | ||||||||||
|---|---|---|---|---|---|---|---|---|---|---|---|
| A | B | C | D | E | F | G | H | I | J | K | |
| 1 | 0.5 | 1 | 0.01 | 494 | 0.1 | 1.05 | 0.104 | 30 | 100 | 25 | 0.49 |
| 2 | 1 | 2 | 0.025 | 867 | 0.55 | 1.72 | 0.151 | 60 | 300 | 64 | 0.64 |
| 3 | 2.5 | 3 | 0.05 | 997 | 0.89 | 2.36 | 0.268 | 80 | 500 | 100 | 1 |
| 4 | 5 | 4 | 0.075 | 1261 | 1.53 | 3.06 | 0.285 | 100 | 600 | 144 | 1.5625 |
| 5 | 10 | 5 | 0.1 | 1584 | 1.92 | 4.19 | 0.6069 | 120 | 800 | 225 | 1.96 |
3. Experimental Section

4. Results and Discussion
4.1. General

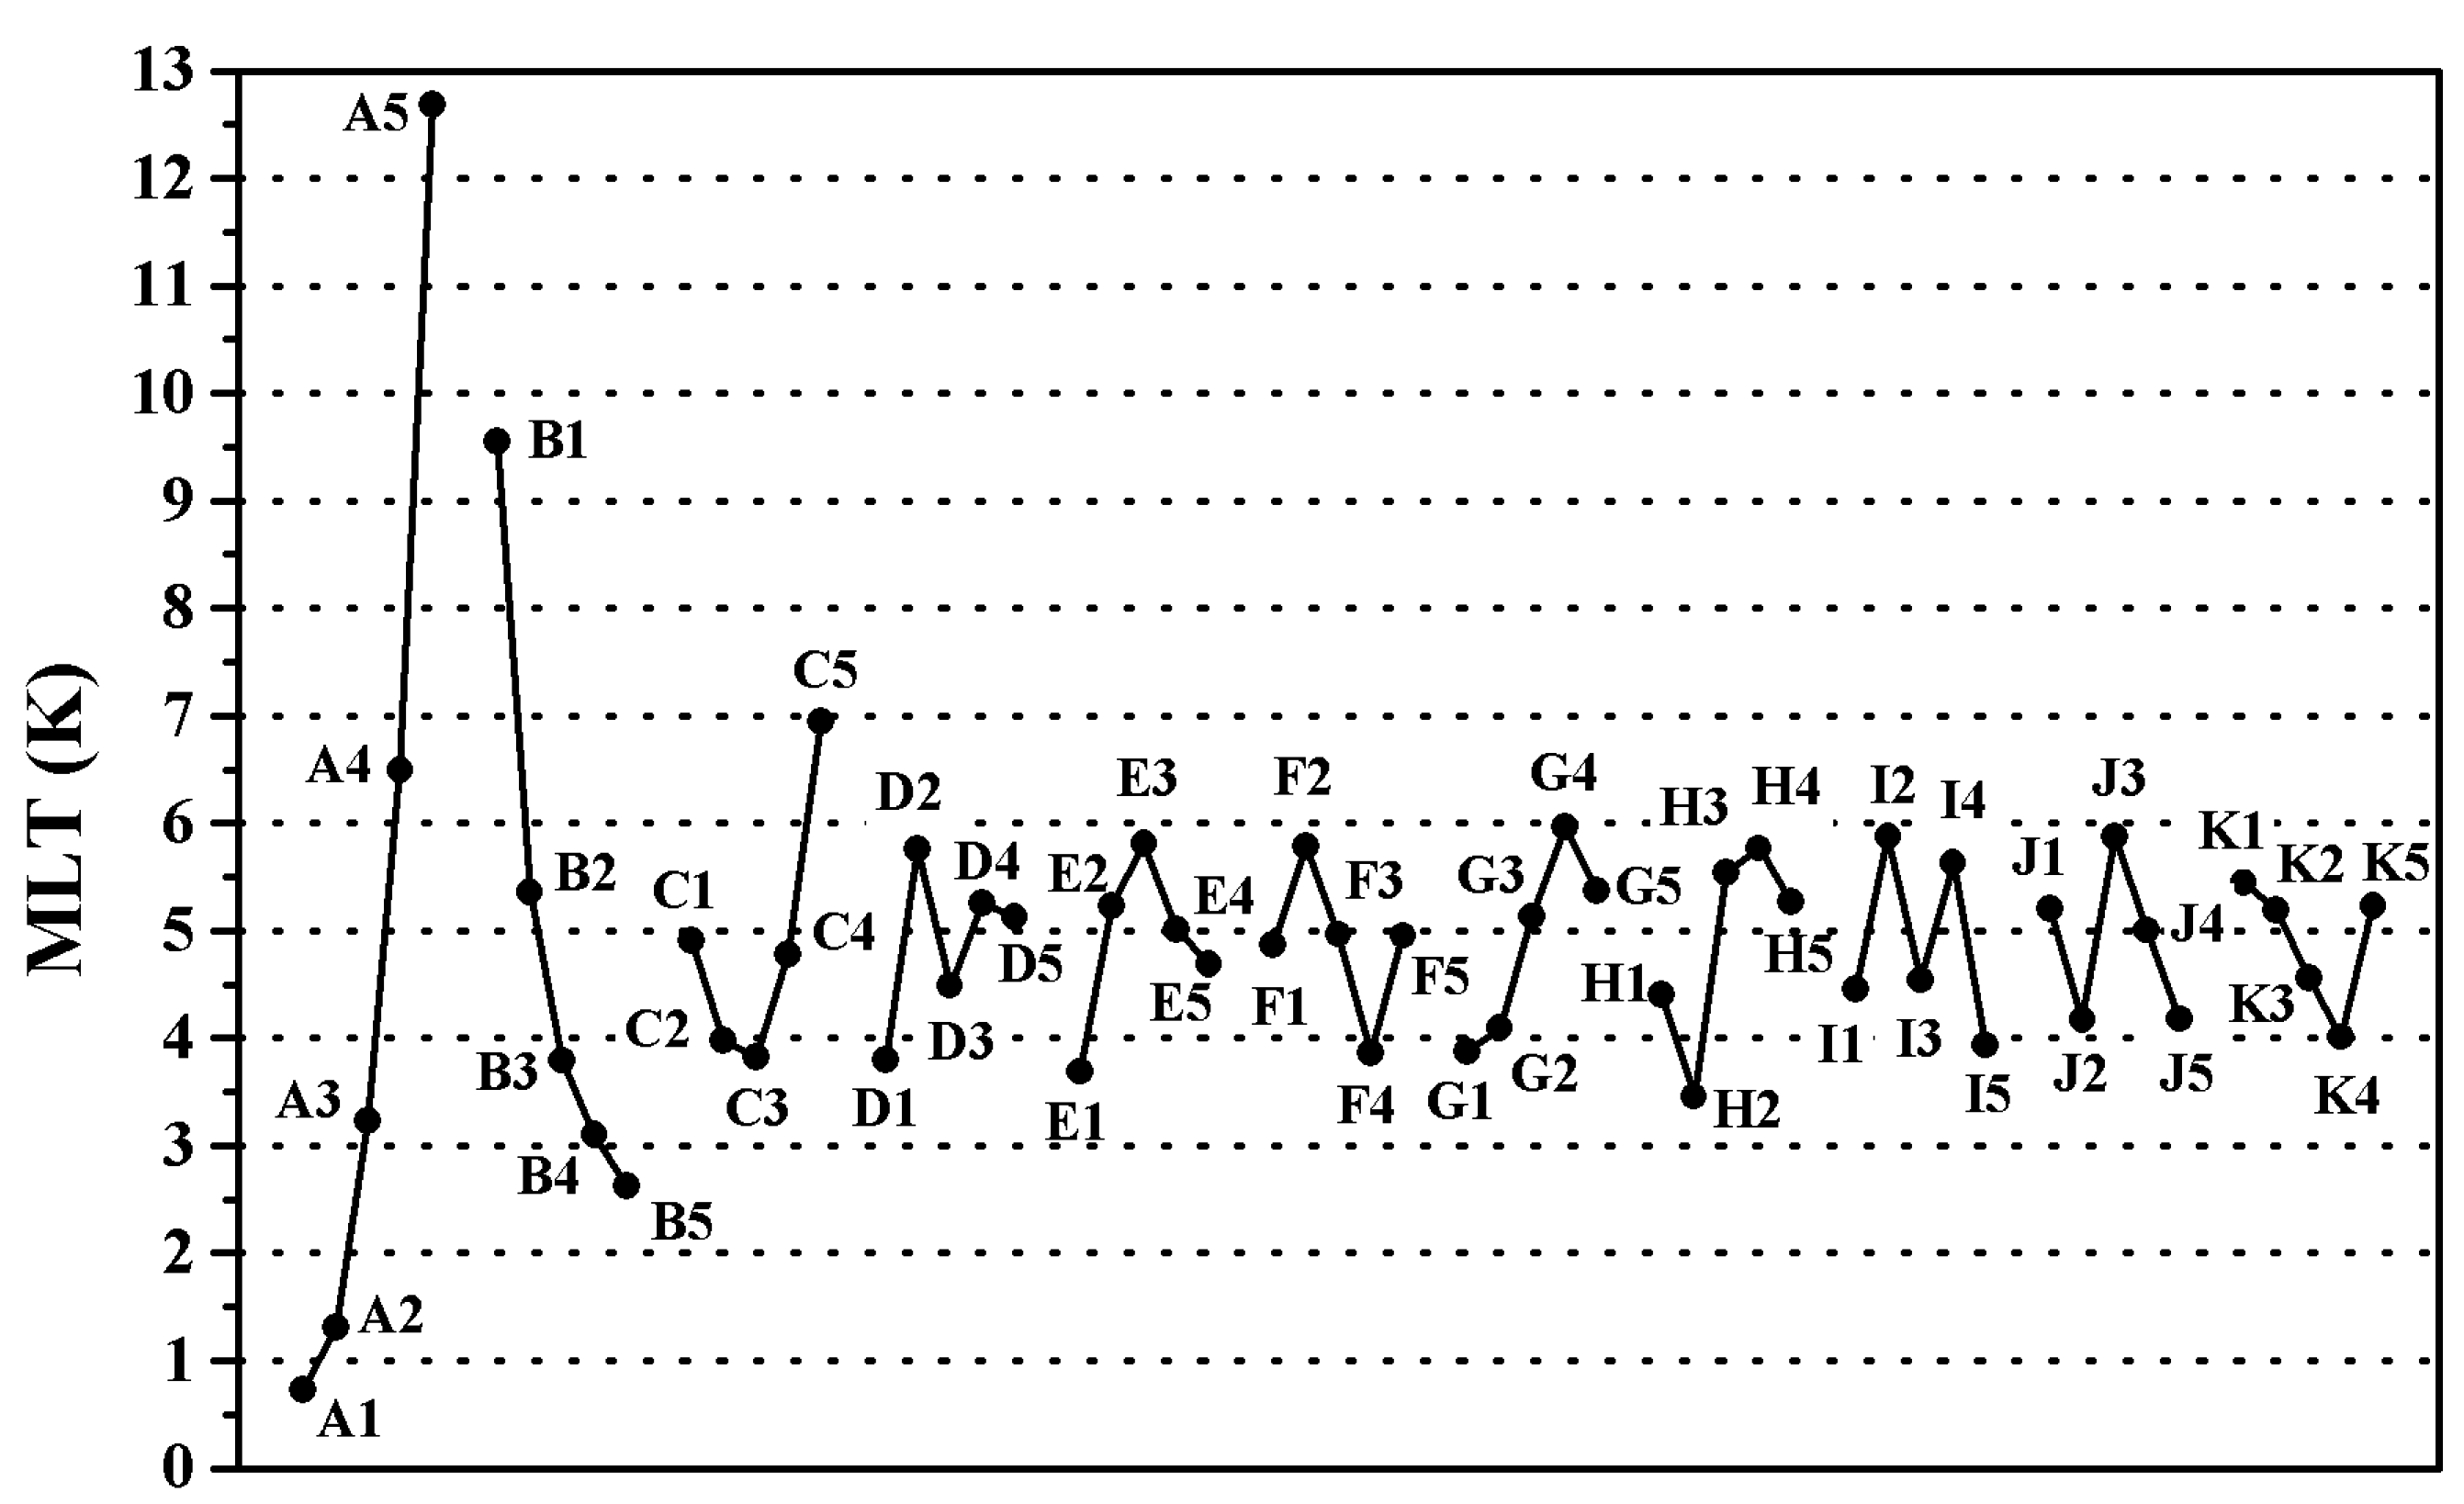
4.2. OA Analysis

| Factors | A | B | C | D | E | F | G | H | I | J | K |
|---|---|---|---|---|---|---|---|---|---|---|---|
| SS * | 961.935 | 315.083 | 62.373 | 23.04 | 24.621 | 18.631 | 31.063 | 36.248 | 27.455 | 21.068 | 13.979 |
| Contribution | 62.6% | 20.5% | 4.1% | 1.5% | 1.6% | 1.2% | 2.0% | 2.4% | 1.8% | 1.4% | 0.9% |
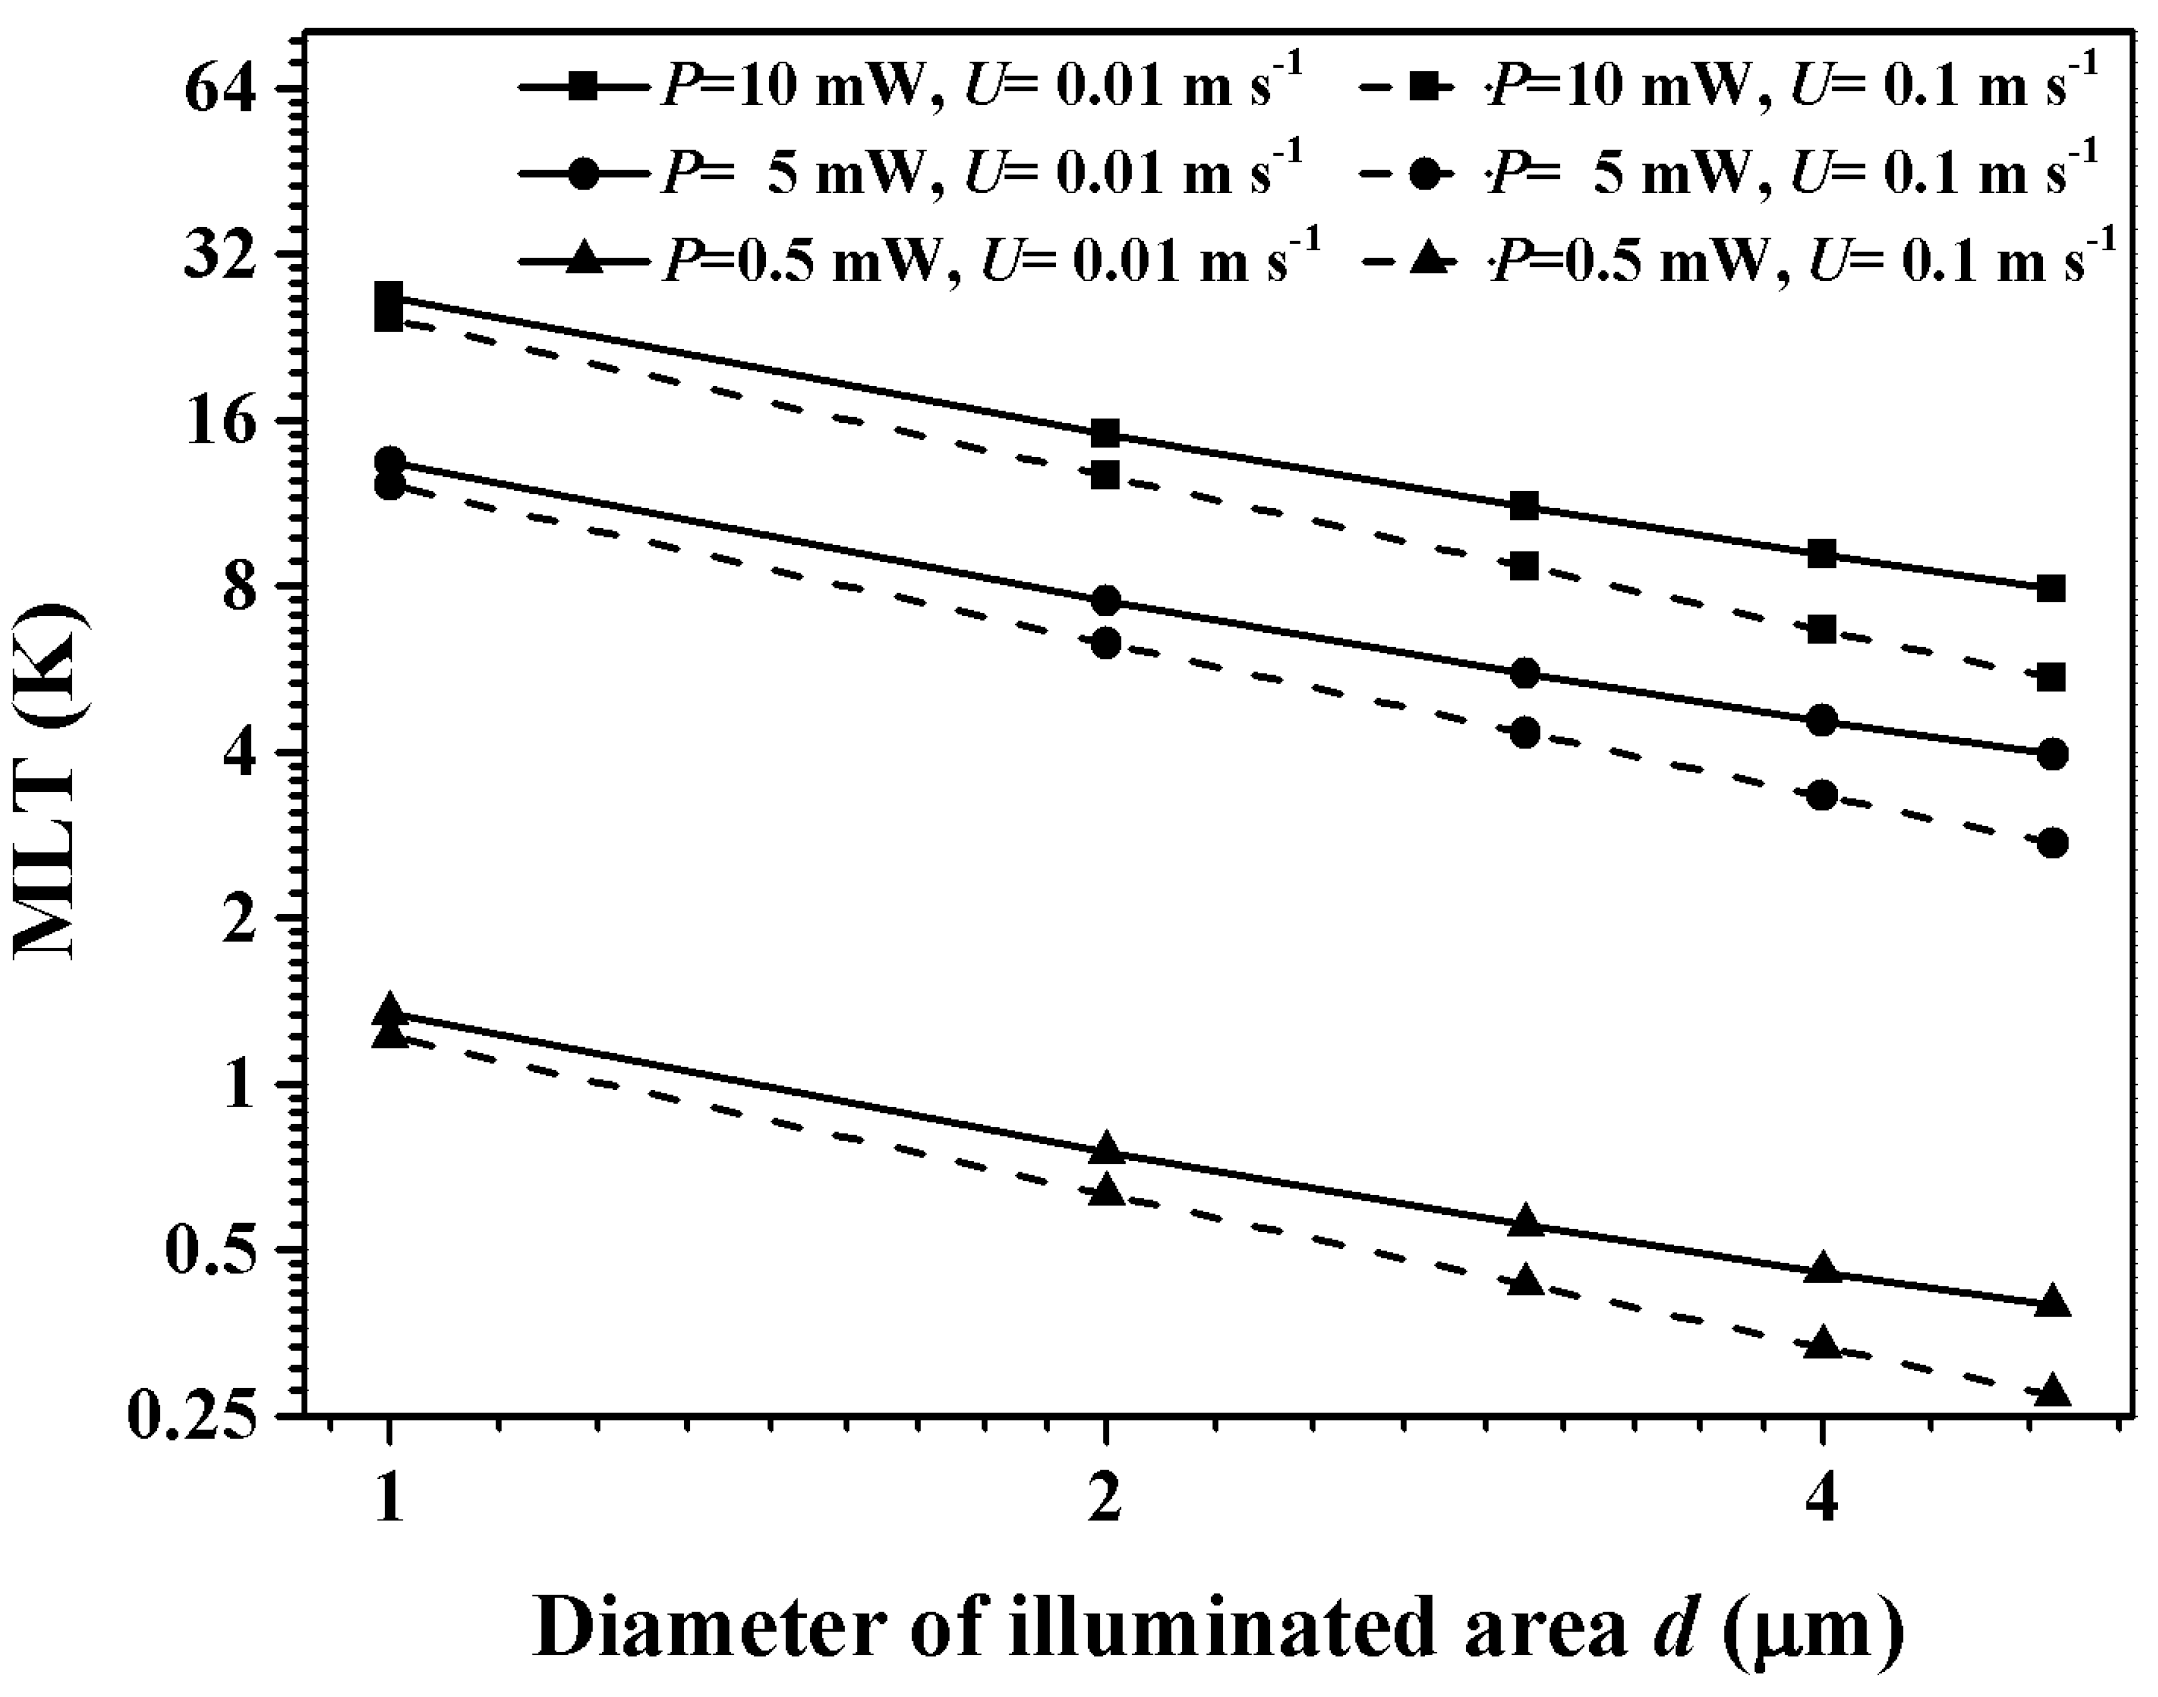
4.3. Effects of Surface Power and Diameter of Illuminated Area


4.4. Effect of Exposure Time

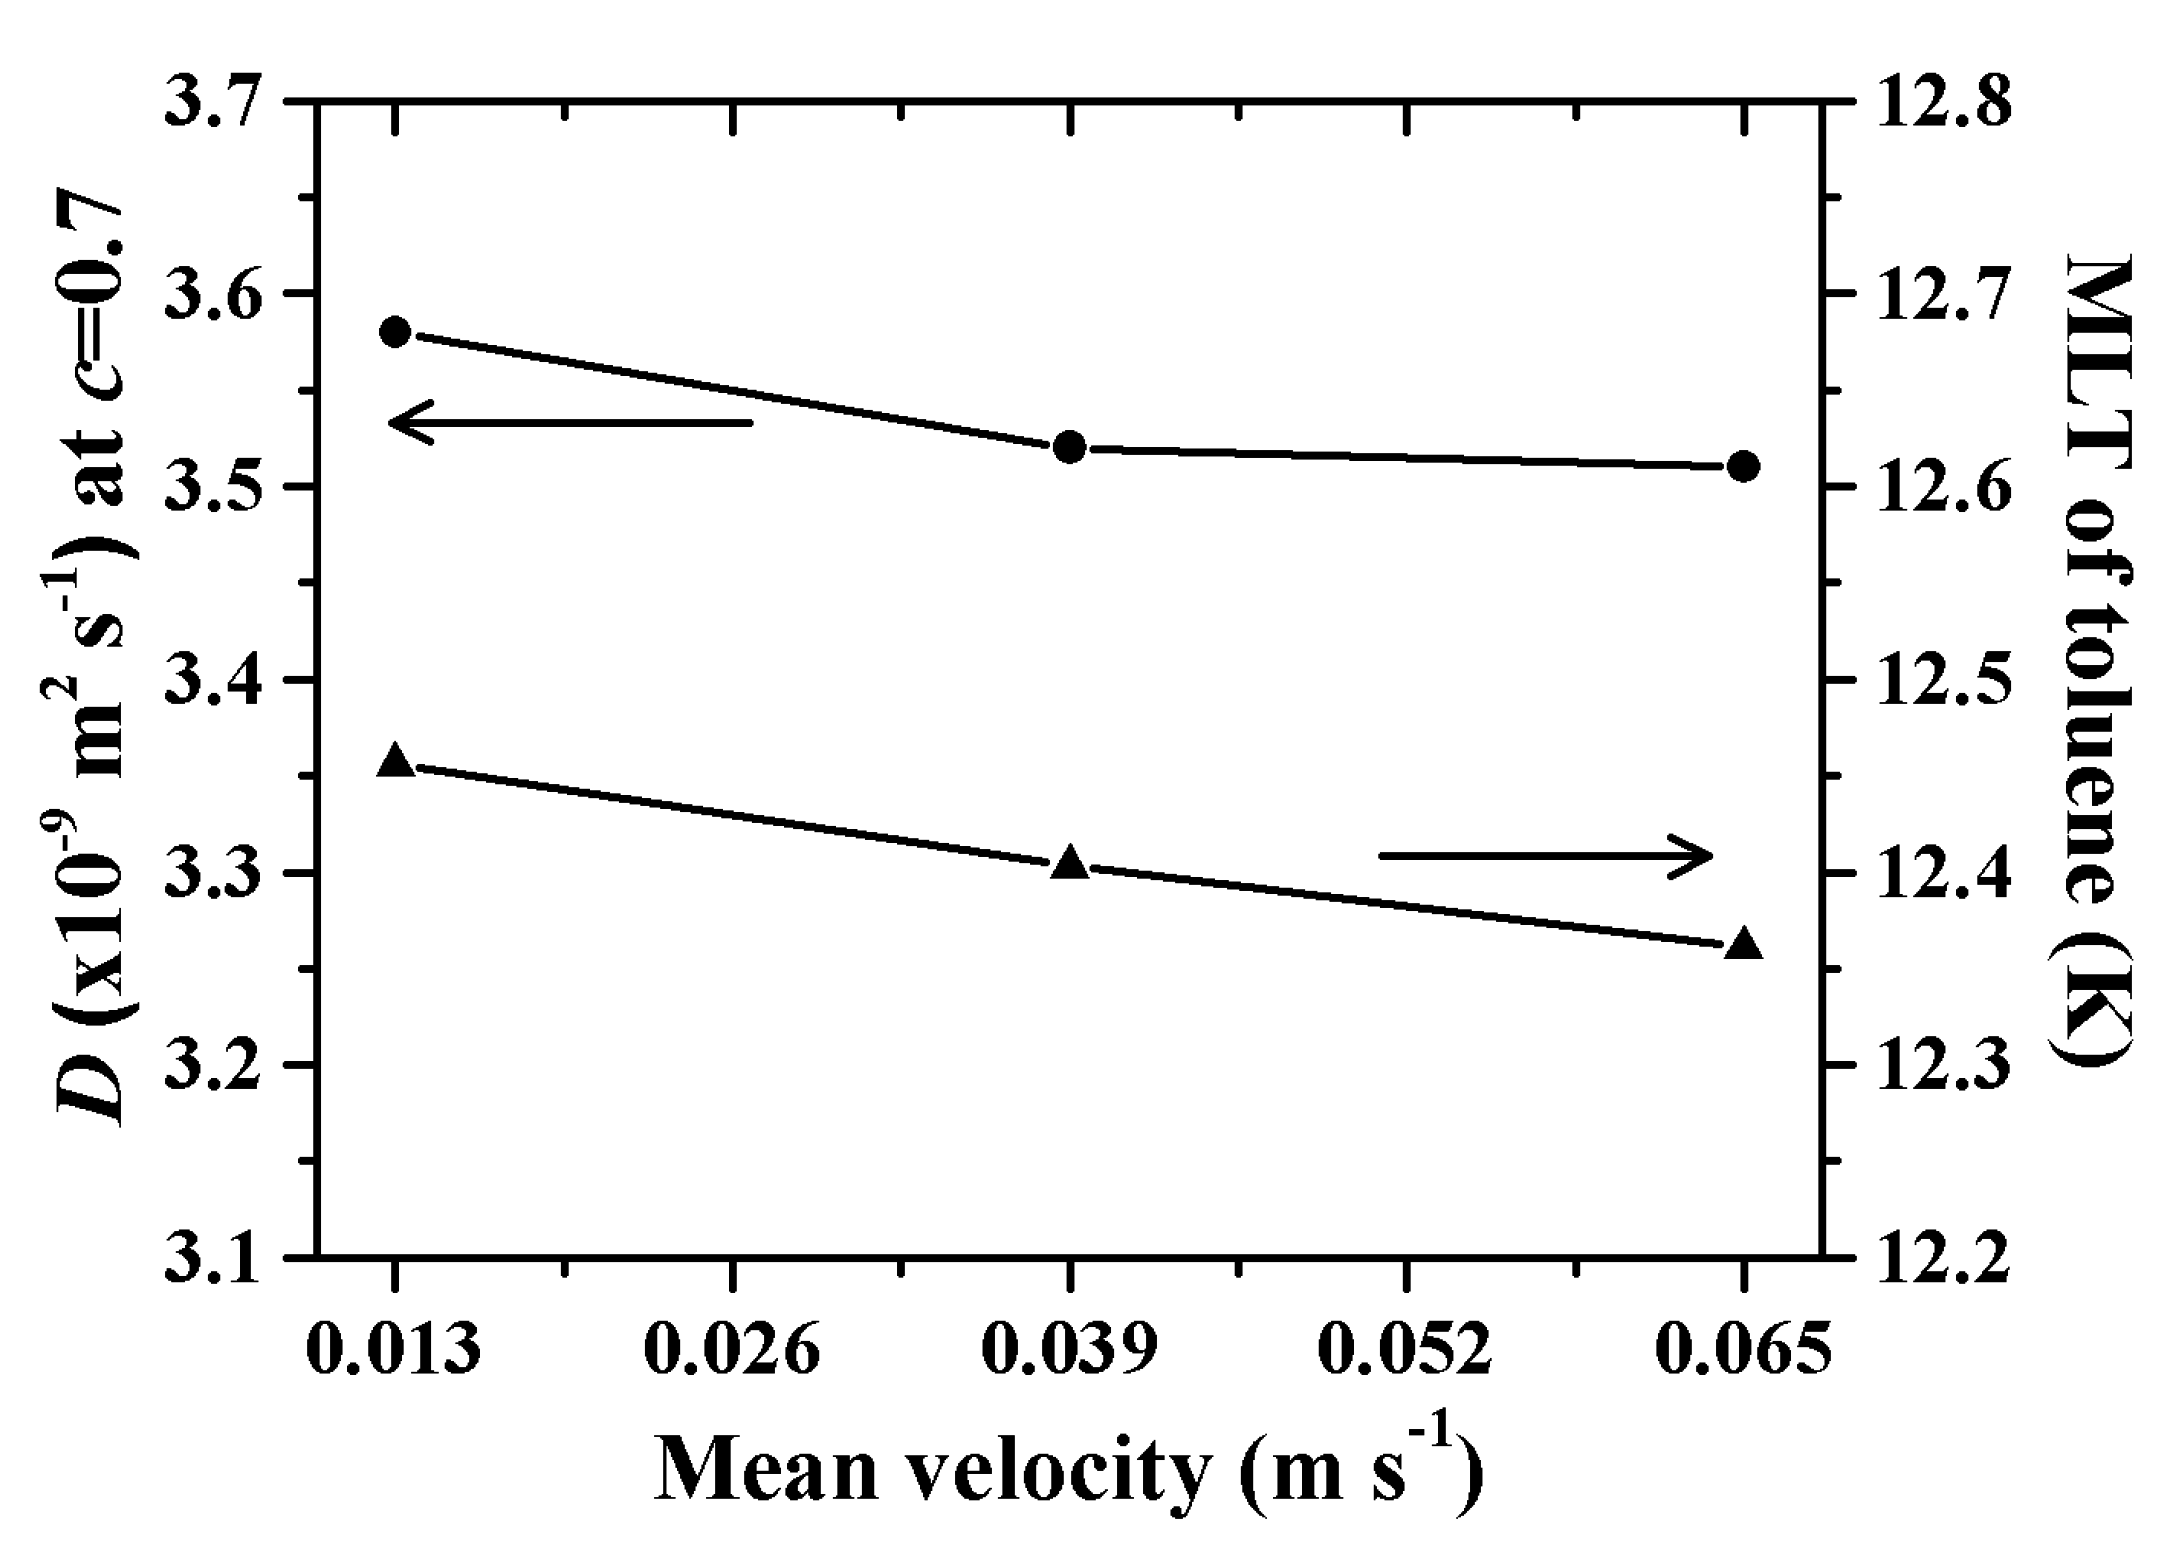
4.5. Experimental Evidence of Temperature Rise


4.6. Estimation of the Laser-Induced Heating Effect
| Dimensionless Group | Expression |
|---|---|
| π1 | (L·W)1/2)/d |
| π2 | λs/(U·(L·W)1/2) |
| π3 | ΔTmax·λs·(L·W) 1/2/(P·α) |
5. Conclusions
Acknowledgements
Author Contributions
Nomenclature
| A | cross-sectional area along the axial direction, m2 |
| cp | specific heat, kJ·kg−1·K−1 |
| d | diameter of illuminated area, μm |
| D | diffusion coefficient, m2·s−1 |
| hfc | free convective heat transfer coefficient, W·m−2·K−1 |
| h | height of the microchannel, μm |
| I | laser intensity, W·m−2 |
| L | length of the microfluidic chip, mm |
| p | pressure, Pa |
| P | surface power, mW |
| q | heat flux, W·m−2 |
| r | the distance with the spot center, μm |
| T | temperature, K |
| ΔTmax | maximum local temperature-rise of fluid, abbreviated as MLT, K |
| u | velocity vector |
| U | mean velocity, m·s−1 |
| w | width of the microchannel, μm |
| W | width of the microfluidic chip, mm |
Dimensionless groups
| M | Maranzana number |
| Pr | Prandtl number, cpfμf/λf |
| Re | Reynolds number, 10−6ρfU 2(hw)/(h + w)/μf |
| Greek symbols | |
|---|---|
| α | absorption coefficient |
| λ | thermal conductivity, W·m−1·K−1 |
| μ | dynamic viscosity, mPa s |
| ρ | density, kg·m−3 |
| ω0 | radius of laser spot, μm |
| Subscripts | |
|---|---|
| 0 | the center of laser spot |
| a | ambient |
| f | fluid |
| s | solid |
Conflicts of Interest
References
- Kamholz, A.E.; Weigl, B.H.; Finlayson, B.A.; Yager, P. Quantitative analysis of molecular interaction in a microfluidic channel: The T-sensor. Anal. Chem. 1999, 71, 5340–5347. [Google Scholar] [CrossRef] [PubMed]
- DeMello, A.J. Control and detection of chemical reactions in microfluidic systems. Nature 2006, 442, 394–402. [Google Scholar] [CrossRef] [PubMed]
- McClain, M.A.; Culbertson, C.T.; Jacobson, S.C.; Allbritton, N.L.; Sims, C.E.; Ramsey, J.M. Microfluidic devices for the high-throughput chemical analysis of cells. Anal. Chem. 2003, 75, 5646–5655. [Google Scholar] [CrossRef] [PubMed]
- Mazutis, L.; Baret, J.C.; Treacy, P.; Skhiri, Y.; Araghi, A.F.; Ryckelynck, M.; Taly, V.; Griffiths, A.D. Multi-step microfluidic droplet processing: Kinetic analysis of an in vitro translated enzyme. Lab Chip 2009, 9, 2902–2908. [Google Scholar] [CrossRef] [PubMed]
- Ohno, K.; Tachikawa, K.; Manz, A. Microfluidics: Applications for analytical purposes in chemistry and biochemistry. Electrophoresis 2008, 29, 4443–4453. [Google Scholar] [CrossRef] [PubMed]
- Fräulin, C.; Rinke, G.; Dittmeyer, R. Characterization of a new system for space-resolved simultaneous in situ measurements of hydrocarbons and dissolved oxygen in microchannels. Microfluid. Nanofluid. 2014, 16, 149–157. [Google Scholar] [CrossRef]
- Pully, V.V.; Lenferink, A.; van Manen, H.J.; Subramaniam, V.; van Blitterswijk, C.A.; Otto, C. Microbioreactors for raman microscopy of stromal cell differentiation. Anal. Chem. 2010, 82, 1844–1850. [Google Scholar] [CrossRef] [PubMed]
- Egawa, T.; Durand, J.L.; Hayden, E.Y.; Rousseau, D.L.; Yeh, S.R. Design and evaluation of a passive alcove-based microfluidic mixer. Anal. Chem. 2009, 81, 1622–1627. [Google Scholar] [CrossRef] [PubMed]
- Sarrazin, F.; Salmon, J.B.; Talaga, D.; Servant, L. Chemical reaction imaging within microfluidic devices using confocal raman spectroscopy: The case of water and deuterium oxide as a model system. Anal. Chem. 2008, 80, 1689–1695. [Google Scholar] [CrossRef] [PubMed]
- Fletcher, P.D.I.; Haswell, S.J.; Zhang, X.L. Monitoring of chemical reactions within microreactors using an inverted raman microscopic spectrometer. Electrophoresis 2003, 24, 3239–3245. [Google Scholar] [CrossRef] [PubMed]
- Zhang, W.; Li, B.; Chen, L.; Wang, Y.; Gao, D.; Ma, X.; Wu, A. Brushing, a simple way to fabricate sers active paper substrates. Anal. Methods 2014, 6, 2066–2071. [Google Scholar] [CrossRef]
- Ndukaife, J.C.; Mishra, A.; Guler, U.; Nnanna, A.G.A.; Wereley, S.T.; Boltasseva, A. Photothermal heating enabled by plasmonic nanostructures for electrokinetic manipulation and sorting of particles. ACS Nano 2014, 8, 9035–9043. [Google Scholar] [CrossRef] [PubMed]
- Wang, Y.; Yan, B.; Chen, L. Sers tags: Novel optical nanoprobes for bioanalysis. Chem. Rev. 2013, 113, 1391–1428. [Google Scholar] [CrossRef] [PubMed]
- Li, Q.-L.; Li, B.-W.; Wang, Y.-Q. Surface-enhanced raman scattering microfluidic sensor. RSC Adv. 2013, 3, 13015–13026. [Google Scholar] [CrossRef]
- Everall, N.J. Modeling and measuring the effect of refraction on the depth resolution of confocal raman microscopy. Appl. Spectrosc. 2000, 54, 773–782. [Google Scholar] [CrossRef]
- Everall, N.J. Confocal raman microscopy: Why the depth resolution and spatial accuracy can be much worse than you think. Appl. Spectrosc. 2000, 54, 1515–1520. [Google Scholar] [CrossRef]
- Salmon, J.B.; Ajdari, A.; Tabeling, P.; Servant, L.; Talaga, D.; Joanicot, M. In situ raman imaging of interdiffusion in a microchannel. Appl. Phys. Lett. 2005, 86, 094106. [Google Scholar] [CrossRef]
- Lin, Y.; Yu, X.; Wang, Z.; Tu, S.-T.; Wang, Z. Measurement of temperature-dependent diffusion coefficients using a confocal raman microscope with microfluidic chips considering laser-induced heating effect. Anal. Chim. Acta 2010, 667, 103–112. [Google Scholar] [CrossRef] [PubMed]
- Lo, H.W.; Compaan, A. Raman measurements of temperature during cw laser heating of silicon. J. Appl. Phys. 1980, 51, 1565. [Google Scholar] [CrossRef]
- Kouteva-Arguirova, S.; Arguirov, T.; Wolfframm, D.; Reif, J. Influence of local heating on micro-raman spectroscopy of silicon. J. Appl. Phys. 2003, 94, 4946–4949. [Google Scholar] [CrossRef]
- Wu, X.M.; Yu, J.Y.; Ren, T.L.; Liu, L.T. Micro-raman spectroscopy measurement of stress in silicon. Microelectron. J. 2007, 38, 87–90. [Google Scholar] [CrossRef]
- Georgi, C.; Hecker, M.; Zschech, E. Effects of laser-induced heating on raman stress measurements of silicon and silicon-germanium structures. J. Appl. Phys. 2007, 101, 123104. [Google Scholar] [CrossRef]
- Suthar, K.J.; Patten, J.; Dong, L.; Abdel-Aal, H. Estimation of Temperature Distribution in Silicon During Micro Laser Assisted Machining. In Proceedings of the ASME 2008 International Manufacturing Science and Engineering Conference, Evanston, IL, USA, 7–10 October 2008; pp. 301–309.
- Downes, A.; Salter, D.; Elfick, A. Heating effects in tip-enhanced optical microscopy. Opt. Express 2006, 14, 5216–5222. [Google Scholar] [CrossRef] [PubMed]
- Hung, M.-S.; Kurosawa, O.; Washizu, M. Single DNA molecule denaturation using laser-induced heating. Mol. Cell. Probes 2012, 26, 107–112. [Google Scholar] [CrossRef] [PubMed]
- Kim, H.; Vishniakou, S.; Faris, G.W. Petri dish pcr: Laser-heated reactions in nanoliter droplet arrays. Lab Chip 2009, 9, 1230–1235. [Google Scholar] [CrossRef] [PubMed]
- Zhao, R.; Marshall, M.; Alemán, E.A.; Lamichhane, R.; Feig, A.; Rueda, D. Laser-assisted single-molecule refolding (lasr). Biophys. J. 2010, 99, 1925–1931. [Google Scholar] [CrossRef] [PubMed]
- Baaske, P.; Duhr, S.; Braun, D. Melting curve analysis in a snapshot. Appl. Phys. Lett. 2007, 91, 133901. [Google Scholar] [CrossRef]
- Gallardo, A.; Spells, S.; Navarro, R.; Reinecke, H. Confocal raman microscopy: How to correct depth profiles considering diffraction and refraction effects. J. Raman Spectrosc. 2007, 38, 880–884. [Google Scholar] [CrossRef]
- Everall, N. Depth profiling with confocal raman microscopy, part II. Spectroscopy 2004, 19, 16–26. [Google Scholar]
- Baldwin, K.J.; Batchelder, D.N. Confocal raman microspectroscopy through a planar interface. Appl. Spectrosc. 2001, 55, 517–524. [Google Scholar] [CrossRef]
- Bruneel, J.L.; Lassegues, J.C.; Sourisseau, C. In-depth analyses by confocal raman microspectrometry: Experimental features and modeling of the refraction effects. J. Raman Spectrosc. 2002, 33, 815–828. [Google Scholar] [CrossRef]
- Tiselj, I.; Hetsroni, G.; Mavko, B.; Mosyak, A.; Pogrebnyak, E.; Segal, Z. Effect of axial conduction on the heat transfer in micro-channels. Int. J. Heat Mass Transf. 2004, 47, 2551–2565. [Google Scholar] [CrossRef]
- Engineering ToolBox. Available online: http://www.engineeringtoolbox.com (accessed on 24 June 2015).
- Maranzana, G.; Perry, I.; Maillet, D. Mini- and micro-channels: Influence of axial conduction in the walls. Int. J. Heat Mass Transf. 2004, 47, 3993–4004. [Google Scholar] [CrossRef]
© 2015 by the authors; licensee MDPI, Basel, Switzerland. This article is an open access article distributed under the terms and conditions of the Creative Commons Attribution license (http://creativecommons.org/licenses/by/4.0/).
Share and Cite
Lin, Y.; Yu, X.; Wang, Z.; Tu, S.-T.; Wang, Z. Effect of Laser-Induced Heating on Raman Measurement within a Silicon Microfluidic Channel. Micromachines 2015, 6, 813-830. https://doi.org/10.3390/mi6070813
Lin Y, Yu X, Wang Z, Tu S-T, Wang Z. Effect of Laser-Induced Heating on Raman Measurement within a Silicon Microfluidic Channel. Micromachines. 2015; 6(7):813-830. https://doi.org/10.3390/mi6070813
Chicago/Turabian StyleLin, Ying, Xinhai Yu, Zhenyu Wang, Shan-Tung Tu, and Zhengdong Wang. 2015. "Effect of Laser-Induced Heating on Raman Measurement within a Silicon Microfluidic Channel" Micromachines 6, no. 7: 813-830. https://doi.org/10.3390/mi6070813