Article

High Resolution Cell Positioning Based on a Flow Reduction Mechanism for Enhancing Deformability Mapping

1
Department of Mechanical Engineering, Osaka University, 2-1 Yamadaoka, Suita, Osaka 565-0871, Japan
2
Department of Micro-Nano Systems Engineering, Nagoya University, Furo-Cho, Chikusa-Ku, Nagoya 464-8601, Japan
3
Department of Cardiovascular Medicine, Osaka University, 2-1 Yamadaoka, Suita, Osaka 565-0871, Japan
*
Author to whom correspondence should be addressed.
Present Address: Department of Micro-Nano Systems Engineering, Nagoya University, Furo-cho, Chikusa-Ku, Nagoya, Aichi 464-8603, Japan.
Micromachines 2014, 5(4), 1188-1201; https://doi.org/10.3390/mi5041188
Submission received: 23 September 2014 / Revised: 30 October 2014 / Accepted: 11 November 2014 / Published: 18 November 2014
(This article belongs to the Collection Lab-on-a-Chip)

Abstract

:
The dispersion of cell deformability mapping is affected not only by the resolution of the sensing system, but also by cell deformability itself. In order to extract the pure deformability characteristics of cells, it is necessary to improve the resolution of cell actuation in the sensing system, particularly in the case of active sensing, where an actuator is essential. This paper proposes a novel concept, a “flow reduction mechanism”, where a flow is generated by a macroactuator placed outside of a microfluidic chip. The flow can be drastically reduced at the cell manipulation point in a microchannel due to the elasticity embedded into the fluid circuit of the microfluidic system. The great advantage of this approach is that we can easily construct a high resolution cell manipulation system by combining a macro-scale actuator and a macro-scale position sensor, even though the resolution of the actuator is larger than the desired resolution for cell manipulation. Focusing on this characteristic, we successfully achieved the cell positioning based on a visual feedback control with a resolution of 240 nm, corresponding to one pixel of the vision system. We show that the utilization of this positioning system contributes to reducing the dispersion coming from the positioning resolution in the cell deformability mapping.

Graphical Abstract

1. Introduction

There have been a number of works measuring the cell mechanical characteristics, such as cell mechanical impedance [13], cell deformability [47] and cell property under reciprocated mechanical stress [8,9], by utilizing a microfluidic chip whose cross-sectional area is close to that of the minimum size of the human blood pipe. The measurement of cell mechanical impedance or cell deformability needs an appropriate actuator for manipulating the cell, as shown in Figure 1a. The dispersion of the obtained data is influenced by both the resolution of the actuator and the property of the cell, as shown in Figure 1b,c. Figure 1b,c shows the heat map on the frequency of the data, where the blue and red color show the low frequency and high frequency, respectively. Suppose cellular properties are the same for both Figures 1b,c. Furthermore, suppose an extreme case where the system holds infinitely small resolution and no sensing error. In such a case, the measured property exactly coincides with that of cellular one, as shown in Figure 1b. In a general case, however, the system has a limitation of resolution and includes some sensing errors. Eventually, the measured property has a wide dispersion depending on the one coming from the sensing system, as shown in Figure 1c. Therefore, in order to obtain the pure dispersion characteristics of the cell group, it is necessary to increase the resolution of cell manipulation. This is the reason why we focus on high resolution cell positioning in this paper.
Under these circumstances, the goal of this work is to provide a cell positioning system with an extremely high resolution, such as less than 250 nm. There are two approaches for fluid-based cell actuation in a microfluidic chip. One is the internal actuation, where the actuator component for producing a propelling force is installed within the microfluidic chip, and the other is the external actuation, when such an actuator component is placed outside of the microfluidic chip [1013]. An electrically-driven micropump installed inside of a microfluidic chip is a good example of the internal actuation [13]. Since the resolution of the actuator directly affects the resolution for the cell positioning, the internal actuation has an advantage for achieving a high resolution. However, this approach usually requires a complicated actuation mechanism due to the necessity of mechanical and/or electrical components in the chip, and results in a lack of robustness of the actuation system. Furthermore, when the microchannel is fully blocked by the cell, we are obliged to throw away the microfluidic chip together with the micropump. On the other hand, a syringe pump [1417], a peristaltic pump [18] and a pneumatic pump [19] are good examples of external actuation. These external pumps enable us to achieve the simple set up, where they are connected to the microchip through a hard tube. This mechanical configuration provides a big advantage for disposable applications using microfluidic devices. Among them, the syringe pump has a certain advantage due to its quick response time based on the powerful actuation. For these reasons, this work focuses on using a syringe pump as the actuator, as shown in Figure 1a. The cell positioning system is composed of a vision sensor, a syringe pump and a microfluidic chip. Although the system has a simple configuration, there is an issue where the cell velocity is geometrically amplified in the microchannel. For example, suppose that we combine a syringe pump with the cross-sectional area of A1 with a diameter of 10 mm and connected to the microchannel with a cross-sectional area of A2 with a diameter of 10 μm. In this case, the area ratio RIncom = A1/A2 ≃ 106, which results in increasing the velocity in the microchannel with a huge amplification ratio. Even if the syringe pump has a high resolution, such as δ1 = 10 nm, the equivalent resolution δ2 = RIncomδ1 in the michrochannel becomes in the order of 1 mm, which is far from ensuring a high resolution in the order of 100 nm. Therefore, an appropriate flow reduction mechanism is very much required for the cell positioning with high resolution.
To overcome this serious issue of the geometrically amplification of the flow in a microchannel, we propose to utilize the flow reduction mechanism embedded in the microfluidic system itself. Generally, a microfluidic chip made of polydimethylsiloxane (PDMS) has elasticity and produces a volumetric change of the microfluidic system when the pressure in the microchannel increases stepwise. While the volumetric change is usually considered as an issue for cell position control, we can regard it as the function of the flow reduction embedded in the microfluidic system. This characteristic contributes to drastically improving the positioning resolution of the cell at the manipulation point. To confirm this characteristic, we constructed a full experimental system equipped with online high speed vision and succeeded in cell position control with a resolution of less than 250 nm by using visual feedback control. This is in the same order of the resolution of a standard optical microscope.
This paper is organized as follows. After explaining the elasticity of the microfluidic chip in the Introduction, we discuss how to achieve high resolution in the microfluidic channel in detail in Section 2. In Section 3, we explain the experimental system and the results for confirming the basic principle. In Section 4, we show an example of the deformability map of blood transfusion, where there are several groups, while there is only one before blood transfusion. We give also a discussion in Section 5 before concluding remarks in Section 6.

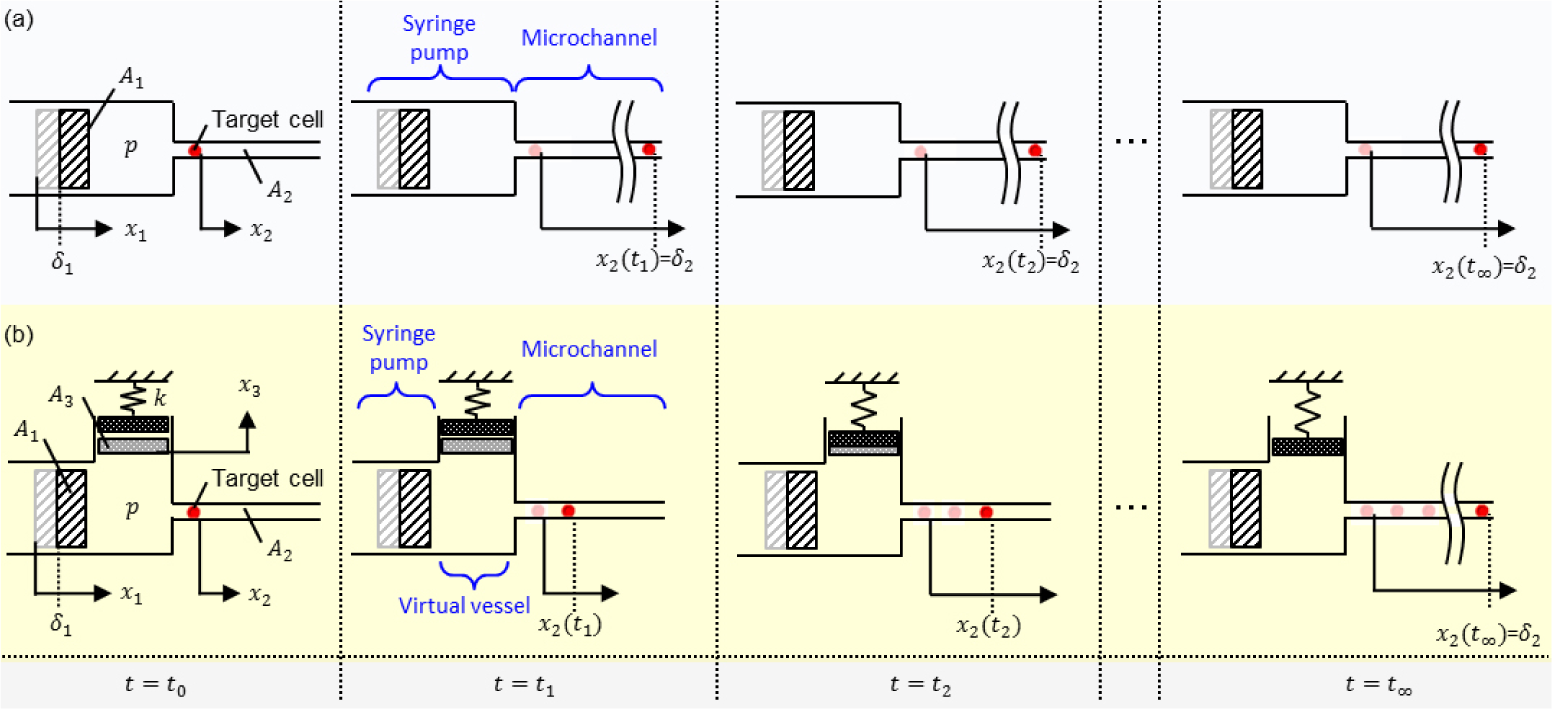
2. Flow Reduction Mechanism

2.1. Under Incompressibility of the Microfluidic Chip

While implementing mechatronics devices, we generally combine a motor and a reduction gear, so that we can increase the force (or torque) and position resolution (or angle resolution) at the output shaft. As mentioned in the Introduction, a syringe pump is directly connected to a microfluidic channel through a tube. This is a typical example of a velocity amplification mechanism, where the flow velocity at the piston of the syringe pump increases with RIncom = A1/A2; because A1 is usually even larger than A2 and δ2 is the order of 1 mm, as shown in the Introduction. Most of the conventional works utilizing a syringe pump together with a microfluidic channel are categorized into this group. However, so far, this velocity amplification mechanism has not been treated as a serious issue, since precise cell manipulation with high resolution has not been discussed precisely. Figure 2a shows the behavior of cell motion under the incompressibility of the microfluidic chip when the piston of the syringe is actuated with δ1. The target cell is flowing in the microchannel without any time lag, and it maintains the position until the next command is given to the syringe pump. In this case, the displacement of cell δ2 results in δ2 = RIncomδ1 instantaneously, irrespective of each observation time t1, t2, t3 and t, as shown in Figure 2a. We note that δ2 = RIncomδ1 occurs instantaneously.

2.2. Under Compressibility of the Microfluidic Chip

Figure 2b shows a model of how the target cell moves when the piston of a syringe is actuated under a compressible vessel with a microchannel. For simplicity, we suppose that all other parts, except the vessel, are rigid, and therefore, there is no deformation from the pressure increase. In other words, all compressive elements are integrated in the virtual vessel in Figure 2b, where A3 is the equivalent cross-sectional area of the elastic vessel. For further simplicity, we suppose that the mass of the piston is neglected. Now, suppose that a piston is pushed with a step input δ1, and then the position is maintained. In the case of Figure 2a, the pressure in the vessel sharply increases and decreases with the interval of the liquid flow in the microchannel, which is the basic characteristic of the incompressible liquid/structure system. On the other hand, in the case of Figure 2b, the pressure in the vessel sharply increases with a step input, and the liquid in the microchannel starts to flow. Since there is a compressible element, the liquid in the microchannel is continuously flowing, and after the pressure increases, it gradually decreases with an appropriate time constant, which is determined by the stiffness, the damping of the virtual vessel and the flow in the microchannel. We note that A3 is the cross-sectional area of the virtual vessel and is unknown. We can observe that the position of the target cell δ2 gradually changes with respect to each observation time t1 through t, as shown in Figure 2b. The compressibility comes from both the tube and the PDMS microfluidic chip, and therefore, we cannot confirm it, until we build up the total system. However, the advantage of using the combination of a macroactuator and a microfluidic channel is that we can keep an extremely high area ratio RIncom = A1/A2 ≃ 106, by which we can keep the pressure almost constant with respect to time, since the pressure drop due to the liquid flow is extremely small and negligible. This nature brings us two advantages, where one is to produce a flow reduction in the microchannel and the other is to contribute to an easy control scheme. This is what we call the “flow reduction mechanism” characteristic embedded in a microfluidic system.

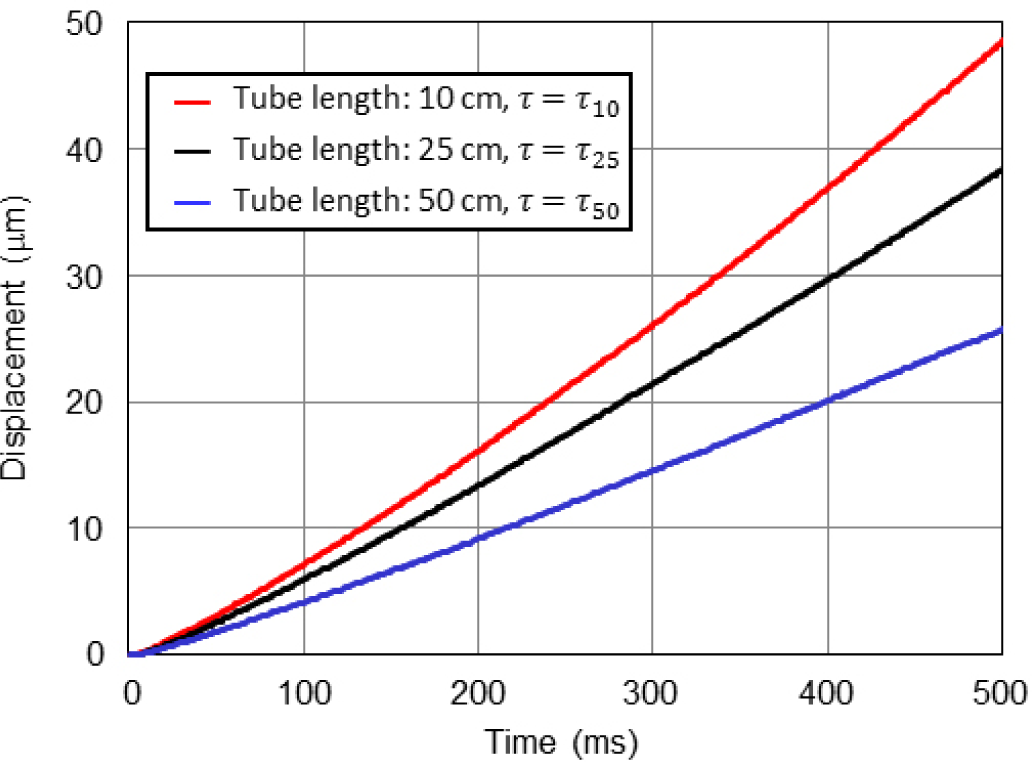
2.3. Analysis of the Flow Reduction Mechanism

In order to provide a more general discussion, we consider a model, as shown in Figure 2b, where A i , x i , x ˙ i ( i = 1 , 2 , 3 ) and p are the i-th equivalent cross-sectional area, the displacement, the velocity and the pressure in a vessel, respectively. We note that A 3 , x 3 , x ˙ 3 are unknown parameters of the virtual vessel, which is imaginarily integrated into all compressive elements of the fluid circuit. For incompressible fluid and an elastic vessel, we have the following Equations (1)(3) as a function of time t.
A 1 x ˙ 1 ( t ) = A 2 x ˙ 2 ( t ) + A 3 x ˙ 3 ( t )
A 2 p ( t ) = c x ˙ 2 ( t )
A 3 p ( t ) = k x 3 ( t )
where Equations (1)(3) denote the continuity of liquid, the relationship between the pressure and the cell velocity and the force balance equation for the virtual plate, respectively, where k and c are the stiffness of the vessel and the constant parameter determined by the viscosity of the fluid, respectively. We note that the cell is supposed to move together with the fluid. By using Laplace transform under the condition of x1(0) = x2(0) = x3(0) = 0, we have the following Equations (4)(6).
A 1 X 1 ( s ) = A 2 X 2 ( s ) + A 3 X 3 ( s )
A 2 P ( s ) = c s X 2 ( s )
A 3 P ( s ) = k X 3 ( s )
From Equations (4)(6), we can obtain the following relationship between X1(s) and X2(s),
X 2 ( s ) = k A 1 A 2 k A 2 2 + c s A 3 2 X 1 ( s )
Now, suppose that a step input is given as in Equation (8).
X 1 ( s ) = δ 1 s
where δ1 is the amplitude of the step input. By inputting Equation (8) into Equation (7), we can obtain the substituting Equations (9)(11):
x 2 ( t ) = R I n c o m δ 1 ( 1 exp ( t τ ) )
τ = 1 r A c k
r A = A 2 2 A 3 2
where rA and τ are the design parameter of the microchannel and the time constant during the relaxation of the pressure due to the flow in the microchannel, respectively. Eventually, we can obtain the following Equation (12) about the flow rate in the microchannel x ˙ 2 ( t ),
x ˙ 2 ( t ) = R I n c o m δ 1 τ exp ( t τ )
Now, we define the reduction ratio RCom by Equation (13):
R C o m = def δ 2 δ 1
By supposing that the initial velocity can be kept constant during the sampling interval Δt, the displacement of the cell together with the fluid is given by:
δ 2 = x ˙ 2 ( 0 ) Δ t = R I n c o m δ 1 Δ t τ
By the definition, RCon can be rewritten by:
R C o m = Δ t τ R I n c o m
Equation (15) means that we can improve the positioning resolution of the target cell by utilizing the compressibility of the microfluidic system under the condition of Δt/τ < 1.

3. Experiments

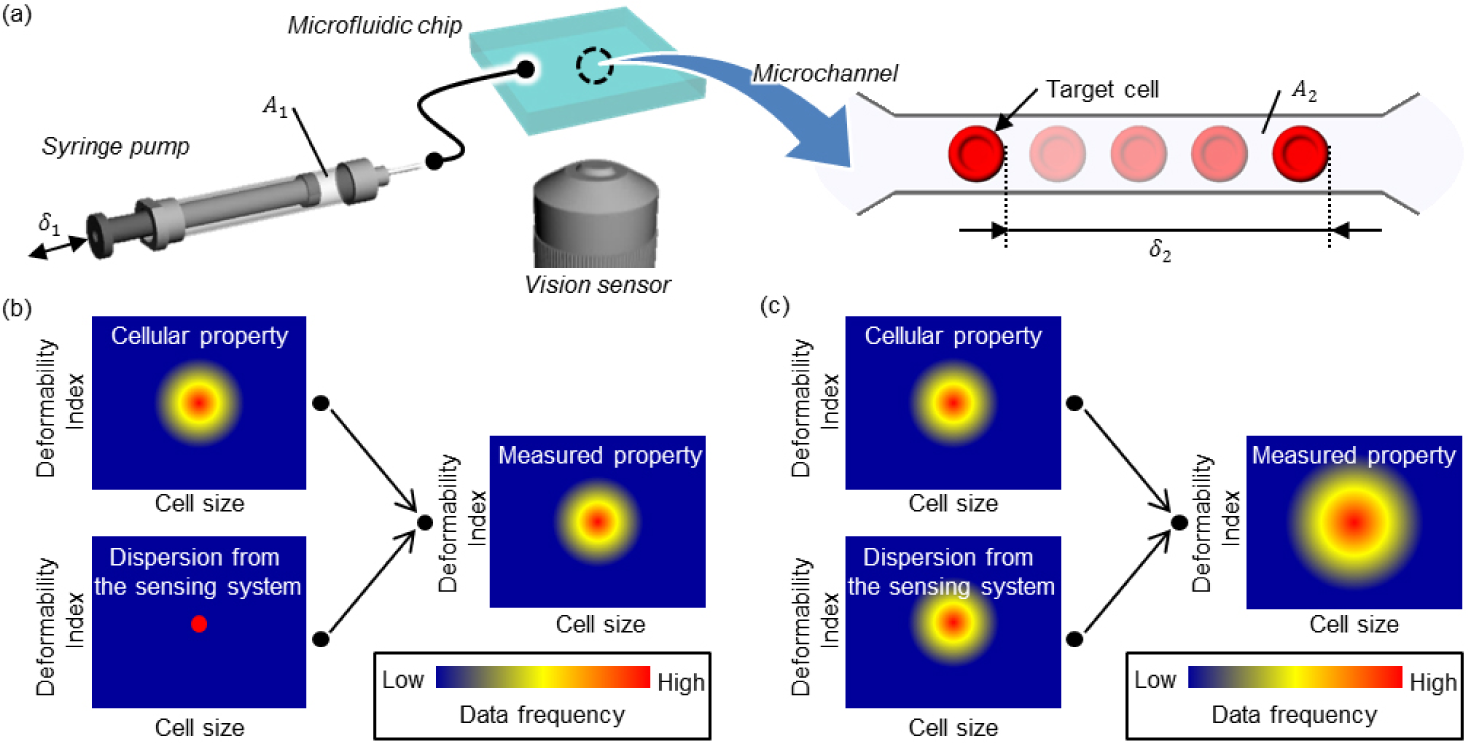
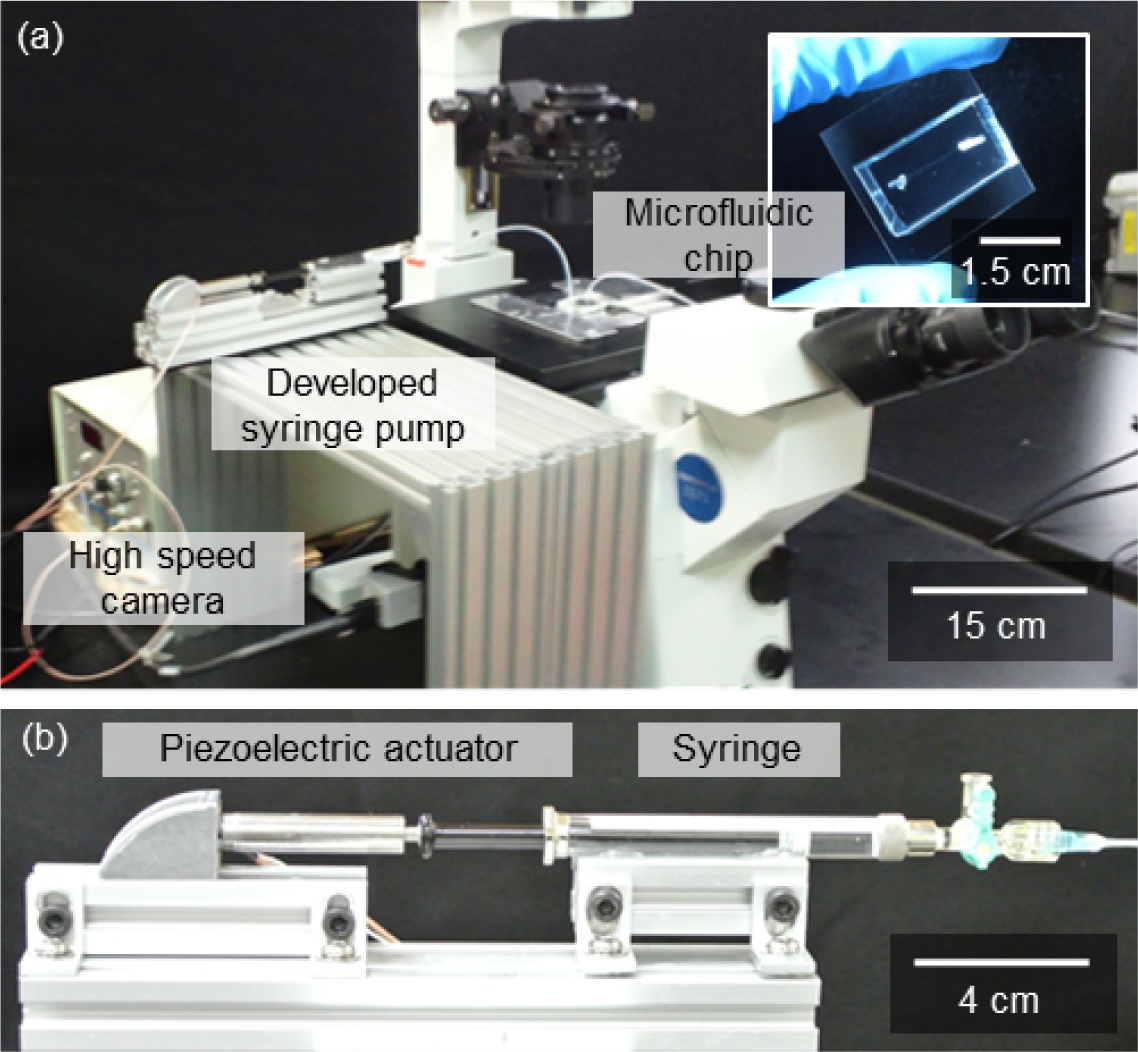
3.1. Experimental System

Figure 3 shows the experimental system, where it is composed of a syringe pump utilizing the piezoelectric actuator (MESS-TEK Co., Ltd. Saitama, Japan), online high speed vision (I-I-LAB. Co., Ltd. Hiroshima, Japan) and a microfluidic chip. The cross-sectional diameter of the piston of the syringe is 7.29 mm (A1 = 41.7 mm2). The piezoelectric actuator is directly connected to the piston through a bolt for the purpose of high speed response. Two tubes (PTFE, ID: 0.96 mm, OD: 1.56 mm, Chukoh Chemical Industries Ltd., Tokyo, Japan) are connected to the inlet and outlet of the microfluidic chip. Cells are injected into the microchannel through the tube, and then, the position is detected by online high speed vision, where 1 pixel corresponds to 240 nm. The maximum sampling rate of the total system Δt is 1 ms.

3.2. Fabrication Process of the Microfluidic Chip

The microfluidic chip is fabricated by standard soft-lithography using PDMS for a disposable application.
  • Spin-coated SU-8 (KAYAKU, Co., Ltd. Tokyo, Japana) is patterned by laser lithography.
  • The fabricated pattern is transcribed to PDMS (SILPOT 184 W/C, DOW CORNING TORAY, Co., Ltd. Tokyo, Japan). The thickness of the molded PDMS is 5 mm.
  • The molded and punched PDMS is bonded with the glass substrate by heating after O2 plasma treatment. The size of the inlet and outlet hole is 1.5 mm.
We use a red blood cell (RBC) as the target cell. By considering that the height and the diameter of an RBC typically range from 2 through 3 μm and 6 through 8 μm, respectively, the height and the width of the microchannel are designed as 3 μm and 10 μm, respectively.

3.3. Sample Preparation

To achieve single RBC evaluation from whole blood, we dilute blood with standard saline solution. RBCs were obtained from a volunteer subject who read and signed the donor consent for the evaluation. The blood was withdrawn by a licensed medical doctor. The procedures of the preparations are described as follows:
  • The microchannel is filled with standard saline solution.
  • The blood is diluted by saline with a density of 2%.
  • The blood-saline mixture is injected into the microchannel from the sample inlet.
Equation (15) says that the reduction ratio under compressibility RCom varies depending on Δt/τ and incompressibility RIncom. We first estimate τ by giving the step input δ1 to the pump. Figures 4 shows the measured position of RBCs in the microchannel with respect to time, where the step input is δ1 = 5.0 μm. The blue, black and red line show the results of the cases using the tubes whose lengths are 10, 25 and 50 cm, respectively. From these results, we can evaluate τ by the elasticity of the fluid circuit. From Equation (15), we can see that RCom is a function of RIncom, Δt and τ, where RIncom and Δt are given parameters, and τ is an unknown parameter.

3.4. Without Visual Feedback Control

From Equation (14), we can obtain the following Equation (16),
τ = R I n c o m δ 1 Δ t δ 2
By using Equation (16), we can evaluate τ without measuring unknown parameters A3, c and k. For example, RIncom and δ1 are measured as 1.4 × 10⁶ and 5 μm in the developed system, respectively. Supposing Δt = 100 ms, we can compute τ, and τ10, τ25 and τ50 are calculated as 2.3 × 10⁷, 2.8 × 10⁷ and 3.9 × 10⁷ ms, respectively, where the subscript of τ shows the length of the tube.

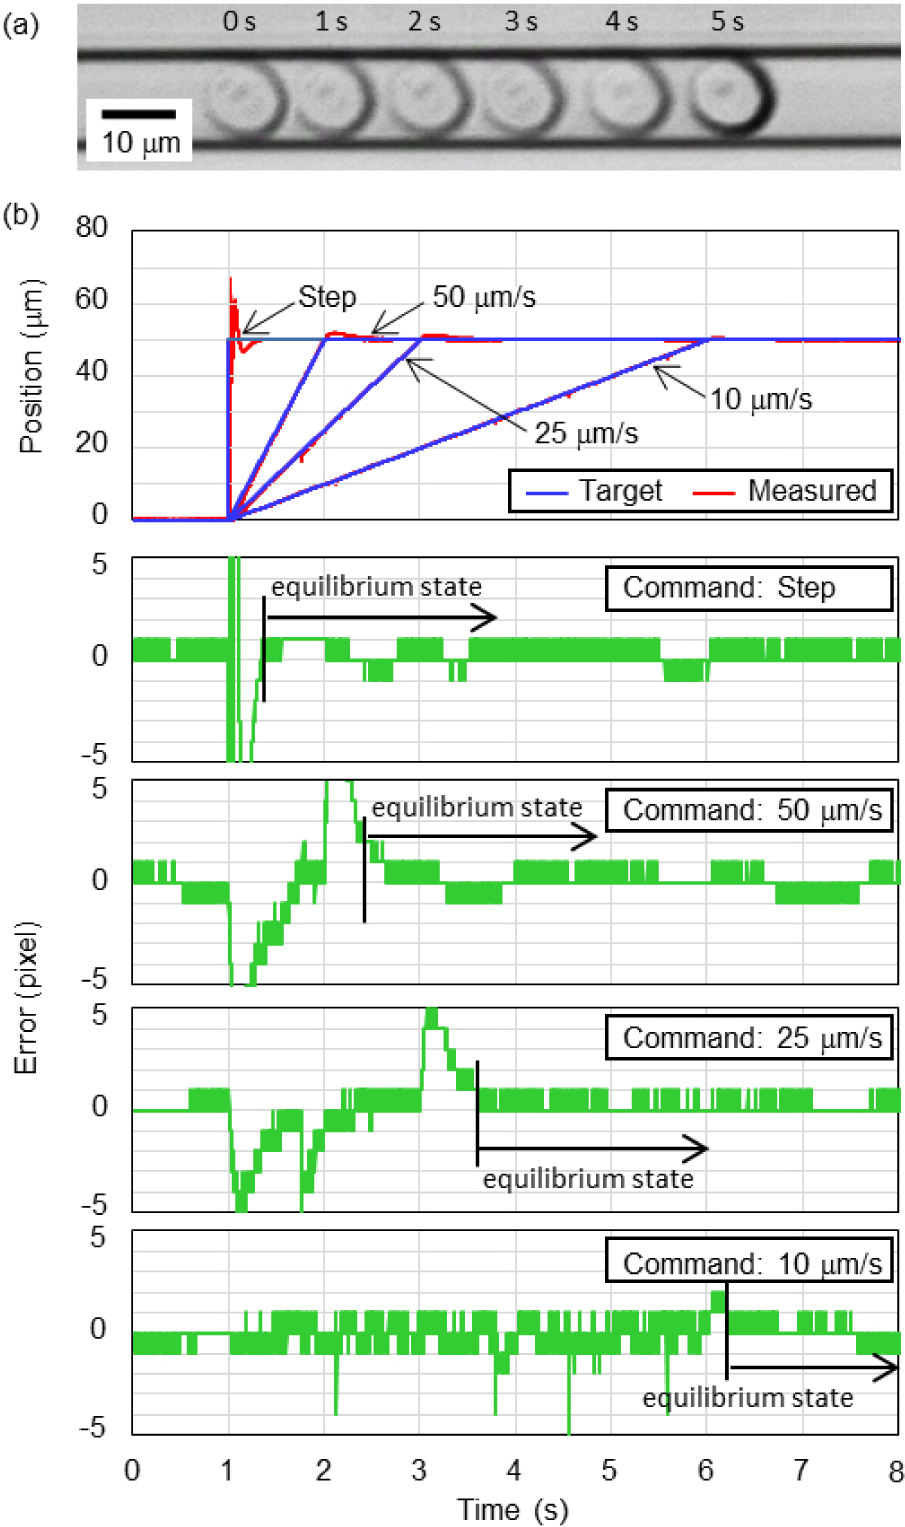
3.5. With Visual Feedback Control

In this section, we discuss the resolution of cell positioning under visual feedback control. In order to make the sampling interval Δt small, we utilize online high speed vision. Figure 5a shows a series of photos when the position of the RBC is controlled under the linear input of 10 μm/s. Figure 5b shows the response of position control under the given target position of the RBC with respect to time, where the each position command is given as the step input, a linear input of 10, 25 and 50 μm/s, respectively. The blue, red and green curves show the target position, the measured position and the error between them, respectively. The amplitude of each input is 208 pixels, which corresponds to 50 μm. The error of cell positioning is within ±240 nm (±1 pixel) in an equilibrium state. From these results, we could confirm that the embedded flow reduction mechanism can drastically contribute to reducing the flow rate in the microchannel generated by a macro pump system placed outside of a microfluidic chip. Moreover, we can control the cell position with the extremely high resolution of ±240 nm, corresponding to the limitation of the pixel of the online high speed vision sensor.

4. Application Example

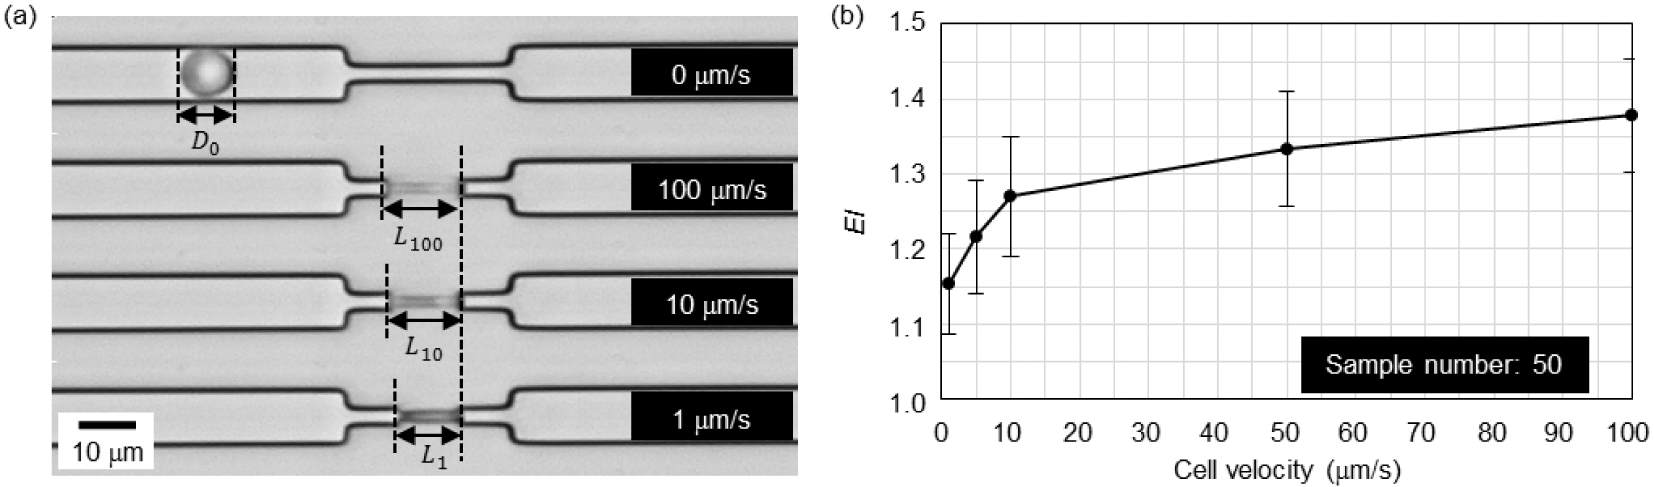
4.1. Cell Extensibility

In this section, we show an application example of the developed actuation system. By changing the position command continuously, we can control the flowing velocity of the target cell. In this section, we evaluate the RBC’s extensibility, which is an index of the deformability of the cell [9,2022]. Figure 6a shows an example of the extensibility evaluation test of the RBC. The microchannel has a narrow throat, whose width and length are 3 μm and 25 μm, respectively, and the target RBC is compressed by the throat. We evaluate the extensibility index (EI) by Equation (17),
E I = L v D 0
where D0 and Lv show the original diameter of the RBC and the length of the RBC in the narrow throat, respectively, and the subscript v shows the command velocity. The command velocities are given as 1, 5, 10, 50 and 100 μm/s, respectively. Figure 6b shows the relationship between EI and the cell velocity. The cell length increases with respect to the control velocity. The plots show the average value of the fifty measurement data, and the error bars show the standard deviation of that. This result indicates that the extensibility is strongly dependent on the cell velocity. While the cell velocity changes according to the cell deformability under the constant pressure difference between the entrance and the exit of the channel, we note that the velocity by using the developed system can be accurately controlled. By considering that EI depends on the cell velocity, we set the cell velocity to 100 μm/s in the following experiments.

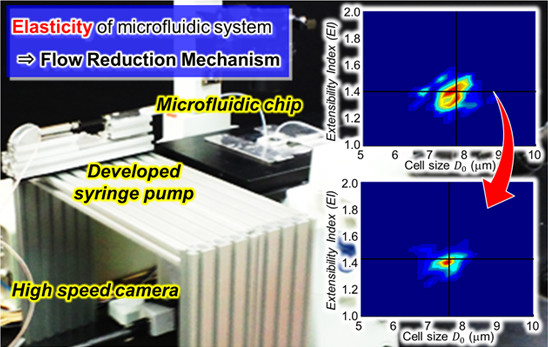
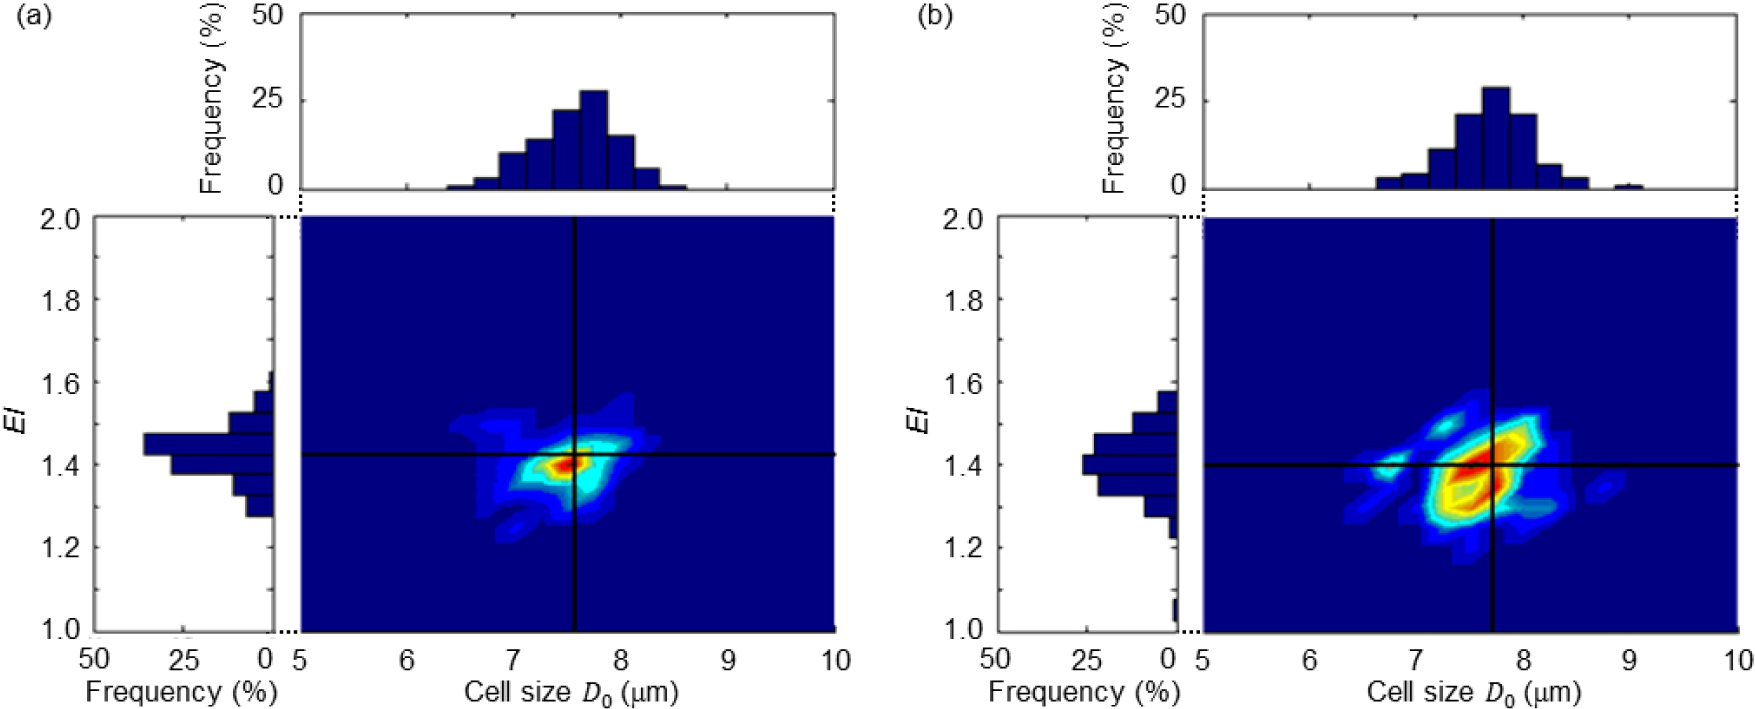
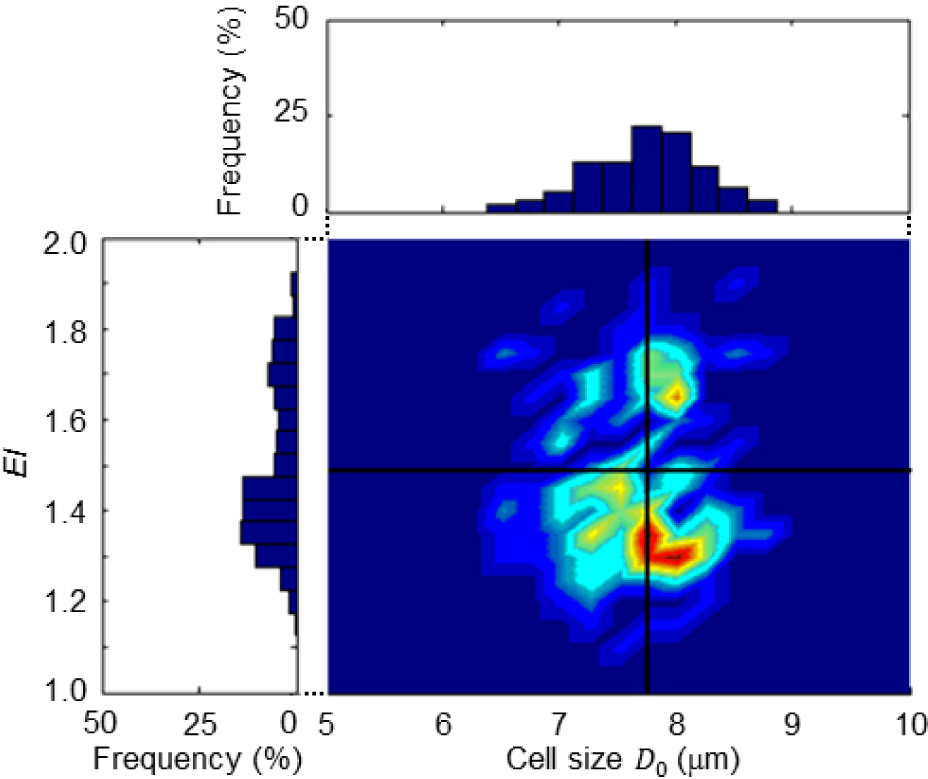
4.2. Extensibility Map

We can evaluate the effect of positioning resolution by using an extensibility map. Figures 7 and 8 show the heat map where the color means the frequency of the data, as shown in Figure 1.
Figure 7 shows the extensibility map for the same blood where Figure 7a,b correspond to the positioning resolution of ±240 nm and ±1200 nm, respectively. To tune the positioning resolution, we purposely changed the resolution of the displacement of the pump δ1 as 1 × 10⁻³ μm and 4 μm for the experiments of Figure 7a,b, respectively. We evaluated the standard deviation as a dispersion index. In Figure 7a, the standard deviations of the original diameter of RBCs and EI are 0.37 μm and 0.06, respectively, while those standard deviations are 0.39 μm and 0.11, respectively, in Figure 7b. Since we use the same blood sample for both experiments, the standard deviations of the original diameter in Figures 7a,b should be close to each other. However, the standard deviations of EI show a different value in each experiment, while the standard deviations of the diameters of RBCs are almost the same. This means that the system with high positioning resolution can suppress the dispersion of the map, as expected. We believe that this is one of the biggest advantages for utilizing such a high resolution positioning system.
Figure 8 shows another example of an extensibility map, where the sample blood is taken from a subject who has a blood transfusion within 24 h. An interesting observation is that the shape of the map is completely different form those shown in Figure 7. We can see that the effect of blood transfusion still remains for the shape of the map in Figure 8, while this tendency can also be observed by the distribution of EI; we can see it at a glance through the extensibility map, where there are multiple groups of EI. These behaviors perhaps come from the remaining effect of the blood transfusion. An important note is that such a true characteristic can be enhanced only by a high resolution cell positioning system.

5. Discussions

Since the difference between RCom and RIncom is Δt/τ, we can regard it as an additional parameter when the elasticity of the microfluidic chip is considered. Now, let us define R ^ by the ratio between the reduction ratio under compressibility and incompressibility.
R ^ = R C o m R I n c o m = Δ t τ
R ^ = 1 means that there is no effect by including the elasticity in the microfluidic chip. Our intention is to achieve R ^ 1. From Figure 4, under Δt = 1 ms, for example, Δt = τ ≃ 10−7, and therefore, the position resolution δ2 is in the order of 10−1δ1. This means that the resolution of cell positioning can be achieved with even higher resolution than that of the piezoelectric actuator. This is because the resolution of the sensing system is not high enough to support the target resolution.

6. Conclusions

In this paper, we proposed a novel concept, the flow reduction mechanism, for high resolution cell positioning in a microfluidic chip. The mechanism is based on the elasticity embedded in the fluid circuit of a microfluidic system and plays an essential role for the high resolution of cell positioning. There is great advantage in that we can easily construct a high resolution cell manipulation system by combining a macro-level actuator and a macro-level position sensor, even though the resolution of the actuator is larger than the desired resolution for cell manipulation. Focusing on this reduction mechanism, we successfully achieved cell position control with a resolution of 240 nm, corresponding to the limitation of the vision system. We also showed the importance of high resolution cell positioning through the extensibility map.

Supplementary Materials

Supplementary materials can be accessed at: https://www.mdpi.com/2072-666X/5/4/1188/s1.

Acknowledgments

A part of this work was supported by the “Hyper Bio Assembler”, the “Nanotechnology Platform Project (Nanotechnology Open Facilities in Osaka University)”, Grant-in-Aid for Challenging Exploratory Research (26630098) of the Ministry of Education, Culture, Sports, Science and Technology”, Creating Hybrid Organs of the Future” at Osaka University and the Japan Society for the Promotion of Science.

Author Contributions

Shinya Sakuma, Keisuke Kuroda, Fumihito Arai and Makoto Kaneko performed conception and design of the study, collection of data, analysis and interpretation of data, drafting of the manuscript and critical revision of the manuscript for important intellectual content. Tatsunori Taniguchi, Tomohito Ohtani and Yasushi Sakata performed design of the study and interpretation of data. All authors read and approved the final manuscript.

Conflicts of Interest

The authors declare no conflict of interest.

References

  1. Sun, Y.; Wan, K.T.; Roberts, K.P.; Bischof, J.C.; Nelson, B.J. Mechanical property characterization of mouse zona pellucida. IEEE Trans. NanoBiosci. 2003, 2, 279–286. [Google Scholar]
  2. Bremmell, K.E.; Evans, A.; Prestidge, C.A. Deformation and nano-rheology of red blood cells: An AFM investigation. Colloids Surf. B Biointerfaces 2006, 50, 43–48. [Google Scholar]
  3. Sakuma, S.; Arai, F. Cellular force measurement using a nanometric-probe-integrated microfluidic chip with a displacement reduction mechanism. J. Robot. Mechatron. 2013, 25, 277–284. [Google Scholar]
  4. Shelby, J.P.; White, J.; Ganesan, K.; Rathod, P.K.; Chiu, D.T. A microfluidic model for single-cell capillary obstruction by plasmodium-falciparuminfected erythrocytes. Proc. Natl. Acad. Sci. USA 2003, 100, 14618–14622. [Google Scholar]
  5. Hirose, Y.; Tadakuma, K.; Higashimori, M.; Arai, T.; Kaneko, M.; Iitsuka, R.; Yamanishi, Y.; Arai, F. A new stiffness evaluation toward high speed cell sorter, Proceedings of the IEEE Internatinal Conference on Robotics and Automation, Anchorage, AK, USA, 3–7 May 2010; pp. 4113–4118.
  6. Adamo, A.; Sharei, A.; Adamo, L.; Lee, B.; Mao, S.; Jensen, K.F. Microfluidics-based assessment of cell deformability. Anal. Chem. 2012, 84, 6438–6443. [Google Scholar]
  7. Zheng, Y.; Shojaei-Baghini, E.; Azad, A.; Wang, C.; Sun, Y. High-throughput biophysical measurement of human red blood cells. Lab Chip 2012, 12, 2560–2567. [Google Scholar]
  8. Fukui, W.; Kaneko, M.; Sakuma, S.; Kawahara, T.; Arai, F. μ-Cell fatigue test, Proceedings of the IEEE Internatinal Conference on Robotics and Automation, Saint Paul, MN, USA, 14–18 May 2012; pp. 4600–4605.
  9. Sakuma, S.; Kuroda, K.; Tsai, C.H.D.; Fukui, W.; Arai, F.; Kaneko, M. Red blood cell fatigue evaluation based on the close-encountering point between extensibility and recoverability. Lab Chip 2014, 14, 1135–1141. [Google Scholar]
  10. Pamme, N.; Wilhelm, C. Magnetism and microfluidics. Lab Chip 2006, 6, 24–38. [Google Scholar]
  11. Maruo, S.; Inoue, H. Optically driven micropump produced by three-dimensional two-photon microfabrication. Appl. Phys. Lett. 2006, 89, 144101. [Google Scholar]
  12. Dao, M.; Lim, C.T.; Suresh, S. Mechanics of the human red blood cell deformed by optical tweezers. J. Mech. Phys. Solids. 2003, 51, 2259–2280. [Google Scholar]
  13. Lintel, H.T.G.V.; Pol, F.C.M.V.D.; Bouwstra, S. A piezoelectric micropump based on micromachining of silicon. Sens. Actuators. 1988, 15, 153–167. [Google Scholar]
  14. Krüger, J.; Singh, K.; O’Neill, A.; Jackson, C.; Morrison, A.; O’Brien, P. Development of a microfluidic device for fluorescence activated cell sorting. J. Micromech. Microeng. 2002, 12, 486–494. [Google Scholar]
  15. Chung, B.G.; Flanagan, L.A.; Rhee, S.W.; Schwartz, P.H.; Lee, A.P.; Monuki, E.S.; Jeon, N.L. Human neural stem cell growth and differentiation in a gradient-generating microfluidic device. Lab Chip 2005, 5, 401–406. [Google Scholar]
  16. Mahalanabis, M.; Muayad, H.A.; Kulinski, M.D.; Altman, D.; Klapperich, C.M. Cell lysis and DNA extraction of gram-positive and gram-negative bacteria from whole blood in a disposable microfluidic chip. Lab Chip 2009, 9, 2811–2817. [Google Scholar]
  17. Ichikawa, A.; Tanikawa, T.; Akagi, S.; Ohba, K. Automatic cell cutting by high-precision microfluidic control. J. Robot. Mechatron. 2011, 23, 13–18. [Google Scholar]
  18. Gomez-Sjoberg, R.; Leyrat, A.A.; Pirone, D.M.; Chen, C.S.; Quake, S.R. Versatile, fully automated, microfluidic cell culture system. Anal. Chem. 2007, 79, 8557–8563. [Google Scholar]
  19. Tai, C.H.; Hsiung, S.K.; Chen, C.Y.; Tsai, M.L.; Lee, G.B. Biomed. Microdevices 2007, 9, 533–543.
  20. Tsukada, K.; Sekizuka, E.; Oshio, C.; Minamitani, H. Direct measurement of erythrocyte deformability in diabetes mellitus with a transparent microchannel capillary model and high-speed video camera system. Microvasc. Res. 2001, 61, 231–239. [Google Scholar]
  21. Lee, S.S.; Yim, Y.; Ahn, K.H.; Lee, S.J. Extensional flow-based assessment of red blood cell deformability using hyperbolic converging microchannel. Biomed. Microdevices 2009, 11, 37–43. [Google Scholar]
  22. Braunmuller, S.; Schmid, L.; Sackmann, E.; Franke, T. Hydrodynamic deformation reveals two coupled modes/time scales of red blood cell relaxation. Soft Matter 2012, 8, 11240–11248. [Google Scholar]
Figure 1. Cell positioning system. (a) The overview of the system and an illustration of cell movement in a microchannel and the contribution of system dispersion to the deformability map by using (b) a high resolution system and (c) a low resolution system.
Micromachines 05 01188f1
Figure 2. Analytical model of the flow reduction mechanism and the target cell motion in the microchannel at each observation time t1, t2, t3 and t when the syringe pump is actuated with a step input of δ1. (a) Without elasticity and (b) with elasticity.
Micromachines 05 01188f2
Figure 3. The developed cell positioning system. (a) An overview of the system and (b) the developed syringe pump.
Micromachines 05 01188f3
Figure 4. The measured cell position when a step input of δ1 = 5 μ m is given to the syringe piston.
Micromachines 05 01188f4
Figure 5. Demonstration of cell positioning. (a) An example of cell position control and (b) the measured cell position with respect to time.
Micromachines 05 01188f5
Figure 6. Extensibility evaluation. (a) An example of the measurement of cell length and (b) EI with respect to the cell velocity.
Micromachines 05 01188f6
Figure 7. Extensibility map for the same blood. (a) Positioning resolution: ±240 nm; (b) positioning resolution: ±1200 nm.
Micromachines 05 01188f7
Figure 8. Extensibility map of a subject who received a blood transfusion within 24 h.
Micromachines 05 01188f8

