
Performance Study of Piezoelectric Injection System Based on Finite Element Simulation

Abstract
:1. Introduction
2. Finite Element Modeling and Simulation of Droplet Ejection Process
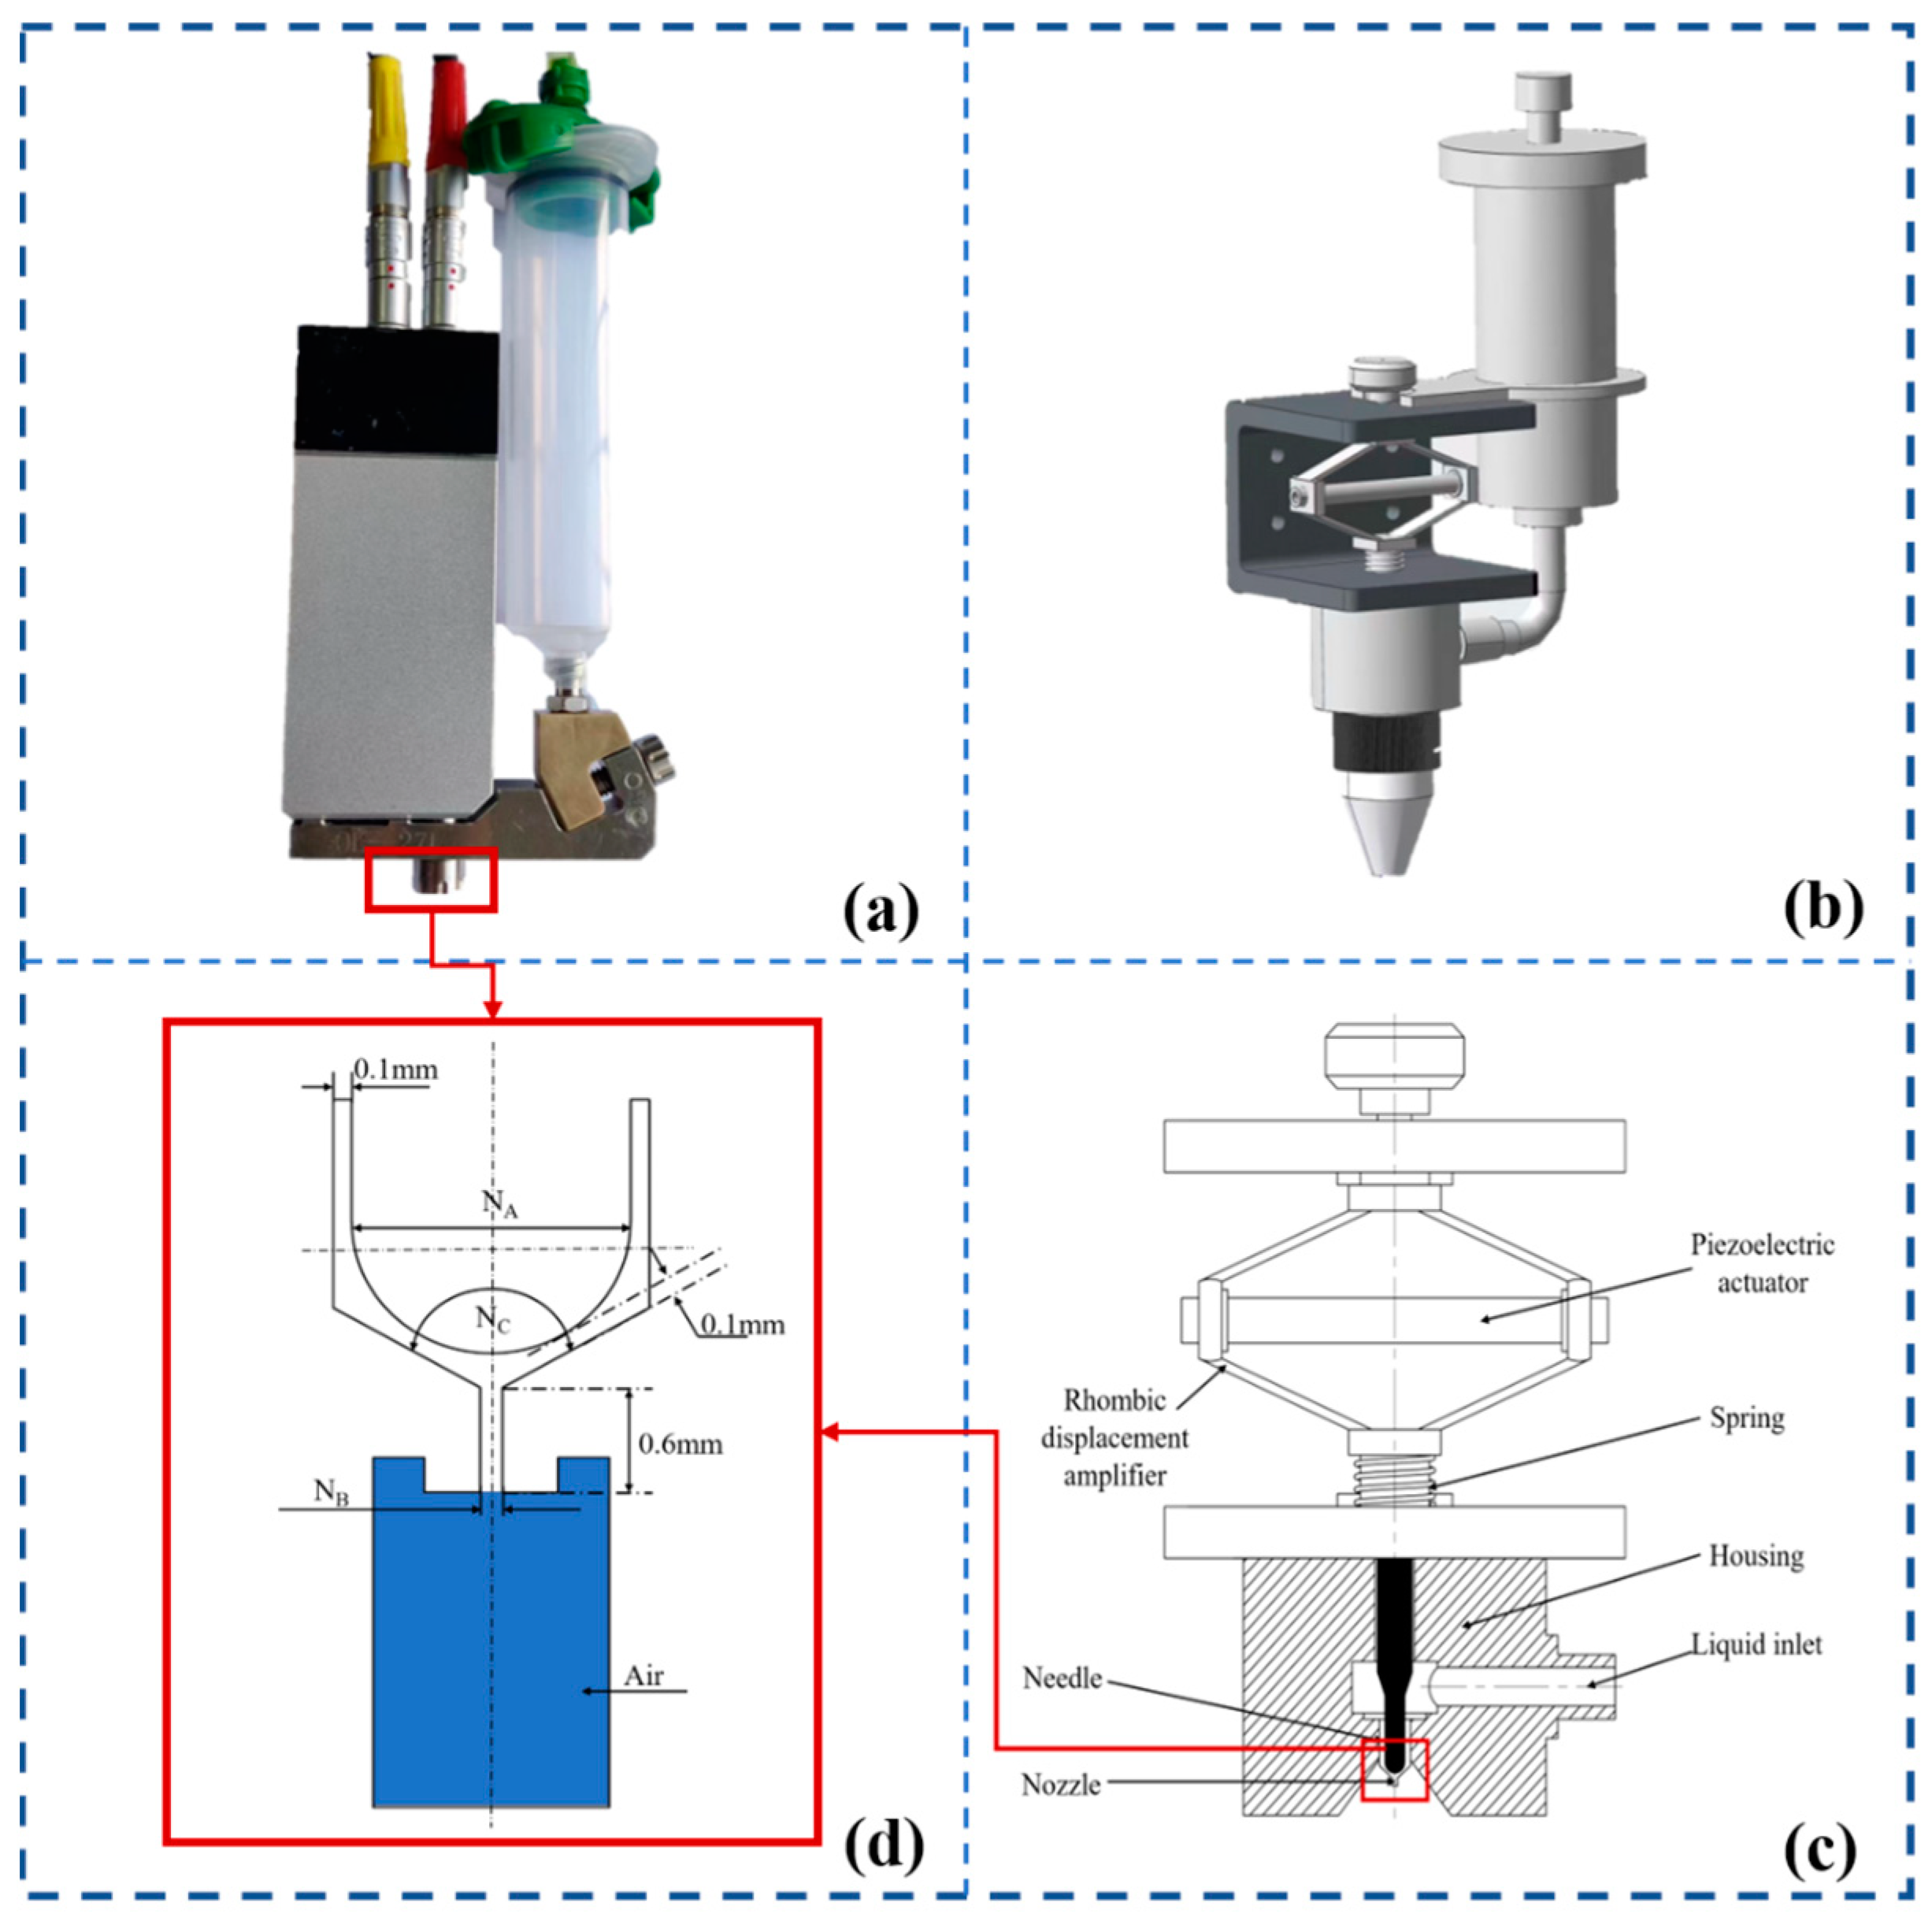
2.1. The Process of Building the Finite Element Model
2.1.1. CAD Model
2.1.2. Theoretical Model
- (i)
- the fluid is an incompressible Newtonian fluid,
- (ii)
- the jetting time is short and the influence of temperature gradient can be ignored.
2.1.3. Generate Meshes and Boundary Conditions
2.2. Finite Element Model
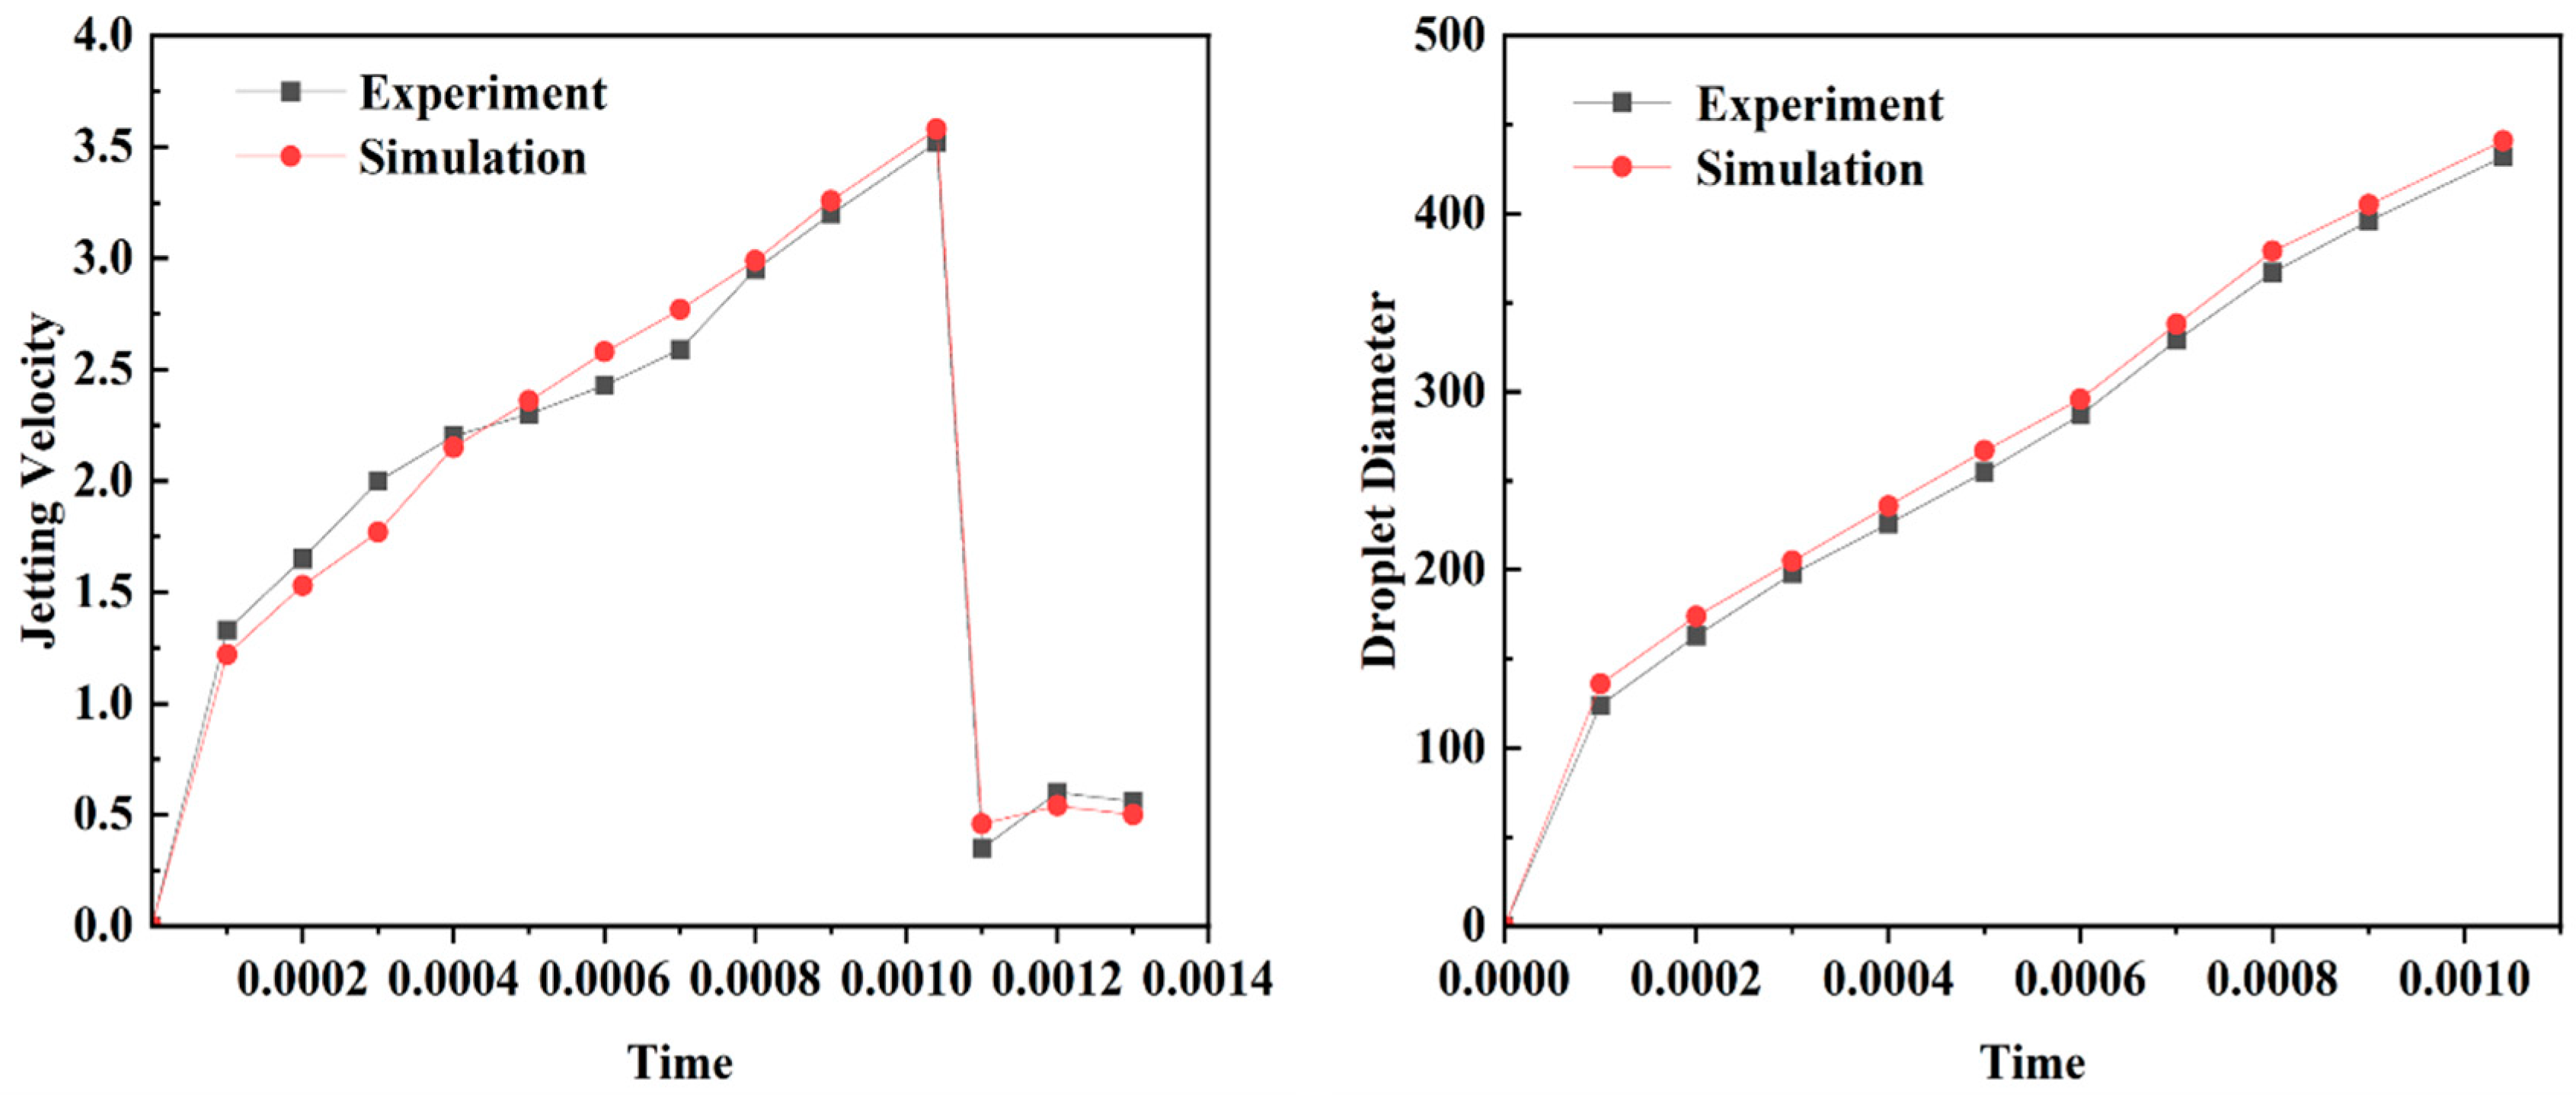
3. Experimental Verification
4. Conclusions
Author Contributions
Funding
Institutional Review Board Statement
Informed Consent Statement
Data Availability Statement
Acknowledgments
Conflicts of Interest
References
- Murphy, S.V.; Atala, A. 3D bioprinting of tissues and organs. Nat. Biotechnol. 2014, 32, 773–785. [Google Scholar] [CrossRef]
- Yang, Y.J.; Kim, H.C.; Sajid, M.; Kim, S.W.; Aziz, S.; Choi, Y.S.; Choi, K.H. Drop-on-Demand Electrohydrodynamic Printing of High Resolution Conductive Micro Patterns for MEMS Repairing. Int. J. Precis. Eng. Manuf. 2018, 19, 811–819. [Google Scholar] [CrossRef]
- Zhang, H.; Moon, S.K.; Ngo, T.H. 3D Printed Electronics of Non-contact Ink Writing Techniques: Status and Promise. Int. J. Precis. Eng. Manuf. 2020, 7, 511–524. [Google Scholar] [CrossRef]
- Chen, F.; Zhang, Y.; Nakagawa, Y.; Zeng, H.; Luo, C.; Nakajima, H.; Uchiyama, K.; Lin, J. A piezoelectric drop-on-demand generator for accurate samples in capillary electrophoresis. Talanta 2013, 107, 111–117. [Google Scholar] [CrossRef]
- Salary, R.R.; Lombardi, J.P.; Samie Tootooni, M.; Donovan, R.; Rao, P.K.; Borgesen, P.; Poliks, M.D. Computational Fluid Dynamics Modeling and Online Monitoring of Aerosol Jet Printing Process. J. Manuf. Sci. Eng. 2016, 139, 021015. [Google Scholar] [CrossRef]
- Shin, D.Y.; Kim, M. Rapid jetting status inspection and accurate droplet volume measurement for a piezo drop-on-demand inkjet print head using a scanning mirror for display applications. Rev. Sci. Instrum. 2017, 88, 25109. [Google Scholar] [CrossRef]
- Mahajan, A.; Frisbie, C.D.; Francis, L.F. Optimization of Aerosol Jet Printing for High-Resolution, High-Aspect Ratio Silver Lines. ACS Appl. Mater. Interfaces 2013, 5, 4856–4864. [Google Scholar] [CrossRef] [PubMed]
- Mao, M.; He, J.; Li, X.; Zhang, B.; Lei, Q.; Liu, Y.; Li, D. The Emerging Frontiers and Applications of High-Resolution 3D Printing. Micromachines 2017, 8, 113. [Google Scholar] [CrossRef] [Green Version]
- Bartolo, D.; Boudaoud, A.; Narcy, G.; Bonn, D. Dynamics of Non-Newtonian Droplets. Phys. Rev. Lett. 2007, 99, 174502. [Google Scholar] [CrossRef]
- Mao, Z.; Asai, Y.; Yamanoi, A.; Seki, Y.; Wiranata, A.; Minaminosono, A. Fluidic rolling robot using voltage-driven oscillating liquid. Smart Mater. Struct. 2022, 31, 105006. [Google Scholar] [CrossRef]
- Kwon, K. Speed measurement of ink droplet by using edge detection techniques. Measurement 2009, 42, 44–50. [Google Scholar] [CrossRef]
- Mao, Z.; Asai, Y.; Wiranata, A.; Kong, D.; Man, J. Eccentric actuator driven by stacked electrohydrodynamic pumps. J. Zhejiang Univ. Sci. A 2022, 23, 329–334. [Google Scholar] [CrossRef]
- Tsai, M.H.; Hwang, W.S.; Chou, H.H.; Hsieh, P.H. Effects of pulse voltage on inkjet printing of a silver nanopowder suspension. Nanotechnology 2008, 19, 335304. [Google Scholar] [CrossRef]
- Swaminathan, C.R.; Voller, V.R. A time-implicit filling algorithm. Appl. Math. Model. 1994, 18, 101–108. [Google Scholar] [CrossRef]
- Pan, Y.; Zeng, L. Simulation and Validation of Droplet Generation Process for Revealing Three Design Constraints in Electrohydrodynamic Jet Printing. Micromachines 2019, 10, 94. [Google Scholar] [CrossRef] [PubMed] [Green Version]
- Zhong, Y.; Fang, H.; Ma, Q.; Dong, X. Analysis of droplet stability after ejection from an inkjet nozzle. J. Fluid Mech. 2018, 845, 378–391. [Google Scholar] [CrossRef]
- Liou, T.; Chan, C.; Shih, K. Effects of actuating waveform, ink property, and nozzle size on piezoelectrically driven inkjet droplets. Microfluid. Nanofluid. 2010, 8, 575–586. [Google Scholar] [CrossRef]
- Liu, Y.; Derby, B. Experimental study of the parameters for stable drop-on-demand inkjet performance. Phys. Fluids 2019, 31, 32004. [Google Scholar] [CrossRef] [Green Version]
- Ktari, A.; El Mansori, M. Intelligent approach based on FEM simulations and soft computing techniques for filling system design optimisation in sand casting processes. Int. J. Adv. Manuf. Technol. 2021, 114, 981–995. [Google Scholar] [CrossRef]
- Feng, Y.; Liu, J.; Li, K.; Li, H.; Deng, J.; Liu, Y. Waveform Optimization of Piezoelectric Micro-Jet for the Control of Metal Micro-Droplet Ejection. IEEE Trans. Ind. Electron. 2022, 69, 3967–3976. [Google Scholar] [CrossRef]
- Huang, J.; Segura, L.J.; Wang, T.; Zhao, G.; Sun, H.; Zhou, C. Unsupervised learning for the droplet evolution prediction and process dynamics understanding in inkjet printing. Addit. Manuf. 2020, 35, 101197. [Google Scholar] [CrossRef]
- Falahat, A. Sensitivity analysis of boehmite alumina nanofluid in a novel cylindrical heat sink with hybrid helical-straight minichannels using the taguchi method and statistical analysis. Int. J. Therm. Sci. 2023, 185, 108035. [Google Scholar] [CrossRef]
- Vidakis, N.; Petousis, M.; Mountakis, N.; Moutsopoulou, A.; Karapidakis, E. Energy Consumption vs. Tensile Strength of Poly[methyl methacrylate] in Material Extrusion 3D Printing: The Impact of Six Control Settings. Polymers 2023, 15, 845. [Google Scholar] [CrossRef] [PubMed]
- Aramli, M.S.; Sarvi Moghanlou, K.; Imani, A. Effect of dietary antioxidant supplements (selenium forms, alpha-tocopherol, and coenzyme Q10) on growth performance, immunity, and physiological responses in rainbow trout (Oncorhynchus mykiss) using orthogonal array design. Fish Shellfish. Immunol. 2023, 134, 108615. [Google Scholar] [CrossRef] [PubMed]
- Shirpurkar, P.P.; Kamble, P.D.; Bobde, S.R.; Patil, V.V. Optimization of CNC Turning Process Parameters for Prediction of Surface Roughness by Taguchi Orthogonal Array; ESRSA Publications: Gujarat, India, 2014. [Google Scholar]
- Ball, A.K.; Das, R.; Das, D.; Roy, S.S.; Murmu, N.C. Design, Development and Experimental Investigation of E-jet Based Additive Manufacturing Process. Mater. Today Proc. 2018, 5, 7355–7362. [Google Scholar] [CrossRef]
- De Ferreira, B.C.; Coutinho, T.; Ayala Botto, M.; Cardoso, S. Development of an Inkjet Setup for Printing and Monitoring Microdroplets. Micromachines 2022, 13, 1878. [Google Scholar] [CrossRef]


| Parameter | Fluid Viscosity | Fluid Density | Surface Tension |
|---|---|---|---|
| Value | 0.02 Pa.s | 1.45 g/cm3 | 0.05 N/m |
| Data Case No. | Needle Diameter (mm) | Nozzle Diameter (mm) | Nozzle Taper (°) | Needle Speed m s−1 | Jetting Velocity m s−1 | Droplet Diameter (μm) |
|---|---|---|---|---|---|---|
| NA | NB | NC | ND | |||
| 1. | 1 | 0.04 | 60 | 0.3 | 4.13 | 320 |
| 2. | 1 | 0.08 | 75 | 0.4 | 4.21 | 419 |
| 3. | 1 | 0.12 | 90 | 0.5 | 3.36 | 376 |
| 4. | 1 | 0.16 | 105 | 0.6 | 2.79 | 326 |
| 5. | 1 | 0.20 | 120 | 0.7 | 2.34 | 313 |
| 6. | 1.25 | 0.04 | 75 | 0.7 | 12.80 | 247 |
| 7. | 1.25 | 0.08 | 90 | 0.3 | 3.52 | 436 |
| 8. | 1.25 | 0.12 | 105 | 0.4 | 2.86 | 381 |
| 9. | 1.25 | 0.16 | 120 | 0.5 | 2.36 | 338 |
| 10. | 1.25 | 0.20 | 60 | 0.6 | 3.78 | 487 |
| 11. | 1.5 | 0.04 | 90 | 0.6 | 16.13 | 340 |
| 12. | 1.5 | 0.08 | 105 | 0.7 | 7.78 | 317 |
| 13. | 1.5 | 0.12 | 120 | 0.3 | 2.13 | 378 |
| 14. | 1.5 | 0.16 | 60 | 0.4 | 3.58 | 568 |
| 15. | 1.5 | 0.20 | 75 | 0.5 | 3.35 | 476 |
| 16. | 1.75 | 0.04 | 105 | 0.5 | 11.00 | 281 |
| 17. | 1.75 | 0.08 | 120 | 0.6 | 6.69 | 331 |
| 18. | 1.75 | 0.12 | 60 | 0.7 | 8.96 | 520 |
| 19. | 1.75 | 0.16 | 75 | 0.3 | 2.85 | 546 |
| 20. | 1.75 | 0.20 | 90 | 0.4 | 2.83 | 445 |
| 21. | 2 | 0.04 | 120 | 0.4 | 10.33 | 223 |
| 22. | 2 | 0.08 | 60 | 0.5 | 11.37 | 614 |
| 23. | 2 | 0.12 | 75 | 0.6 | 8.21 | 525 |
| 24. | 2 | 0.16 | 90 | 0.7 | 6.78 | 427 |
| 25. | 2 | 0.20 | 105 | 0.3 | 2.12 | 461 |
| 26. | 1 | 0.04 | 60 | 0.7 | 15.25 | 296 |
| 27. | 1.25 | 0.16 | 75 | 0.5 | 3.53 | 453 |
| 28. | 1.5 | 0.08 | 90 | 0.3 | 4.08 | 439 |
| 29. | 1.75 | 0.2 | 105 | 0.6 | 3.76 | 384 |
| 30. | 2 | 0.12 | 120 | 0.4 | 3.73 | 398 |
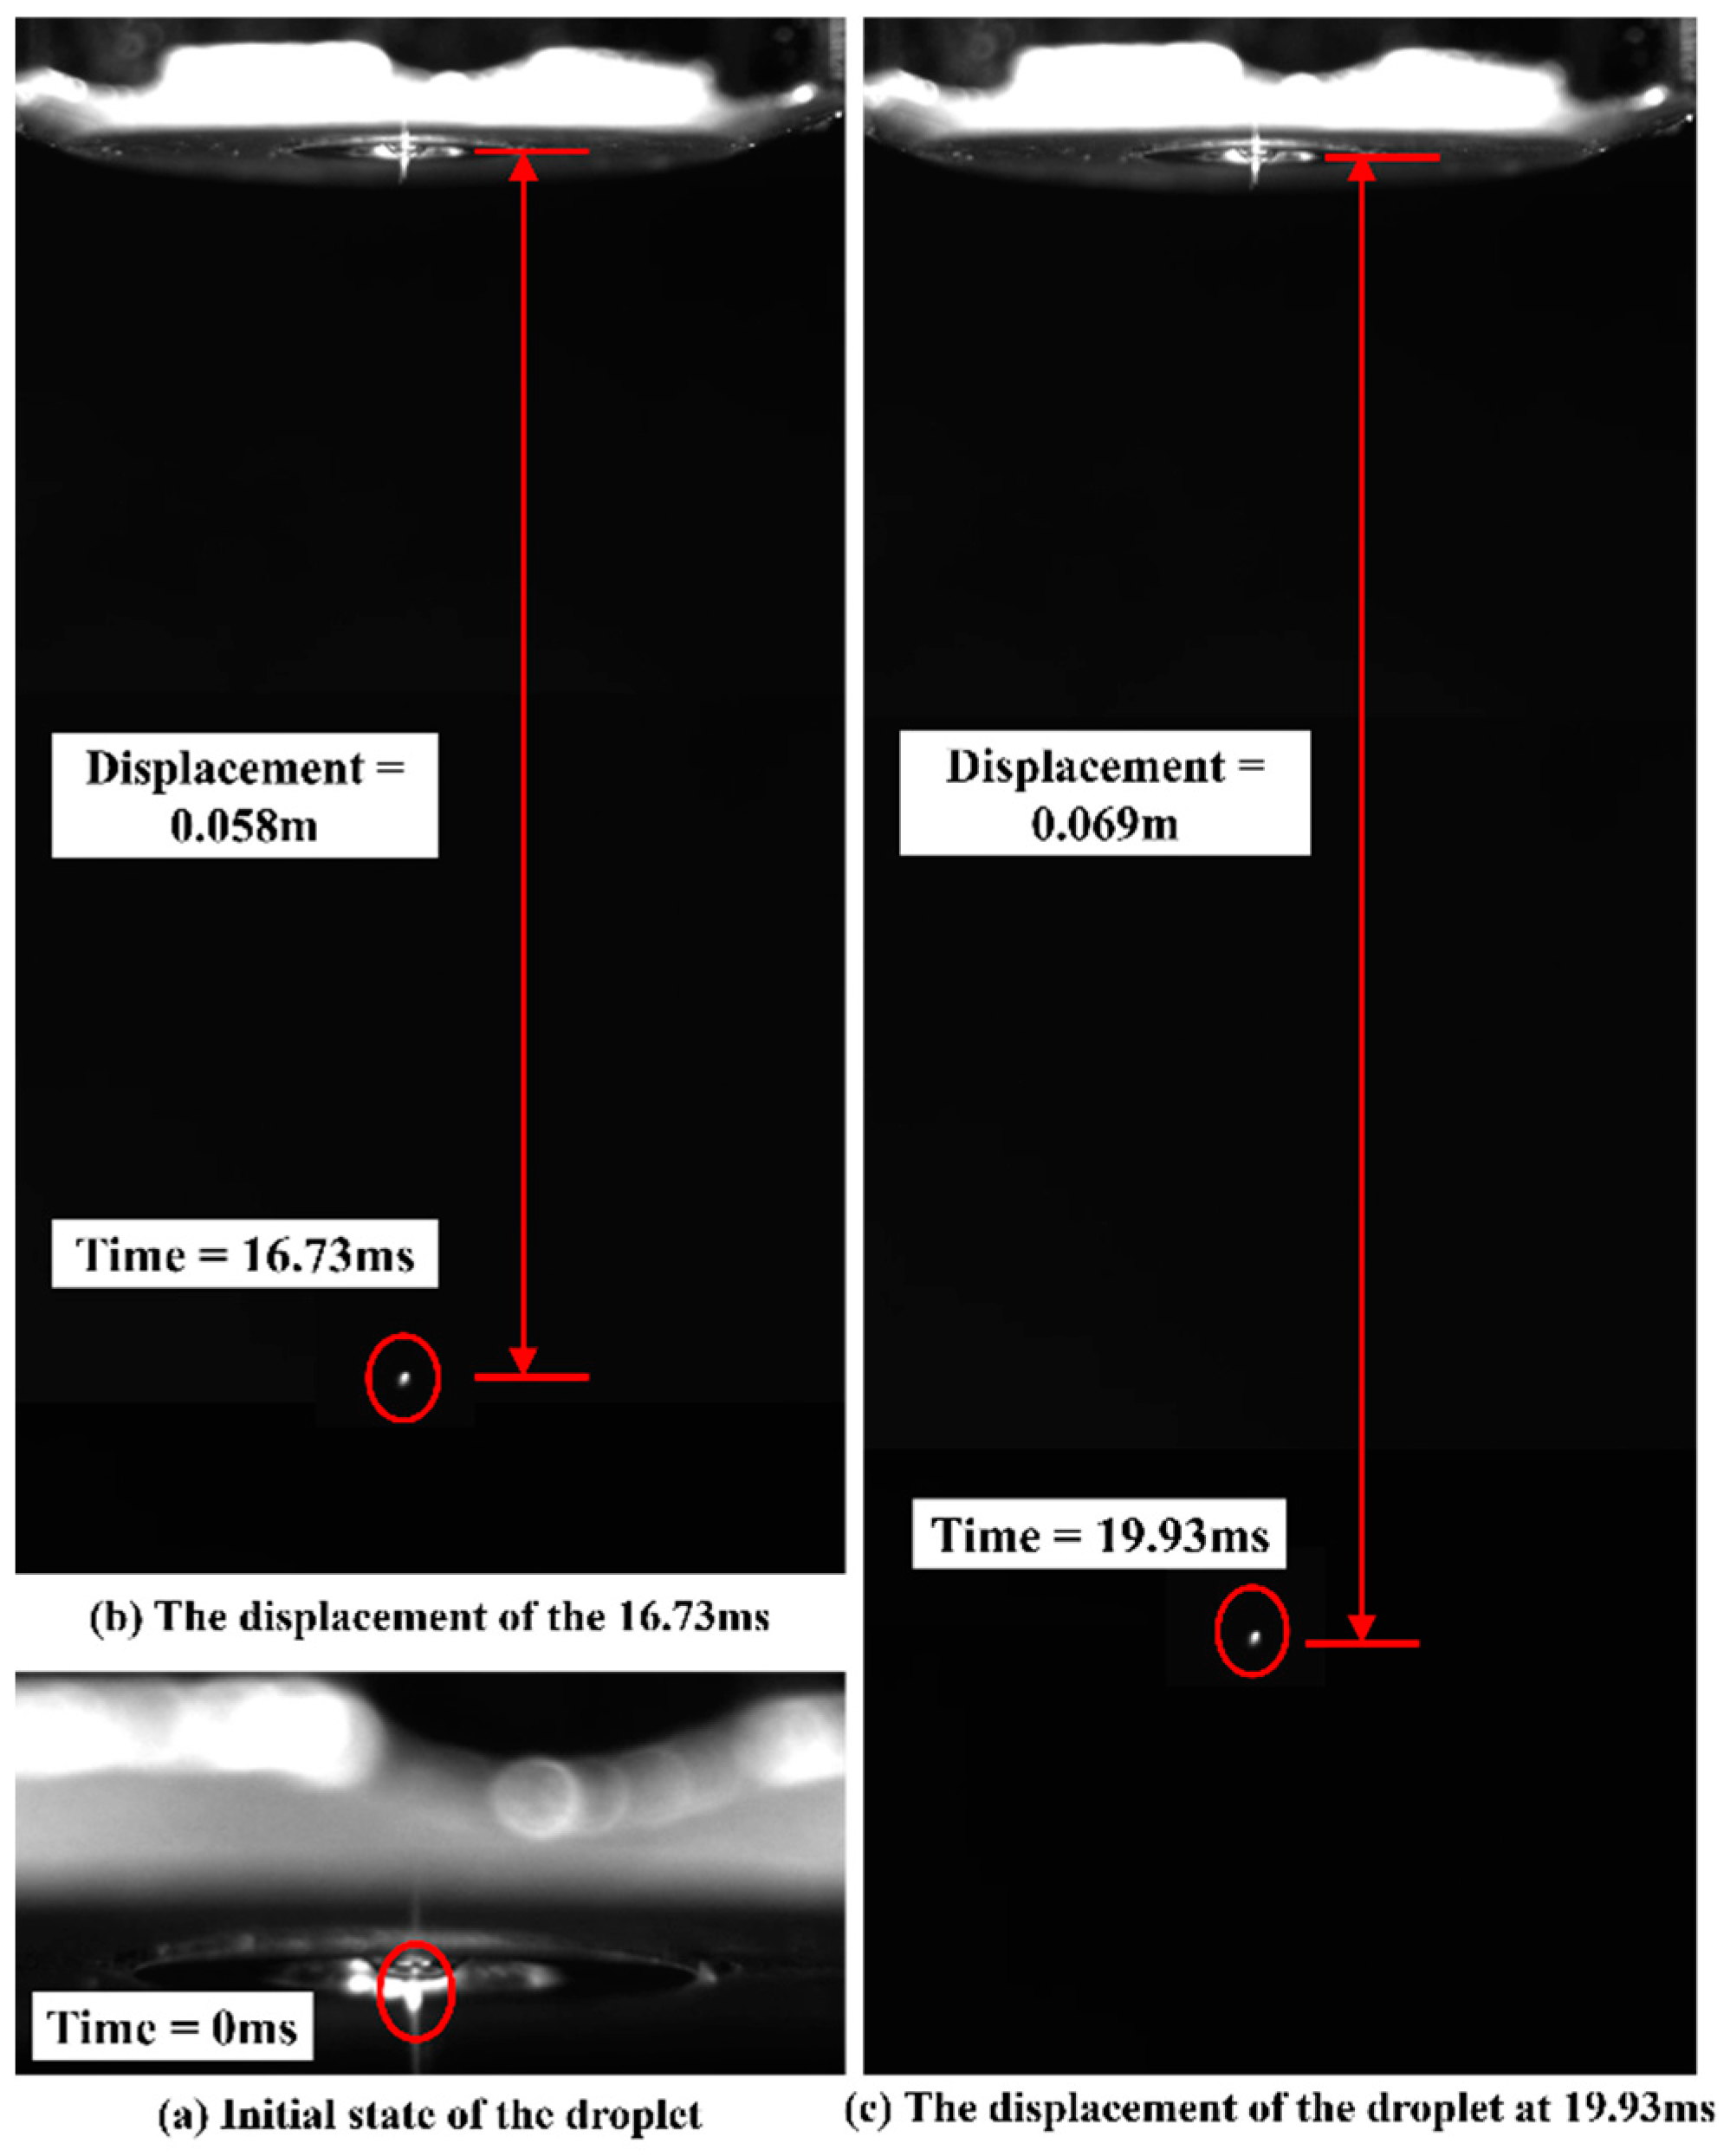
| Group | Num. | Displacement (m) | Time (s) | Droplet Diameter (μm) | Jetting Velocity (m/s) |
|---|---|---|---|---|---|
| Group 1 | 1 | 0.055 | 0.01573 | 483 | 3.51 |
| 2 | 0.066 | 0.01890 | |||
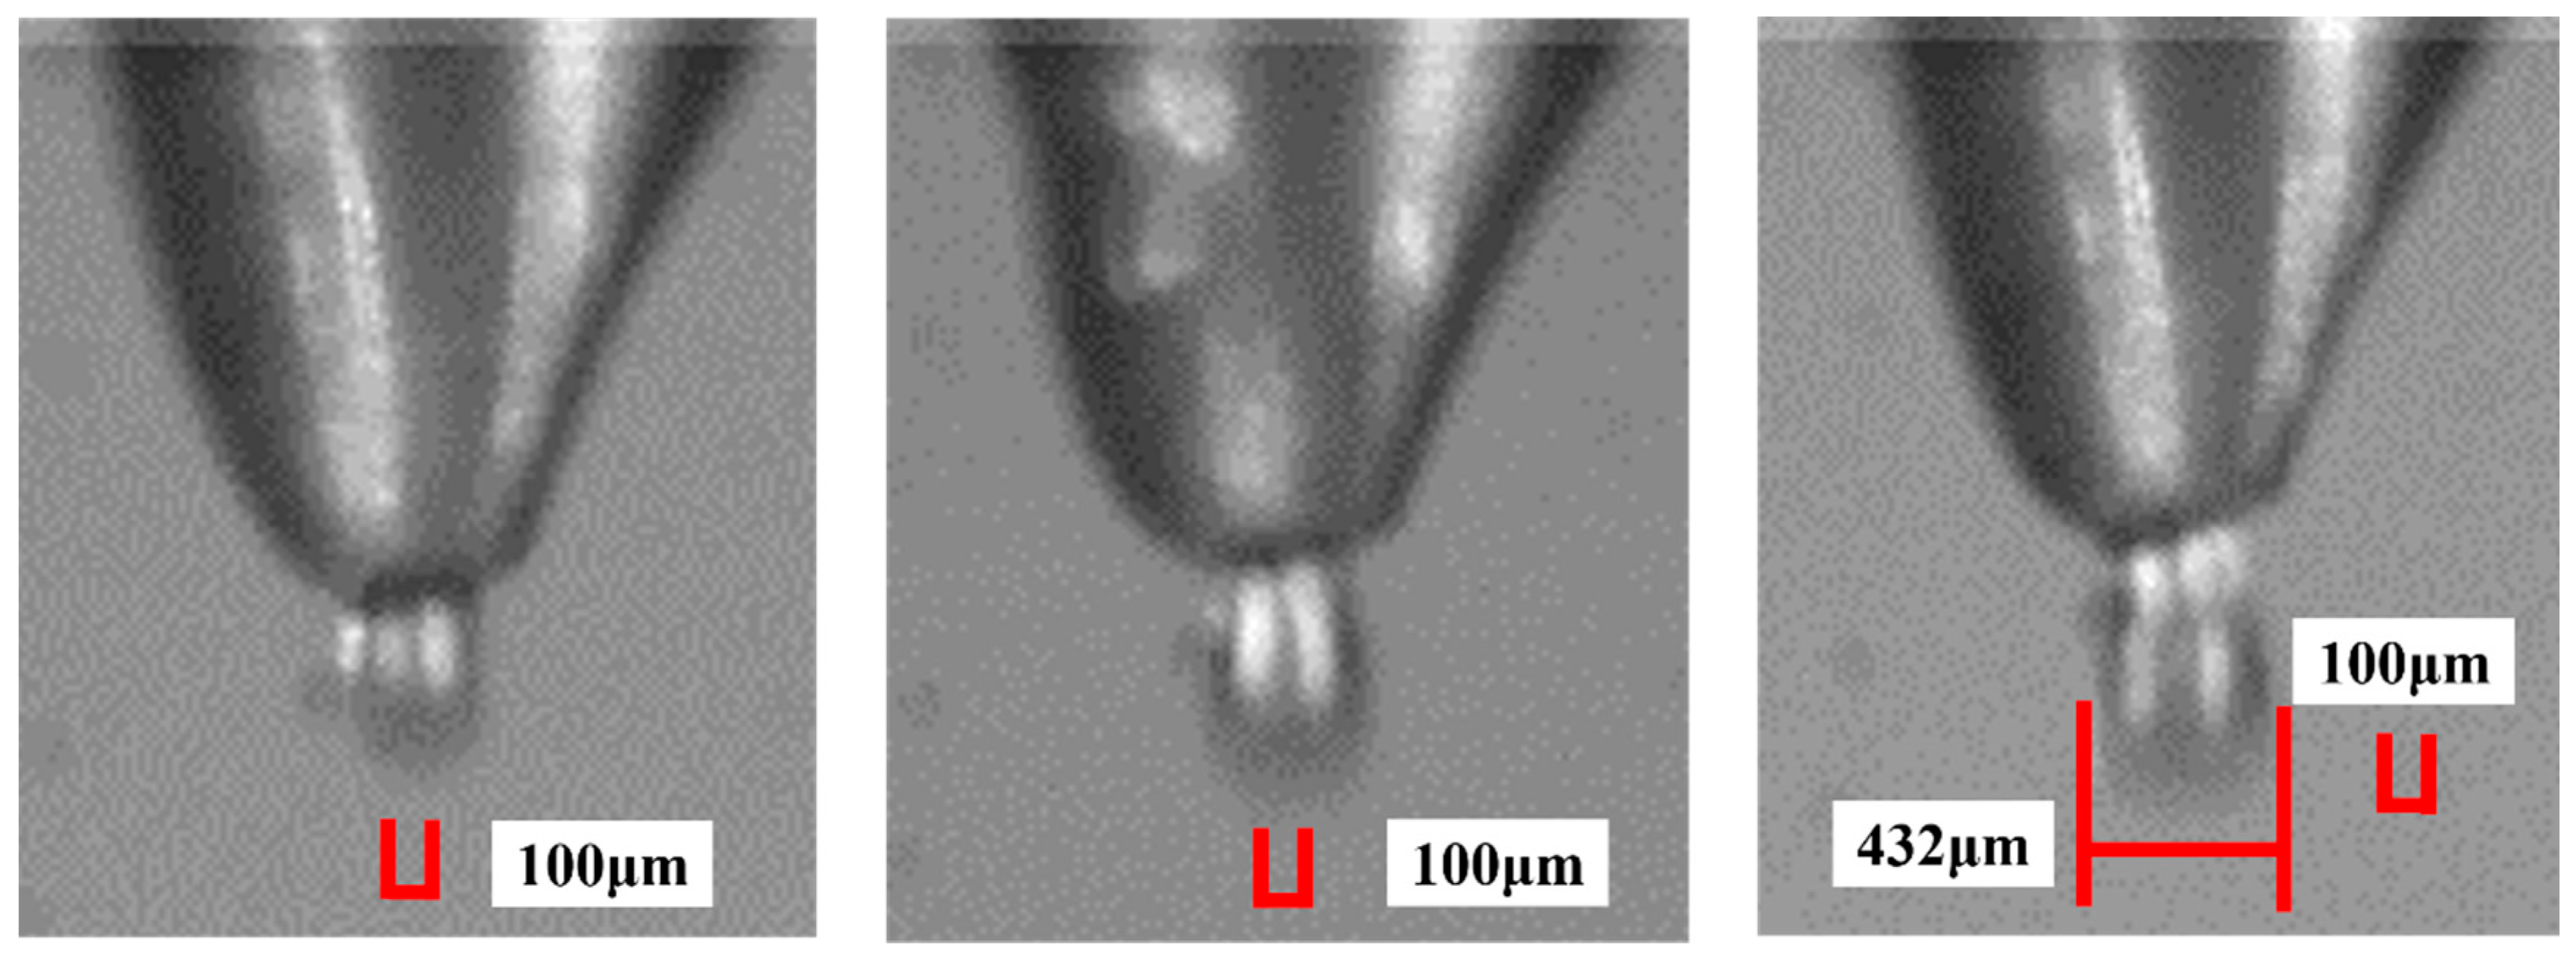
| Group 2 | 3 | 0.058 | 0.01673 | 432 | 3.58 |
| 4 | 0.069 | 0.01993 | |||
| Group 3 | 5 | 0.060 | 0.01699 | 466 | 3.69 |
| 6 | 0.072 | 0.02042 | |||
| Group 4 | 7 | 0.073 | 0.01946 | 458 | 3.75 |
| 8 | 0.085 | 0.02269 | |||
| Group 5 | 9 | 0.078 | 0.02251 | 477 | 3.66 |
| 10 | 0.091 | 0.02630 | |||
| Average value | 463.2 | 3.64 |
Disclaimer/Publisher’s Note: The statements, opinions and data contained in all publications are solely those of the individual author(s) and contributor(s) and not of MDPI and/or the editor(s). MDPI and/or the editor(s) disclaim responsibility for any injury to people or property resulting from any ideas, methods, instructions or products referred to in the content. |
© 2023 by the authors. Licensee MDPI, Basel, Switzerland. This article is an open access article distributed under the terms and conditions of the Creative Commons Attribution (CC BY) license (https://creativecommons.org/licenses/by/4.0/).
Share and Cite
Li, X.; Zhao, Y. Performance Study of Piezoelectric Injection System Based on Finite Element Simulation. Micromachines 2023, 14, 738. https://doi.org/10.3390/mi14040738
Li X, Zhao Y. Performance Study of Piezoelectric Injection System Based on Finite Element Simulation. Micromachines. 2023; 14(4):738. https://doi.org/10.3390/mi14040738
Chicago/Turabian StyleLi, Xin, and Yongsheng Zhao. 2023. "Performance Study of Piezoelectric Injection System Based on Finite Element Simulation" Micromachines 14, no. 4: 738. https://doi.org/10.3390/mi14040738