
Biomechanical Assessment of Red Blood Cells in Pulsatile Blood Flows


Department of Mechanical Engineering, Chosun University, 309 Pilmun-daero, Dong-gu, Gwangju 61452, Republic of Korea
Micromachines 2023, 14(2), 317; https://doi.org/10.3390/mi14020317
Submission received: 6 January 2023
/
Revised: 24 January 2023
/
Accepted: 24 January 2023
/
Published: 26 January 2023
(This article belongs to the Special Issue Microfluidics and Biosensors for Point-of-Care Applications)
Abstract
:As rheological properties are substantially influenced by red blood cells (RBCs) and plasma, the separation of their individual contributions in blood is essential. The estimation of multiple rheological factors is a critical issue for effective early detection of diseases. In this study, three rheological properties (i.e., viscoelasticity, RBC aggregation, and blood junction pressure) are measured by analyzing the blood velocity and image intensity in a microfluidic device. Using a single syringe pump, the blood flow rate sets to a pulsatile flow pattern (Qb[t] = 1 + 0.5 sin(2πt/240) mL/h). Based on the discrete fluidic circuit model, the analytical formula of the time constant (λb) as viscoelasticity is derived and obtained at specific time intervals by analyzing the pulsatile blood velocity. To obtain RBC aggregation by reducing blood velocity substantially, an air compliance unit (ACU) is used to connect polyethylene tubing (i.d. = 250 µm, length = 150 mm) to the blood channel in parallel. The RBC aggregation index (AI) is obtained by analyzing the microscopic image intensity. The blood junction pressure (β) is obtained by integrating the blood velocity within the ACU. As a demonstration, the present method is then applied to detect either RBC-aggregated blood with different concentrations of dextran solution or hardened blood with thermally shocked RBCs. Thus, it can be concluded that the present method has the ability to consistently detect differences in diluent or RBCs in terms of three rheological properties.
1. Introduction
Red blood cells (RBCs) are highly deformable and constitute 40–50% of the blood volume. They carry oxygen into peripheral tissues and discharged carbon dioxide from them [1]. Rheological properties (including viscoelasticity, RBC aggregation, and deformability) are determined by RBCs and plasma. They significantly contribute to the varying blood flow in the capillary vessels [2]. Abnormal rheological changes induce blood clotting, irregular blood flow, and blockage of the blood vessels. The change of rheological properties of blood has been observed and correlated to diseases (such as lung cancer [3], sickle cell anemia [4,5,6], neurological disease [7], diabetes [8,9], chronic venous disease [10], atopic dermatitis [11], hypertension [12], and cardiovascular disease [13]). Based on the strong correlation between diseases and rheological properties [14], the mechanical properties of blood have been probed to monitor variations in the blood collected from patients. As rheological properties are substantially influenced by RBCs and plasma, it is necessary to decouple individual contributions. The measurement of multiple properties has been regarded as a critical issue for the effective detection of diseases.
Microfluidic devices that can provide in vitro biological microenvironments [15,16] or physiological capillary vessel structures [17] have been extensively adopted to measure rheological properties [18,19,20]. Several rheological properties, including viscosity [21,22,23,24,25], viscoelasticity [26], aggregation (or sedimentation) [27,28], deformability [29], and hematocrit [25,30,31], have been obtained by manipulating blood flows in microfluidic environments [32,33].
Among several rheological properties, blood viscosity, as a determinant factor of fluidic resistance, can be obtained by quantifying the blood flow in the capillary channel under a specific blood flow rate. As blood viscosity plays an important role in determining blood flow, several methodologies have focused on the quantification of blood flow, including interfacial relocation [34,35,36], liquid–air interface movement [25,37,38], droplet length [20,21], and membrane displacement [39,40,41]. Being influenced by several factors including RBC deformability, hematocrit, and plasma proteins, blood viscosity alone does not provide sufficient information for understanding the contribution of individual factors. RBC aggregation occurs at a sufficiently low shear rate or stasis rather than at higher shear rates. It is largely influenced by several factors such as the viscoelastic membrane, RBC morphology, and plasma proteins [42,43]. The RBC aggregation index (AI) is obtained by analyzing the image intensity of the blood flow in the capillary channel after stopping the blood delivery source [44,45,46]. Instead of the image intensity of RBC aggregation, a new term shear stress has been suggested as an alternative parameter for quantifying the degree of RBC disaggregation under continuous blood flow [47,48]. The shear stress estimated in a co-flowing channel has been used to quantify RBC sedimentation in the driving syringe [49]. According to previous studies, RBC aggregation has been quantified during stasis. It aims to detect changes in plasma proteins rather than the mechanical properties of RBC under continuous blood flow. As rheological properties (i.e., viscoelasticity and hematocrit) have a strong influence on RBC aggregation, they should be monitored by measuring RBC aggregation. Recently, based on parallel flow manipulation, RBC aggregation has been measured in the turn-off setting of the syringe pump. Subsequently, blood viscosity is obtained at the turn-on setting of the syringe pump [50]. Here, it is necessary to set a constant flow rate for the reference fluid, whose viscosity is specified in advance. Thus, two pumps are required to supply two fluids (i.e., the reference fluid and blood) with precise control of the flow rate. Furthermore, the previous method required blood flow to be stopped to measure RBC aggregation. To overcome the limitations of previous methods, it is necessary to measure RBC aggregation and rheological properties simultaneously, even without stopping blood flow. Moreover, because blood flow shows a pulsatile pattern in physiological environments [51,52,53], rheological properties should be monitored under continuous pulsatile blood flow.
In this study, three rheological properties (viscoelasticity, RBC aggregation, and blood junction pressure) were simultaneously measured by analyzing the blood velocity and microscopic image intensity. To quantify viscoelasticity (i.e., time constant), the blood flow was set to pulsatile flow patterns with a single syringe pump. The time constant was then obtained by analyzing the blood velocity using a simple mathematical model. Next, to induce RBC aggregation at a low shear rate, an air compliance unit (ACU) is connected to the blood channel in parallel. As the blood velocity decreases substantially inside the ACU, RBC aggregation occurs. RBC aggregation was then obtained from the microscopic image intensity of the blood flow. Finally, the blood velocity within the ACU was used to estimate variations in blood junction pressure over time.
Compared with previous studies, the present method can simultaneously measure three rheological properties (i.e., viscoelasticity, RBC aggregation, and blood junction pressure) under continuous pulsatile blood flow. By replacing the blood viscosity with the viscoelasticity, the syringe pump is reduced. A single syringe pump is sufficient to supply blood with a pulsatile profile. By connecting a simple ACU to the main channel in parallel, three rheological properties can be obtained at specific intervals.
2. Materials and Methods
2.1. Microfluidic Device and Experimental Setup
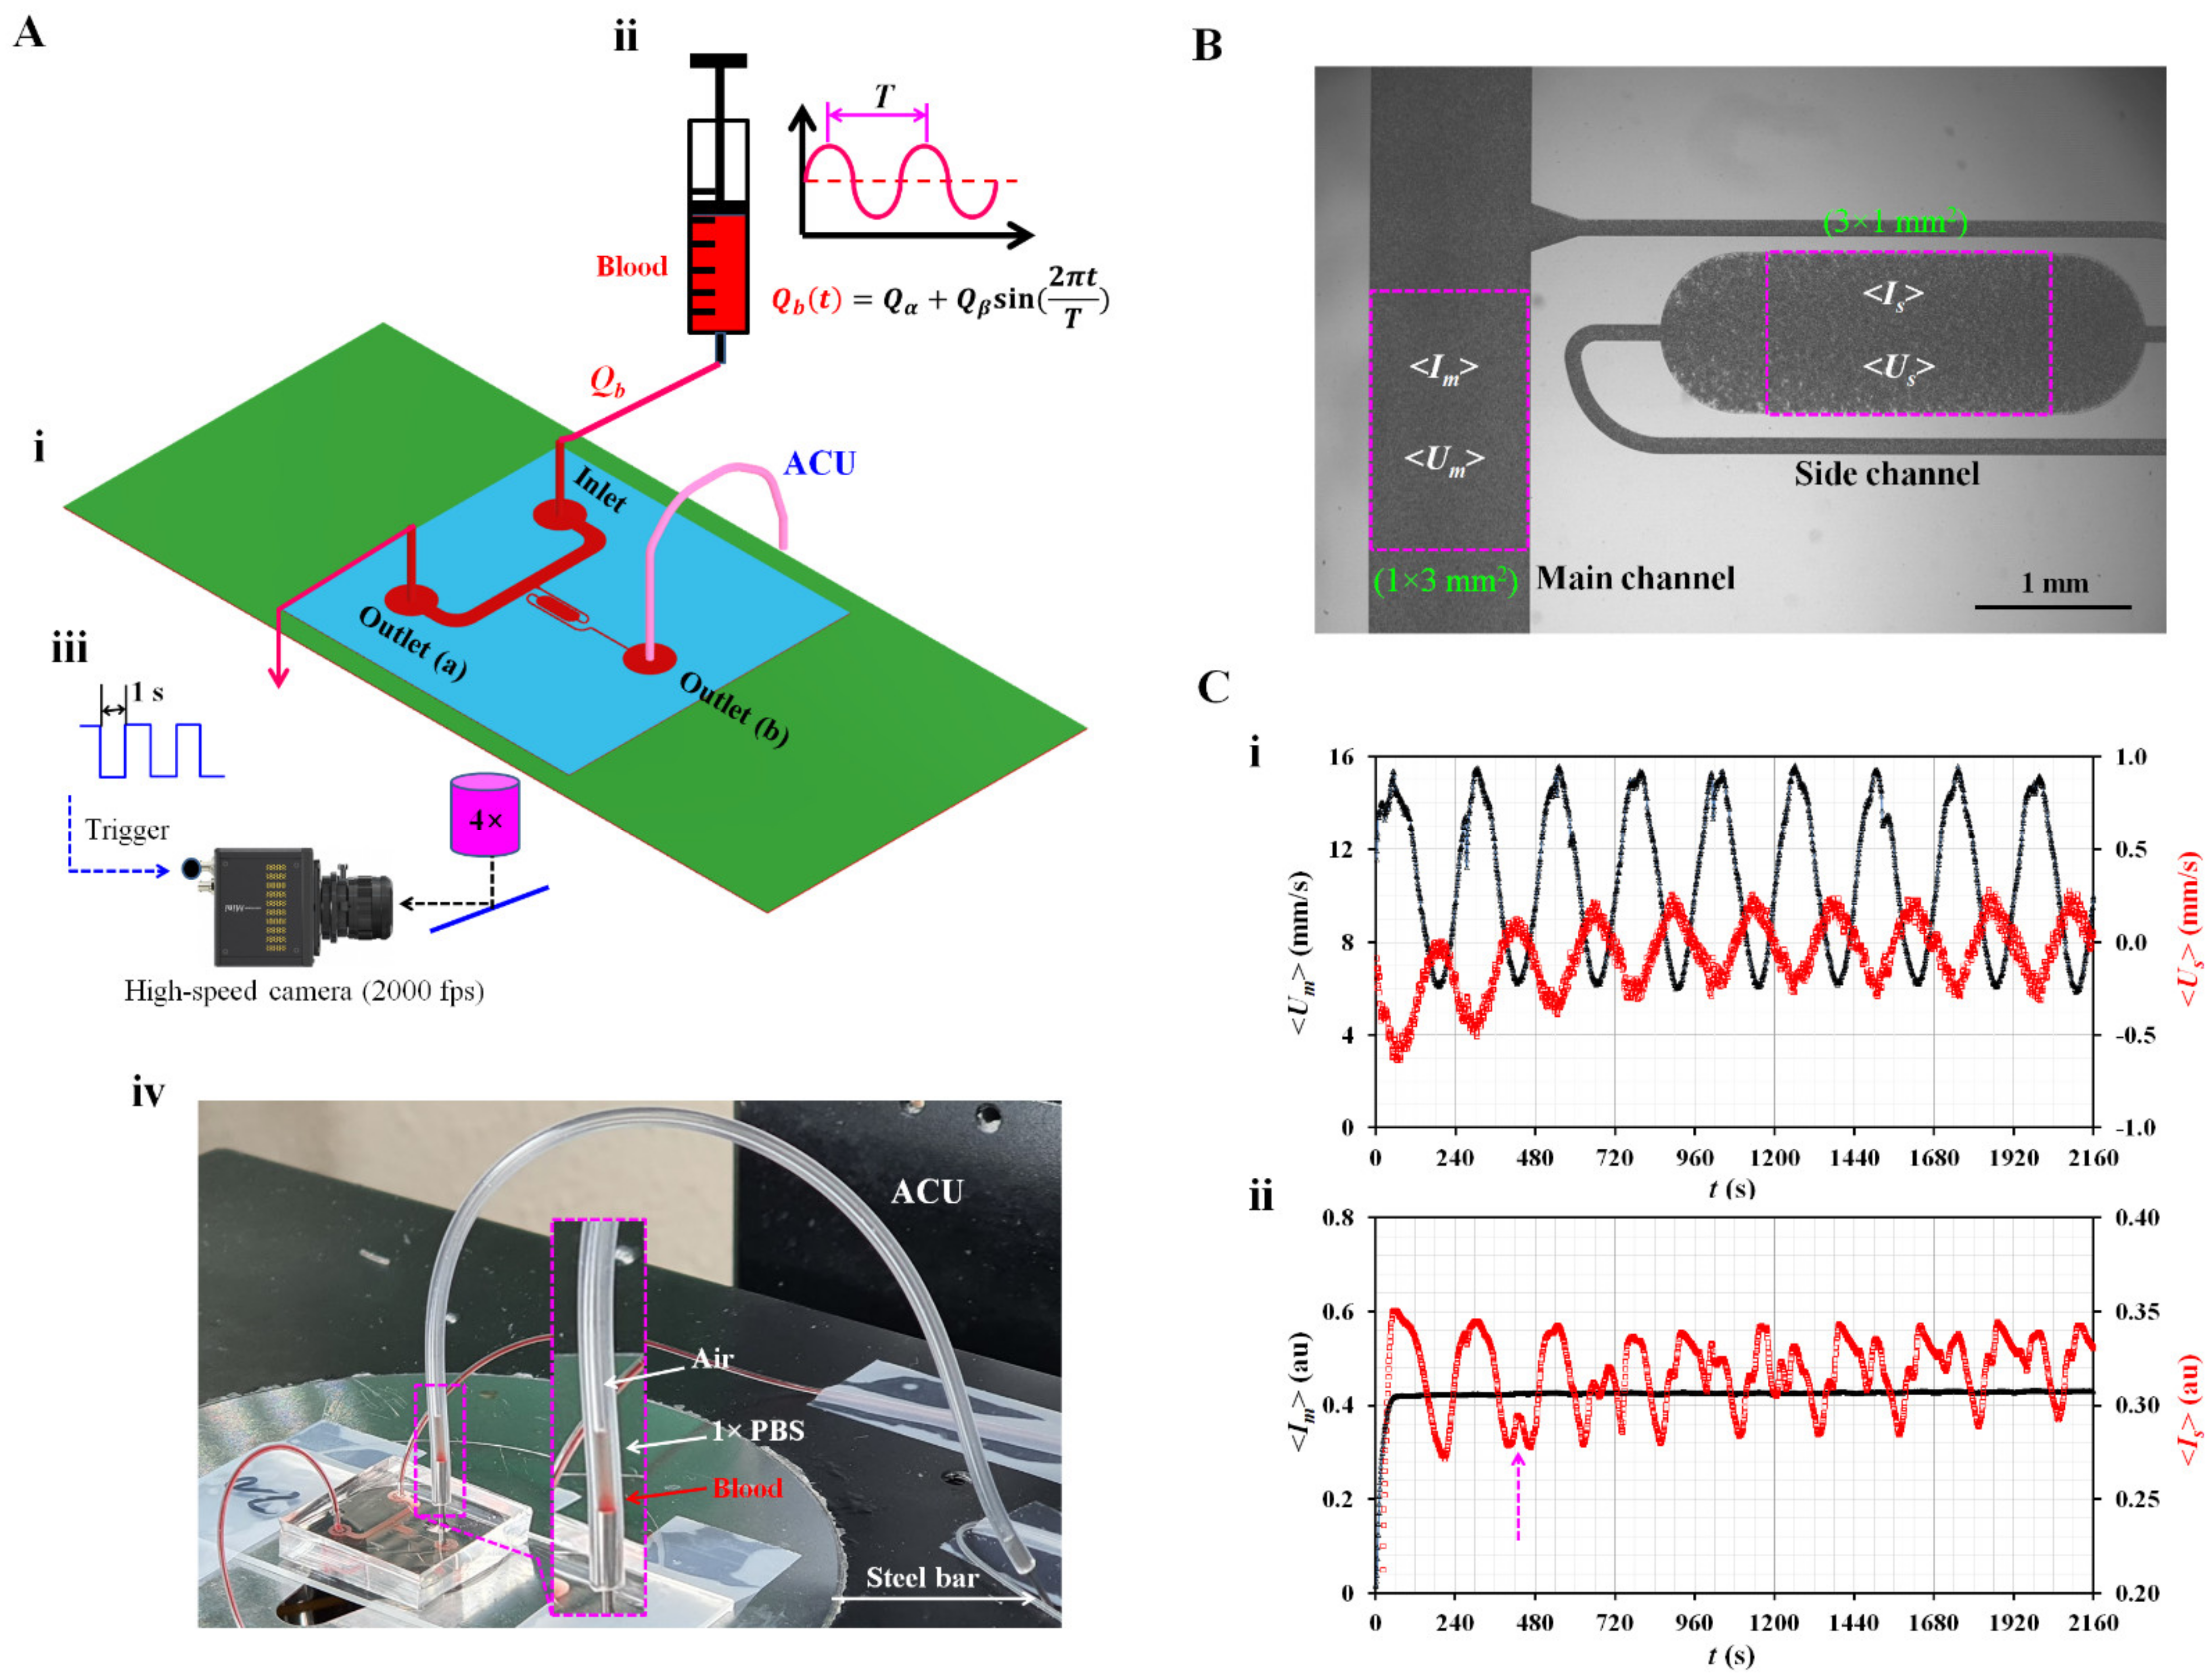
As shown in Figure 1(A-i), the microfluidic device suggested in a previous study [54] is modified to obtain three rheological properties under pulsatile blood flow. The device consists of one inlet and two outlets (a, b), a main channel with a uniform width (width = 1000 µm), and a side channel with a multistep width. The side channel consists of a narrow channel (width = 100 µm), wide channel (width = 1000 µm), and narrow channel (width = 100 µm) connected in series. The depth of all channels is fixed at 20 µm. Based on the protocol reported in a previous study [55], a polydimethylsiloxane (Sylgard 184, Dow Corning, Midland, MI, USA) microfluidic device is manufactured using a soft lithography technique.
The microfluidic device is then mounted on an inverted optical microscope (IX53; Olympus, Tokyo, Japan) equipped with a 4× objective lens (N.A. = 0.1). One polyethylene tubing (i.d. = 0.25 mm, length = 400 mm) is inserted into the inlet. The other tube (length = 200 mm) is fitted to the outlet (a). To repel air in the device and tubing, 1× phosphate-buffered saline (PBS) is injected through the tubing connected to the outlet (a). To embody the ACU, polyethylene tubing (i.d. = 250 µm, length = LACU) is connected to the outlet (b). The open end of the tubing is completely closed using a steel bar, as shown in Figure 1(A-iv). The blood is loaded into a disposable syringe (~1 mL) and connected to the end of the polyethylene tubing connected to the inlet. The syringe is then installed in a syringe pump (neMESYS, Cetoni GmbH, Korbußen, Germany) aligned in the gravitational direction. As shown in Figure 1(A-ii), to induce the viscoelastic behavior of blood in the main channel, the flow rate is set to a pulsatile flow pattern of Qb (t) = Qα + Qβ sin(2πt/T), where Qα, Qβ, and T denote the mean flow rate, alternating flow rate, and period, respectively. As shown in Figure 1(A-iii), microscopic blood images are captured and saved using an image-acquisition system. The high-speed camera (FASTCAM MINI, Photron, Tokyo, Japan) is set to 2000 fps. With an external trigger, two sequential images are captured and recorded at intervals of 1 s during all the experiments. Figure 1(A-iv) shows a prototype of the proposed microfluidic system. Using a syringe pump, blood is supplied to the microfluidic channels. When the blood pressure increases significantly at the junction point, the blood moves toward the main channel and side channel simultaneously. As shown in the inset of Figure 1(A-iv), air compression inside the ACU contributes to sucking blood and 1× PBS as the vertical liquid column sequentially. An interface is then shown between air and 1× PBS inside the ACU.
2.2. Acquisition of Microscopic Image Intensity and Blood Velocity
As shown in Figure 1B, the image intensity of blood flow and blood velocity are obtained by digital image processing of microscopic images recorded during the experiments. First, a specific region of interest (ROI; 1 mm × 3 mm) is selected within the main channel. The image intensity of blood flow (<Im>) is obtained by averaging the image intensity of the blood flow over the ROI. Temporal variations in blood velocity are obtained with time-resolved micro-particle image velocimetry (micro-PIV) [56]. The interrogation window is set to 64 × 64 pixels. One pixel corresponded to 3.3 µm. The window overlap is set to 50%. Velocity fields are validated using a local median filter. According to a previous study [50,57], DOC (Depth-Of-Correlation) is calculated as DOC = 151.6 µm for the present imaging system. Because the DOC is much larger than the channel depth (h = 20 µm), it is inferred that the velocity fields are averaged and remain constant in the depth direction. Blood velocity (<Um>) is obtained by arithmetically averaging the velocity fields over the ROI [50]. Second, to quantify the image intensity and blood velocity in the side channel, a specific ROI (3 mm × 1 mm) is selected within the large-width section rather than the short-width section. Following the same procedures used for the quantification of image intensity and blood velocity within the main channel, image intensity (<Is>) and blood velocity (<Us>) are estimated by analyzing the microscopic image within the ROI. Finally, variations in four parameters (<Um>, <Us>, <Im>, and <Is>) are obtained under pulsatile blood flow. Here, blood (hematocrit [Hct] = 50%) is prepared by adding normal RBCs into a dextran solution (15 mg/mL). The blood flow rate is set to Qb (t) = 1 + 0.5 sin(2πt/240) mL/h. The length of the ACU is 150 mm (LACU = 150 mm). Figure 1(C-i) shows temporal variations of <Um> and <Us>. Both velocities exhibit pulsatile flow patterns. <Us> is much smaller than <Um>. <Um> decreases slightly over time. <Us> also decreases gradually during the period when the pressure increased gradually inside the ACU. Figure 1(C-ii) shows the temporal variations in <Im> and <Is>. <Im> did not show substantial changes over time, even with pulsatile blood flow. Owing to RBC aggregation in the side channel, the <Is> shows periodic fluctuations (i.e., increase or decrease) over time. Two <Is> peaks occur when <Us> decreases, and its direction is reversed. The arrow mark (‘↑’) denotes the specific time of the two peaks of <Is>. In this study, <Um> and <Us> are used to quantify the viscoelasticity (i.e., time constant) and blood junction pressure, respectively. <Is> is used to obtain the RBC aggregation index (AI).
2.3. Analytical Formula of Time Constant of Blood Flow
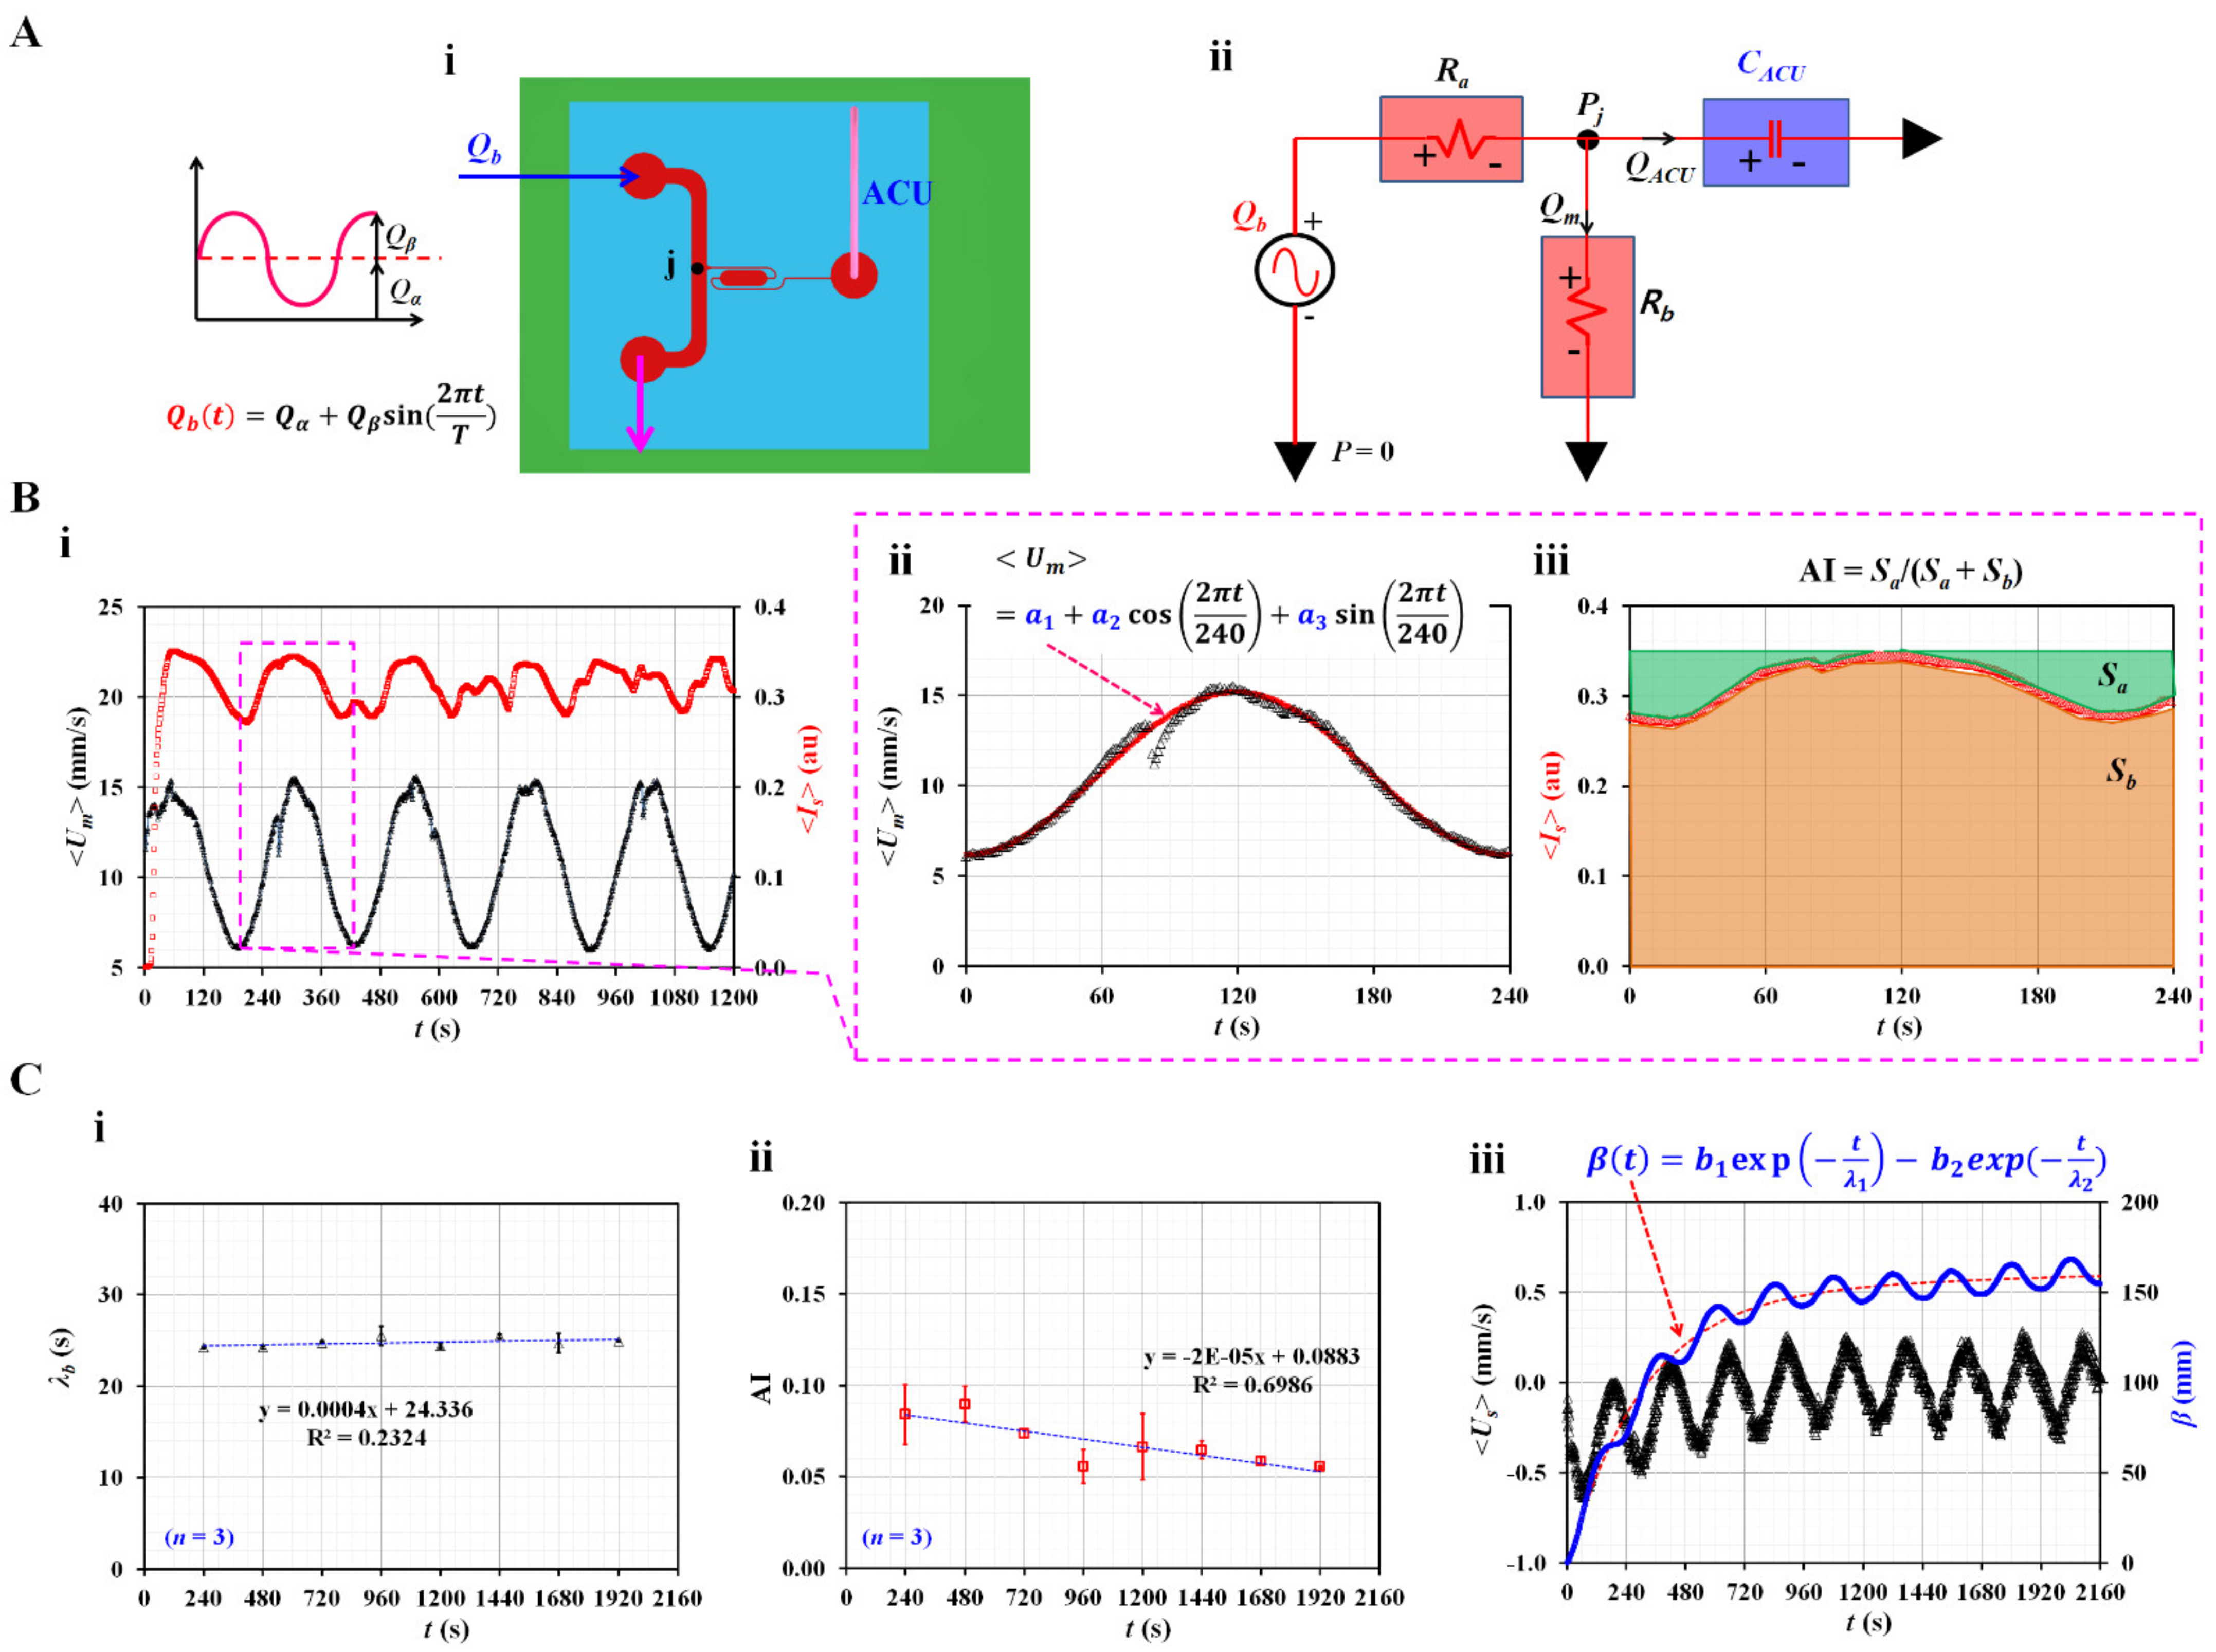
As the blood flow was set to a pulsatile pattern, it was possible to obtain the time constant (i.e., viscoelasticity) of the blood flow in the main channel. As shown in Figure 2(A-i), blood is supplied in a pulsatile pattern (Qb [t] = Qα + Qβ sin [2πt/T]) through the inlet. To embody the air compliance effect [58,59], an ACU is attached at the end of the side channel (i.e., outlet [b]). The blood junction pressure is denoted as Pj at the junction (j) of both channels. Based on the pressure-driven flow relation (i.e., ΔP = R × Q, pressure drop = fluidic resistance × flow rate) [60], individual microfluidic channels filled with blood are modeled as fluidic resistance elements. As shown in Figure 2(A-ii), the main channel is modeled as two fluidic resistance elements connected in series (Ra, Rb). As shown in Figure 1(C-i), the blood velocity inside the side channel is much smaller than that in the main channel. Therefore, the fluidic resistance of the blood flow in the side channel is considered negligible. The ACU alone is modeled as a compliance element (CACU). The blood flow rate controlled by the syringe pump is represented as an alternating source element (Qb). A mathematical model of the microfluidic channels is constructed using discrete fluidic circuit elements. When the mass conservation law is applied at the junction (j), the following equation is derived:
The blood junction pressure (Pj) is given by Pj = Rb × Qm, where Qm is the blood flow rate in the main channel. Substituting the formula for Pj into Equation (1), the following differential equation is derived:
λb denotes the time constant of viscoelasticity and is expressed as λb = CACU × Rb. ω was equal to ω = 2π/T. For a blood channel (i.e., width: w, depth: h, and length: l) with a low aspect ratio (AR) (AR = 20/1000)61, the analytical expression of the fluidic resistance (Rb) was derived as approximately . Here, the µb of blood. The steady solution of Equation (2) is derived as follows:
The time delay (θ0) was expressed as . As shown in Figure 1(C-i), the mean and alternating values of <Um> were obtained by conducting a curve-fitting technique of <Um> = Uman + Ualt sin (ωt − θ0).
Figure 2.
Mathematical representation of three rheological properties in terms of discrete fluidic circuit model. (A) Mathematical representation of microfluidic channels. (i) A top view of the microfluidic device. Blood flow rate set to pulsatile pattern. (ii) Mathematical representation of microfluidic circuit. A discrete fluidic circuit model consisted of flow rate source (Qb), fluidic resistance (Ra, Rb), and compliance (CACU). (B) Quantification of time constant (λb) and RBC aggregation index (AI). (i) Temporal variations of <Um> and <Is>. (ii) A curve-fitting procedure of <Um> for single period. The <Um> was then assumed as <Um> = a1 + a2 cos(2πt/240) + a3 sin(2πt/240). (iii) Temporal variations of <Is> for single period. Based on temporal variations of <Is>, two parameters (Sa, Sb) were calculated as Sa = and Sb = , respectively. RBC aggregation index (AI) was then obtained as AI = Sa/(Sa + Sb). (C) Variation of three rheological properties at intervals of period. (i) Variation of λb over period. (ii) Variations of AI over period. (iii) Temporal variations of <Us> and β. Based on the constitutive equation (i.e., Pj = the β as new pressure-related variable was defined as β = −. The β (t) was then assumed as β (t) = b1 exp (−t/λ1) − b2 exp (−t/λ2).

As the analytical expression of flow rate (Qm) was proportional to the blood velocity obtained with the micro-PIV technique (<Um>), the following relationship between Qm and <Um> is given as
Based on Equation (4), the λb was derived as
To obtain the time constant (λb), it was necessary to obtain two velocity values: Uman and Ualt. Based on Equation (5), the time constant was then obtained at intervals of the period.
2.4. Blood Preparation for Stimulating RBCs Sedimentation in the Driving Syringe
Concentrated RBC Bags (~320 mL) were purchased from the Gwangju–Chonnam Blood Bank (Gwangju, South Korea). First, to elevate RBC aggregation in RBCs, normal RBCs were added to several different types of dextran solutions. Five dextran solutions (Cdex = 15, 20, 40, 60, and 80 mg/mL) were diluted by dissolving dextran powder (Leuconostoc spp., MW = 450–650 kDa, Sigma-Aldrich, St. Louis, MO, USA) in 1× PBS. Unless otherwise stated, the Hct was set to 50%. Next, to harden the normal RBCs substantially, they were mixed with 1× PBS. Normal RBCs (approximately 5 mL) were loaded into a centrifuge tube. The tube was then exposed to 50 °C in a convection oven for 1 h [61]. As thermally shocked RBCs were collected by washing twice, test blood was prepared by adding hardened RBCs to a dextran solution (20 mg/mL).
3. Results and Discussion
3.1. Quantification of Three Rheological Properties in Pulsatile Blood Flow
Three parameters (<Um>, <Us>, and <Is>) were used to obtain the three rheological properties. Among the four parameters (<Um>, <Us>, <Im>, and <Is>), as shown in Figure 1C, two (<Um>, <Is>) are redrawn from t = 0 s to t = 1200 s, as shown in Figure 2(B-i). To extract the mean value (Uman) and alternating value (Ualt) of <Um> during a single period (T = 240 s), as shown in Figure 2(B-ii), <Um> is replotted for 240 s from the specific time at which <Um> had the minimum value. To best fit the temporal variations in <Um> as periodic trigonometric functions, <Um> was assumed to be <Um> = a1 + a2 cos (2πt/240) + a3 sin (2πt/240). Using the orthogonality relation of the periodic trigonometric function, three unknown constants (a1, a2, and a3) were calculated from the following relationship:
From Equations (6)–(8), three unknown constants were calculated: a1 = 10.68, a2 = −4.51, and a3 = 0.11. Uman and Ualt were then calculated as and . By inserting five parameters (i.e., T = 240 s, Qα =1 mL/h, Qβ = 0.5 mL/h, Uman = 10.68 mm/s, and Ualt = 4.51 mm/s) into Equation (5), time constant was obtained as λb = 24.18 s. To obtain RBC aggregation index (AI), as shown in Figure 2(B-iii), the <Is> was replotted for single period. <Is> exhibits pulsatile trends over time because <Um> varies in a pulsatile pattern. According to a previous study, blood flow should be suddenly stopped to measure RBC aggregation. Blood image intensity decreases or increases over time, depending on the optical system [45,54]. Owing to the difference in the blood flow profile (i.e., sudden stop flow or pulsatile flow), microscopic image intensity (<Is>) exhibited a substantially different trend over time. However, the present method adopted a similar protocol for calculating AI, as reported in a previous study [45,50]. Based on the temporal variations in <Is>, two parameters (Sa, Sb) were calculated as Sa = and Sb = , respectively. Here, <Is>max denotes the maximum value of <Is> in a single period. Sa exhibited a unique contribution resulting from the RBC aggregation. In addition, Sb was calculated to normalize AI as a dimensionless index. The RBC aggregation index (AI) is defined as AI = Sa/(Sa + Sb). The two parameters were calculated Sa = 7.879 and Sb = 74.564. The RBC aggregation index was calculated as AI = 0.096. As shown in Figure 2(C-i,ii), λb and AI are obtained at specific intervals. Figure 2(C-i) shows variations in λb at certain intervals. Based on repetitive tests (n = 3), each AI was represented as the mean ± standard deviation. According to linear regression, the regression coefficient had a low value of R2 = 0.2324. From these results, it is evident that λb remained unchanged over time. Figure 2(C-ii) shows the variations in AI over time. The AI tends to decrease significantly over time (R2 = 0.6986). This was due to RBC sedimentation in the driving syringe. While blood was supplied from the driving syringe into the microfluidic channel, the hematocrit of blood flow tended to increase over time [49]. The gradually increasing hematocrit contributed to hindering RBC aggregation. Blood junction pressure could be estimated from the constitutive relationship in the compliance element (i.e., ). However, it was impossible to extract the compliance (CACU) from the formula of the time constant (i.e., λb = CACU × Rb) because fluidic resistance (Rb) was not given during each experiment. As shown in Figure 1B, blood flows from right to left within the ROI of the side channel. To represent the junction pressure without information on CACU, a new variable (β) was defined as β = . Figure 2(C-iii) shows the temporal variations in <Us> and β. β tends to increase gradually over time and exhibits a periodic pulsatile pattern. To analyze β quantitatively, β (t) was best fitted as β (t) = b1 exp (–t/λ1)–b2 exp (–t/λ2). According to the nonlinear regression analysis, four unknown constants (i.e., b1, b2, λ1, and λ2) were obtained as b1 = 151.8, b2 = 153.9, λ1 = 45,413.26, and λ2 = 306.18. Thus, b1 and b2 have similar values (i.e., b1 ≈ b2). λ2 could be considered a vital parameter because λ1 is much longer than λ2 (i.e., λ1 λ2).
3.2. Contributions of Three Vital Factors (i.e., Flow Profile, Air Cavity, and Hematocrit) to Rheological Properties
Three promising factors (blood flow profile, air cavity size in the ACU, and hematocrit) that might influence the performance of the present method were selected. Their contributions were evaluated quantitatively by measuring the image intensity and velocity of blood in both channels. Here, the same blood, which was prepared by suspending normal RBCs in dextran solution (15 mg/mL), was used for the following experiments.
First, three types of blood rate patterns (constant, pulsatile, and square-wave) were selected to evaluate their contributions to variations in velocity, image intensity, and blood junction pressure. The length of the ACU was set to 150 mm (LACU = 150 mm) and hematocrit was set to 50%. Figure 3A shows temporal variations in blood velocities (<Um> and <Us>), blood junction pressure (β), image intensities (<Im> and <Is>) under a constant flow rate (Qb = 1 mL/h). The <Um> remains unchanged over time. However, <Us> decreases gradually over time and is approximately zero at 1200 s. To represent the BP, β is obtained by integrating <Us> over time. It exhibits a gradual increase for up to 1200 s. Thereafter, it does not exhibit a substantial change over time. Based on the curve-fitting technique, three unknown constants of the regression formula of β are obtained: b1 = 120.0 ± 9.7, b2 = 115.8 ± 6.9, and λ2 = 258.6 ± 6.1 (n = 3). The image intensity in the main channel (<Im>) remains unchanged over time. However, <Is> decreases substantially from 132 to 1148 s because <Us> tends to decrease over time. It is estimated that RBC aggregation contributes to a decrease in the image intensity (<Is>) in the side channel. Thereafter (t > 1148 s), as <Us> decreases to nearly zero, the variations in <Is> are influenced by random flows in the side channel (i.e., increase–decrease–increase–constant). Based on the temporal variations in <Is> from t = 132 s to t = 1148 s, AI was then obtained as AI = 0.14 ± 0.01 (n = 3).
Figure 3B shows temporal variations in blood velocities (<Um> and <Us>), blood junction pressure (β), image intensities (<Im> and <Is>) under pulsatile flow rate (i.e., Qb = 1 + 0.5 sin [2πt/240] mL/h). Both the blood velocities exhibited pulsatile patterns over time. Based on the curve-fitting procedure, three unknown constants of the regression formula of β were obtained as b1 = 155.2 ± 4.1, b2 = 161.3 ± 4.2, and λ2 = 280.9 ± 4.6 (n = 2). AI tended to decrease gradually from 0.099 to 0.04, with an increase in period. Figure 3C showed temporal variations of blood velocities (<Um>, and <Us>), blood junction pressure (β), and image intensities (<Im>, and <Is>) under square-wave flow rate (i.e., Qmax = 1.5 mL/h, Qmin = 0.5 mL/h, and T = 240 s). Both blood velocities exhibited square wave patterns over time. By conducting regression analysis, three unknown constants of regression formula of β were obtained as b1 = 134.2 ± 1.1, b2 = 134.3 ± 0.3, and λ2 = 256.3 ± 12.8 (n = 2). AI tended to decrease gradually from 0.105 to 0.028 with an increase in the period. From the results, the AI obtained at a constant flow rate had a maximum value when compared with the remaining profiles. However, at alternating blood flow rates, variations in AI could be obtained at specific time intervals. Consequently, it tended to decrease with increasing period. In addition, based on the curve-fitting procedure, the constant and square-wave profiles had similar value of λ2. The λ2 of the pulsatile profile was longer than that of the square-wave profile. Thus, the AI and β were substantially influenced by the blood flow rate profile. Among the three profiles, for convenience, to obtain rheological properties at specific time intervals, the blood flow rate was set to the pulsatile profile (i.e., Qb = 1 + 0.5 sin [2πt/240] mL/h) in following experiments.
Second, as it was expected that the air compliance unit (ACU) would influence blood flow in the side channel, its contribution was evaluated by varying the length of the ACU (LACU).
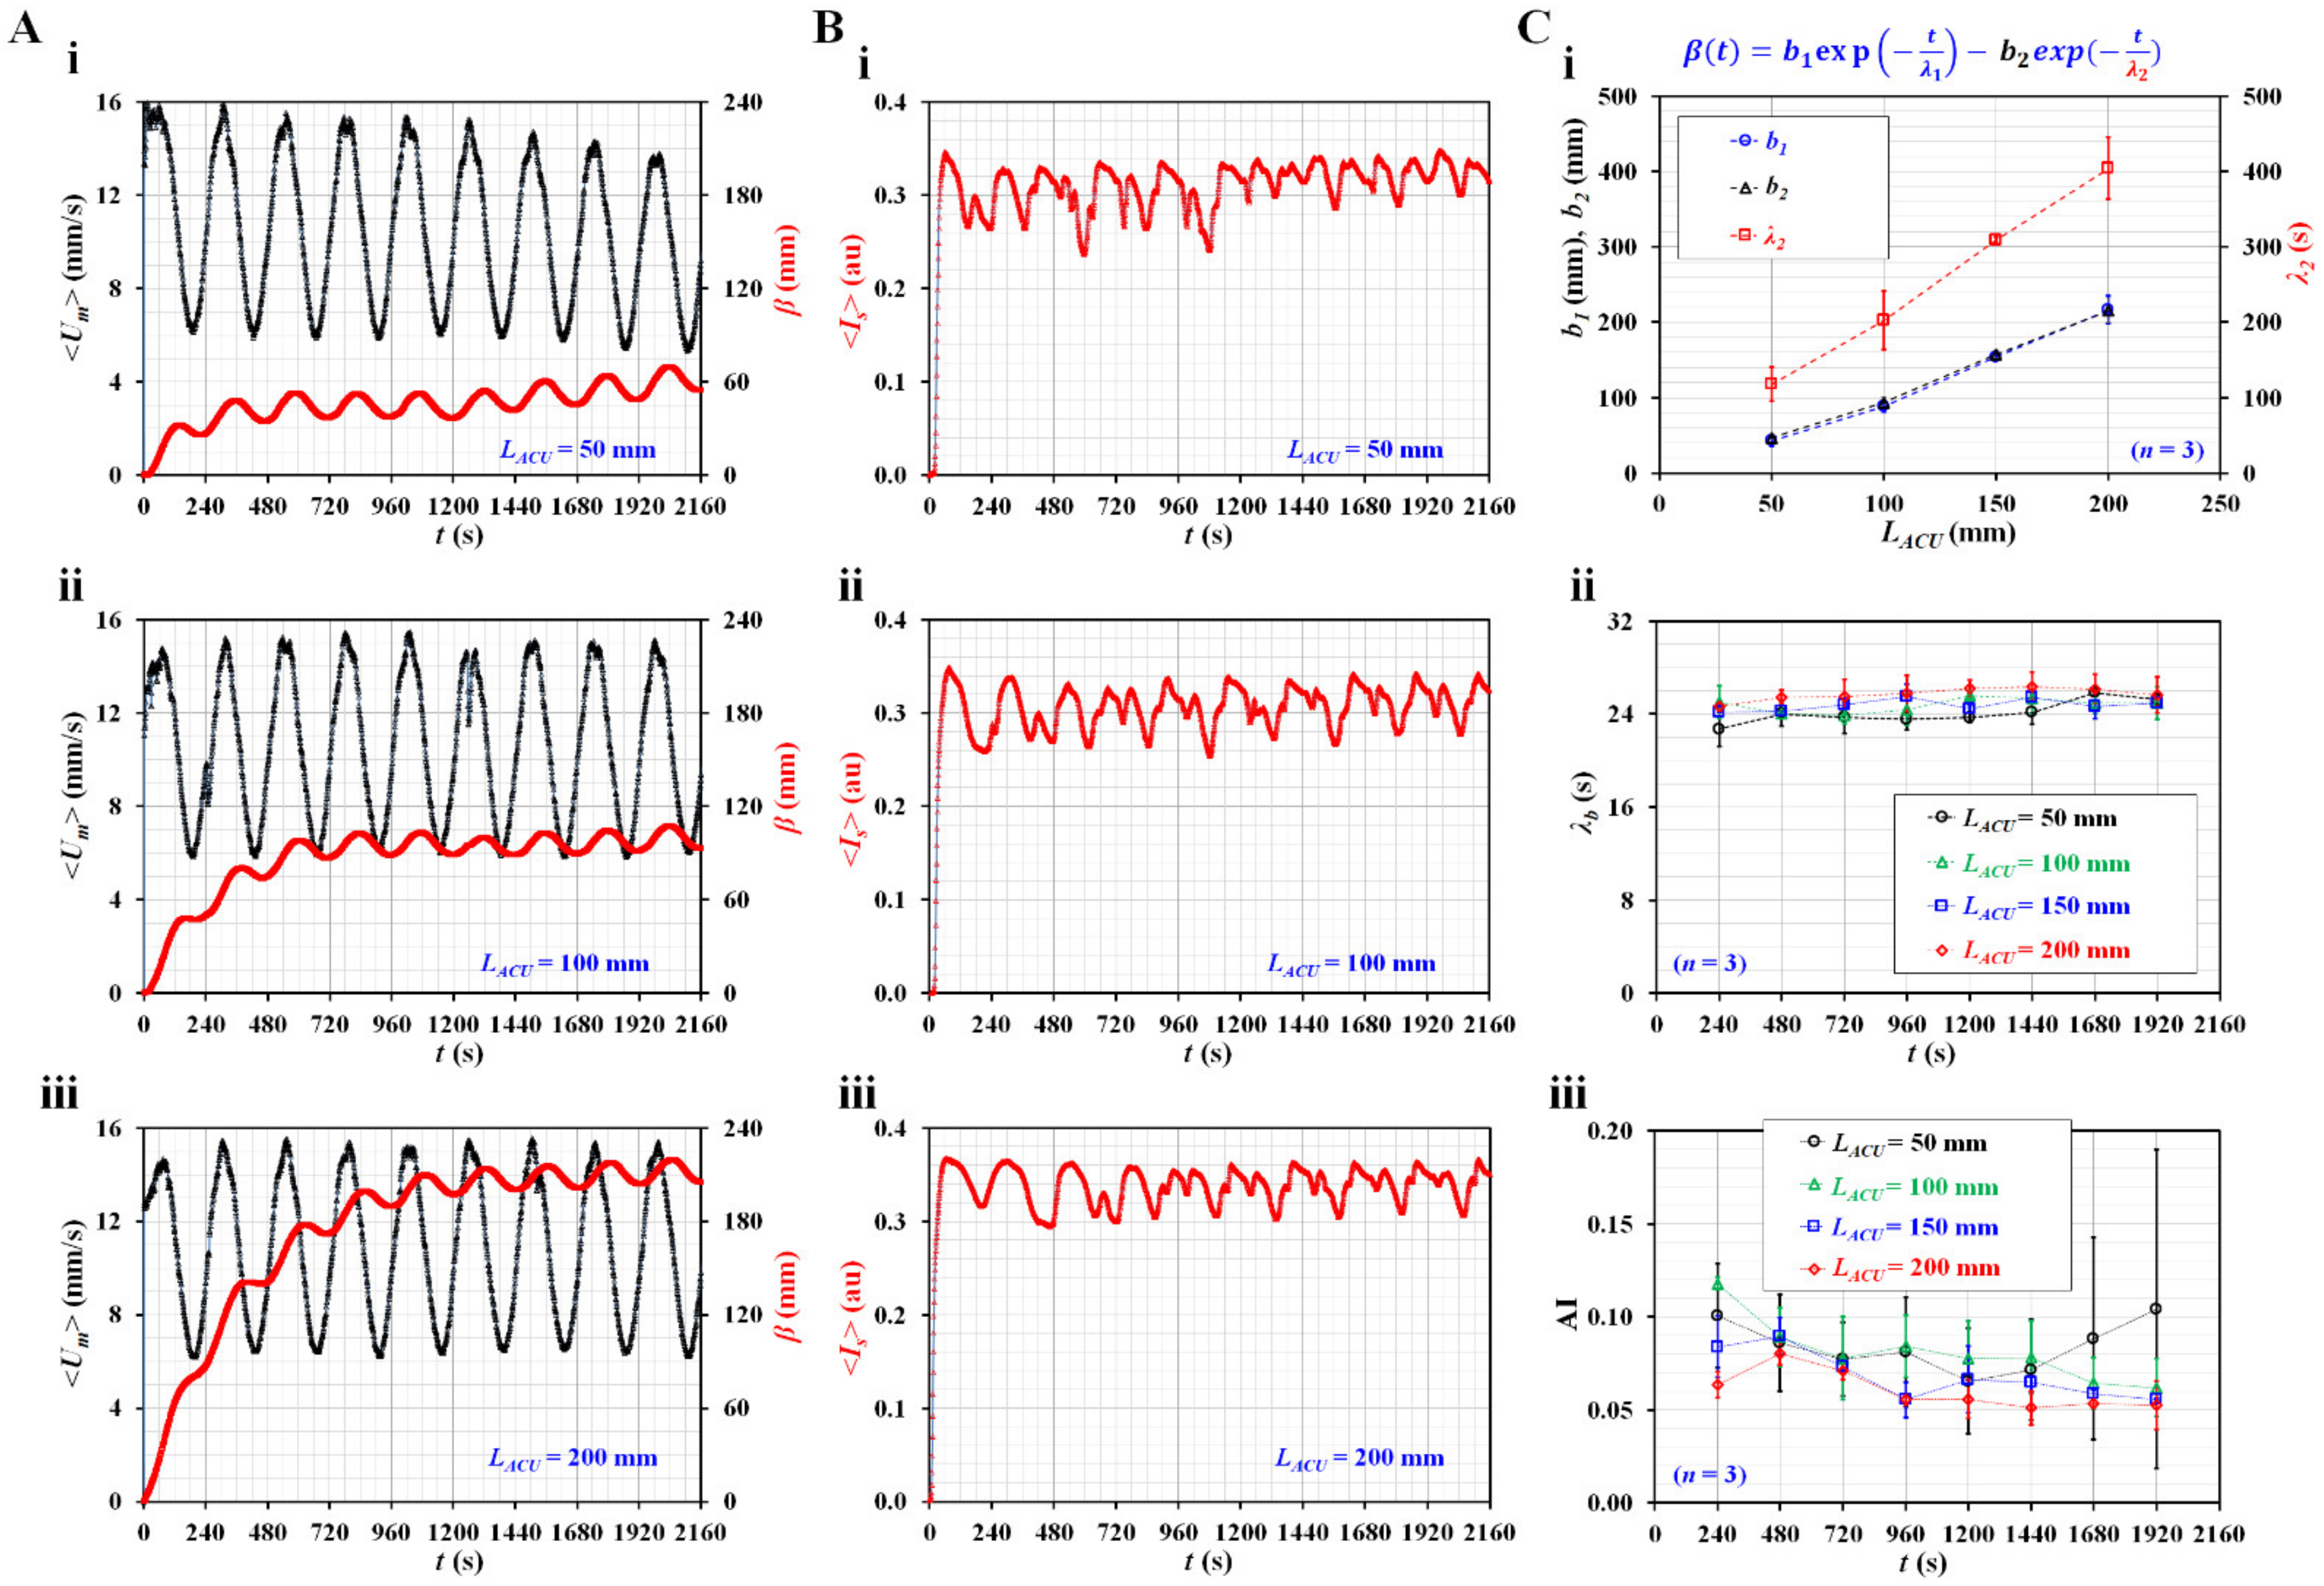
According to previous studies [59,62,63,64], the compliance element has been used to reduce unstable flow in microfluidic channels. However, in this study, ACU was used to substantially decrease blood flow and quantify blood junction pressure simultaneously. Figure 4A shows the temporal variations in <Um> and β with respect to LACU = 50, 100, and 200 mm. The β tends to increase with increasing ACU length. According to a previous study, a longer air cavity contributed to increasing air compliance (CACU) [62]. To maintain the same blood junction pressure, this result was regarded as reasonable because β should be increased at longer ACU lengths. Figure 4B shows the temporal variations in <Is> with respect to LACU = 50, 100, and 200 mm. From the results, it was confirmed that <Is> exhibited consistent periodic patterns at larger ACU lengths (i.e., LACU = 100 or 200 mm). Figure 4C shows the quantification of three parameters (β, λb, and AI) with respect to LACU. Based on the curve-fitting technique, three unknown constants (b1, b2, and λ2) of the regression formula for β were obtained with respect to LACU. As shown in Figure 4(C-i), b1 and b2 exhibit similar trends and increase gradually with respect to LACU. Furthermore, λ2 tends to increase substantially with respect to LACU. Figure 4(C-ii) shows the temporal variations in the time constant (λb) with respect to LACU. λb tends to increase with increasing ACU length. Because λb is proportional to CACU (i.e., λb = Rb × CACU), the experimental results exhibit consistent trends with respect to LACU. However, λb does not show substantial changes at the intervals of the period. Figure 4(C-iii) shows the temporal variations in AI with respect to LACU. AI exhibits large fluctuations at lower ACU lengths (i.e., LACU ≤ 100 mm). The fluctuation of AI tends to decrease at larger ACU lengths (LACU ≥ 150 mm). It tends to decrease substantially at larger ACU lengths. The AI decreases gradually at intervals of the period. Based on these results, the length of the ACU was set to 150 mm in the following experiments.
Third, the contributions of the hematocrit to the three rheological properties were evaluated in pulsatile blood flow. As hematocrit plays an important role in blood flow, it was necessary to evaluate the rheological properties with respect to Hct = 30, 40, and 50%.
Figure 5(A-i) shows the temporal variations of <Um> with respect to hematocrit. Lower hematocrit (Hct = 30%) has higher value of blood velocity within less than two periods. Blood velocity of blood (Hct = 30%) increases largely from the seventh period. Blood velocity (Hct = 40%) increases substantially from the eighth period. As RBC sedimentation occurred in the driving syringe, diluent and RBCs were separated into the syringe. Both were supplied sequentially into the main channel. After a certain period, pure liquid (i.e., diluent) came into the main channel after all RBCs were already supplied into the microfluidic channel [65]. Owing to a feature of micro-PIV technique, the velocity of diluent is higher than that of blood with RBCs [66]. Figure 5(A-ii) shows temporal variations of β with respect to Hct. The β of blood (Hct = 50%) increases gradually up to the third period. After that period, it shows pulsatile patterns over time without an additional increase in the average value. The remaining two hematocrits of blood (Hct = 30 and 40%) do not exhibit substantial difference of β for up to the fifth period. After that period, the β exhibits substantial difference because of RBC sedimentation in the driving syringe. Figure 5(A-iii) shows temporal variations of <Im> with respect to Hct. The <Im> of 50% hematocrit is higher than that of Hct = 30 or 40%. RBC sedimentation in the driving syringe contributes to increasing <Im> gradually over time with respect to Hct = 30 or 40%. When diluent comes into the main channel, <Im> decreases substantially. Thus, the corresponding <Im> of Hct = 30% and Hct = 40% decreases abruptly at t = 1573 (Hct = 30%) and t = 1927 s (Hct = 40%), respectively. The difference between Hct = 30% and Hct = 40% can be detected effectively with sudden change of <Im> rather than steady value of <Im>. However, the <Im> of Hct = 50% remains constant over time. Figure 5(A-iv) shows temporal variations of <Is> with respect to Hct. Within the second period, the <Is> shows substantial difference with respect to Hct. Thereafter, the <Is> does not show noticeable difference with respect to Hct. Based on the temporal variation of <Im> over the period, temporal variations of λb are obtained with respect to Hct. Figure 5(B-i) shows temporal variations of λb with respect to Hct. The λb of Hct = 30% is higher than that of Hct = 40 or 50%. According to the formula λb = Rb × CACU, it was expected that the CACU of 30% hematocrit was larger than that of 40 or 50% because viscosity of 30% hematocrit is higher than that of 40 or 50%. Thus, as compliance had reciprocal relation to elasticity, elasticity of 30% hematocrit is lower than that of 40 or 50%. For this reason, the result shows consistent trends when compared with previous study62. The λb of Hct = 50% remains consistent over time. Figure 5(B-ii) shows temporal variations of AI with respect to Hct. The AI of Hct = 30 or 40% exhibits large fluctuations when compared with that of Hct = 50%. For consistent measurement of the present method, hematocrit of blood was set to 50% in the following experiments.
3.3. Quantification of Three Rheological Properties for Aggregated Blood and Hardened Blood
As a demonstration, the present method was applied to detect differences in diluent and RBC flexibility. To increase RBC aggregation in normal RBCs, blood samples (Hct = 50%) were prepared by adding normal RBCs to a specific concentration of dextran solution (Cdex) (Cdex = 20, 40, 60, and 80 mg/mL). Additionally, to harden normal RBCs under thermal shock conditions, normal RBCs were exposed to a higher temperature of 50 °C for 1 h. Hardened blood (Hct = 50%) as test blood was then prepared by adding thermally shocked RBCs into a specific concentration of dextran solution (20 mg/mL).
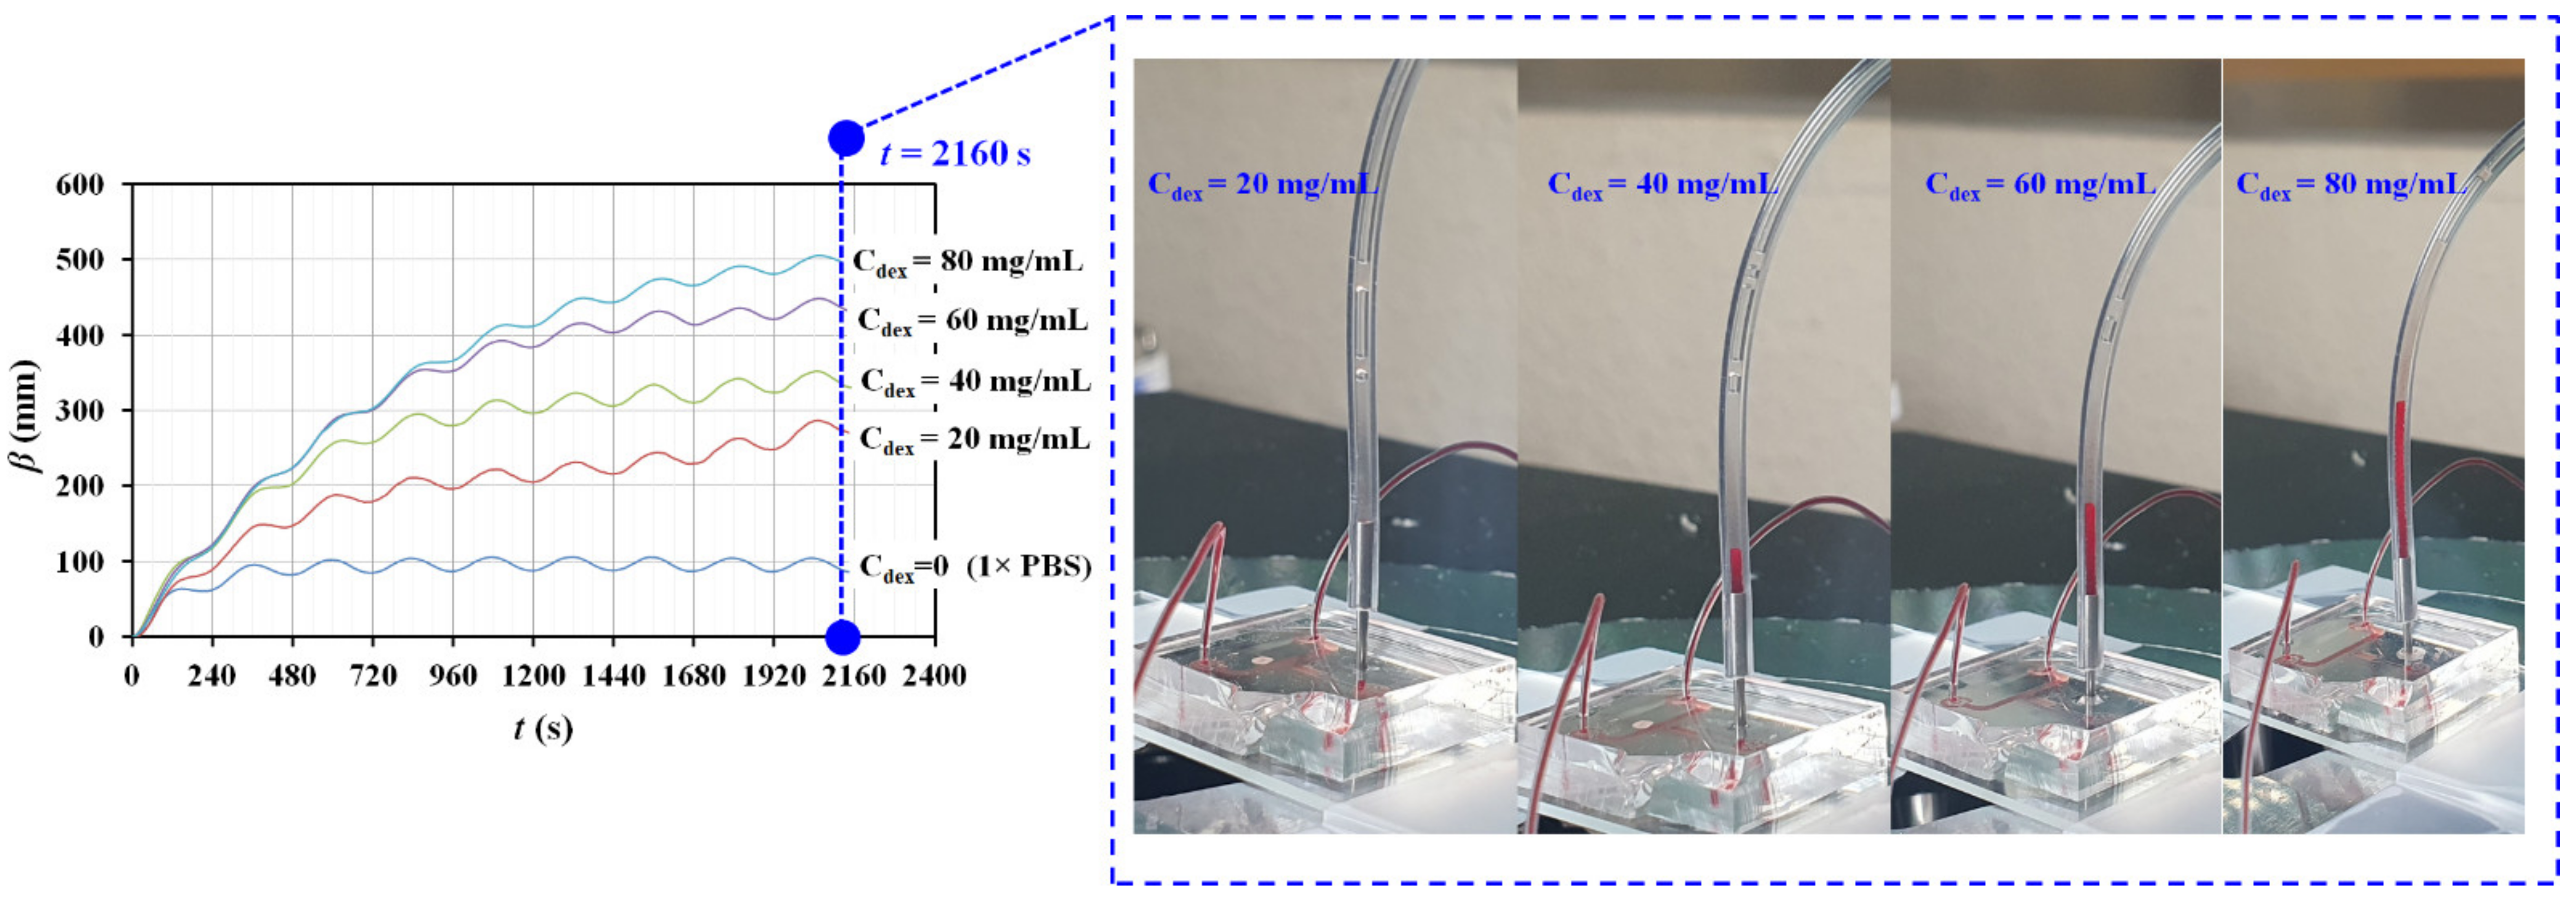
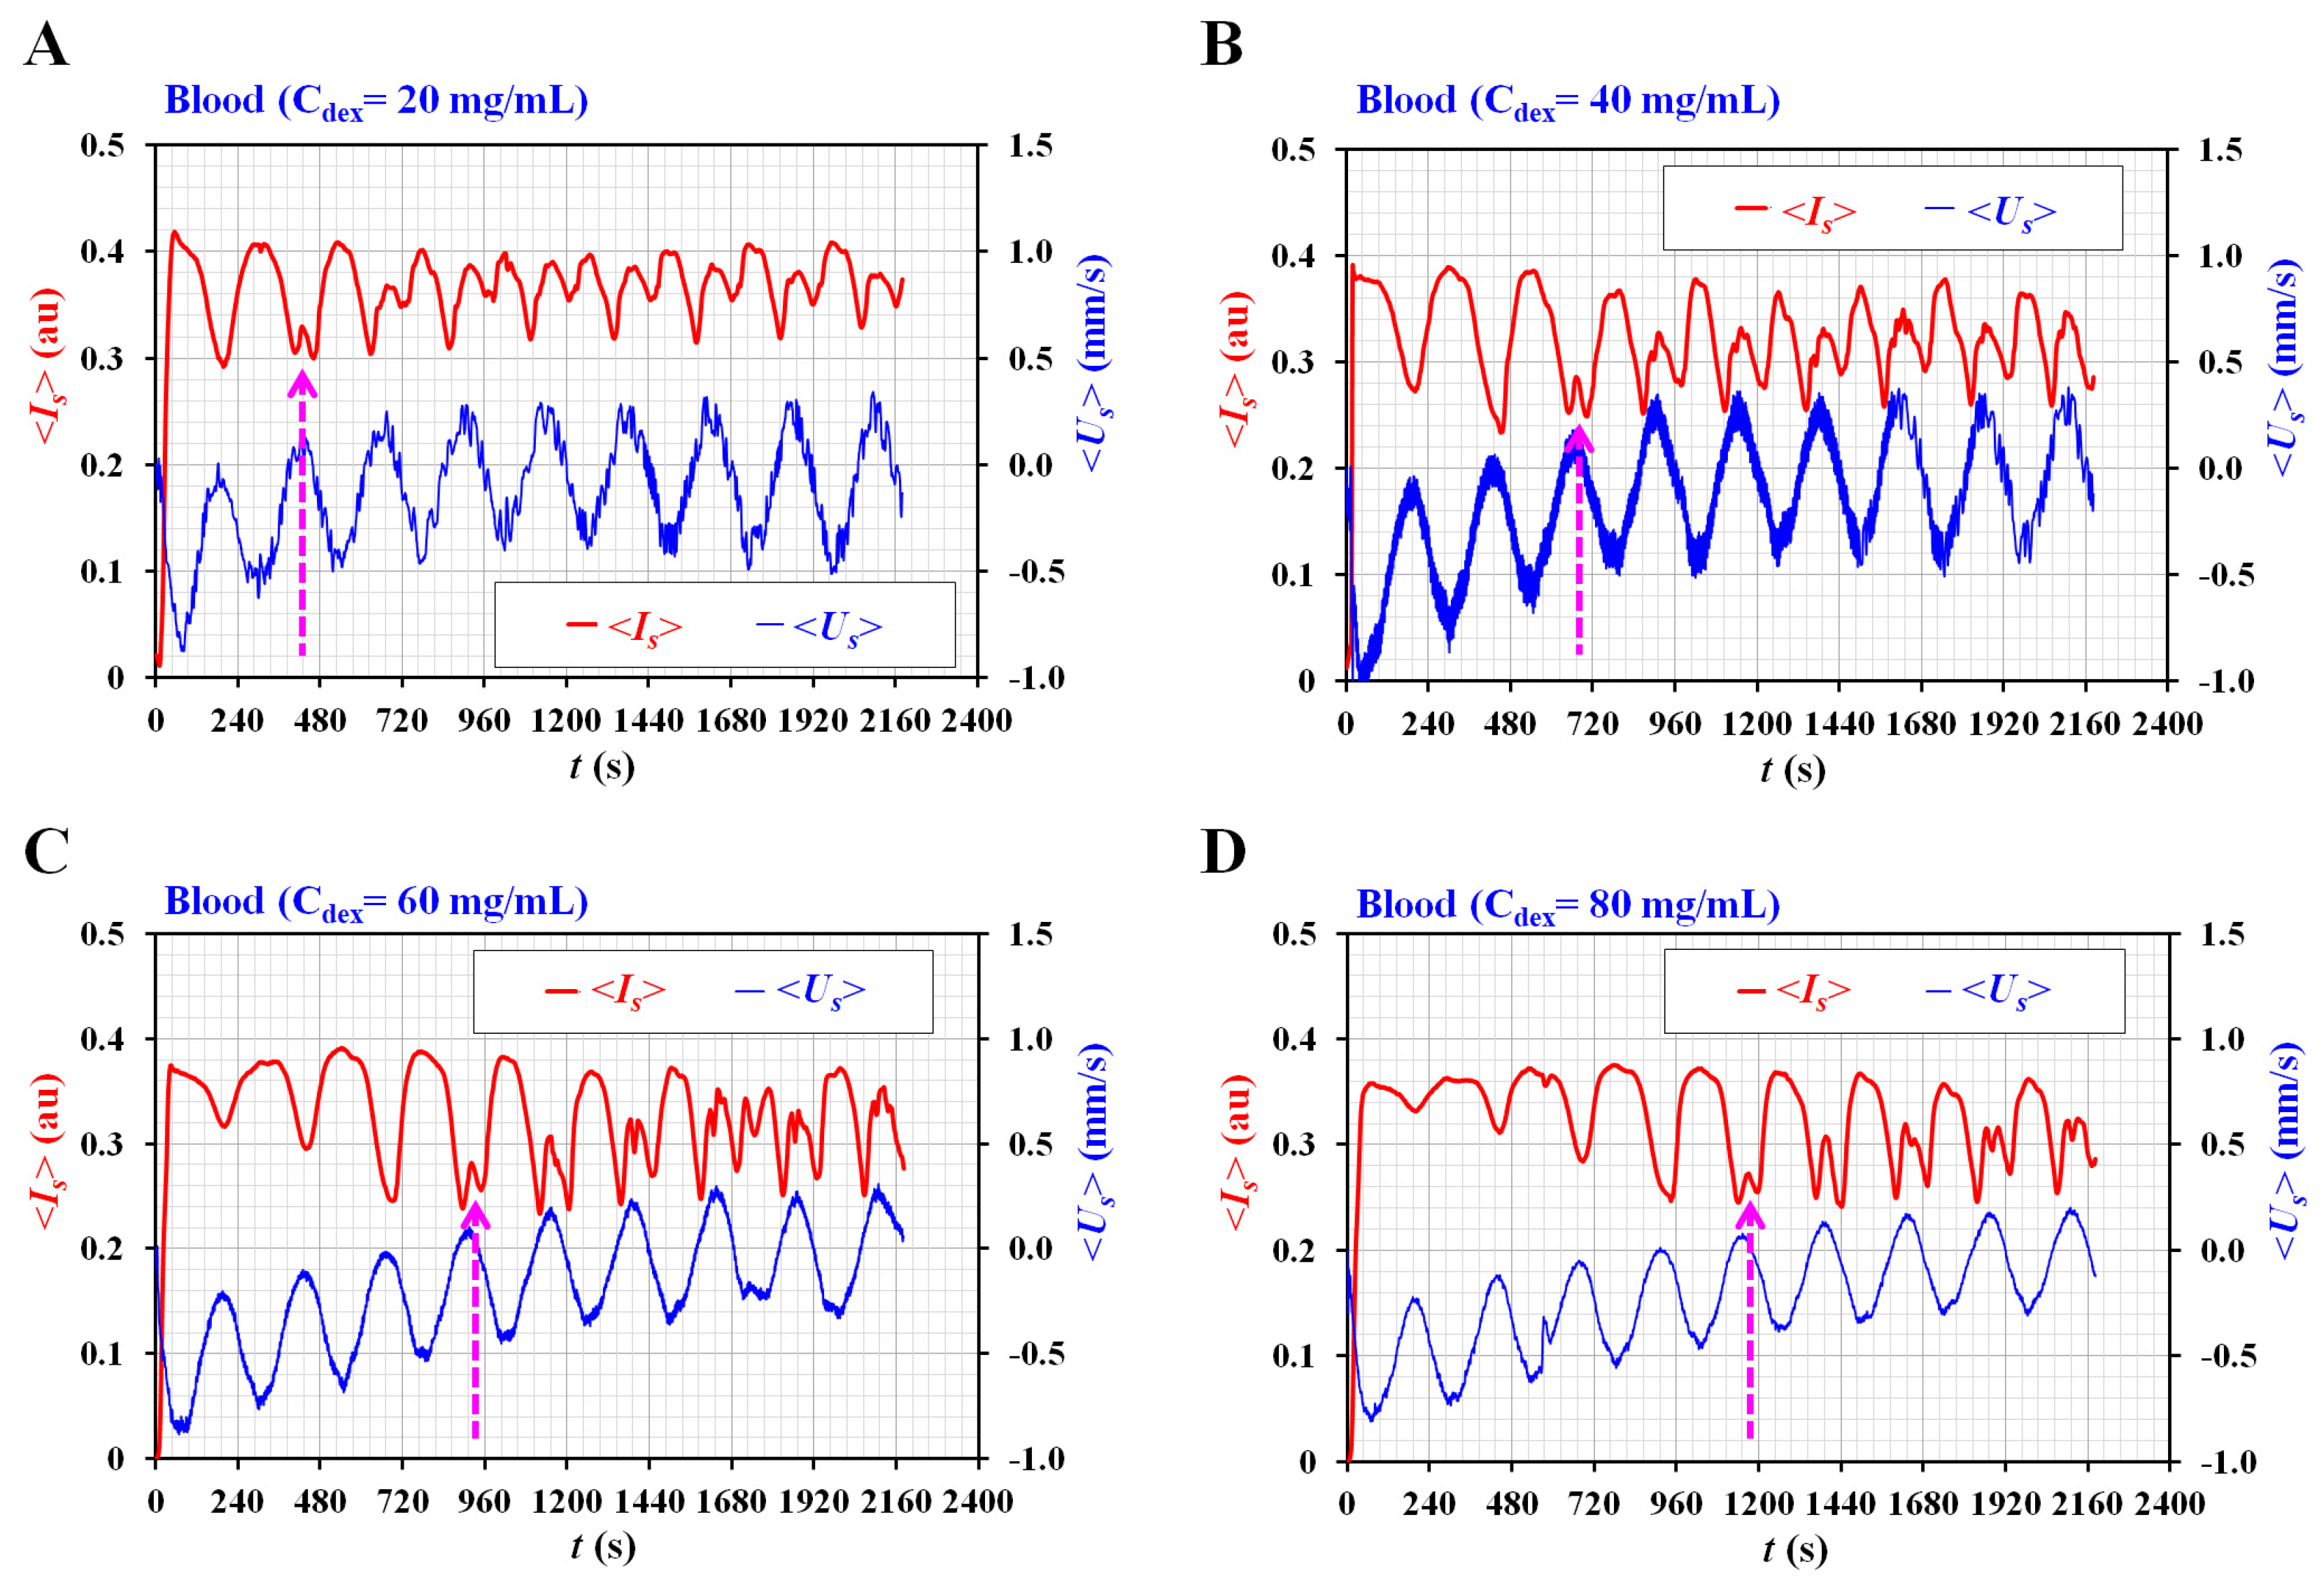
First, the contribution of the diluent (i.e., dextran solution) to the rheological properties was evaluated with respect to Cdex. Three types of blood tests (n = 3) were conducted to confirm the repeatability of the present method. All tests were completed in three days. As shown in Figure A1 (Appendix A), by integrating <Us> over time, the temporal variations in β are obtained with respect to Cdex. The results indicate that β increases at higher concentrations of dextran solution. In addition, four snapshots showing the volume of blood filled in the ACU were captured at the end of the blood delivery (t = 2160 s). The blood volume in the ACU increases at higher concentrations of dextran solution. Based on the temporal variations of β, as shown in Figure A1 (Appendix A), nonlinear regression is conducted to extract four unknown constants. Because b1 and b2 have very similar values (i.e., b1 ≈ b2), b1 is adopted to represent trends of β quantitatively. Figure 6A shows the variations in b1 and λ2 with respect to Cdex. According to the results, both constants (b1 and λ2) tend to increase with respect to Cdex. The trends of both the constants are consistent for the three types of blood tests. Thus, it is inferred that the dextran solution played an important role in increasing blood junction pressure substantially. Based on the temporal variations in <Um>, the time constant of blood flow (λb) was obtained at different time intervals. Figure 6B shows temporal variations in λb with respect to Cdex. The λb increases at higher concentrations of dextran solution. In addition, blood samples with a higher concentration of dextran solution exhibit a substantial increase in λb over time. Here, it is expected that RBC sedimentation in the driving syringe will contribute to increasing the hematocrit of the blood flow in the blood channel. As the hematocrit contribute to increasing blood viscosity, it is reasonable that λb tended to increase over time. As shown in Figure A2 (Appendix A), the AI is obtained at intervals of the period by analyzing the temporal variations of <Is> with respect to Cdex. Interestingly, two peaks of <Is> are detected when <Us> tends to decrease gradually, and its flow direction is reversed. Two peaks of <Is> are denoted as an arrow mark (‘↑’) with respect to Cdex. Based on the specific time when two peaks occur, the AI is calculated from one period ago. Figure 6C shows the temporal variations in AI with respect to Cdex. The AI tends to increase up to Cdex = 40 mg/mL. Above Cdex = 40 mg/mL, AI exhibits fluctuations with respect to Cdex = 60 and 80 mg/mL. Because of the ESR in the driving syringe, the AI varies with the elapsed period. The experimental results show that the three rheological properties exhibit substantial differences with respect to Cdex.
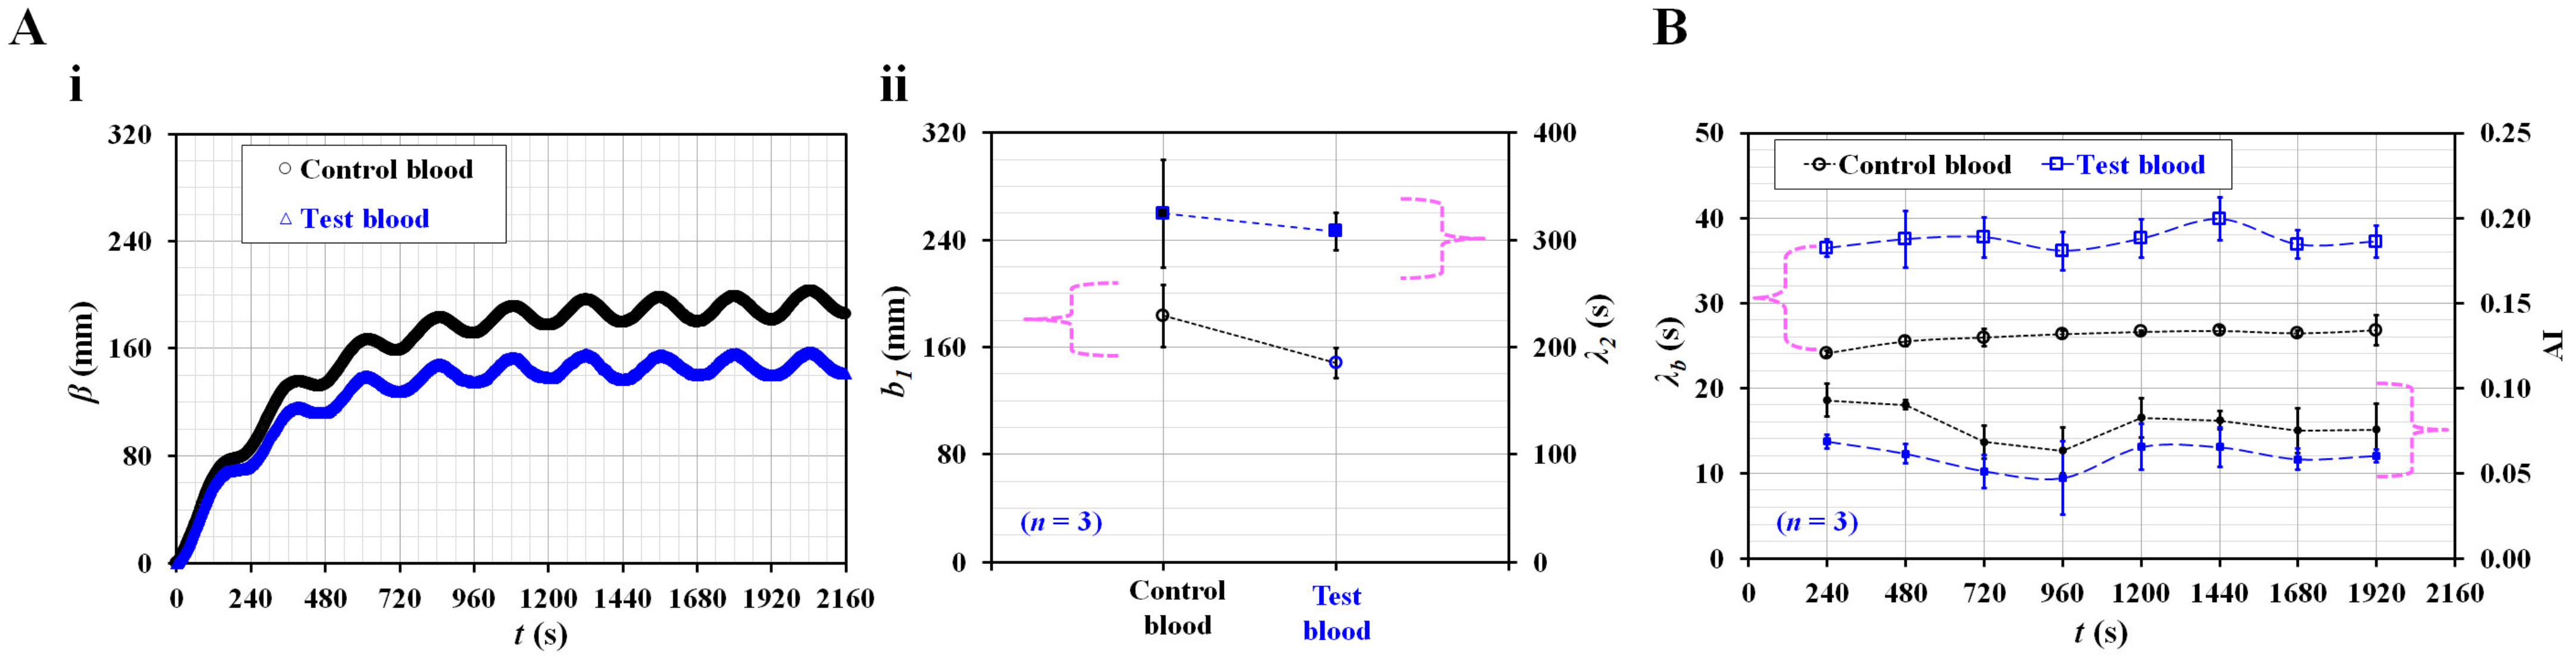
Second, the present method was used to detect differences between normal RBCs and hardened RBCs in terms of the three rheological properties. Control blood (Hct = 50%) and test blood (Hct = 50%) were prepared by adding normal RBCs and thermally shocked RBCs to the same concentration of dextran solution (20 mg/mL). Figure 7(A-i) shows the temporal variations in β with respect to the control blood and test blood. The β of the test blood is lower than that of the control blood. The results were contrary to expectations and interesting. According to a previous study [67], hardened RBC largely contributed to decreasing compliance when compared with control blood. However, as the CACU was not specified, it was impossible to obtain the blood junction pressure. Variations in β still showed a limitation in the representation of blood junction pressure when the elasticity of RBC was varied. To determine the reason quantitatively, it is necessary to conduct additional studies in the future. To analyze β of both blood samples quantitatively, based on the curve-fitting technique of β, unknown constants of a curve-fitting formula (i.e., b1, λ2) were obtained. As shown in Figure 7(A-ii), variations in b1 and λ2 are plotted with respect to the test and control blood. The λ2 does not exhibit a substantial difference. The b1 of test blood is lower than that of the control blood. Based on the temporal variations of <Um> and <Is>, λb and AI are obtained at intervals of a period. Figure 7B shows the temporal variations in λb and AI with respect to the control blood and test blood. The λb value of the test blood is higher than that of the control blood. Compared with a previous study [61], the results obtained by the present method were comparable. Additionally, the AI of the test blood was lower than that of control blood. Therefore, heat-shocked RBCs contributed to decreasing AI and increasing λb when compared with normal RBCs. It is to be noted that the β value of the test blood was lower than that of control blood.
According to the previous studies, the author group suggested quantification methods of blood biomechanical properties in a microfluidic channel. For the quantification of blood viscosity, two highly expensive and bulky-sized syringe pumps were used to obtain supply blood and reference fluid, respectively [34,35]. Next, for quantification of RBC aggregation, blood syringe pump was periodically turned off to stop blood flow [44]. Most of all, as RBC aggregation depended on hematocrit or diluent, it was necessary to monitor variations of hematocrit or diluent in terms of blood viscosity or blood pressure. In other words, most of the previous studies were demonstrated with two syringe pumps. The present study was aimed at reducing the number of syringe pump from two to one. Blood viscosity was replaced by blood viscoelasticity (i.e., a time constant). With a single syringe pump, blood flow was set to pulsatile pattern. Three biomechanical properties (i.e., RBC aggregation, time constant, and blood junction pressure) were then simultaneously quantified under pulsatile blood flows. As a key idea, blood flow was stopped in the side channel connected to air compliance unit. Time constant was obtained by analyzing blood velocity in the main channel. Additionally, blood junction pressure was obtained by integrating blood velocity in the side channel. In principle, all formulas used or derived in the study had similar expression when compared with the previous studies. The present results showed very similar trends to the previous results. However, blood hematocrit had a strong influence on blood velocity obtained with a micro-PIV technique [66]. Furthermore, blood junction pressure was obtained as β because compliance constant was not available [67]. Accurate measurement of blood velocity as well as compliance constant will be required for improving the performance of the present method.
From the experimental results, it can be concluded that the present method has the ability to detect differences in diluent or RBCs in terms of the three discussed rheological properties. A limitation of the present method is that it still requires laboratory-equipped facilities, including a microscope, high-speed camera, and syringe pump.
4. Conclusions
In this study, three rheological properties (viscoelasticity, RBC aggregation, and blood junction pressure) were measured by analyzing the blood velocity and image intensity. The blood flow was set to a pulsatile flow pattern with a single syringe pump. First, based on the discrete fluidic circuit model, the analytical formula of the time constant (λb) as a function of viscoelasticity was derived and estimated by analyzing the blood velocity. Next, to reduce the blood velocity substantially, an air compliance unit (ACU) was connected to the blood channel in parallel. The RBC aggregation index (AI) was obtained by analyzing the microscopic image intensity. Finally, based on the constitutive relation (i.e., ), the blood junction pressure (β) was obtained by integrating the blood velocity within the ACU. From quantitative studies of three vital factors (i.e., blood flow rate profile, length of ACU, and hematocrit), the blood flow rate was set to a pulsatile profile (i.e., Qb[t] = 1 + 0.5 sin(2πt/240) mL/h). The length of the ACU was set as 150 mm (i.e., LACU = 150 mm). The hematocrit of the blood was set to 50%. As a demonstration, the proposed method was applied to detect RBC aggregation-enhanced blood and heat-shocked RBCs. Consequently, the present method has the ability to detect differences in diluent or RBCs in terms of the three rheological properties. In the near future, to adopt the present method in clinical settings, it will be necessary to replace the bulky and expensive instruments with a facile and inexpensive system (i.e., imaging acquisition and blood delivery).
Funding
This work was supported by the Basic Science Research Program through the NRF funded by the Ministry of Education (NRF-2021R1I1A3040338).
Institutional Review Board Statement
This study was conducted in accordance with the Declaration of Helsinki and approved by the ethical committee of Chosun University under the reference code (2-1041055-AB-N-01-2022-47).
Data Availability Statement
Not applicable.
Conflicts of Interest
The author declares no conflict of interest.
Appendix A
Figure A1.
Temporal variations of β with respect to concentration of dextran solution (Cdex) (Cdex = 0, 20, 40, 60, and 80 mg/mL). At the end duration of blood delivery (t = 2160 s), four snapshots for showing volume of blood (Cdex = 20, 40, 60, and 80 mg/mL) filled in the ACU were represented in the right-side panel.

Figure A2.
Variations of <Is> and <Us> with respect to concentration of dextran solution (Cdex) (Cdex = 20, 40, 60, and 80 mg/mL). (A) Temporal variations of <Is> and <Us> for blood (Cdex = 20 mg/mL). (B) Temporal variations of <Is> and <Us> for blood (Cdex = 40 mg/mL). (C) Temporal variations of <Is> and <Us> for blood (Cdex = 60 mg/mL). (D) Temporal variations of <Is> and <Us> for blood (Cdex = 80 mg/mL).

References
- Baskurt, O.K.; Meiselman, H.J. Blood rheology and hemodynamics. Semin. Thromb. Hemost. 2003, 29, 435–450. [Google Scholar]
- Secomb, T.W. Red blood cell mechanics and capillary blood rheology. Cell Biophys. 1991, 18, 231–251. [Google Scholar] [CrossRef] [PubMed]
- Dumanskiy, Y.V.; Stoliarova, O.Y.; Syniachenko, O.V.; Giulmamedova, M.F.; Potapov, Y.A. Adsorption-rheological properties of blood serum in lung cancer patients. Exp. Oncol. 2017, 39, 304–307. [Google Scholar] [CrossRef]
- Nader, E.; Romana, M.; Connes, P. The Red Blood Cell-Inflammation Vicious Circle in Sickle Cell Disease. Front Immunol. 2020, 11, 454. [Google Scholar] [CrossRef] [Green Version]
- Ballas, S.K.; Connes, P. Rheological properties of sickle erythrocytes in patients with sickle-cell anemia: The effect of hydroxyurea, fetal hemoglobin, and α-thalassemia. Eur. J. Haematol. 2018, 101, 798–803. [Google Scholar] [CrossRef]
- Vent-Schmidt, J.; Waltz, X.; Romana, M.; Hardy-Dessources, M.-D.; Lemonne, N.; Billaud, M.; Etienne-Julan, M.; Connes, P. Blood Thixotropy in Patients with Sickle Cell Anaemia: Role of Haematocrit and Red Blood Cell Rheological Properties. PLoS ONE 2014, 9, e114412. [Google Scholar] [CrossRef]
- Marcinkowska-Gapińska, A.; Kowal, P. Influence of magnetostimulation therapy on rheological properties of blood in neurological patients. Electromagn. Biol. Med. 2016, 35, 260–264. [Google Scholar] [CrossRef]
- França, E.L.; Ribeiro, E.B.; Scherer, E.F.; Cantarini, D.G.; Pessôa, R.S.; França, F.L.; Honorio-França, A.C. Effects of Momordica charantia L. on the Blood Rheological Properties in Diabetic Patients. BioMed. Res. Int. 2014, 2014, 1–8. [Google Scholar]
- Vermes, I.; Steinmetz, E.T.; Zeyen, L.J.J.M.; Van Der Veen, E.A. Rheological properties of white blood cells are changed in diabetic patients with microvascular complications. Diabetologia 1987, 30, 434–436. [Google Scholar] [CrossRef] [PubMed]
- Słoczyńska, K.; Kózka, M.; Marona, H. Rheological properties of young and aged erythrocytes in chronic venous disease patients with varicose veins. Clin. Hemorheol. Microcirc. 2015, 60, 171–178. [Google Scholar] [CrossRef] [PubMed]
- Kasperska-Zajac, A.; Brzoza, Z.; Koczy-Baron, E.; Jagodzinska, J.; Slowinska, L.; Rogala, B. Blood Rheological Properties in Patients with Atopic Dermatitis (AD). Inflammation 2009, 32, 242–246. [Google Scholar] [CrossRef] [PubMed]
- Fu, G.X.; Ji, M.; Han, L.Z.; Xu, C.C.; Pan, F.F.; Hu, T.J.; Zhong, Y. Erythrocyte rheological properties but not whole blood and plasma viscosity are associated with severity of hypertension in older people. Z Gerontol. Geriatr. 2017, 50, 233–238. [Google Scholar] [CrossRef]
- Fornal, M.; Korbut, R.A.; Lekka, M.; Pyka-Fościak, G.; Wizner, B.; Styczen, J.; Grodzicki, T. Rheological properties of erythrocytes in patients with high risk of cardiovascular disease. Clin. Hemorheol. Microcirc. 2008, 39, 213–219. [Google Scholar] [CrossRef] [PubMed]
- Lowe, G.D.; Drummond, M.M.; Lorimer, A.R.; Hutton, I.; Forbes, C.D.; Prentice, C.R.; Barbenel, J.C. Relation between extent of coronary artery disease and blood viscosity. Br. Med. J. 1980, 280, 673–674. [Google Scholar] [CrossRef] [PubMed] [Green Version]
- Lam, S.F.; Shirure, V.S.; Chu, Y.E.; Soetikno, A.G.; George, S.C. Microfluidic device to attain high spatial and temporal control of oxygen. PLoS ONE 2018, 13, e0209574. [Google Scholar] [CrossRef] [Green Version]
- Gharib, G.; Bütün, İ.; Muganlı, Z.; Kozalak, G.; Namlı, İ.; Sarraf, S.S.; Ahmadi, V.E.; Toyran, E.; Van Wijnen, A.J.; Koşar, A. Biomedical Applications of Microfluidic Devices: A Review. Biosensors 2022, 12, 1023. [Google Scholar] [CrossRef] [PubMed]
- Wu, Q.; Liu, J.; Wang, X.; Feng, L.; Wu, J.; Zhu, X.; Wen, W.; Gong, X. Organ-on-a-chip: Recent breakthroughs and future prospects. BioMedical. Eng. Online 2020, 1, 1–19. [Google Scholar] [CrossRef] [Green Version]
- Bukowska, D.M.; Derzsi, L.; Tamborski, S.; Szkulmowski, M.; Garstecki, P.; Wojtkowski, M. Assessment of the flow velocity of blood cells in a microfluidic device using joint spectral and time domain optical coherence tomography. Opt. Express 2013, 21, 24025. [Google Scholar] [CrossRef] [PubMed]
- Cairone, F.; Ortiz, D.; Cabrales, P.J.; Intaglietta, M.; Bucolo, M. Emergent behaviors in RBCs flows in micro-channels using digital particle image velocimetry. Microvasc. Res. 2018, 116, 77–86. [Google Scholar] [CrossRef] [PubMed]
- Chen, L.; Li, D.; Liu, X.; Xie, Y.; Shan, J.; Huang, H.; Yu, X.; Chen, Y.; Zheng, W.; Li, Z. Point-of-Care Blood Coagulation Assay Based on Dynamic Monitoring of Blood Viscosity Using Droplet Microfluidics. ACS Sens. 2022, 7, 2170–2177. [Google Scholar] [CrossRef]
- Khnouf, R.; Karasneh, D.; Abdulhay, E.; Abdelhay, A.; Sheng, W.; Fan, Z.H. Microfluidics-based device for the measurement of blood viscosity and its modeling based on shear rate, temperature, and heparin concentration. Biomed. Microdevices 2019, 21, 80. [Google Scholar] [CrossRef] [PubMed]
- Mena, S.E.; Li, Y.; McCormick, J.; McCracken, B.; Colmenero, C.; Ward, K.; Burns, M.A. A droplet-based microfluidic viscometer for the measurement of blood coagulation. Biomicrofluidics 2020, 14, 014109. [Google Scholar] [CrossRef]
- Agarwal, R.; Sarkar, A.; Paul, S.; Chakraborty, S. A portable rotating disc as blood rheometer. Biomicrofluidics 2019, 13, 064120. [Google Scholar] [CrossRef]
- Park, J.H.; Go, T.; Lee, S.J. Label-Free Sensing and Classification of Old Stored Blood. Ann. Biomed. Eng. 2017, 45, 2563–2573. [Google Scholar] [CrossRef]
- Kim, B.J.; Lee, Y.S.; Zhbanov, A.; Yang, S. A physiometer for simultaneous measurement of whole blood viscosity and its determinants: Hematocrit and red blood cell deformability. Analyst 2019, 144, 3144–3157. [Google Scholar] [CrossRef] [PubMed]
- Link, A.; Franke, T. Acoustic erythrocytometer for mechanically probing cell viscoelasticity. Lab Chip 2020, 20, 1991–1998. [Google Scholar] [CrossRef] [Green Version]
- Toderi, M.A.; Castellini, H.V.; Riquelme, B.D. Descriptive parameters of the erythrocyte aggregation phenomenon using a laser transmission optical chip. J. Biomed. Opt. 2017, 22, 17003. [Google Scholar] [CrossRef]
- Kaliviotis, E.; Yianneskis, M. Blood viscosity modelling: Influence of aggregate network dynamics under transient conditions. Biorheology 2011, 48, 127–147. [Google Scholar] [CrossRef] [PubMed]
- Kang, Y.J.; Serhrouchni, S.; Makhro, A.; Bogdanova, A.; Lee, S.S. Simple Assessment of Red Blood Cell Deformability Using Blood Pressure in Capillary Channels for Effective Detection of Subpopulations in Red Blood Cells. ACS Omega 2022, 7, 38576–38588. [Google Scholar] [CrossRef]
- Shin, D.A.; Lee, J.C.; Shin, H.; Cho, Y.-J.; Kim, H.C. Point-of-care testing of plasma free hemoglobin and hematocrit for mechanical circulatory support. Sci. Rep. 2021, 11, 3788. [Google Scholar] [CrossRef]
- Chakraborty, S.; Das, S.; Das, C.; Chandra, S.; Sharma, K.D.; Karmakar, A.; Chattoapadhyay, S. On-chip estimation of hematocrit level for diagnosing anemic conditions by Impedimetric techniques. Biomed. Microdevices 2020, 22, 38. [Google Scholar] [CrossRef] [PubMed]
- Kim, H.; Zhbanov, A.; Yang, S. Microfluidic Systems for Blood and Blood Cell Characterization. Biosensors 2023, 13, 13. [Google Scholar] [CrossRef]
- Kang, Y.J.; Lee, S.-J. In vitro and ex vivo measurement of the biophysical properties of blood using microfluidic platforms and animal models. Analyst 2018, 143, 2723–2749. [Google Scholar] [CrossRef]
- Kim, B.J.; Lee, S.Y.; Jee, S.; Atajanov, A.; Yang, S. Micro-viscometer for measuring shear-varying blood viscosity over a wide-ranging shear rate. Sensors 2017, 17, 1442. [Google Scholar] [CrossRef] [Green Version]
- Kang, Y.J.; Yoon, S.Y.; Lee, K.-H.; Yang, S. A highly accurate and consistent microfluidic viscometer for continuous blood viscosity measurement. Artif. Organs 2010, 34, 944–949. [Google Scholar] [CrossRef] [PubMed]
- Kang, Y.J.; Ryu, J.; Lee, S.-J. Label-free viscosity measurement of complex fluids using reversal flow switching manipulation in a microfluidic channel. Biomicrofluidics 2013, 7, 044106. [Google Scholar]
- Srivastava, N.; Davenport, R.D.; Burns, M.A. Nanoliter Viscometer for Analyzing Blood Plasma and Other Liquid Samples. Anal. Chem. 2005, 77, 383–392. [Google Scholar] [CrossRef]
- Lee, J.; Chou, T.-C.; Kang, D.; Kang, H.; Chen, J.; Baek, K.I.; Wang, W.; Ding, Y.; Carlo, D.D.; Tai, Y.-C.; et al. A Rapid Capillary-Pressure Driven Micro-Channel to Demonstrate Newtonian Fluid Behavior of Zebrafish Blood at High Shear Rates. Sci. Rep. 2017, 7, 1980. [Google Scholar] [CrossRef] [PubMed] [Green Version]
- Liu, L.; Hu, D.; Lam, R. Microfluidic Viscometer Using a Suspending Micromembrane for Measurement of Biosamples. Micromachines 2020, 11, 934. [Google Scholar] [CrossRef]
- Mustafa, A.; Eser, A.; Aksu, A.C.; Kiraz, A.; Tanyeri, M.; Erten, A.; Yalcin, O. A micropillar-based microfluidic viscometer for Newtonian and non-Newtonian fluids. Anal. Chim. Acta 2020, 1135, 107–115. [Google Scholar] [CrossRef]
- Lee, T.A.; Liao, W.H.; Wu, Y.F.; Chen, Y.L.; Tung, Y.C. Electrofluidic Circuit-Based Microfluidic Viscometer for Analysis of Newtonian and Non-Newtonian Liquids under Different Temperatures. Anal. Chem. 2018, 90, 2317–2325. [Google Scholar] [CrossRef] [PubMed]
- Nader, E.; Skinner, S.; Romana, M.; Fort, R.; Lemonne, N.; Guillot, N.; Gauthier, A.; Antoine-Jonville, S.; Renoux, C.; Hardy-Dessources, M.-D.; et al. Blood rheology: Key parameters, impact on blood flow, role in sickle cell disease and effects of exercise. Front. Physiol. 2019, 10, 1329. [Google Scholar] [CrossRef] [PubMed] [Green Version]
- Sabuncu, A.C.; Muldur, S.; Cetin, B.; Usta, O.B.; Aubry, N. β-dispersion of blood during sedimentation. Sci. Rep. 2021, 11, 2642. [Google Scholar]
- Kang, Y.; Kim, B. Multiple and Periodic Measurement of RBC Aggregation and ESR in Parallel Microfluidic Channels under On-Off Blood Flow Control. Micromachines 2018, 9, 318. [Google Scholar] [CrossRef] [PubMed] [Green Version]
- Namgung, B.; Lee, T.; Tan, J.K.S.; Poh, D.K.H.; Park, S.; Chng, K.Z.; Agrawal, R.; Park, S.Y.; Leo, H.L.; Kim, S. Vibration motor-integrated low-cost, miniaturized system for rapid quantification of red blood cell aggregation. Lab Chip 2020, 20, 3930–3937. [Google Scholar] [CrossRef]
- Isiksacan, Z.; Erel, O.; Elbuken, C. A portable microfluidic system for rapid measurement of the erythrocyte sedimentation rate. Lab Chip 2016, 16, 4682–4690. [Google Scholar] [CrossRef]
- Kim, J.H.; Lee, H.; Lee, B.K.; Shin, S. Influence of shear stress on erythrocyte aggregation. Clin. Hemorheol. Microcirc. 2016, 62, 165–171. [Google Scholar] [CrossRef]
- Lee, K.; Kinnunen, M.; Danilina, A.V.; Ustinov, V.D.; Shin, S.; Meglinski, I.; Priezzhev, A.V. Characterization at the individual cell level and in whole blood samples of shear stress preventing red blood cells aggregation. J. Biomech. 2016, 49, 1021–1026. [Google Scholar] [CrossRef]
- Kang, Y.J. Red Blood Cell Sedimentation Index Using Shear Stress of Blood Flow in Microfluidic Channel. Biosensors 2022, 12, 547. [Google Scholar] [CrossRef]
- Kang, Y.J. Assessment of blood biophysical properties using pressure sensing with micropump and microfluidic comparator. Micromachines 2022, 13, 483. [Google Scholar] [CrossRef]
- Rajeeva Pandian, N.K.; Jain, A. In silico analyses of blood flow and oxygen transport in human micro-veins and valves. Clin. Hemorheol. Microcirc. 2022, 81, 81–96. [Google Scholar] [CrossRef] [PubMed]
- Kang, Y.J.; Kim, M.G.; Son, K.H.; Lim, C.H.; Son, H.S.; Yoon, S.Y.; Kwon, H.S.; Yang, S. Experimental investigation of pulsatility effect on the deformability and hemolysis of blood cells. Artif. Organs 2010, 34, E103–E109. [Google Scholar] [CrossRef] [PubMed]
- Ahn, C.B.; Kang, Y.J.; Kim, M.G.; Yang, S.; Lim, C.H.; Son, H.S.; Kim, J.S.; Lee, S.Y.; Son, K.H.; Sun, K. The Effect of Pulsatile Versus Nonpulsatile Blood Flow on Viscoelasticity and Red Blood Cell Aggregation in Extracorporeal Circulation. Korean J. Thorac. Cardiovasc. Surg. 2016, 49, 145–150. [Google Scholar] [CrossRef] [PubMed]
- Kang, Y.J. Contributions of red blood cell sedimentation in a driving syringe to blood flow in capillary channels. Micromachines 2022, 13, 909. [Google Scholar] [CrossRef] [PubMed]
- Kim, G.; Jeong, S.; Kang, Y.J. Ultrasound standing wave-based cell-to-liquid separation for measuring viscosity and aggregation of blood sample. Sensors 2020, 20, 2284. [Google Scholar] [CrossRef] [PubMed] [Green Version]
- Thielicke, W.; Stamhuis, E.J. PIVlab–Towards user-friendly, affordable and accurate digital particle image velocimetry in MATLAB. J. Open Res. Softw. 2014, 2, e30. [Google Scholar] [CrossRef] [Green Version]
- Bourdon, C.J.; Olsen, M.G.; Gorby, A.D. The depth of correction in miciro-PIV for high numerical aperaure and immersion objectives. J. Fluid Eng. T. ASME 2006, 128, 883–886. [Google Scholar] [CrossRef]
- Zhang, X.; Zhu, Z.; Xiang, N.; Ni, Z. A microfluidic gas damper for stabilizing gas pressure in portable microfluidic systems. Biomicrofluidics 2016, 10, 054123. [Google Scholar] [CrossRef] [Green Version]
- Zhou, Y.; Liu, J.; Yan, J.; Zhu, T.; Guo, S.; Li, S.; Li, T. Standing Air Bubble-Based Micro-Hydraulic Capacitors for Flow Stabilization in Syringe Pump-Driven Systems. Micromachines 2020, 11, 396. [Google Scholar] [CrossRef]
- Oh, K.W.; Lee, K.; Ahn, B.; Furlani, E.P. Design of pressure-driven microfluidic networks using electric circuit analogy. Lab Chip 2012, 12, 515–545. [Google Scholar] [CrossRef] [PubMed]
- Kang, Y.J.; Lee, S.-J. Blood viscoelasticity measurement using steady and transient flow controls of blood in a microfluidic analogue of Wheastone-bridge channel. Biomicrofluidics 2013, 7, 054122. [Google Scholar]
- Kang, Y.J.; Yang, S. Fluidic low pass filter for hydrodynamic flow stabilization in microfluidic environments. Lab Chip 2012, 12, 1881–1889. [Google Scholar] [CrossRef]
- Yang, B.; Lin, Q. A Compliance-Based Microflow Stabilizer. J. Microelectromech. Syst. 2009, 18, 539–546. [Google Scholar] [CrossRef]
- Veenstra, T.T.; Sharma, N.R.; Forster, F.K.; Gardeniers, J.G.E.; Elwenspoek, M.C.; Berg, A.v.d. The design of an in-plane compliance structure for microfluidical systems. Sens. Actuator B Chem. 2002, 81, 377–383. [Google Scholar] [CrossRef]
- Kang, Y.J. Sequential quantification of blood and diluent using red cell sedimentation-based separation and pressure-induced work in a microfluidic channel. Anal. Methods 2022, 14, 1194–1207. [Google Scholar] [CrossRef]
- Kang, Y.J. Microfluidic-based biosensor for blood viscosity and erythrocyte sedimentation rate using disposable fluid delivery system. Micromachines 2020, 11, 215. [Google Scholar] [CrossRef] [Green Version]
- Kang, Y.J. Microfluidic quantification of blood pressure and compliance properties using velocity fields under periodic on-off blood flows. App. Sci. Basel. 2020, 10, 5273. [Google Scholar] [CrossRef]
Figure 1.
Proposed method for quantifying rheological properties in pulsatile blood flows. (A) Schematic diagram of a proposed method. (i) Microfluidic device with one inlet, two outlets (a, b), a main channel, and a side channel. Air compliance unit (ACU) was connected to outlet (b). The flow rate set to Qb (t) = Qα + Qβ sin(2πt/T). Here, the T denoted period. (iii) Microscopic image acquisition system. (iv) A protype of a suggested microfluidic system. (B) Quantification of four parameters of blood flow in main and side channels (i.e., <Um>, <Im>, <Us>, and <Is>). (C) Quantification of four parameters for dextran-included blood (i.e., normal RBCs suspended into dextran solution [15 mg/mL], and Hct = 50%). (i) Temporal variations of <Um> and <Us>. (ii) Temporal variations of <Im> and <Is>.

Figure 3.
Contributions of a flow rate profile to variation of velocity, image intensity, and pressure in the side channel. (A) Temporal variations of (i) blood velocities (<Um>, <Us>), (ii) β, (iii) image intensities (<Im>, <Is>) under constant flow rate (Qb = 1 mL/h). (B) Temporal variations of (i) blood velocities (<Um>, <Us>), (ii) β, (iii) image intensities (<Im>, <Is>) under pulsatile flow rate (Qb = 1 + 0.5 sin (2πt/240) mL/h). (C) Temporal variations of (i) blood velocities (<Um>, <Us>), (iii) β, and (iii) image intensities (<Im>, <Is>), and under square-wave flow rate (Qmax = 1.5 mL/h, Qmin = 0.5 mL/h, and T = 240 s).

Figure 4.
Contributions of air compliance unit (ACU) to three rheological properties in pulsatile blood flow rate. (A) Temporal variations of <Um> and β with respect to LACU = 50, 100, and 200. (B) Temporal variations of <Is> with respect to LACU. (C) Quantifications of three parameters (i.e., β, λb, and AI) with respect to LACU. (i) Variations of b1, b2, and λ2 with respect to LACU. (ii) Temporal variations of time constant (λb) with respect to LACU. (iii) Temporal variations of AI with respect to LACU.

Figure 5.
Contribution of hematocrit to rheological properties in pulsatile blood flow. (A) Quantification of four parameters (i.e., <Um>, β, <Im>, and <Is>) with respect to Hct = 30, 40, and 50%. Temporal variations of (i) <Um>, (ii) β, (iii) <Im>, and (iv) <Is> were obtained with respect to Hct. (B) Quantification of two properties (λb, AI) with respect to Hct. Temporal variations of (i) λb, and (ii) AI were obtained with respect to Hct.

Figure 6.
Quantification of three rheological properties for RBC aggregation-enhanced blood. Blood (Hct = 50%) was prepared by adding normal RBCs into a specific concentration of dextran solution (Cdex) (Cdex = 20, 40, 60, and 80 mg/mL). Three kinds of blood test (n = 3) were conducted to guarantee repeatability of the present method. (A) Variations of b1 and λ2 obtained by regression analysis of β with respect to Cdex. (B) Temporal variations of λb with respect to Cdex. (C) Temporal variations of AI with respect to Cdex.

Figure 7.
Quantitative comparison between normal RBCs and heat-shocked RBCs in terms of three rheological properties. Here, normal RBCs were exposed to a higher temperature of 50 °C for 1 h. Control blood (Hct = 50%) and test blood (Hct = 50%) were then prepared by adding normal RBCs and heat-shocked RBCs into the same concentration of dextran solution (20 mg/mL). (A) Contribution of heat-exposed RBCs to pressure variation. (i) Temporal variations of β with respect to control blood and test blood. (ii) Variations of b1 and λ2 with respect to test blood and control blood. (B) Temporal variations of λb and AI with respect to control blood and test blood.

Disclaimer/Publisher’s Note: The statements, opinions and data contained in all publications are solely those of the individual author(s) and contributor(s) and not of MDPI and/or the editor(s). MDPI and/or the editor(s) disclaim responsibility for any injury to people or property resulting from any ideas, methods, instructions or products referred to in the content. |
© 2023 by the author. Licensee MDPI, Basel, Switzerland. This article is an open access article distributed under the terms and conditions of the Creative Commons Attribution (CC BY) license (https://creativecommons.org/licenses/by/4.0/).
Share and Cite
MDPI and ACS Style
Kang, Y.J. Biomechanical Assessment of Red Blood Cells in Pulsatile Blood Flows. Micromachines 2023, 14, 317. https://doi.org/10.3390/mi14020317
AMA Style
Kang YJ. Biomechanical Assessment of Red Blood Cells in Pulsatile Blood Flows. Micromachines. 2023; 14(2):317. https://doi.org/10.3390/mi14020317
Chicago/Turabian StyleKang, Yang Jun. 2023. "Biomechanical Assessment of Red Blood Cells in Pulsatile Blood Flows" Micromachines 14, no. 2: 317. https://doi.org/10.3390/mi14020317
Note that from the first issue of 2016, this journal uses article numbers instead of page numbers. See further details here.