
Computational Fluid Dynamics Study of the Effects of Temperature and Geometry Parameters on a Virtual Impactor


Abstract
:1. Introduction
2. Theoretical Analysis and Methods
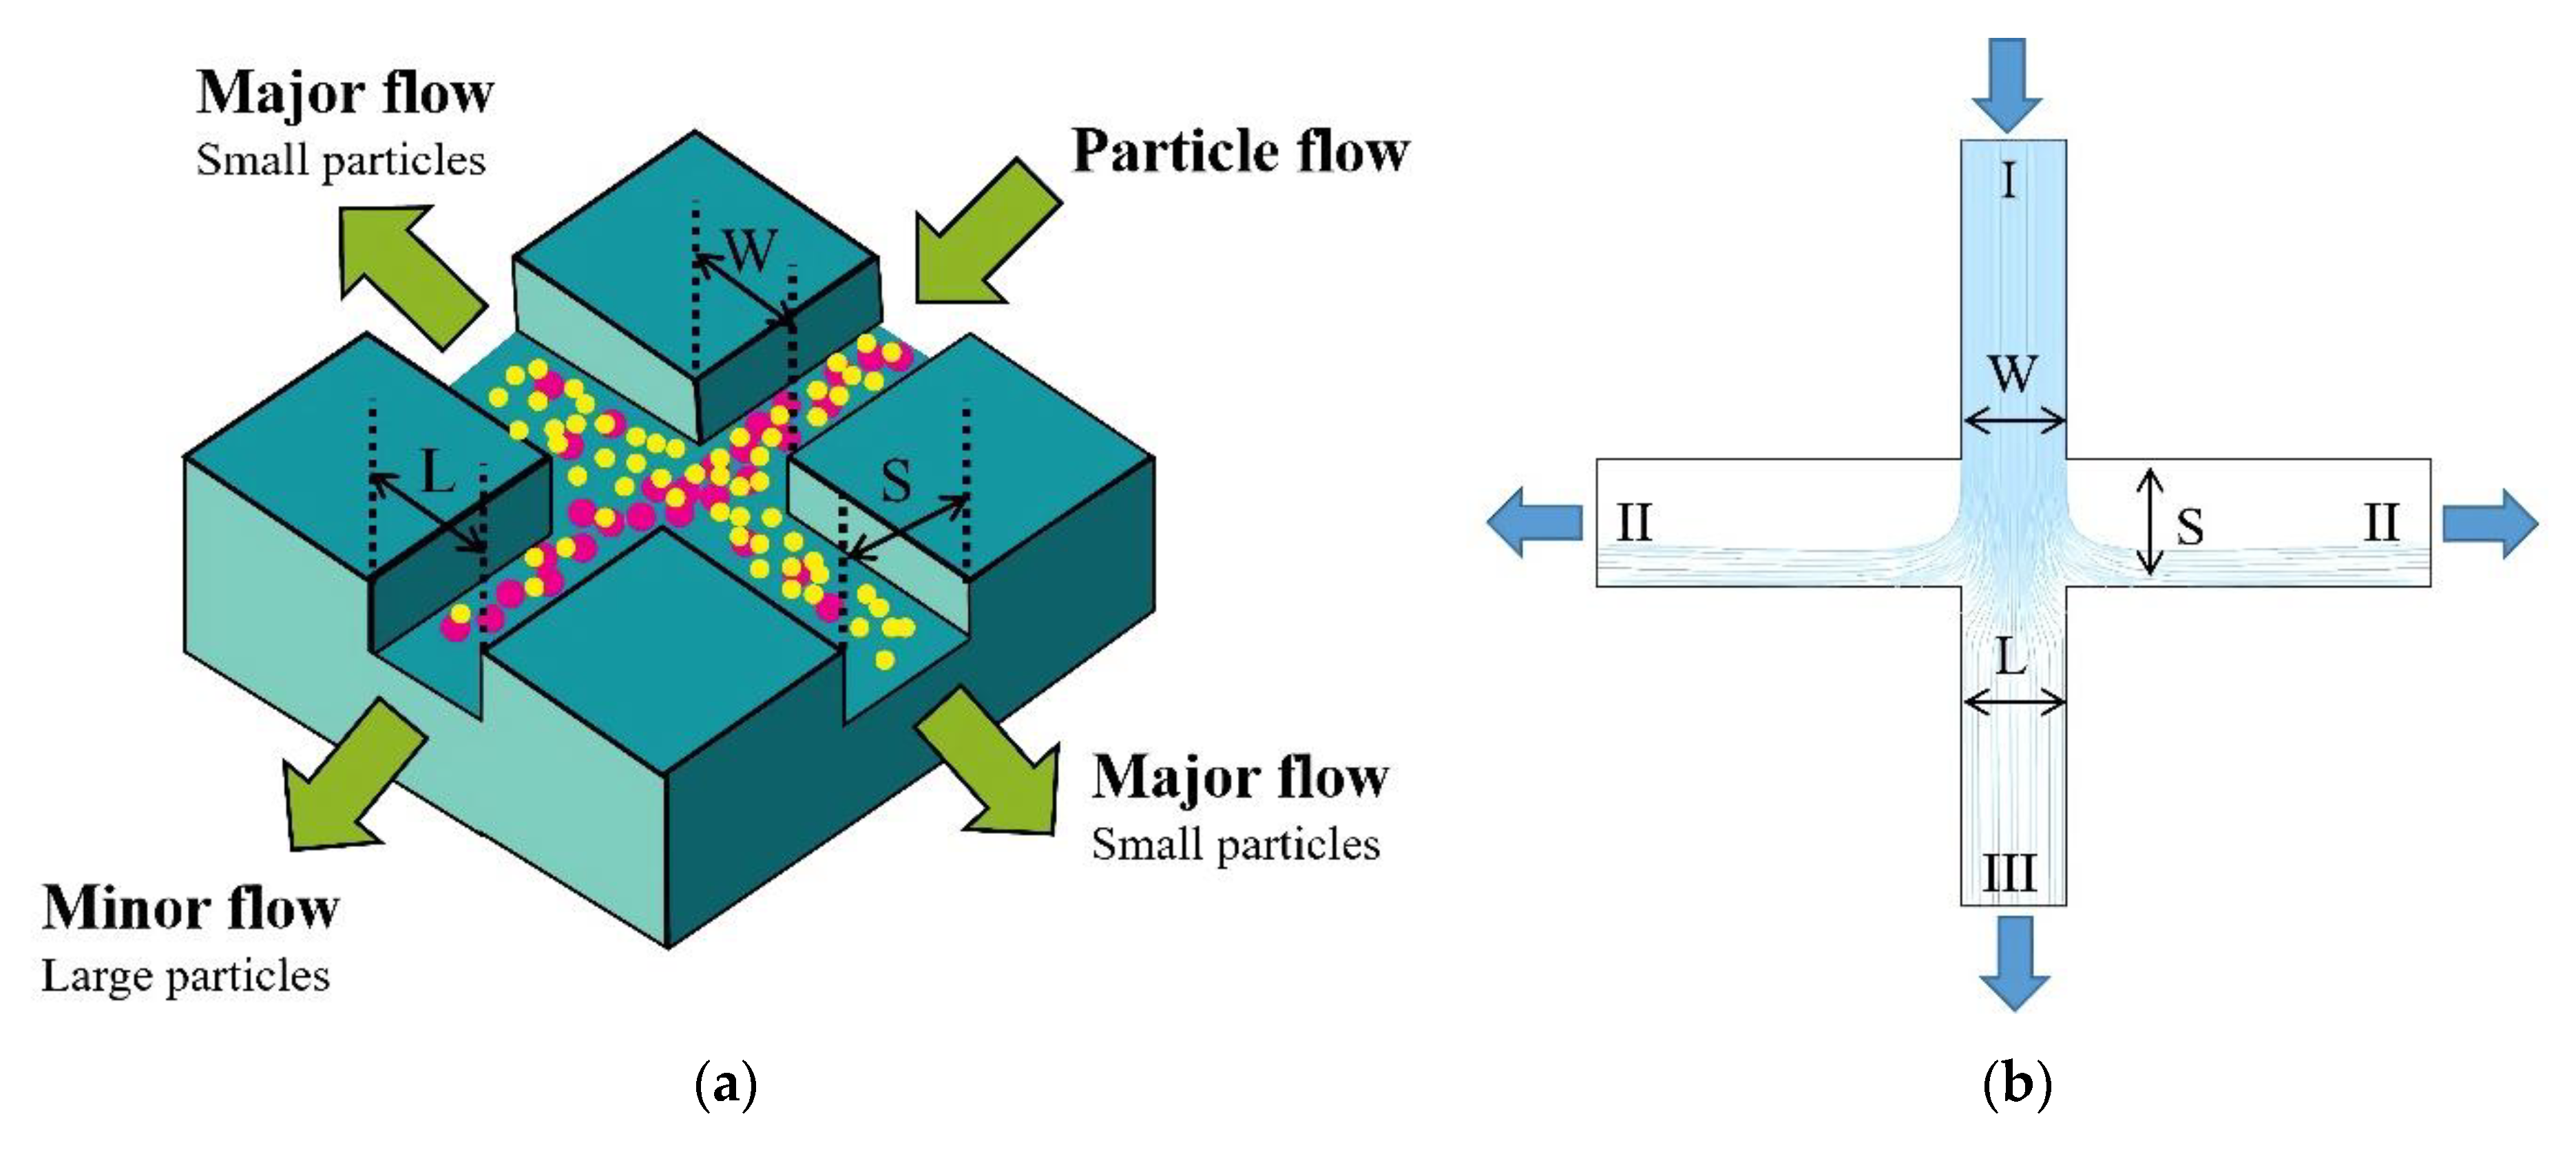
2.1. Theoretical Analysis
2.2. Methods
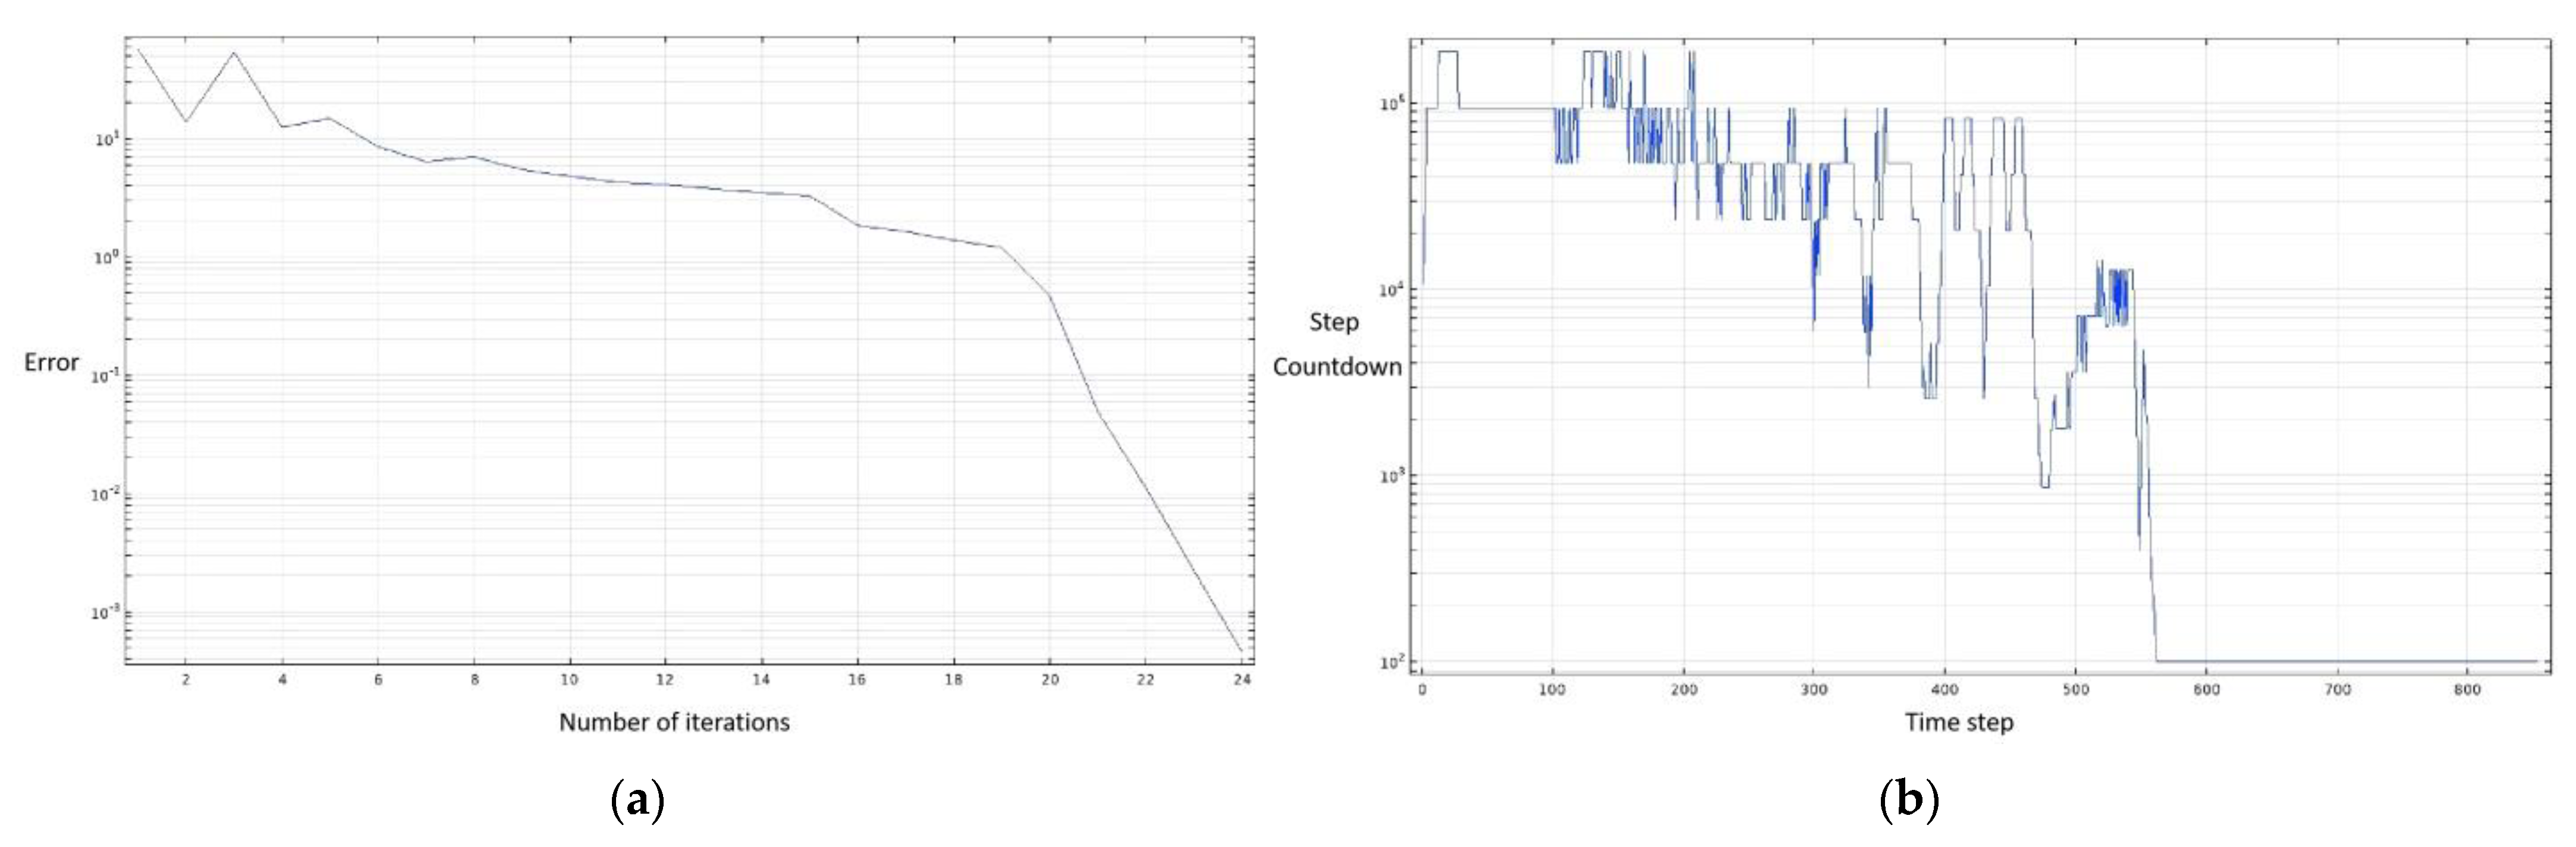
Simulation Methods
3. Results and Discussion
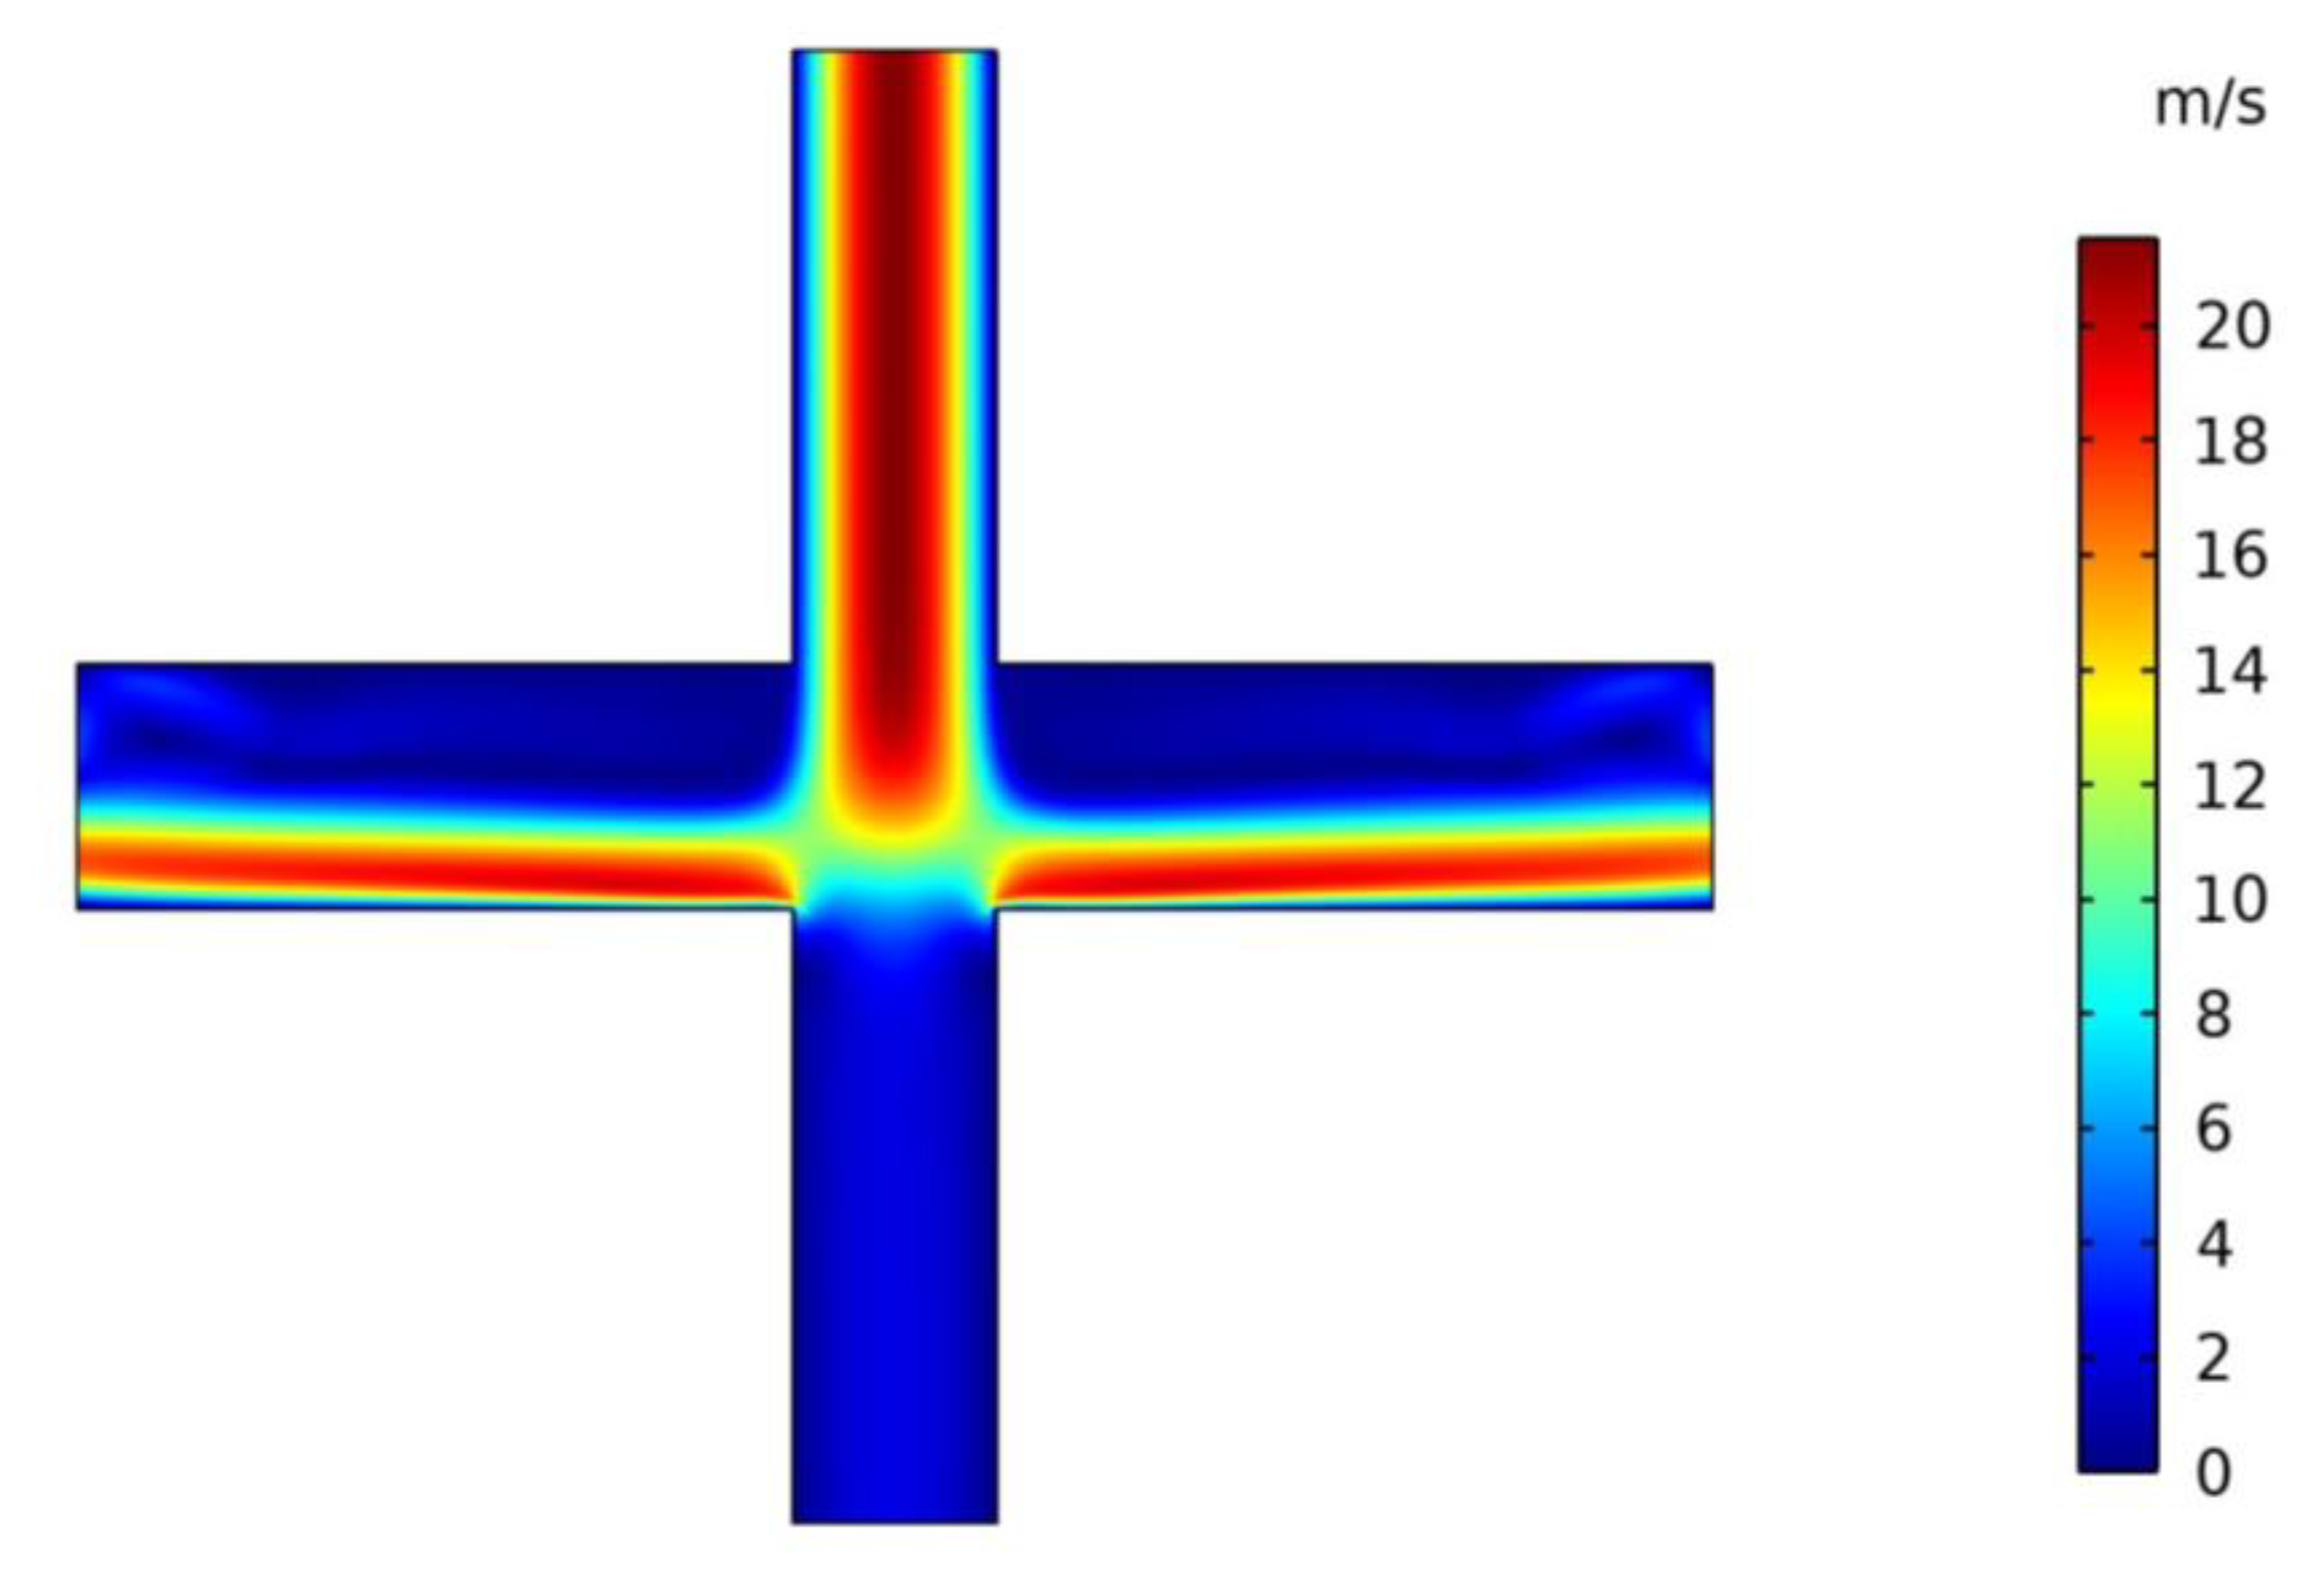
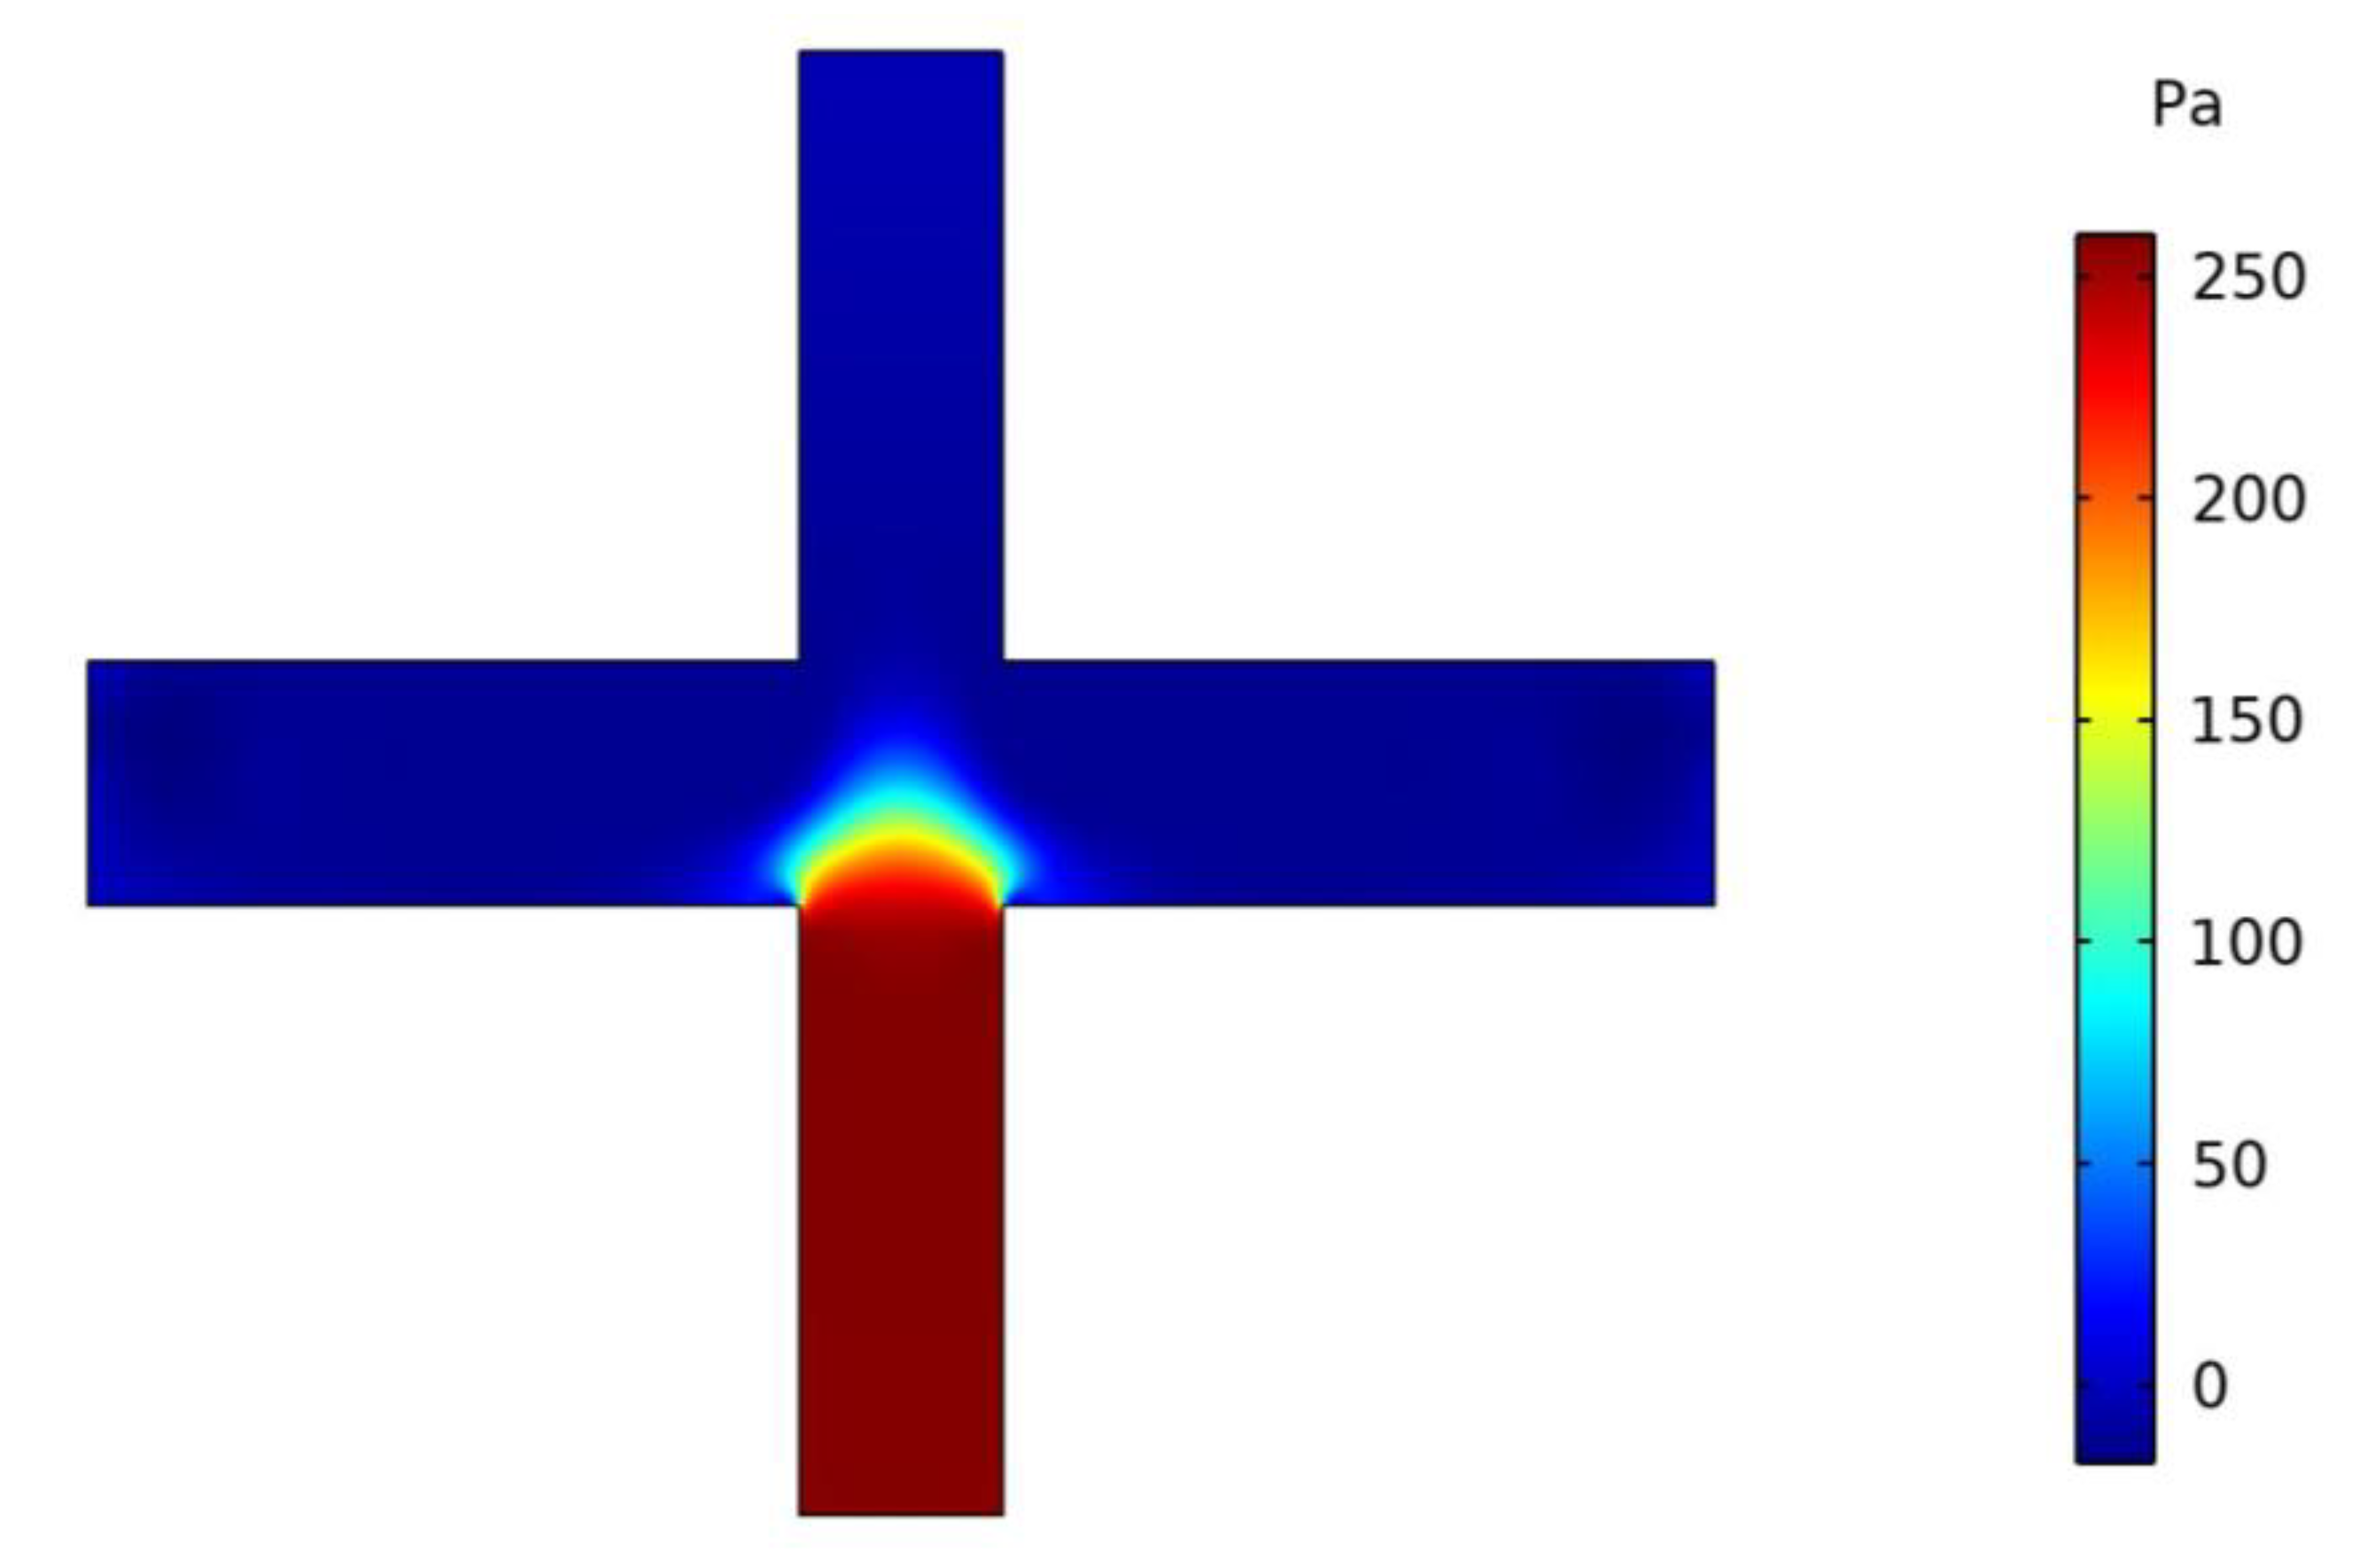
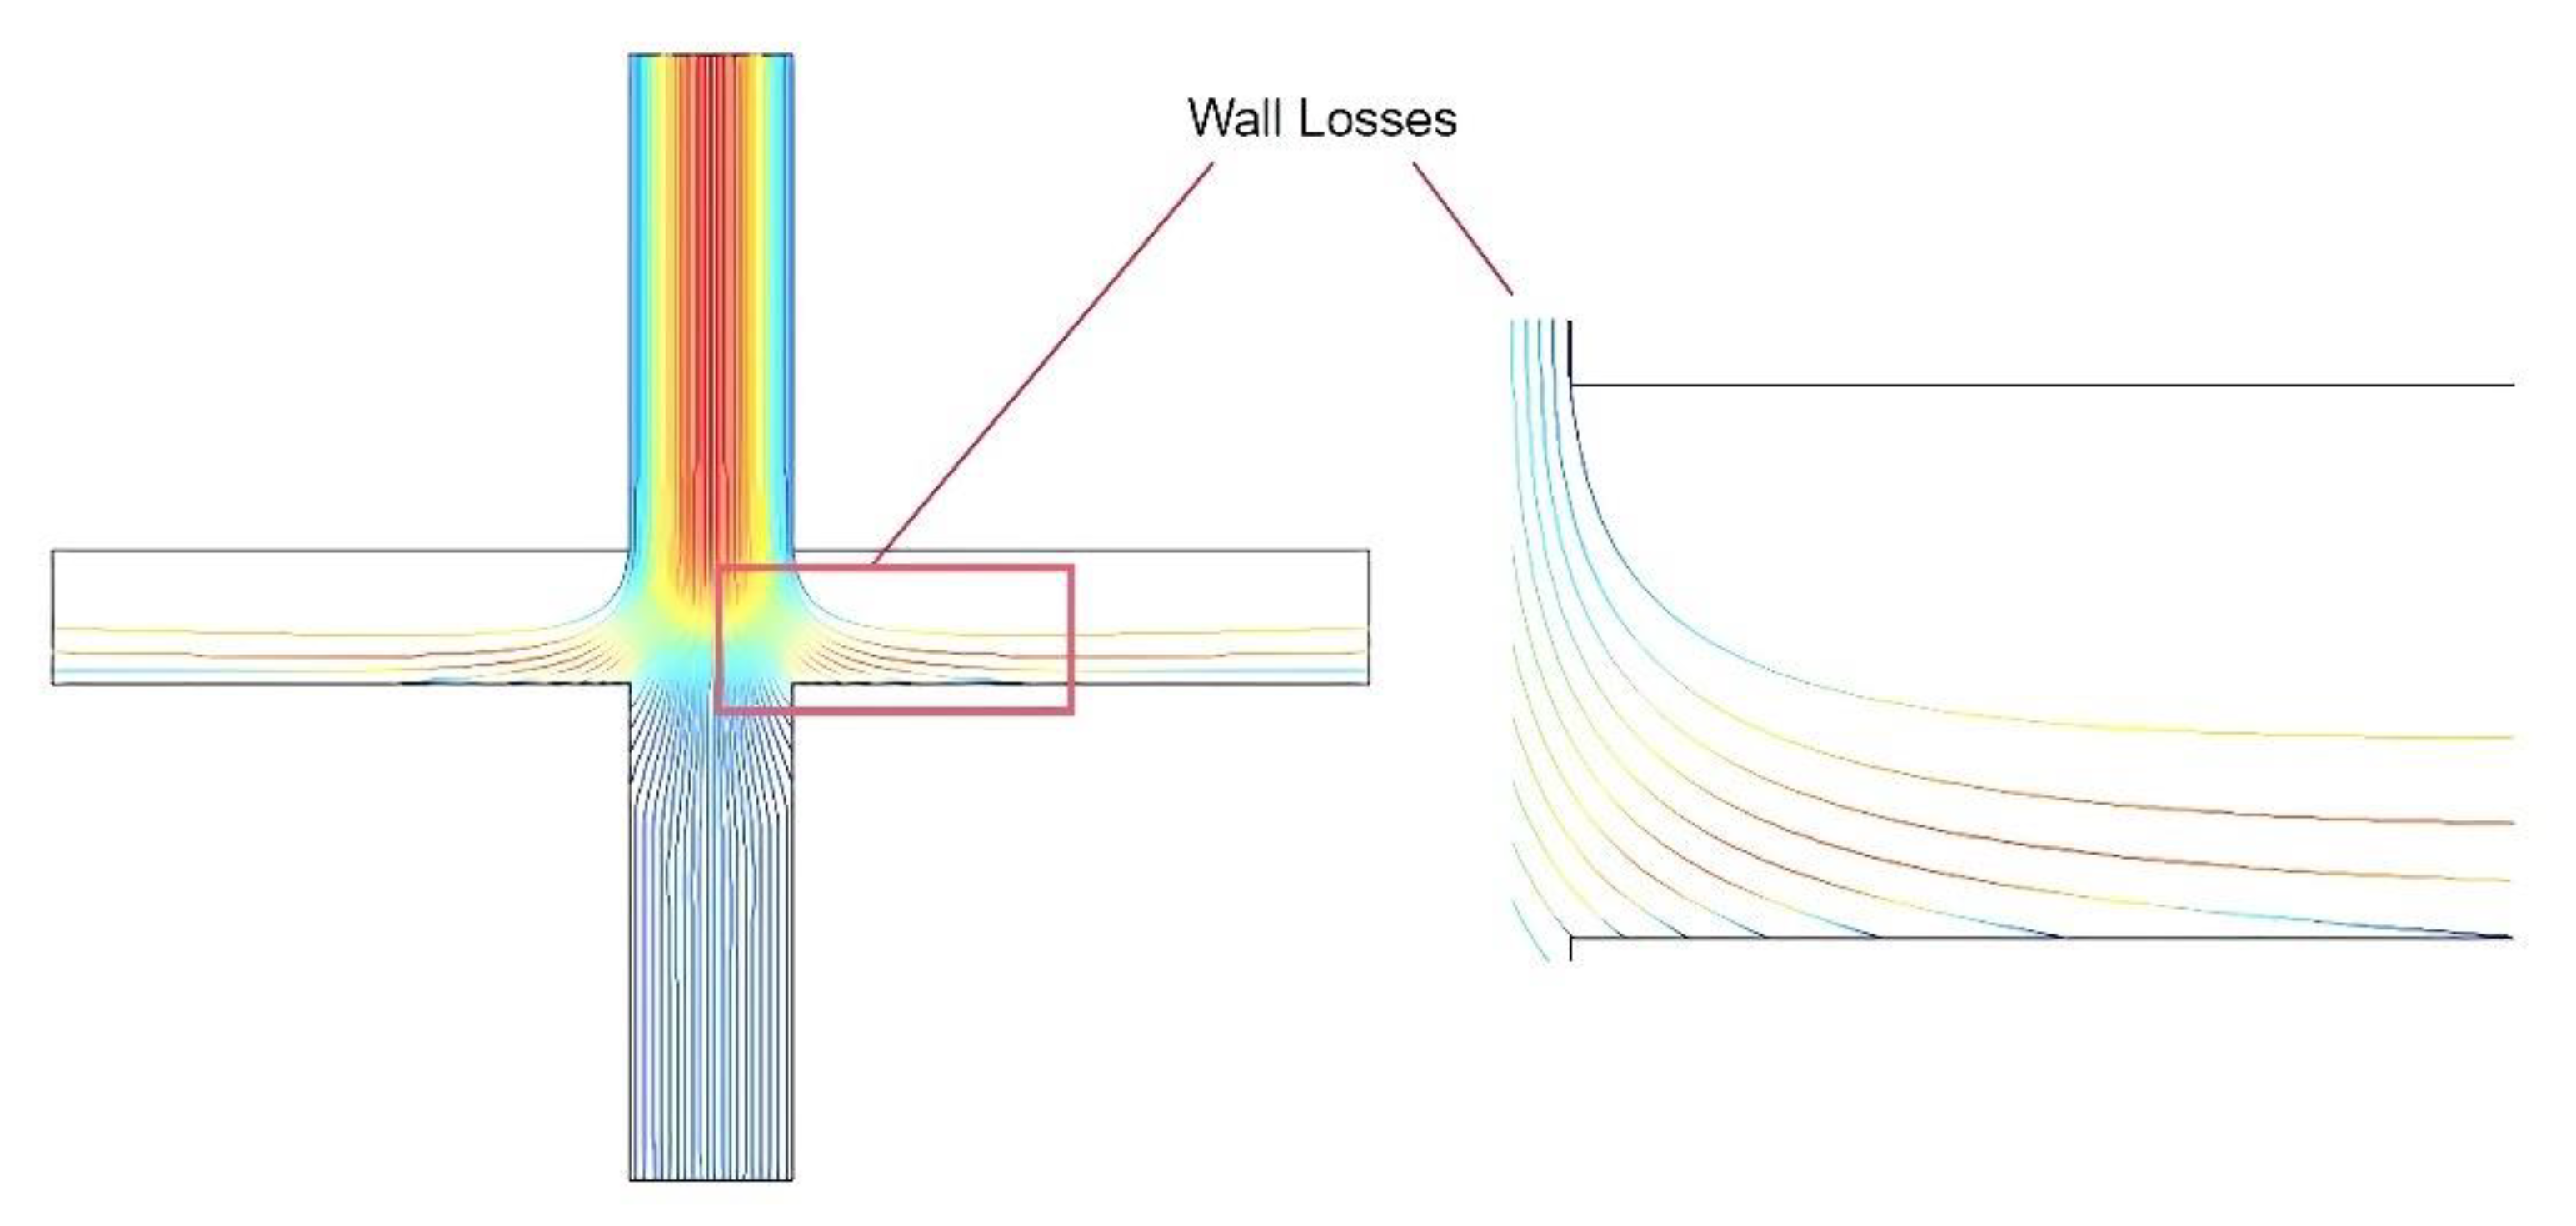
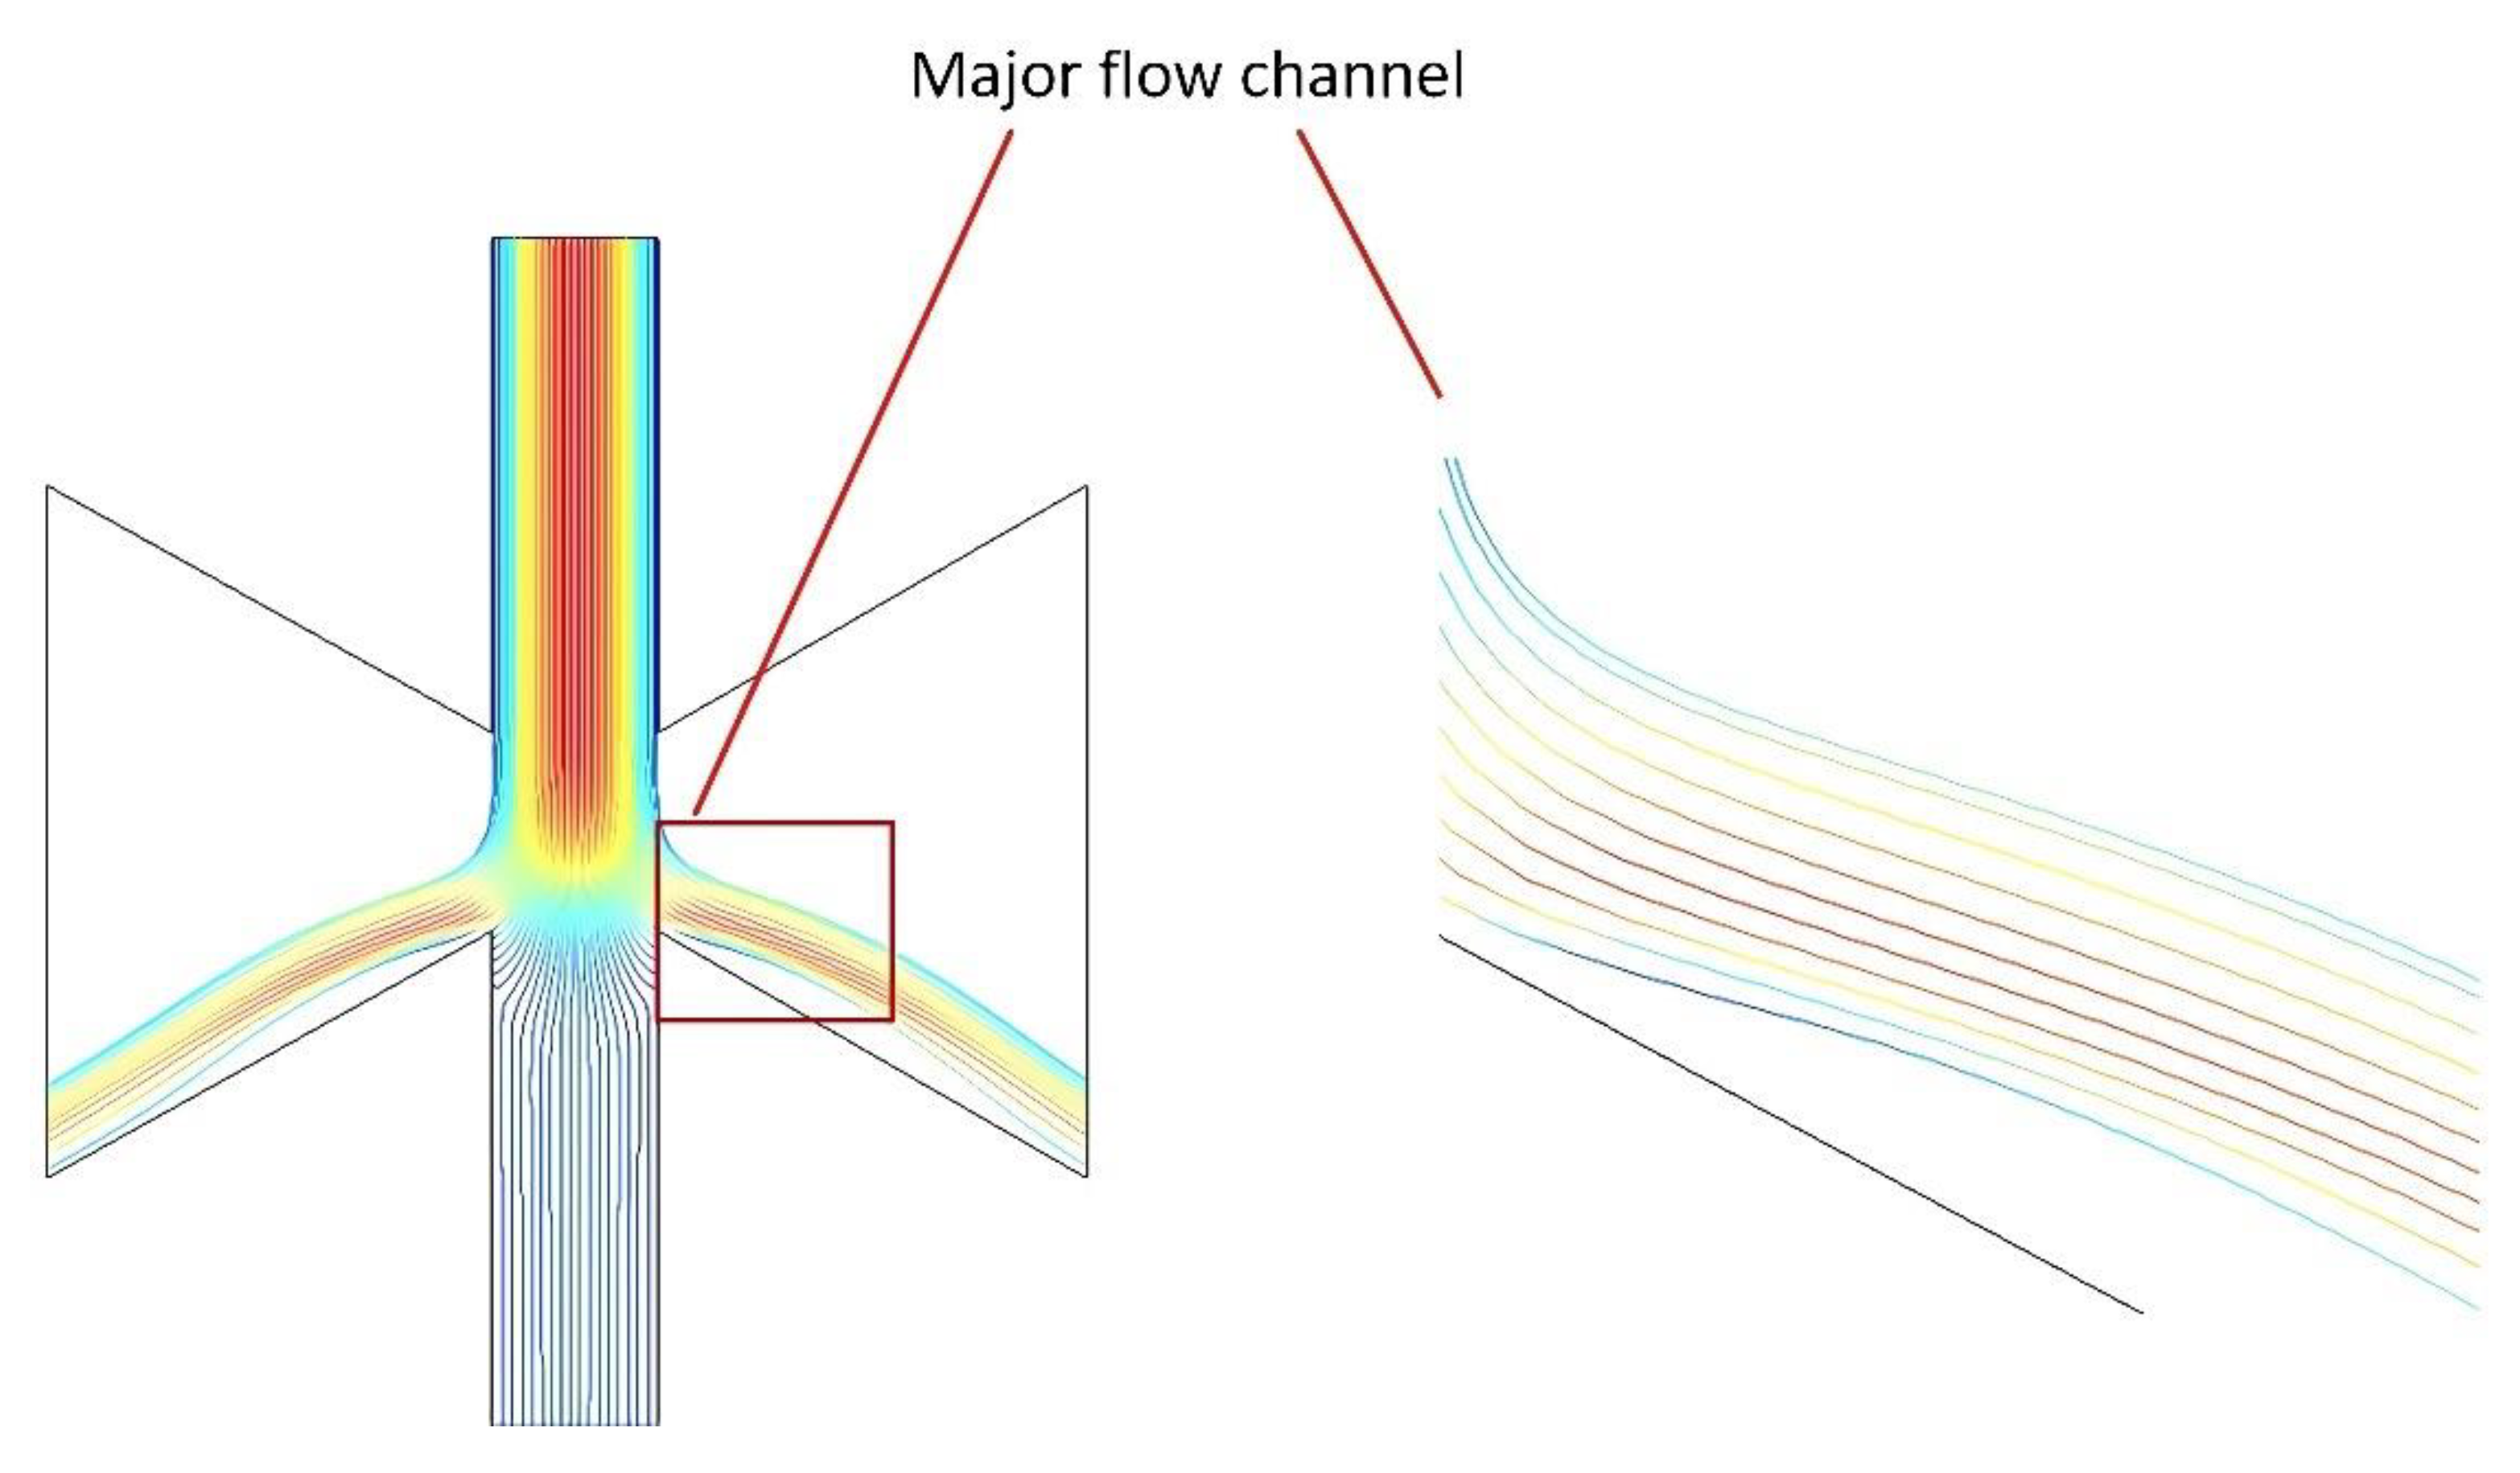
3.1. Flow and Pressure Analysis
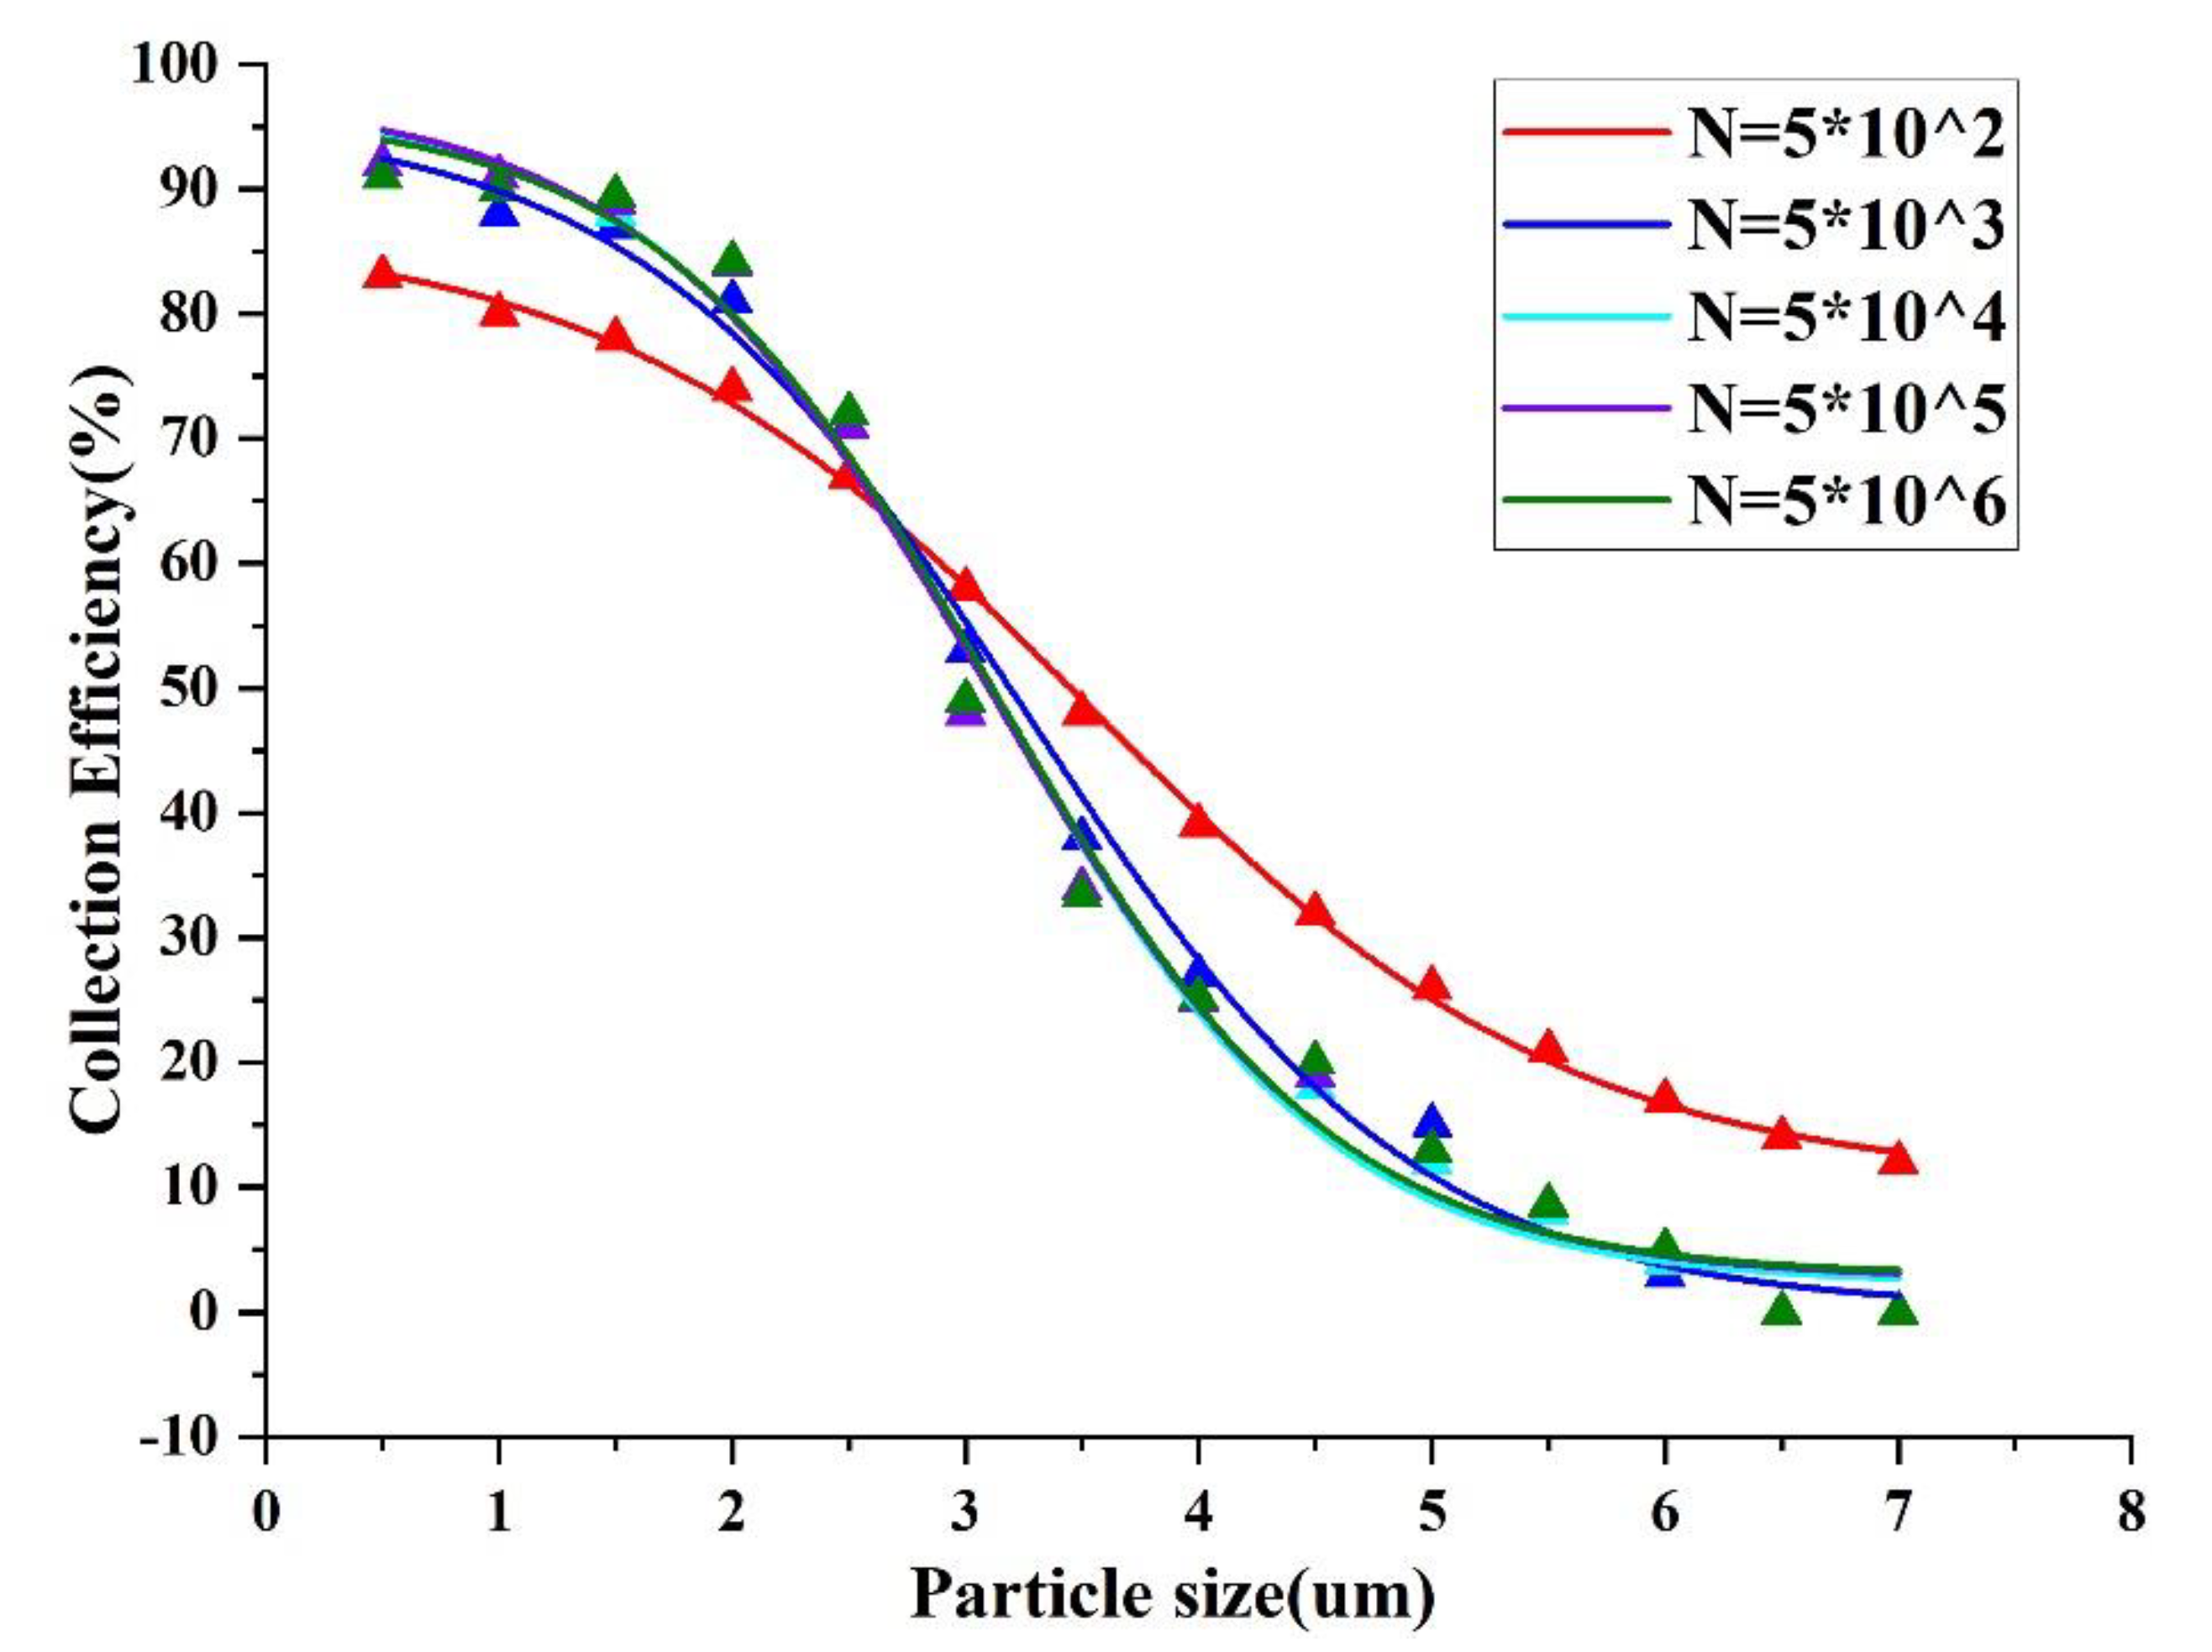
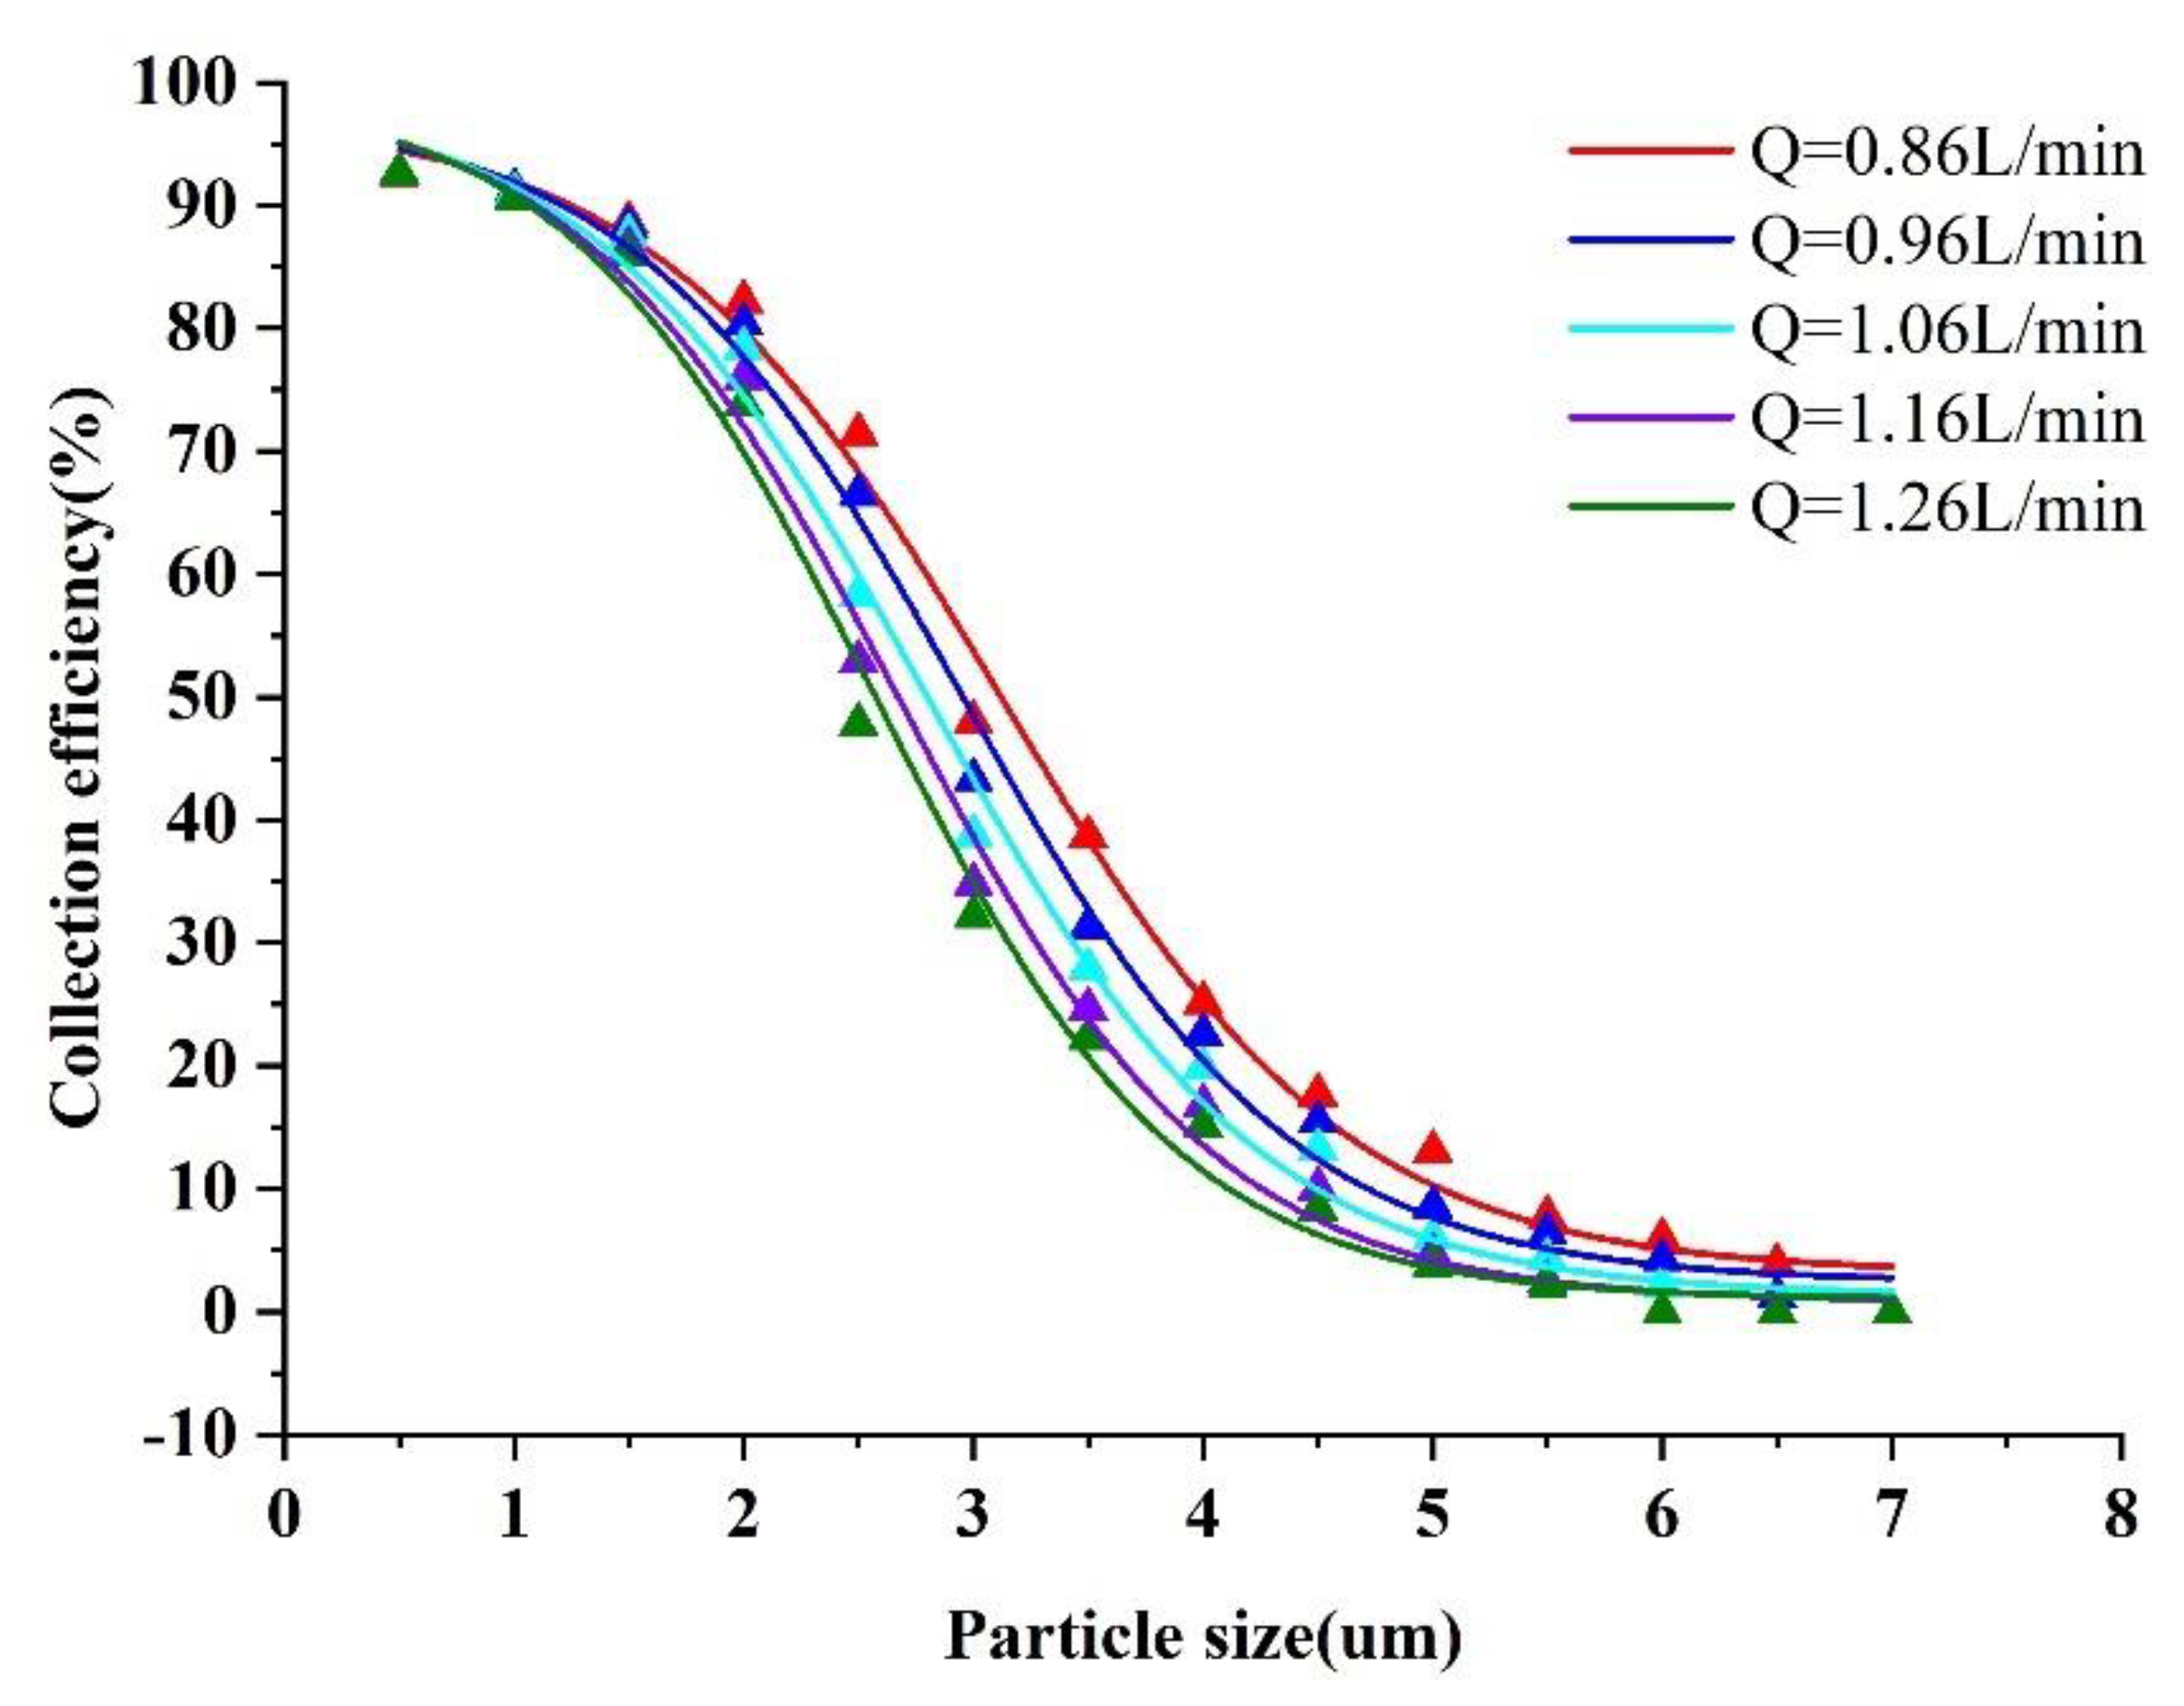
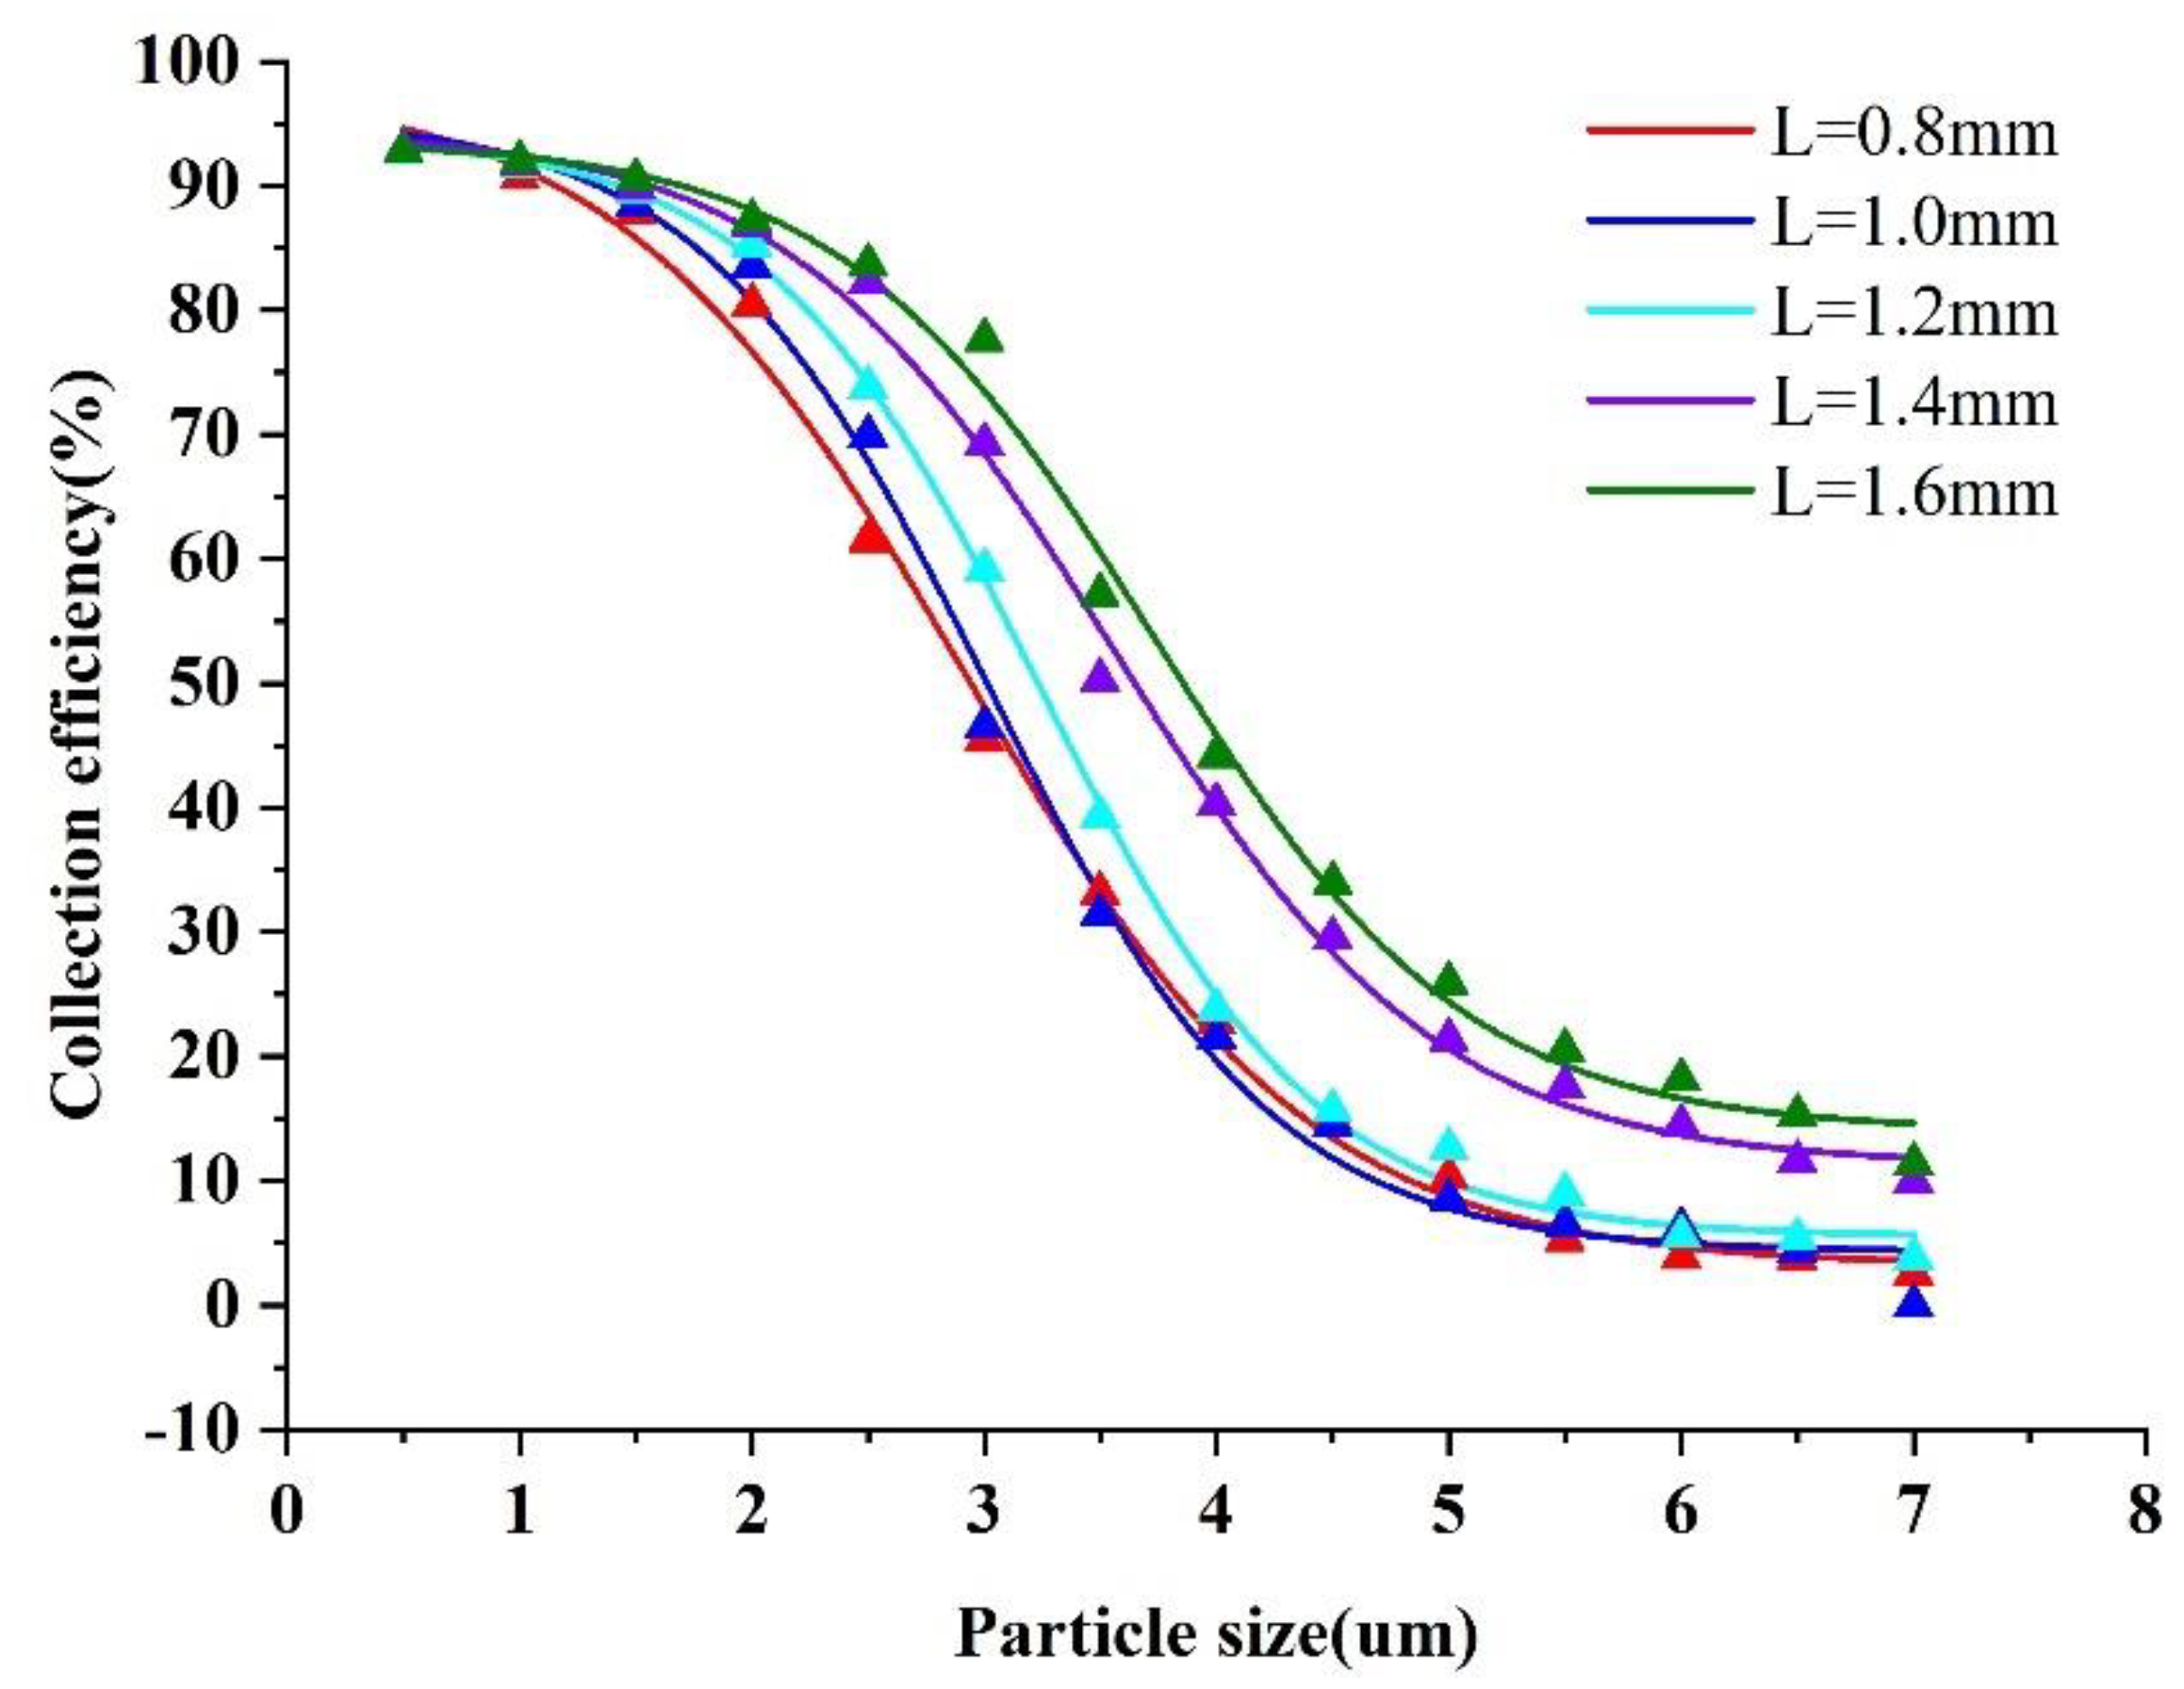
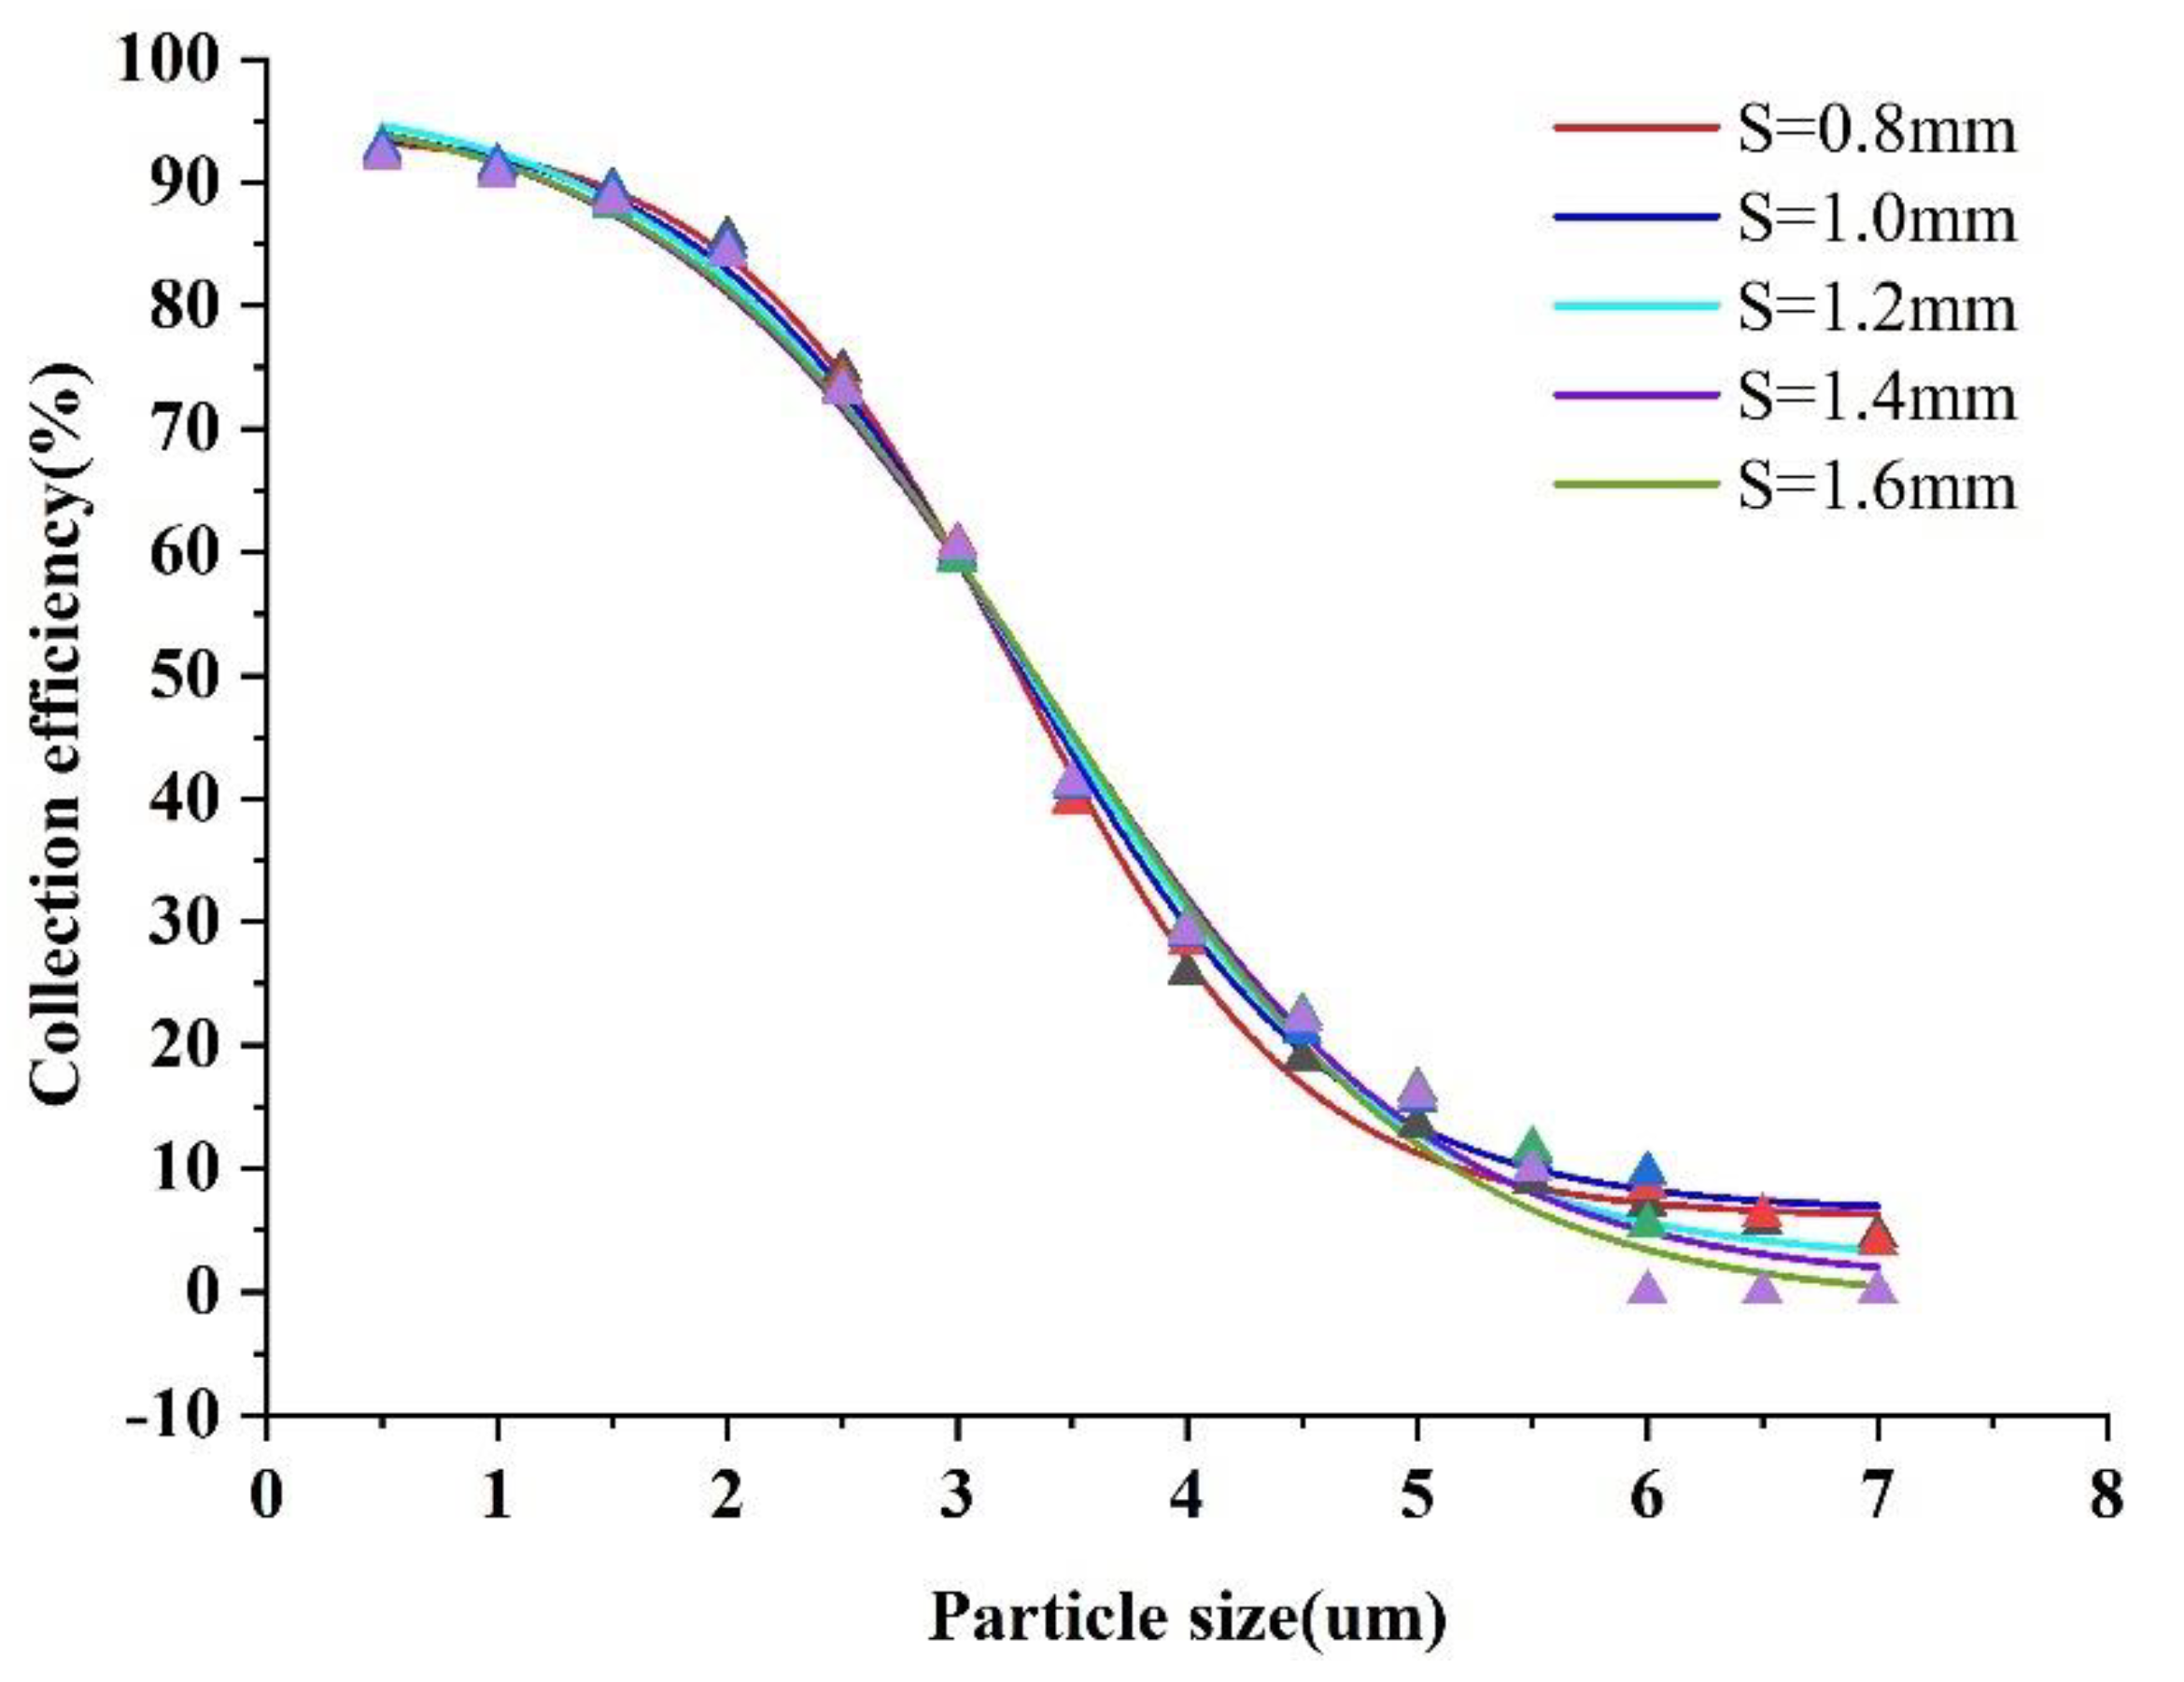
3.2. Effect of the Minor Flow Channel Width (L) and the Major Flow Channel Width (S) on Col−Lection Efficiency
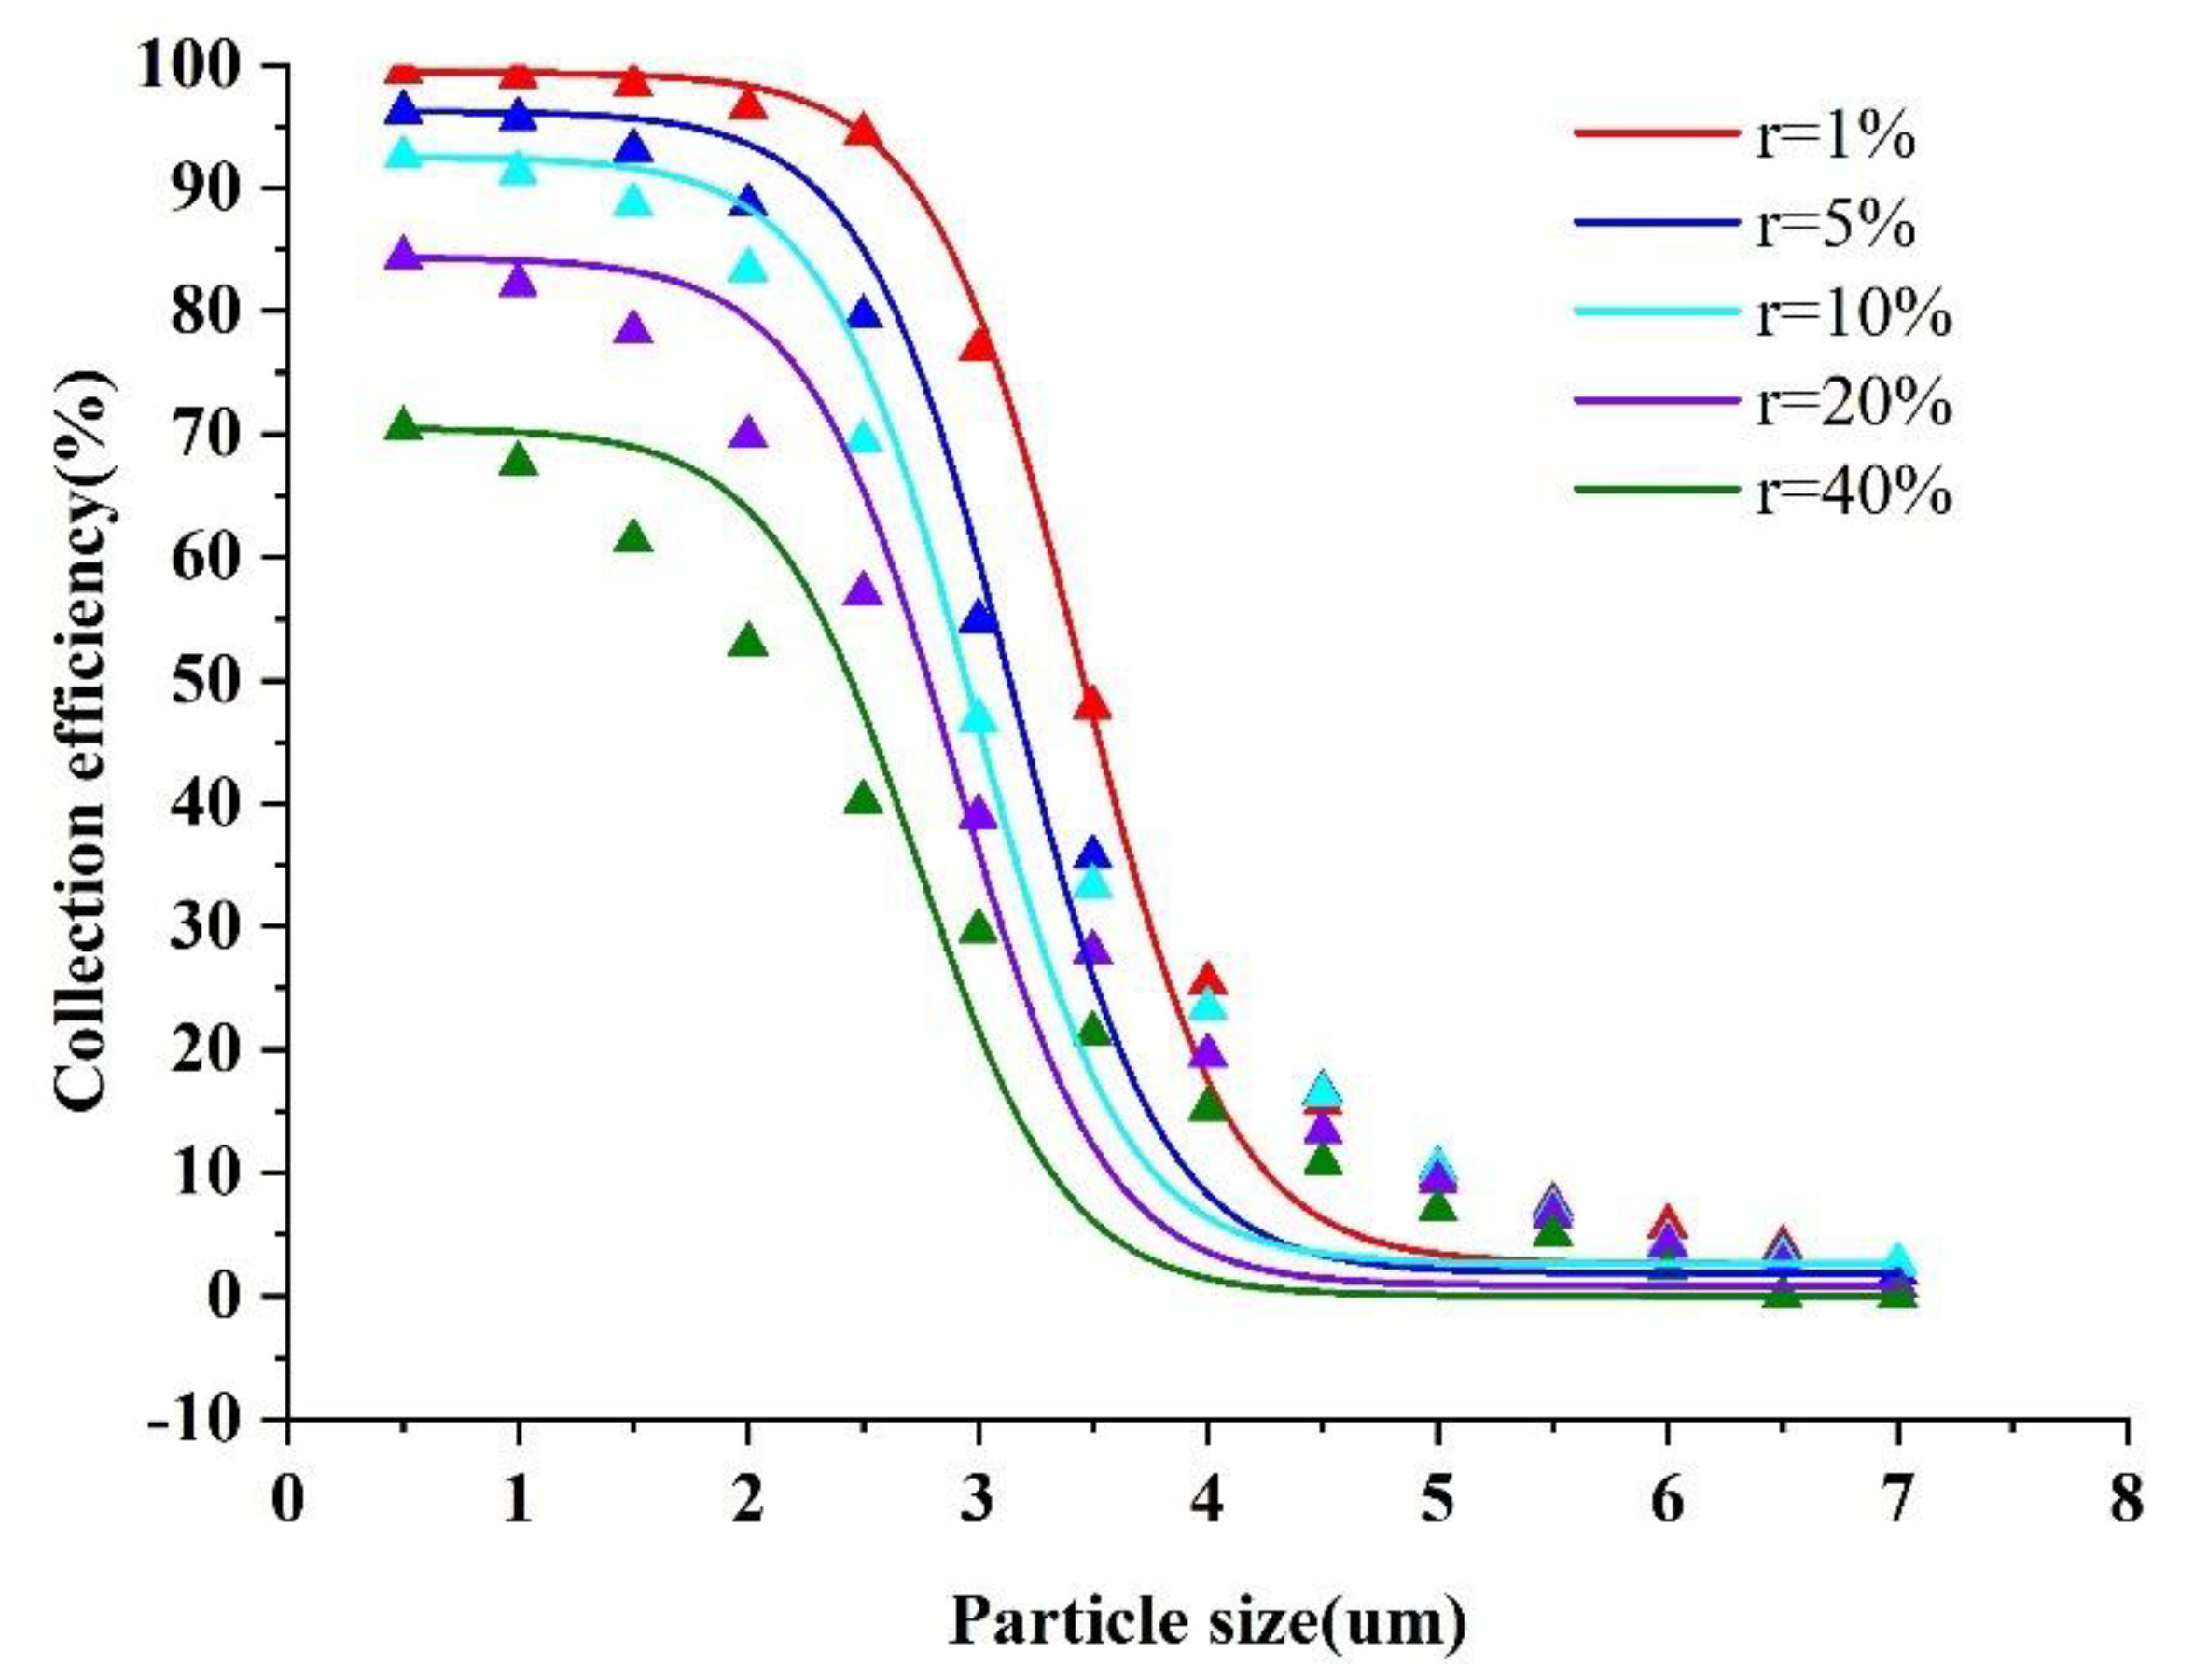
3.3. Effect of the Split Ratio (r) on Collection Efficiency
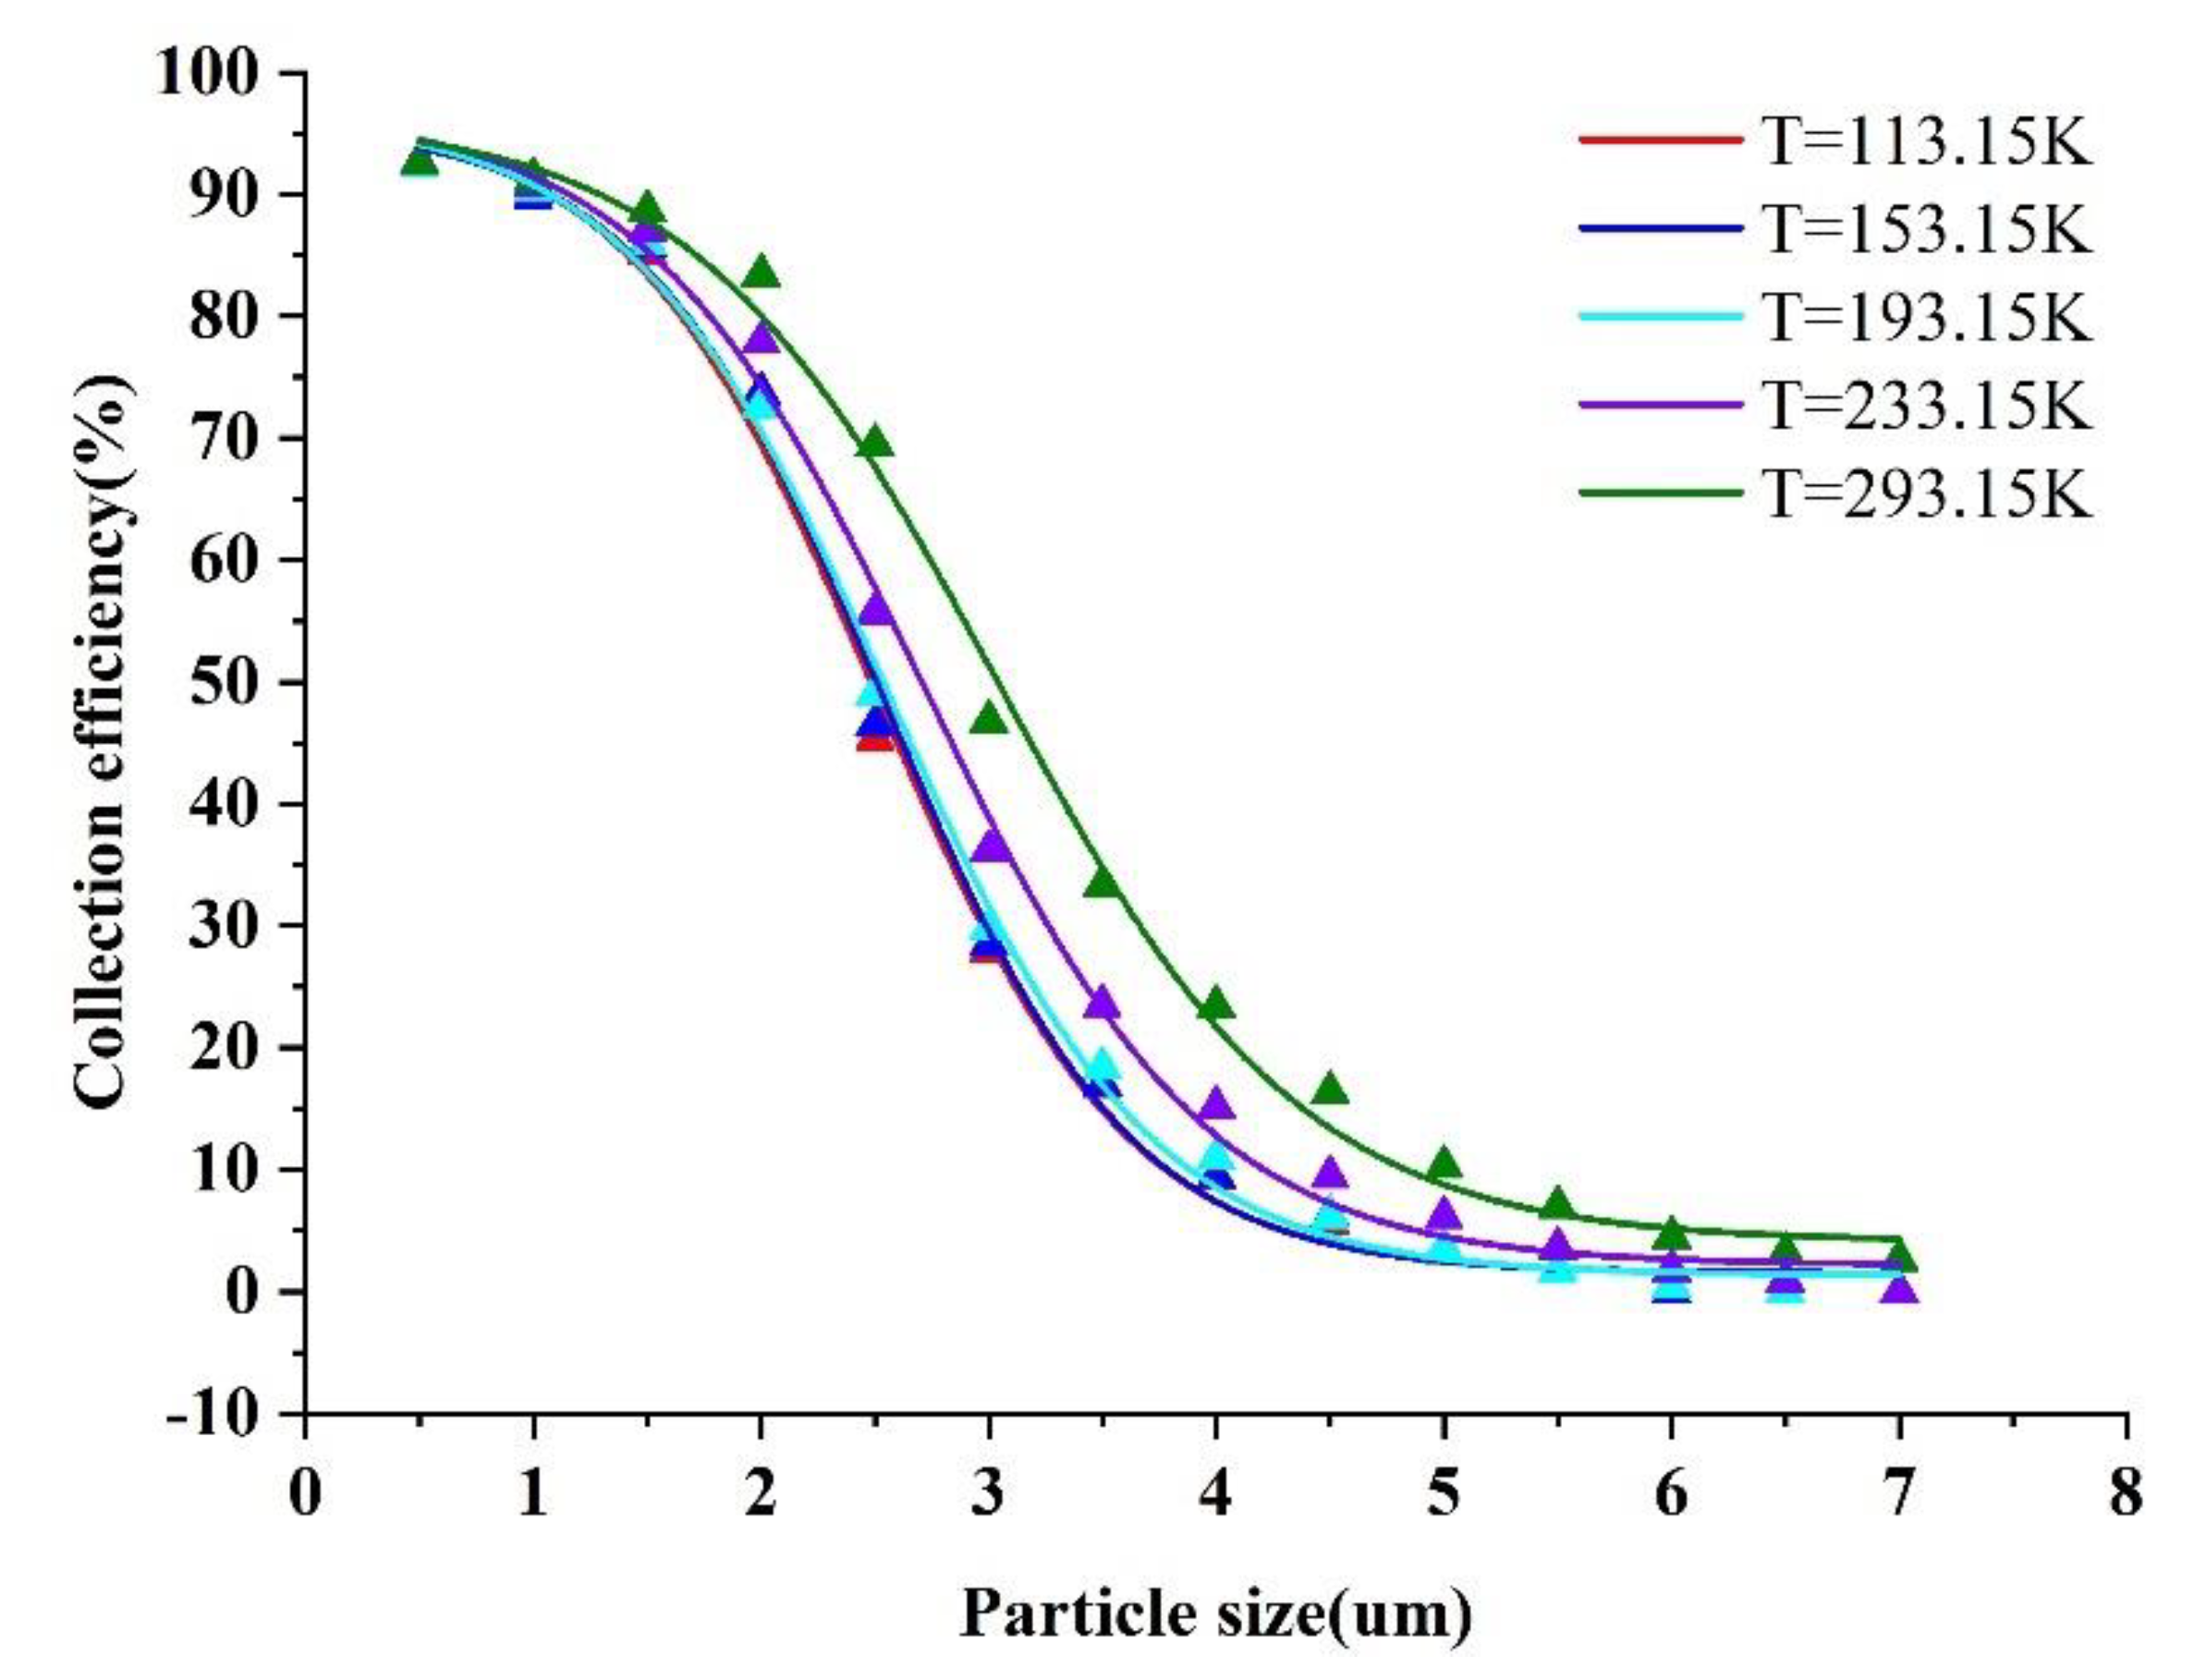
3.4. Effect of the Temperature (T) on Collection Efficiency
3.5. Result of the Simulation
4. Conclusions
Author Contributions
Funding
Data Availability Statement
Conflicts of Interest
References
- Dockery, D.W. Health effects of particulate air pollution. Ann. Epidemiol. 2009, 19, 257–263. [Google Scholar] [CrossRef]
- Mazzarella, G.; Ferraraccio, F.; Prati, M.V.; Annunziata, S.; Bianco, A.; Mezzogiorno, A.; Liguori, G.; Angelillo, I.F.; Cazzola, M. Effects of diesel exhaust particles on human lung epithelial cells: An in vitro study. Respir. Med. 2007, 101, 1155–1162. [Google Scholar] [CrossRef]
- Dehbi, H.M.; Blangiardo, M.; Gulliver, J.; Fecht, D.; de Hoogh, K.; Al-Kanaani, Z.; Tillin, T.; Hardy, R.; Chaturvedi, N.; Hansell, A.L. Air pollution and cardiovascular mortality with over 25years follow-up: A combined analysis of two British cohorts. Env. Int. 2017, 99, 275–281. [Google Scholar] [CrossRef]
- Chi, R.; Chen, C.; Li, H.; Pan, L.; Zhao, B.; Deng, F.; Guo, X. Different health effects of indoor- and outdoor-originated PM2.5 on cardiopulmonary function in COPD patients and healthy elderly adults. Indoor Air 2019, 29, 192–201. [Google Scholar] [CrossRef]
- Loxham, M. Harmful effects of particulate air pollution: Identifying the culprits. Respirology 2015, 20, 7–8. [Google Scholar] [CrossRef]
- Shin, W.Y.; Kim, J.H.; Lee, G.; Choi, S.; Kim, S.R.; Hong, Y.C.; Park, S.M. Exposure to ambient fine particulate matter is associated with changes in fasting glucose and lipid profiles: A nationwide cohort study. BMC Public Health 2020, 20, 430. [Google Scholar] [CrossRef]
- Grigg, J. Arrhythmias and particulate matter. Lancet Planet. Health 2017, 1, e50–e51. [Google Scholar] [CrossRef]
- Wilson, W.E.; Mage, D.T.; Grant, L.D. Estimating separately personal exposure to ambient and nonambient particulate matter for epidemiology and risk assessment: Why and how. J. Air Waste Manag. Assoc. 2000, 50, 1167–1183. [Google Scholar] [CrossRef]
- Bonzini, M.; Tripodi, A.; Artoni, A.; Tarantini, L.; Marinelli, B.; Bertazzi, P.A.; Apostoli, P.; Baccarelli, A. Effects of inhalable particulate matter on blood coagulation. J. Thromb. Haemost 2010, 8, 662–668. [Google Scholar] [CrossRef]
- Kioumourtzoglou, M.A.; Schwartz, J.D.; Weisskopf, M.G.; Melly, S.J.; Wang, Y.; Dominici, F.; Zanobetti, A. Long-term PM2.5 Exposure and Neurological Hospital Admissions in the Northeastern United States. Env. Health Perspect 2016, 124, 23–29. [Google Scholar] [CrossRef] [Green Version]
- Gutfinger, C. Aerosol measurement: Principles, techniques, and applications: Edited by K. Willeke and P. A. Baron. Van Nostrand Reinhold, New York (1993). 876 pp., ISBN 0-442-00486-9. US $100. Int. J. Multiph. Flow 1996, 22, 807–808. [Google Scholar]
- Le, T.-C.; Tsai, C.-J. Inertial Impaction Technique for the Classification of Particulate Matters and Nanoparticles: A Review. KONA Powder Part. J. 2021, 38, 42–63. [Google Scholar] [CrossRef]
- Conner, W.D. An inertial-type particle separator for collecting large samples. J. Air Pollut. Control. Assoc. 1966, 16, 35–38. [Google Scholar] [CrossRef] [PubMed]
- Marple, V.A.; Chien, C.M. Virtual impactors: A theoretical study. Environ. Sci. Technol. 1980, 14, 976–985. [Google Scholar]
- Chen, T.; Sun, J.; Ma, T.; Li, T.; Liu, C.; Zhu, X.; Xue, N. Design and Analysis of Particulate Matter Air-Microfluidic Grading Chip Based on MEMS. Micromachines 2019, 10, 497. [Google Scholar] [CrossRef]
- Chang, P.-K.; Hsiao, T.-C.; Engling, G.; Chen, J.-C. Computational fluid dynamics study of the effects of flow and geometry parameters on a linear-slit virtual impactor for sampling and concentrating aerosols. J. Aerosol. Sci. 2019, 131, 28–40. [Google Scholar] [CrossRef]
- Wang, Y.; Wang, Y.; Liu, W.; Chen, D.; Wu, C.; Xie, J. An aerosol sensor for PM1 concentration detection based on 3D printed virtual impactor and SAW sensor. Sens. Actuators A Phys. 2019, 288, 67–74. [Google Scholar] [CrossRef]
- Dong, M.; Iervolino, E.; Santagata, F.; Zhang, G.; Zhang, G. Integrated Virtual Impactor Enabled PM2.5Sensor. IEEE Sens. J. 2017, 17, 2814–2821. [Google Scholar] [CrossRef]
- Heo, J.-E.; Zahir, M.Z.; Park, H.; Seo, J.; Park, H.; Yook, S.-J. Effect of horizontal inlet on slit-nozzle virtual impactor performance. J. Mech. Sci. Technol. 2018, 32, 2419–2424. [Google Scholar] [CrossRef]
- Lee, H.; Jo, D.-H.; Kim, W.-G.; Yook, S.-J.; Ahn, K.-H. Effect of an Orifice on Collection Efficiency and Wall Loss of a Slit Virtual Impactor. Aerosol Sci. Technol. 2013, 48, 121–127. [Google Scholar] [CrossRef]
- Zeeshan Zahir, M.; Lim, J.-H.; Noh, S.-Y.; Yook, S.-J. Development of electric virtual impactor with variable sampling particle size range. Adv. Powder Technol. 2021, 32, 3456–3464. [Google Scholar] [CrossRef]
- Hinds, C.W. Aerosol Technology: Properties, Behavior, and Measurement of Airborne Particles; Wiley: Hoboken, NJ, USA, 1982. [Google Scholar]
- Walton, W.H. The Mechanics of Aerosols. J. Ind. Med. 1966, 23, 161. [Google Scholar]
- Salvi, D.; Boldor, D.; Ortego, J.; Aita, G.M.; Sabliov, C.M.; Energy, E. Numerical Modeling of Continuous Flow Microwave Heating: A Critical Comparison of COMSOL and ANSYS. J. Microw. Power Electromagn. Energy 2010, 44, 187–197. [Google Scholar]
- Erturk, E. Numerical solutions of 2-D steady incompressible flow over a backward-facing step, Part I: High Reynolds number solutions. Comput. Fluids 2008, 37, 633–655. [Google Scholar] [CrossRef]
- Kim, Y.-H.; Maeng, J.-Y.; Park, D.; Jung, I.-H.; Hwang, J.; Kim, Y.-J. Micromachined cascade virtual impactor with a flow rate distributor for wide range airborne particle classification. Appl. Phys. Lett. 2007, 91, 043512. [Google Scholar] [CrossRef]
- Kiselev, S.P.; Vorozhtsov, E.V.; Fomin, V.M. Viscous Fluid; AIP Publishing: College Park, MD, USA, 2017. [Google Scholar]
- Zahir, M.Z.; Heo, J.-E.; Yook, S.-J. Influence of clean air and inlet configuration on the performance of slit nozzle virtual impactor. Adv. Powder Technol. 2019, 30, 3224–3230. [Google Scholar] [CrossRef]


| Boundary | SPF | FPT |
|---|---|---|
| Inlet | Flow | Uniform distribution |
| Outlet | Pressure | Frozen |
| Wall surface | No slip | Frozen |
| Compressibility | Incompressible flow | - |
| Particle initial velocity | - | SPF |
| Drag force | - | Stokes’ Law |
| Variable | Value | Unit |
|---|---|---|
| W | 1 | mm |
| H | 1 | mm |
| L | 1 | mm |
| S | 1.4 | mm |
| r | 10% | - |
| T | 193.15 | K |
| Q | 0.86 | L/min |
| λ | 0.066 | m |
| 1000 |
| Property | Our Method | Handol Lee et al. [20] | Zeeshan Zahir et al. [28] |
|---|---|---|---|
| Cut−off diameter | |||
| Method of reducing cut−off diameter | Ultra−low temperature | Orifice | Sheath gas |
| Reduction effect | 19% | 16.7% | 16% |
| Curve steepness | Satisfactory | Satisfactory | Satisfactory |
Publisher’s Note: MDPI stays neutral with regard to jurisdictional claims in published maps and institutional affiliations. |
© 2022 by the authors. Licensee MDPI, Basel, Switzerland. This article is an open access article distributed under the terms and conditions of the Creative Commons Attribution (CC BY) license (https://creativecommons.org/licenses/by/4.0/).
Share and Cite
Wang, R.; Zhao, H.; Li, J.; Wang, X. Computational Fluid Dynamics Study of the Effects of Temperature and Geometry Parameters on a Virtual Impactor. Micromachines 2022, 13, 1477. https://doi.org/10.3390/mi13091477
Wang R, Zhao H, Li J, Wang X. Computational Fluid Dynamics Study of the Effects of Temperature and Geometry Parameters on a Virtual Impactor. Micromachines. 2022; 13(9):1477. https://doi.org/10.3390/mi13091477
Chicago/Turabian StyleWang, Ruofei, Heng Zhao, Jiaqi Li, and Xingbo Wang. 2022. "Computational Fluid Dynamics Study of the Effects of Temperature and Geometry Parameters on a Virtual Impactor" Micromachines 13, no. 9: 1477. https://doi.org/10.3390/mi13091477