
An Investigation into the Densification-Affected Deformation and Fracture in Fused Silica under Contact Sliding

 ,
, 
Abstract
:1. Introduction
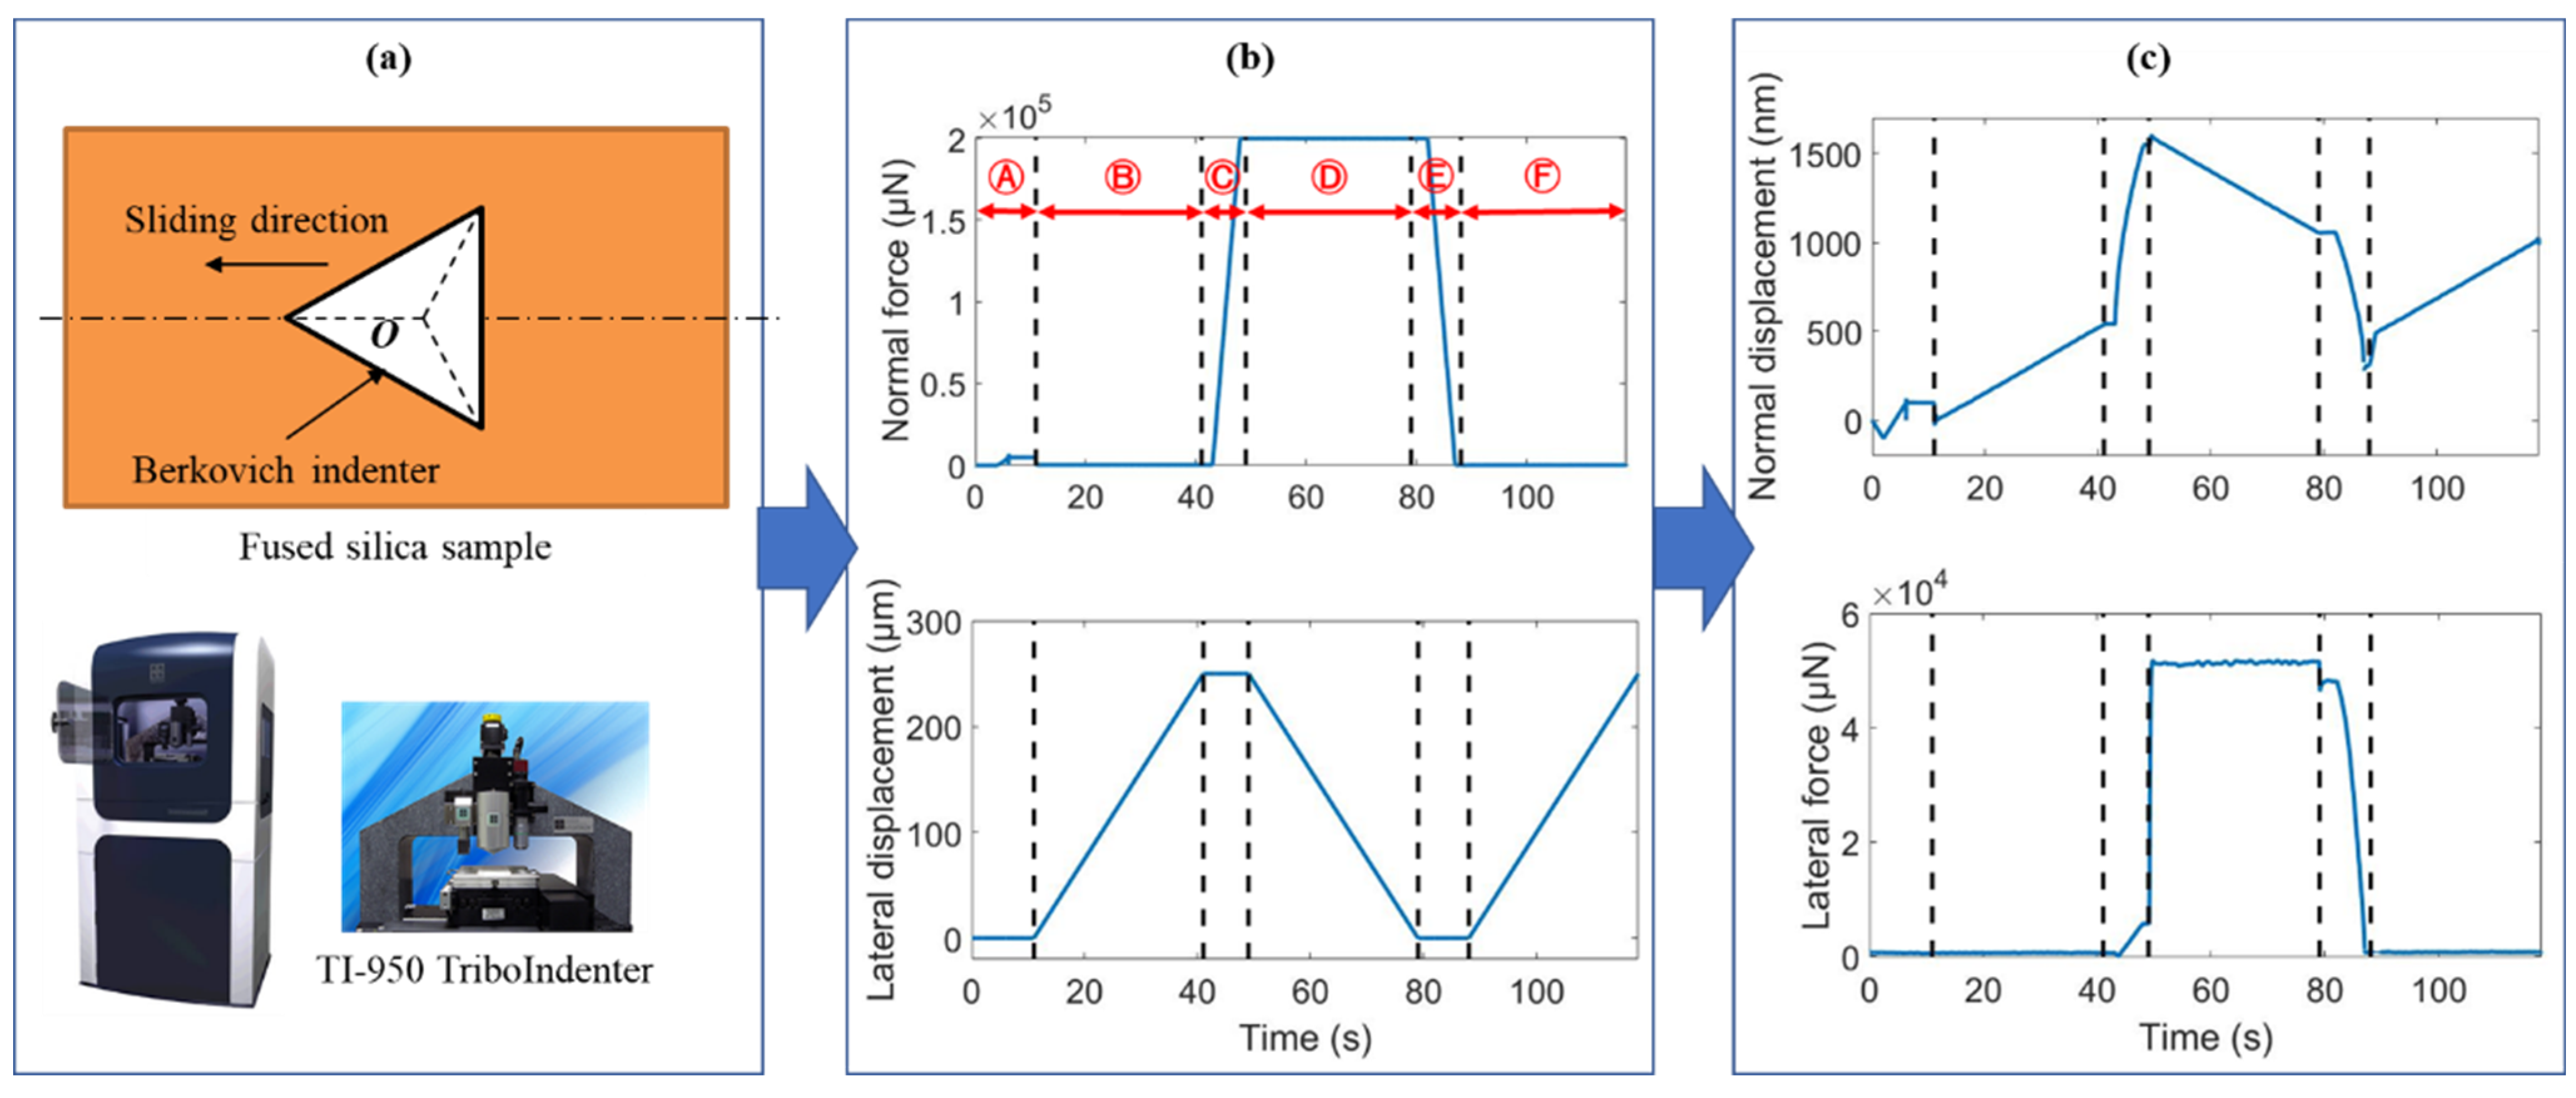
2. Scratching Tests
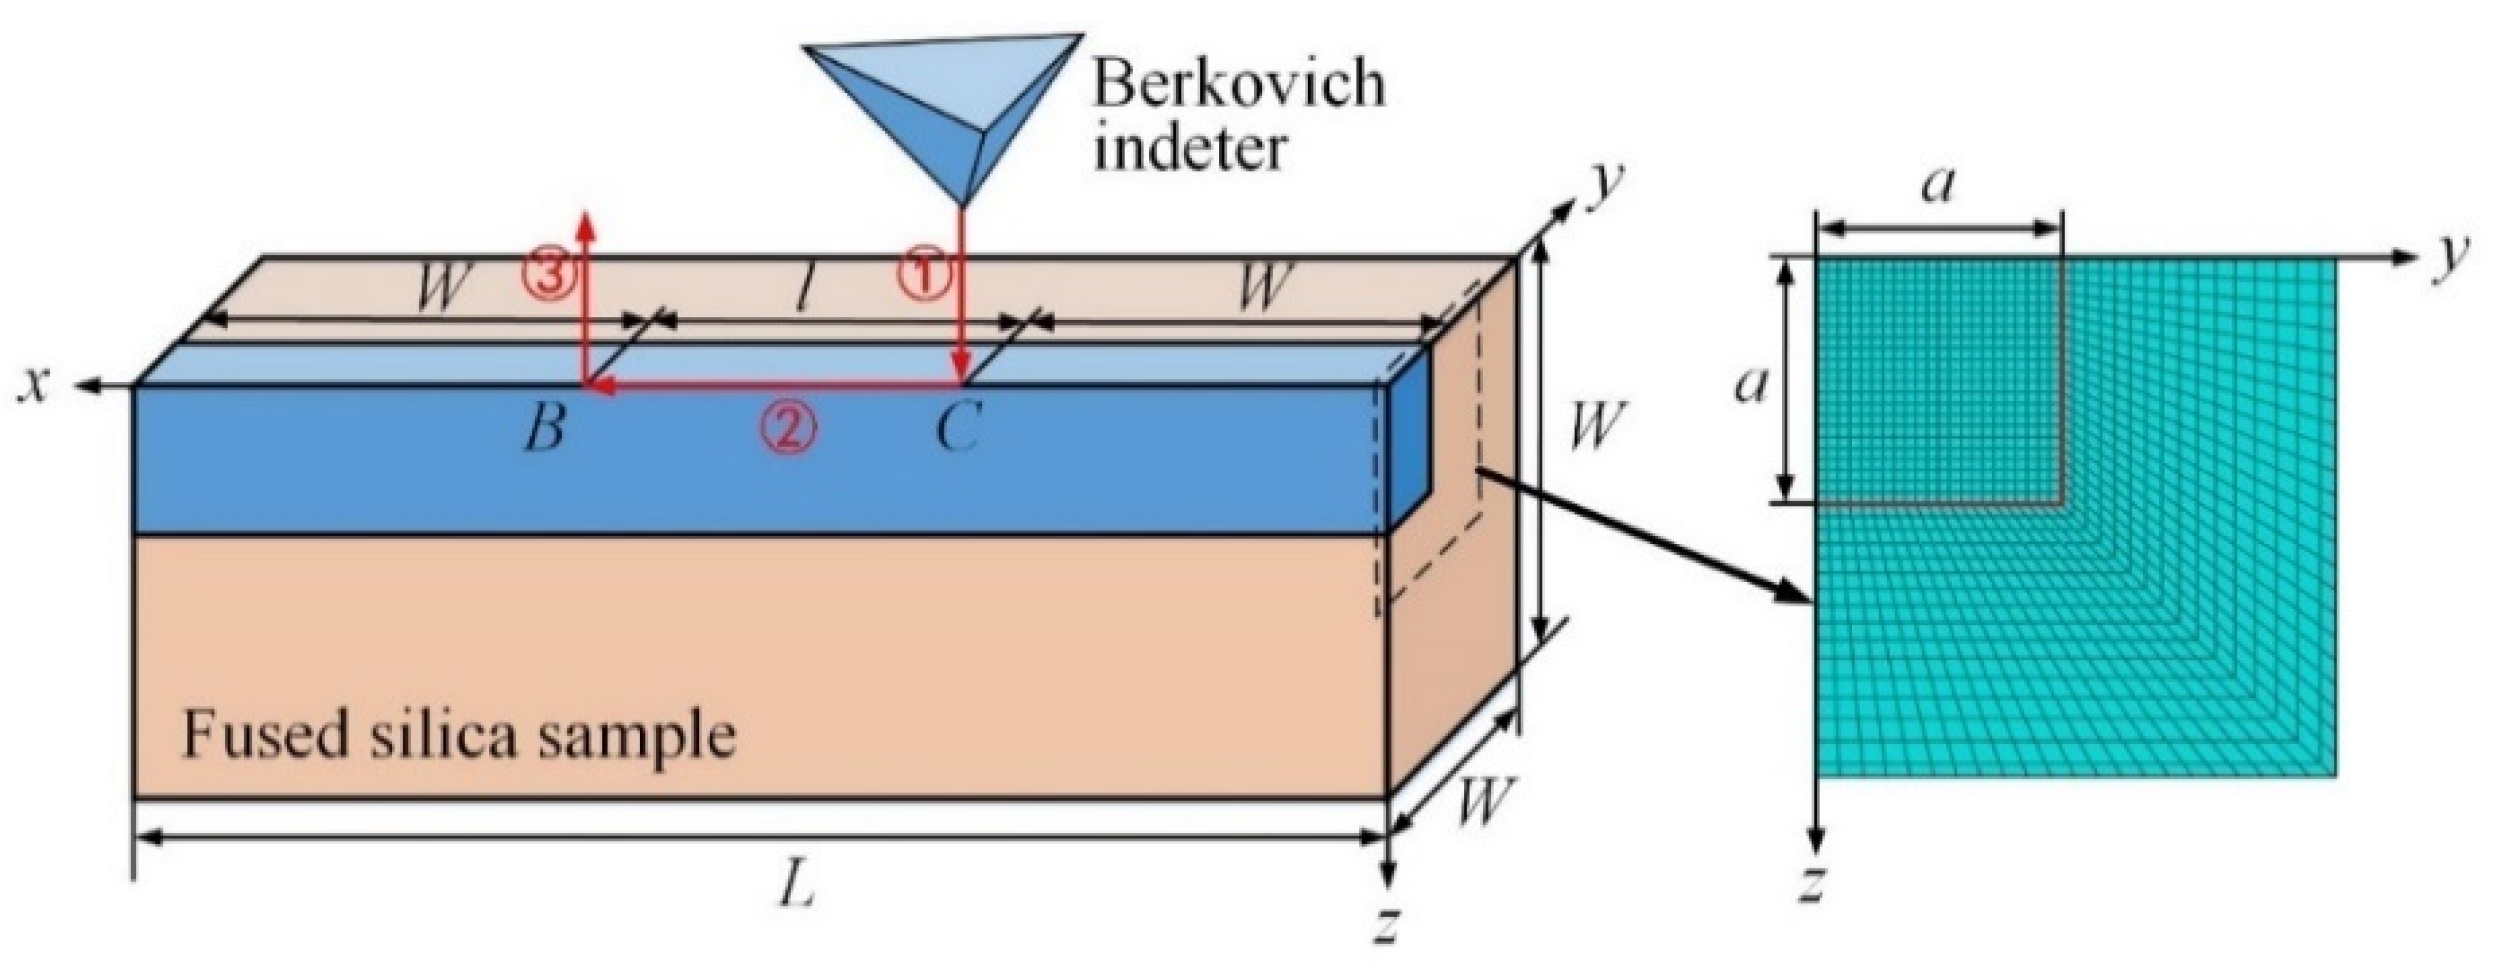
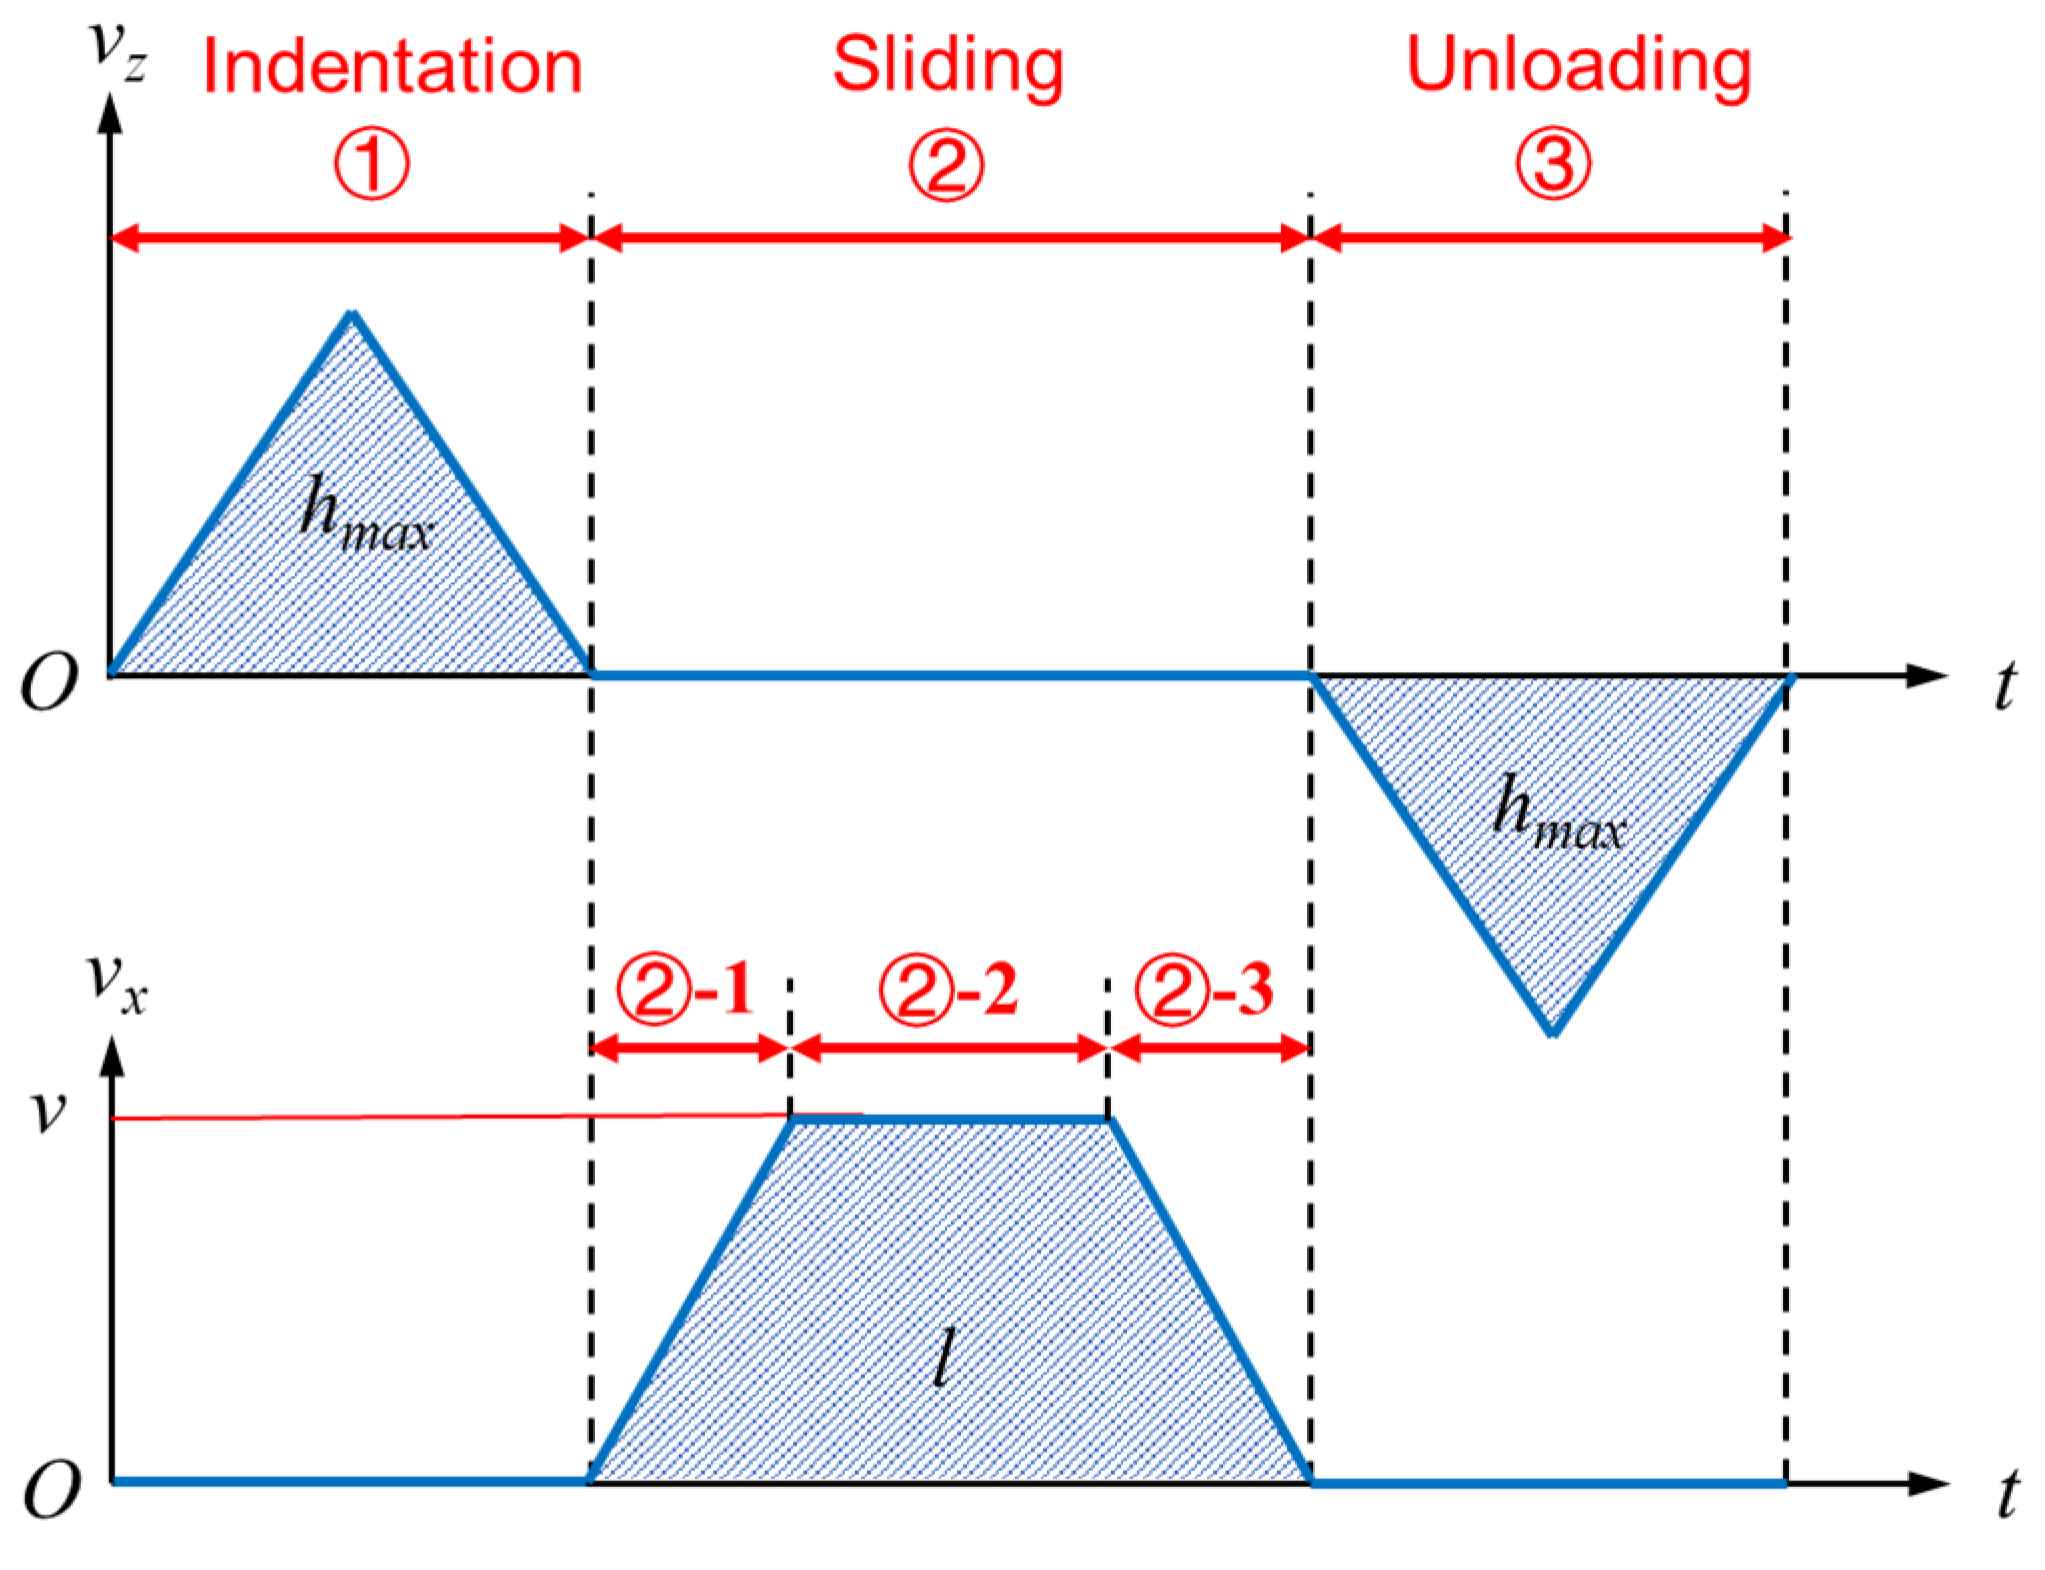
3. Finite Element Modeling
4. Verification of Finite Element Models
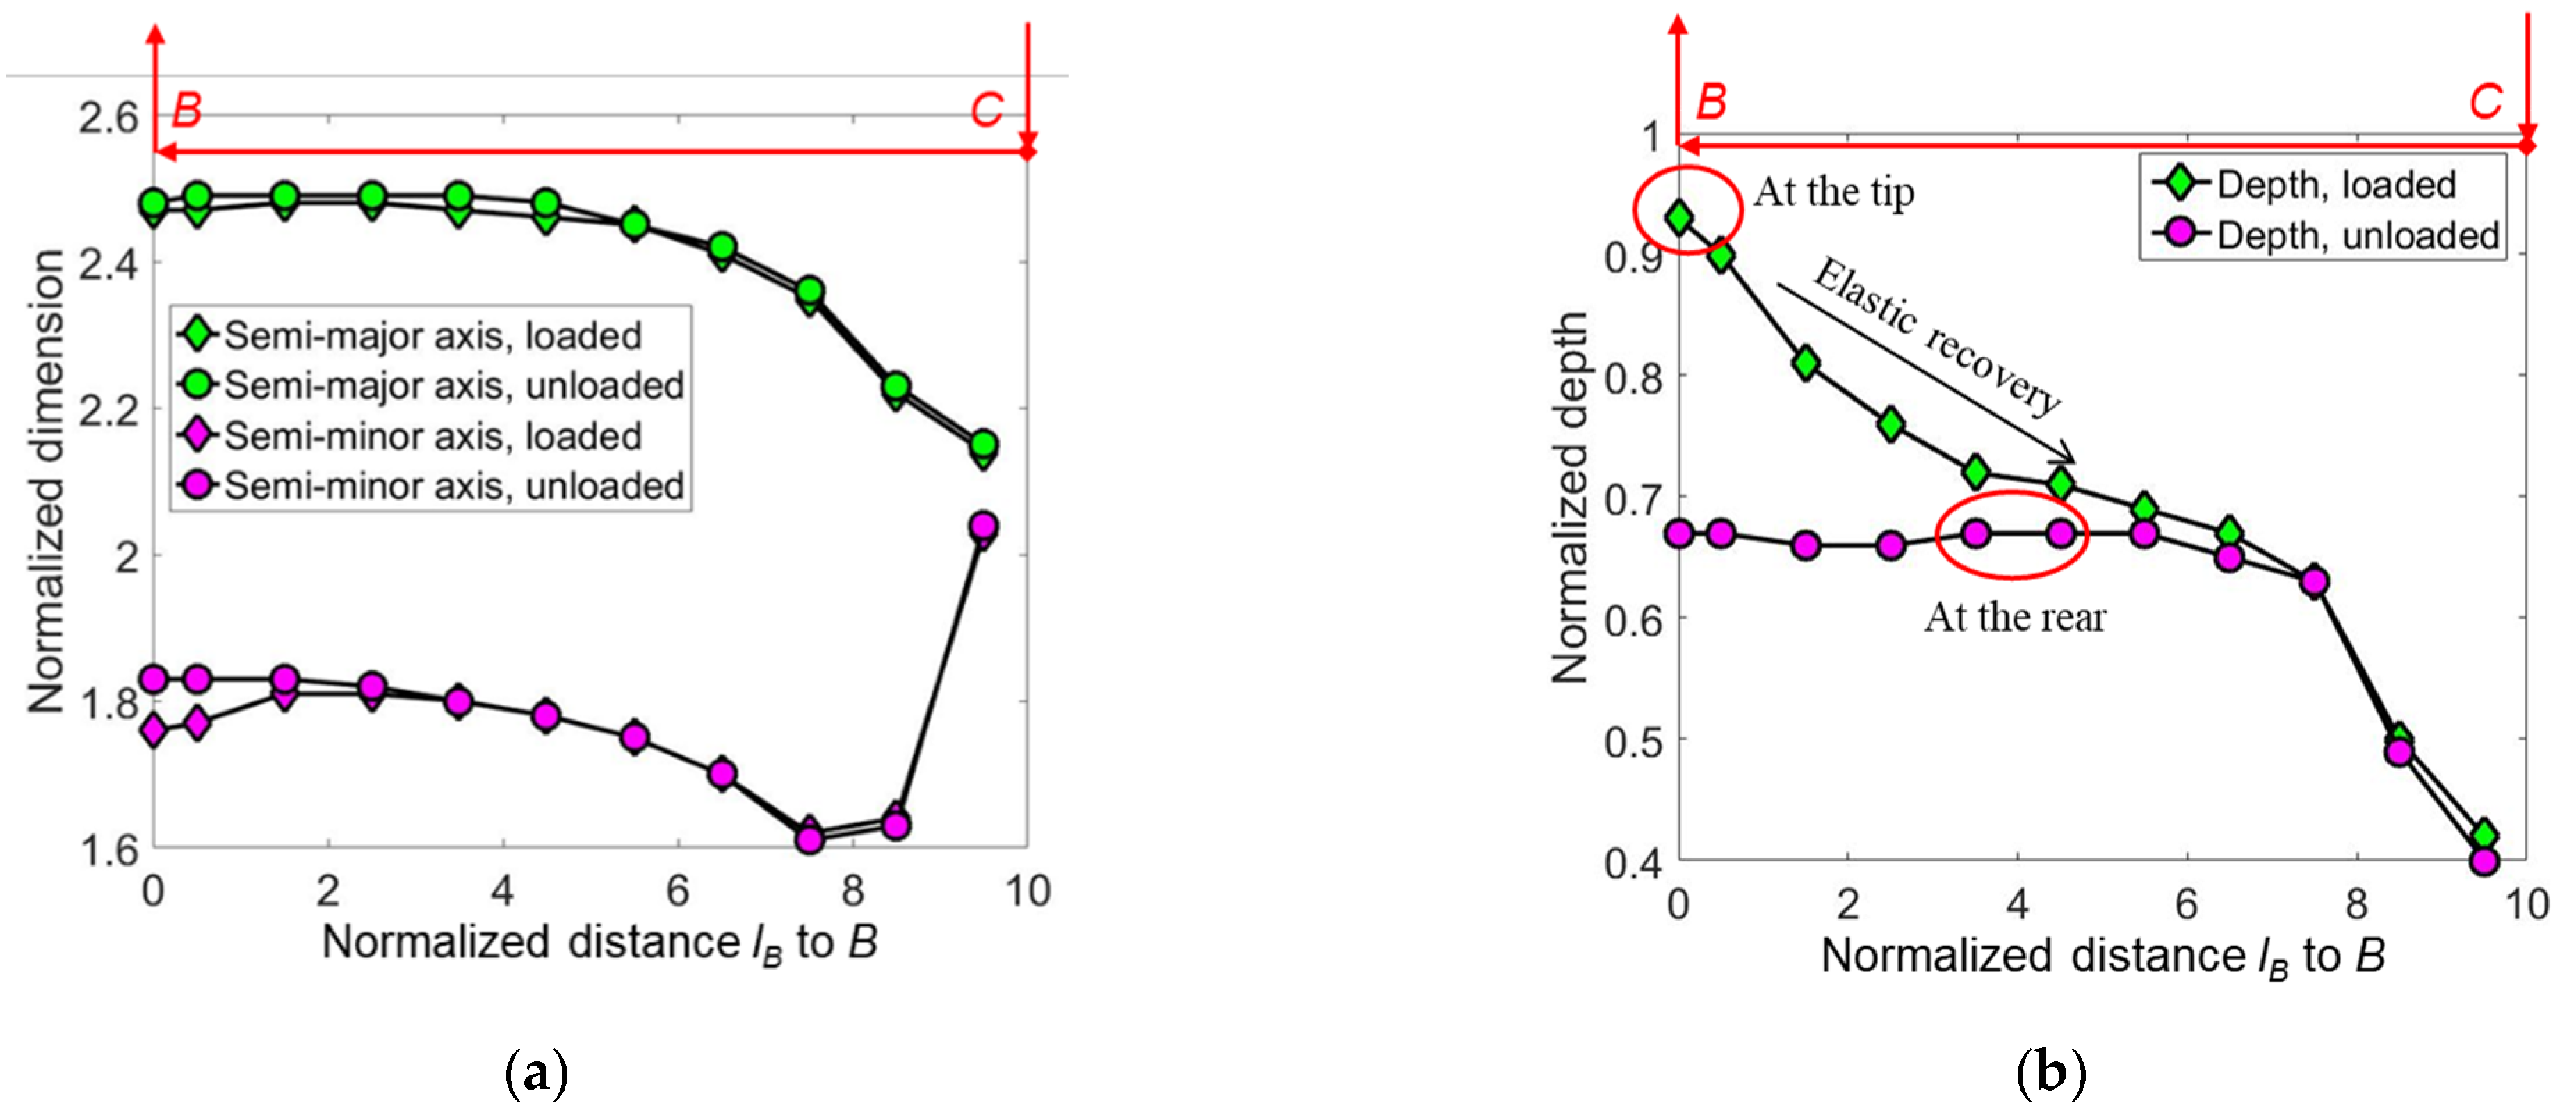
4.1. Experimental Verification of Elastic Recovery
4.2. Theoretical Verification of Hardness Ratio
5. Deformation and Fracture in Fused Silica under Scratching
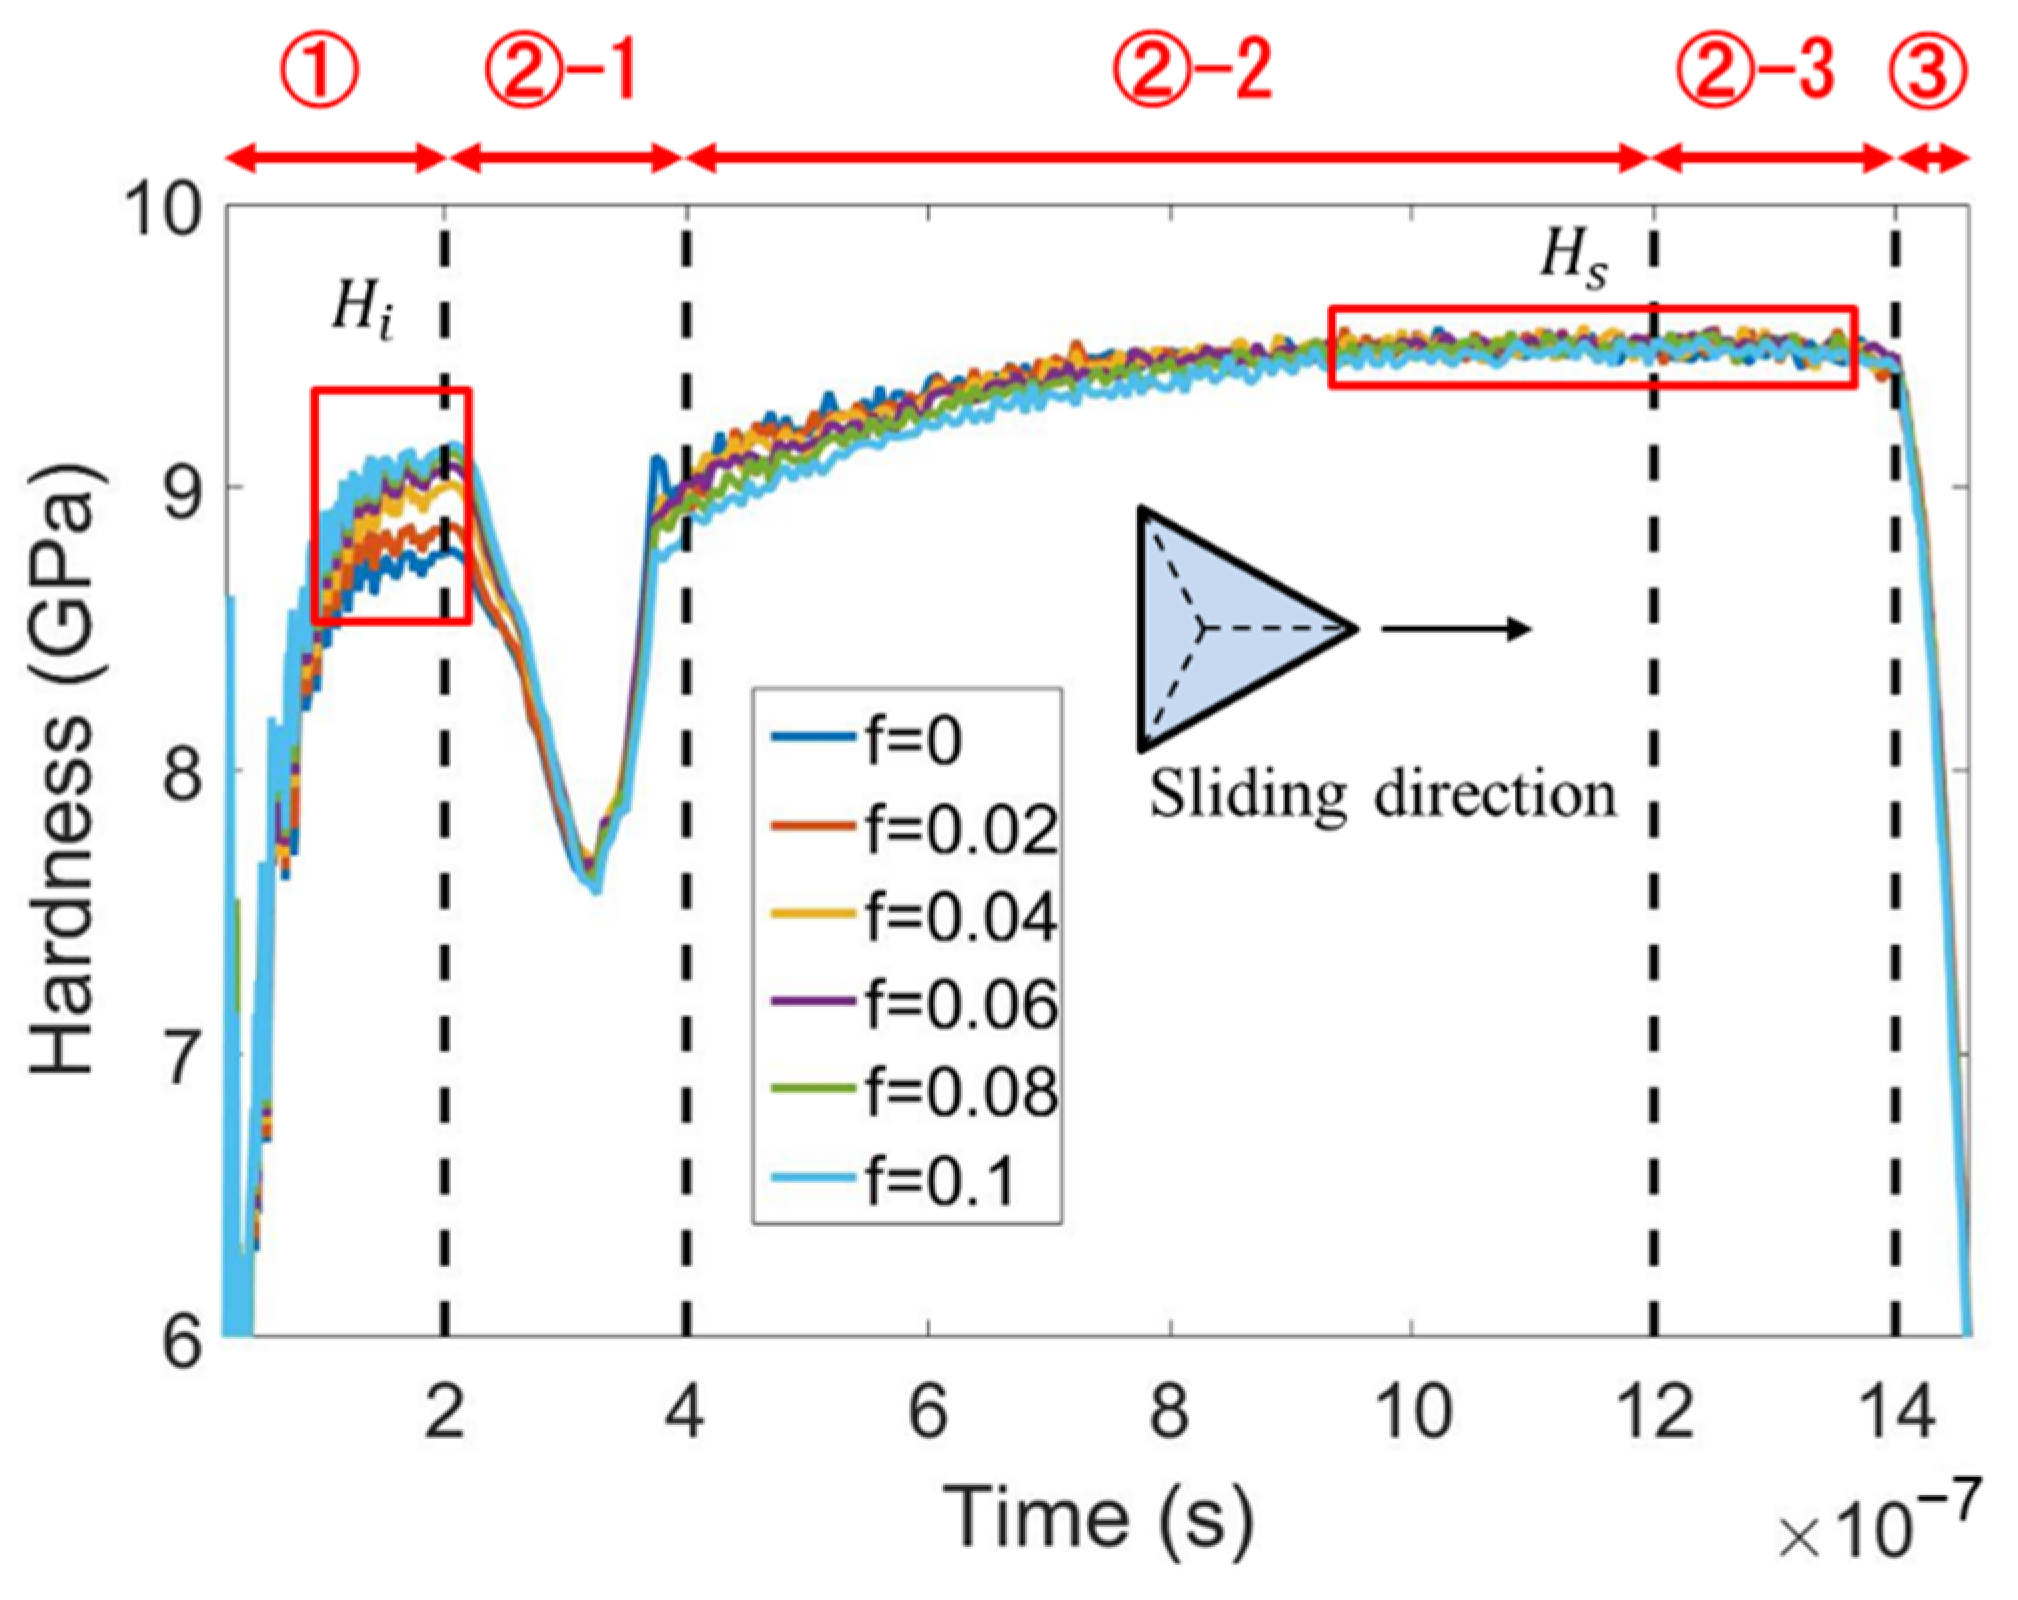
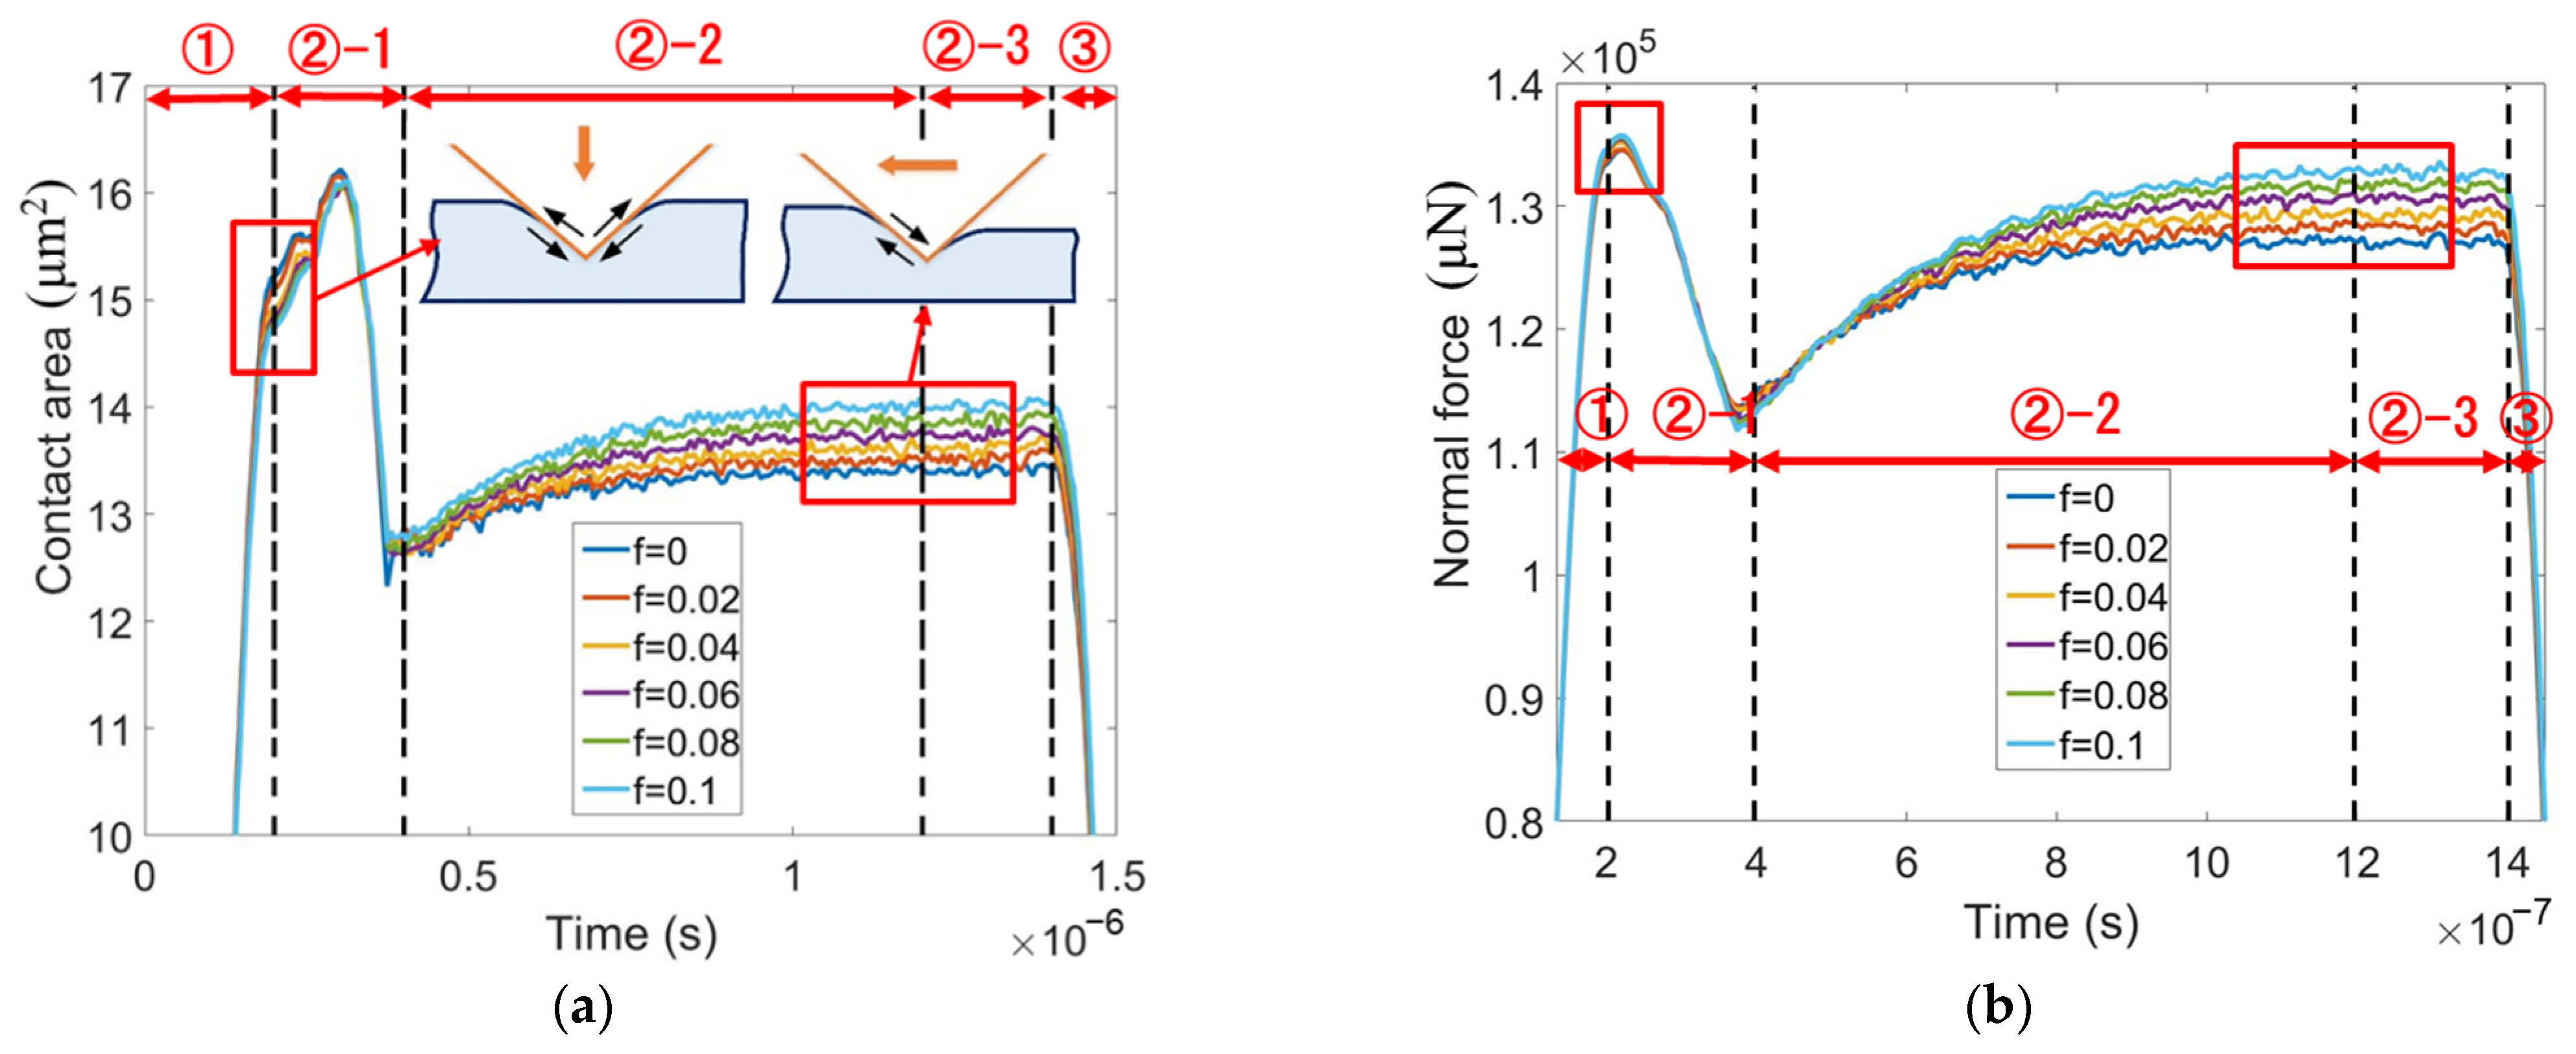
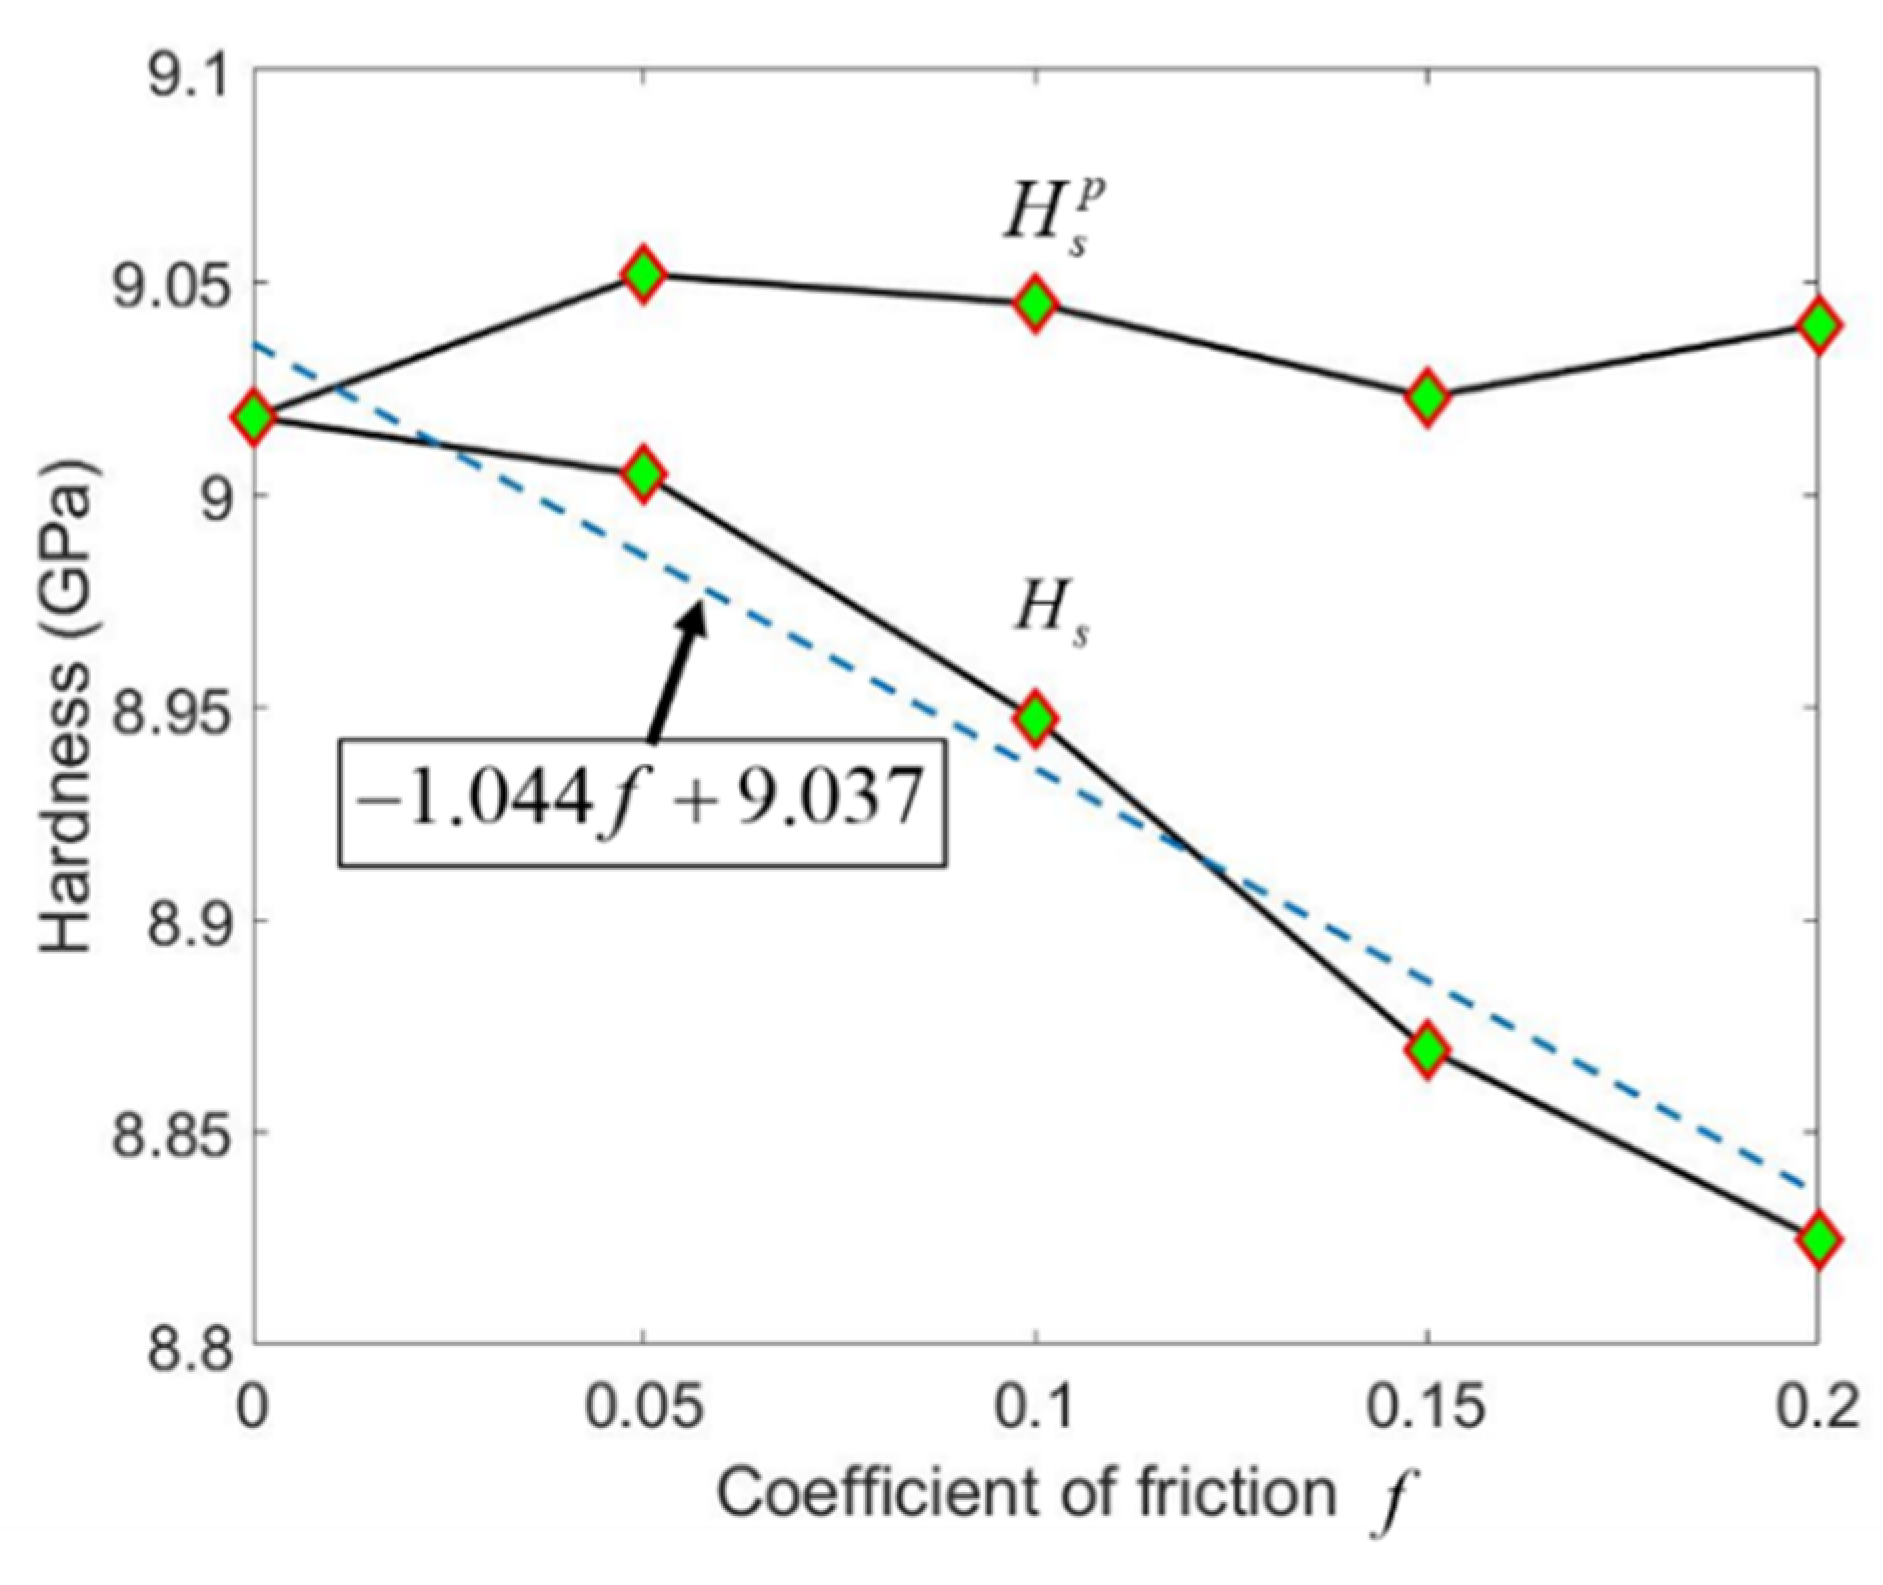
5.1. Scratching Hardness
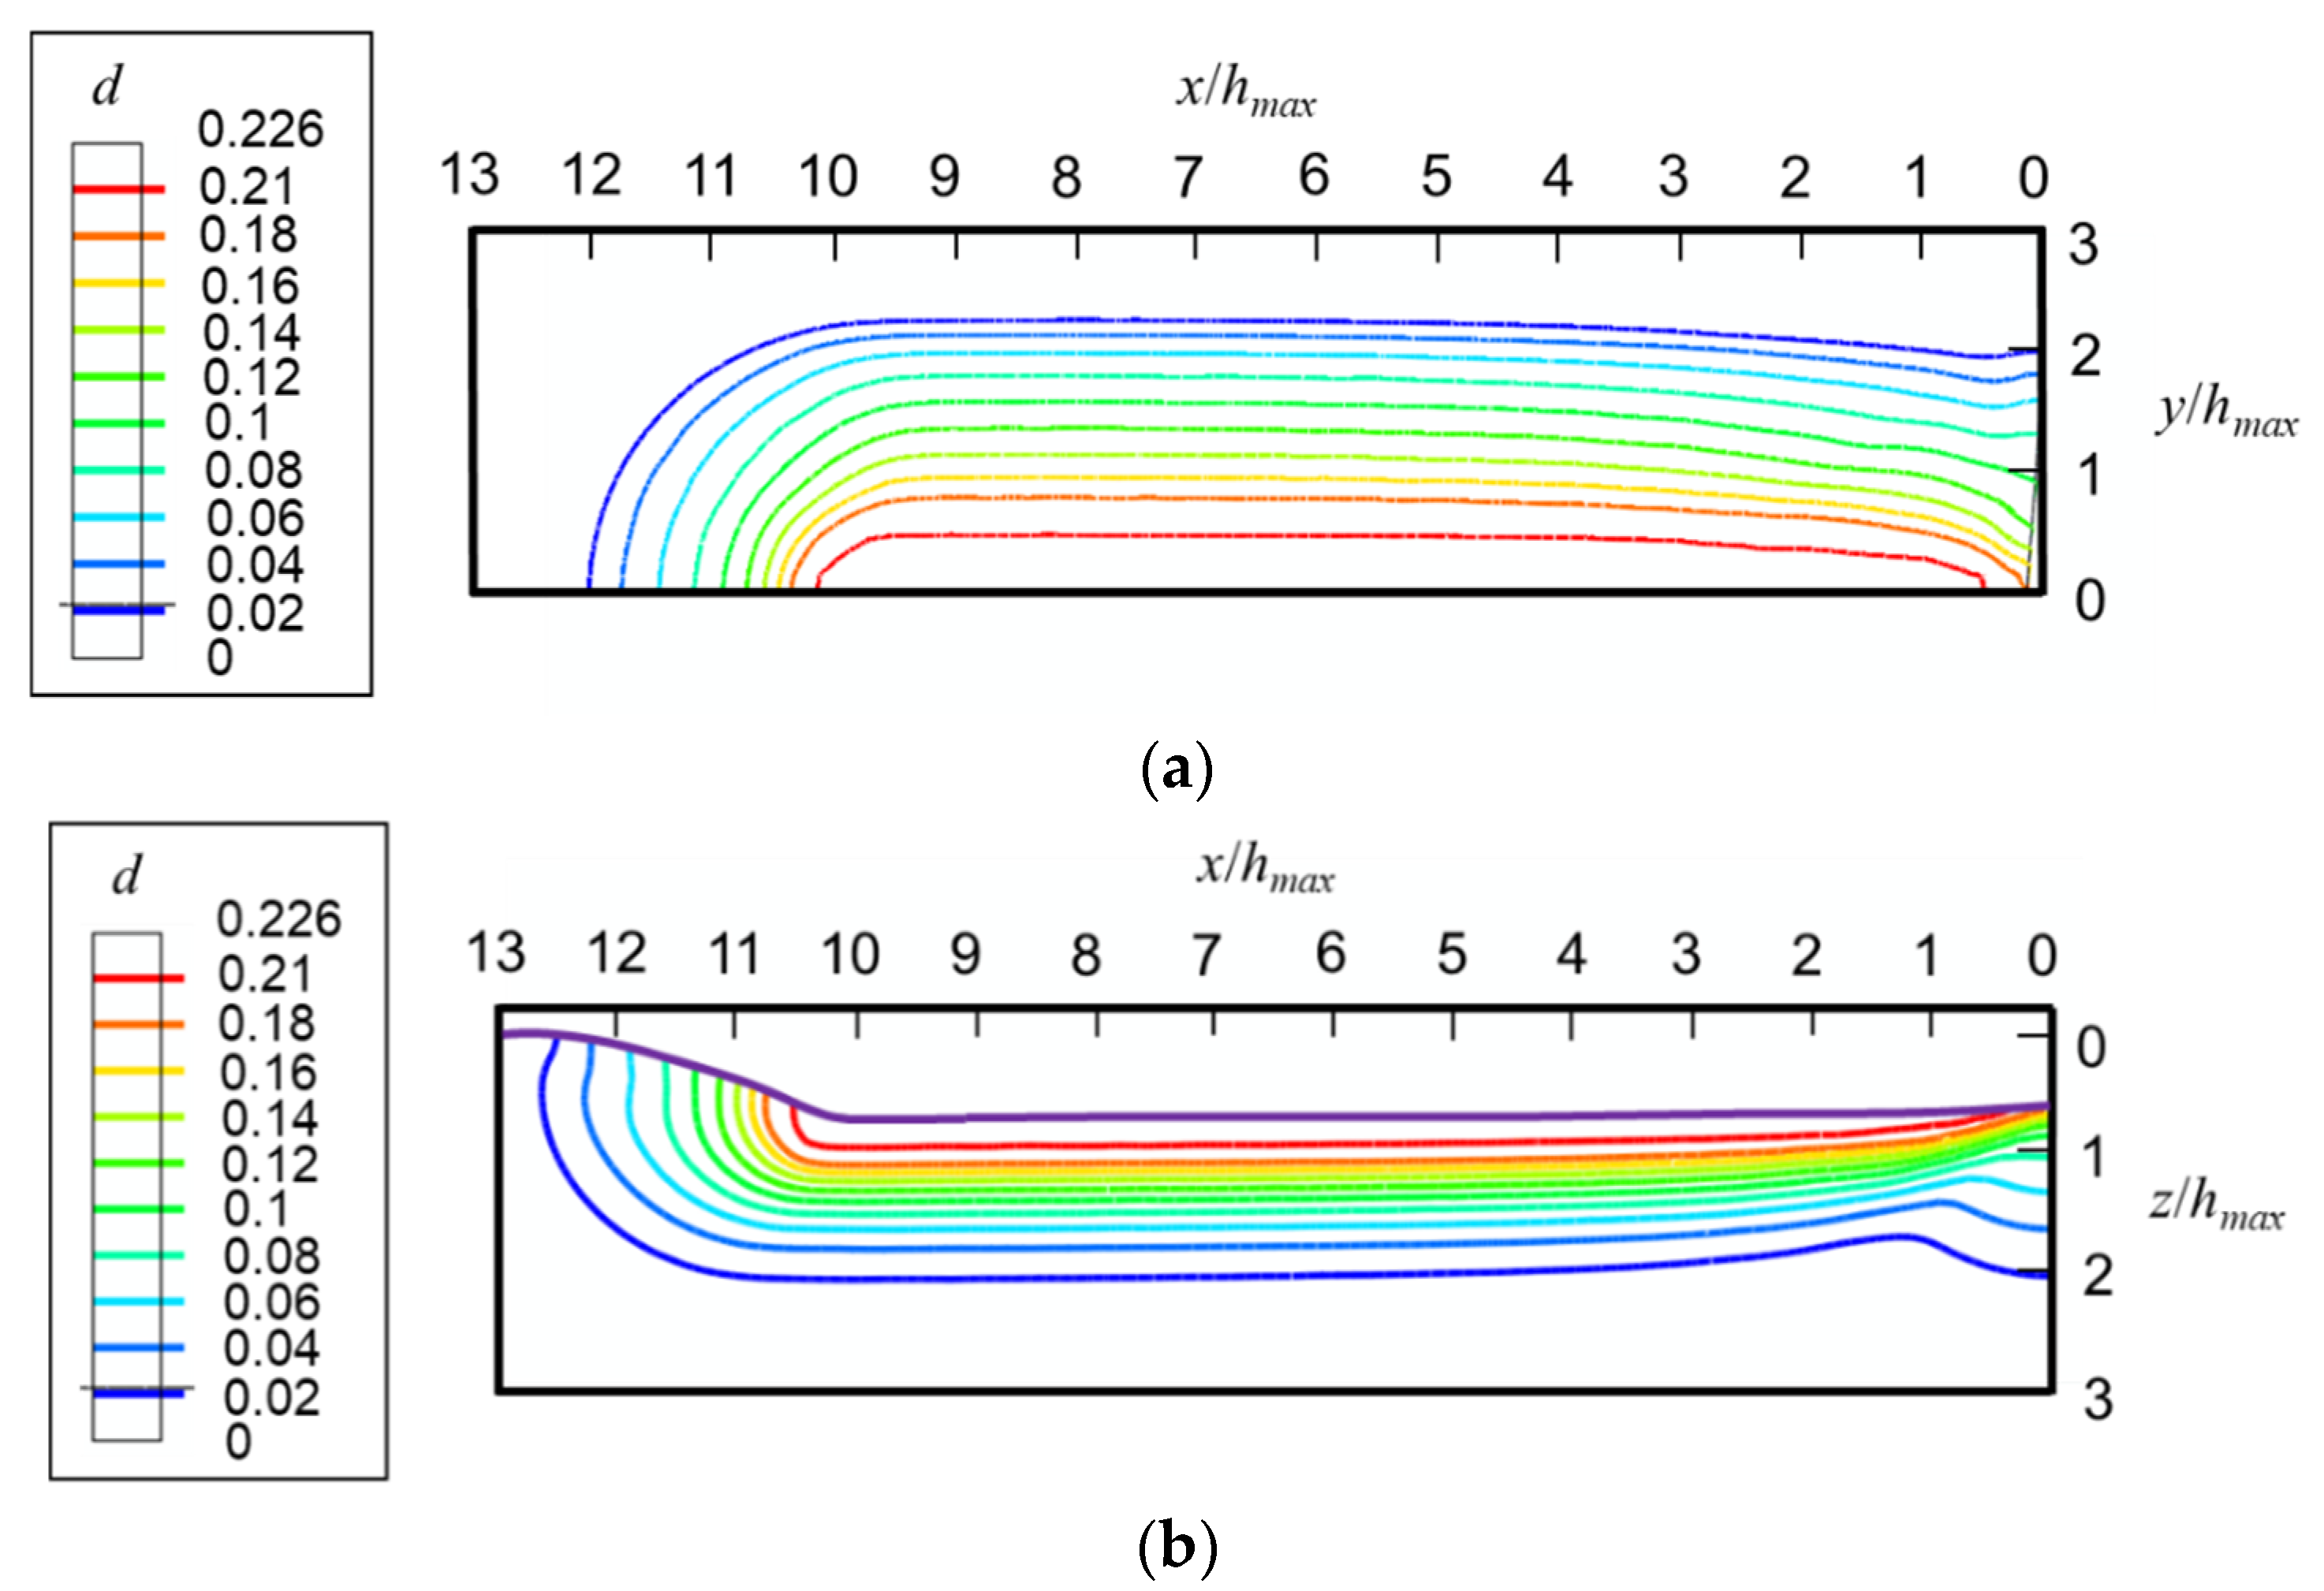
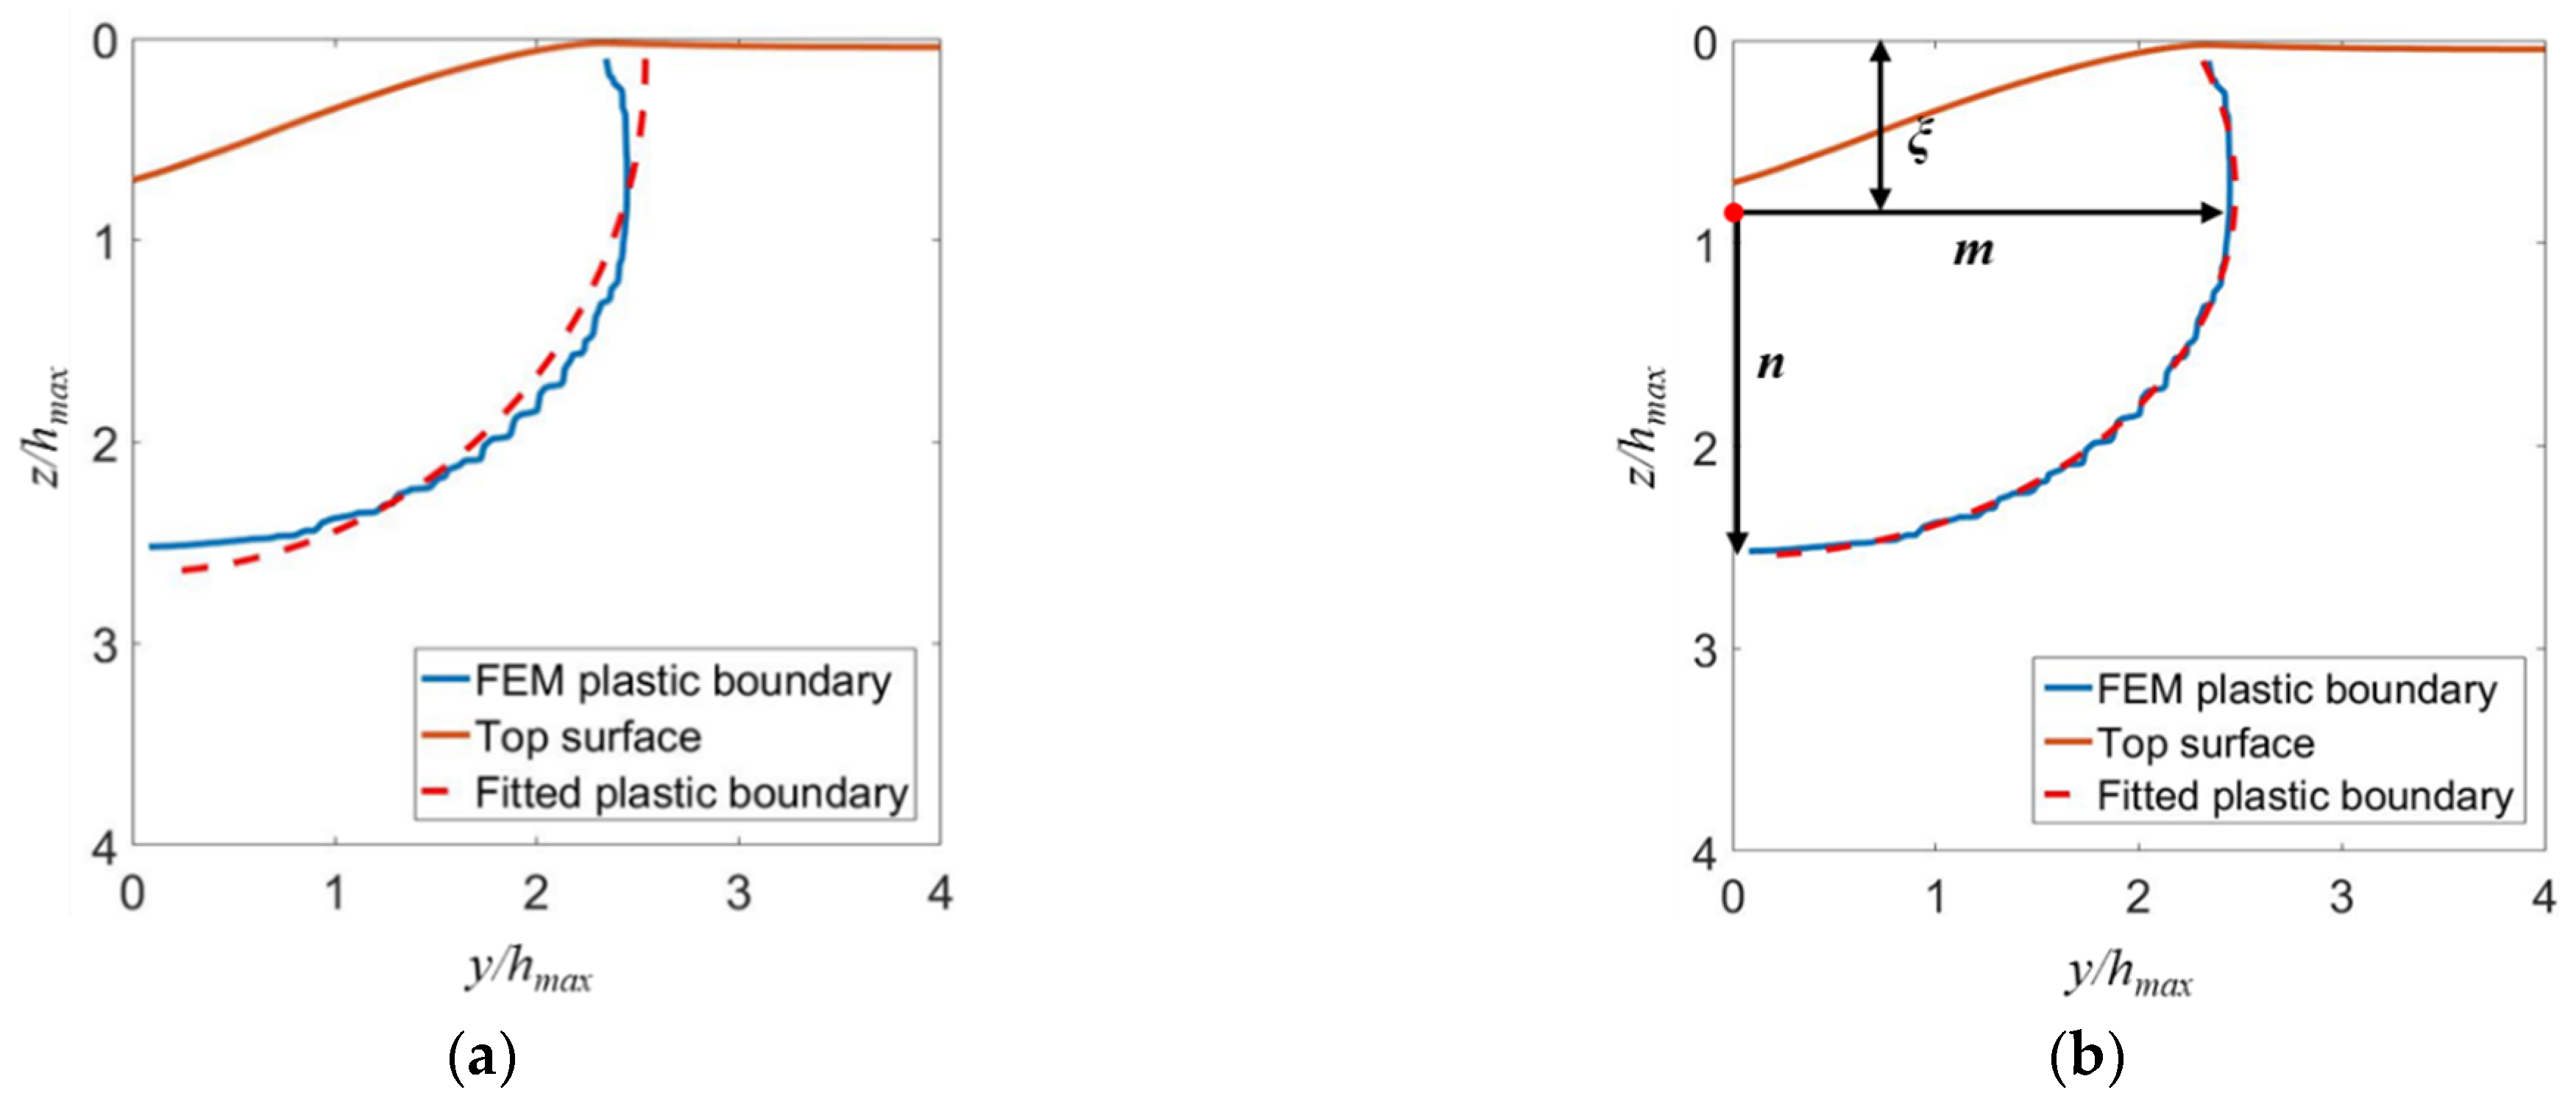
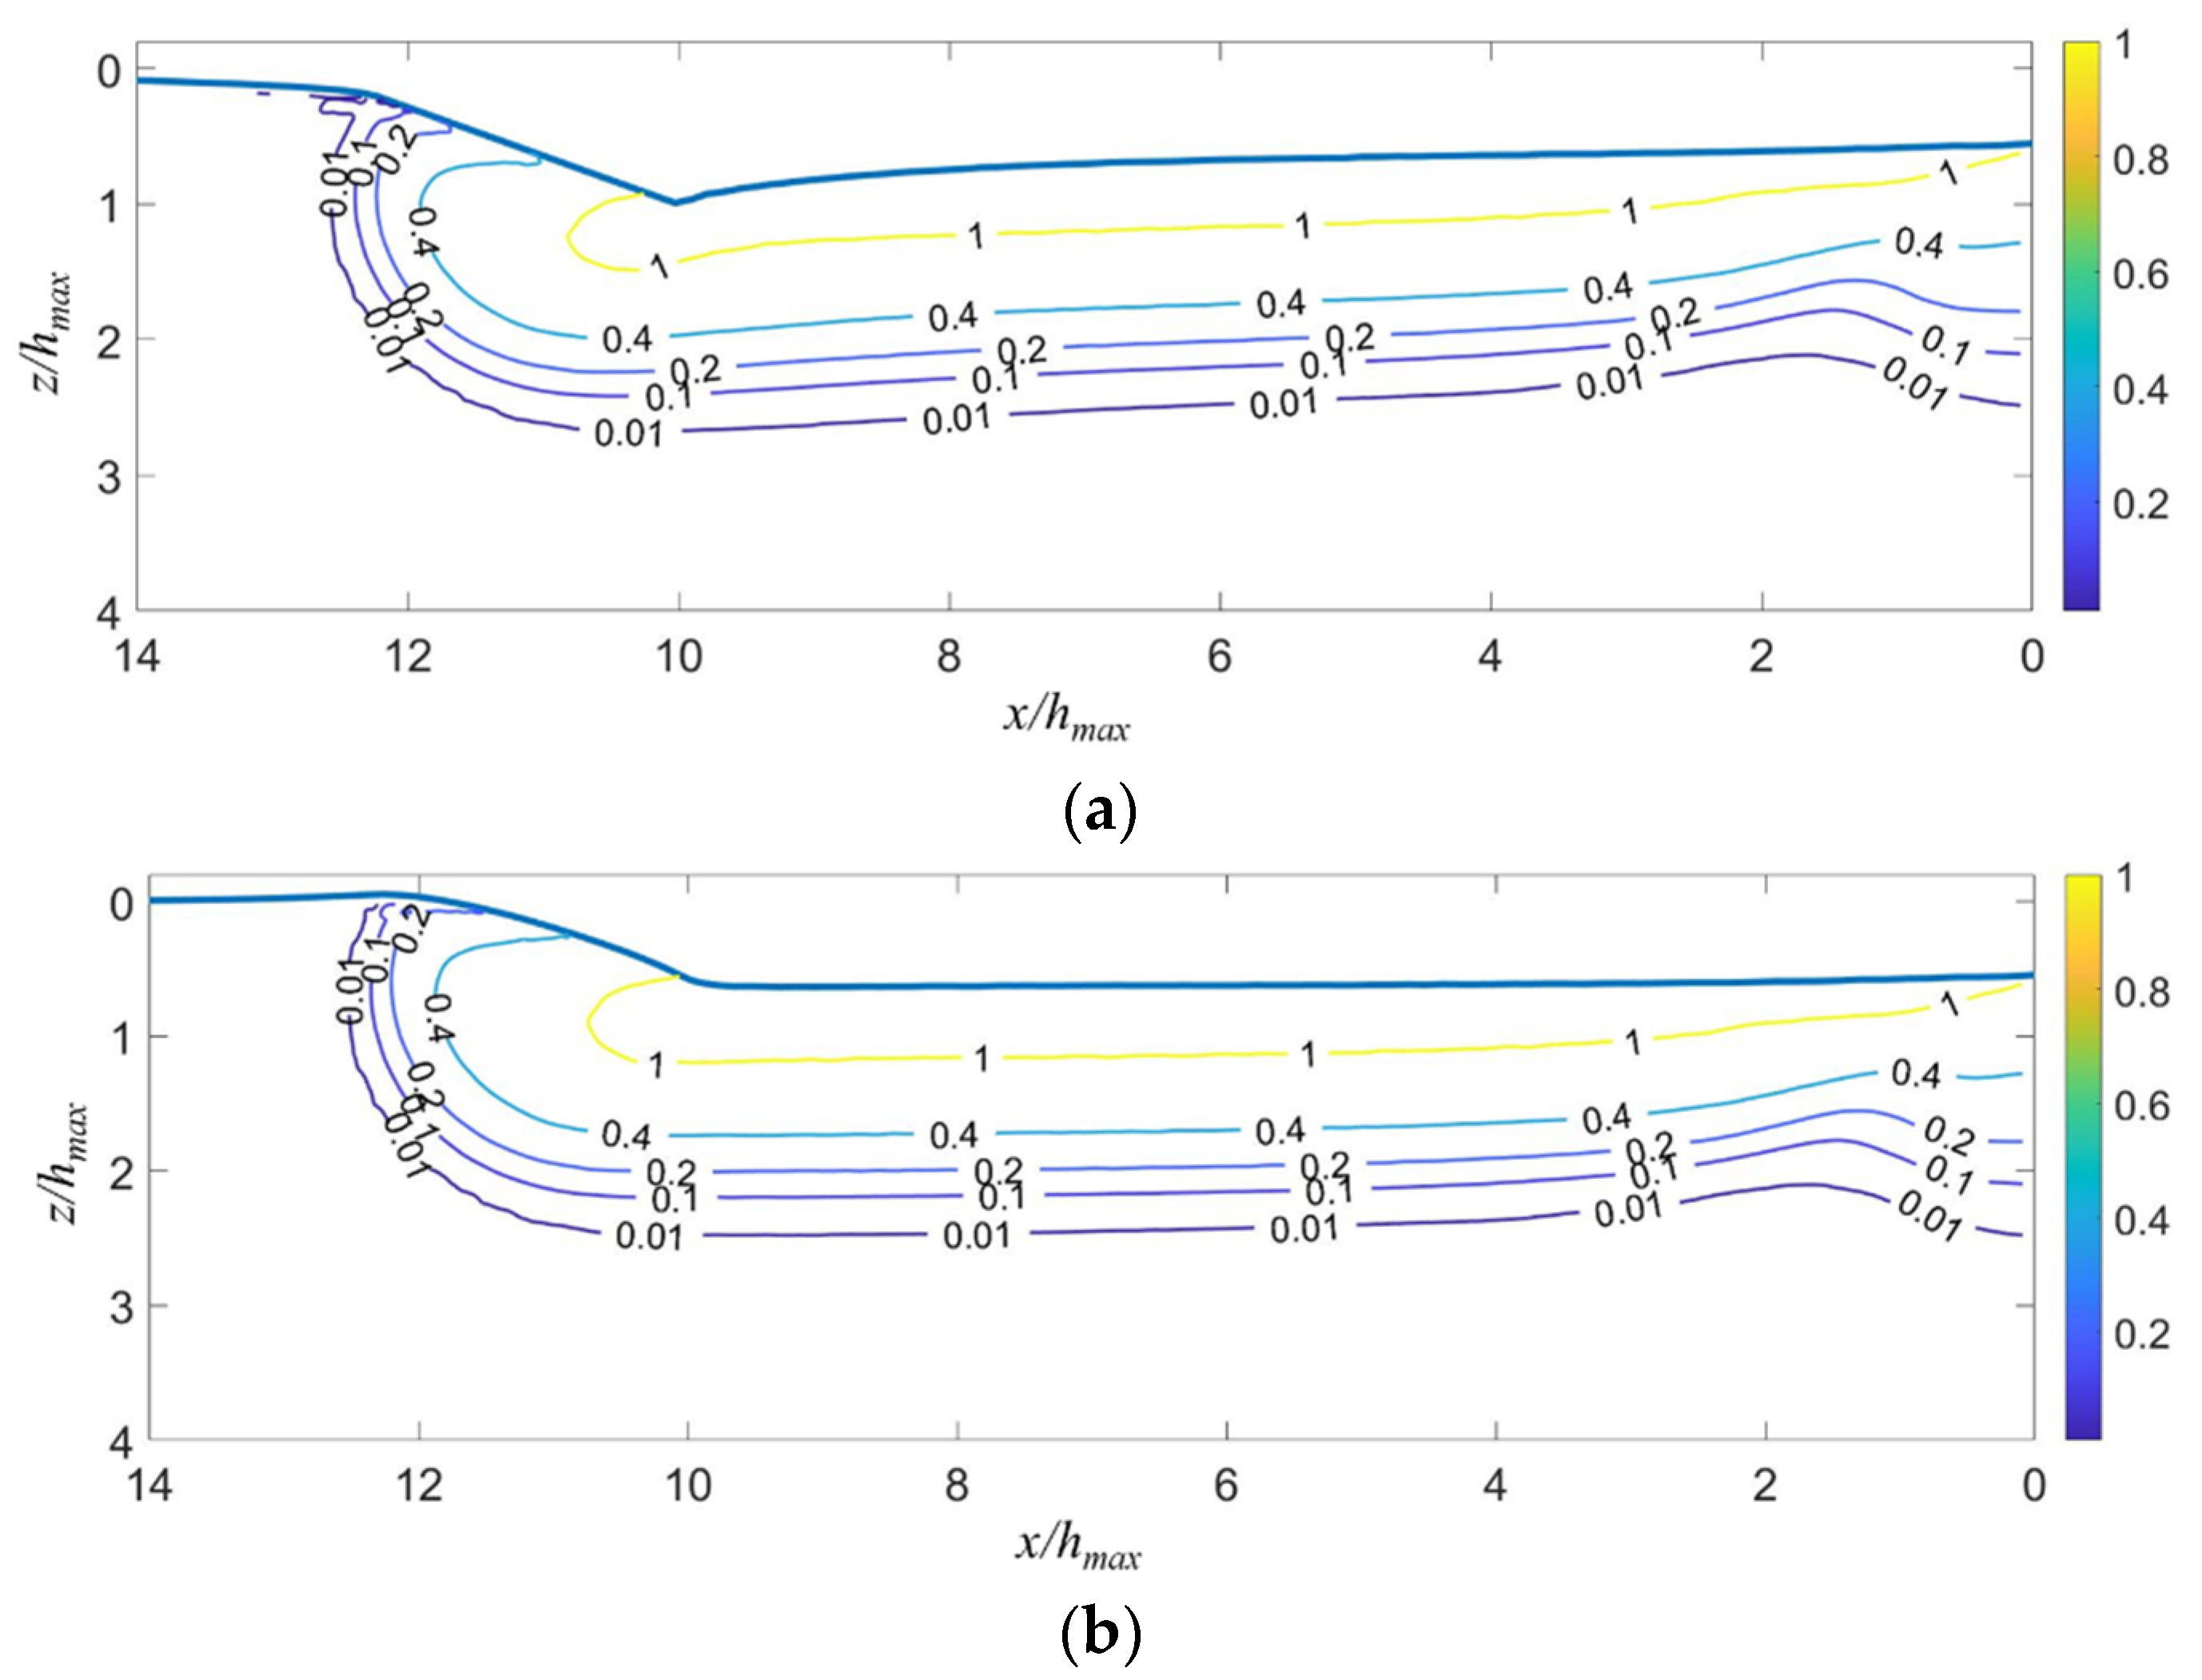
5.2. Plastic Deformation
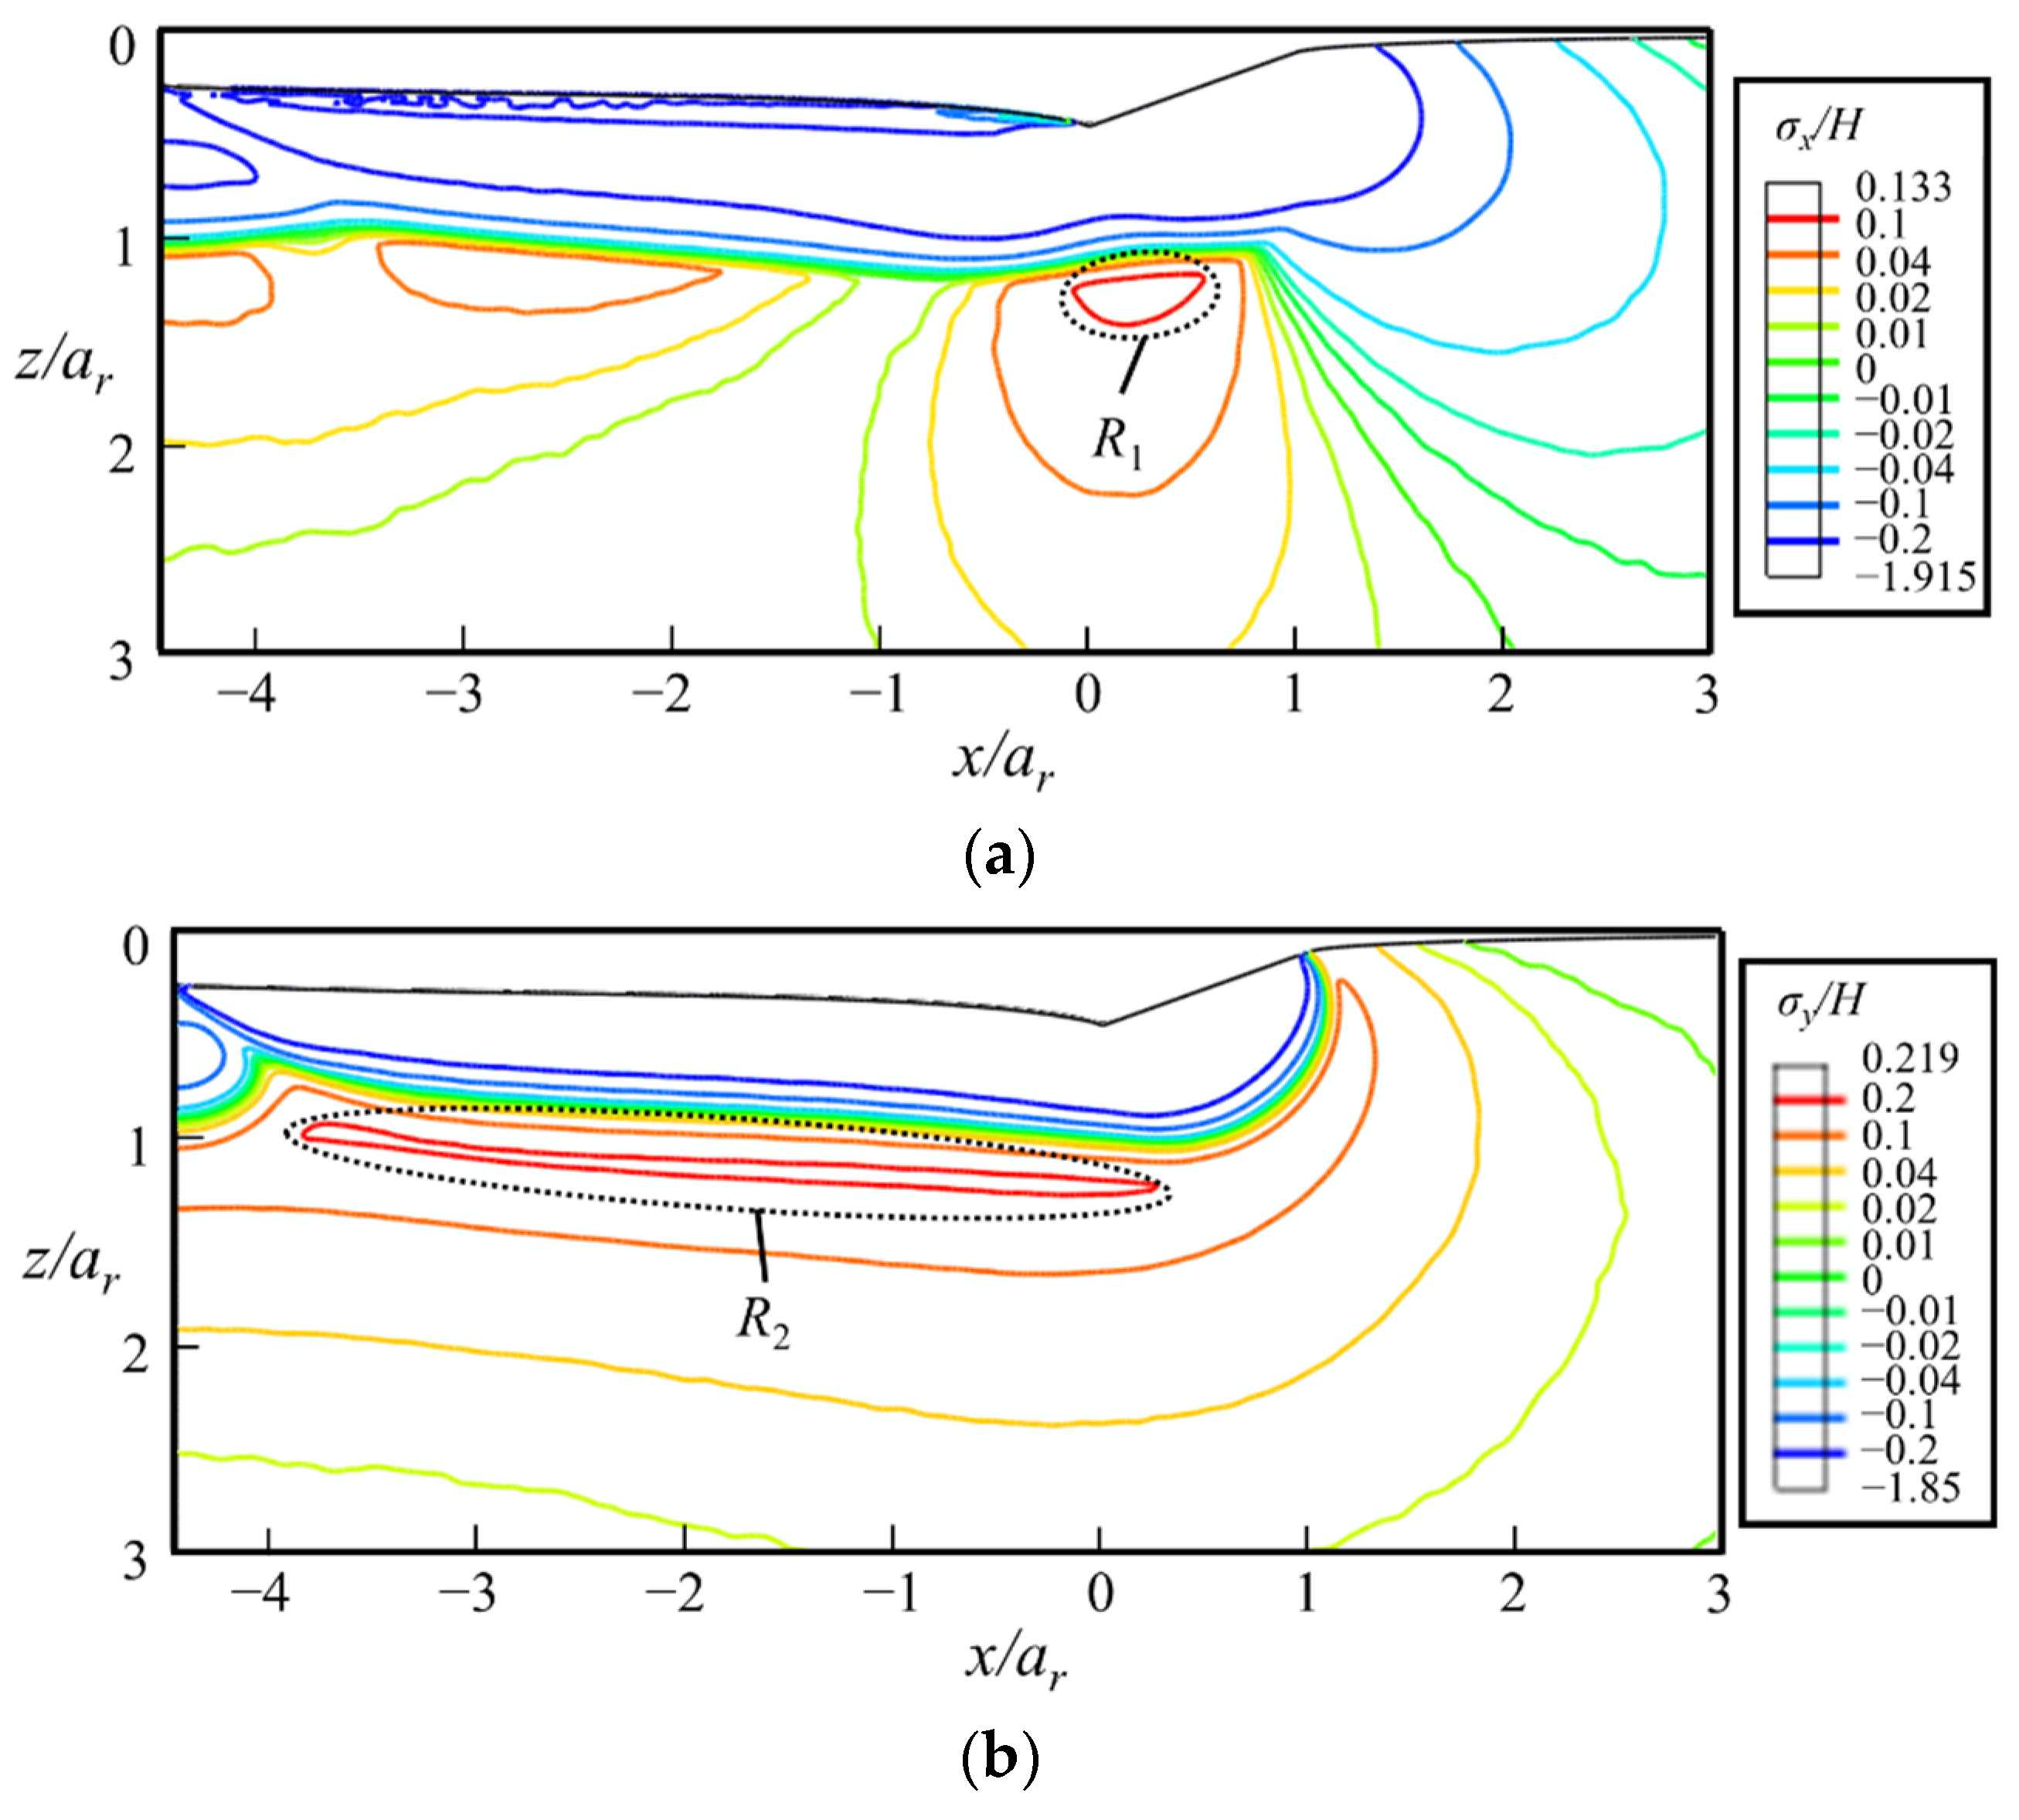
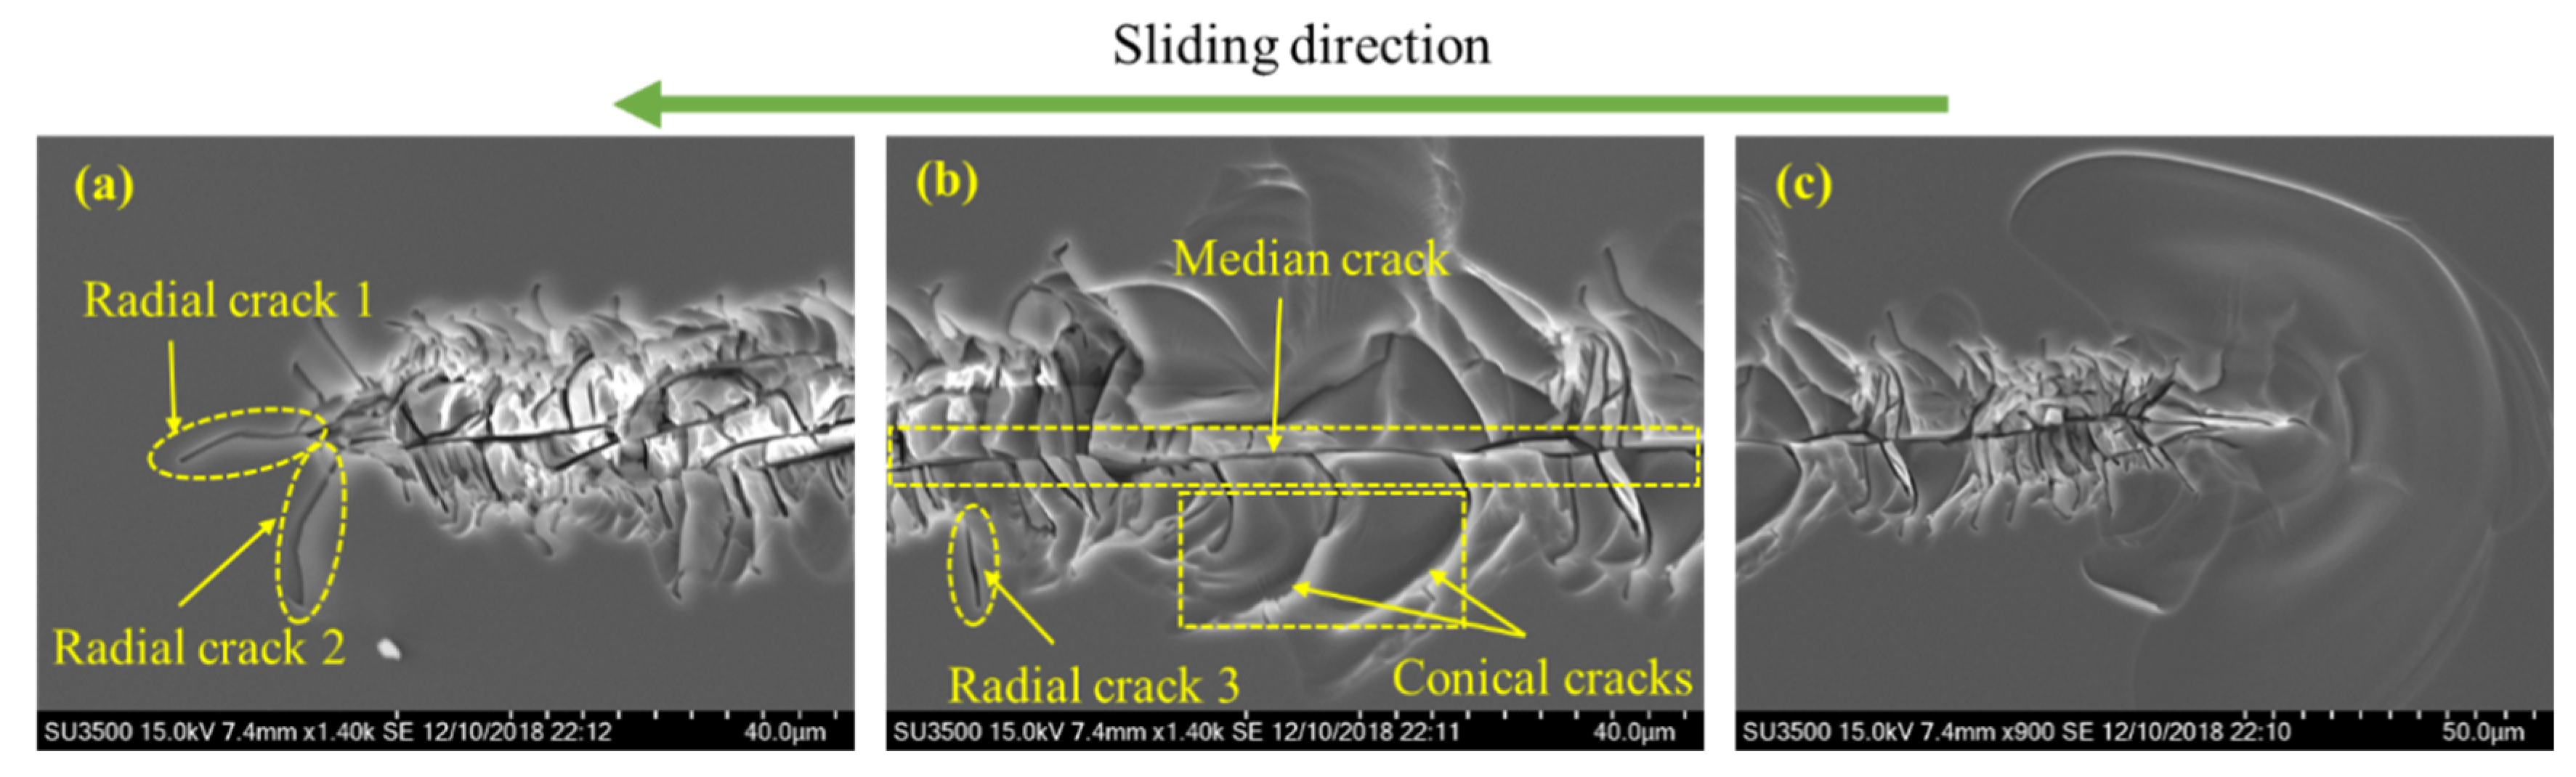
5.3. Stress Fields and Cracking Behavior
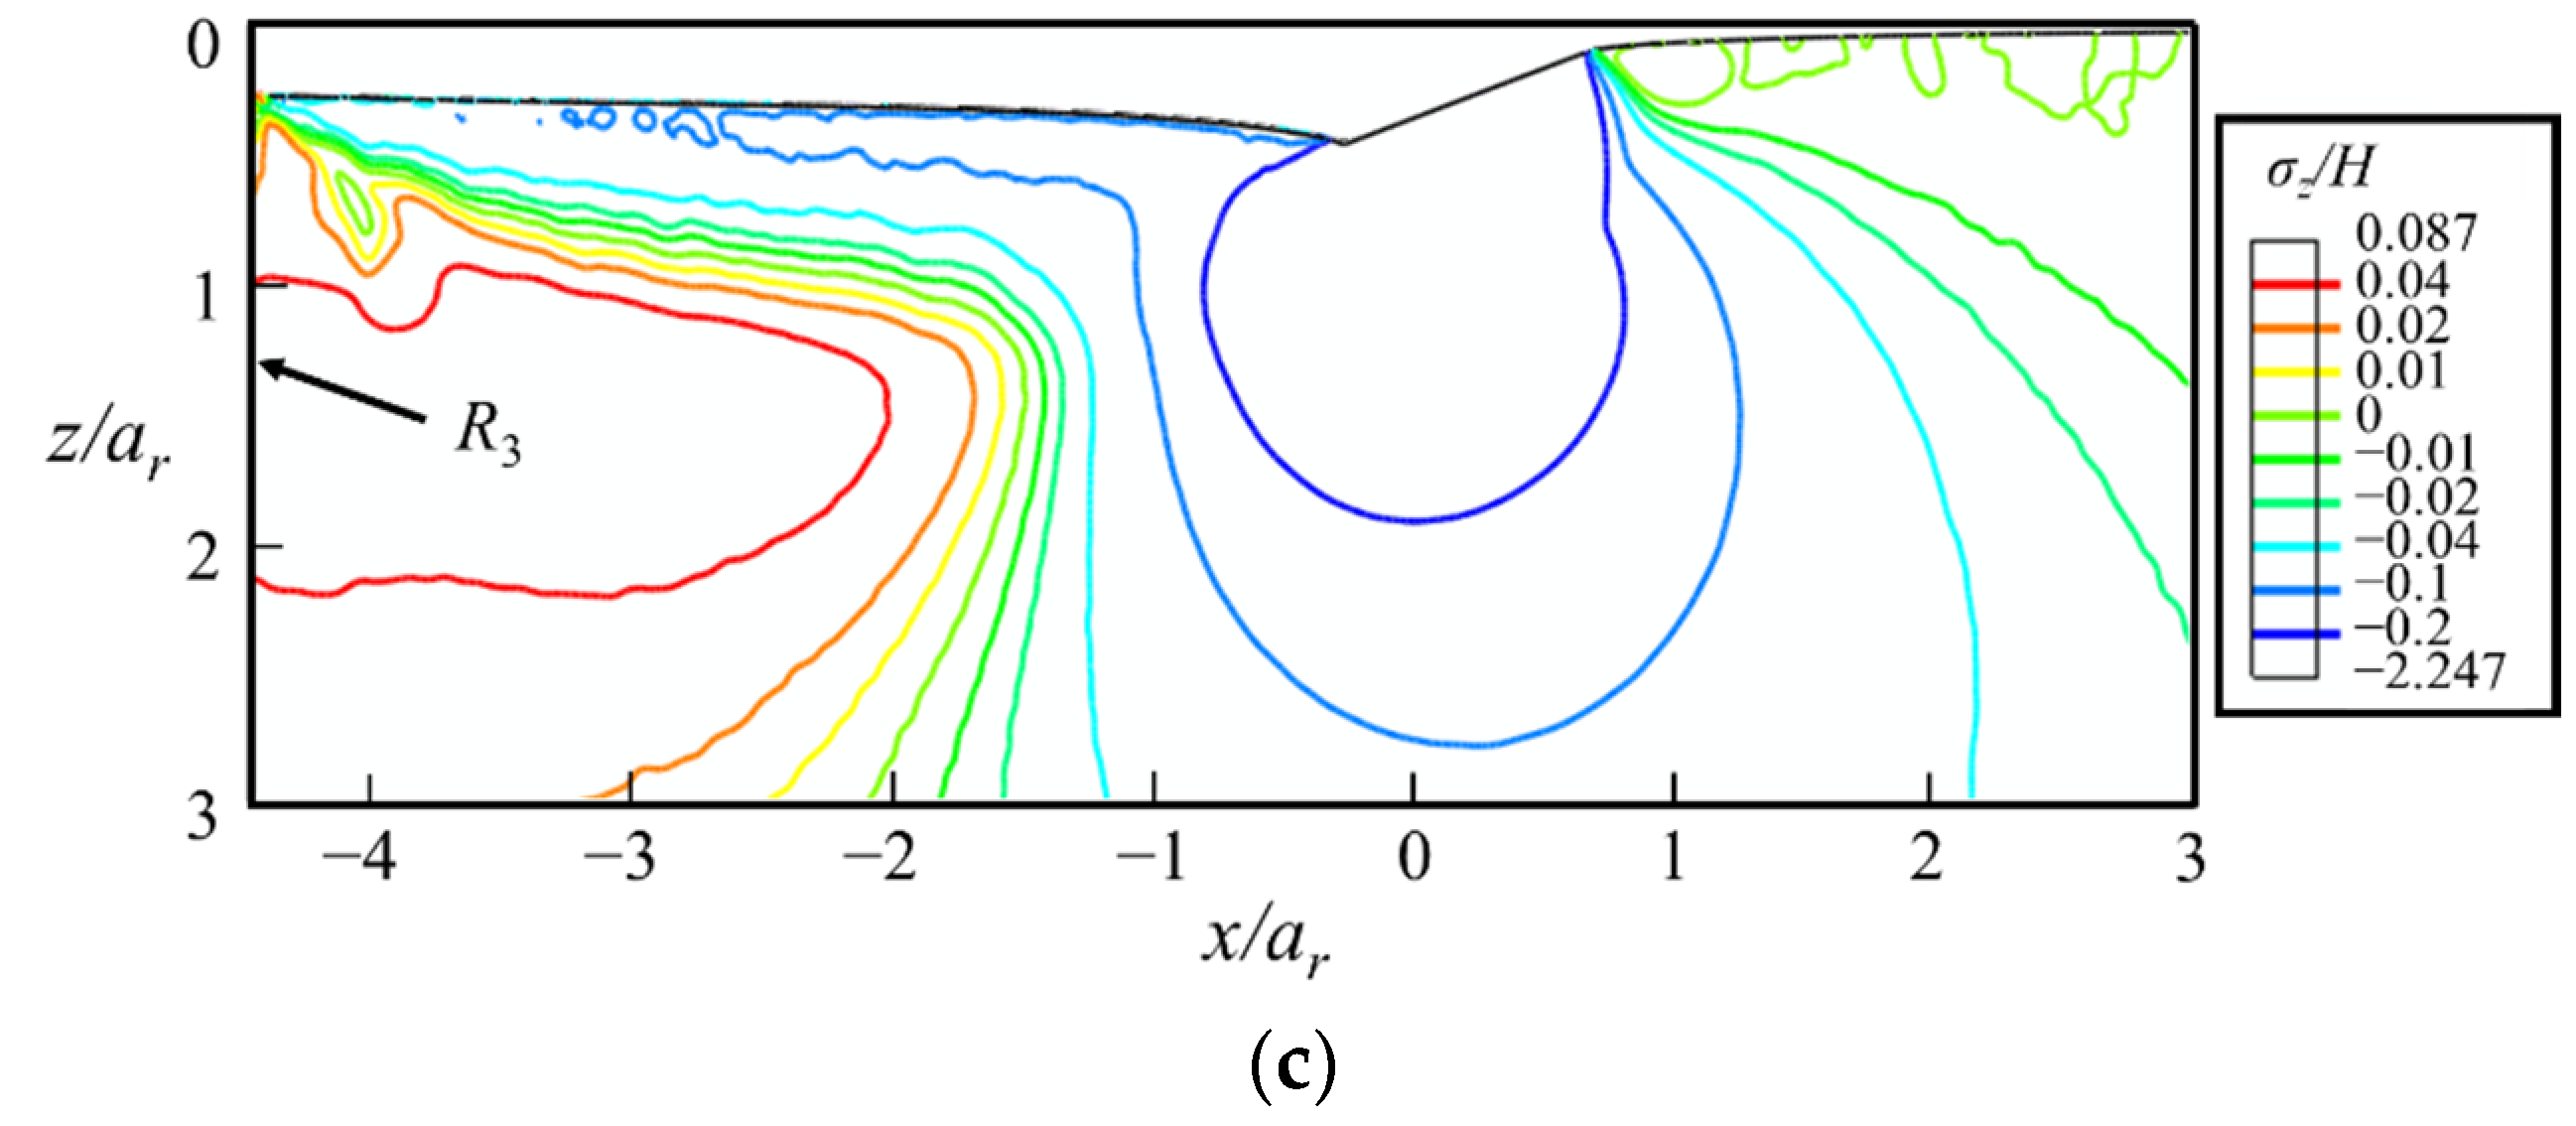
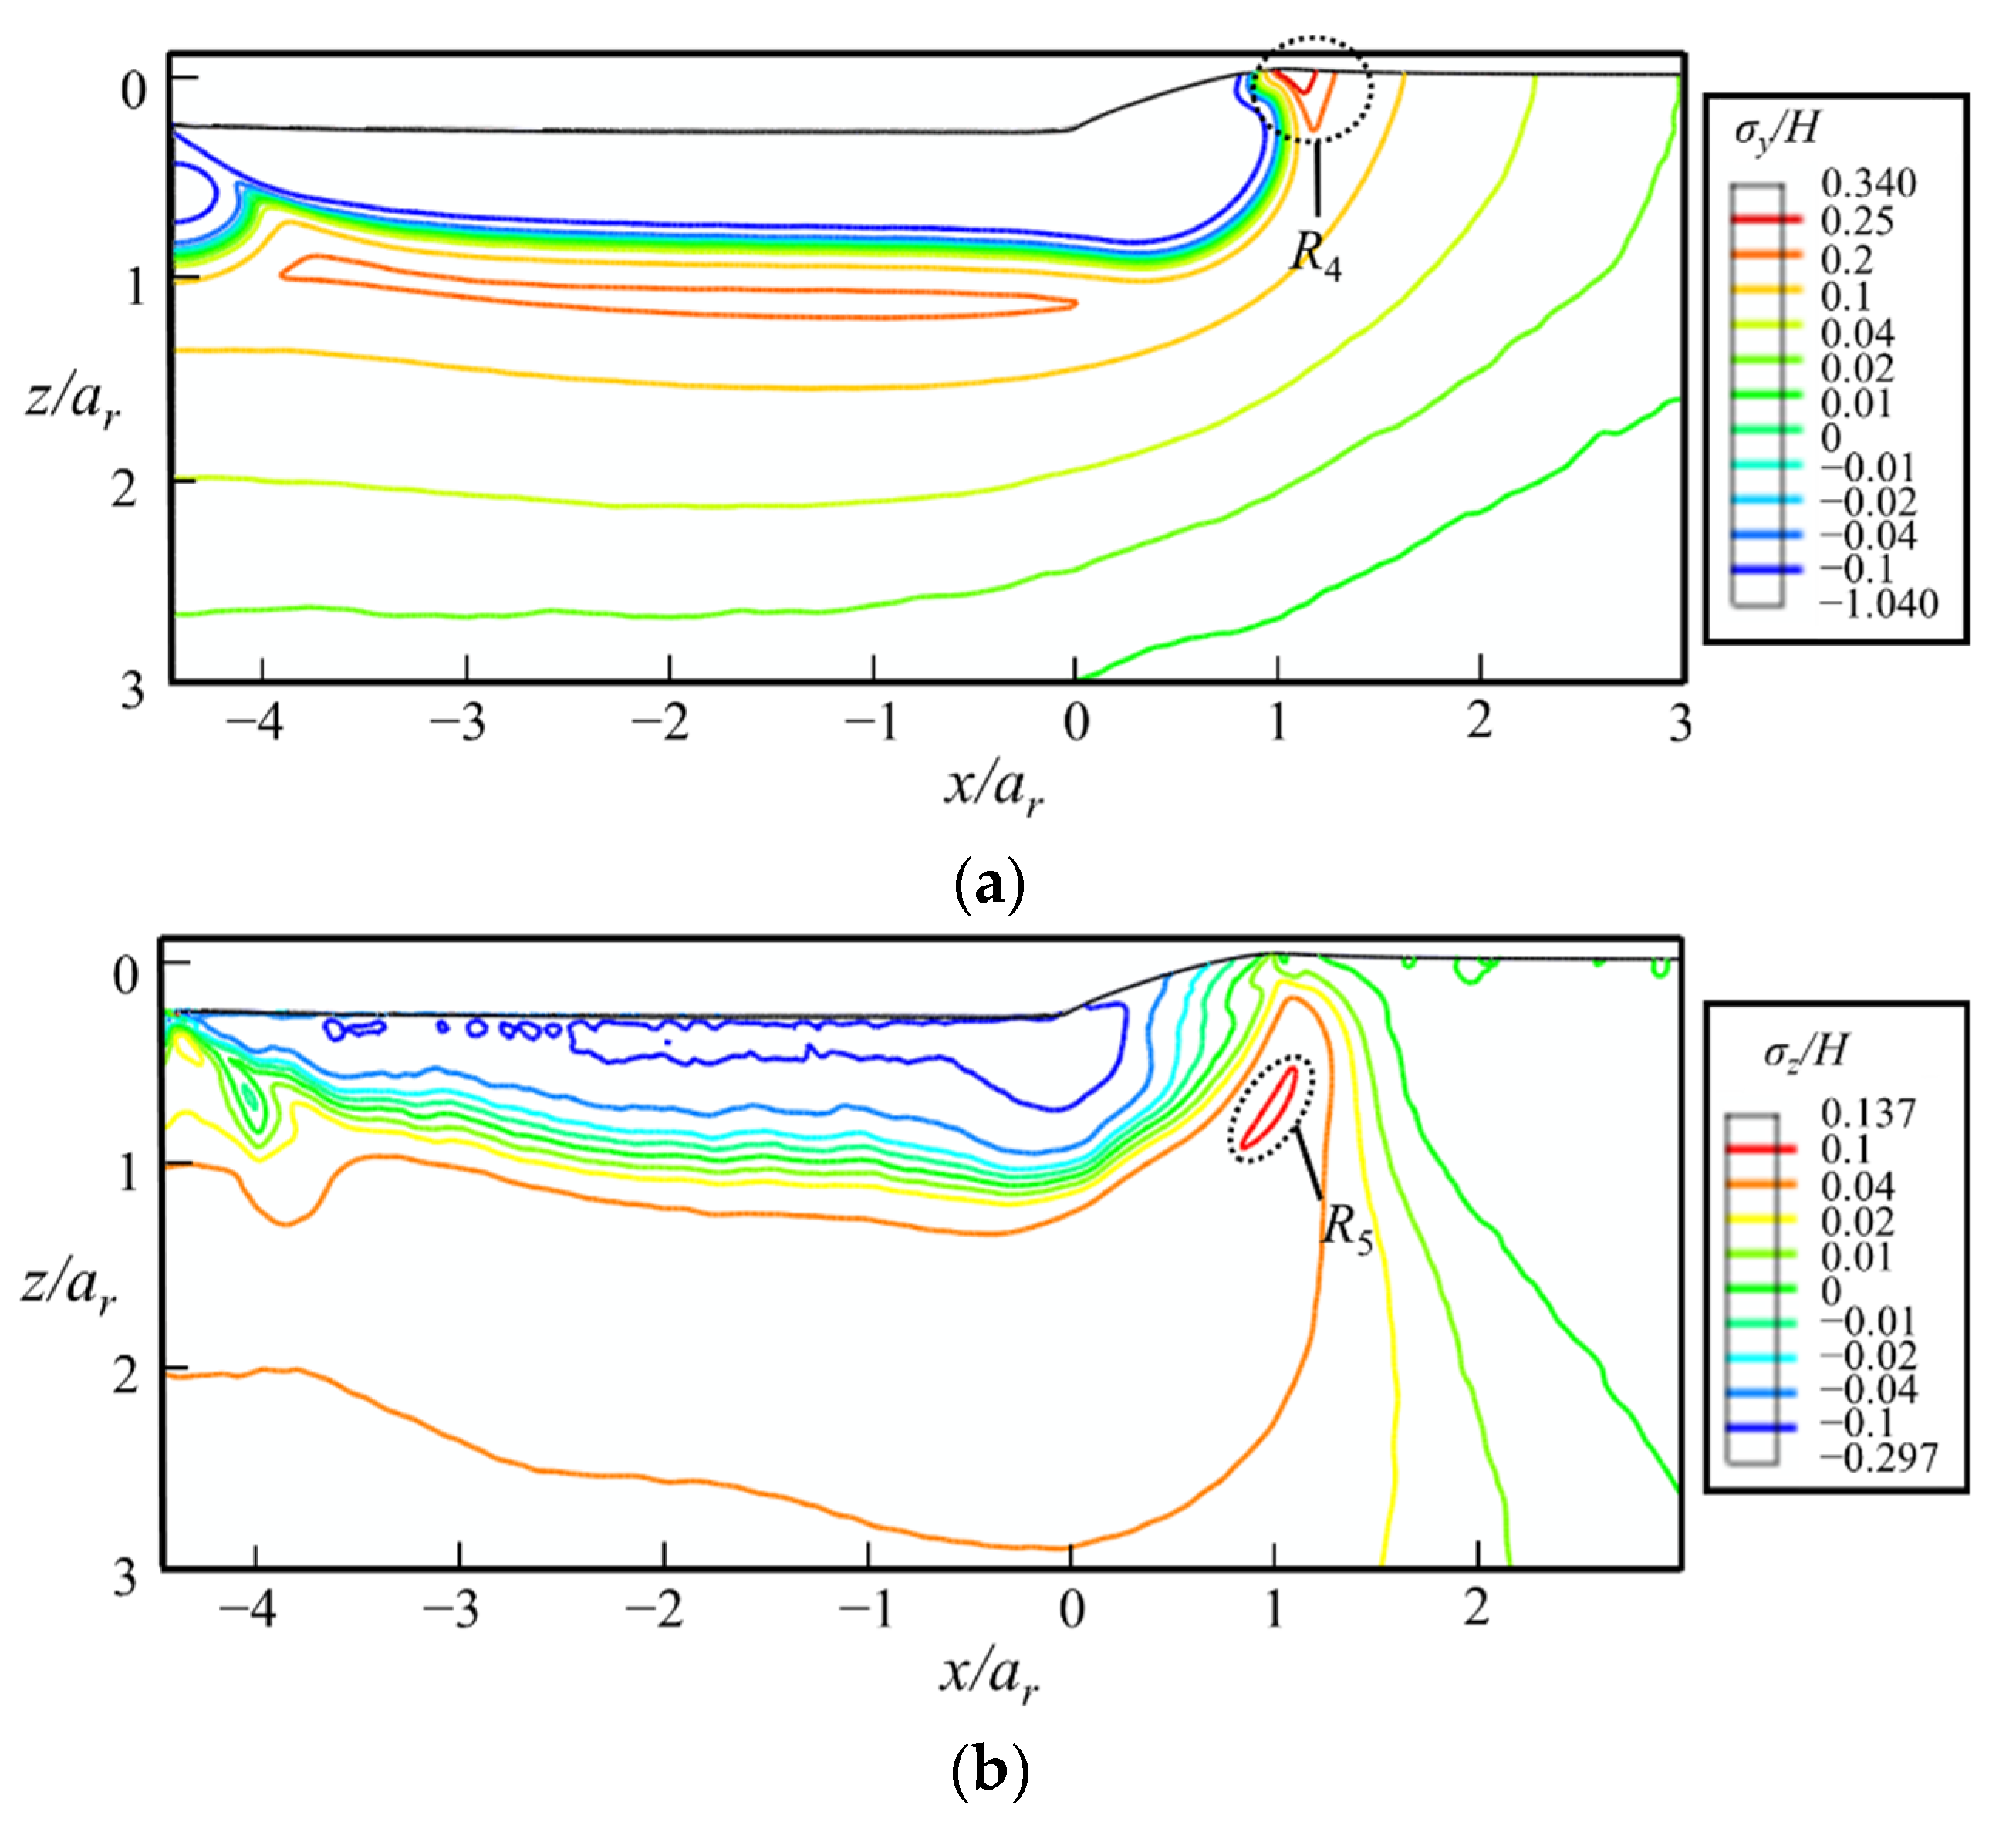
5.3.1. In the Sliding Stage
5.3.2. At the Fully-Unloaded State
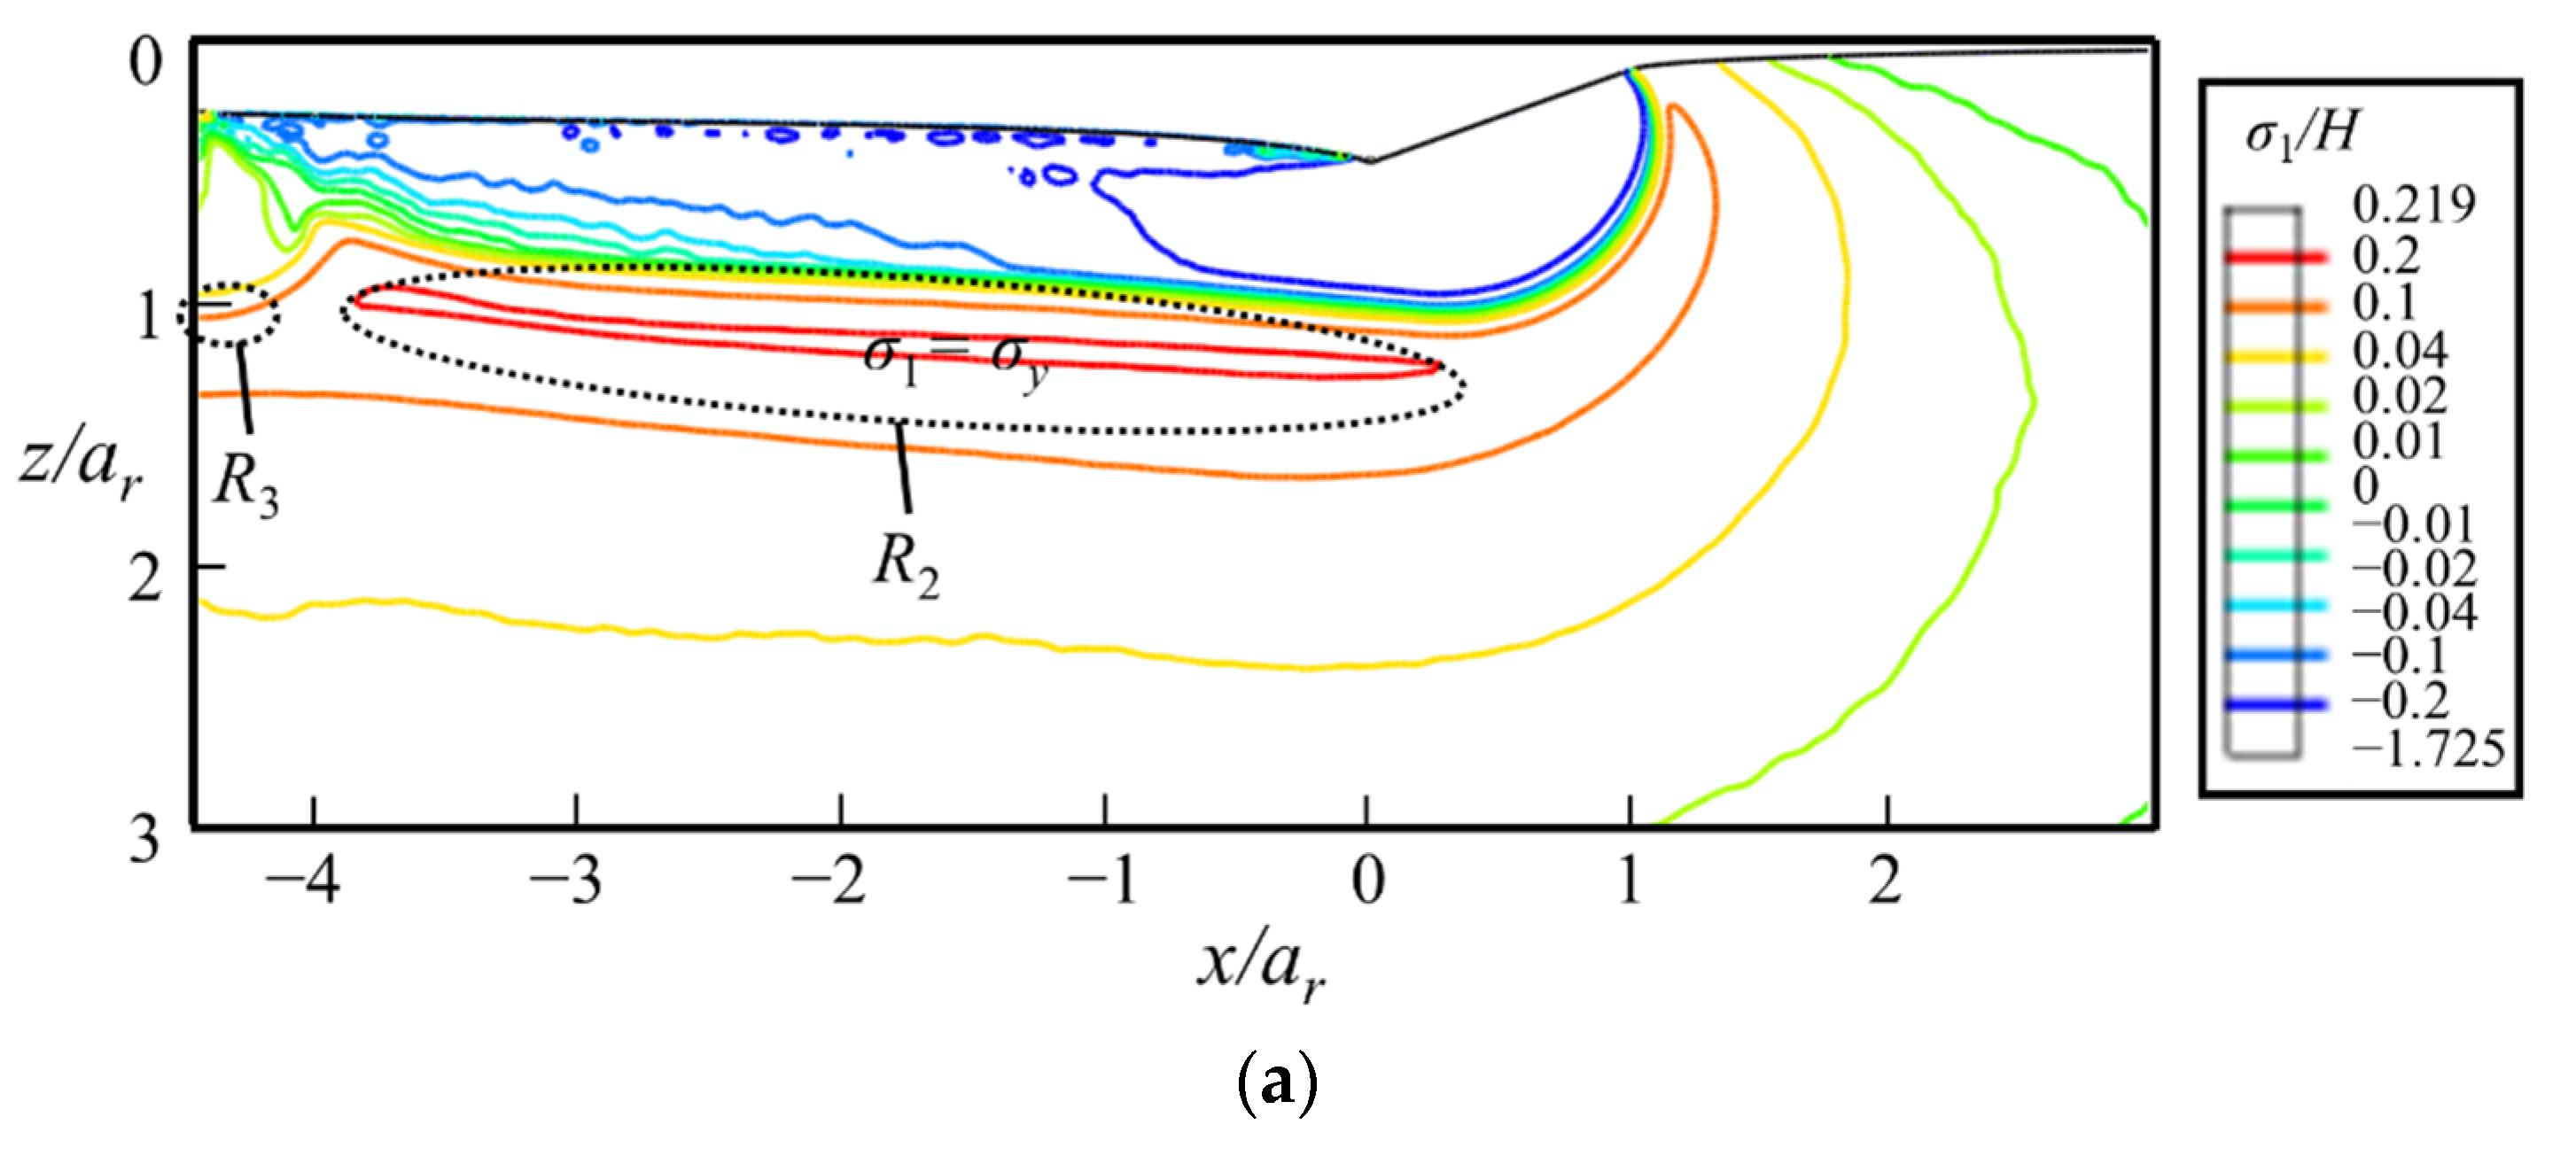
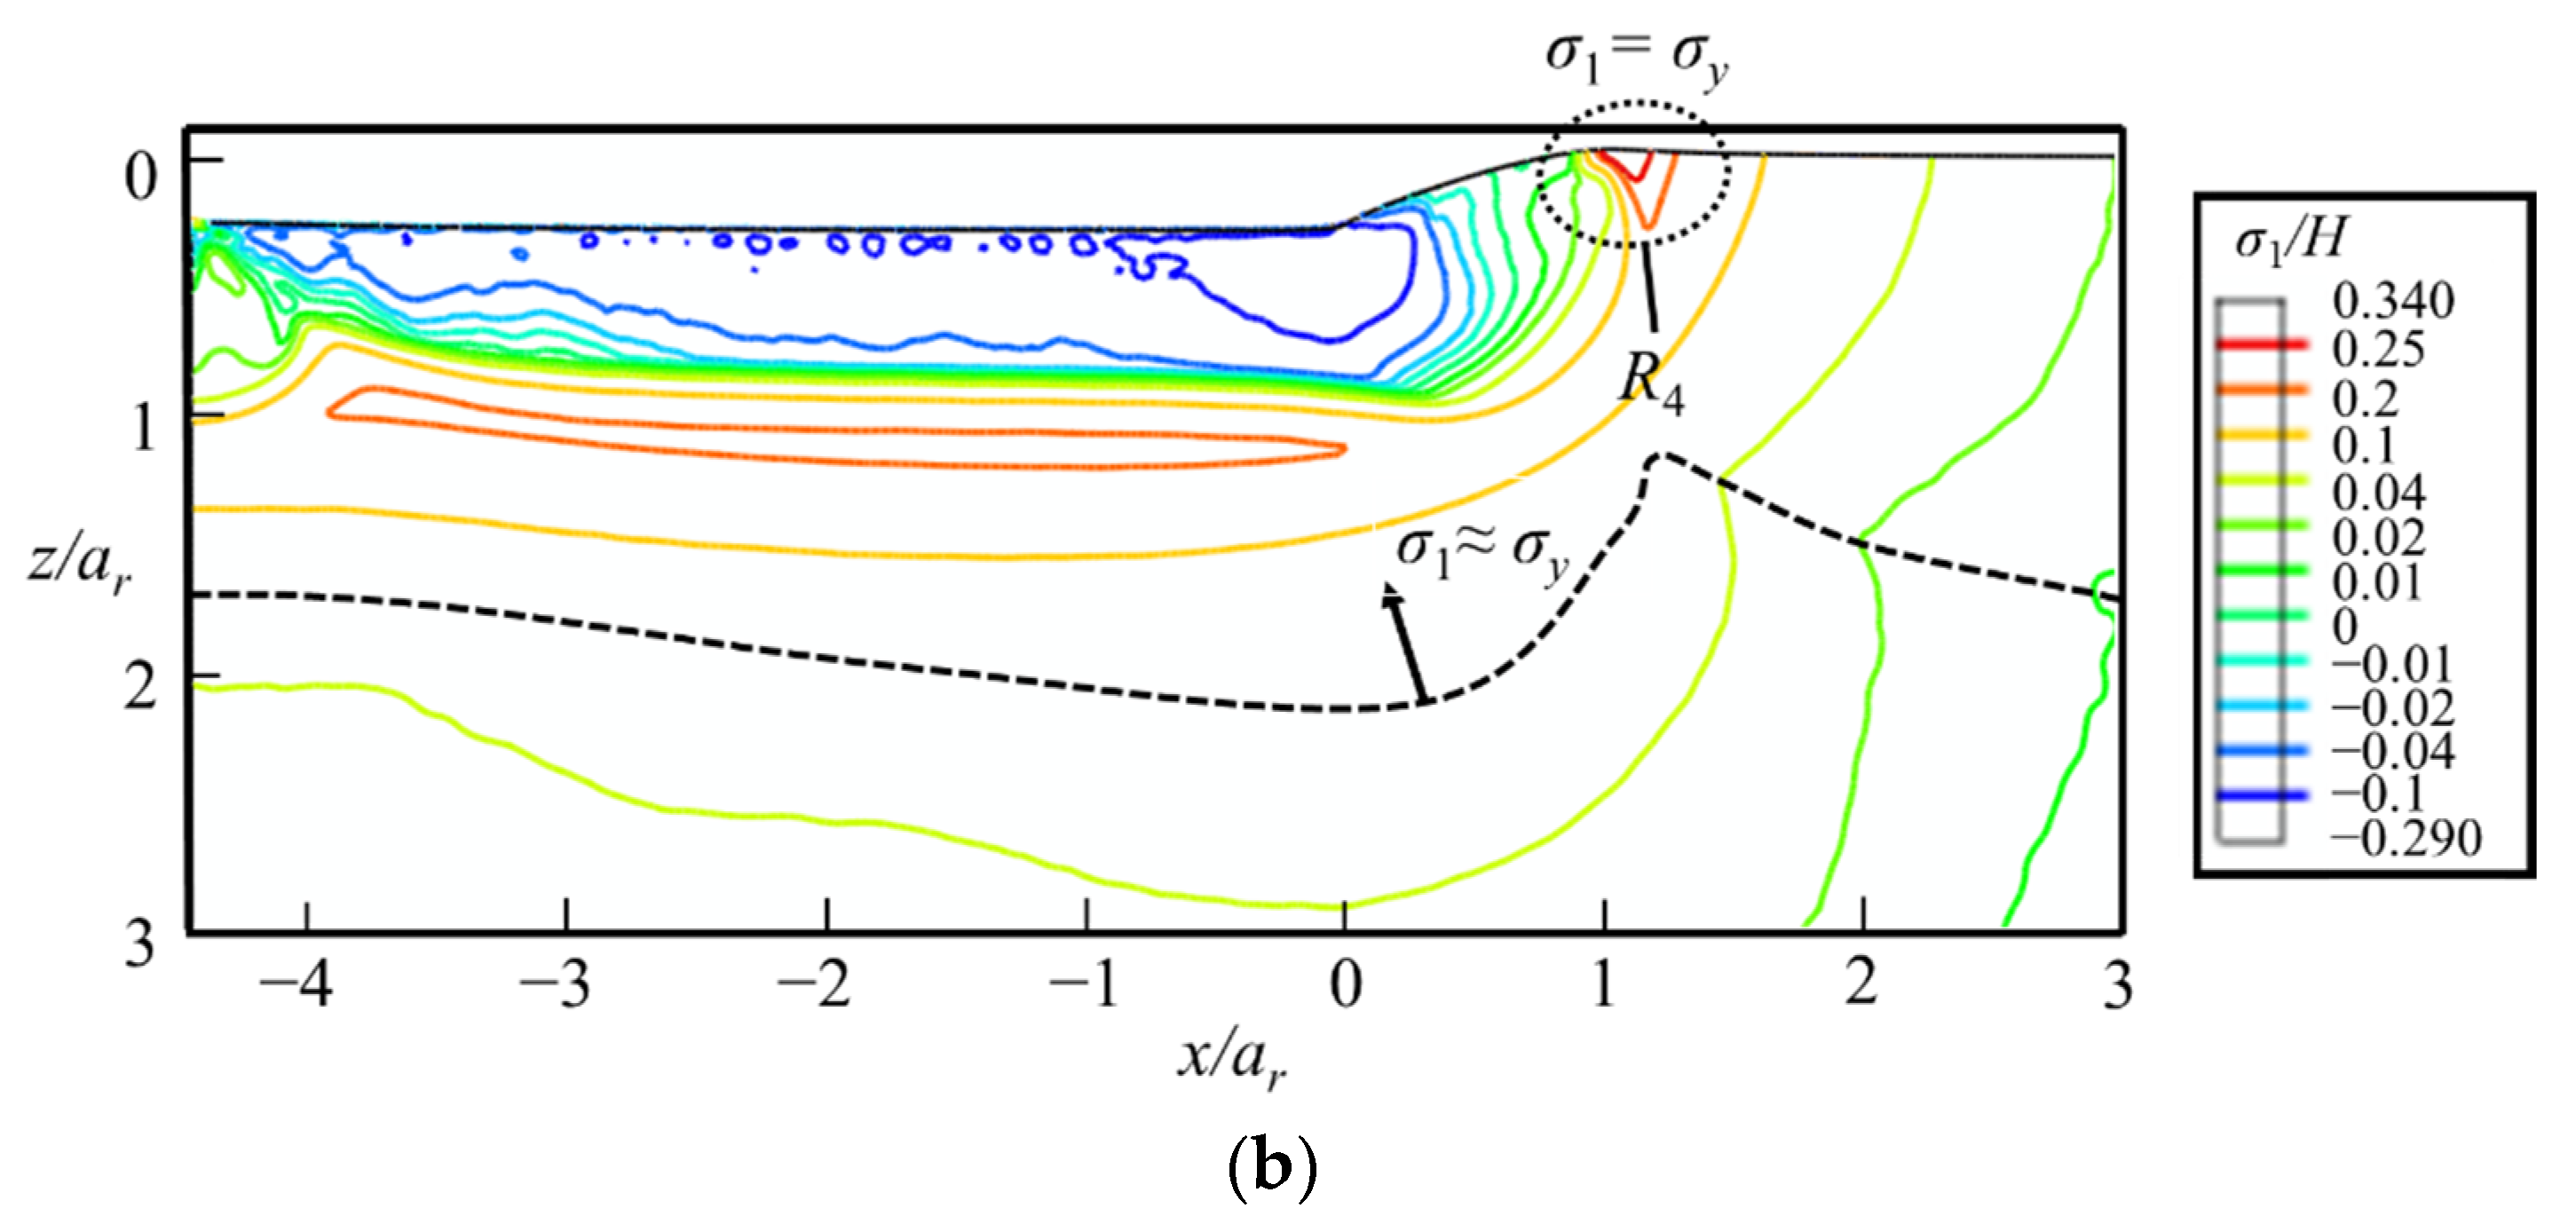
5.3.3. Maximum Principal Stress
6. Conclusions
Author Contributions
Funding
Data Availability Statement
Conflicts of Interest
References
- Campbell, J.H.; Hawley-Fedder, R.A.; Stolz, C.J.; Menapace, J.A.; Borden, M.R.; Whitman, P.K.; Yu, J.; Runkel, M.; Riley, M.O.; Feit, M.D.; et al. NIF optical materials and fabrication technologies: An overview. In Proceedings of the Optical Engineering at the Lawrence Livermore National Laboratory II: The National Ignition Facility, San Jose, CA, USA, 25–29 January 2004; pp. 84–101. [Google Scholar]
- Gray, P.; Ciattaglia, E.; Dupuy, C.; Gago, F.; Guisard, S.; Marrero, J.; Ridings, R.; Wright, A. E-ELT Assembly, Integration, and Technical Commissioning Plans. In Proceedings of the Ground-Based and Airborne Telescopes VI, Edinburgh, UK, 26 June–1 July 2016. [Google Scholar]
- Hrdina, K.E.; Duran, C.A. ULE®Glass with Improved Thermal Properties for EUVL Masks and Projection Optics Substrates. Int. J. Appl. Glas. Sci. 2014, 5, 82–88. [Google Scholar] [CrossRef]
- Hergenhan, G.; Taubert, J.; Grimm, D.; Tilke, M.; Panitz, M.; Ziener, C. Realization of Thermally Stable Transmissive Optical Elements for the EUV Wavelength Range; SPIE: Bellingham, WA, USA, 2020; Volume 11323. [Google Scholar]
- Zhao, L.-J.; Cheng, J.; Chen, M.-J.; Yuan, X.-D.; Liao, W.; Yang, H.; Liu, Q.; Wang, H.-J. Development of Integrated Multi-Station System to Precisely Detect and Mitigate Surface Damage on Fused Silica Optics. Int. J. Precis. Eng. Manuf. 2021, 22, 95–105. [Google Scholar] [CrossRef]
- Malkin, S.; Hwang, T. Grinding mechanisms for ceramics. CIRP Ann. 1996, 45, 569–580. [Google Scholar] [CrossRef]
- Suratwala, T.I.; Steele, W.A.; Wong, L.L.; Tham, G.C.; Destino, J.F.; Miller, P.E.; Ray, N.J.; Menapace, J.A.; Feigenbaum, E.; Shen, N. Subsurface mechanical damage correlations after grinding of various optical materials. Opt. Eng. 2019, 58, 092604. [Google Scholar] [CrossRef]
- Hertz, H. Über die Berührung fester elastischer Körper. J. Reine Angew. Math. 1882, 92, 22. [Google Scholar]
- Hill, R.; Lee, E.H.; Tupper, S.J. The theory of wedge indentation of ductile materials. Proc. R. Soc. Lond. Ser. A Math. Phys. Sci. 1947, 188, 273–289. [Google Scholar]
- Johnson, K.L. The correlation of indentation experiments. J. Mech. Phys. Solids 1970, 18, 115–126. [Google Scholar] [CrossRef]
- Lawn, B.R.; Evans, A.G.; Marshall, D.B. Elastic/plastic indentation damage in ceramics: The median/radial crack system. J. Am. Ceram. Soc. 1980, 63, 574–581. [Google Scholar] [CrossRef]
- Bruns, S.; Uesbeck, T.; Fuhrmann, S.; Tarragó Aymerich, M.; Wondraczek, L.; de Ligny, D.; Durst, K. Indentation densification of fused silica assessed by raman spectroscopy and constitutive finite element analysis. J. Am. Ceram. Soc. 2020, 103, 3076–3088. [Google Scholar] [CrossRef] [Green Version]
- Yoffe, E.H. Elastic Stress-Fields Caused by Indenting Brittle Materials. Philos. Mag. A 1982, 46, 617–628. [Google Scholar] [CrossRef]
- Li, C.; Zhang, L.; Sun, L.; Yang, S.; Wu, C.; Long, X.; Ding, J.; Jiang, Z. A quantitative analysis of the indentation fracture of fused silica. J. Am. Ceram. Soc. 2019, 102, 7264–7277. [Google Scholar] [CrossRef]
- Hamilton, G.M.; Goodman, L.E. The stress field created by a circular sliding contact. J. Appl. Mech. 1966, 33, 371–376. [Google Scholar] [CrossRef]
- Ahn, Y.; Farris, T.N.; Chandrasekar, S. Sliding microindentation fracture of brittle materials: Role of elastic stress fields. Mech. Mater. 1998, 29, 143–152. [Google Scholar] [CrossRef]
- Wang, W.; Yao, P.; Wang, J.; Huang, C.; Kuriyagawa, T.; Zhu, H.; Zou, B.; Liu, H. Elastic stress field model and micro-crack evolution for isotropic brittle materials during single grit scratching. Ceram. Int. 2017, 43, 10726–10736. [Google Scholar] [CrossRef]
- Yao, L.; Zhang, L.; Ge, P.; Gao, Y.; Wang, H. Study on nucleation and propagation of median cracks generated by scratching single crystal silicon. Mater. Sci. Semicond. Process. 2020, 105, 104691. [Google Scholar] [CrossRef]
- Lee, K.; Marimuthu, K.P.; Kim, C.-L.; Lee, H.J.T.I. Scratch-tip-size effect and change of friction coefficient in nano/micro scratch tests using XFEM. Tribol. Int. 2018, 120, 398–410. [Google Scholar] [CrossRef]
- Arjmandi, M.; Ramezani, M. Finite element modelling of sliding wear in three-dimensional textile hydrogel composites. Tribol. Int. 2019, 133, 88–100. [Google Scholar] [CrossRef]
- Asqari, M.A.; Akbari, J. Investigation of cohesive FE modeling to predict crack depth during deep-scratching on optical glasses. Ceram. Int. 2018, 44, 16781–16790. [Google Scholar] [CrossRef]
- Shim, S.; Oliver, W.C.; Pharr, G.M. A comparison of 3D finite element simulations for Berkovich and conical indentation of fused silica. Int. J. Surf. Sci. Eng. 2007, 1, 259–273. [Google Scholar] [CrossRef]
- Imaoka, M.; Yasui, I. Finite element analysis of indentation on glass. J. Non-Cryst. Solids 1976, 22, 315–329. [Google Scholar] [CrossRef]
- Gadelrab, K.R.; Bonilla, F.A.; Chiesa, M. Densification modeling of fused silica under nanoindentation. J. Non-Cryst. Solids 2012, 358, 392–398. [Google Scholar] [CrossRef]
- Xin, K.; Lambropoulos, J.C. Densification of fused silica: Effects on nanoindentation. In Proceedings of the International Symposium on Optical Science and Technology, San Diego, CA, USA, 30 July–4 August 2000; Volume 4102, pp. 112–121. [Google Scholar] [CrossRef]
- Kermouche, G.; Barthel, E.; Vandembroucq, D.; Dubujet, P. Mechanical modelling of indentation-induced densification in amorphous silica. Acta Mater. 2008, 56, 3222–3228. [Google Scholar] [CrossRef] [Green Version]
- Bruns, S.; Johanns, K.E.; Rehman, H.U.; Pharr, G.M.; Durst, K. Constitutive modeling of indentation cracking in fused silica. J. Am. Ceram. Soc. 2017, 100, 1928–1940. [Google Scholar] [CrossRef]
- Li, C.; Zhang, L.; Sun, L.; Wu, C.; Duan, D.; Lin, Q.; Ding, J.; Jiang, Z. A finite element study on the effects of densification on fused silica under indentation. Ceram. Int. 2020, 46, 26861–26870. [Google Scholar] [CrossRef]
- Li, C.; Ding, J.; Zhang, L.; Wu, C.; Sun, L.; Lin, Q.; Liu, Y.; Jiang, Z. Densification effects on the fracture in fused silica under Vickers indentation. Ceram. Int. 2021, 48, 9330–9341. [Google Scholar] [CrossRef]
- Fang, X.; Li, C.; Sun, L.; Sun, H.; Jiang, Z. Hardness and friction coefficient of fused silica under scratching considering elastic recovery. Ceram. Int. 2020, 46, 8200–8208. [Google Scholar] [CrossRef]
- Menapace, J.A.; Davis, P.J.; Steele, W.A.; Wong, L.L.; Suratwala, T.I.; Miller, P.E. MRF applications: Measurement of process-dependent subsurface damage in optical materials using the MRF wedge technique. In Proceedings of the Boulder Damage Symposium XXXVII: Annual Symposium on Optical Materials for High Power Lasers, Boulder, CO, USA, 19–21 September 2005. [Google Scholar]
- Broitman, E. Indentation Hardness Measurements at Macro-, Micro-, and Nanoscale: A Critical Overview. Tribol. Lett. 2017, 65, 23. [Google Scholar] [CrossRef] [Green Version]
- Brookes, C.A. Plastic Deformation and Anisotropy in the Hardness of Diamond. Nature 1970, 228, 660–661. [Google Scholar] [CrossRef]
- Li, K.; Shapiro, Y.; Li, J.C.M. Scratch test of soda-lime glass. Acta Mater. 1998, 46, 5569–5578. [Google Scholar] [CrossRef]
- Chamani, H.R.; Ayatollahi, M.R. The effect of Berkovich tip orientations on friction coefficient in nanoscratch testing of metals. Tribol. Int. 2016, 103, 25–36. [Google Scholar] [CrossRef]
- Cai, X. Effect of friction in indentation hardness testing: A finite element study. J. Mater. Sci. Lett. 1993, 12, 301–302. [Google Scholar] [CrossRef]
- Feng, G.; Qu, S.; Huang, Y.; Nix, W.D. An analytical expression for the stress field around an elastoplastic indentation/contact. Acta Mater. 2007, 55, 2929–2938. [Google Scholar] [CrossRef]
- Rouxel, T.; Ji, H.; Hammouda, T.; Moreac, A. Poisson’s ratio and the densification of glass under high pressure. Phys. Rev. Lett. 2008, 100, 225501. [Google Scholar] [CrossRef] [PubMed]
- Cook, R.F.; Pharr, G.M. Direct Observation and Analysis of Indentation Cracking in Glasses and Ceramics. J. Am. Ceram. Soc. 1990, 73, 787–817. [Google Scholar] [CrossRef]


Publisher’s Note: MDPI stays neutral with regard to jurisdictional claims in published maps and institutional affiliations. |
© 2022 by the authors. Licensee MDPI, Basel, Switzerland. This article is an open access article distributed under the terms and conditions of the Creative Commons Attribution (CC BY) license (https://creativecommons.org/licenses/by/4.0/).
Share and Cite
Li, C.; Ma, Y.; Sun, L.; Zhang, L.; Wu, C.; Ding, J.; Duan, D.; Wang, X.; Chang, Z. An Investigation into the Densification-Affected Deformation and Fracture in Fused Silica under Contact Sliding. Micromachines 2022, 13, 1106. https://doi.org/10.3390/mi13071106
Li C, Ma Y, Sun L, Zhang L, Wu C, Ding J, Duan D, Wang X, Chang Z. An Investigation into the Densification-Affected Deformation and Fracture in Fused Silica under Contact Sliding. Micromachines. 2022; 13(7):1106. https://doi.org/10.3390/mi13071106
Chicago/Turabian StyleLi, Changsheng, Yushan Ma, Lin Sun, Liangchi Zhang, Chuhan Wu, Jianjun Ding, Duanzhi Duan, Xuepeng Wang, and Zhandong Chang. 2022. "An Investigation into the Densification-Affected Deformation and Fracture in Fused Silica under Contact Sliding" Micromachines 13, no. 7: 1106. https://doi.org/10.3390/mi13071106