
Research on Intelligent Distribution of Liquid Flow Rate in Embedded Channels for Cooling 3D Multi-Core Chips


Abstract
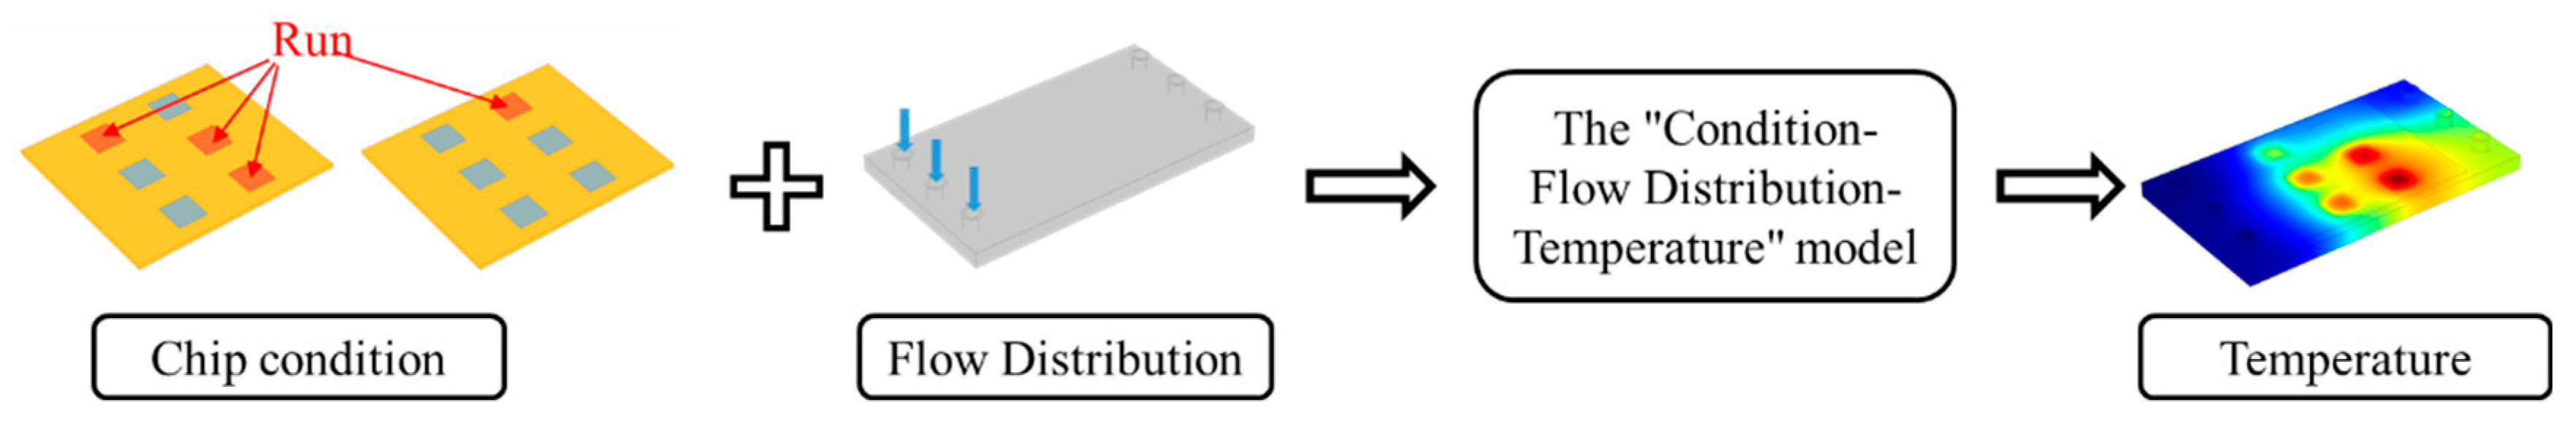
:1. Introduction
2. Model Building
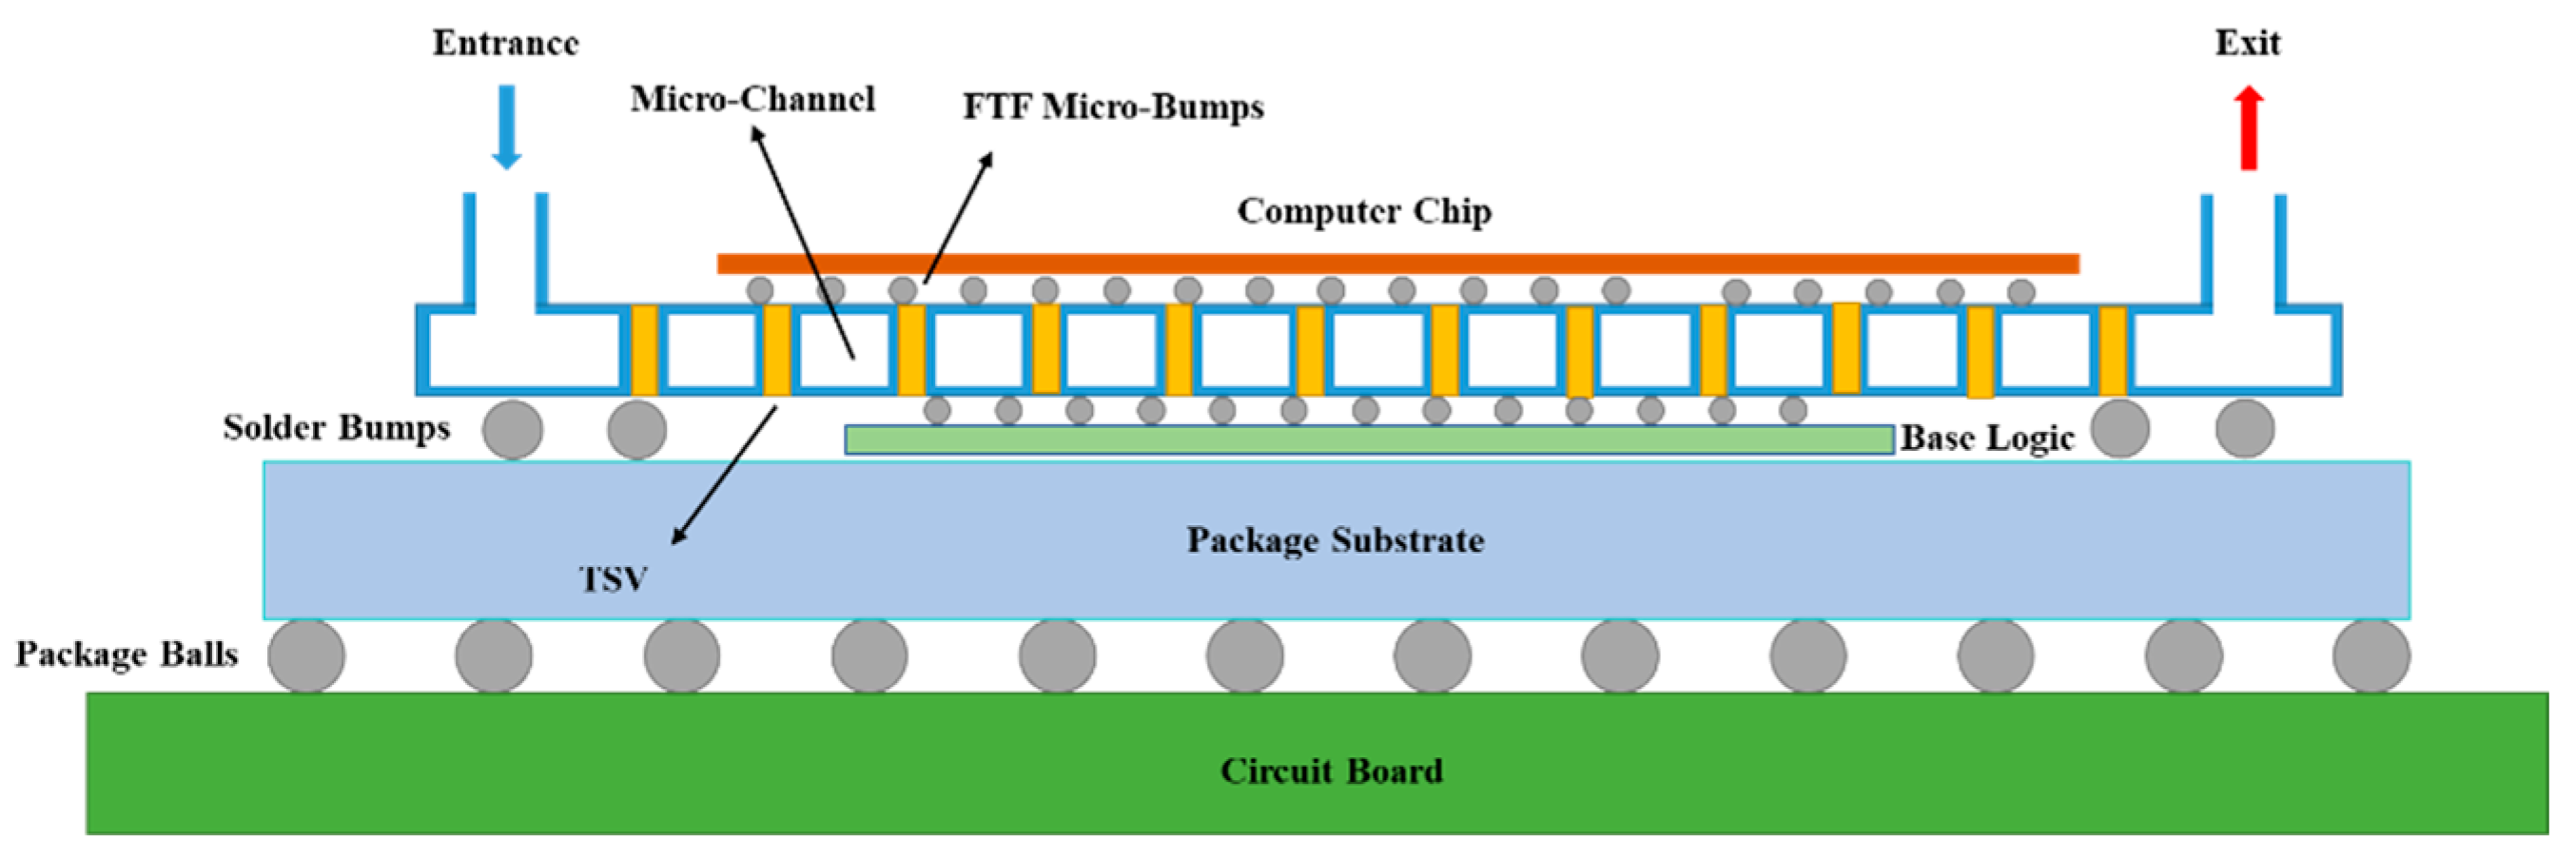
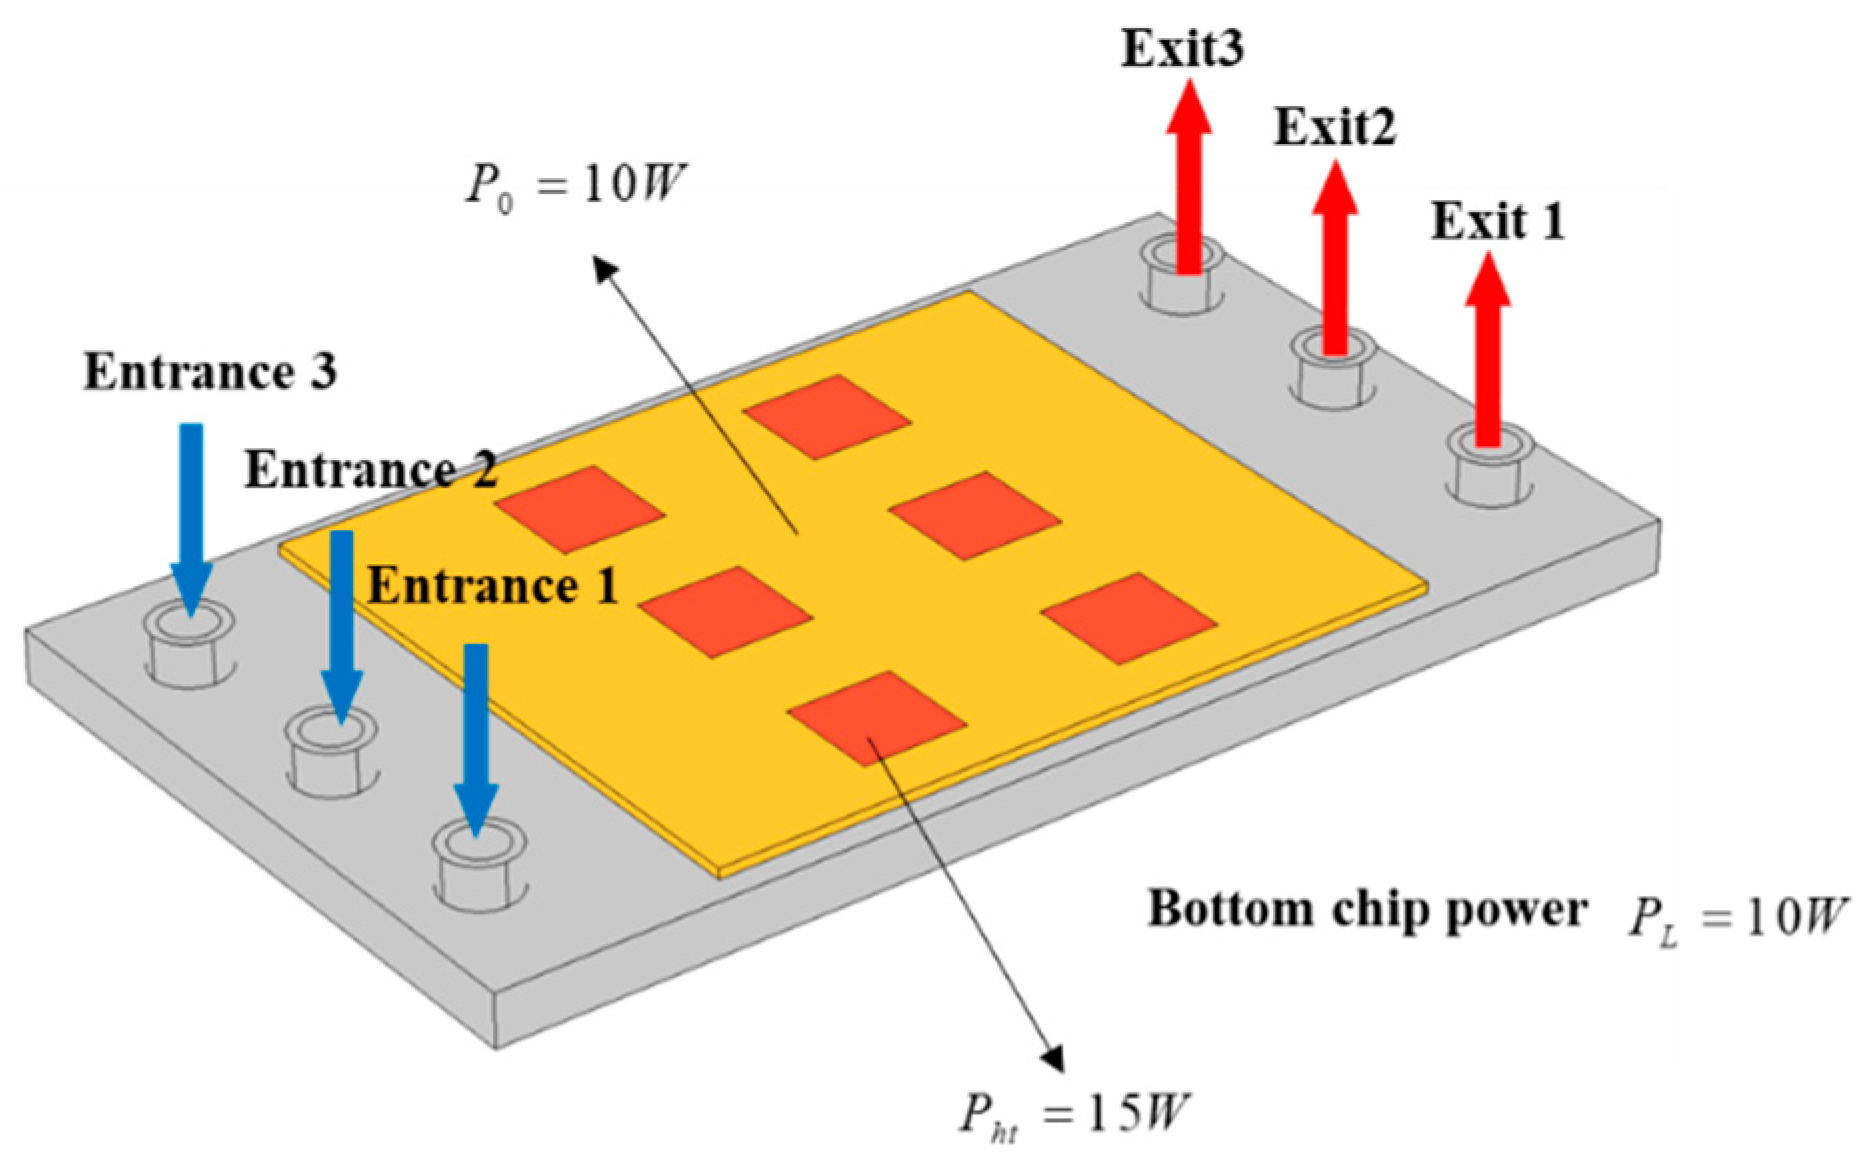
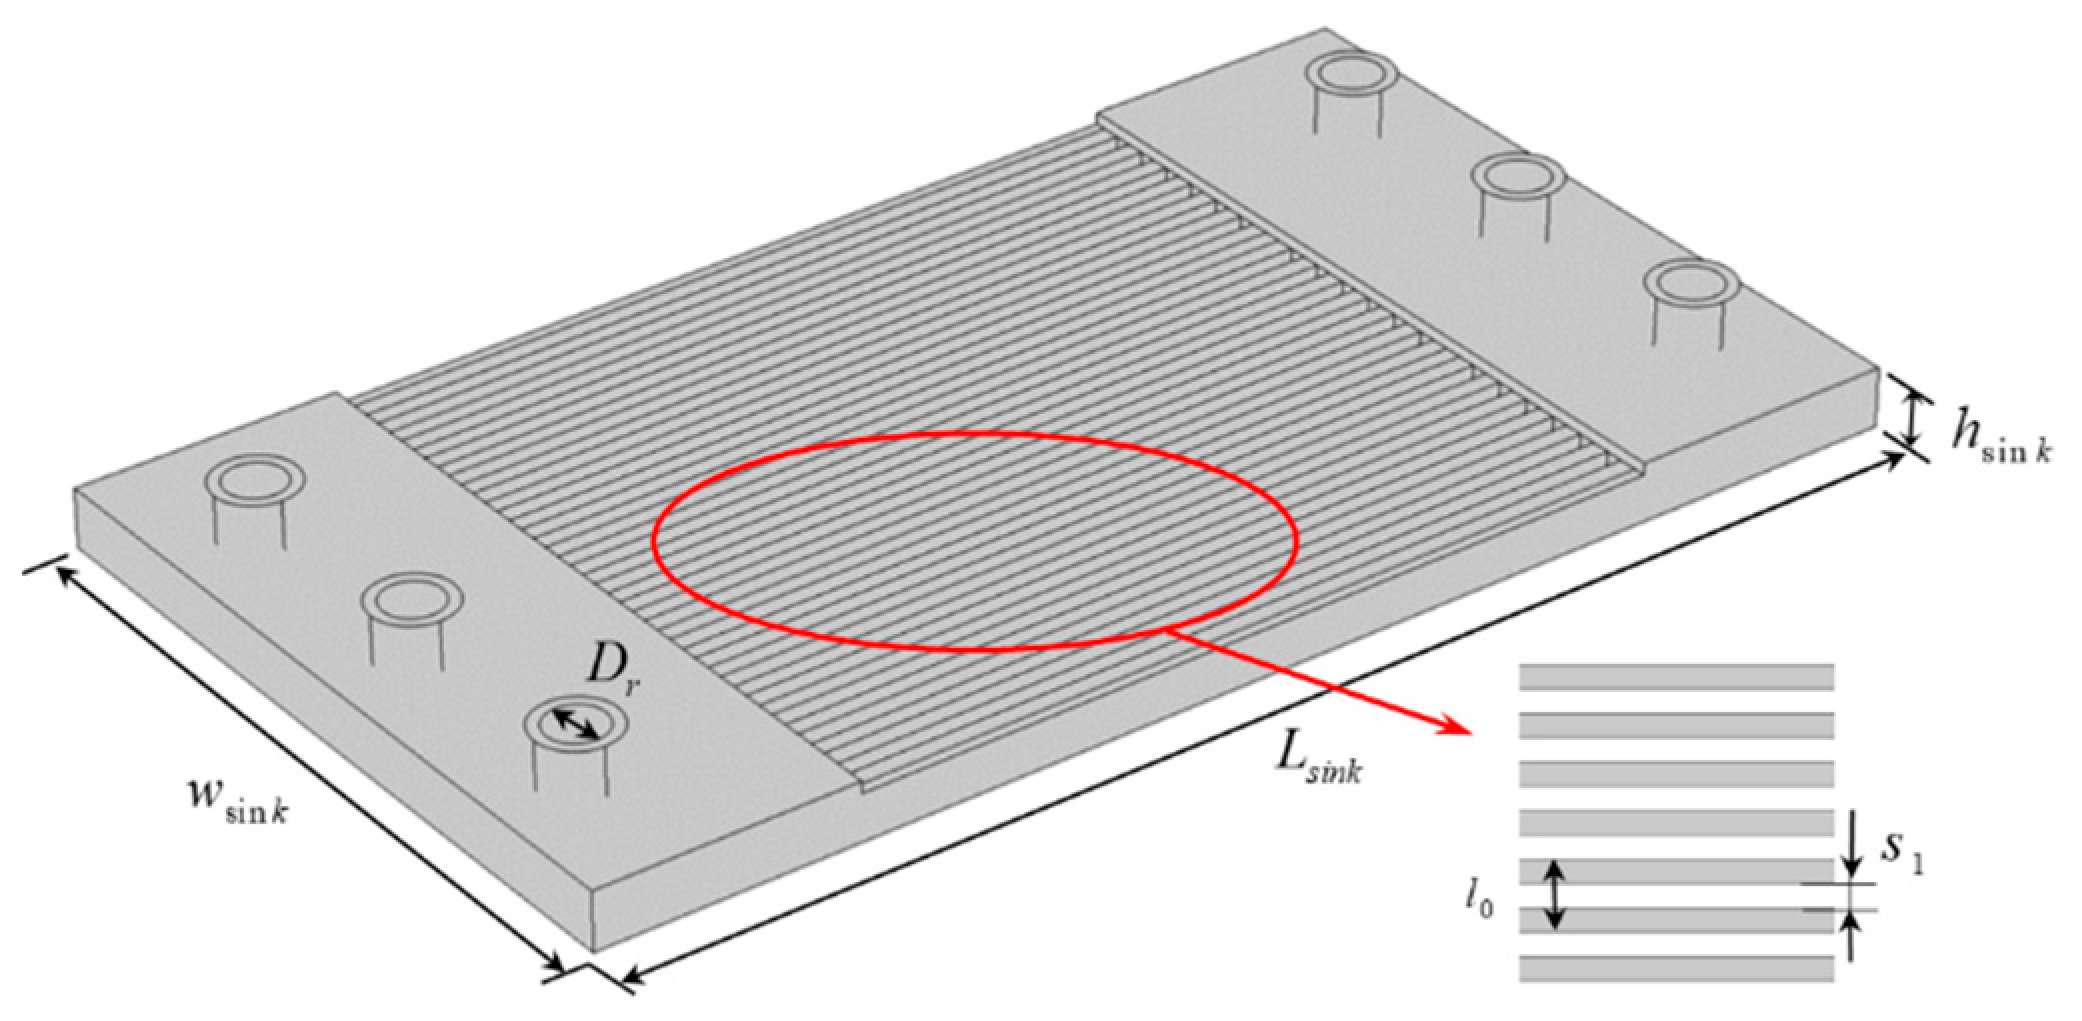
2.1. Geometric Model
2.2. Physical Model
- (1)
- The fluid flow and heat transfer were in a steady state, the cooling fluid was incompressible, and the flow state was laminar flow;
- (2)
- The physical properties of solid material did not change with temperature, and the thermophysical parameters of the solid material were isotropic;
- (3)
- The no-slip boundary condition was adopted for the walls;
- (4)
- The model did not take into account the effects of gravity, the effects of radiative heat transfer, and the effects of heat dissipation due to fluid viscous dissipation.
- (1)
- The inlet water temperature was constant;
- (2)
- The inlet mass flow rate was M0 = 0.001 kg/s;
- (3)
- Outlet pressure was 0 Pa;
- (4)
- The outer walls of the micro-channel were insulated, except where the micro-channel contacted the chip.
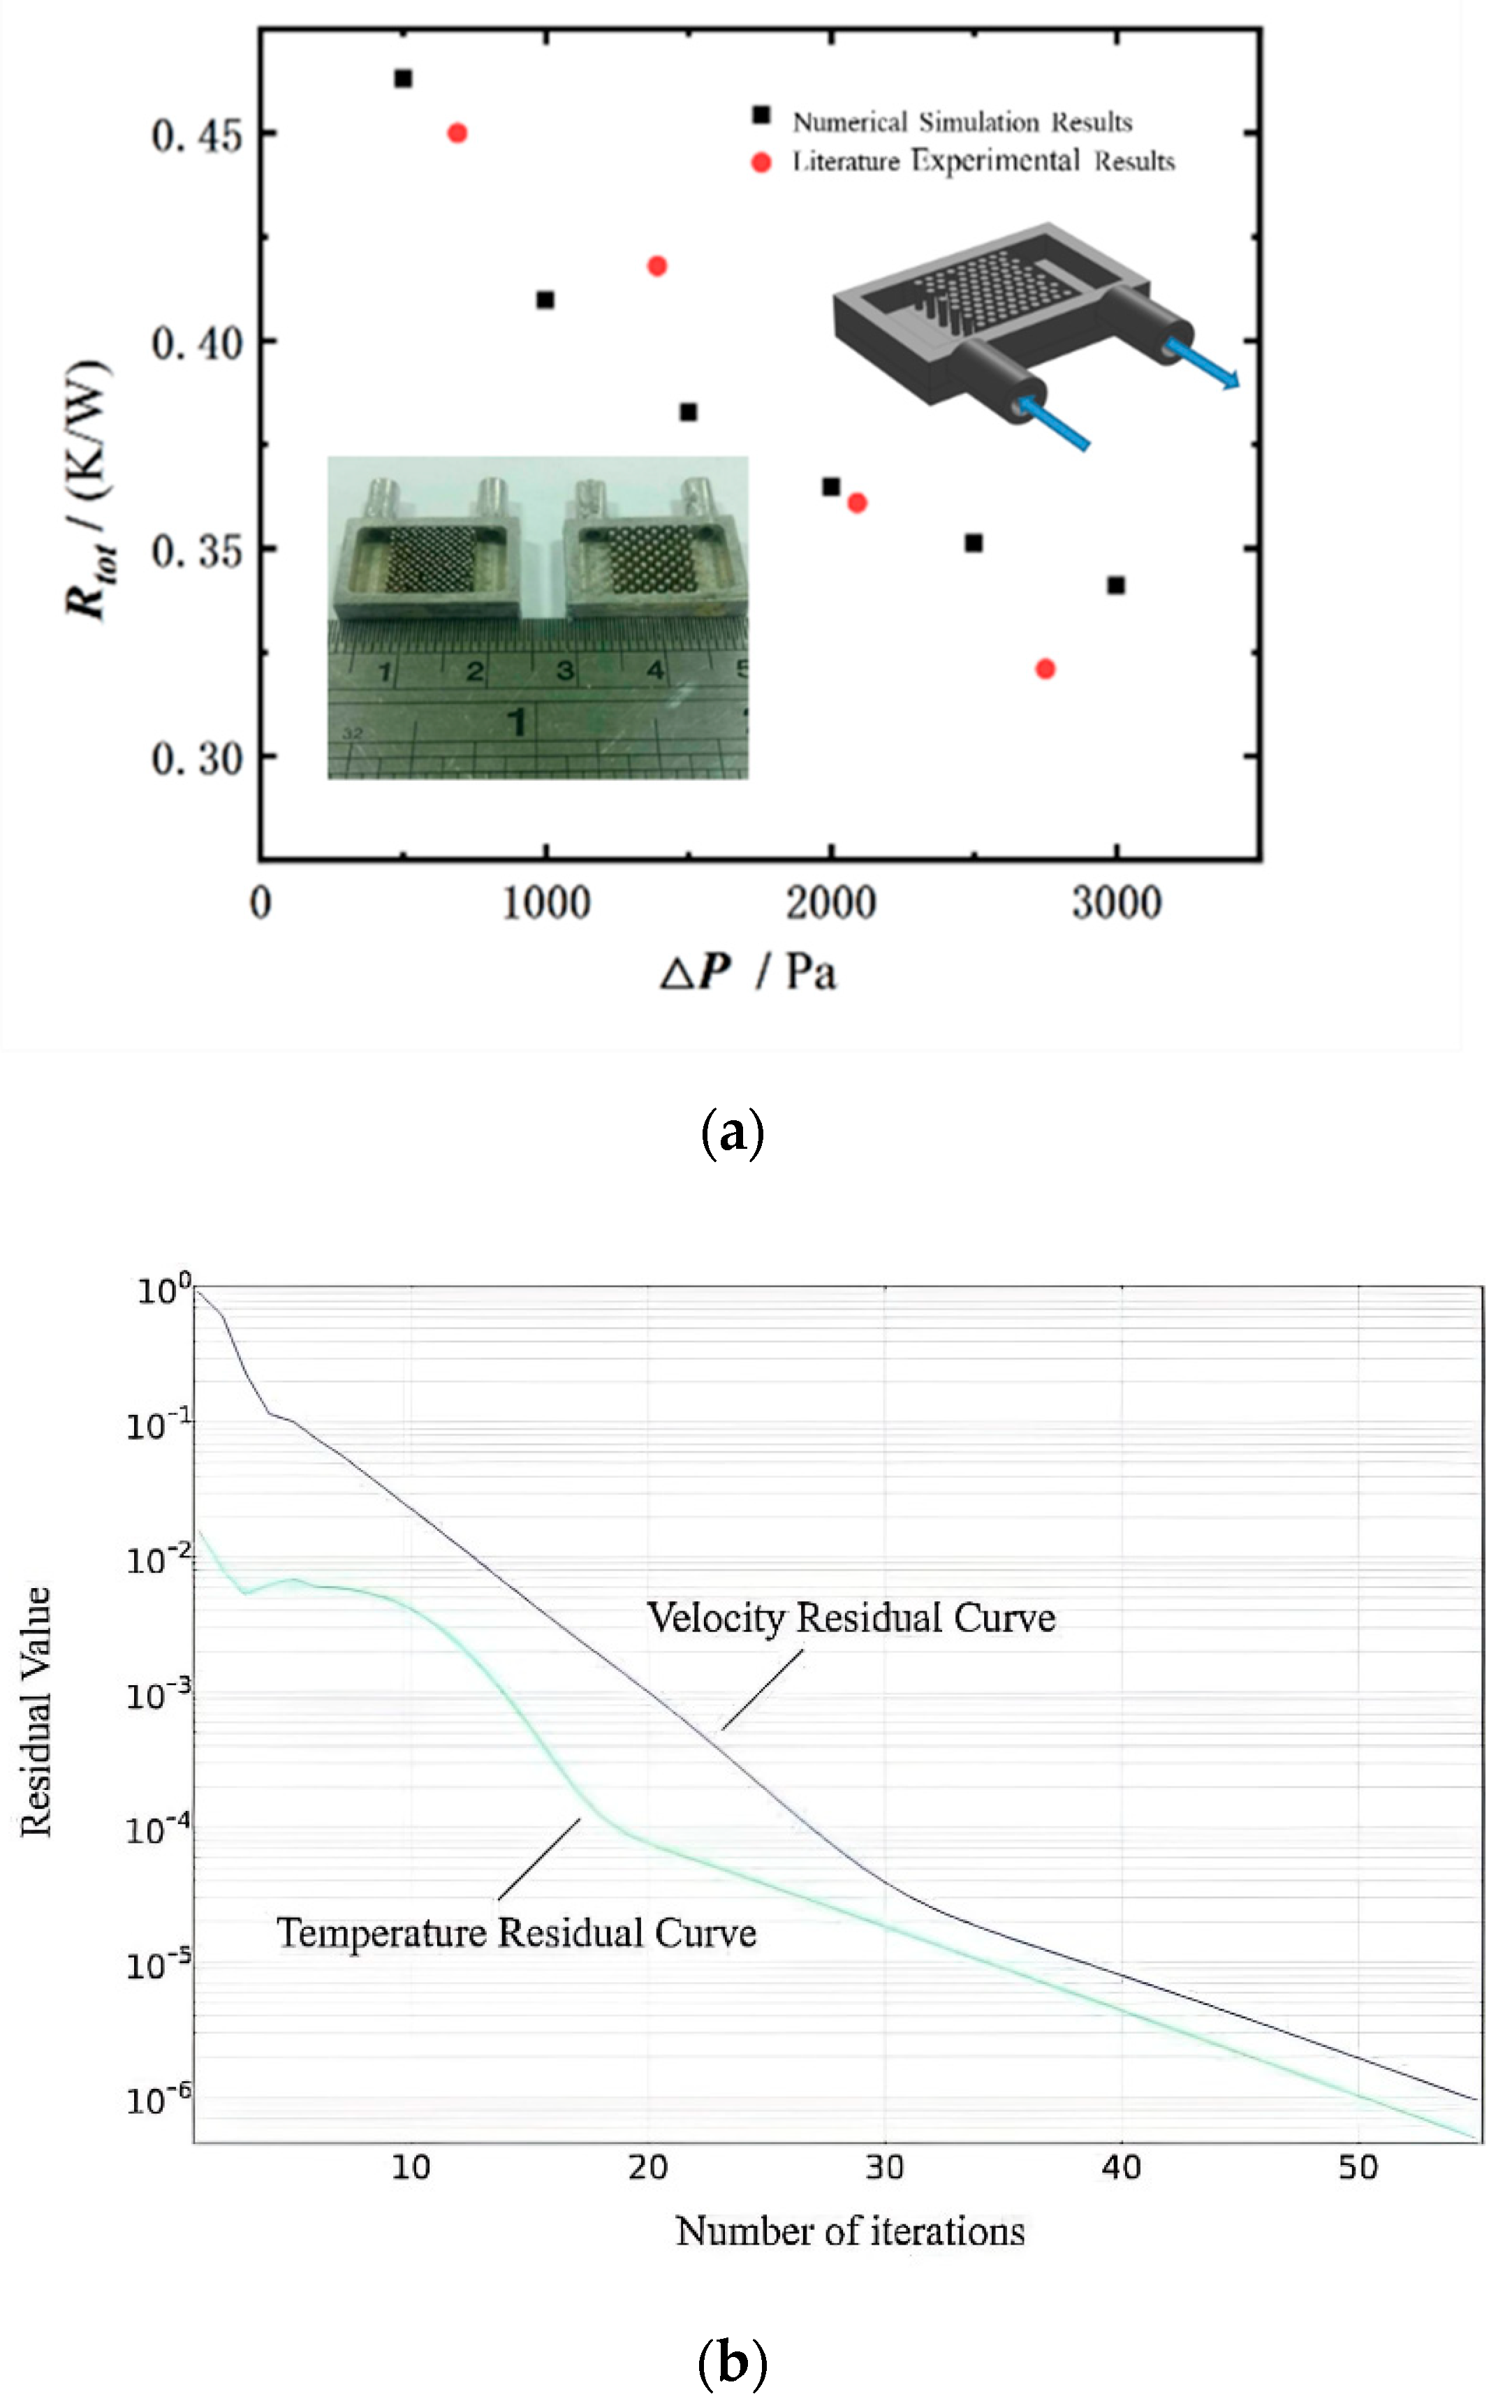
2.3. Model Validation
3. Optimization Method
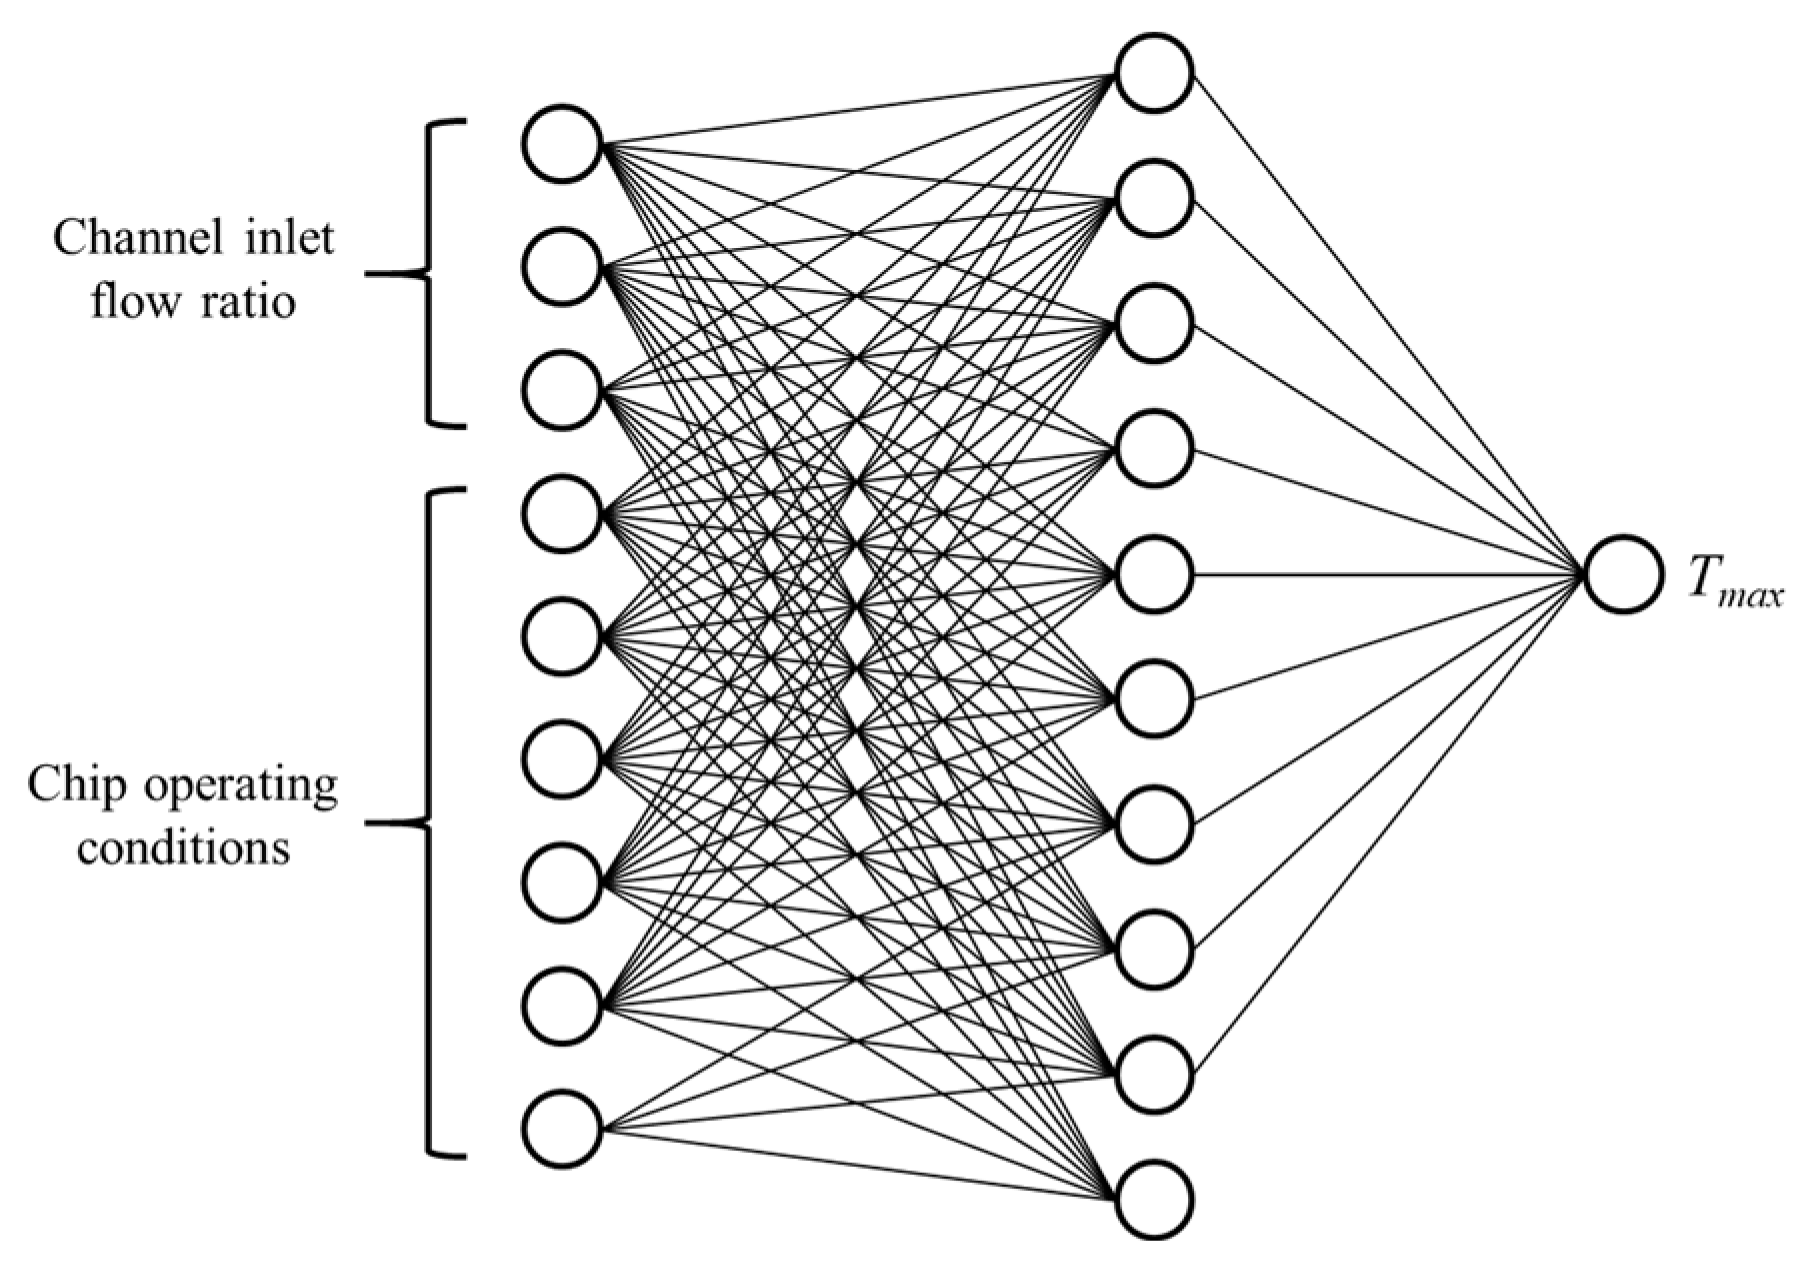
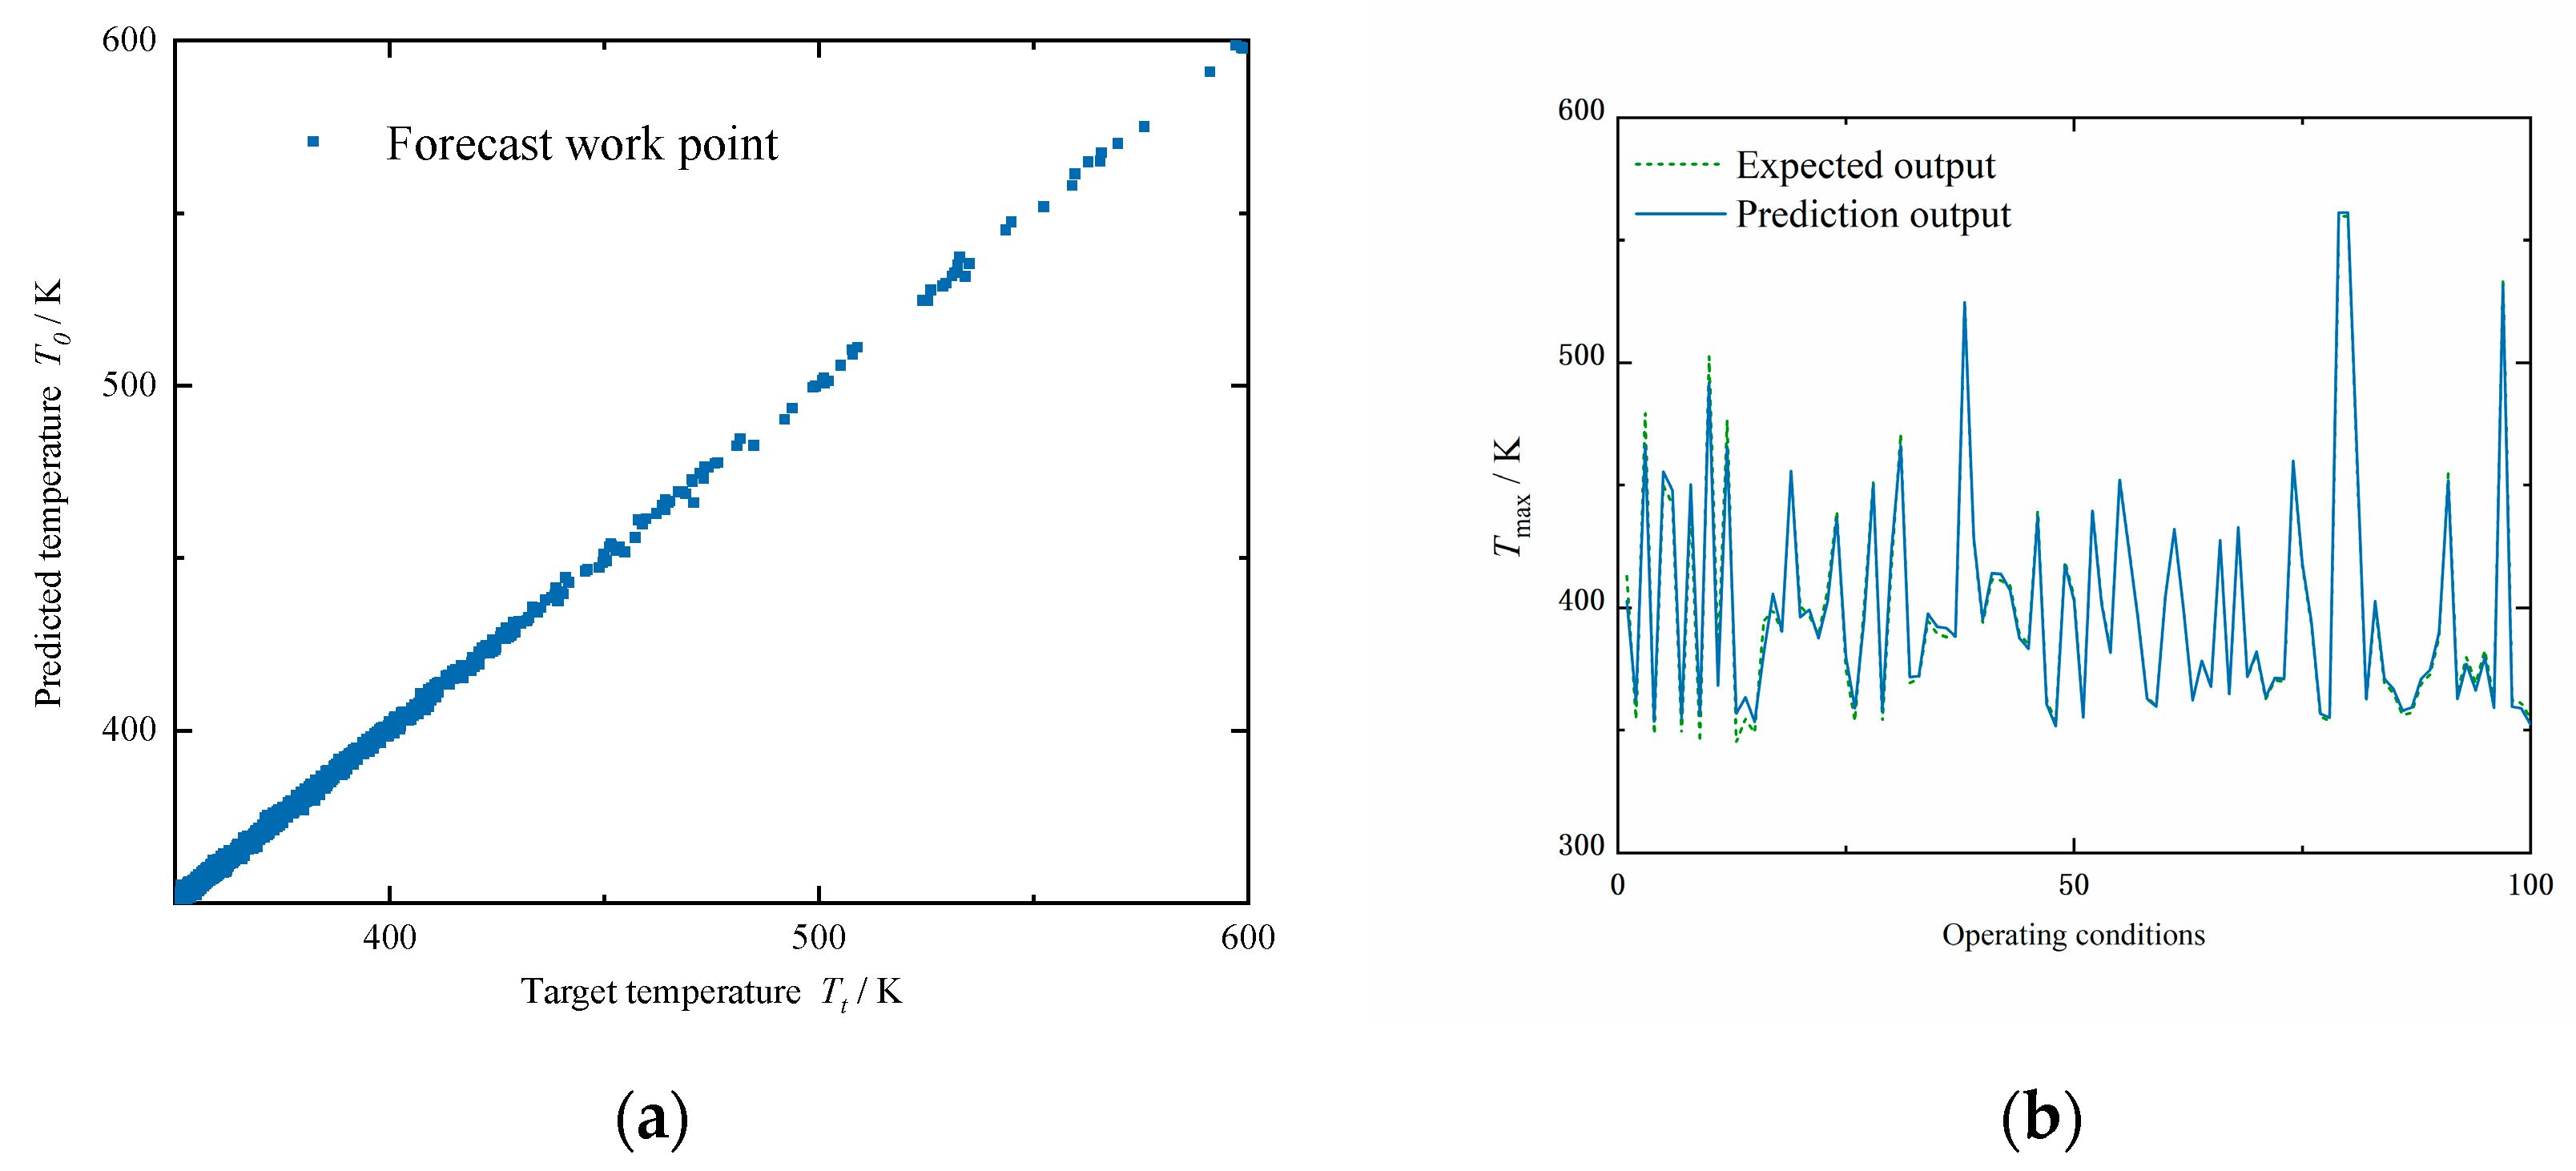
3.1. BP Neural Network Training
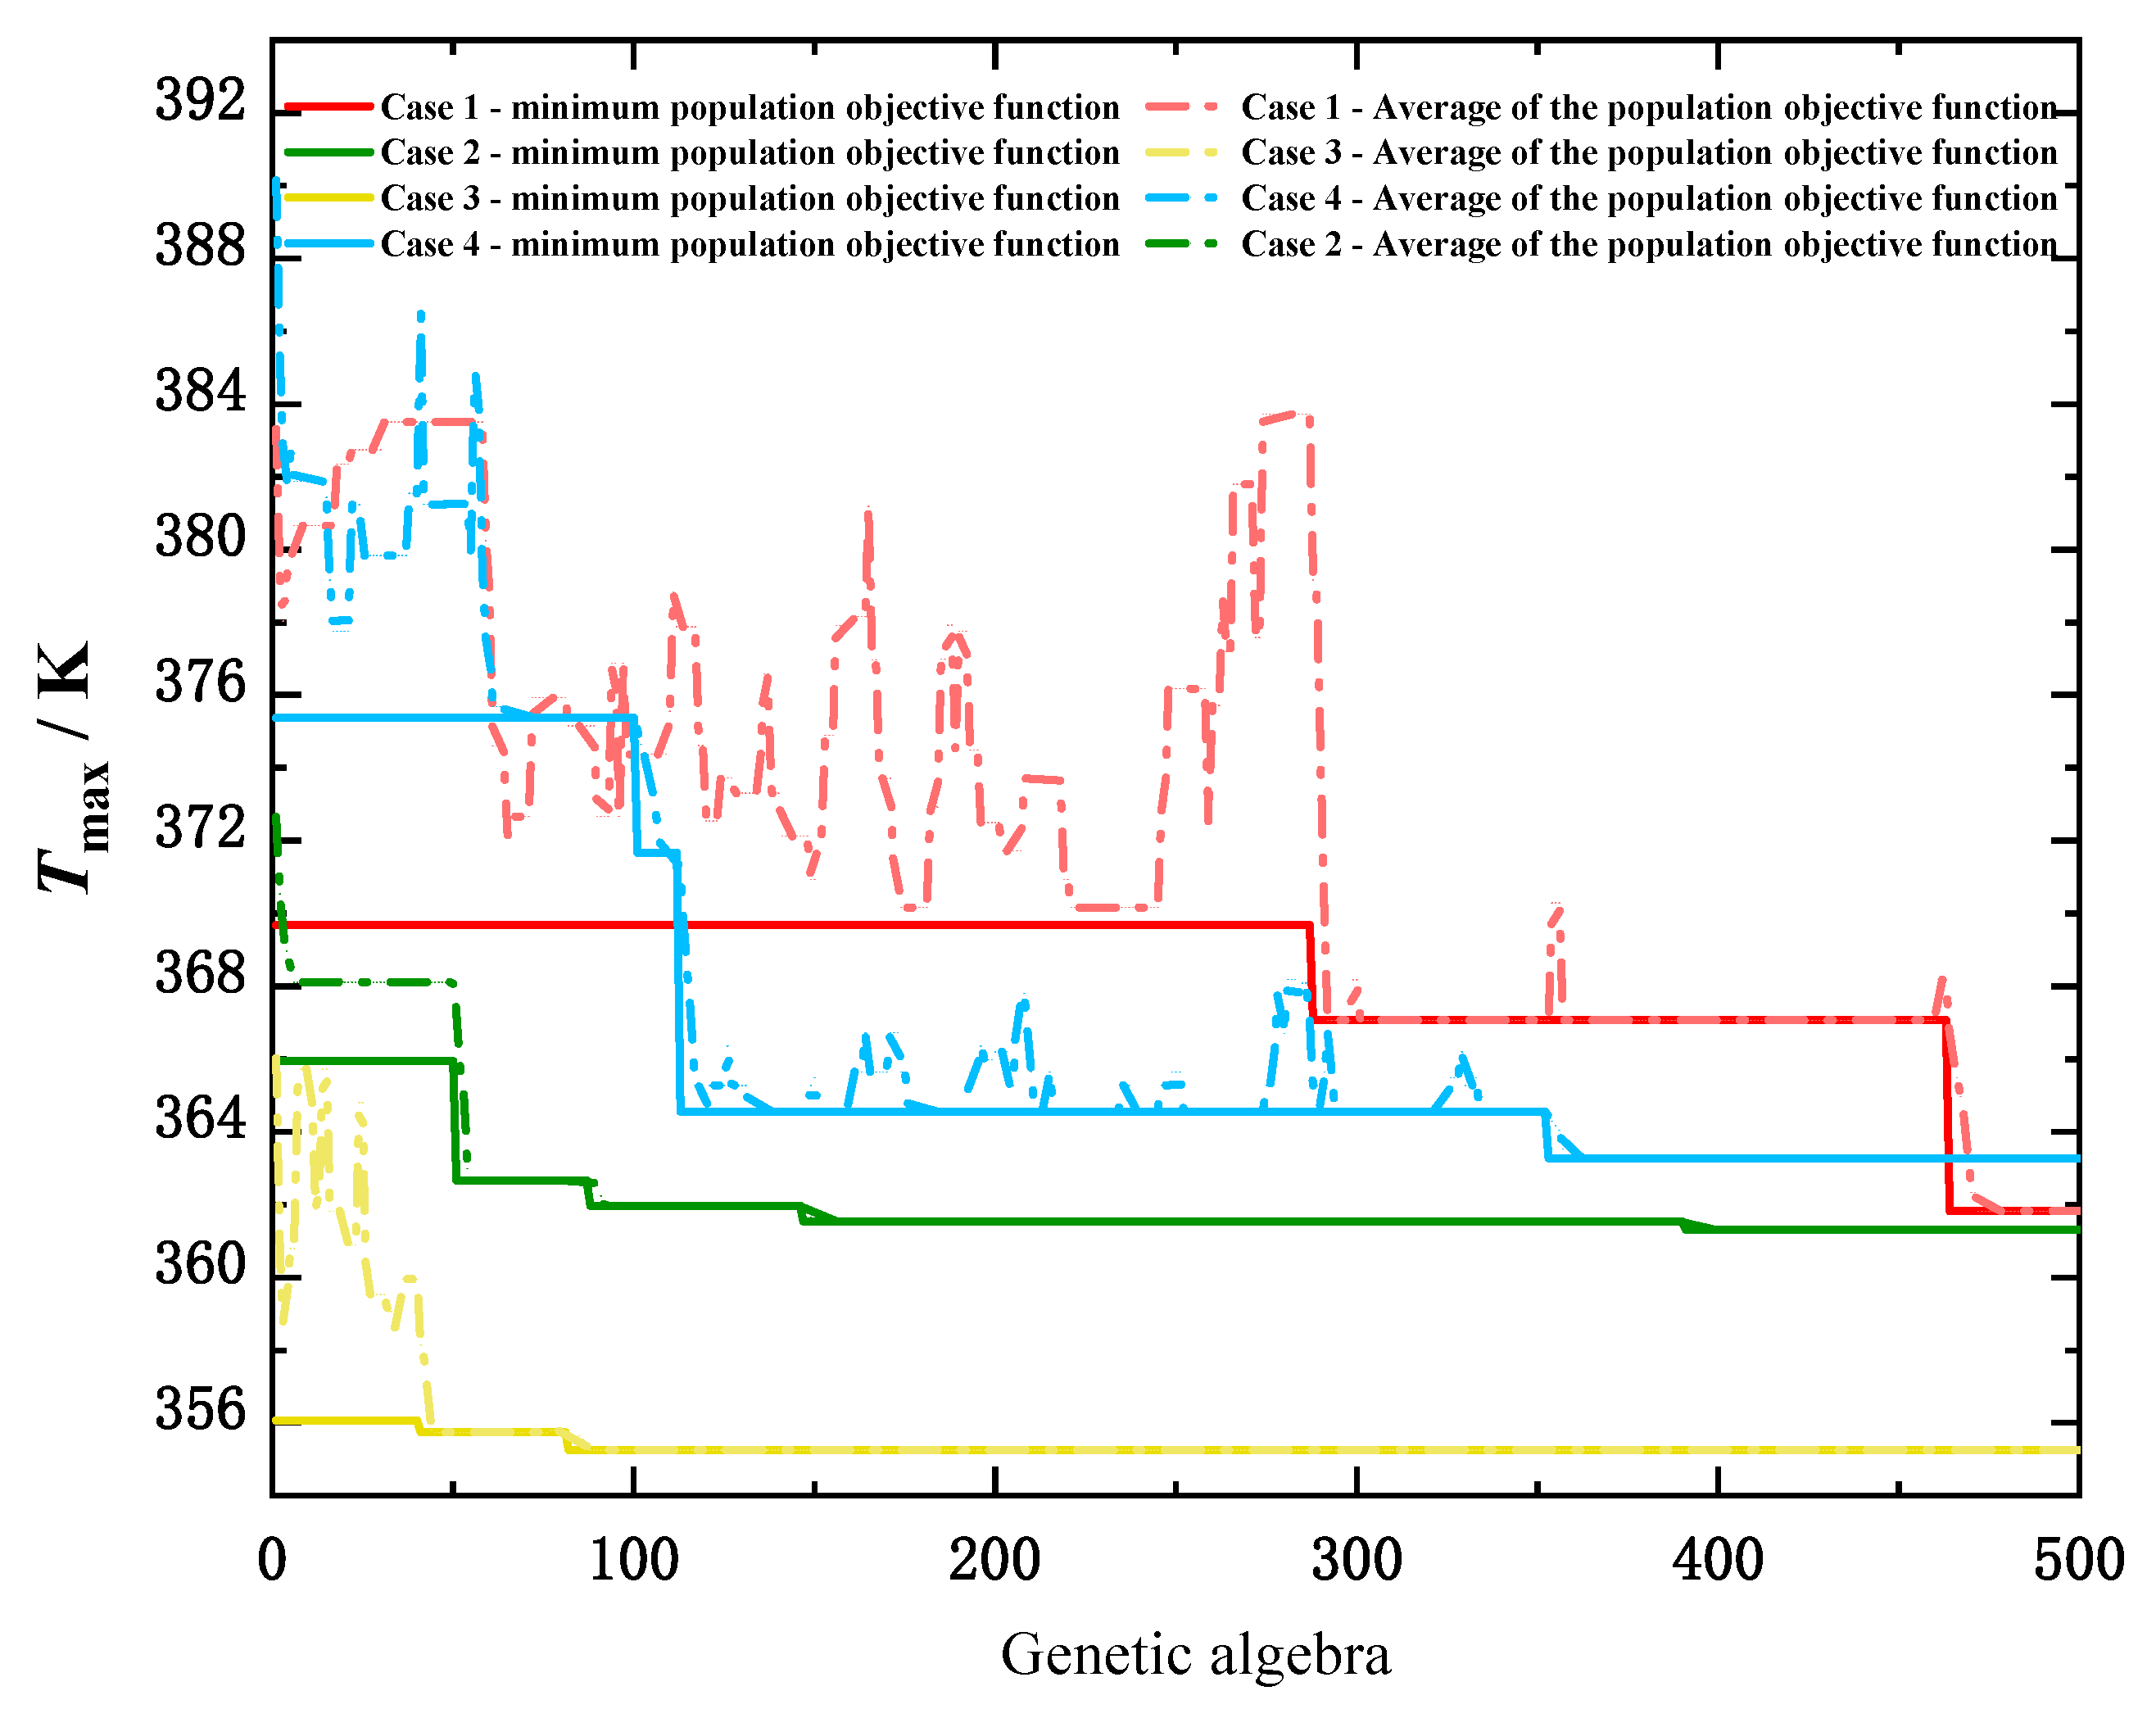
3.2. Genetic Algorithm Optimization
4. Result Analyses
5. Conclusions
Author Contributions
Funding
Acknowledgments
Conflicts of Interest
References
- Patti, R.S. Three-dimensional integrated circuits and the future of system-on-chip designs. Proc. IEEE 2006, 94, 1214–1224. [Google Scholar] [CrossRef]
- Wang, Z.Y. Microsystems using three-dimensional integration and TSV technologies: Fundamentals and applications. Microelectron. Eng. 2019, 210, 35–64. [Google Scholar] [CrossRef]
- Salvi, S.S.; Jain, A. A review of recent research on heat transfer in three-dimensional integrated circuits (3D ICs). Packag. Manuf. Technol. 2021, 12, 21–32. [Google Scholar]
- Tan, L.; Liu, P.; She, C.; Xu, P.; Yan, L.; Quan, H. Heat dissipation characteristics of IGBT module based on flow-solid coupling. Micromachines 2022, 13, 554. [Google Scholar] [CrossRef] [PubMed]
- Murshed, S.M.S.; De Castro, C.A.N. A critical review of traditional and emerging techniques and fluids for electronics cooling. Renew. Sustain. Energy Rev. 2017, 78, 821–833. [Google Scholar] [CrossRef]
- Lohrasbi, S.; Hammer, R.; Essl, W.; Reiss, G.; Defregger, S.; Sanz, W. A comprehensive review on the core thermal management improvement concepts in power electronics. IEEE Access 2020, 8, 166880–166906. [Google Scholar] [CrossRef]
- Nan, G.; Xie, Z.H.; Guan, X.N.; Ji, X.K.; Lin, D.G. Constructal design for the layout of multi-chip module based on thermal-flow-stress coupling calculation. Microelectron. Reliab. 2021, 127, 114417. [Google Scholar] [CrossRef]
- Tuckerman, D.B.; Pease, R.F.W. High-performance heat sinking for VLSI. IEEE Electron Device Lett. 1981, 2, 126–129. [Google Scholar] [CrossRef]
- Van, E.R.; Soleimanzadeh, R.; Nela, L.; Kampitsis, G.; Matioli, E. Co-designing electronics with microfluidics for more sustainable cooling. Nature 2020, 585, 211–216. [Google Scholar]
- Cai, G.C.; Liang, Y.M.; Liu, Z.C.; Liu, W. Design and optimization of bio-inspired wave-like channel for a PEM fuel cell applying genetic algorithm. Energy 2020, 192, 116670–116671. [Google Scholar] [CrossRef]
- Peng, Y.; Zhu, X.G.; Cao, B.; Luo, Y.Q.; Zhou, W.J. Heat transfer and permeability of the tree-like branching networks. Int. J. Heat Mass Transf. 2019, 129, 801–811. [Google Scholar] [CrossRef]
- Naqiuddin, N.H.; Saw, L.H.; Yew, M.C.; Yusof, F.; Ng, T.C.; Yew, M.K. Overview of micro-channel design for high heat flux application. Renew. Sustain. Energy Rev. 2018, 82, 901–914. [Google Scholar] [CrossRef]
- Martin, E.; Valeije, A.; Sastre, F.; Velazquez, A. Impact of channels aspect ratio on the heat transfer in finned heat sinks with tip clearance. Micromachines 2022, 13, 599. [Google Scholar] [CrossRef] [PubMed]
- Li, H.W.; Li, Y.J.; Huang, B.H.; Xu, T.T. Numerical investigation on the optimum thermal design of the shape and geometric parameters of microchannel heat exchangers with cavities. Micromachines 2020, 11, 721. [Google Scholar] [CrossRef]
- Feng, H.J.; Chen, L.G.; Xia, S.J. Constructal design for disc-shaped heat exchanger with maximum thermal efficiency. Int. J. Heat Mass Transf. 2019, 130, 740–746. [Google Scholar] [CrossRef]
- Yu, S.F.; Wang, S.Y.; Lu, M.; Zuo, L. A novel polyimide based micro heater with high temperature uniformity. Sens. Actuators A Phys. 2017, 257, 58–64. [Google Scholar] [CrossRef] [Green Version]
- Li, W.L.; Xie, Z.H.; Xi, K.; Xia, S.J.; Ge, Y.L. Constructal optimization of rectangular microchannel heat sink with porous medium for entropy generation minimization. Entropy 2021, 23, 1528. [Google Scholar] [CrossRef]
- Jiang, H.F.; Zhang, Q.; Shi, L. Effective thermal conductivity of carbon nanotube-based nanofluid. J. Taiwan Inst. Chem. Eng. 2015, 55, 76–81. [Google Scholar] [CrossRef]
- Ma, Y.; Yan, H.B.; Xie, G.N. Flow and thermal performance of sandwich panels with plate fins or/and pyramidal lattice. Appl. Therm. Eng. 2019, 164, 114468. [Google Scholar] [CrossRef]
- Deng, S.; Xiao, T. Transient two-layer electroosmotic flow and heat transfer of power-law nanofluids in a microchannel. Micromachines 2022, 13, 405. [Google Scholar] [CrossRef]
- Wu, J.M.; Zhao, J.Y.; Lei, J.; Liu, B. Effectiveness of nanofluid on improving the performance of microchannel heat sink. Appl. Therm. Eng. 2016, 101, 402–412. [Google Scholar] [CrossRef]
- Bayer, Ö.; Oskouei, S.B.; Aradag, S. Investigation of double-layered wavy microchannel heat sinks utilizing porous ribs with artificial neural networks. Int. Commun. Heat Mass Transf. 2022, 134, 105984. [Google Scholar] [CrossRef]
- Tafarroj, M.M.; Mahian, O.; Kasaeian, A.; Sakamatapan, K.; Dalkilic, A.S.; Wongwises, S. Artificial neural network modeling of nanofluid flow in a microchannel heat sink using experimental data. Int. Commun. Heat Mass Transf. 2017, 86, 25–31. [Google Scholar] [CrossRef]
- Chen, C.; You, J.; Feng, H.J.; Chen, L.G. A multi-objective study on the constructal design of non-uniform heat generating disc cooled by radial-and dendritic-pattern cooling channels. Sci. China Technol. Sci. 2021, 64, 729–744. [Google Scholar] [CrossRef]
- Wang, T.H.; Wu, H.C.; Meng, J.H.; Yan, W.M. Optimization of a double-layered microchannel heat sink with semi-porous-ribs by multi-objective genetic algorithm. Int. J. Heat Mass Transf. 2020, 149, 119217. [Google Scholar] [CrossRef]
- Wei, J. Challenges in cooling design of CPU packages for high-performance servers. Heat Transf. Eng. 2008, 29, 178–187. [Google Scholar] [CrossRef]
- Cetkin, E.; Lorente, S.; Bejan, A. Vascularization for cooling a plate heated by a randomly moving source. J. Appl. Phys. 2012, 112, 084906. [Google Scholar] [CrossRef]
- Sharma, C.S.; Tiwari, M.K.; Zimmermann, S.; Brunschwiler, T.; Schlottig, G.; Michel, B.; Poulikakos, D. Energy efficient hotspot-targeted embedded liquid cooling of electronics. Appl. Energy 2015, 138, 414–422. [Google Scholar] [CrossRef]
- Ansari, D.; Kim, K.Y. Performance analysis of double-layer microchannel heat sinks under non-uniform heating conditions with random hotspots. Micromachines 2017, 8, 54. [Google Scholar] [CrossRef]
- Li, X.; Xuan, Y. Self-adaptive cooling of chips with unevenly distributed high heat fluxes. Appl. Therm. Eng. 2022, 202, 117913. [Google Scholar] [CrossRef]
- Li, Y.S.; Li, E.P.; Yu, H.; Oh, H.J.; Bakir, M.S.; Swaminathan, M. Machine learning for 3D-IC electric-thermal simulation and management. In Proceedings of the 2018 IEEE International Conference on Computational Electromagnetics (ICCEM), Chengdu, China, 26–28 March 2018; p. 18182967. [Google Scholar]
- Chiu, H.C.; Hsieh, R.H.; Wang, K.; Jang, J.; Yu, C. The heat transfer characteristics of liquid cooling heat sink with micro pin fins. Int. Commun. Heat Mass Transf. 2017, 86, 174–180. [Google Scholar] [CrossRef]


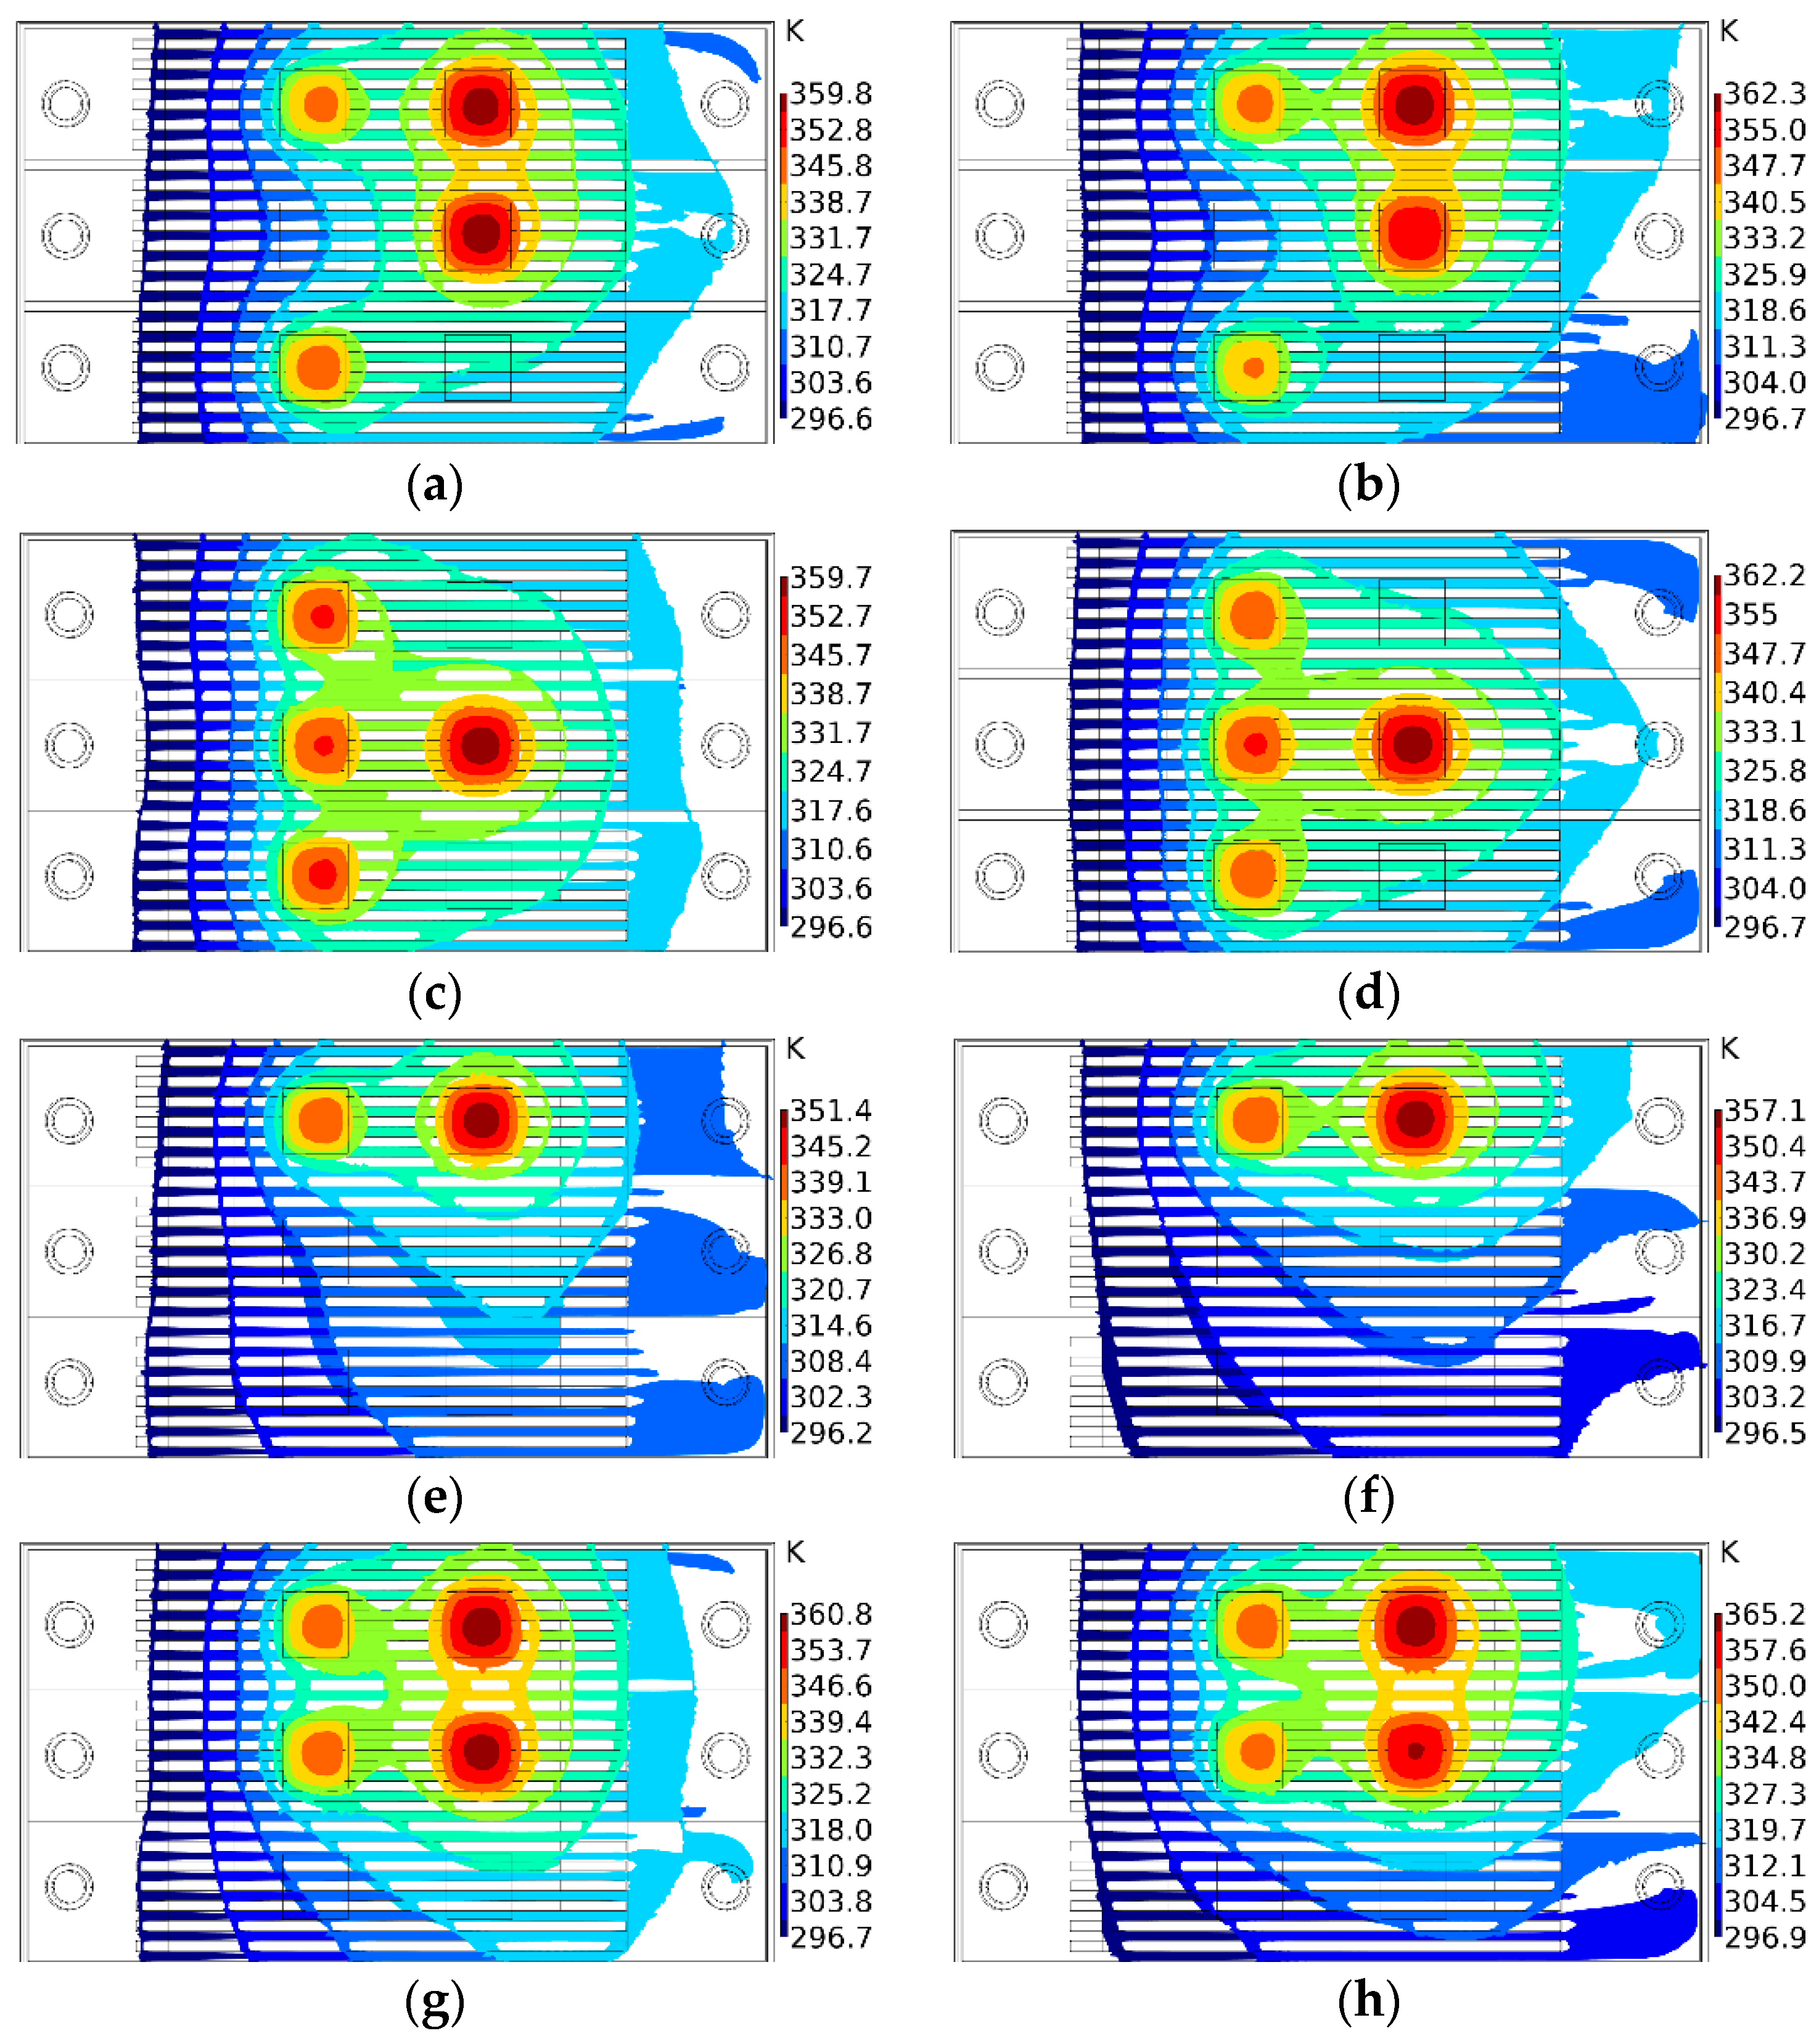
| Chip Condition | Core 1 | Core 2 | Core 3 | Core 4 | Core 5 | Core 6 |
|---|---|---|---|---|---|---|
| Case 1 | Running | Not running | Not running | Running | Running | Running |
| Case 2 | Running | Not running | Running | Running | Running | Not running |
| Case 3 | Not running | Not running | Not running | Not running | Running | Running |
| Case 4 | Not running | Not running | Running | Running | Running | Running |
| Chip Condition | Flow Distribution | Maximum Temperature | Residual Value |
|---|---|---|---|
| Case 1 after optimization | 29:29:42 | 363.38 K | 2.63 K |
| Case 1 before optimization | 1:1:1 | 366.01 K | |
| Case 2 after optimization | 25:48:27 | 363.29 K | 2.63 K |
| Case 2 before optimization | 1:1:1 | 365.92 K | |
| Case 3 after optimization | 14:29:57 | 354.5 K | 6.06 K |
| Case 3 before optimization | 1:1:1 | 360.56 K | |
| Case 4 after optimization | 14:43:43 | 364.41 K | 4.63 K |
| Case 4 before optimization | 1:1:1 | 369.04 K |
Publisher’s Note: MDPI stays neutral with regard to jurisdictional claims in published maps and institutional affiliations. |
© 2022 by the authors. Licensee MDPI, Basel, Switzerland. This article is an open access article distributed under the terms and conditions of the Creative Commons Attribution (CC BY) license (https://creativecommons.org/licenses/by/4.0/).
Share and Cite
Zhang, J.; Xie, Z.; Lu, Z.; Li, P.; Xi, K. Research on Intelligent Distribution of Liquid Flow Rate in Embedded Channels for Cooling 3D Multi-Core Chips. Micromachines 2022, 13, 918. https://doi.org/10.3390/mi13060918
Zhang J, Xie Z, Lu Z, Li P, Xi K. Research on Intelligent Distribution of Liquid Flow Rate in Embedded Channels for Cooling 3D Multi-Core Chips. Micromachines. 2022; 13(6):918. https://doi.org/10.3390/mi13060918
Chicago/Turabian StyleZhang, Jian, Zhihui Xie, Zhuoqun Lu, Penglei Li, and Kun Xi. 2022. "Research on Intelligent Distribution of Liquid Flow Rate in Embedded Channels for Cooling 3D Multi-Core Chips" Micromachines 13, no. 6: 918. https://doi.org/10.3390/mi13060918