
Investigation of Material Removal Distributions and Surface Morphology Evolution in Non-Contact Ultrasonic Abrasive Machining (NUAM) of BK7 Optical Glasses

Abstract
:1. Introduction
2. Analysis of Material Removal Distribution under NUAM
2.1. Theory of Cavitation
2.2. Simulation of Cavitation
2.3. Removal Theory Using Fluid Scouring
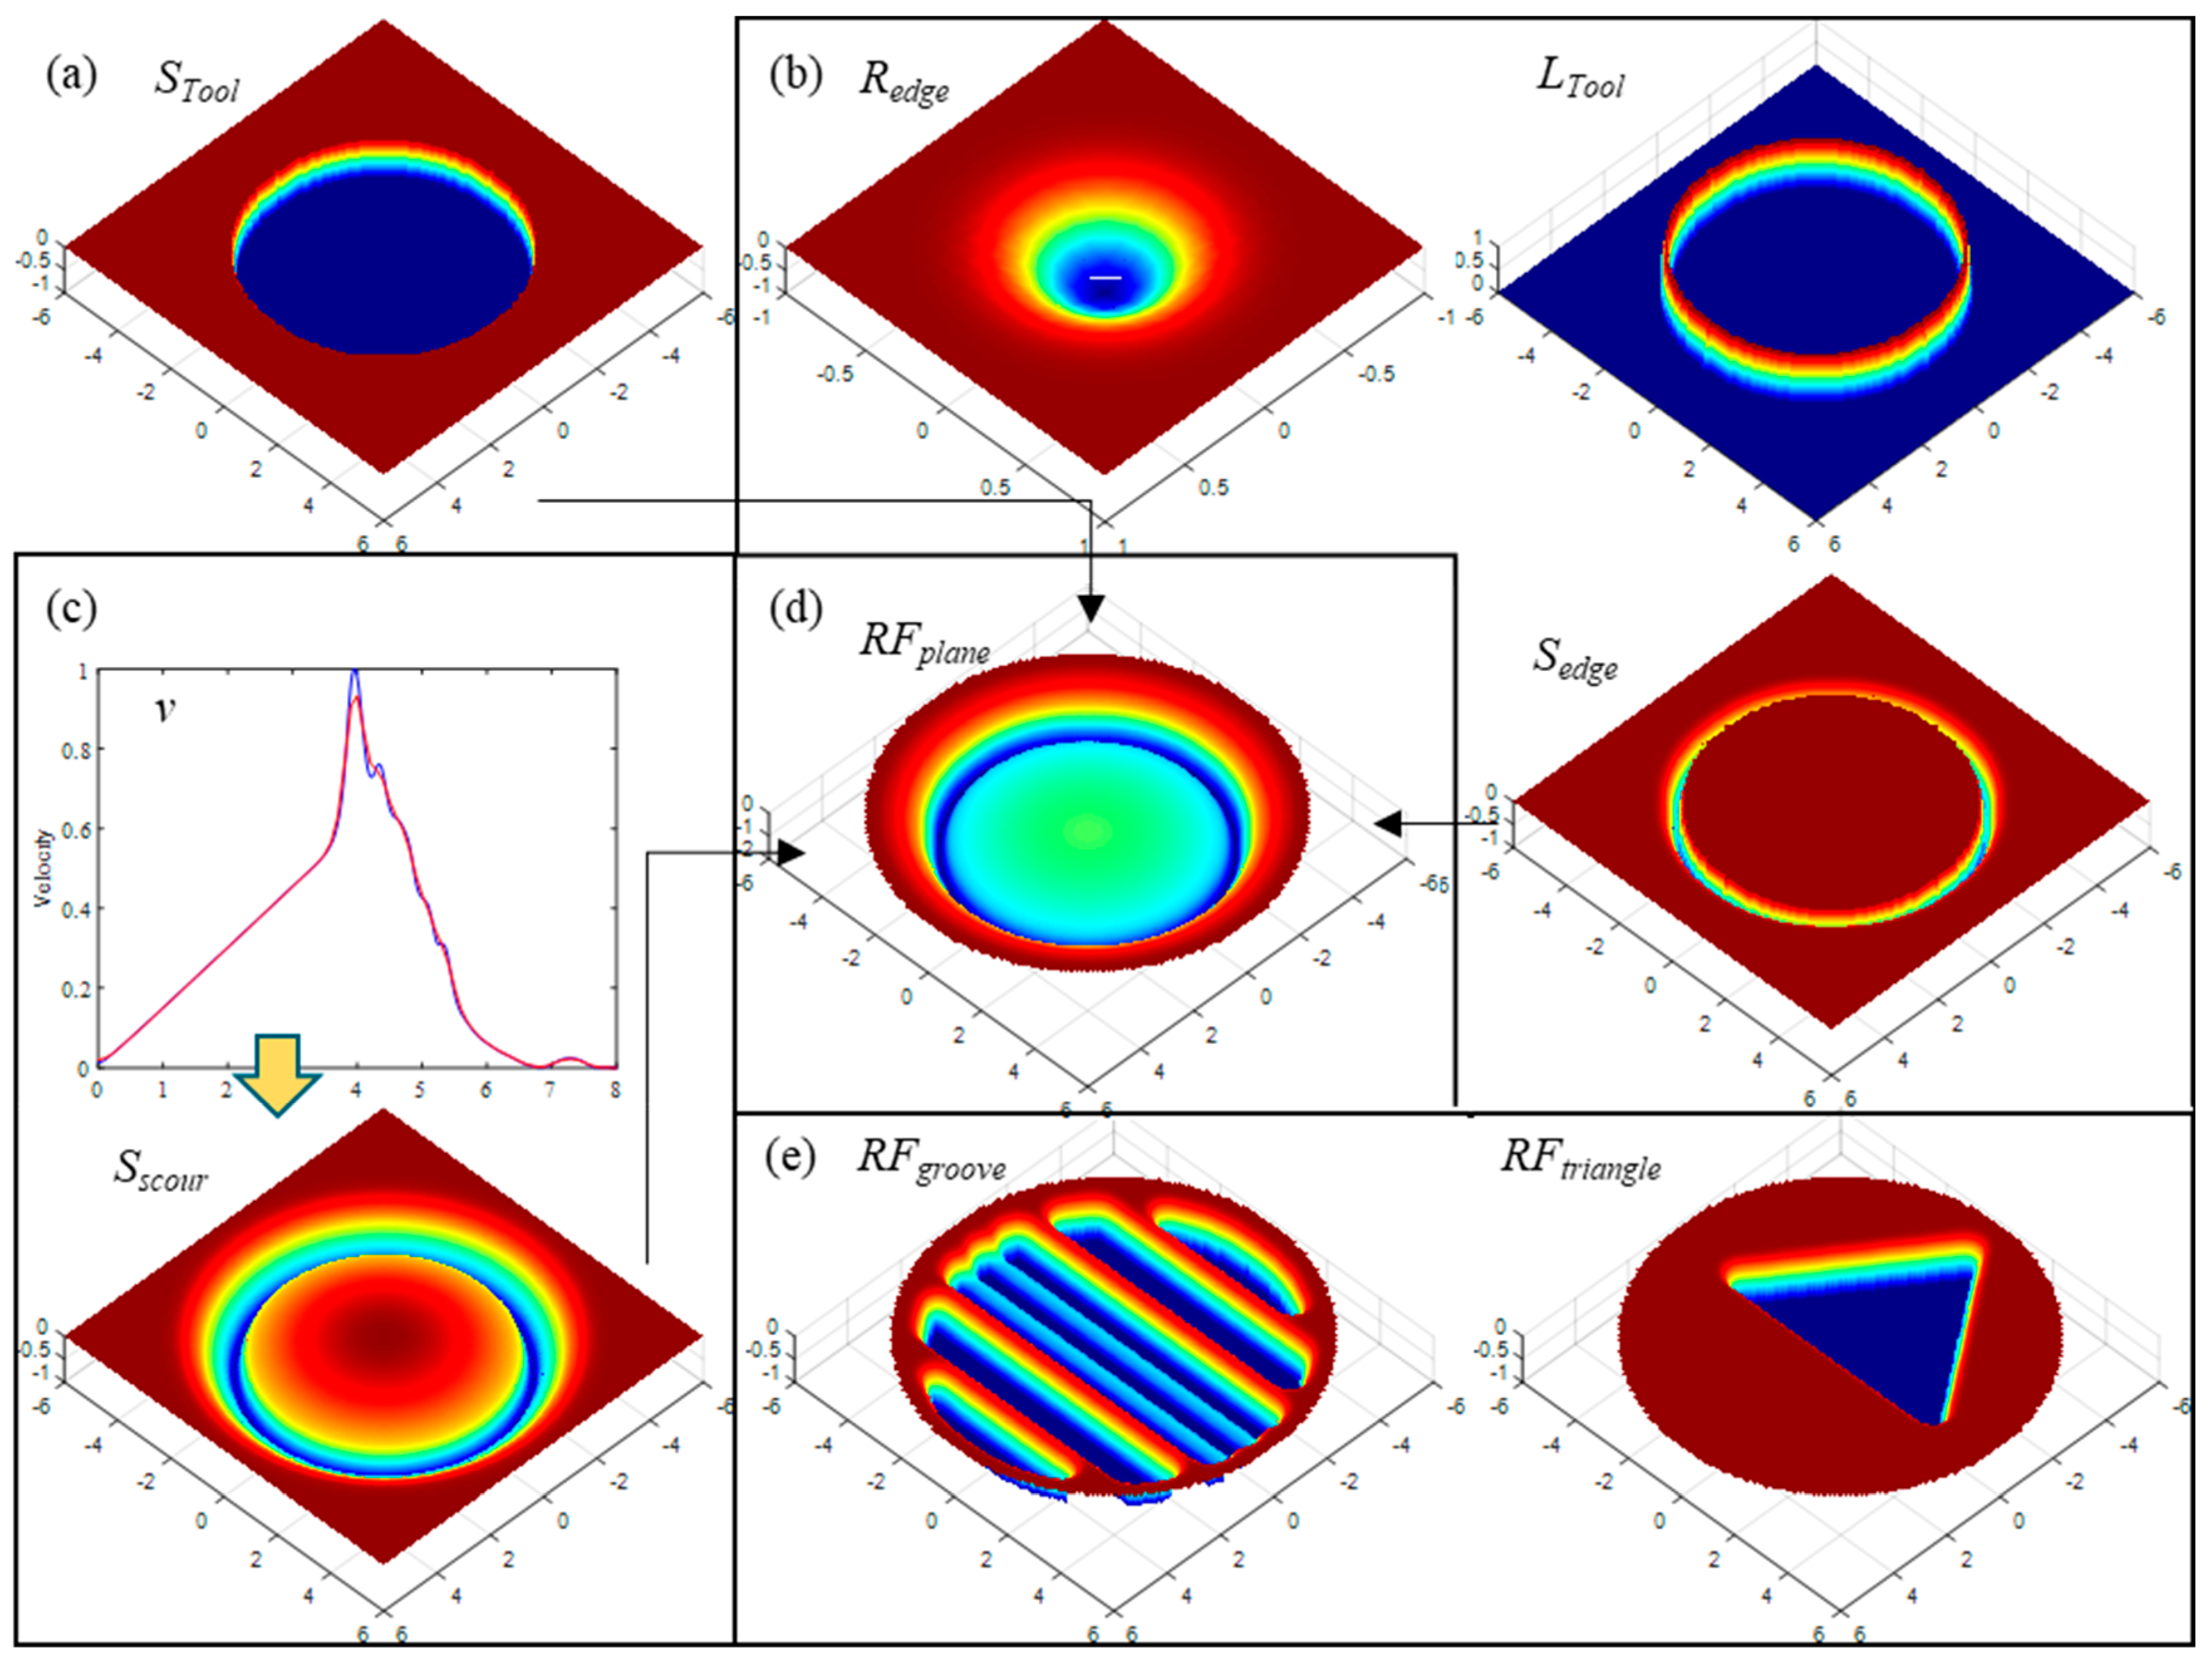
2.4. Prediction of the Material Removal Distribution
3. Experimental Research and Results Analysis
3.1. Experimental Preparation
3.2. Material Removal Distribution
3.2.1. Under the Action of the Plane Tool
3.2.2. Under the Action of the Tool with a Complex Structure
3.2.3. Interaction Analysis of the Removal Pits
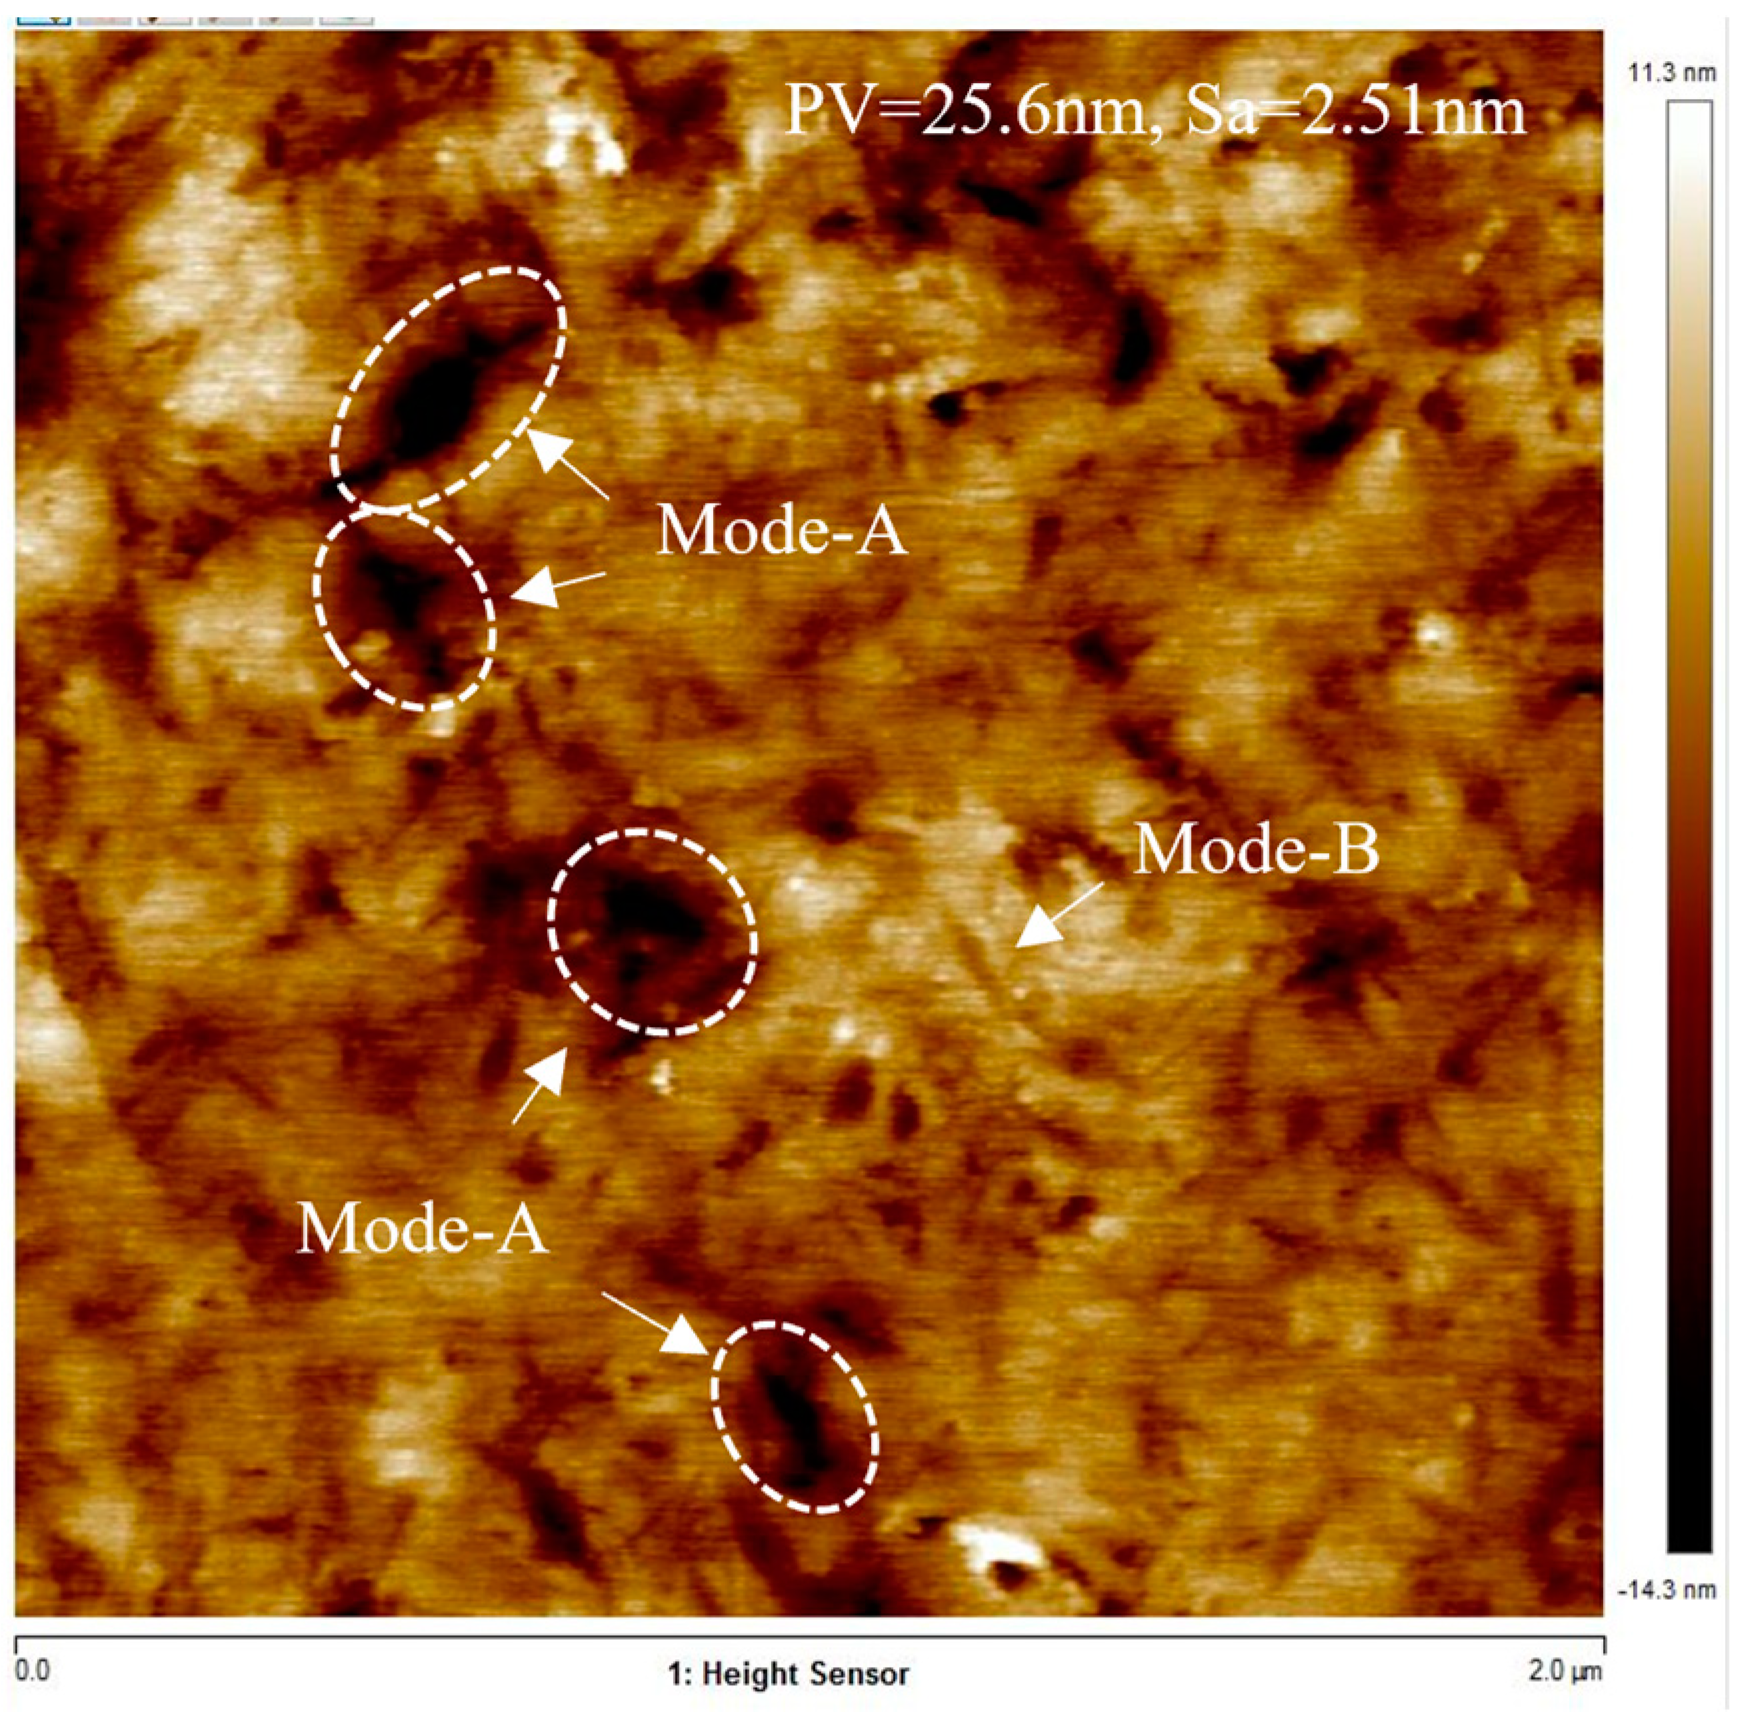
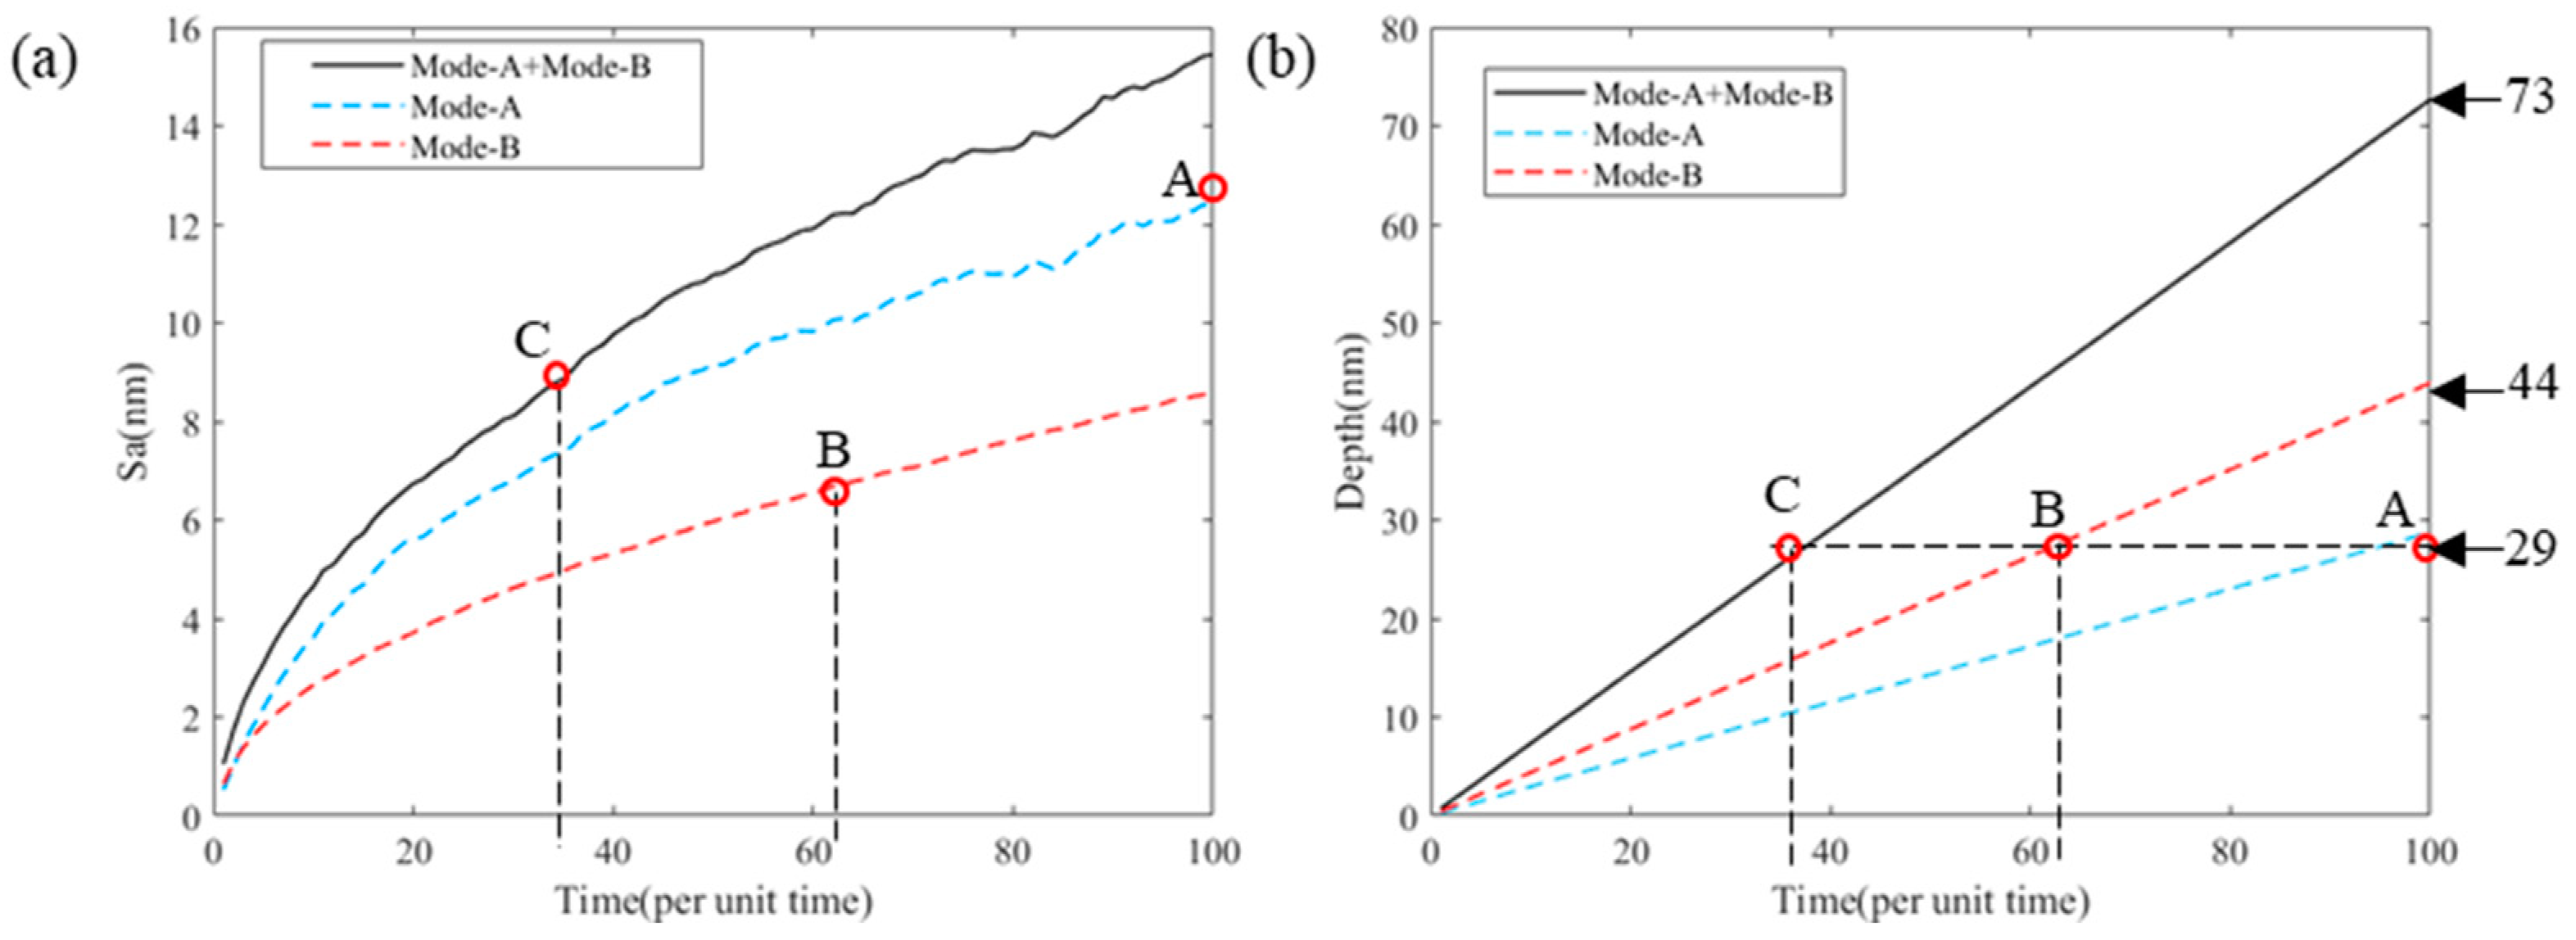
3.3. Removal Depth and Surface Morphology
4. Modeling of Material Removal Distributions and Surface Morphology
4.1. Material Removal Distributions Model
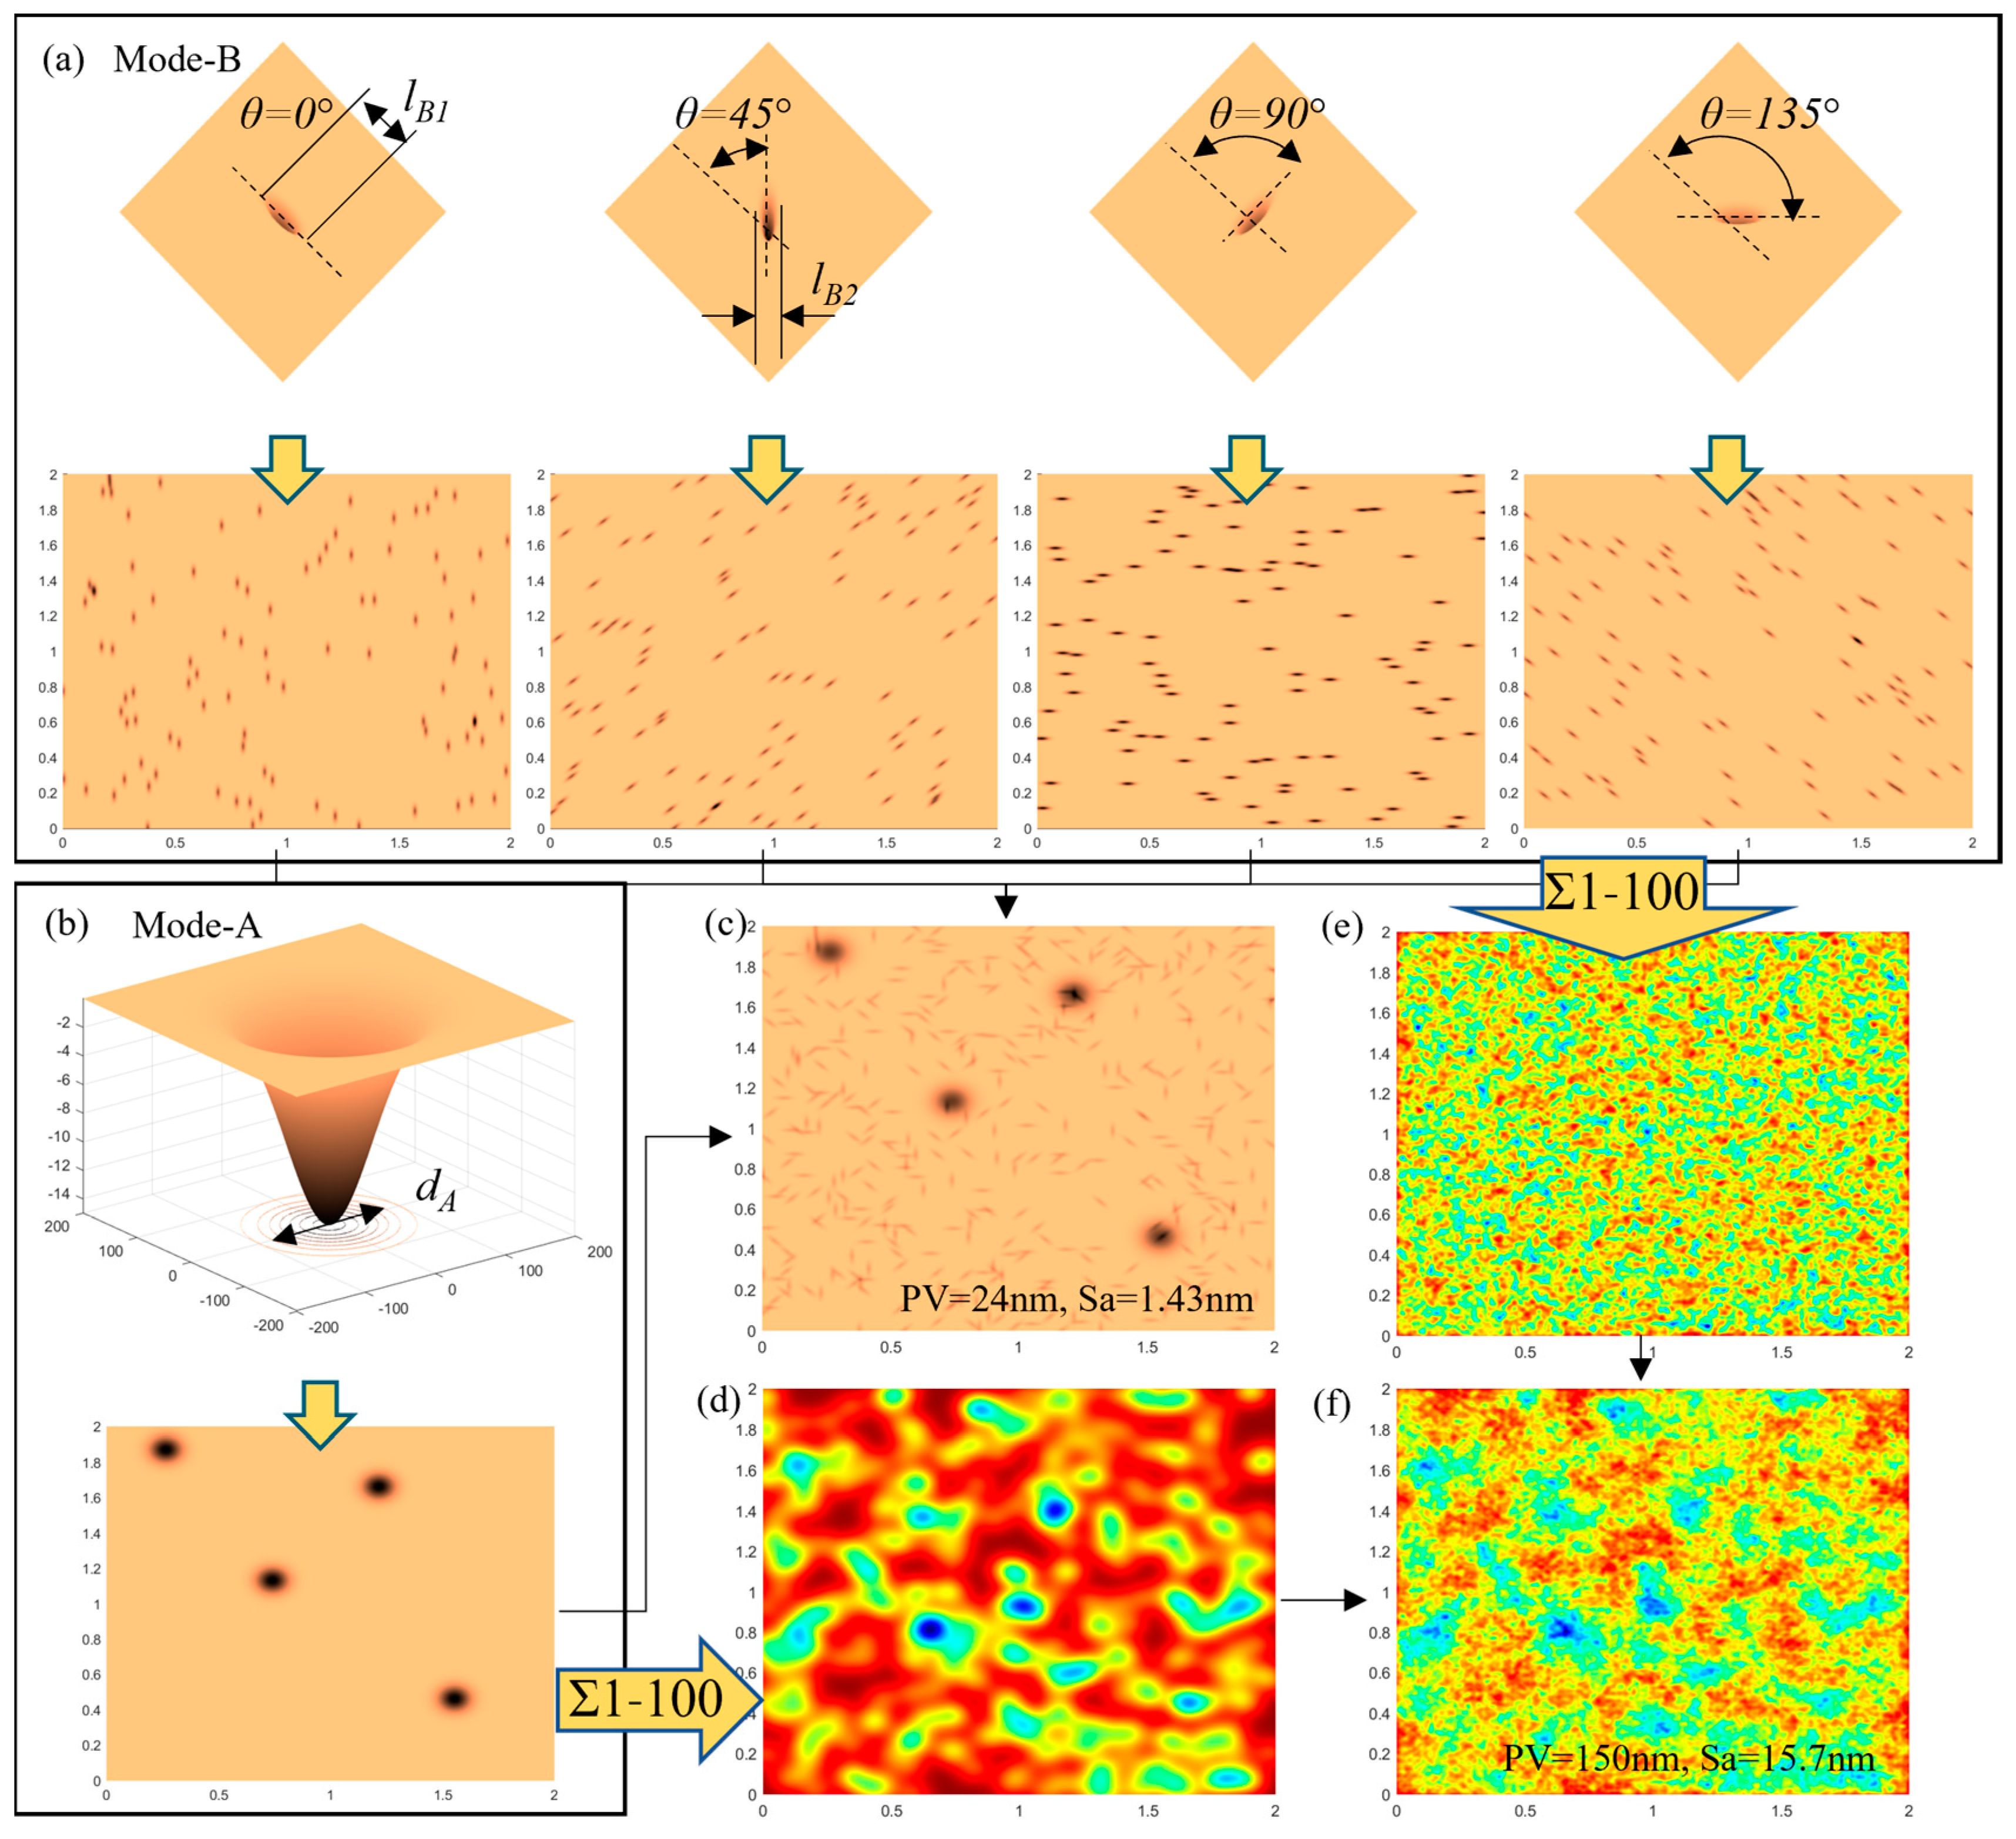
4.2. Evolution of the Surface Micromorphology
5. Conclusions
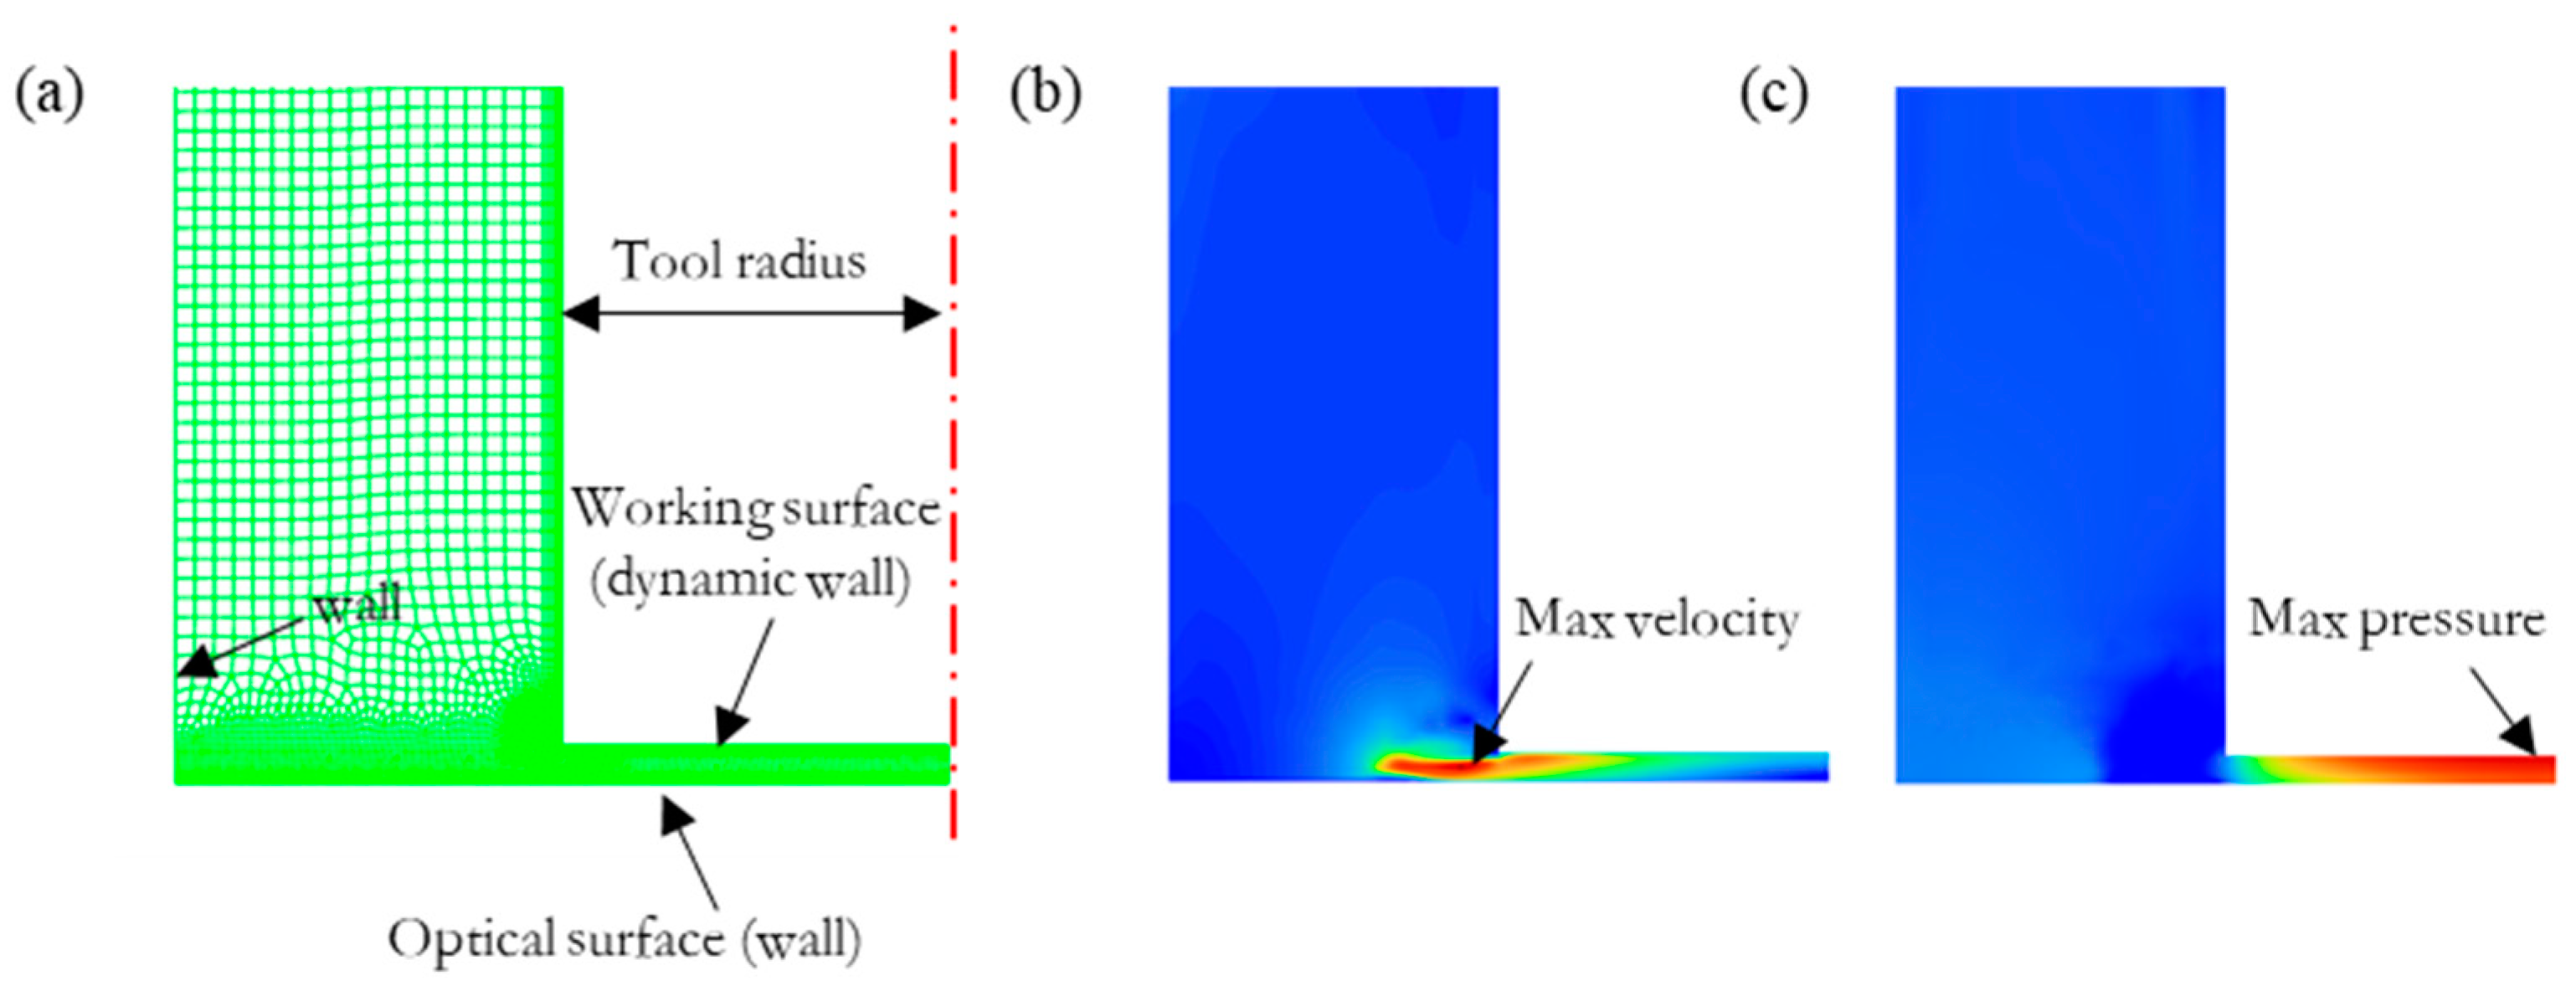
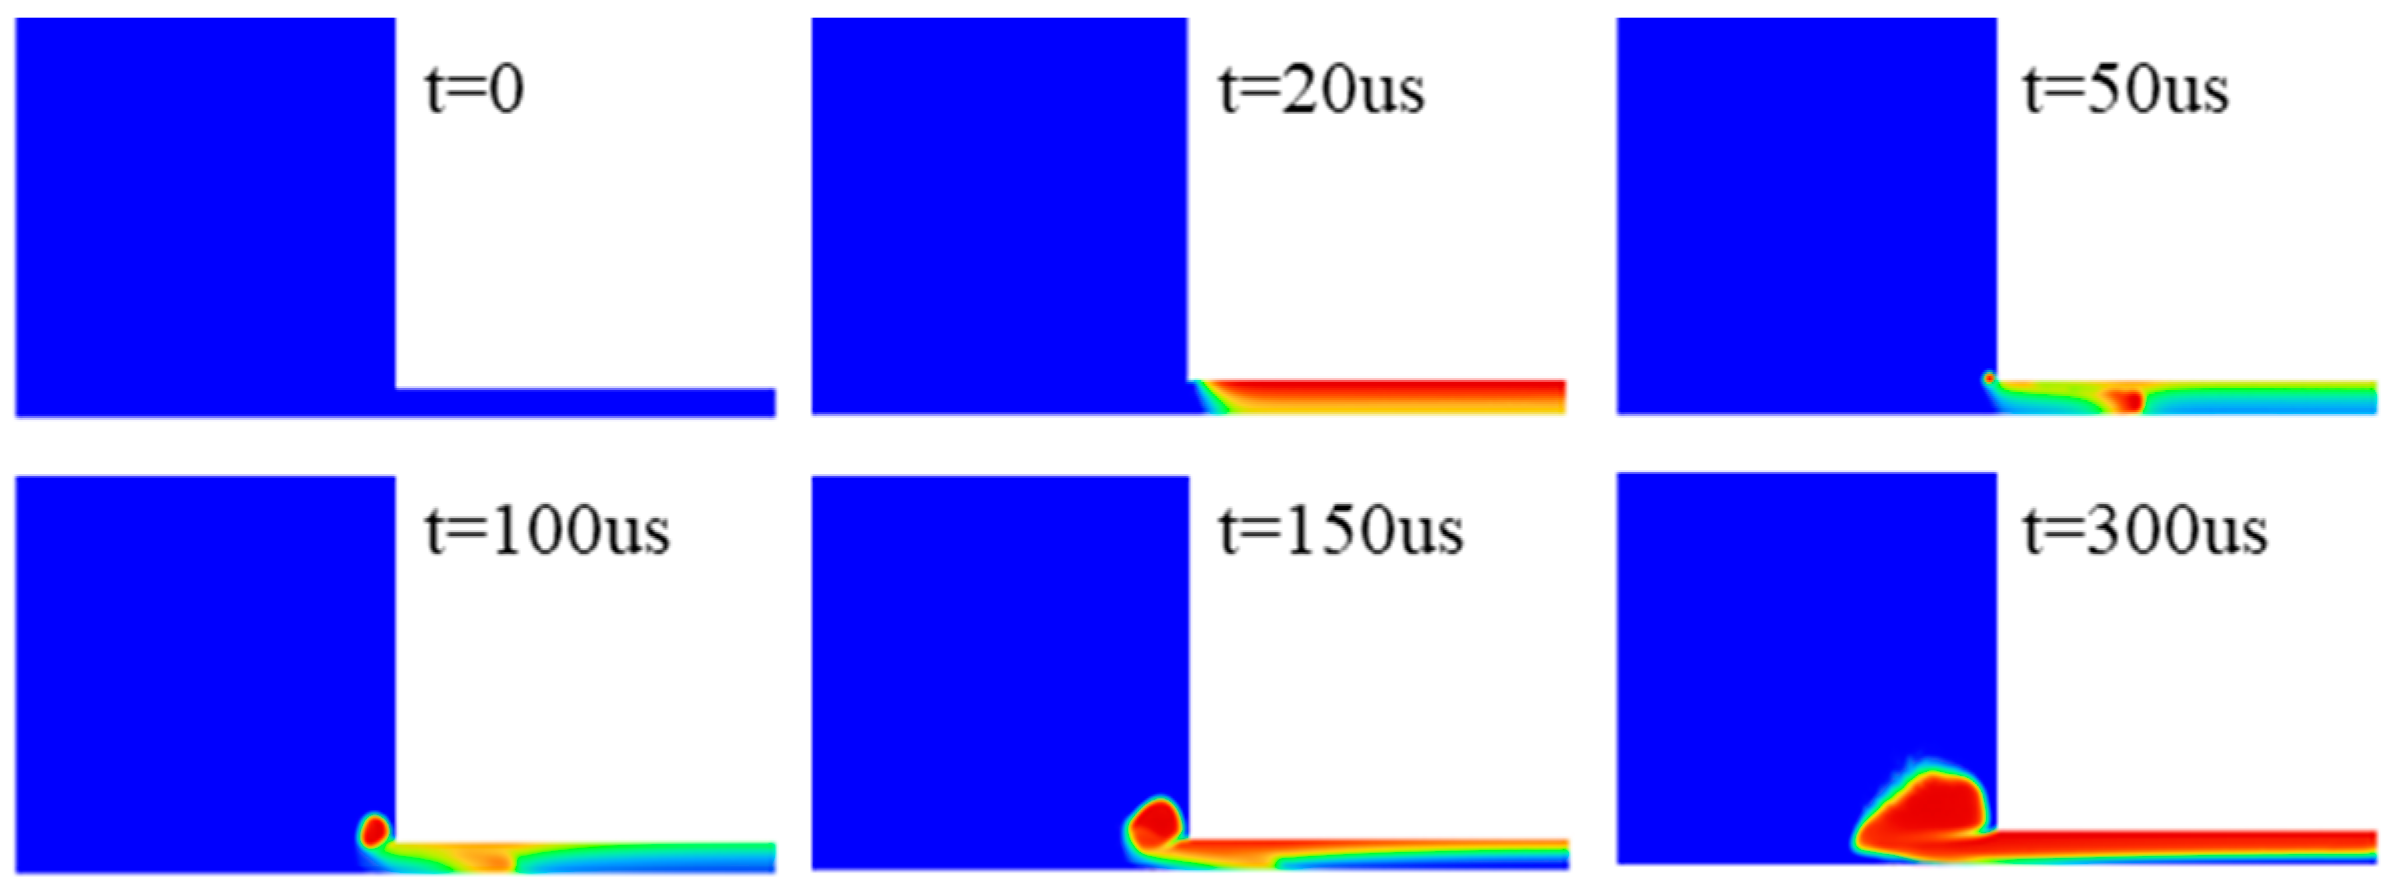
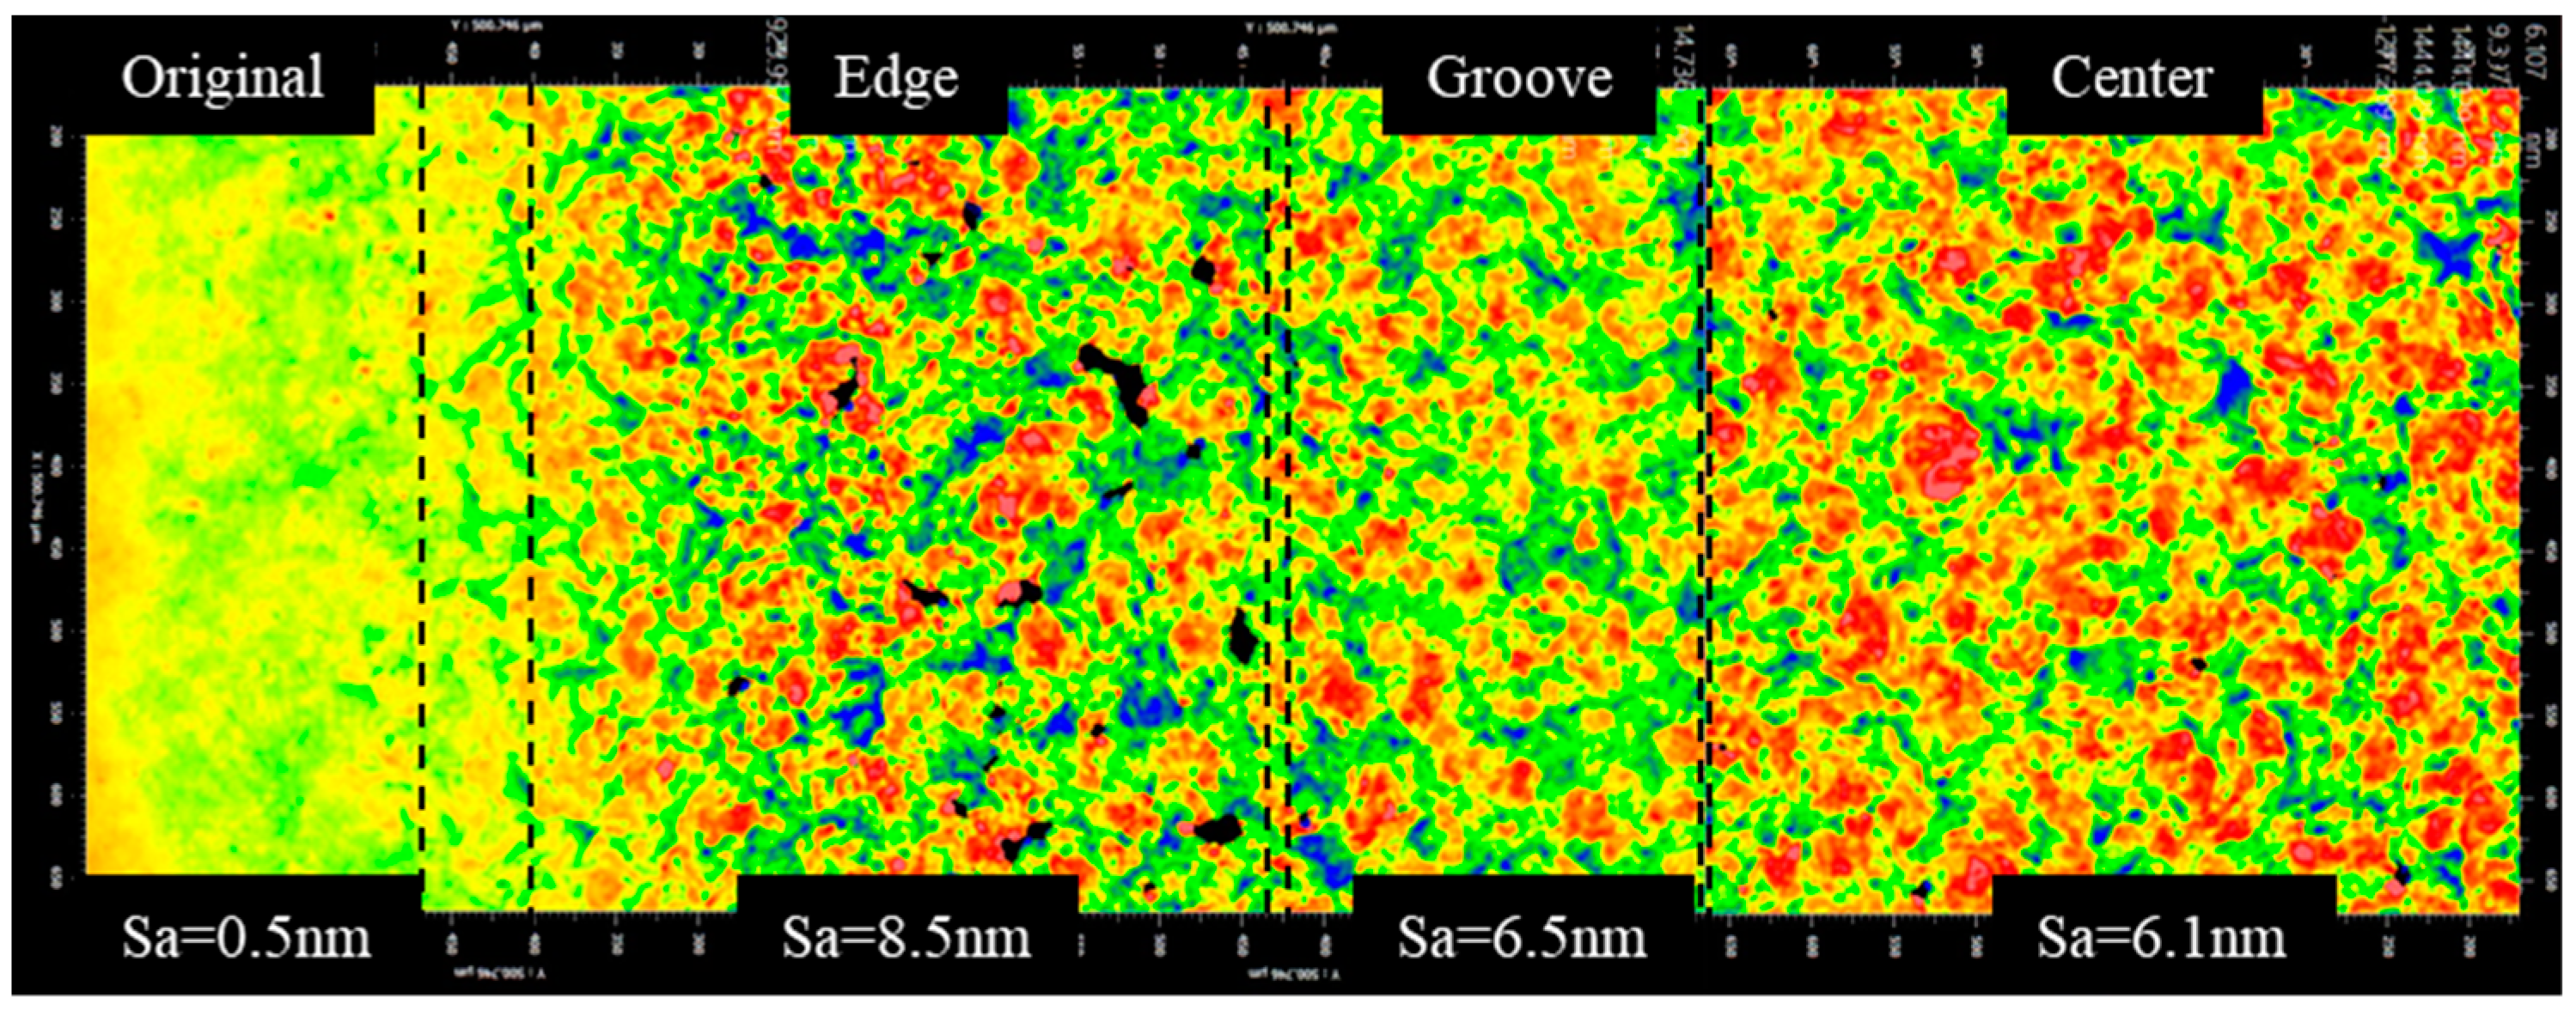
- The material removal caused by cavitation bubble explosion was uniformly distributed on the entire working surface and had a 0.25 mm edge influence range. The flow scouring removal was mainly concentrated in the high-velocity flow zone around the machining area.
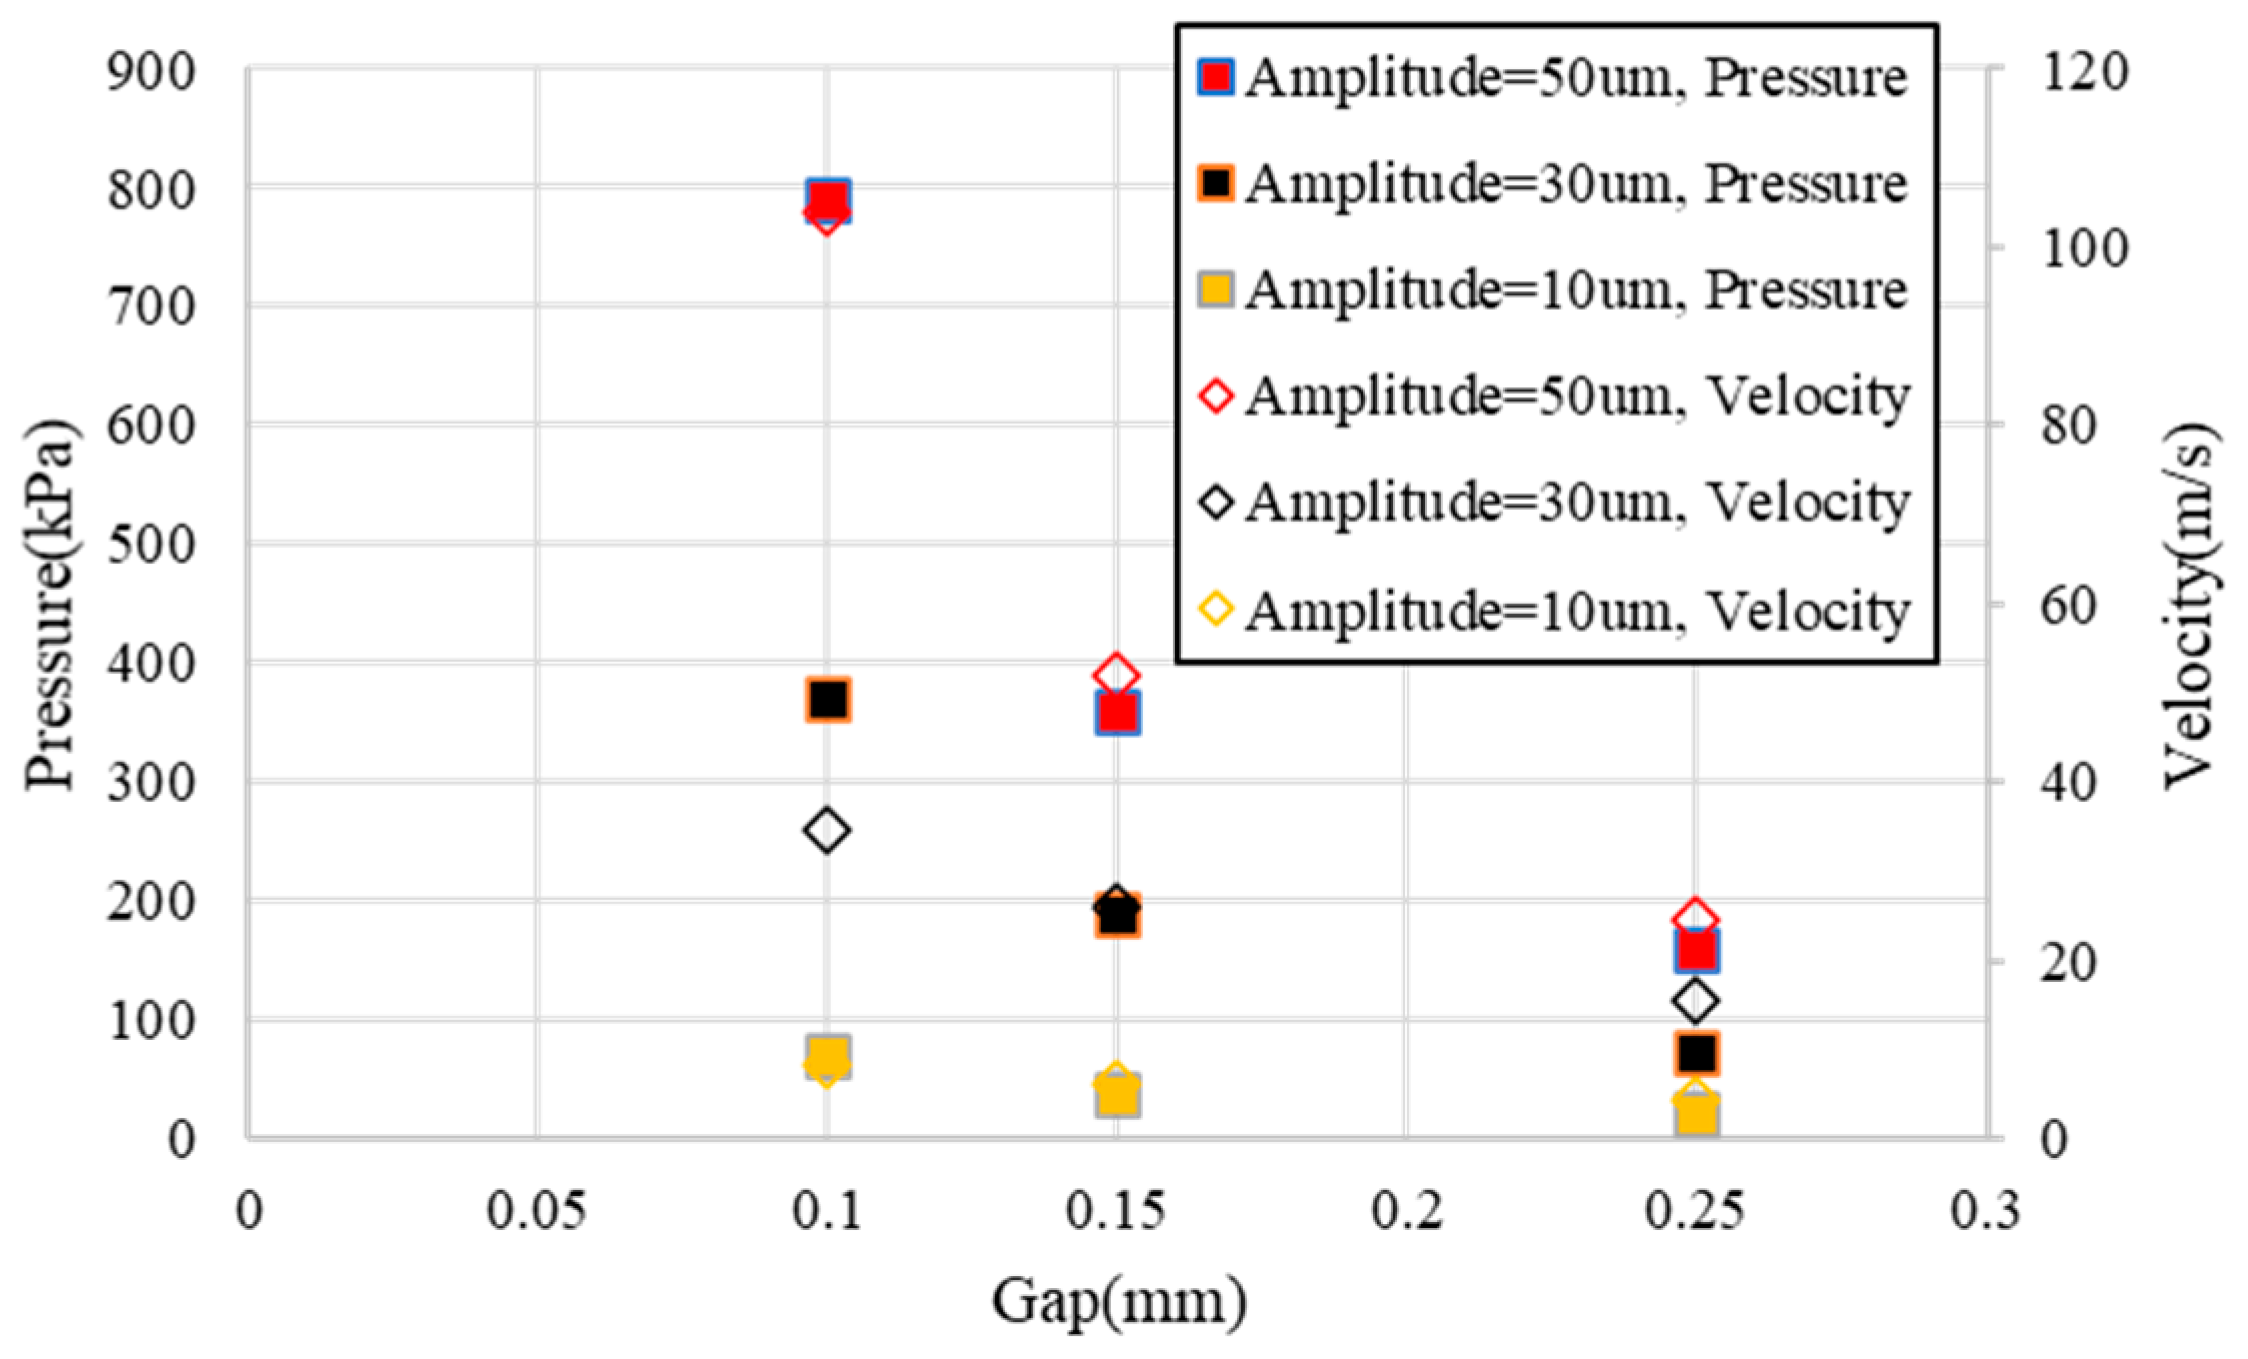
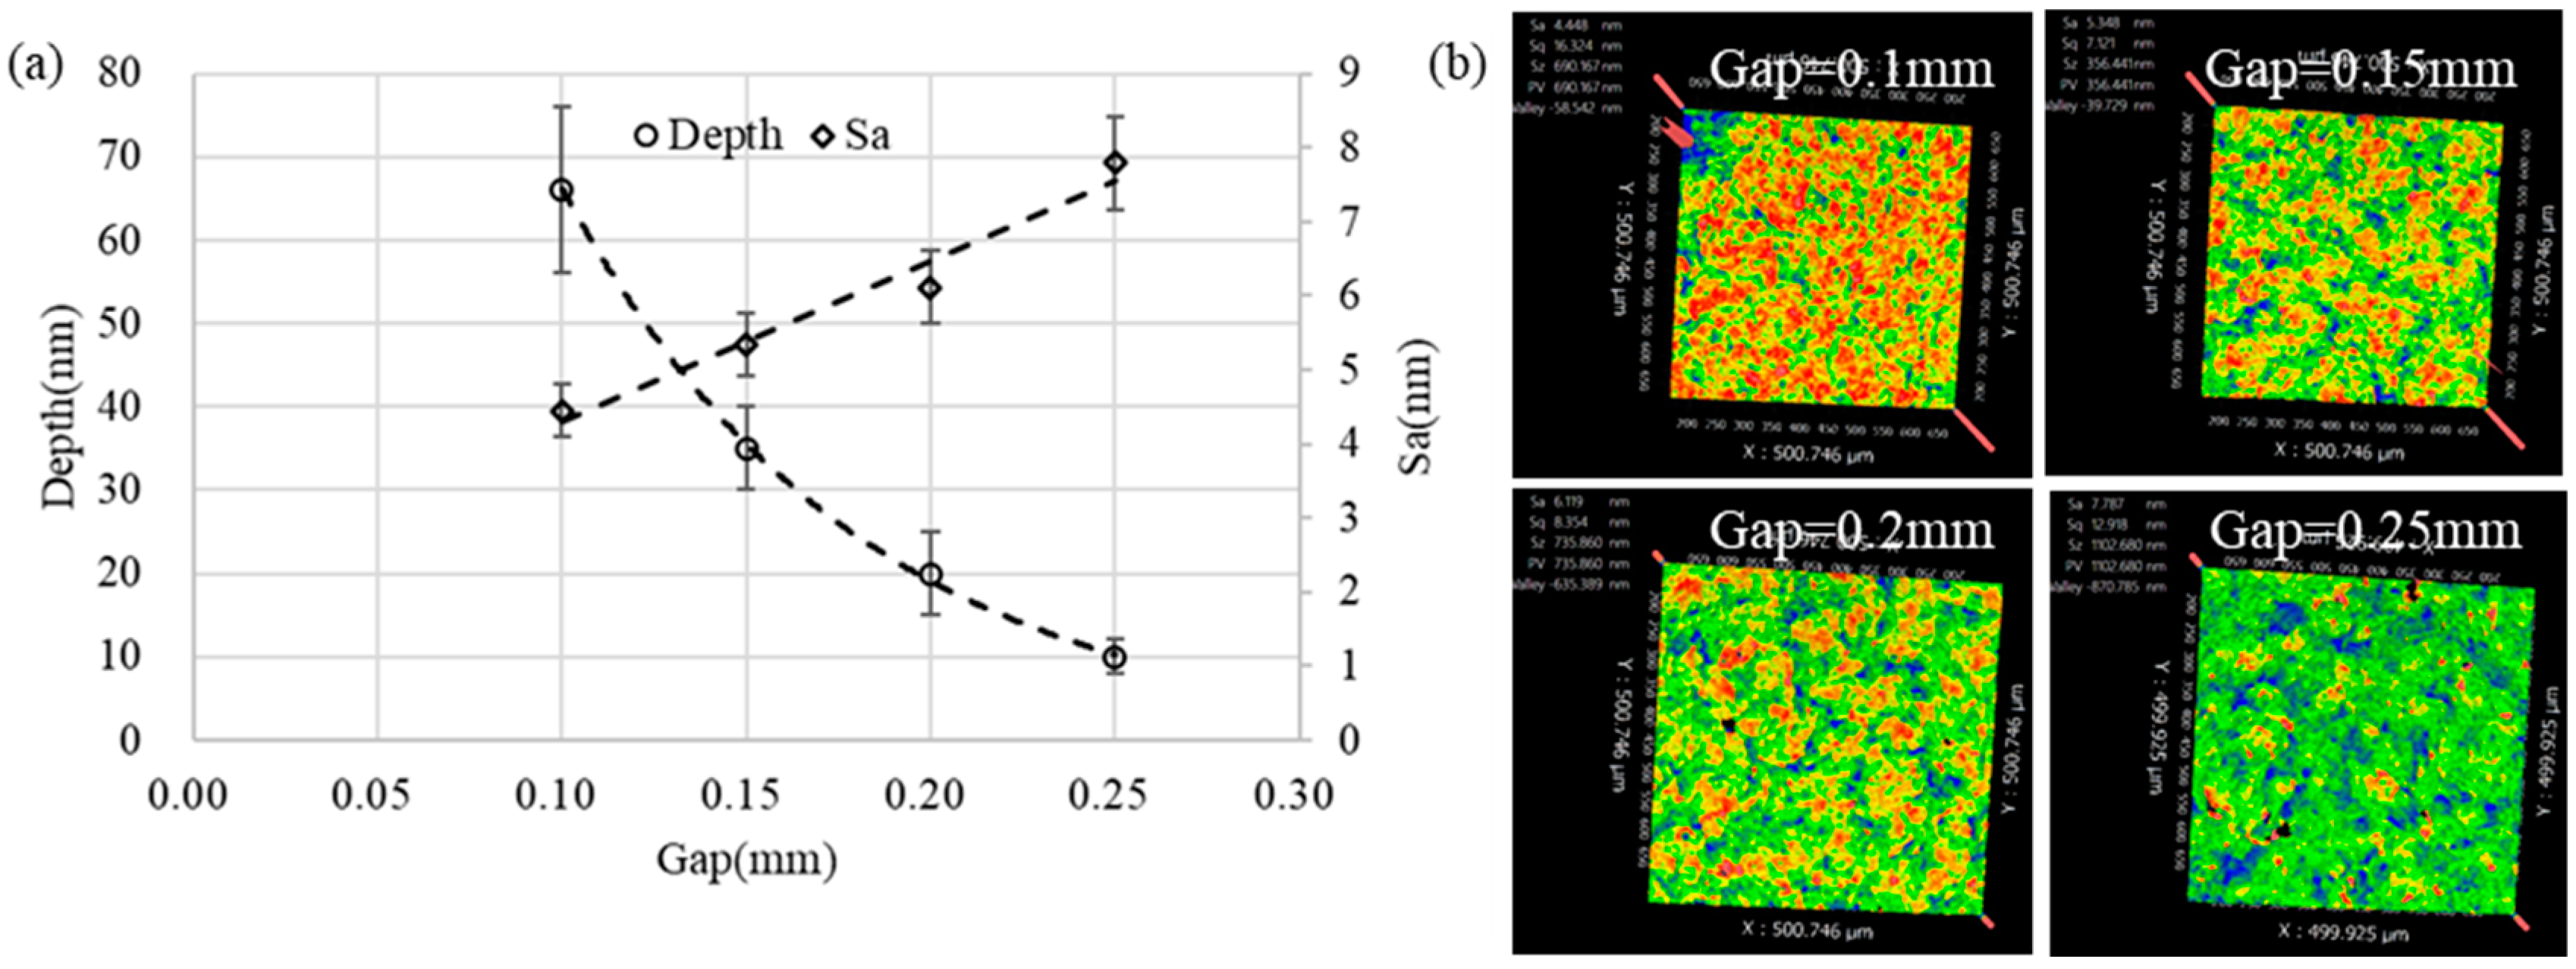
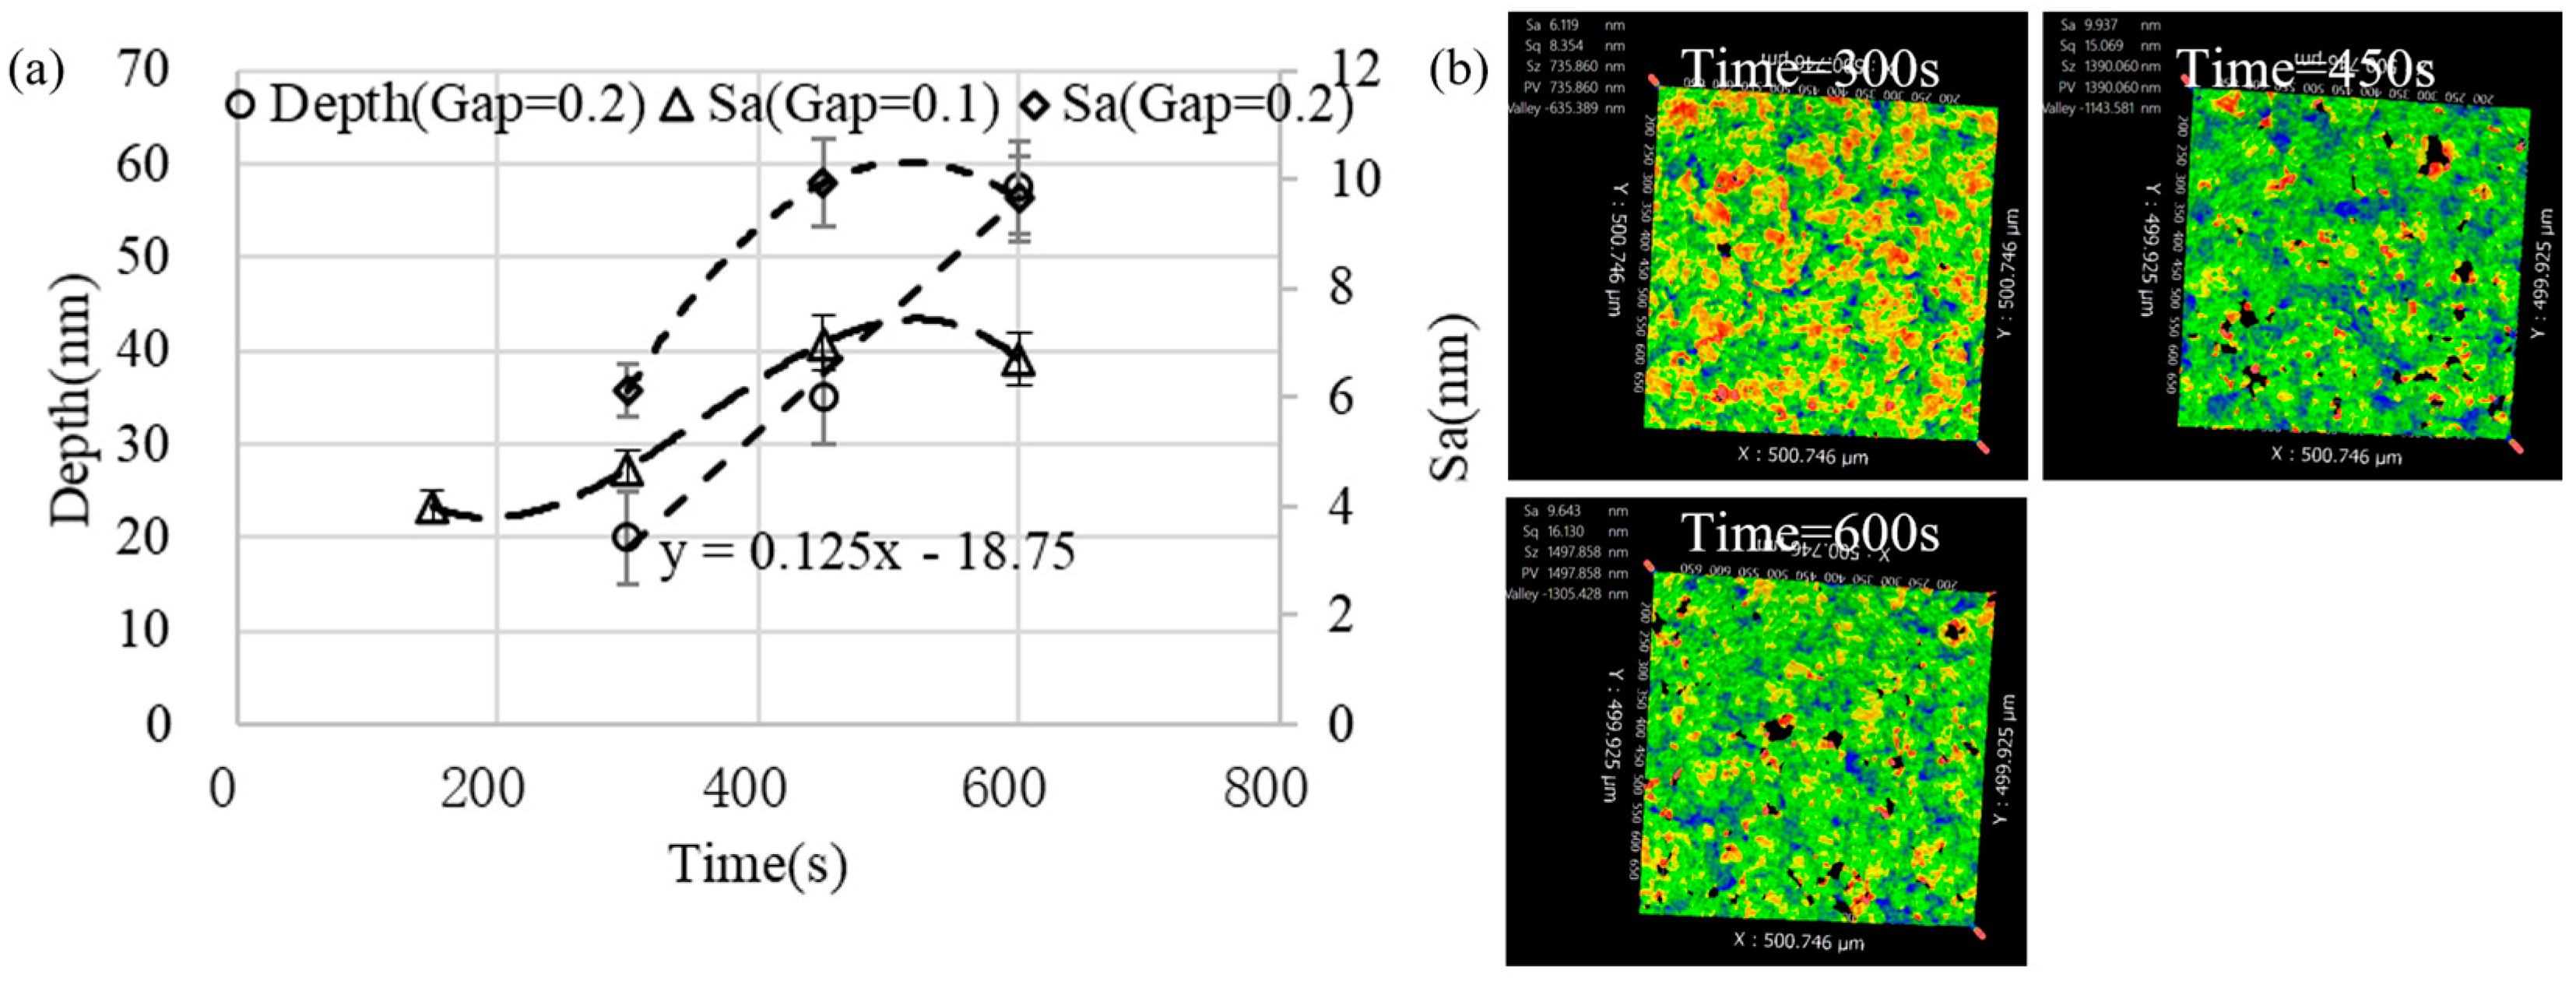
- The material removal rate increased exponentially with the decrease in machining gap and the increase in amplitude, and remained constant with machining time. This feature is suitable for deterministic polishing.
- Under the combined action of cavitation erosion and fluid erosion, the machined surface roughness increased linearly with the increase in amplitude and gap due to the reduced removal uniformity.
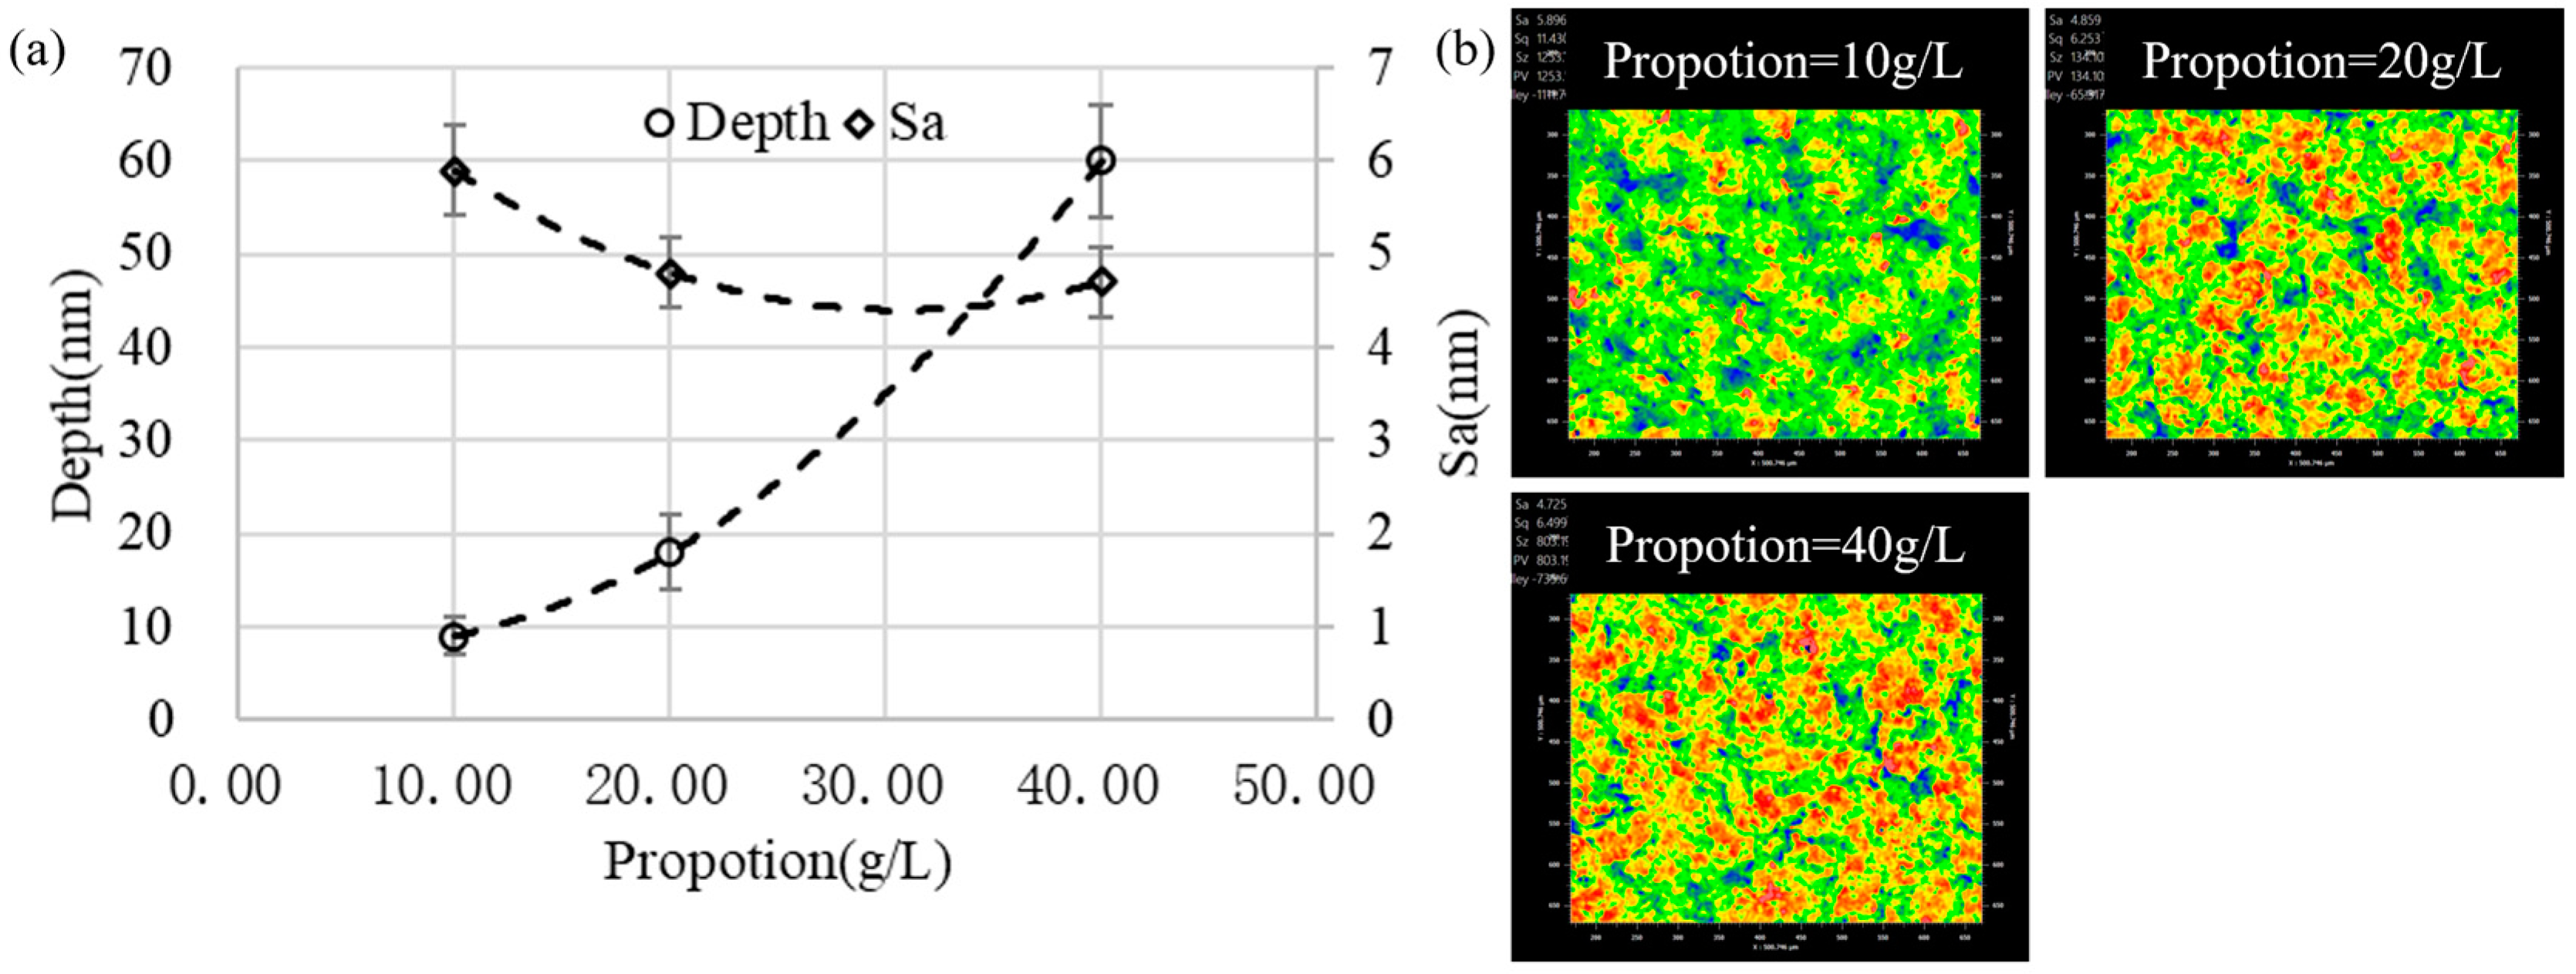
- Increasing the particle concentration significantly improved the material removal rate, and the generated surface exhibited a better removal uniformity and a lower surface roughness.
- Increasing the blasting density of cavitation bubbles while avoiding near-wall blasting, such as increasing the concentration of abrasive particles, could improve the material removal rate and achieve a higher surface quality.
Author Contributions
Funding
Data Availability Statement
Acknowledgments
Conflicts of Interest
References
- Li, P.; Chen, S.; Xiao, H.; Chen, Z.; Qu, M.; Dai, H.; Jin, T. Effects of local strain rate and temperature on the workpiece subsurface damage in grinding of optical glass. Int. J. Mech. Sci. 2020, 182, 105737. [Google Scholar] [CrossRef]
- Beaucamp, A.; Namba, Y. Super-smooth finishing of diamond turned hard X-ray molding dies by combined fluid jet and bonnet polishing. Cirp Ann.-Manuf. Technol. 2013, 62, 315–318. [Google Scholar] [CrossRef]
- Chen, G.; Yi, K.; Yang, M.; Liu, W.; Xu, X. Factor effect on material removal rate during phosphate laser glass polishing. Mater. Manuf. Process. 2014, 29, 721–725. [Google Scholar] [CrossRef]
- Cai, G.; Lu, Y.; Cai, R.; Zheng, H. Analysis on lapping and polishing pressure distribution. CIRP Ann. 1998, 47, 235–238. [Google Scholar] [CrossRef]
- Zhao, D.; Lu, X. Chemical mechanical polishing: Theory and experiment. Friction 2013, 1, 306–326. [Google Scholar] [CrossRef] [Green Version]
- Cheng, H.; Dong, Z.; Ye, X.; Tam, H.-Y. Subsurface damages of fused silica developed during deterministic small tool polishing. Opt. Express 2014, 22, 18588–18603. [Google Scholar] [CrossRef]
- Wang, C.; Wang, Z.; Yang, X.; Sun, Z.; Peng, Y.; Guo, Y.; Xu, Q. Modeling of the static tool influence function of bonnet polishing based on FEA. Int. J. Adv. Manuf. Technol. 2014, 74, 341–349. [Google Scholar] [CrossRef]
- Walker, D.D.; Freeman, R.; Morton, R.; McCavana, G.; Beaucamp, A. Use of the ‘precessions’™ process for prepolishing and correcting 2D & 2½D form. Opt. Express 2006, 14, 11787–11795. [Google Scholar]
- Golini, D.; Kordonski, W.I.; Dumas, P.; Hogan, S.J. Magnetorheological finishing (MRF) in commercial precision optics manufacturing. Int. Soc. Opt. Photonics 1999, 3782, 80–91. [Google Scholar]
- Shi, F.; Tian, Y.; Peng, X.; Dai, Y. Combined technique of elastic magnetorheological finishing and HF etching for high-efficiency improving of the laser-induced damage threshold of fused silica optics. Appl. Opt. 2014, 53, 598–604. [Google Scholar] [CrossRef]
- Wang, T.; Huang, L.; Vescovi, M.; Kuhne, D.; Tayabaly, K.; Bouet, N.; Idir, M. Study on an effective one-dimensional ion-beam figuring method. Opt. Express 2019, 27, 15368–15381. [Google Scholar] [CrossRef] [PubMed]
- Weiser, M. Ion beam figuring for lithography optics. Nucl. Instrum. Methods Phys. Res. Sect. B Beam Interact. Mater. At. 2009, 267, 1390–1393. [Google Scholar] [CrossRef]
- Guo, Z.; Jin, T.; Xie, G.; Lu, A.; Qu, M. Approaches enhancing the process accuracy of fluid jet polishing for making ultra-precision optical components. Precis. Eng. 2019, 56, 20–37. [Google Scholar] [CrossRef]
- Wang, C.; Cheung, C.; Ho, L.; Loh, Y. Development of a fluid line-jet polishing process for rotational axisymmetric surfaces. J. Manuf. Process. 2021, 61, 15–24. [Google Scholar] [CrossRef]
- Zhang, T.; Guan, C.; Zhang, C.; Xi, W.; Yu, T.; Zhao, J. Predictive modeling and experimental study of generated surface-profile for ultrasonic vibration-assisted polishing of optical glass BK7 in straight feeding process. Ceram. Int. 2021, 47, 19809–19823. [Google Scholar] [CrossRef]
- Zhang, T.; Wang, Z.; Yu, T.; Chen, H.; Dong, J.; Zhao, J.; Wang, W. Modeling and prediction of generated local surface profile for ultrasonic vibration-assisted polishing of optical glass BK7. J. Mater. Process. Technol. 2021, 289, 116933. [Google Scholar] [CrossRef]
- Suzuki, H.; Hamada, S.; Okino, T.; Kondo, M.; Yamagata, Y.; Higuchi, T. Ultraprecision finishing of micro-aspheric surface by ultrasonic two-axis vibration assisted polishing. CIRP Ann. 2010, 59, 347–350. [Google Scholar] [CrossRef]
- Lv, Z.; Huang, C.; Zhu, H.; Wang, J.; Wang, Y.; Yao, P. A research on ultrasonic-assisted abrasive waterjet polishing of hard-brittle materials. Int. J. Adv. Manuf. Technol. 2015, 78, 1361–1369. [Google Scholar] [CrossRef]
- Lv, Z.; Hou, R.; Wang, T.; Huang, C.; Zhu, H. Research on cavitation involved in ultrasonic-assisted abrasive waterjet machining. Int. J. Adv. Manuf. Technol. 2018, 101, 1879–1886. [Google Scholar] [CrossRef]
- Beaucamp, A.; Katsuura, T.; Kawara, Z. A novel ultrasonic cavitation assisted fluid jet polishing system. CIRP Ann. 2017, 66, 301–304. [Google Scholar] [CrossRef]
- Beaucamp, A.; Katsuura, T.; Takata, K. Process mechanism in ultrasonic cavitation assisted fluid jet polishing. CIRP Ann. 2018, 67, 361–364. [Google Scholar] [CrossRef]
- Ichida, Y.; Sato, R.; Morimoto, Y.; Kobayashi, K. Material removal mechanisms in non-contact ultrasonic abrasive machining. Wear 2005, 258, 107–114. [Google Scholar] [CrossRef]
- Du, J.; Chen, F. Cavitation dynamics and flow aggressiveness in ultrasonic cavitation erosion. Int. J. Mech. Sci. 2021, 204, 106545. [Google Scholar] [CrossRef]
- Pandit, A.V.; Sarvothaman, V.P.; Ranade, V.V. Estimation of chemical and physical effects of cavitation by analysis of cavitating single bubble dynamics. Ultrason. Sonochem. 2021, 77, 105677. [Google Scholar] [CrossRef] [PubMed]
- Sauer, J.; Schnerr, G.H. Unsteady cavitating flow—A new cavitation model based on a modified front capturing method and bubble dynamics. In Proceedings of the 2000 ASME Fluid Engineering Summer Conference, Boston, MA, USA, 11–15 June 2000; Volume 251, pp. 1073–1079. [Google Scholar]
- Neppiras, E. Acoustic cavitation thresholds and cyclic processes. Ultrasonics 1980, 18, 201–209. [Google Scholar] [CrossRef]
- Kadivar, E.; el Moctar, O.; Skoda, R.; Löschner, U. Experimental study of the control of cavitation-induced erosion created by collapse of single bubbles using a micro structured riblet. Wear 2021, 486–487, 204087. [Google Scholar] [CrossRef]
- Luther, S.; Mettin, R.; Koch, P.; Lauterborn, W. Observation of acoustic cavitation bubbles at 2250 frames per second. Ultrason. Sonochem. 2001, 8, 159–162. [Google Scholar] [CrossRef]
- Li, S. Cavitation enhancement of silt erosion—An envisaged micro model. Wear 2006, 260, 1145–1150. [Google Scholar] [CrossRef]
- Haosheng, C.; Jiadao, W.; Darong, C. Cavitation damages on solid surfaces in suspensions containing spherical and irregular microparticles. Wear 2009, 266, 345–348. [Google Scholar] [CrossRef]
- Plesset, M.S.; Chapman, R.B. Collapse of an initially spherical vapour cavity in the neighbourhood of a solid boundary. J. Fluid Mech. 2006, 47, 283–290. [Google Scholar] [CrossRef] [Green Version]
- Ye, L.; Zhu, X. Analysis of the effect of impact of near-wall acoustic bubble collapse micro-jet on Al 1060. Ultrason. Sonochem. 2017, 36, 507–516. [Google Scholar] [CrossRef] [PubMed]
- Teran, L.A.; Laín, S.; Rodríguez, S.A. Synergy effect modelling of cavitation and hard particle erosion: Implementation and validation. Wear 2021, 478–479, 203901. [Google Scholar] [CrossRef]
- Cao, Z.-C.; Cheung, C.F. Theoretical modelling and analysis of the material removal characteristics in fluid jet polishing. Int. J. Mech. Sci. 2014, 89, 158–166. [Google Scholar] [CrossRef]
- Guo, Z.; Jin, T.; Ping, L.; Lu, A.; Qu, M. Analysis on a deformed removal profile in FJP under high removal rates to achieve deterministic form figuring. Precis. Eng. 2018, 51, 160–168. [Google Scholar] [CrossRef]
- Namba, Y.; Beaucamp, A.; Freeman, R. Ultra-precision fluid jet and bonnet polishing for next generation hard x-ray telescope application. In Proceedings of the ASPE 2010 Annual Meeting, Atlanta, GA, USA, 5–31 October 2010. [Google Scholar]


| Amplitude (μm) | 10, 30, 50 | Gap (mm) | 0.1, 0.15, 0.25 |
| Frequency | 28 kHz | Fluid | Water |
| Tool radius | 4 mm | Temperature | 20 °C |
| Homogeneous models | 2 Eulerian phases | Viscous model [33] | k-omega (SST) |
| Cavitation model | Schnerr–Sauer | Vaporization pressure | 3540 Pa |
| Element size | Minimum 0.01 mm Maximum 0.2 mm |
| Resonance frequency (kHz) | 28 |
| Amplitude (μm) | 20, 30, 40, 50 (peak to peak) |
| Abrasive | CeO2 (1 μm in mean diameter) |
| Machining fluid | Water |
| Water mixed with abrasive grains (10 g/L) | |
| Water mixed with abrasive grains (20 g/L) | |
| Water mixed with abrasive grains (40 g/L) | |
| Machining time (s) | 150, 300, 450, 600 |
| Gap (mm) | 0.1, 0.15, 0.2, 0.25 |
| Fluid temperature (°C) | 25 |
| Workpiece | BK7 flat optical glass |
| Surface roughness (Sa): 0.5 nm | |
| Hardness (HK100): 610 kg/mm2 | |
| Dimensions: φ 50 × 10 mm | |
| Submerged depth (mm) | 20 |
| Working surface on the horn | Plane (diameter: 8 mm) |
| Rectangle groove (diameter: 10 mm) | |
| Five-pointed star (diameter: 10 mm) | |
| Testing equipment | Zygo GPI for material removal distribution |
| Zygo Newview9000 for surface morphology |
| Mode-A | Diameter | dA = 150 nm |
| Depth | hA = 19 nm | |
| Number | M = 4 | |
| Mode-B | Major axis | lB1 = 100 nm |
| Minor aixs | lB2 = 10 nm | |
| Depth | hB = 5 nm | |
| Number | N = 400 |
| No. | M | N | Sa (nm) | Depth (nm) | Sa/Depth | a | b | Goodness of Fit (R2) |
|---|---|---|---|---|---|---|---|---|
| 1 | 3 | 466 | 15.16 | 72.75 | 0.208 | 1.287 | 0.532 | 0.9991 |
| 2 | 3 | 0 | 11.51 | 21.37 | 0.54 | 0.8873 | 0.563 | 0.9947 |
| 3 | 0 | 466 | 9.35 | 51.38 | 0.18 | 0.8842 | 0.5089 | 0.9998 |
| 4 | 4 | 400 | 15.69 | 72.37 | 0.217 | 0.133 | 0.5482 | 0.9992 |
| 5 | 4 | 0 | 13.08 | 28.45 | 0.46 | 1.073 | 0.5561 | 0.9966 |
| 6 | 0 | 400 | 8.539 | 43.92 | 0.19 | 0.7974 | 0.5166 | 0.9998 |
| 7 | 5 | 334 | 16.16 | 72.46 | 0.223 | 1.488 | 0.5183 | 0.9983 |
| 8 | 5 | 0 | 14.23 | 35.58 | 0.4 | 1.236 | 0.5327 | 0.9972 |
| 9 | 0 | 334 | 7.73 | 36.89 | 0.21 | 0.7609 | 0.5053 | 0.9996 |
Publisher’s Note: MDPI stays neutral with regard to jurisdictional claims in published maps and institutional affiliations. |
© 2022 by the authors. Licensee MDPI, Basel, Switzerland. This article is an open access article distributed under the terms and conditions of the Creative Commons Attribution (CC BY) license (https://creativecommons.org/licenses/by/4.0/).
Share and Cite
Guo, Z.; Luo, X.; Hu, X.; Jin, T. Investigation of Material Removal Distributions and Surface Morphology Evolution in Non-Contact Ultrasonic Abrasive Machining (NUAM) of BK7 Optical Glasses. Micromachines 2022, 13, 2188. https://doi.org/10.3390/mi13122188
Guo Z, Luo X, Hu X, Jin T. Investigation of Material Removal Distributions and Surface Morphology Evolution in Non-Contact Ultrasonic Abrasive Machining (NUAM) of BK7 Optical Glasses. Micromachines. 2022; 13(12):2188. https://doi.org/10.3390/mi13122188
Chicago/Turabian StyleGuo, Zongfu, Xichun Luo, Xiaoping Hu, and Tan Jin. 2022. "Investigation of Material Removal Distributions and Surface Morphology Evolution in Non-Contact Ultrasonic Abrasive Machining (NUAM) of BK7 Optical Glasses" Micromachines 13, no. 12: 2188. https://doi.org/10.3390/mi13122188